influence of ecological and geological features on
TRANSCRIPT

ORIGINAL ARTICLE
Influence of ecological and geological features on rangewidepatterns of genetic structure in a widespread passerine
RV Adams and TM Burg
Geological and ecological features restrict dispersal and gene flow, leading to isolated populations. Dispersal barriers can beobvious physical structures in the landscape; however microgeographic differences can also lead to genetic isolation. Our studyexamined dispersal barriers at both macro- and micro-geographical scales in the black-capped chickadee, a resident NorthAmerican songbird. Although birds have high dispersal potential, evidence suggests dispersal is restricted by barriers. Thechickadee’s range encompasses a number of physiological features which may impede movement and lead to divergence.Analyses of 913 individuals from 34 sampling sites across the entire range using 11 microsatellite loci revealed as many as 13genetic clusters. Populations in the east were largely panmictic whereas populations in the western portion of the range showedsignificant genetic structure, which often coincided with large mountain ranges, such as the Cascade and Rocky Mountains, aswell as areas of unsuitable habitat. Unlike populations in the central and southern Rockies, populations on either side of thenorthern Rockies were not genetically distinct. Furthermore, Northeast Oregon represents a forested island within the Great Basin;genetically isolated from all other populations. Substructuring at the microgeographical scale was also evident within the FraserPlateau of central British Columbia, and in the southeast Rockies where no obvious physical barriers are present, suggestingadditional factors may be impeding dispersal and gene flow. Dispersal barriers are therefore not restricted to large physicalstructures, although mountain ranges and large water bodies do play a large role in structuring populations in this study.Heredity advance online publication, 30 July 2014; doi:10.1038/hdy.2014.64
INTRODUCTION
Dispersal is the ecological process where individuals move from onepopulation to another to reproduce. This process facilitates gene flowand is essential for the persistence of populations and species.However, ecological and geological features can affect the ability ofindividuals to move across landscapes and those that restrict dispersalare termed a ‘barrier’. Barriers therefore play a key role in the geneticstructuring of populations by influencing important evolutionaryprocesses such as gene flow and adaptation.
Over the last decade, landscape genetics has contributed to ourunderstanding of how contemporary landscapes influence the spatialdistribution of genetic variation in a variety of organisms (Manel andHolderegger, 2013). Topographical features (Smissen et al., 2013),unsuitable habitat (Piertney et al., 1998) and anthropogenic disturbanceto the landscape (Young et al., 1996) have all been identified as factorsstrongly influencing population genetic structure in previous studies.Examining the effects of landscape features and environmental variableson current genetic patterns will provide us with a better understandingof how species interact with their environment. Not only doeslandscape genetics allow us to assess the environmental contributorsof population structuring, it also compliments phylogeographic studiesallowing researchers to tease apart the effects of historical andcontemporary processes on gene flow in complex landscapes.
During the Quaternary period, severe climatic oscillations played amajor role in shaping current landscapes and a number of geneticstudies have documented the effects of climatic fluctuations on
species distributions since the Last Glacial Maximum, approximately18–21 thousand years ago (Hewitt, 1996, 2004; Carstens and Knowles,2007). While these historical processes may have contributed to howspecies are distributed today, many physical structures influenced thedispersal routes of new colonisers, some of which still exist incontemporary landscapes and continue to restrict movement. Forexample, mountain ranges provide an elevational limit to dispersaland large bodies of water may be perceived as too risky orenergetically costly to cross. Barriers can also be climate related (forexample, large arid regions) or occur at microgeographic scales (forexample, habitat fragmentation). So, although historical processes areimportant to consider when assessing the genetic integrity ofpopulations, contemporary processes ultimately impact the spatialdistribution of genetic variation seen today.
The black-capped chickadee (Poecile atricapillus) is a small,generalist songbird common throughout North America (Figure 1).They are an ideal model for understanding how landscape featuresinfluence dispersal and gene flow as their current distributionencompasses a wide and diverse geographic region. Althoughgeographically widespread, they are year-round residents with loca-lised distributions. Only juveniles engage in limited dispersal(approximately 1.1 km; Brennan and Morrison, 1991) creating thepotential for restricted gene flow. Owing to their generalist nature,suitable habitat is not limited but they do exhibit preference fordifferent types of woodland varying from deciduous and coniferouswoodland to forested wetlands, favourable riparian communities,
Department of Biological Sciences, University of Lethbridge, Lethbridge, AB, CanadaCorrespondence: Ms RV Adams, Department of Biological Sciences, University of Lethbridge, 4401 University Drive, Lethbridge, AB, Canada T1K 3M4.E-mail: [email protected]
Received 10 December 2013; revised 29 May 2014; accepted 3 June 2014
Heredity (2014), 1–12& 2014 Macmillan Publishers Limited All rights reserved 0018-067X/14
www.nature.com/hdy
deciduous shrubs and even urban, suburban and disturbed areas(Smith, 1993). As cavity nesters, they are however, dependent on treesor snags with advanced decay, particularly of those found in matureforest. They also show a varied diet, feeding on mixed berries, seedsand insects in winter months, switching to a completely insectivorousdiet in the breeding season (Runde and Capen, 1987; Smith, 1993).Thus, habitat quality is important for reproductive and foragingsuccess of this species (Fort and Otter, 2004). Although black-cappedchickadee behaviour is extensively studied in North America, little isknown about the roles barriers play in structuring populations.Previous research focused primarily on hybridisation between theblack-capped chickadee and other chickadees, (for example,P. carolinensis (Davidson et al., 2013); P. hudsonicus (Lait et al.,2012) and P. gambeli (Grava et al., 2012)), vocalisations (Guilletteet al., 2010) and winter survival (Cooper and Swanson, 1994).Geographical variation in song, plumage and morphology (Smith,1993; Roth and Pravosudov, 2009) in addition to differences inhippocampal gene expression profiles (Pravosudov et al., 2013) aresuggestive of divergence among populations. Moreover, previousstudies using high-resolution genetic data (Gill et al., 1993;Pravosudov et al., 2012; Hindley, 2013) have all identified geneticallydistinct populations of the black-capped chickadee over a largegeographical range. Hindley’s (2013) study showed the most com-prehensive sampling design, but was limited by the use of a singlematernally inherited locus (mitochondrial DNA control region). Bycreating a picture of the overall genetic structure of the black-cappedchickadee across a wide range of environments, this current study canhelp provide additional insights into other ecological patterns foundin this species. For example, do patterns in song and morphologyreflect differences in genetic patterns and therefore different selectivepressures?
The aims of this study are to investigate how contemporarylandscapes have shaped the spatial patterns of genetic variation andpopulation structuring of the black-capped chickadee and to identifypotential barriers to dispersal providing additional insights into theirecological and evolutionary potential using microsatellite markers.Birds can be used as mobile indicators of habitat quality, so as acommon, widely distributed songbird that responds relatively quicklyto environmental change (for example, in insect outbreaks (Gray,1989)) the black-capped chickadee is an ideal model organism forinvestigating population structure and gene flow in contemporarylandscapes at both large and small geographical scales.
In this study, we aim to answer the following questions:
1. Do mountain ranges and large bodies of water restrict gene flowacross the black-capped chickadee’s range? Mountain ranges havebeen found to restrict dispersal in a number of organisms (for
example, the downy woodpecker Picoides pubescens (Pulgarın-Rand Burg, 2012); the hairy woodpecker Picoides villosus (Grahamand Burg, 2012) and the tundra vole Micotus oeconomus(Galbreath and Cook, 2004)) producing in some cases a cleareast/west divide corresponding to the Rocky and/or CascadeMountains. We predict significant genetic differences amongsamples collected on either side of mountain ranges. The mostprominent ranges include the Rocky Mountains, the AlaskanMountain range and the Cascade Mountains. Black-capped chick-adees are notably absent from Vancouver Island, Haida Gwaii (alsoknown as the Queen Charlotte Islands) and the AlexanderArchipelago, suggesting large expanses of water are also significantdispersal barriers. The island of Newfoundland is separated fromcontinental populations by the Strait of Belle Isle and Cabot Straitand mitochondrial DNA (mtDNA) studies show restricted mater-nal gene flow between Newfoundland and the mainland in black-capped chickadees (Gill et al., 1993; Hindley, 2013). As such, wepredict populations on Newfoundland will be genetically distinctfrom those on the mainland.
2. Are fine-scale genetic differences present within the black-cappedchickadee populations? We predict finer scale differences inpopulation structure will be found (in comparison with previousmtDNA and amplified fragment length polymorphism markerstudies) using high-resolution microsatellite markers as the resultof ecological differences across the species’ range. Restricted geneflow can result from recent modifications to the landscape creatingsmall-scale barriers (for example, change in habitat composition).Habitat loss and associated fragmentation can reduce connectivityand create small, isolated populations leading to increased geneticdifferentiation (Young et al., 1996).
MATERIALS AND METHODSSampling and DNA extractionAdult birds were captured using mist nets and call playback over six breeding
seasons (2007–2012). Blood samples (o100ml from the brachial vein) and/or
feather samples were collected from across the species’ range (Figure 1 and
Supplementary Table S1). Suspected family groups and juveniles were removed
from the data. Sampling sites were confined to a 40 km radius where possible
and a total of 913 individuals from 34 populations were sampled across North
America. Each bird was banded with a numbered metal band to prevent re-
sampling. All blood samples were stored in 95% ethanol and, on return to the
laboratory, stored at �80 1C. Additionally, museum tissue samples (toe pads
and skin) were obtained to supplement field sampling (see Acknowledge-
ments). Museum samples were collected within the last 30 years with the oldest
sample obtained in 1983. DNA was extracted from blood ethanol mix (10ml),
tissue (B1mg) or feather samples using a modified Chelex protocol (Walsh
et al., 1991).
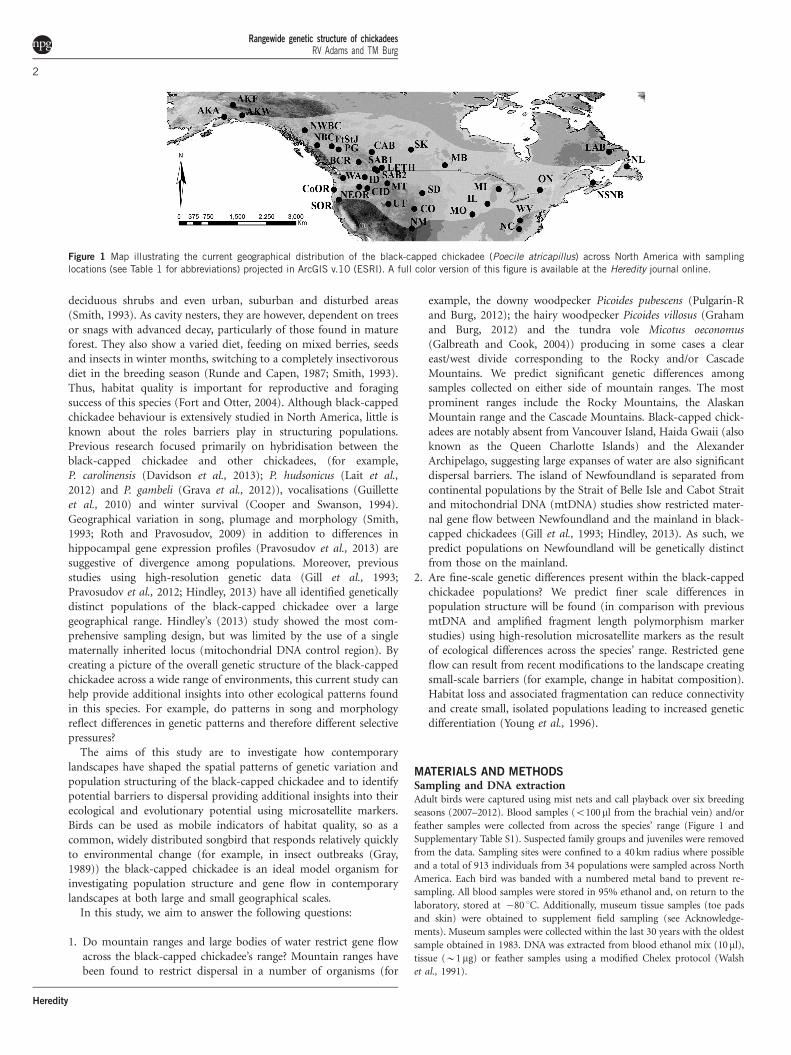
Figure 1 Map illustrating the current geographical distribution of the black-capped chickadee (Poecile atricapillus) across North America with sampling
locations (see Table 1 for abbreviations) projected in ArcGIS v.10 (ESRI). A full color version of this figure is available at the Heredity journal online.
Rangewide genetic structure of chickadeesRV Adams and TM Burg
2
Heredity
DNA amplification and microsatellite genotypingA subset of individuals was initially screened with 54 passerine microsatellite
loci. In total, 29 microsatellite loci yielded PCR products, of which 18 loci were
monomorphic (Aar1 (Hannson et al., 2000), Ase48, Ase56 (Richardson et al.,
2000), CE150, CE152, CE207, CETC215, CM014, CM026 (Polakova et al.,
2007), CtA105 (Tarvin, 2006), Gf06 (Petren, 1998), Hofi20, Hofi24, Hofi5
(Hawley, 2005), Lox1 (Piertney et al., 1998), NPAS2 (Steinmeyer et al., 2009),
Pca2 (Dawson et al., 2000) and VeCr02 (Stenzler et al., 2004)) and 11 were
polymorphic (Supplementary Table S2).
DNA was amplified in 10ml reactions containing MgCl2 (Supplementary
Table S2), 0.2 mM dNTPs, 1mM each primer pair (forward and reverse) and
0.5 U Taq DNA polymerase. All forward primers were synthesised with an M13
sequence on the 50 end to allow for incorporation of a fluorescently labelled
M13 primer (0.05mM; Burg et al., 2005) during DNA amplification. One
percent formamide was added to reactions involving PAT MP 2–14. Among 11
markers, 6 could be multiplexed in three sets of two markers each (PAT MP 2-
14/Titgata39, Escu6/Titgata02 and Ppi2/Cum28). For multiplex reactions
involving loci Escu6 and Titgata02, PCR conditions for Titgata02 were used.
We used a two-step annealing protocol: 1 cycle of 94 1C for 2 min, 50 1C for
45 s and 72 1C for 1 min, followed by 7 cycles of 94 1C for 1 min, 50 1C for 30 s
and 72 1C for 45 s, followed by 25 cycles of 94 1C for 30 s, 52 1C for 30 s and
72 1C for 45 s, followed by a final extension step of 72 1C for 5 min. For two
loci (PAT MP 2–43 and Titgata02), the second step was increased from 25 to
31 cycles. Subsequently, products were denatured and run on a 6%
polyacrylamide gel on a LI-COR 4300 DNA Analyser (LI-COR Inc., Lincoln,
NE, USA) and manually scored using Saga Lite Electrophoresis Software (LI-
COR Inc.). For each gel, three positive controls of known size were included to
maintain consistent allele sizing, and all gels were scored by a second person to
reduce the possibility of scoring error.
Genetic diversityStandard statistical analyses were performed on all individuals unless otherwise
indicated. MICRO-CHECKER v2.2.3 was used to detect any errors within the
data such as input errors, allelic dropout, stutter or null alleles (van Oosterhout
et al., 2004). Allelic richness was calculated in FSTAT v2.9.2.3 (Goudet, 2001)
after removing under sampled populations (np5). Tests for deviations from
Hardy–Weinberg equilibrium (HWE) and linkage disequilibrium (LD) were
performed in GENEPOP v4.0.10 (Raymond and Rousset, 1995) using default
Markov chain parameters (100 batches, 1000 iterations and 1000 dememor-
isation steps). Levels of significance were adjusted for multiple statistical tests
within populations using a modified False Discovery Rate (FDR) correction
method (Benjamini and Yekutieli, 2001). Finally, to determine the levels of
population genetic diversity, both observed and expected heterozygosities were
calculated in GenAlEx v6.5 (Peakall and Smouse, 2012).
Genetic clustering analysesSeveral Bayesian clustering methods are currently available to infer the spatial
structure of genetic data (Latch et al., 2006). Genetic structure was therefore
assessed using three approaches (one non-spatial and two spatial): STRUC-
TURE v2.3.4 (Pritchard et al., 2000), BAPS v5.4 (Bayesian Analysis of
Population Structure; Corander et al., 2008) and TESS v2.3 (Chen et al., 2007).
As assignments are based on individual multilocus genotypes rather than
population allele frequencies, we included samples from all 34 populations as
small population sizes will not bias assignment results. All three programs use a
Bayesian clustering approach, which assigns individuals to clusters by max-
imising HWE and minimising LD. They differ in their underlying model and
assumptions (reviewed in Francois and Durand, 2010) and some include the
type of algorithm used and how the true number of clusters (K) is determined.
For example, STRUCTURE and TESS use a Markov chain Monte Carlo
(McMC) simulation and complex hierarchical Bayesian modelling, whereas
BAPS models genetic structure using a combination of analytical and
stochastic methods, which is computationally more efficient, particularly for
large data sets (Corander et al., 2008). Ultimately, STRUCTURE uses a non-
spatial prior distribution; relying purely on the genetic data, whereas BAPS and
TESS explicitly incorporate spatial information (that is, geographic coordi-
nates) from genotyped individuals to infer genetic clusters. All three programs
work well when genetic differentiation among clusters is low (FST p0.05;
Latch et al., 2006).
STRUCTURE was run using the admixture model, correlated allele
frequencies (Falush et al., 2003) and locations as priors (locpriors). Ten
independent runs for each value of K (1–10) were conducted to determine the
optimal K. Runs were performed using 50 000 burn in periods followed by
100 000 Markov chain Monte Carlo repetitions. The results from replicate runs
were averaged using STRUCTURE HARVESTER v0.6.6 (Earl and vonHoldt,
2012). Both delta K (DK; Evanno et al., 2005), LnPr(X|K) and Bayes factor
(Pritchard et al., 2000) were used to determine K. Following the initial run,
subsets of the data (that is, individuals who formed a single cluster from the
initial runs) were re-run to establish if further structure was present using the
same parameters and five runs for each value of K. Individuals that showed
mixed ancestry to two clusters (Qo60%) were re-run together with a subset of
individuals from each of the two groups to confirm assignment.
BAPS was run with the option ‘clustering of individuals’ followed by
‘clustering of groups of individuals’, both for KMAX¼ 34. BAPS searches for all
values of K up to the value given for KMAX and gives a final K for the
maximum log (marginal likelihood). The ‘spatial clustering of groups’ option
was then used on all individuals and their corresponding group geographic
coordinates (weighted mid-point values for each population projected in DIVA
GIS v7.5 (Hijmans et al., 2012)). This option has been shown to increase the
power to detect underlying population structure and allows the user to visually
investigate population structure using Voronoi tessellations.
Using the number of clusters inferred from STRUCTURE, TESS was run
using 100 000 sweeps and 50 000 burn-in sweeps for KMAX (2–13) to identify
which K produced the highest likelihoods. The CAR (conditional autocorrela-
tion) admixture model based on the Delaunay tessellation was used and a
deviance information criterion (DIC), a measure of model fit, is computed for
each run. We conducted 10 replicates for each value of KMAX with an
interaction parameter (C; the degree to which the geographical information
influences individual assignment) of 0.6 as described in Chen et al. (2007). To
determine the true number of clusters, we retained 20% of the lowest DIC to
identify which K produced the highest likelihood (KMAX) and lowest DIC.
We also averaged DIC over all 10 runs for each value of KMAX as often the
optimum cluster is the value that coincides with the plateau of the DIC curve.
Population structureAll populations with a small sample size (np5) were removed from
population-level analyses (CoOR n¼ 2; NC n¼ 5 and LAB n¼ 5) unless
otherwise indicated. Pairwise FST values were calculated in ARLEQUIN v3.5
(Excoffier and Lischer, 2010) to investigate the degree of genetic differentiation
among the predefined populations (significance determined by 1023 permuta-
tions). As the theoretical maximum of 1 for FST is only valid when there are
two alleles, F’ST standardised by the maximum value it can obtain were also
calculated in GenAlEx v6.5 (Peakall and Smouse, 2012).
Since traditional FST is often criticised by its dependency on within-
population diversity, sample sizes and its use with highly variable molecular
markers such as microsatellites (Meirmans and Hedrick, 2011), we also
calculated an alternative diversity measure, Dest (Jost, 2008), using the software
SMOGD v1.2.5 (Crawford, 2010). The overall value of Dest is calculated as the
harmonic mean across loci for each pairwise population comparison and is
suggested to be more accurate for identifying population structure. Measures
from both Dest and FST were compared to determine the true level of genetic
differentiation. We also assessed the level of concordance between the two
estimates by plotting linearised Dest values (Dest/(1�Dest)) against linearised
FST values (FST/(1�FST)) using a Mantel test in GenAlEx v6.5. Significance
was determined using 9999 permutations. To further assess population
structure, a hierarchical analysis of molecular variance was carried out in
ARLEQUIN v3.5 on the various groupings produced from both STRUCTURE
and BAPS.
Effects of barriers on population structureIsolation by distance (IBD) was tested using a Mantel test in GenAlEx v6.5
using linearised FST values. Significance was determined using 9999 permuta-
tions and geographic distances (km) were calculated using the GEOGRAPHIC
Rangewide genetic structure of chickadeesRV Adams and TM Burg
3
Heredity

DISTANCE MATRIX GENERATOR v1.2.3. (http://biodiversityinformatic-
s.amnh.org/open_source/gdmg/). Straight line distances are not always accu-
rate as barriers can affect dispersal routes and for that reason, we also tested
shortest distance through suitable habitat. For example, distance through forest
was calculated for populations located on or around the Great Plains (CO, SD,
UT, MT, SAB1, SAB2, LETH, CAB, SK, MB, MI, IL and MO).
BARRIER v2.2 uses a geometry approach to compute barriers on a Delaunay
triangulation (Manni et al., 2004). Monmonier’s algorithm identifies areas
where genetic differences between pairs of populations are the largest. Using a
genetic distance matrix (FST), BARRIER identifies the location and direction of
barriers to provide a visual representation of how the landscape influences
dispersal in comparison with IBD. We computed the first 10 genetic
boundaries using an FST distance matrix for all populations (excluding sites
with p5 samples: CoOR, NC and LAB).
Finally, we used GIS landscape genetics toolbox (Vandergast et al., 2011) to
visualise the distribution of genetic diversity across geographical space. The
toolbox is run within the Geographical Information System software package
ArcGIS v.9 (ESRI, Redlands, CA, USA) and utilises the population pairwise
genetic distances (FST) to produce a genetic divergence raster surface (or heat
map). This will help evaluate our hypothesised barriers to movement by
plotting values on a map.
Landscape geneticsA landscape genetic approach was used to assess the influence of environ-
mental factors on genetic differentiation in the black-capped chickadee. We
used GESTE v2.0 (Foll and Gaggiotti, 2006), a hierarchical Bayesian method,
which estimates population-specific FST values and links them to environ-
mental variables using a generalised linear model. It evaluates likelihoods of
models that include all the factors, their combinations and a constant (which
excludes all variables). Posterior probabilities are used to identify the factor(s)
that influence genetic structure. Using a reversible jump Markov chain Monte
Carlo method and default parameters, we conducted 10 pilot runs with a
burn-in of 50 000 iterations to obtain convergence and a chain length of
2.5� 105, separated by a thinning interval of 20. A total of six factors were
considered, including three environmental variables (annual average tempera-
ture, precipitation and elevation) and three related to distance (latitude,
longitude and distance to unsuitable habitat). We tested a number of scenarios
to determine the models with the highest probabilities. Certain factors were
also tested under different environmental scenarios to more closely examine
their influence on genetic structuring (as conducted in Wellenreuther et al.,
2011). Three environmental scenarios were assessed; spatial, climatic and
geographic. In the spatial scenario, we tested latitude and longitude; for the
climatic scenario, we tested annual average temperature and precipitation; and
with the geographic scenario, we tested elevation and distance to unsuitable
habitat. As only two factors are being assessed in these specific scenarios, we
added a factor interaction as suggested by Foll and Gaggiotti (2006), and kept
all other parameters at their default setting.
RESULTS
Genetic diversityIn total, 913 individuals from 34 populations were successfullygenotyped for 11 variable microsatellite loci with the overall numberof alleles per locus ranging from 5 to 46 (Supplementary Table S2).Observed heterozygosity ranged from 0.52 (PG) to 0.73 (CoOR)across all loci and expected heterozygosity ranged from 0.39 (NC) to0.73 (LAB and MI; Table 1). Allelic richness (which accounts foruneven sample size) ranged from 5.26 (AKA) to 8.00 (ON) (Table 1).Nineteen of the 34 populations contained private alleles (Table 1): 16populations contained 1 or 2 private alleles, whereas NSNB had thehighest (10), PG had 5 and FtStJ had 4 private alleles. Evidence of nullalleles and homozygote excess was found for locus Pman45. Exclusionof this locus did not change the results and so was included in thefinal analyses.
Disequilibrium and departures from HWE were detected followingcorrections for multiple comparisons. Significant LD was detected
between Titgata02 and Cum28 and between Escu6 and Pman71 withinID (Pp0.001 and Pp0.001, respectively); between Escu6 andTitgata02 and Escu6 and Ppi2 within SAB1 (Pp0.001 andPp0.001, respectively); between Titgata39 and Titgata02 within SK(Pp0.001) and between Titgata02 and Ppi2 within UT (Pp0.001).LD was not consistent across populations and genotypes showed noassociation suggesting that LD detected here could be a result of atype 1 error. Significant deviations from HWE were evident for 14population/loci comparisons: FtStJ at locus PAT MP 2–43; AKA, MI,FtStJ, SOR, NSNB and WV at locus Pman45; SAB2 and MB at locusPpi2 and PG deviated at PAT MP 2–14, Titgata39, Titgata02, Escu6and PAT MP 2–43. We checked the data for populations that deviatedfrom HWE at two or more loci for the presence of family groups,which could explain deviations from Hardy–Weinberg expectations.Although a number of individuals were caught at the same locationon the same day in PG and NSNB, no evidence of family groups wasfound.
Bayesian clustering analysesSTRUCTURE estimated 13 clusters (Figures 2 and 3 andSupplementary Figure S1). The initial run of all of the samplesresulted in K¼ 3, using mean log likelihood (Pr (X|K)¼ �34 930)and DK, and consisted of: the three Alaskan populations (AKA, AKFand AKW), the Fraser Plateau populations (PG and FtStJ) and allother populations (‘main’; Figure 2a). The two latter clusters showedevidence of further structure. The Fraser Plateau group was sub-divided into two groups, PG and FtStJ (Pr (X|K)¼ �3034;Figure 2b). The ‘main’ cluster produced three clusters: western,central and eastern (Pr (X|K)¼ �28 689; Figure 2c). Nine of thepopulations showed evidence of mixed ancestry (NWBC, BCR,LETH, MB, CID, MT, IL, LAB and NC). Each of these populationswas run with individuals from the two clusters to which they had highQ values. NWBC, BCR, LETH and MB clustered with the westerncluster, MT with the central cluster and the remaining threepopulations with the eastern cluster (results not shown). These ninepopulations were then grouped accordingly for additional analyses.Further runs were performed on the western, central and easternclusters using a hierarchical approach. Subsequent runs of the westerngroup (Figures 2d–g) resulted in a total of five clusters: CanadianPacific-Prairies (NBC, all AB populations, SK and MB; Pr (X|K)¼�14 136), Pacific (WA, SOR, CoOR; Pr (X|K)¼ �8710), NorthwestRockies (NWBC and BCR; Pr (X|K)¼ �6614); Idaho (CID and ID)in the Intermountain West and finally NEOR Pr (X|K)¼ �2383).The central group was subdivided into three clusters: eastern Rockies(MT, SD and UT; Pr (X|K)¼ �4041), CO and NM (Pr (X|K)¼�1096; Figures 2h and i). The eastern cluster was further subdividedinto two clusters: NL and eastern mainland (Pr (X|K)¼ �10 073;Figure 2j). All runs were supported by a Bayes Factor of 1 and DK.
The two spatial methods were unable to identify finer differencesdetected in STRUCTURE despite incorporating individual spatialinformation. BAPS estimated 5 distinct clusters (Figure 3) incomparison with STRUCTURE’s 13. Concordant with groups identi-fied by STRUCTURE, BAPS identified both AK and the FraserPlateau as being two genetically distinct units in addition to thesouthern Rockies populations (CO and NM) and Oregon (CoOR andSOR); while the remaining populations formed the fifth cluster. ForTESS analyses, the mean DIC plot did not plateau (SupplementaryFigure S2). The mean DIC for KMAX of 12 disrupted the curveindicating that the program may have failed to converge. Nevertheless,after comparing runs for various assumed K (2–13), KMAX wasestimated from the highest likelihood and lowest DIC run to be 13
Rangewide genetic structure of chickadeesRV Adams and TM Burg
4
Heredity

(average log likelihood: �33 818; DIC: 68 793.3). The effectivenumber of clusters with this parameter was four (SupplementaryFigure S3), detecting the same three groupings as the initial run ofSTRUCTURE (Figure 2a) and an additional cluster representingNewfoundland, which was not detected by BAPS.
Population structurePairwise FST values ranged from �0.014 to 0.148 (SupplementaryTable S3) and 318 of the 465 values were significant after correctionsfor multiple tests. Of the 87 nonsignificant pairwise FST values, 27were between adjacent sampling sites. Population wide F’ST was 0.231(Supplementary Table S4). Significant population structure wasdetected by Dest, which ranged from 0.030 to 0.316 (SupplementaryTable S3). Pairwise Dest and FST values shared a significant, positivecorrelation (r¼ 0.496; Pp0.001).
Using a hierarchical analysis of molecular variance, the highestamong group variance (5.75%) was produced using three groups (AK,Fraser Plateau and all remaining populations). Among group variancedecreased once the ‘remaining populations’ were split into western,central and eastern groups, but as these regions were split further intotheir respective groups identified in the hierarchical STRUCTURE
runs, among group variance steadily increased. Once NEOR was splitfrom the Intermountain West group, the amount of varianceincreased to 4.06% and a final run of all 13 groups from STRUC-TURE resulted in 4.12%. Meanwhile, when populations were analysedaccording to BAPS (K¼ 5) and TESS (K¼ 4) groupings, amonggroup variance was 5.25% and 5.08%, respectively.
Effects of barriers on population structureThe test for IBD among all black-capped chickadee populations usingstraight line distances was not significant (r2¼ 0.010; P¼ 0.16).However, we did find significant IBD within some clusters identifiedby STRUCTURE. IBD was significant for the eastern mainland groupwhen NL was included (r2¼ 0.358; P¼ 0.01), but not when NL wasremoved (r2¼ 0.003; P¼ 0.24). For other populations separated bylarge geographical barriers (that is, unsuitable habitat), we found asignificant effect of IBD using the shortest distance through suitablehabitat. For example, when testing populations located around theGreat Plains, using the shortest distance through forested habitatresulted in a significant IBD pattern (r2¼ 0.137; P¼ 0.01).
BARRIER identified nine discontinuities. Boundaries detected tothe ninth order were considered the most strongly supported for the
Table 1 For each sampling site, the location (latitude (lat) and longitude (long)), sample size (n) and site abbreviation (site) are shown
Location Site Lat (N) Long (W) n Ho He PA AR
Alaska Anchorage AKA 61.4249 149.2035 32 0.60 0.61 0 5.26
Alaska Fairbanks AKF 64.2072 147.2111 32 0.63 0.64 0 5.35
Alaska Wrangell AKW 61.8039 145.0931 20 0.61 0.58 0 —
Revelstoke BCR 50.9807 118.1817 54 0.67 0.70 0 6.69
Northern British Columbia NBC 54.8883 127.7665 43 0.65 0.70 1 7.01
Fort St James FtStJ 54.6453 124.3946 61 0.69 0.72 4 7.12
Prince George PG 53.8936 122.8289 30 0.52 0.60 5 —
Northwest British Columbia NWBC 58.3003 130.6677 17 0.66 0.71 2 6.67
Central Alberta CAB 53.2981 115.1566 30 0.70 0.72 0 —
Lethbridge LETH 49.6939 112.8625 19 0.67 0.67 1 6.64
Southern Alberta 1 SAB1 49.3450 114.4153 30 0.70 0.68 1 6.54
Southern Alberta 2 SAB2 49.0694 113.8561 22 0.63 0.70 0 6.01
Saskatchewan SK 53.8749 106.1137 33 0.66 0.70 1 6.79
Manitoba MB 50.2898 98.2522 11 0.67 0.70 1 6.73
Washington WA 47.3096 121.8213 27 0.68 0.68 2 5.47
Coastal Oregon CoOR 44.6326 123.9205 2 0.73 0.50 0 —
Northeast Oregon NEOR 45.2441 118.0606 15 0.64 0.62 0 —
Southern Oregon SOR 42.2981 122.7940 15 0.71 0.69 0 —
Central Idaho CID 44.9291 116.1540 21 0.65 0.66 0 6.41
Idaho ID 47.5010 116.7914 30 0.70 0.71 0 6.89
Montana MT 46.0765 111.5521 29 0.71 0.70 0 5.93
South Dakota SD 43.8065 103.4944 17 0.70 0.69 0 5.71
New Mexico NM 35.7104 105.8804 11 0.71 0.70 2 —
Colorado CO 40.1711 105.3413 21 0.71 0.67 1 5.61
Utah UT 41.3436 111.2951 30 0.67 0.65 2 6.11
Illinois IL 41.3588 88.4561 14 0.60 0.64 2 —
Michigan MI 44.7404 85.8333 34 0.69 0.73 1 6.98
Missouri MO 38.9053 91.9269 11 0.68 0.70 1 —
Ontario ON 44.5666 76.3167 33 0.71 0.72 2 8.00
Nova Scotia/New Brunswick NSNB 46.2215 64.0937 111 0.62 0.56 10 7.50
Labrador LAB 53.3292 60.3700 5 0.69 0.73 1 —
North Carolina NC 35.5164 81.1243 5 0.62 0.39 0 —
West Virginia WV 37.5237 80.8948 13 0.72 0.69 0 —
Newfoundland NL 49.9483 56.2473 35 0.61 0.66 2 5.76
Microsatellite summary statistics for each population and all loci include: number of private alleles (PA), observed (Ho) and expected (He) heterozygosities and allelic richness (AR).
Rangewide genetic structure of chickadeesRV Adams and TM Burg
5
Heredity
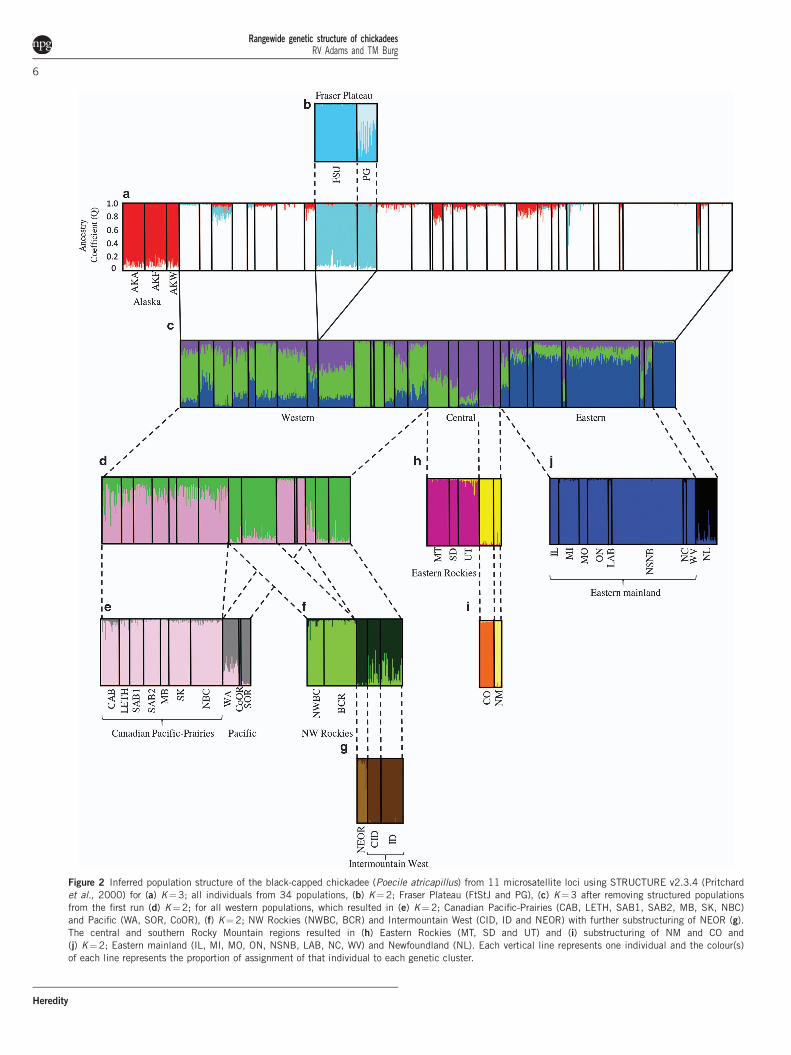
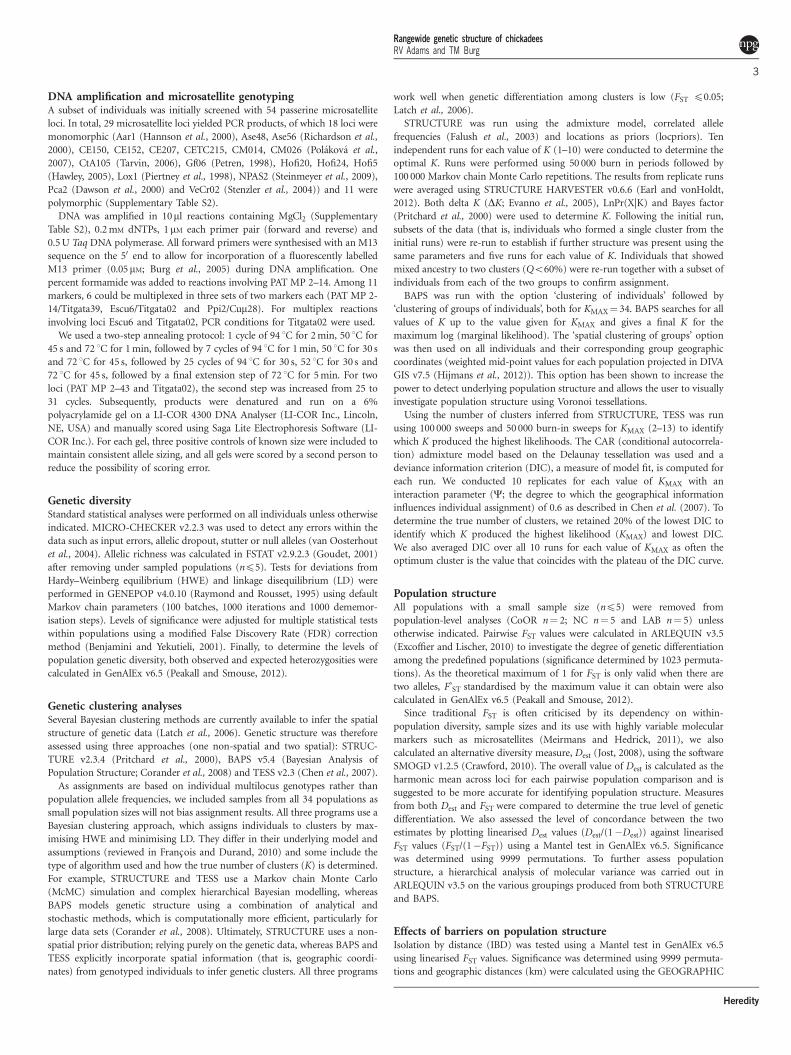
Figure 2 Inferred population structure of the black-capped chickadee (Poecile atricapillus) from 11 microsatellite loci using STRUCTURE v2.3.4 (Pritchard
et al., 2000) for (a) K¼3; all individuals from 34 populations, (b) K¼2; Fraser Plateau (FtStJ and PG), (c) K¼3 after removing structured populations
from the first run (d) K¼2; for all western populations, which resulted in (e) K¼2; Canadian Pacific-Prairies (CAB, LETH, SAB1, SAB2, MB, SK, NBC)
and Pacific (WA, SOR, CoOR), (f) K¼2; NW Rockies (NWBC, BCR) and Intermountain West (CID, ID and NEOR) with further substructuring of NEOR (g).
The central and southern Rocky Mountain regions resulted in (h) Eastern Rockies (MT, SD and UT) and (i) substructuring of NM and CO and
(j) K¼2; Eastern mainland (IL, MI, MO, ON, NSNB, LAB, NC, WV) and Newfoundland (NL). Each vertical line represents one individual and the colour(s)
of each line represents the proportion of assignment of that individual to each genetic cluster.
Rangewide genetic structure of chickadeesRV Adams and TM Burg
6
Heredity
level of population structure observed in the data, and were overlaidonto a map for visual interpretation (Figure 3). Boundaries detectedafter the ninth order did not conform to differences observed inprevious analyses (for example, pairwise FST and Dest) and so wereremoved. Overall, populations where barriers exist were significantlydifferent from all other populations (Pp0.008). Eight of the linearbarriers identified were concordant with STRUCTURE results wherepopulations on either side of the barrier belong to different clusters.The ninth barrier that encircles PG and FtStJ was confirmed bySTRUCTURE, BAPS and TESS, however, BARRIER failed to identifya genetic discontinuity between these two populations as found inSTRUCTURE.
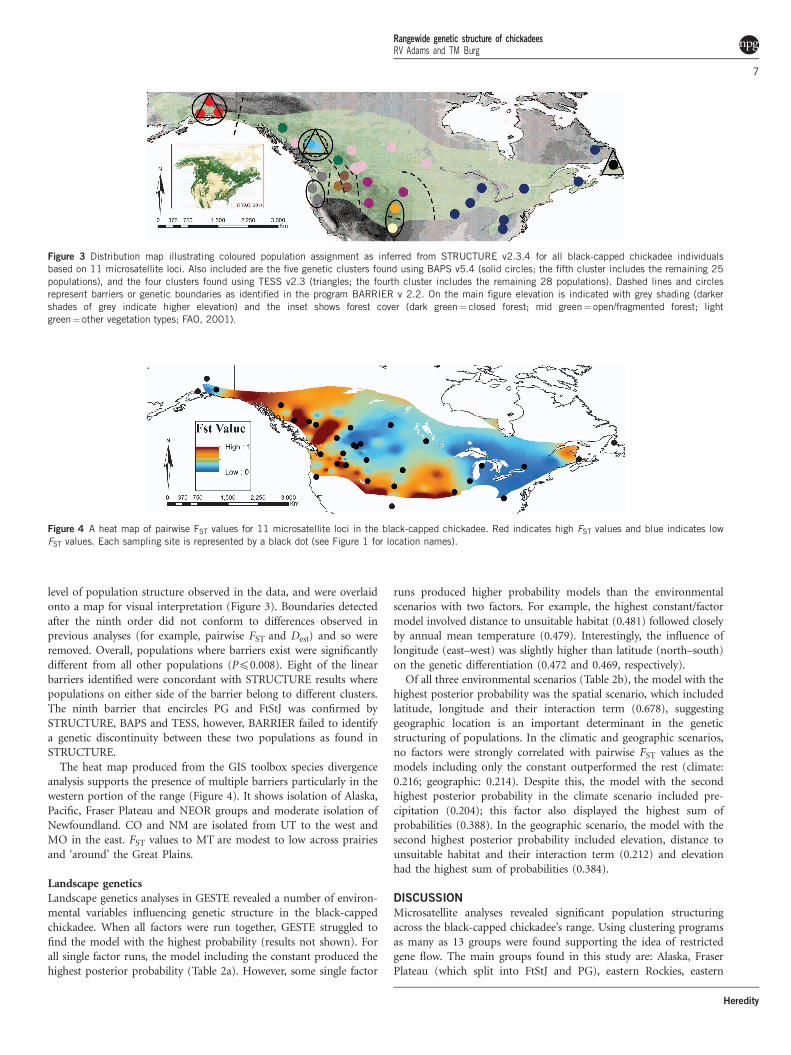
The heat map produced from the GIS toolbox species divergenceanalysis supports the presence of multiple barriers particularly in thewestern portion of the range (Figure 4). It shows isolation of Alaska,Pacific, Fraser Plateau and NEOR groups and moderate isolation ofNewfoundland. CO and NM are isolated from UT to the west andMO in the east. FST values to MT are modest to low across prairiesand ‘around’ the Great Plains.
Landscape geneticsLandscape genetics analyses in GESTE revealed a number of environ-mental variables influencing genetic structure in the black-cappedchickadee. When all factors were run together, GESTE struggled tofind the model with the highest probability (results not shown). Forall single factor runs, the model including the constant produced thehighest posterior probability (Table 2a). However, some single factor
runs produced higher probability models than the environmentalscenarios with two factors. For example, the highest constant/factormodel involved distance to unsuitable habitat (0.481) followed closelyby annual mean temperature (0.479). Interestingly, the influence oflongitude (east–west) was slightly higher than latitude (north–south)on the genetic differentiation (0.472 and 0.469, respectively).
Of all three environmental scenarios (Table 2b), the model with thehighest posterior probability was the spatial scenario, which includedlatitude, longitude and their interaction term (0.678), suggestinggeographic location is an important determinant in the geneticstructuring of populations. In the climatic and geographic scenarios,no factors were strongly correlated with pairwise FST values as themodels including only the constant outperformed the rest (climate:0.216; geographic: 0.214). Despite this, the model with the secondhighest posterior probability in the climate scenario included pre-cipitation (0.204); this factor also displayed the highest sum ofprobabilities (0.388). In the geographic scenario, the model with thesecond highest posterior probability included elevation, distance tounsuitable habitat and their interaction term (0.212) and elevationhad the highest sum of probabilities (0.384).
DISCUSSION
Microsatellite analyses revealed significant population structuringacross the black-capped chickadee’s range. Using clustering programsas many as 13 groups were found supporting the idea of restrictedgene flow. The main groups found in this study are: Alaska, FraserPlateau (which split into FtStJ and PG), eastern Rockies, eastern
Figure 3 Distribution map illustrating coloured population assignment as inferred from STRUCTURE v2.3.4 for all black-capped chickadee individuals
based on 11 microsatellite loci. Also included are the five genetic clusters found using BAPS v5.4 (solid circles; the fifth cluster includes the remaining 25
populations), and the four clusters found using TESS v2.3 (triangles; the fourth cluster includes the remaining 28 populations). Dashed lines and circles
represent barriers or genetic boundaries as identified in the program BARRIER v 2.2. On the main figure elevation is indicated with grey shading (darker
shades of grey indicate higher elevation) and the inset shows forest cover (dark green¼ closed forest; mid green¼ open/fragmented forest; light
green¼ other vegetation types; FAO, 2001).
Figure 4 A heat map of pairwise FST values for 11 microsatellite loci in the black-capped chickadee. Red indicates high FST values and blue indicates low
FST values. Each sampling site is represented by a black dot (see Figure 1 for location names).
Rangewide genetic structure of chickadeesRV Adams and TM Burg
7
Heredity

mainland, Newfoundland, Canadian Pacific-Prairies, Pacific, NWRockies, southern Rockies (which split into CO and NM), Inter-mountain West and finally NEOR. The level of genetic structure ismuch greater in the west, and may reflect the complex landscape ofwestern North America.
Bayesian analyses comparisonsAll Bayesian analyses (STRUCTURE, BAPS and TESS) estimatedsimilar genetic clusters. BAPS failed to separate Newfoundland, oridentify substructure in western North America including the
differences within the Fraser Plateau and southern Rockies. AlthoughBAPS is computationally more efficient and incorporates the spatialdistribution of populations, it struggled to identify key signatures offine-scale genetic structure. Comparatively, most studies havereported the overestimation of genetic clusters using BAPS (Aspiet al., 2006; Latch et al., 2006) or congruence with STRUCTURE(Canestrelli et al., 2008) rather than the underestimation as found inthis study.
Although TESS and STRUCTURE often detect a similar number ofgenetic clusters (Francois and Durand, 2010), in this study TESSfailed to identify the key signatures of genetic differentiation in black-capped chickadees. It did detect the same three genetic clusters (AK,Fraser Plateau and main) as the initial STRUCTURE run when allindividuals were included, as well as a fourth cluster involvingNewfoundland. This information suggests that when using Bayesianclustering methods to evaluate the spatial genetic structure oforganisms, a comparison is essential to detect different levels ofpopulation structure and to continue beyond one single run asadditional structure can be hidden by noisy data.
Macrogeographic dispersal barriersA number of prominent landscape features correspond with geneticclusters of black-capped chickadees across North America, includingboth mountain ranges, particularly in the west, unsuitable habitat inthe centre and large water bodies in the east.
In Alaska, a series of three tall mountain ranges (Chugach,Wrangell and Alaska), effectively isolate the three Alaskan black-capped chickadee populations from the rest of their range. Our datasupport the genetic isolation of the Alaskan populations and confirmsprevious findings by Pravosudov et al. (2012) and Hindley (2013).Black-capped chickadees in Alaska have larger hippocampus volumeswith a subsequent increase in spatial memory and learning capabil-ities reflecting selective pressures to retrieve cached food items insevere winter climates (Roth and Pravosudov, 2009; Roth et al., 2012).These differences combined with morphological differences supportrestricted gene flow between Alaska and adjacent populations.Mountains also restrict dispersal in other parts of the chickadee’srange. For example, the Pacific group (WA, CoOR and SOR) andIntermountain West (NEOR, CID and ID), separated by the CascadeMountains, are genetically distinct (Figures 3 and 4). This pattern isrepeated for a number of other populations on either side of theRocky and Blue Mountains.
Contrary to our earlier prediction, not all mountains are effectivedispersal barriers. Populations separated by the northern RockyMountains (with the exception of NWBC and BCR) show noevidence of significant population differentiation in either STRUC-TURE or FST and Dest comparisons (Figures 2 and 3, SupplementaryTable S3). In contrast, populations on either side of the central andsouthern Rockies are genetically distinct from each other. This wasunexpected as the highest tree line elevation; a factor likely to facilitateeffective dispersal of forest birds through mountainous valleys andacross ranges, actually occurs in the southern Rockies. So althoughtree line elevation is higher in the American Rockies (3000 m in theeastern Rockies (WY) to 3500 m in the southern Rockies (CO)) thanthe Canadian Rockies (2400 m) (Korner, 1998), it is possible thatlower elevation, treed mountain valleys in the northern Rockies (thelowest elevation being approximately 950 m in comparison with1500 m in the south) may facilitate dispersal between populations.Overall, mountain topography (particularly elevation) is an effectivedispersal barrier to black-capped chickadees and limiting gene flow inthe south and has impacted dispersal in a number of organisms such
Table 2 Six environmental variables were tested in GESTE v2.0 to
determine their influence on population genetic structure of the
black-capped chickadee
(a) Posterior probabilities
Factors
Constant 0.527
Constant, elevation 0.473Constant 0.521
Constant, annual mean temperature 0.479Constant 0.526
Constant, precipitation 0.474Constant 0.531Constant, latitude 0.469Constant 0.528Constant, longitude 0.472Constant 0.519
Constant, distance to unsuitable habitat 0.481
(b)
Factors
Posterior
probabilities
Spatial scenario(i) Latitude 0.155
Longitude 0.154Latitude� longitude 0.678
(ii) Constant 0.086Constant, latitude 0.083Constant, longitude 0.081Constant, latitude, longitude 0.072Constant, latitude, longitude, latitude� longitude 0.678
Climatic scenario(i) Annual mean temperature 0.385
Precipitation 0.388Annual mean temperature�precipitation 0.195
(ii) Constant 0.216
Constant, annual mean temperature 0.201Constant, precipitation 0.204Constant, annual mean temperature, precipitation 0.184Constant, annual mean temperature, precipitation, annualmean temperature� precipitation
0.195
Geographic scenario(i) Elevation 0.384
Distance to unsuitable habitat 0.376Elevation� distance to unsuitable habitat 0.212
(ii) Constant 0.214
Constant, elevation 0.197Constant, distance to unsuitable habitat 0.190Constant, elevation, distance to unsuitable habitat 0.186Constant, elevation, distance to unsuitable habitat,elevation� distance to unsuitable habitat
0.212
Posterior probabilities of models for runs, which included (a) one individual factor and (b)factors under three different environmental scenarios are provided. For each environmentalscenario, we provide the sum of posterior probabilities of models including a given factor (i)and the posterior probability of the five models considered for each scenario (ii). Bold valuesindicate the factor with highest score.
Rangewide genetic structure of chickadeesRV Adams and TM Burg
8
Heredity

as thin horn sheep (Ovis dalli; Worley et al., 2004). However,mountain ranges are highly heterogeneous environments and lowelevation valleys can also increase population connectivity (Perez-Espona et al., 2008; Hagerty et al., 2010).
Differentiation within the central and southern Rockies cannotsolely be explained by contemporary barriers. Historical processesmay have also contributed to the genetic structuring in these regionsas similar phylogeographic and genetic patterns in north westernNorth America are found in a number of organisms (Avise, 2000).Specifically, the genetic patterns found in our study are concordantwith other plant and animal species (Li and Adams, 1989;Nielson et al., 2001; Hindley, 2013). Several hypotheses (such as,biotic distributions, ancient vicariance, dispersal and refugia) havebeen proposed to explain the genetic concordance observed amongdiverse taxa (Brunsfeld et al., 2001; Carstens et al., 2005).
Mountain ranges in western North America have undergone acomplex history of geological and environmental fluctuations com-bined with successive glacial–interglacial cycles, which have subse-quently influenced ecosystems within and around them. The geneticdivergence of coastal (WA, CoOR and SOR) and interior (ID andCID) populations of black-capped chickadees, for both mtDNA andnuclear DNA, may have been influenced by features formed by‘ancient vicariance’ events such as the uplift of the Cascades combinedwith the Columbia basin rain shadow; limiting dispersal betweenthese groups (Brunsfeld et al., 2001). The ‘multiple refugia’ hypothesisalso helps explain the level of genetic differentiation within the RockyMountains (Brunsfeld et al., 2001; Shafer et al., 2010). The Bitterrootcrest (located along the north-central Idaho/Montana border) restrictsforest connectivity between the eastern and western slopes, and majorriver canyons have fragmented forest communities throughout therange. In our study, populations in the central/southern Rockies areisolated from each other (for example, CID and ID are differentiatedfrom MT and UT) and from northern populations such as SAB andBCR. This east–west and north–south split is consistent with otherstudies (Good and Sullivan, 2001) and supports the idea of multiplevalley refugia during the Pleistocene.
Black-capped chickadees on Newfoundland are genetically distinctfrom all continental populations suggesting that large water bodiesrestrict dispersal. Pairwise FST and Dest values involving NL were allsignificant (with the exception of MB (n¼ 11)) and relatively high(FST and Dest¼ 0.013 and 0.039 (MB) to 0.108 and 0.221 (PG),respectively, Supplementary Table S3). The Strait of Belle Isle andCabot Strait have separated Newfoundland from the mainland forapproximately 12 000 years (Pielou, 1991). Distances to the mainlandare relatively short (18 km to Labrador and 110 km to Nova Scotia);however, oceanic conditions are often harsh. MtDNA data supportthe presence of genetically distinct groups and show no evidence ofmaternal gene flow between Newfoundland and continental popula-tions (Gill et al., 1993; Hindley 2013). Large expanses of water areeffective barriers to dispersal in a number of other species. Geneticallydistinct Newfoundland populations have been found in mammals(pine martin Martes americana (McGowan et al., 1999)); plants (redpine Pinus resinosa (Boys et al., 2005)) and other chickadees (borealchickadee Poecile hudsonicus (Lait and Burg, 2013)) suggesting thatlong-term isolation of Newfoundland, while not common, is notrestricted to black-capped chickadees.
Geographical distance does influence population structuring whendistances are measured through suitable habitat. The presence ofother dispersal barriers, such as mountains, limits the ability to detectIBD at the rangewide scale using simple straight line distance (McRae,2006). In the central portion of the black-capped chickadee range lies
the Great Plains; a broad expanse of flat land, covered in prairie,steppe and grassland. As a forest-dependent songbird, habitat in thisregion is unsuitable for dispersal due to lack of trees, necessary formovement. In order for chickadees to move from one side of theGreat Plains to the other, they would be required to travel around(through suitable habitat), rather than straight across the unforestedlandscape. When pairs of populations associated with this region weretested, the effect of geographic distance is clear. Pairwise FST and Dest
values are high, and significant, for populations on either side of theGreat Plains (Figure 4, Supplementary Table S3). Black-cappedchickadee dispersal is therefore limited by geographic distancesthat are influenced by suitable habitat, which explains whypopulations to the east of the Great Plains are genetically dissimilarfrom those to the west.
Population differentiation within continuous habitatWe found additional population structure that cannot be explained bymountain or water barriers. In the southern Rockies, substructuringbetween CO and NM may reflect large areas of unsuitable habitat inthe form of open desert and grassland. A similar pattern was foundfor the American puma (Puma concolor) across the southwestern US(McRae et al., 2005). Similarly, the unexpected genetic discontinuityof SD and SK, from MB and MO (Figure 3) identified by BARRIERcorresponds to the large areas of prairie grasslands (that is, the GreatPlains). Although black-capped chickadees are present in the forestssurrounding the grasslands, the large geographical distance requiredto travel in order to circumscribe the unforested area may beimpeding movement. Sacks et al. (2004) found that gaps in habitatcorresponded to genetically distinct populations in coyotes (Canuslatrans). Chestnut-backed chickadees show a similar pattern wherebydiscontinuities in suitable habitat result in genetically isolatedpopulations (Burg et al., 2005). Animals perceive the landscape atdifferent spatial scales and what appears to be a relatively small breakin continuous habitat (for example, 18 km from Newfoundland toLabrador or o10 km between suitable coyote habitat) is perceived bythe individual as a large enough risk that dispersal is restricted(Holderegger and Wagner, 2008).
Another population isolated by unsuitable habitat, and mountains,is NEOR which is a genetically isolated island. Within northeasternOregon, the Blue Mountains stretch from southeastern Washingtontowards the Snake River along the Oregon-Idaho border and areassociated with the Columbia River Plateau, a flood basalt rangelocated between the Cascade and Rocky mountain ranges. Althoughmountain ranges may be involved in genetic differentiation, it ispossible that the high elevation plateau represents a forested islandwithin the Great Basin; a distinctive natural desert region of westernNorth America bordered by the Sierra Nevada on the west, theWasatch Mountains (UT) on the east, the Columbia Plateau to thenorth and the Mojave Desert (CA) to the south. With its ruggednorth–south mountain ranges and deep intervening valleys, combinedwith the absence of forested communities in lower elevations, theGreat Basin isolates NEOR from nearby populations in Oregon, Idahoand all other populations.
The genetic isolation and differentiation of two central BritishColumbia populations in the Fraser Plateau was unexpected. Theclosest sampling site to these two populations is B188 km away(NBC) and habitat within the region is continuous. In addition, thefurther genetic differentiation of PG and FtStJ within the FraserPlateau, supported by a number of analyses, was surprising given thesmall geographical distance between these populations (straight linedistance B120 km). It is possible that a recent change to the habitat
Rangewide genetic structure of chickadeesRV Adams and TM Burg
9
Heredity
composition because of forestry practices both between and encirclingthese two populations could be impeding movement. Logging in thisarea and the relative size and abundance of cut blocks may berestricting dispersal and gene flow. Approximately 1–18% of the totalcut block area is retained, however, a recent biodiversity assessment inBritish Columbia stated that it would take over 140 years to recruitappropriate habitat and over 200 years to recruit specific old growthstand structure elements such as large trees and snags (Ministry ofForests, Land and Natural Resource Operations, 2012); the latterbeing suitable breeding habitat for the black-capped chickadee.Alternatively, the outbreak of the mountain pine beetle (Dendroctonusponderosae) in British Columbia since the 1950s has led to a hugeinfestation and devastation of black-capped chickadee habitat(Axelson et al., 2009). At least 17 million hectares of mature andold lodgepole pine (Pinus contorta) stands have been infested (Proulxand Kariz, 2005; Petersen and Stuart, 2014) resulting in huge clearcutoperations to recover the infested timber. Although, black-cappedchickadees are niche generalists, they are forest dependent and so thisinfestation combined with the removal of infected trees has anindirect effect on breeding and dispersal.
A large number of private alleles present in both PG and FtStJsuggest that additional factors may also explain structuring in thisregion (such as hybridisation with other chickadees) but a moreadvanced landscape genetics approach at a smaller geographical scaleis necessary to determine the cause of population structuring in thisregion.
Landscape genetics analysesGESTE confirms the influence of latitude and longitude and theirinteraction on population structuring providing additional support toprevious analyses. Although all other factors showed no significantinfluence on genetic differentiation among black-capped chickadeepopulations, we cannot rule them out as many exhibited similarposterior probabilities. Populations in this study experience a widerange of different climates (Peel et al., 2007). For example, popula-tions located at high elevation and high latitudes experience harsherpolar climates in comparison with coastal populations withintemperate climates (with increased precipitation) and those in thesouth, which experience dry arid climates. Climatic differences resultin changes to vegetation, including trees. The complex biogeographymay allow black-capped chickadees to adapt to their local environ-ment. In addition, populations located close to unsuitable habitat orbarriers have fewer dispersal opportunities (Burg et al., 2005). In thisstudy, many groups (for example, the Alaska and Pacific groups) arehighly isolated suggesting that interplay between gene flow and localadaption could explain genetic structure among populations but thisis beyond the scope of this study. Further research into adaptive traitsand/or loci within this species will allow for a more meaningfulinterpretation.
Nuclear versus mitochondrial DNA patternsUsing mtDNA restriction fragment length polymorphism data, Gillet al. (1993) first explored population differentiation in the black-capped chickadee. Two groups were found with individuals fromNewfoundland being genetically distinct from all continental popula-tions (results not shown). More recently, Hindley (2013) identifiedfive groups with mtDNA sequence data; Newfoundland as well asadditional structuring of the continental group (Pacific, Alaska, SERockies and main Northeast group; Supplementary Figure S4). Anumber of these groupings using mtDNA are identical to those in ourstudy, although our microsatellite data identified finer scale
differences. Pravosudov et al. (2012) identified four groupings withnuclear amplified fragment length polymorphism data collected fromonly 10 populations, some of which were used in this study (AK, BC,WA, MT and CO; Supplementary Figure S4). Alaska and Washingtonwere both distinct from other populations; BC and MT formed acluster and there was also an eastern group. Differences such as BC(PG) clustering with MT, and CO with the eastern populations (MN,KS, IA and ME) in their study are not unexpected. Our groupingsmatch some of those identified using the alternative nuclear marker.Although amplified fragment length polymorphism datas showsimilar levels of differentiation, microsatellites often show higherlevels of within-population diversity because of their codominant,multiallelic nature (Marriette et al., 2001), which may have con-tributed to the higher levels of genetic structure found in our study. Inaddition, our study included an additional 24 populations. Overall,two identical groups were identified by all recent data sets: Alaska andPacific. Our microsatellite data also support the presence of agenetically distinct group on Newfoundland as identified by bothHindley (2013) and Gill et al. (1993) suggesting that Newfoundlandmay have served as a refugium during the Last Glacial Maximum aspreviously claimed.
CONCLUSIONS
Higher levels of genetic differentiation were found in black-cappedchickadee populations across North America using microsatellitemarkers in comparison with previous studies (for example, mtDNA,amplified fragment length polymorphisms and restriction fragmentlength polymorphisms), illustrating the sensitivity of microsatellites todetect fine-scale genetic structure. Population differentiation wasmore prominent in the western portion of the black-capped chickadeerange and coincided with a number of landscape features such asmountain ranges and habitat discontinuities. Continued isolationmay influence evolutionary processes (gene flow and adaptation) infuture generations, particularly in a constantly changing environment.This pattern may also be reflected in other resident organisms.Further study is necessary to detect the locations of genetic breaksamong subgroups at the microgeographical scale, particularly withinthe Fraser Plateau, to help identify the corresponding landscapestructures or features restricting dispersal and gene flow among theseneighbouring populations.
DATA ARCHIVING
Genotype data available from the Dryad Digital Repository:doi:10.5061/dryad.k086v. Data file contains the raw data of 11microsatellite loci for the black-capped chickadee across NorthAmerica.
CONFLICT OF INTEREST
The authors declare no conflict of interest.
ACKNOWLEDGEMENTSWe gratefully thank funding for this project provided by a Natural Science and
Engineering Research Council (NSERC) Discovery Grant and Alberta
Innovates (AI) New Faculty Award. We also thank J Hindley, L Lait, K Dohms,
A Martin, C MacFarlane, K Gohdes, K Nielson and others for helping with
sample collection for this project. We are also grateful to the following for
providing additional samples to supplement field sampling; Brian Davidson
(Smithsonian Museum), Daniel Mennill, Jenn Foote and Laurene Ratcliffe
(Queen’s University Biological Station), Steve Van Wilgenburg (CWS
Saskatoon), Ken Otter and Angelique Grava (University of Northern British
Columbia), North Carolina Museum of Natural Sciences, University of
Rangewide genetic structure of chickadeesRV Adams and TM Burg
10
Heredity
Michigan, Field Museum of Chicago and the Museum of Southwestern
Biology at the University of New Mexico. Finally, we would like to thank the
anonymous reviewers and editor for their constructive comments.
Aspi J, Roininen E, Ruokonen M, Kojola I, Vila C (2006). Genetic diversity, populationstructure, effective population size and demographic history of the Finnish wolfpopulation. Mol Ecol 15: 1561–1576.
Avise JC (2000). Phylogeography: the history and formation of species. Harvard UniversityPress: Cambridge, MA, USA.
Axelson JN, Alfaro RI, Hawkes BC (2009). Influence of fire and mountain pine beetle onthe dynamics of lodgepole pine stands in British Columbia, Canada. Forest Ecol Manag257: 1874–1882.
Benjamini Y, Yekutieli D (2001). The control of false discovery rate under dependency. AnnStat 29: 1165–1188.
Boys J, Cherry M, Dayanandan S (2005). Microsatellite analysis reveals geneticallydistinct populations of red pine (Pinus resinosa, Pinaceae). Am J Bot 92: 833–841.
Brennan LA, Morrison ML (1991). Long-term trends of chickadee populations in westernNorth America. Condor 93: 130–137.
Brunsfeld SJ, Sullivan D, Soltis E, Soltis PS (2001). Comparative phylogeography ofnorthwestern North America: a synthesis. In: Silvertown J, Antonovics J (eds)Integrating Ecology and Evolution in a Spatial Context. Blackwell Publishing: Williston,VT, USA, pp 319–339.
Burg TM, Gaston AJ, Winker K, Friesen VL (2005). Rapid divergence and postglacialcolonization in western North American Steller’s jays (Cyanocitta stelleri). Mol Ecol 14:3745–3755.
Burg TM, Gaston AJ, Winker K, Friesen VL (2006). Effects of Pleistocene glaciations onpopulation structure of North American chestnut-backed chickadees. Mol Ecol 15:2409–2419.
Canestrelli D, Cimmaruta R, Nascetti G (2008). Population genetic structure and diversityof the Apennine endemic stream frog, Rana italica- insights on the Pleistoceneevolutionary history of the Italian peninsular biota. Mol Ecol 17: 3856–3872.
Carstens BC, Brunsfeld SJ, Dembroski JR, Good JM, Sullivan J (2005). Investigating theevolutionary history of the Pacific Northwest mesic forest ecosystems: hypothesistesting within a comparative phylogeographic framework. Evolution 59: 1639–1652.
Carstens BC, Knowles LL (2007). Shifting distribution and speciation: species divergenceduring rapid climate change. Mol Ecol 16: 619–627.
Chen C, Durand E, Forbes F, Francois O (2007). Bayesian clustering algorithmsascertaining spatial population structure: a new computer program and a comparisonstudy. Mol Ecol Notes 7: 747–756.
Cooper ST, Swanson DL (1994). Acclimatization of thermoregulation in the black-cappedchickadee. Condor 96: 638–646.
Corander J, Marttinen P, Siren J, Tang J (2008). Enhanced Bayesian modelling in BAPSsoftware for learning genetic structures of populations. BMC Bioinform 9: 539.
Crawford NG (2010). SMOGD: software for the measurement of genetic diversity. Mol EcolRes 10: 556–557.
Davidson BS, Sattler GD, Via S, Braun MJ (2013). Reproductive isolation and crypticintrogression in a sky island enclave of Appalachian birds. Ecol Evol 3: 2485–2496.
Dawson DA, Hanotte O, Greig C, Stewart IAK, Burke T (2000). Polymorphic microsatellitesin the blue tit Parus caeruleus and their cross-species utility in 20 songbird families.Mol Ecol 9: 1941–1944.
Earl DA, vonHoldt BM (2012). STRUCTURE HARVESTER: a website and program forvisualizing STRUCTURE output and implementing the Evanno method. Conserv GenetRes 4: 359–361.
Evanno G, Regnaut S, Goudet J (2005). Detecting the number of clusters of individualsusing the software STRUCTURE: a simulation study. Mol Ecol 14: 2611–2620.
Excoffier L, Lischer HEL (2010). Arlequin suite ver 3.5: a new series of programs toperform population genetics analyses under Linux and Windows. Mol Ecol Res 10:564–567.
Falush D, Stephens M, Pritchard JK (2003). Inference of population structure usingmultilocus genotype data: linked loci and correlated allele frequencies. Genetics 164:1567–1587.
FAO (2001). Global Forest Resources Assessment 2000. FAO Forestry Paper 140. Rome,Food and Agriculture Organization. http://www.fao.org/forestry/fo/fra/ [Geo-2-402]
Foll M, Gaggiotti O (2006). Identifying the environmental factors that determine thegenetic structure of populations. Genetics 174: 875–891.
Fort KT, Otter K (2004). Effects of habitat disturbance on reproduction in black-cappedchickadees (Poecile atricapillus) in northern British Columbia. The Auk 121:1070–1080.
Francois O, Durand E (2010). Spatially explicit Bayesian clustering models in populationgenetics. Mol Ecol Res 10: 773–784.
Galbreath KE, Cook JA (2004). Genetic consequences of Pleistocene glaciations for thetundra vole (Microtus oeconomus) in Beringia. Mol Ecol 13: 135–148.
Gill FB, Mostrom AM, Mack AL (1993). Speciation in North American chickadees: I.Patterns of mtDNA genetic divergence. Evolution 47: 195–212.
Good JM, Sullivan J (2001). Phylogeography of the red-tailed chipmunk (Tamisruficaudus), a northern Rocky Mountain endemic. Mol Ecol 10: 2683–2695.
Goudet J (2001). FSTAT, a program to estimate and test gene diversities and fixationindices (version 2.9.3). Available from http://www.unil.ca/izea/softwares/fstat.html.Updated from Goudet (2005).
Graham BA, Burg TM (2012). Molecular markers provide insights into contemporary and
historic gene flow for a non-migratory species. J Avian Biol 43: 198–214.Gray LJ (1989). Response of insectivorous birds to emerging aquatic insects in riparian
habitats of a tallgrass prairie stream. Am Midl Nat 129: 288–300.Grava A, Grava T, Didier R, Lait LA, Dosso J, Koran E et al. (2012). Interspecific
dominance relationships and hybridization between black-capped and mountain
chickadees. Behav Ecol 23: 566–572.Guillette LM, Bloomfield LL, Batty ER, Dawson MR, Sturdy CB (2010). Black-capped
(Poecile atricapillus) and mountain chickadee (Poecile gambeli) contact call
contains species, sex, and individual identity features. J Acoust Soc Am 127:
1116–1123.Hagerty BE, Nussear KE, Esque TC, Tracy R (2010). Making molehills out of
mountains: landscape genetics of the Mojave desert tortoise. Landscape Ecol 26:
267–280.Hansson B, Bensch S, Hasselquist D, Lillandt BG, Wennerberg L, Von Schantz T (2000).
Increase of genetic variation over time in a recently founded population of great reed
warblers (Acrocephalus arundinaceus) revealed by microsatellites and DNA fingerprint-
ing. Mol Ecol 9: 1529–1538.Hawley DM (2005). Isolation and characterization of eight microsatellite loci from the
house finch (Carpodacus mexicanus). Mol Ecol Notes 5: 443–445.Hewitt GM (1996). Some genetic consequences of ice ages, and their role in divergence
and speciation. Biol J Linnean Soc 58: 247–276.Hewitt GM (2004). Genetic consequences of climatic oscillations in the Quaternary. Philos
Trans R Soc Lond B Biol Sci 359: 183–195.Hindley JA (2013). Post-Pleistocene dispersal in black-capped (Poecile atricapillus) and
mountain (P. gambeli) chickadees, and the effect of social dominance on black-capped
chickadee winter resource allocation. PhD Thesis University of Lethbridge: AB, Canada.Hijmans RJ, Guarino L, Mathur P (2012). DIVA-GIS; Version 7.5 Manual.Holderegger R, Wagner HH (2008). Landscape genetics. Bioscience 58: 199–207.Jost L (2008). GST and its relatives do not measure differentiation. Mol Ecol 17:
4015–4026.Korner C (1998). A re-assessment of high elevation treeline positions and their
explanation. Oecologia 115: 445–459.Lait LA, Burg TM (2013). When east meets west: population structure of a
high-latitude resident species, the boreal chickadee (Poecile hudsonicus). Heredity
111: 321–329.Lait LA, Lauff RF, Burg TM (2012). Genetic evidence supports boreal chickadee (Poecile
hudsonicus) x black-capped chickadee (Poecile atricapillus) hybridization in Atlantic
Canada. Canadian Field-Naturalist 126: 143–147.Latch EK, Dharmarajan G, Glaubitz JC, Rhodes Jr OE (2006). Relative performance of
Bayesian clustering software for inferring population substructure and individual
assignments at low levels of population differentiation. Conserv Genet 7: 295–302.Li P, Adams WT (1989). Range-wide patterns of allozyme variation in Douglas-fir
(Pseudotsuga menziesii). Can J Forest Research 19: 149–161.Manel S, Holderegger R (2013). Ten years of landscape genetics. TREE 28: 614–621.Manni F, Guerard E, Heyer E (2004). Geographic patterns of (genetic, morphologic,
linguistic) variation: how barriers can be detected by using Monmonier’s algorithm.
Hum Biol 76: 173–190.Mariette S, Changnea D, Zier CLL, Pastuszka P, Raffin A, Plomion C, Kremer A (2001).
Genetic diversity within and among Pinus pinaster populations: comparison between
AFLP and microsatellite markers. Heredity 86: 469–479.McGowan C, Howes LA, Davidson WS (1999). Genetic analysis of an endangered pine
marten (Martes americana) population from Newfoundland using randomly amplified
polymorphic DNA markers. Can J Zool 77: 661–666.McRae BH, Beier P, Dewald E, Huynh Y, Keim P (2005). Habitat barriers limit gene flow
and illuminate historical events in a wide-ranging carnivore, the American puma. Mol
Ecol 14: 1965–1977.McRae B (2006). Isolation by resistance. Evolution 60: 1551–1561.Meirmans PG, Hedrick PW (2011). Assessing population structure: FST and related
measures. Mol Ecol Res 11: 5–18.Ministry of Forests, Land and Natural Resource Operations (2012). Resource Values
Assessment: Biodiversity. Available at: http://www.for.gov.bc.ca/hfp/mountain_pine_-
beetle/mid-term-timber-supply-project/Biodiversity_summary_june_11.pdf.Nielson M, Lohman K, Sullivan J (2001). Phylogeography of the tailed frog (Ascaphus truei):
implications for the biogeography of the Pacific Northwest. Evolution 55: 147–160.Peakall R, Smouse PE (2012). GenAlEx 6.5: genetic analysis in excel. Population genetic
software for teaching and research—an update. Bioinformatics 28: 2537–2539.Peel MC, Finlayson BL, McMahon TA (2007). Updated world map of the Koppen-Geiger
climate classification. Hydrol Earth Syst Sci 11: 1633–1644.Perez-Espona S, Perez-Barberia FJ, McLeod JE, Jiggins CD, Gordon IJ, Pemberton JM
(2008). Landscape features affect gene flow of Scottish Highland red deer (Cervus
elaphus). Mol Ecol 17: 981–996.Petersen B, Stuart D (2014). Explanations of a changing landscape: a critical
examination of the British Columbia bark beetle epidemic. Environment and Planning
A 46: 598–613.Petren K (1998). Microsatellite primers from Geospiza fortis and cross-species amplifica-
tion in Darwin’s finches. Mol Ecol 7: 1782–1784.Pielou EC (1991). After the Ice Age: The Return of Life to Glaciated North America.
University of Chicago Press: Chicago, IL, USA.Piertney SB, MacColl AD, Bacon PJ, Dallas JF (1998). Local genetic structure in red
grouse (Lagopus lagopus scoticus): evidence from microsatellite DNA markers. Mol
Ecol 7: 1645–1654.
Rangewide genetic structure of chickadeesRV Adams and TM Burg
11
Heredity

Polakova R, Vyskocilova M, Martin JF, Mays Jr HL, Hill GE, Bryja J et al. (2007). Amultiplex set of microsatellite markers for the Scarlet Rosefinch (Carpodacuserythrinus). Mol Ecol Notes 7: 1375–1378.
Pravosudov VV, Roth TC, Forister NL, Ladage LD, Burg TM, Braun MJ et al. (2012).Population genetic structure and its implications for adaptive variation in memory andthe hippocampus on a continental scale in food-caching black-capped chickadees. MolEcol 21: 4486–4497.
Pravosudov VV, Roth TC, Forister ML, Ladage LD, Kramer R, Schilkey F et al. (2013).Differential hippocampal gene expression is associated with climate-related naturalvariation in memory and the hippocampus in food-caching chickadees. Mol Ecol 22:397–408.
Pritchard JK, Stephens M, Donnelly P (2000). Inference of population structure usingmultilocus genotype data. Genetics 155: 945–959.
Proulx G, Kariz RM (2005). Winter habitat use by moose, Alces alces, in central interiorBritish Columbia. Can Field-Nat 119: 186–191.
Pulgarın-R PC, Burg TM (2012). Genetic signals of demographic expansion in downywoodpecker (Picoides pubescens) after the last North American glacial maximum.PLoS ONE 7: e40412.
Raymond M, Rousset F (1995). GENEPOP (version 1.2): population genetics software forexact tests and ecumenicism. J Hered 86: 248–249.
Richardson DS, Jury FL, Dawson DA, Salgueiro P, Komdeur J, Burke T (2000). FiftySeychelles warbler (Acrocephalus sechellensis) microsatellite loci polymorphic inSylviidae species and their cross-species amplification in other passerine birds. MolEcol 9: 2226–2231.
Roth TC II, Pravosudov VV (2009). Hippocampal volumes and neuron numbers increasealong a gradient of environmental harshness: a large-scale comparison. Proc R SocLond B Biol Sci 276: 401–405.
Roth TC, LaDage LD, Freas CA, Pravosudov VV (2012). Variation in memory and thehippocampus across populations from different climates: a common garden approach.Proc R Soc Lond B Biol Sci 279: 402–410.
Runde DE, Capen DE (1987). Characteristics of northern hardwood trees used by cavity-nesting birds. J Wildlife Manage 51: 217–223.
Sacks BN, Browns SK, Ernest HB (2004). Population structure of California coyotescorresponds to habitat-specific breaks and illuminates species history. Mol Ecol 13:1265–1275.
Shafer ABA, Cullingham CI, Cote SD, Coltman DW (2010). Of glaciers and refugia: adecade of study sheds new light on phylogeography of northwestern North America. MolEcol 19: 4589–4621.
Smissen PJ, Melville J, Sumner J, Jessop TS (2013). Mountain barriers and river conduits:phylogeographical structure in a large, mobile lizard (Varanidae: Varanus varius) fromeastern Australia. J Biogeogr 40: 1729–1740.
Smith SM (1993). Black-capped chickadee (Parus atricapillus). In: Poole A, Gill F (eds)The Birds of North America. The Birds of North America, Inc.: Philadelphia, PA,USA. 39.
Steinmeyer C, Mueller JC, Kempanaers B (2009). Search for information polymorphismsin candidate genes: clock genes and circadian behaviour in blue tits. Genetica 136:109–117.
Stenzler LM, Fraser R, Lovette IJ (2011). Isolation and characterization of 12 micro-satellite loci from Golden-winged Warblers (Vermivora chrysoptera) with broad cross-taxon utility in emberizine songbirds. Mol Ecol Notes 4: 602–604.
Tarvin KA (2006). Polymorphic microsatellite loci from the American goldfinch (Carduelistristis) and their cross-amplification in a variety of passerine species. Mol Evol Notes 6:470–472.
van Oosterhout C, Hutchinson WF, Wills DPM, Shipley P (2004). MICRO-CHECKER:software for identifying and correcting genotyping errors in microsatellite data. Mol Ecol4: 535–538.
Vandergast AG, Perry WM, Lugo RV, Hathaway SA (2011). Genetic landscapes GIStoolbox: tools to map patterns of genetic divergence and diversity. Mol Ecol Res 11:158–161.
Walsh PS, Metzger DA, Higuchi R (1991). Chelex 100 as a medium for simpleextraction of DNA for PCR based typing from forensic material. Biotechniques 10:506–513.
Wellenreuther M, Sanchez-Guillen RA, Cordero-Rivera A, Svensson EI, Hansson B (2011).Environmental and climatic determinants of molecular diversity and genetic populationstructure in a coenagionid damselfly. PLoS ONE 6: e20440.
Worley K, Strobeck C, Arthur S, Carey J, Schwantje H, Veitch A et al. (2004). Populationgenetic structure of North American thinhorn sheep (Ovis dalli). Mol Ecol 13:2545–2556.
Young A, Boyle T, Brown T (1996). The population genetic consequences of habitatfragmentation for plants. TREE 11: 413–418.
Supplementary Information accompanies this paper on Heredity website (http://www.nature.com/hdy)
Rangewide genetic structure of chickadeesRV Adams and TM Burg
12
Heredity