influence of extrusion parameters and recipe … of extrusion parameters and recipe compounds on...
TRANSCRIPT

Influence of Extrusion Parameters and Recipe
Compounds on Flavor Formation and its
Detection and Quantification
vorgelegt von
Dipl.-Ing. Tobias Rausch
aus Berlin
von der Fakultät III – Prozesswissenschaften
der Technischen Universität Berlin
zur Erlangung des akademischen Grades
Doktor der Ingenieurwissenschaften
- Dr.-Ing. -
genehmigte Dissertation
Promotionsausschuss:
Vorsitzender: Prof. Dr. Ulf Stahl
1. Gutachter: Prof. Dr. Dietrich Knorr
2. Gutachter: Prof. Dr. Dr. e.h. Friedrich Meuser
3. Gutachter: Prof. Dr. Bernhard van Lengerich
4. Gutachter: Prof. Dr. Leif-Alexander Garbe
Tag der wissenschaftlichen Aussprache: 11. November 2008
Berlin 2009
D83

“So eine Arbeit ist eigentlich nie fertig,
man muss sie für fertig erklären,
wenn man nach Zeit und Umständen das Möglichste getan hat.“
(J.W. Goethe; „Italienische Reise“, 1787)

Table of Contents 3
Table of Contents
Table of Contents ........................................................................................................3
List of Figures..............................................................................................................6
List of Tables .............................................................................................................10
Abbreviations ............................................................................................................12
Acknowledgement .....................................................................................................13
Summary ...................................................................................................................14
Zusammenfassung .....................................................................................................17
1 Introduction and Objectives .....................................................................20
1.1 Introduction.................................................................................................20
1.2 Objectives ...................................................................................................21
2 State of the Art ..........................................................................................23
2.1 Extrusion Cooking.......................................................................................23
2.2 Expanded Ready to Eat Cereals ...................................................................24
2.2.1 Puffed Cereals .............................................................................................24
2.2.2 Extruded Expanded Cereals.........................................................................25
2.3 Flavor..........................................................................................................25
2.3.1 Flavor in Extruded Expanded Cereals..........................................................26
2.3.2 Flavor Development by Nonenzymatic Browning Reactions .......................28
2.3.2.1 Pyrolysis .....................................................................................................28
2.3.2.2 Caramelization ............................................................................................28
2.3.2.3 Maillard Reaction........................................................................................29
2.3.3 Flavor Precursors.........................................................................................32
2.3.3.1 Sugar...........................................................................................................32
2.3.3.2 Protein and Single Amino Acids..................................................................34
2.3.4 Selected Flavor Compounds ........................................................................35
2.3.4.1 Pyrazines.....................................................................................................35
2.3.4.2 Furanones / Pyranones.................................................................................36
2.3.4.3 Pyrroles / Pyridines .....................................................................................37
2.3.4.4 Aldehydes ...................................................................................................38

Table of Contents 4
2.3.5 Maillard Reaction and its Influence on Acrylamide Formation ....................39
2.4 Flavor Analysis ...........................................................................................40
2.4.1 Flavor Isolation and Concentration ..............................................................40
2.4.1.1 Simultaneous Extraction/Distillation According to Likens-Nickerson ..........41
2.4.1.2 Liquid-Liquid Extraction According to Kutscher-Steudel ............................42
2.4.1.3 Solvent Assisted Flavor Evaporation (SAFE) ..............................................43
2.4.1.4 Headspace Sampling ...................................................................................45
2.4.2 Flavor Identification and Quantification ......................................................46
2.4.2.1 Chromatography..........................................................................................46
2.4.2.2 Gas Chromatography (GC)..........................................................................47
2.4.2.3 Mass Spectrometry (MS).............................................................................49
2.4.2.4 Gas Chromatography–Mass Spectrometry (GC-MS) ...................................52
2.4.3 Quantification..............................................................................................54
2.4.3.1 Internal Standards........................................................................................54
2.4.3.2 Stable Isotope Dilution Analysis..................................................................54
2.5 Color and Color Measurement.....................................................................55
3 Materials and Methods..............................................................................57
3.1 Raw materials..............................................................................................57
3.2 Sample Generation ......................................................................................58
3.2.1 Experimental Design ...................................................................................58
3.2.2 Extrusion Process ........................................................................................59
3.2.3 Drying Process ............................................................................................60
3.2.4 Sampling .....................................................................................................60
3.3 Isolation of Flavor Volatiles ........................................................................61
3.3.1 Extraction according to Kutscher-Steudel ....................................................61
3.3.2 Solvent Assisted Flavor Evaporation (SAFE Method) .................................61
3.3.3 Purge and Trap Headspace Sampling...........................................................61
3.4 Identification and Quantification of Flavor Volatiles ...................................62
3.4.1 Gas Chromatography / Mass Spectrometry (GC/MS) ..................................62
3.4.1.1 Quadrupole GC/MS.....................................................................................63
3.4.1.2 Sector field GC/MS.....................................................................................63
3.4.2 Quantification..............................................................................................64
3.5 Color Measurements....................................................................................65

Table of Contents 5
4 Results and Discussion ..............................................................................66
4.1 Flavor Analysis ...........................................................................................67
4.1.1 Comparison of Dynamic Headspace Sampling and Liquid/Liquid Extraction – SAFE Distillation ....................................................................67
4.1.2 Quantification by Internal Standards Compared to Stable Isotope Dilution Analysis (SIDA) ............................................................................71
4.2 Influence of Process Parameters on Product Parameters...............................76
4.2.1 Influences on Pyrazine Formation................................................................80
4.2.2 Influences on Furanmethanol Formation......................................................87
4.2.3 Influences on 2,4-Decadienal Formation......................................................89
4.2.4 Influences on Acid Formation......................................................................93
4.2.5 Influences on Maltol Formation...................................................................96
4.3 Influence of Process Parameters on System Parameters ...............................99
4.4 Influence of System Parameters on Product Parameters .............................102
4.5 Influence of Single Amino Acids as Potential Flavor Precursor .................104
4.6 Color Measurement ...................................................................................109
Appendix..................................................................................................................113
Literature.................................................................................................................117

List of Figures 6
List of Figures
Figure 1: General overview of the Maillard reaction showing flavor compounds as end products. ......................................................................................30
Figure 2: Outline of the chemical reactions occurring during the Maillard reaction. ..................................................................................................31
Figure 3: Carbonyl group location in ketoses and aldoses.......................................33
Figure 4: Saccharose molecule consisting of α-D-Glucose and β-D-Fructose. ........33
Figure 5: Amino acid and its functional groups as a part in the primary structure of a complex protein. ..............................................................................34
Figure 6: Pyrazine..................................................................................................36
Figure 7: Basic structures and potent flavor representatives of furanones and pyranones. ..............................................................................................37
Figure 8: Basic structure of pyrroles and pyridines, required for roasted odor.........38
Figure 9: Apparatus according to Likens and Nickerson used for simultaneous extraction and distillation of volatile compounds.....................................42
Figure 10: Liquid-liquid extractor according to Kutscher and Steudel. .....................43
Figure 11: SAFE apparatus for the distillation of aroma substances from food (for explanations, see text. According to Engel et al. [24, 83]) .......................44
Figure 12: Principle set-up of a gas chromatograph. ................................................48
Figure 13: Basic parts of a mass spectrometer. .........................................................50
Figure 14: Design and function principle of a double focusing mass analyzer. .........51
Figure 15: Simplified set-up of gas chromatograph / mass spectrograph unit............53
Figure 16: Barrel temperature profile and profile of the mechanical energy input in the extruder due to the heating of the barrel section and the use of different screw elements. ........................................................................60
Figure 17: Systems analytical model for the extrusion cooking process....................66
Figure 18: Chromatograms of extruded wheat starch, containing 6% protein and 4% glucose, processed at 160°C. A): headspace sampling with subsequent quadrupole GC/MS, B): liquid-liquid extraction/SAFE distillation with subsequent sector field GC/MS......................................68
Figure 19: Influence of different quantification methods on the determined concentration of methylpyrazine and 2,5-dimethylpyrazine in milk protein/glucose syrup samples containing 4% sugar and differing protein content, processed at 160°C. .......................................................73
Figure 20: Comparison of methylpyrazine concentration in milk protein/glucose syrup samples containing 4% glucose syrup obtained by quantification using 1-octanol and trimethylpyrazine (TMP). ........................................73

List of Figures 7
Figure 21: Comparison of 2,5-dimethylpyrazine concentration in milk protein/glucose syrup samples containing 4% glucose syrup obtained by quantification using 1-octanol and trimethylpyrazine (TMP). .............74
Figure 22: Influence of different quantification methods on the determined concentration of butyric acid in milk protein/glucose syrup samples containing 4% sugar and differing in protein content, processed at 160°C. ....................................................................................................75
Figure 23: Comparison of butyric acid concentration in milk protein/glucose syrup samples containing 4% glucose syrup quantified by using the standards 1-octanol and C13 labeled butyric acid (stable isotope dilution analysis, SIDA)..........................................................................75
Figure 24: Influence of different proteins of constant concentration of 2% in the recipe on the formation of 2,5-dimethylpyrazine in dependence on sugar content and barrel temperature. ......................................................81
Figure 25: Influence of different sugars of constant concentration of 4% in the recipe on the formation of 2,5-dimethylpyrazine in dependence on protein content and barrel temperature. ...................................................81
Figure 26: Influence of barrel temperature on methylpyrazine formation at constant protein (2%) and sugar (4%) contents........................................82
Figure 27: Influence of barrel temperature on 2,5-dimethylpyrazine formation at constant Protein (2%) and sugar (4%) contents........................................82
Figure 28: Concentration of methylpyrazine and 2,5-dimethylpyrazine depending on the amount of glucose at a constant whey protein content (2%), processed at 160°C..................................................................................83
Figure 29: Concentration of methylpyrazine and 2,5-dimethylpyrazine depending on the amount of glucose at a constant milk protein content (2%), processed at 160°C..................................................................................83
Figure 30: Concentration of methylpyrazine and 2,5-dimethylpyrazine depending on the amount of glucose syrup at a constant milk protein content (2%), processed at 160°C. .......................................................................84
Figure 31: Concentration of methylpyrazine and 2,5-dimethylpyrazine depending on the amount of whey protein at a constant glucose content (4%), processed at 160°C..................................................................................85
Figure 32: Concentration of methylpyrazine and 2,5-dimethylpyrazine depending on the amount of milk protein at a constant glucose content (4%), processed at 160°C..................................................................................85
Figure 33: Concentration of methylpyrazine and 2,5-dimethylpyrazine depending on the amount of milk protein at a constant glucose syrup content (4%), processed at 160°C. .......................................................................86
Figure 34: Concentration of furanmethanol depending on the amount of sugar at constant protein contents (2%), processed at 160°C.................................88
Figure 35: Concentration of furanmethanol depending on the amount of protein at constant sugar contents (4%), processed at 160°C. ..............................88
Figure 36: Influence of barrel temperature on furanmethanol formation at constant protein (2%) and sugar (4%) contents........................................89

List of Figures 8
Figure 37: Concentration of 2,4-decadienal depending on the amount of sugar at constant protein contents (2%), processed at 160°C.................................90
Figure 38: Concentration of 2,4-decadienal depending on the amount of protein at constant sugar contents (4%), processed at 160°C. ..............................91
Figure 39: Influence of barrel temperature on 2,4-decadienal formation at constant protein (2%) and sugar (4%) contents........................................92
Figure 40: Influence of temperature and glucose contents on 2,4-decadienal formation at a constant milk protein content (2%). ..................................92
Figure 41: Concentration of butyric acid, pentanoic acid, and hexanoic acid, depending on the amount of sugar at constant protein contents (2%), processed at 160°C..................................................................................93
Figure 42: Concentration of butyric acid, pentanoic acid, and hexanoic acid, depending on the amount of protein at constant sugar contents (4%), processed at 160°C..................................................................................94
Figure 43: Influence of barrel temperature on the formation of butyric acid, pentanoic acid, and hexanoic acid at constant protein (2%) and sugar (4%) contents..........................................................................................95
Figure 44: Influence of different protein-sugar compositions on maltol formation at 160°C barrel temperature. ...................................................................96
Figure 45: Concentration of maltol, depending on the amount of sugar at constant protein contents (2%), processed at 160°C. .............................................97
Figure 46: Concentration of maltol, depending on the amount of protein at constant sugar contents (4%), processed at 160°C. ..................................97
Figure 47: Influence of barrel temperature on the formation of maltol at constant protein (2%) and sugar (4%) contents. ....................................................98
Figure 48: Changes in die pressure depending on glucose content and barrel temperature at a constant whey protein content of 2%. ..........................102
Figure 49: Influence of SME and die temperature on 2,5-dimethylpyrazine formation in a milk protein/glucose syrup design at medium die pressure (approx. 6 bar).........................................................................104
Figure 50: Differences in methylpyrazine and 2,5-dimethylpyrazine formation, depending on the kind and concentration of added amino acids. ............106
Figure 51: Differences in maltol formation, depending on the kind and concentration of added amino acids.......................................................107
Figure 52: Differences in 2,4-decadienal formation, depending on the kind and concentration of added amino acids.......................................................108
Figure 53: Influence of sugar concentrations on product lightness at 2% protein constantly for samples processed at 160°C, containing different protein and sugar compositions. ............................................................110
Figure 54: Influence of protein concentrations on product lightness at 4% sugar constantly for samples processed at 160°C, containing different protein and sugar compositions. ............................................................111

List of Figures 9
Figure 55: One factor plots, showing the influence of selected flavor compound concentrations on relative product lightness L (0=white, 100=black) using the example of the whey protein/glucose model system. ..............112

List of Tables 10
List of Tables
Table 1: Characteristics of modern extrusion cooking...........................................23
Table 2: Initial caramelization temperatures of common sugars ............................29
Table 3: Flavor impressions and formation pathways of selected aldehydes..........39
Table 4: Proximate composition of protein containing additives used ...................57
Table 5: Designs of the extrusion cooking experiments.........................................58
Table 6: Coding of the experimental trials ............................................................58
Table 7: Technical Data of the Twin-Screw-Extruder DNDL-44/28D...................59
Table 8: Purge and Trap instrument conditions .....................................................62
Table 9: Parameters of the quadrupole mass spectrometer “HP 5989 MS-ENGINE” ...............................................................................................63
Table 10: Parameters of the double focusing sector field mass spectrometer “Model 8230” .........................................................................................64
Table 11: Used internal standards and their amounts...............................................64
Table 12: Aroma active volatiles detected in extruded wheat starch samples containing different proteins and sugars, processed at 160°C, isolated by DHS and LLE-SAFE..........................................................................69
Table 13: Comparison of concentrations of selected compounds in extrudate samples produced according to a milk protein/glucose syrup design, determined by TMP or SIDA and 1-octanol ............................................72
Table 14: Concentration of selected flavor compounds in extrudate samples produced according to a whey protein/glucose design, all results in ppm ........................................................................................................77
Table 15: Concentration of selected flavor compounds in extrudate samples produced according to a milk protein/glucose design, all results in ppm ........................................................................................................77
Table 16: Concentration of selected flavor compounds in extrudate samples produced according to a milk protein/glucose syrup design, all results in ppm ....................................................................................................78
Table 17: Regression coefficients and coefficients of determination for the influence of process parameters on selected flavor compounds using whey protein and glucose........................................................................78
Table 18: Regression coefficients and coefficients of determination for the influence of process parameters on selected flavor compounds using milk protein and glucose .........................................................................79
Table 19: Regression coefficients and coefficients of determination for the influence of process parameters on selected flavor compounds using milk protein and glucose syrup................................................................79

List of Tables 11
Table 20: Regression coefficients and coefficients of determination for the influence of process parameters on system parameters using milk protein and glucose syrup......................................................................100
Table 21: Regression coefficients and coefficients of determination for the influence of process parameters on system parameters using whey protein and glucose ...............................................................................100
Table 22: Statistical correlation of system parameters...........................................101
Table 23: Regression coefficients and coefficients of determination for the influence of system parameters on product parameters using whey protein and glucose ...............................................................................103
Table 24: Regression coefficients and coefficients of determination for the influence of system parameters on product parameters using milk protein and glucose syrup......................................................................103
Table 25: Flavor compound concentration depending on amino acids...................105
Table 26: Regression coefficients and coefficients of determination for the influence of process parameters on product lightness L .........................109

Abbreviations 12
Abbreviations
APCI atmospheric pressure chemical ionization N Nitrogen
AS amino acid NIR near infrared reflectance
CI chemical ionization NIT near infrared transmittance
DHS dynamic headspace sampling NPLC normal phase liqid chromatography
EI electron ionization PID photo ionization detector
ESI electrospray ionization ppm parts per million
FD field desorption RPLC reversed phase liquid chromatography
FID flame ionization detector rt retention time
FPD flame photometric detector RTE ready to eat
GC gas chromatograph / gas chromatography SAFE solvent assisted flavor evaporation
GC-MS gas chromatography-mass spectrometry SDE simultaneous distillation-extraction
GLC gals-liquid chromatography SIDA stable isotope dillution analysis
HPLC high performance liquid chromatography SIM selctive ion monitoring
HTST high-temperature short-time SME specific mechanical energy
L* lightness TCD thermal conductivity detector
L relative lightness (100-L*) TMP trimethylpyrazine
LC liquid chromatography TOF time of flight
LLE liquid-liquid extraction VHS vacuum headspace
m/z dimensionless mass to charge ratio WP/G whey protein/glucose
MALDI matrix assisted laser desorption/ionization
MP/CS milk protein/glucose syrup
MP/G milk protein/glucose
MS mass spectromter / mass spectrometry
MS/MS tandem mass spectrometry
MSD mass selective detector

Acknowledgement 13
Acknowledgement
Hidden within the text of this thesis is the support and energy of my family and friends.
I would like to express my appreciation for their assistance over the past years.
I thank my supervisors, Prof. Dr. Dr. e.h. F. Meuser and Prof. Dr. B. van Lengerich, for
their encouragement, financial support, and confidence in my research ability.
This project had a wide geographic base. A large part of the experimental work was
conducted at the University of Minnesota, Department of Food Science and Nutrition. I
am grateful to Prof. Dr. Gary Reineccius for his interest in this project and for allowing
me liberal access to the facilities of the Food Research Institute. I thank all members of
his flavor chemistry group for their friendship which made my time abroad an unforget-
table experience. I thank Keith Evenson for his helpful assistance through many long,
hot extruder runs as well as Steve Robie and Hasmuk Patel for their unconditional help.
I thank Dr. Leif-Alexander Garbe from the Berlin Institute of Technology, Department
of Biotechnology, for his suggestions which were very helpful in my gaining a better
understanding in the field of flavor chemistry. Furthermore I would like to thank Wal-
traut Poppe, Dipl.-Ing. Gunnar Köhler, and Dipl.-Ing. Konrad Neuman for their careful
analytical work.
I would like to express my appreciation to the staff at the Chair of Cereal Technology at
the Berlin Institute of Technology for the pleasant teamwork atmosphere.
I thank Dipl.-Ing. Nils Lachmann, Dipl.-Ing. Marco Kaiser, and Manja Bloch for care-
fully reviewing this thesis.
A special thanks is due to my parents for their support which I always could rely on.

Summary 14
Summary
Objective of the dissertation was to examine the influence of specific Maillard reaction
precursors and temperature on the formation of flavor compounds and color develop-
ment in extrusion cooked food products. For this, functional relationships between
process, system, and product parameters were analyzed.
Dry mixtures of wheat starch and protein were processed in a 44 mm diameter, co-
rotating twin screw extruder by the addition of sugar and single amino acids dissolved
in water. For each mixture of protein and sugar, a 33 factorial experiment was designed
on the following operating conditions:
i) barrel temperature 140°C, 160°C, and 180°C
ii) protein concentration of the mixture 1.3%, 2.0%, and 2.6%
iii) sugar concentration of the mixture 2%, 4%, and 6%
Screw speed, moisture, and feed rate were kept constant to narrow the influencing vari-
ables and to keep the residence time unchanged.
Protein and sugar concentrations and barrel temperature showed different influences on
the system parameters die temperature, die pressure, and specific mechanical energy
input (SME). SME was found to be the only system parameter showing a significant
influence on flavor development. An increase resulted in elevated concentrations of
pyrazines and furanmethanol, representing important flavor compounds. Within this
study, no statistical significance of product pressure and product temperature could be
found regarding their influence on the formation of the examined flavor compounds.
Evaluations of the influence of protein, sugar, and temperature as well as separate ex-
aminations of the influence of single amino acids are based on GC/MS quantification
results obtained by stable isotope dilution analysis (SIDA) or the use of trimethypyra-
zine (TMP).
The results showed distinct differences in how protein, sugar, and temperature influence
different groups of flavor compounds. It was found that the most important flavor com-
pounds for the desired cereal like aroma among the evaluated compounds, i.e. pyrazi-
nes, furanmethanol, and maltol, showed similarities in how they were generally af-
fected. They were significantly positive influenced by increasing barrel temperatures
and protein contents. Increasing sugar contents led to decreasing concentrations of
2,5-dimethylpyrazine, furanmethanol, and maltol whereas the formation of
methylpyrazine was favored up to 4% sugar followed by a distinct drop at higher con-
centrations. The kind of protein and sugar used was found to be important. The forma-
tion of pyrazines was favored by using glucose and whey protein while furanmethanol
and maltol formation was positively influenced by using milk protein.

Summary 15
Oppositional effects regarding sugar and protein concentrations have been found for
2,4-decadienal, representing a chemical compound derived by the autoxidation of fatty
acids, providing typical off-flavor characteristics at higher concentration. Its formation
was favored at increasing sugar contents and reduced by increasing protein concentra-
tions. Proceeding from the assumption that 2,4-decadienal follows a different chemical
pathway than pyrazines, furanmethanol and maltol it was found that those pathways are
differently influenced by protein and sugar.
Acid formation was found to be dependent on the kind of sugar and protein used as well
as on their concentration. By adding glucose syrup, acid formation reached its maxi-
mum at 4% followed by a distinct decrease. The same effect was found for butyric acid
using glucose, while a minimum concentration at 4% glucose was detected for pen-
tanoic acid and hexanoic acid. Increasing whey protein contents led to decreasing acid
concentrations whereas the use of 2% milk protein maximized the concentrations of
butyric and pentanoic acid. Hexanoic acid made an exception by showing consistently
increasing concentrations at high milk protein concentrations.
The addition of different single amino acids as potential flavor precursors showed simi-
larities in how they influence the formation of the examined flavor compounds. In gen-
eral, the results were comparable to those found for protein. Differences were found in
the intensity in which different amino acids affect the formation of the selected flavor
compounds. Valine and proline showed the highest potential in reducing the amounts of
2,4-decadienal and acids whereas the highest levels of pyrazines were found using leu-
cine. However, neither did one of the examined amino acids come along with definite
advantages over the other amino acids nor were the detected variances distinct enough,
compared to the reference sample, to justify their application.
Color measurement showed significant influences of all adjustable parameters, i.e. pro-
tein, sugar, and barrel temperature on product lightness. A quadratic influence was
found for the barrel temperature (140°C – 180°C), resulting in maximum darkening at
different temperature. This temperature depended on the protein-sugar composition
used. A maximum darkening was reached at lower temperatures using milk protein,
compared to samples containing whey protein. The addition of protein led to significant
increasing product darkening due to Maillard type browning reactions. No differences
could be found for the type of protein used. The addition of sugar resulted also in a sig-
nificantly increasing color formation which was found to be more intense compared to
protein. Thereby, more intense coloration was found using glucose compared to glucose
syrup. A coherence regarding product lightness and the formation of specific flavor
compounds could not be found.
This study demonstrated that the formation of flavor compounds and color development
could be modulated by the tested parameters. Furthermore it could be shown that flavor

Summary 16
formation as well as coloration can be differently influenced depending on the kind of
used additives, i.e. sugar, protein, and amino acid.

Zusammenfassung 17
Zusammenfassung
Das Ziel der vorliegenden Promotion war die Untersuchung des Einflusses von Tempe-
ratur und spezifischer Prekursoren der Maillardreaktion auf die Aromastoffbildung und
die Farbentwicklung in stärkehaltigen Extrudaten. Dazu wurden die funktionellen Be-
ziehungen von Prozess-, System- und Produktparametern betrachtet.
Mischungen aus Weizenstärke und Protein wurde in einem gegenläufigen Zweiwelle-
nextruder mit einem Scheckendurchmesser von 44 mm unter Zugabe von in Wasser
gelöstem Zucker und einzelnen Aminosäuren bei verschiedenen Gehäusetemperaturen
extrudiert. Für jede der untersuchten Protein-Zucker-Mischungen wurde ein 33-
Faktorenversuchsplan mit den nachfolgenden Einstellungen verwendet.
i) Gehäusetemperatur 140°C, 160°C und 180°C
ii) Proteingehalt der Mischung 1,3%, 2,0% und 2,6%
iii) Zuckergehalt der Mischung 2%, 4% und 6%
Um die Zahl der möglichen Einflussgrößen zu reduzieren und eine weitestgehend
gleichbleibende Verweilzeit zu erreichen, wurden Schneckendrehzahl sowie Extrusions-
feuchte und Gesamtmassenstrom nicht variiert.
Hinsichtlich der gemessenen Systemgrößen Düsentemperatur, Düsendruck und spezi-
fisch mechanischer Energieeinleitung (SME) zeigten Protein, Zucker und Temperatur
unterschiedlich starke Einflüsse. Die SME war der einzige Systemparameter für den ein
statistisch signifikanter Einfluss auf die Aromastoffentwicklung festgestellt werden
konnte. Ein Anstieg führte zu einer erhöhten Konzentration der aromaaktiven Pyrazine
und des aromaaktiven Furanmethanols. Die statistische Auswertung zeigte für keine der
untersuchten Aromastoffe eine signifikante Beeinflussung im Bereich des gemessenen
Produkttemperatur- beziehungsweise Produktdruckbereiches.
Grundlage der Bewertung des Einflusses von Protein, Zucker und Temperatur sowie der
in einer separaten Versuchsreihe untersuchten Aminosäuren auf die Aromaentwicklung
waren die Konzentrationen ausgewählter Aromastoffe nach Auswertung von GC/MS-
Analysen. Die Quantifizierung erfolgte hierbei mit Hilfe der Stable Isotope Dilution
Analysis (SIDA) beziehungsweise durch die Verwendung von Trimethylpyrazin als
internen Standard für die selektive Quantifizierung der Pyrazine. Proteine, Zucker und
Temperatur zeigten hierbei unterschiedliche Einflüsse auf die Bildung verschiedener
Aromastoffe. Es konnte gezeigt werden, dass die im Rahmen dieser Studie untersuchten
Aromastoffe, welche für einen gewünschten cerealen Röstgeschmack verantwortlich
sind, ähnlich beeinflusst werden. Hierzu zählten neben Pyrazinen auch Furanmethanol
und Maltol. Bei allen zeigten sich zunehmende Konzentrationen mit steigenden Gehäu-

Zusammenfassung 18
setemperaturen und Proteingehalten. Im Gegensatz dazu führten erhöhte Zuckergehalte
zu sinkenden Konzentrationen an 2,5-Dimethylpyrazin, Furanmethanol und Maltol.
Lediglich Methylpyrazin zeigte steigende Werte bis 4 % Zucker, gefolgt von einer Kon-
zentrationsabnahme. Neben ihren prozentualen Anteilen im Endprodukt konnte ein
deutlicher Einfluss der Art von Protein und Zucker festgestellt werden. Während die
Verwendung von Glucose und Molkenprotein die Bildung der untersuchten Pyrazine
begünstigte, zeigten Furanmethanol und Maltol höchste Konzentration in Proben wel-
che unter Zugabe von Milchprotein hergestellt wurden.
Gegensätzliche Effekte wurden für die Bildung von 2,4-Decadienal festgestellt, einer
während der Autoxidation von Fettsäuren gebildete Verbindung mit negativer Aroma-
charakteristik. Es konnte gezeigt werden, dass die Bildung stark durch steigende Zu-
ckerkonzentrationen begünstigt wird, während steigende Proteingehalte zu Abnahme
führen.
Die Bildung der untersuchten Säuren (Butansäure, Pentansäure und Hexansäure) war
sowohl abhängig von der Konzentration als auch von der Art des Zuckers beziehungs-
weise Proteins. Die Zugabe von 4 % Glucosesirup führte hierbei zu maximalen Kon-
zentrationen aller untersuchten Säuren, während dieser Effekt bei Verwendung von 4 %
Glucose nur für Butansäure beobachtet werden konnte. Die Verwendung von Molken-
protein führte zu sinkenden Konzentrationen aller Säuren, wohingegen die Verwendung
von Milchprotein zu Anstiegen führte.
Die verschiedenen Aminosäuren zeigten grundsätzliche Ähnlichkeiten in der Art und
Weise wie sie die Bildung der untersuchten Aromastoffen beeinflussten. Diese war wei-
testgehend mit dem der Proteine vergleichbar. Untereinander zeigten sich hingegen Un-
terschiede in der Intensität der Einflüsse. Während durch die Verwendung von Valin
und Prolin die Bildung von 2,4-Decadienal am effektivsten gehemmt werden konnte,
zeigte Leucin den positivsten Einfluss auf die Pyrazinbildung. Ein deutlicher Vorteil
einer der verwendeten Aminosäuren gegenüber anderen Aminosäuren oder der Ver-
wendung von Protein konnte jedoch nicht gezeigt werden.
Die durchgeführten Farbmessungen zeigten einen signifikanten Einfluss aller Prozess-
parameter auf die Helligkeit der Extrudate. Für die Temperatur im Untersuchungsbe-
reich von 140°C bis 180°C Gehäusetemperature konnte hierbei ein quadratischer Ein-
fluss festgestellt werden. Abhängig von der verwendeten Protein-Zucker-Kombination
zeigte sich eine maximale Farbintensität bei unterschiedlichen Temperaturen. Die Ver-
wendung von Molkenproteinen führte hierbei erst bei höheren Temperaturen zu einer
maximalen Bräunung im Vergleich zu Milchprotein. Sowohl Protein als auch Zucker
beeinflussten die Farbbildung, wobei ein stärkerer Einfluss des Zuckers festgestellt
wurde. Im Gegensatz zu den untersuchten Proteinen zeigte sich zusätzlich eine deutli-
che Abhängigkeit der Intensität der Farbstoffbildung von der Art des verwendeten Zu-

Zusammenfassung 19
ckers. Die Verwendung von Glucose führte hierbei zu stärkeren Bräunungsreaktionen
im Vergleich zu Glucose Sirup. Ein Zusammenhanges zwischen der Produkthelligkeit
und der Bildung spezifischer Aromastoffe konnte nicht festgestellt werden.
Durch die vorliegende Studie konnte demonstriert werden, dass sich mit Hilfe der unter-
suchten Parameter Temperatur, Protein und Zucker die Bildung von Aroma- und Farb-
stoffen modulieren lässt. Des Weiteren konnte gezeigt werden, dass sich sowohl die
Aromabildung als auch die Farbgebung verschiedenartig durch die Art des gewählten
Zusatzes (Zucker, Protein, Aminosäure) beeinflussen lassen.

Introduction and Objectives 20
1 Introduction and Objectives
1.1 Introduction
Extrusion cooking is a modern process, which has become widely used in the manufac-
ture of breakfast cereals and snack food. Compared with traditional processes, like bak-
ing, extrusion cooking combines multiple process operations such as mixing, cooking,
and texturing in a single process unit. This results in very short processing times, small
production spaces, and low energy consumption for the production of specific end
products, like breakfast cereals.
The major shortcoming experienced with extrusion cooked cereal flours is the lack of
flavor generation in the end products. This is due to the short cooking time and low
temperature which the processed raw material encounters during extrusion. This limits
the extent of chemical reactions of the raw material components which are responsible
for flavor compound formation. In addition, flavor compounds are lost to the atmos-
phere as the product exits the extruder. This loss of flavor is a major concern as espe-
cially the volatile aroma components are regarded as the most important parameters of
food flavor quality.
The formation of flavor compounds in conventionally processed as well as in extruded
cereals is attributed to a series of reactions, with the Maillard reaction and degradation
of lipids being the most prominent. However, the most important flavor compounds,
providing typical cereal, roasted, toasted and caramel-like flavor impressions are gener-
ated during the Maillard reaction. For this, it requires the presence of reducing sugars
and free amino groups to form such important flavor compounds as pyrazines, alde-
hydes, or pyrroles. These reactions are favored by elevated temperature and intermedi-
ate moisture, typical for extrusion cooking [1].
Over the past years, many studies on extrusion cooking were carried out which aimed at
the examination of the influence of different cereal formulations on extrusion behavior,
extrudate properties, and nutritional and physical attributes of cereal products [2]. How-
ever, no specific studies have been carried out as yet on the formation of flavor com-
pounds during extrusion cooking in the presence of added protein and sugar as potential
reactants for flavor generation.
Several studies have been addressed to how to influence Maillard reaction driven flavor
formation by the addition of potential flavor precursors such as reducing sugar and
amino sources or by changing process parameters. Many were carried out on liquid
model systems, examining the influences of temperature, pH, selected sugars, and single

Introduction and Objectives 21
amino acids on the formation of flavor compounds such as pyrazines, derived from the
Maillard reaction [3, 4, 5, 6].
With regard to extrusion processing, most studies focused on the influence of process
parameters such as temperature and moisture on flavor formation or on changes in col-
or, shape, texture, mouth-coating characteristics, and acceptability [7, 8].
The effect of single amino acids and selected reducing sugars on flavor compound for-
mation and aroma characteristics have been intensively studied as well. Thereby it was
found that each of them have significant influences on flavor formation. Briefly, amino
acids as well as reducing sugars favor the formation of desired components mainly af-
fected by the type of the used amino acid and the chemical structure of the sugar.
However, less is reported about the use of complex proteins as potential precursors of
flavor generation. This is surprising since proteins are always present in the raw mate-
rial used for this type of products and have also become important recipe ingredients in
extruded food as a consequence of their availability at reasonable cost and their func-
tional and nutritional values. Furthermore, they represent an excellent source of amino
groups, necessary for the Maillard reaction [9]. Solina et al. examined the influence of
soy protein and vegetable protein on the volatile components of extruded wheat starch
[10]. To date, nothing has been reported about the interactive influences of complex
proteins and different types of sugar on flavor development in dependence on extrusion
temperature.
1.2 Objectives
The main aim of the dissertation was to use a recipe model system consisting of wheat
starch, milk proteins, reducing sugars, and single amino acids for the examination of the
influence of the recipe components and the extrusion temperature on the development
of selected flavor compounds in the extruded end product.
In this study, dried milk powder from defatted milk as a source of complex milk protein
and whey protein isolate were chosen to examine differences in their ability to influence
the generation of flavor compounds. Both represent excellent amino group sources and
are widely used as ingredients in the food industry. As for the sugar, the effect of glu-
cose syrup was compared to that of glucose, as a pure reducing sugar.
These substances were added to wheat starch in different combinations and concentra-
tions and subsequently extruded at different temperatures. To reduce the experimental
complexity, 33 factorial designs were used, leaving the barrel temperature and the con-
centration of the used proteins and sugars as changeable parameters. Several statistical
means were used to elucidate the interactions.

Introduction and Objectives 22
Regarding the flavor formation, eight selected important flavor compounds representing
different chemical classes were analyzed. The aim was to get a general overview on
how the changed process parameters influence the final product parameters, i.e. the fla-
vor formation. In terms of a precious evaluation, two different techniques in sample
preparation were examined. Therefore, the widely used headspace analysis was com-
pared to a complex extraction-distillation method regarding their differences in detect-
ing flavor compounds. Beside a qualitative analysis of the generated aroma compounds,
their quantification was of high interest. Quantification by stable isotope dilution analy-
sis was carried out on selected compounds to carve out its advantages in obtaining accu-
rate results compared to those obtained by using common internal standards. The aim
was to look for a possible application in conventional product control processes.
During extrusion cooking, four single amino acids were added in different amounts to a
mixture of wheat starch and 4% glucose to evaluate their influence on flavor formation.
Additionally, color formation during extrusion processing, its measuring, and the ex-
amination of its possible applicability to the process control regarding flavor formation
was the aim of this study. Since it is known that flavor formation during the Maillard
reaction comes along with non-enzymatic browning, the effect of used sugars and pro-
teins on resulting product lightness was analyzed and evaluated. The goal was to look
for coherences between color formation and the formation of single flavor compounds.

State of the Art 23
2 State of the Art
2.1 Extrusion Cooking
Food extrusion has been practiced for over 60 years. While the first extruders were used
as mixing and forming units for the production of pasta and ready to eat (RTE) cereal
pellets, the first single-screw cooking extruders were developed in the 1940’s to create
puffed snacks from cereal flours. Modern extruders are considered to be high-
temperature short-time (HTST) bioreactors which transform a wide variety of ingredi-
ents in intermediate and finished products. Several characteristics make modern extrud-
ers interesting for food processing (Table 1) [11].
Table 1: Characteristics of modern extrusion cooking
- Continuous high-throughput processing
- Energy efficiency
- Processing of relatively dry viscous materials
- Improved textural and flavor characteristics of food
- Use of unconventional ingredients
Source: Harper, J.M. (1981) [11]
Today, many food or feed products are produced by extrusion cooking technology.
Breakfast cereals, snacks, pregelatinized flour and starch, pet food and animal feedstuff
are some examples [12, 13].
Expanded extrusion products have gained their market mainly because of their pleasing
crispy texture. To create such a puffed product, the starch and water containing ingredi-
ents are heated up inside the extruder by external heating of the barrel and by the me-
chanical energy, required to turn the screw, which is partly converted into heat. The heat
raises the temperature of the mixture up to 180°C or more if necessary. The pressure
drop at the die exit causes puffing to occur when the high-temperature water, entrapped
in the gelatinized product rapidly evaporates [11, 14, 15, 16].
Regarding flavor formation, according to Harper et al. [11], extrusion tends to be limit-
ing because of its short-time treatment and the loss of volatiles which are being flashed
off at the die. However, flavor formation during extrusion cooking is complex and de-
pends on several parameters. The use of extrusion cooking with regard on flavor forma-
tion has been shown by Meuser et al. [17] who integrated HTST extrusion cooking into

State of the Art 24
the malting process during beer production. The obtained extrudates were characterized
by high yields of flavor compounds identically to those generated by conventional
malting. It was found that the flavor compounds as well as the intense browning are
mostly generated during Maillard reaction, positively influenced by increasing tempera-
ture and SME [18, 19, 20].
A closer look on flavor formation during extrusion cooking is given in chapter 2.3.1.
2.2 Expanded Ready to Eat Cereals
Ready to eat cereals (RTE) are either produced by gun puffing or extrusion cooking.
These processes are used to convert raw, dense grain or milled fractions of these into
friable, crisp, or chewable products, suitable as human food.
2.2.1 Puffed Cereals
One major group of puffed cereals are gun-puffed whole grain cereals. According to
Fast et al. [21], whole rice or wheat kernels are predominantly processed this way. Two
things are necessary for the grain to puff. It must be cooked, and a large, sudden pres-
sure drop must occur in the atmosphere surrounding the grain which forces the liquid to
convert into steam instantly. Today, the puffing process mostly takes place in so called
single- or multiple-shot guns which are operated automatically and partly continuously.
The gun(s) is (are) loaded with grain and steam is injected into the gun body at 14 bar
(200 psi). By doing so, the necessary time to transfer the heat into the grain to cook and
condition it for puffing could be reduced to as low as 90 sec compared to 9-12 min with
traditional batch puffing single-shot gun.
The starchy matter of other cereal grains, such as oats or corn can be puffed as well. For
this, milled products of these cereals are used. The cooking process, necessary to gelati-
nize the starch doesn’t take place in the shot gun but in an extruder. That is why this
group is called extruded gun puffed cereals. The basic dry materials like flour and grits
and a solution made of water and, depending on the final product, sugar, salt, malt, col-
ors and flavors is fed into a cooking extruder in where it is gelatinized. After the cooked
dough exits the extruder, it is fed to a forming extruder which is usually controlled at
noncooking temperatures below 70°C. After drying and tempering to a moisture content
of 9-12% the shaped pieces are then gun puffed as described above.
Another group of puffed cereals are the oven puffed. These are almost exclusively made
from rice or corn since they puff easily in the presence of elevated heat and correct
moisture content, whereas wheat and oats do not. After several steps of preconditioning
like cooking, drying and bumping (slightly flattening of the kernels by running through

State of the Art 25
flaking rolls) the grain is puffed in special rotary flake-toasting ovens or other fluid-bed
oven, characterized by extremely high temperatures (288-343°C).
The process of oven puffing as well as gun puffing is followed by cooling and screen-
ing. If necessary the final products can be fortified with vitamins and flavors or treated
with antioxidants to preserve freshness [21].
2.2.2 Extruded Expanded Cereals
Direct puffed snacks and cereals made by extrusion process are classified as a second
generation snack. As well as conventional puffed products they are usually low in bulk
density and are often marketed as high-fiber, low-calorie, high-protein and nutritional
products [22, 23].
In contrast to conventional puffed cereals, the whole process of cooking and expanding
happens in a single unit, the extruder. This technology operates on a continuous basis, is
applicable for all kinds of grain and uses flour or meal rather than whole or broken ker-
nels. Once the formulation has received its cooking, it is pressed through the holes of
die at the end of the extruder which controls the shape of the product. By leaving the
zone of elevated temperature and pressure inside the extruder, the product expands
when moisture converts into steam. The cutting of the expanded or expanding product is
usually done by a knife rotating on the outer face of the die.
As well as the conventional processes, the production of extruded expanded products is
followed by drying, cooling and fortification steps. Especially flavoring, coloring and
sugar coating allow the creation of products for various tastes.
The advantages of this process over conventional techniques are both economic and
practical in terms of a reduction in space, time and energy [14, 21].
2.3 Flavor
Flavor in principle is the overall sensation, provided by the interaction of taste, odor and
textural feeling, when food is consumed. Flavor results from compounds that are di-
vided in two broad classes. Those responsible for taste are generally nonvolatile at room
temperature. Therefore, they interact only with taste receptors located in the taste buds
of the tongue. Compounds responsible for the odor are often designated as aroma sub-
stances. They are volatile and are perceived by the odor receptor sites of the smell or-
gan, i.e. the olfactory tissue of the nasal cavity [24].
Flavor particularly influences acceptance by consumers, and volatile aroma components
generally are regarded as the most important parameters of food flavor quality.

State of the Art 26
Specific flavor compounds can be grouped rather simply as being derived from envi-
ronmental, metabolic, microbial, chemical, or thermal sources. Since flavor develop-
ment in extruded cereals is the basis of this thesis, the main factor contributing to flavor
formation is temperature, and thus thermally produced flavor compounds are of major
concern.
2.3.1 Flavor in Extruded Expanded Cereals
The number of flavor compounds, present in various food flavor systems totals into the
hundreds and thousands. However, the presence of a specific flavor associated com-
pound does not mean that it makes a significant contribution to the characteristic flavor
of a specific food.
Even if progress in instrumental analysis, particularly high resolution gas chromatogra-
phy and mass spectrometry, has shown that the volatile fraction of heated cereals con-
sists of a multiplicity of compounds only a few are important [23, 25, 26].
Grosch and Schieberle [27] pointed out that only a small number of volatiles are of sig-
nificance in determining the flavor of heated cereals which are characterized by a
roasted, toasted, and nutty flavor impression
Most extruded cereals are primarily composed of carbohydrates such as starch and sug-
ars, protein, lipids, and moisture. These ingredients serve as major precursors of the
thermally produced flavor compounds.
During extrusion the most significant reactions in heat induced flavor compound forma-
tion are nonenzymatic browning reactions typified by caramelization and Maillard reac-
tion. Those are the same reactions as they appear during traditional processes such as
baking or frying. As the name implies, this reactions usually produce product browning.
From a flavor point of view nonenzymatic browning is a highly desirable reaction oc-
curring during extrusion since important compounds are produced. However, the rate of
chemical reaction or rather flavor generation is much lower due to a shorter residence
time compared to baking and a much lower temperature compared to frying.
The wide use of extruder in the production of foodstuff has led to a number of reviews
detailing the effects that extrusion has on odor generation and odor retention in extruded
products. Some recent studies in this field have led to a better understanding of the in-
fluence of different extruder conditions on flavor development. Bredie et al. [26] and
Parker et al. [14] demonstrated the influence of high barrel temperatures and low mois-
ture contents on an increasing yield of Maillard reaction products, so important in the
development of baked and roasted odors, using maize, wheat, and oat flours.
Bredie et al. [28], Ames et al. [29], Jusino et al. [30], and others independently exam-
ined the influence of the pH and found that levels of pyrazines and other flavor com-

State of the Art 27
pounds, beside furans, generally increase with pH which is in contrast to a study by
Bonvehi et al. [31] who stated that higher pH values let to lower concentration of aroma
but higher presence of brown color.
No studies could be found detailing the effect of screw speed variations on flavor for-
mation. Hsieh et al. studied the effects of screw speed on processing and product vari-
ables such as die pressure, SME, and expansion index but it remains unclear if the ex-
amined changes may have an influence on the formation of aroma compounds [12]. The
general influence of process and system parameter on chemical reactions during extru-
sion cooking has been studied by Gimmler, focusing not on flavor compound formation
but on the derivatization of starch during extrusion cooking [32]. He found higher rates
of chemical reactions at longer residence times and elevated SME inputs. Similar ex-
aminations were made by Jusino et al. [30] and Huang et al. [33]. They investigated the
formation of pyrazines in solid model systems and found it favored at high temperature
and long residence time.
The gained information is of high interest but partially conferrable on the present study
only. This is due to the fact that the solid model studies mentioned, investigated the py-
razine formation over a longer period of time and lower temperatures as it is possible
during extrusion cooking. On the other hand, Gimmler used the process of extrusion
cooking but analyzed its influence on a chemical reaction that would happen even under
non processing conditions. All of these studies showed that chemical reactions are in-
fluenced not only by the energy input, but by time as well.
Beside the variation of process and system parameters, different studies examined the
effect of specific precursors on flavor formation. The influence of single amino acids
and selected reducing sugars on flavor compound formation and aroma characteristics
have been studied most intensively. Thereby it was found that both have significant
influences on flavor formation. Especially amino acids favored the formation of desired
components whereas the latter strongly depended on the type of the used amino acid.
[20, 29, 44, 46, 49, 61, 62, 104]
However, less is reported about the use of complex proteins as potential flavor precur-
sor. Proteins have become important ingredients in extruded food as a consequence of
their availability at reasonable cost and demonstrated functional and nutritional values.
Their influence on nutritional, physiological and physical properties of extruded cereal
products have been studied by Köhler [34]. Furthermore, proteins represent an excellent
source of amino groups, necessary within the Maillard reaction [35]. Solina et al. exam-
ined the influence of soy protein and vegetable protein on the volatile components of
extruded wheat starch [25, 36]. But still, nothing has been reported yet about the inter-
active influences of complex proteins and different types of sugar at varying extrusion
temperatures on flavor development.

State of the Art 28
Summarizing it can be said that by extrusion cooking important flavor compounds can
be generated by Maillard reactions. This flavor generation is limited because of the
short residence time of the mass in the extruder barrel. The benefit of specific Maillard
reaction precursors was primarily investigated by using single amino acids and selected
sugars. Cognitions about the influence of complex proteins and their interactions with
sugars at different temperatures are still missing.
2.3.2 Flavor Development by Nonenzymatic Browning Reactions
There are three basic nonenzymatic browning reactions that cause flavor in heated food
systems. Because of the high temperature, the short processing time and the presence of
reducing sugars and amino groups, the so called Maillard reaction is the most important
in the production of extruded expanded cereals. Therefore it will be described more pre-
ciously while there will be just a short overlook on the other two.
2.3.2.1 Pyrolysis
Pyrolysis is simply scorching, from the Greek “pyro”-burning, and involves the total
loss of water from the sugar molecule and the braking of carbon-carbon linkages, i.e.
the “destruction” of the sugar molecule. It requires higher temperatures as given in
processing cereals and results in burnt and inedible flavors as well as in chemical com-
pounds that showed a highly mutagenic effect in microbial tests [24].
2.3.2.2 Caramelization
Beside Maillard reaction and enzymatic browning, the caramelization represents the
most important type of browning process appearing during heating and roasting of car-
bohydrate-rich food. It is a transformation of reducing sugars alone in a concentrated
solution through so called anhydro sugars. In this reaction sugars of a low degree of
polymerization lose water molecules from their structure through 1:2 and
2:3-enolisation followed by polymerization steps.
The whole process of caramelization requires high temperatures and can be directed
more toward aroma formation or more toward brown pigment accumulation. Heating
glucose syrup with sulfuric acid in the presence of ammonia as a source of nitrogen
provides intensively colored polymers. On the other hand, heating the syrup in a buff-
ered solution enhances molecular fragmentation and thereby formation of aroma sub-
stances [24].
In general, the temperature required for caramelization depends on the type of sugar.
Initial caramelization temperatures of common sugars are shown in Table 2.
Brands et al. [37] compared a fructose-casein and glucose-casein model system. They
verified that browning depends strongly on the temperature and found that after an in-
duction time during which no browning is detected, fructose browns more quickly than

State of the Art 29
glucose. Due to differences in reaction behavior between glucose and fructose it re-
mained unclear if browning is attributed to different caramelization temperatures or to
differences in reactivity within the occurring Maillard reaction.
However, it is undoubted that caramelization takes place during extrusion processing,
contributing to color and flavor [24, 38].
Table 2: Initial caramelization temperatures of common sugars
Sugar Temperature
Fructose 110°C
Galactose 160°C
Glucose 160°C
Maltose 180°C
Saccharose 160°C
Source: Food-Info.net (2008) [38]
2.3.2.3 Maillard Reaction
The Maillard reaction is named after the chemist Louis-Camille Maillard .
It represents a chemical reaction caused by the condensation of a nucleophilic amino
group e.g. of an amino acid and the carbonyl group of a reducing sugar.
The Maillard reaction is of utmost importance for quality of foods, more in particular
for heated foods. It induces browning of foods, has an effect on nutritive value, can
have toxicological implications (such as the formation of acrylamide, see chapter 2.3.5),
can produce antioxidative components (reductones) and it has, most important, a large
effect on flavor. For instance, the Maillard reaction is responsible for the desired aroma
formation accompanying such important processes like cooking, baking, roasting or
frying. It is equally significant for the generation of off-flavors in food during storage or
on heat treatment for the purpose of pasteurization, sterilization and roasting. It can also
produce partially desired bitter substances (coffee).
Beside the development of important volatile aroma substances, the Maillard reaction is
well known for generating brown pigments, known as melanoidins which contain vari-
able amounts of nitrogen. They are desired in baking and roasting, but not in food which
have a typical weak or other color of their own (condensed milk, tomato soup).
In the process, hundreds of different flavor compounds are created. These compounds in
turn break down to form yet more new flavor compounds, causing a chain reaction. A

State of the Art 30
short overlook on the Maillard reaction regarding generated flavor compounds might be
given by Figure 1 [39, 40].
Each type of food has a distinctive set of flavor compounds that are formed during the
Maillard reaction. Selected flavor compounds, important for generating cereal like fla-
vor impressions, are elucidated more detailed in chapter 2.3.4.
Sugar + Amino Group
N-glycosylamine/N-fructosylamine
Amadori/Heyns Rearrangement
Amadori Rearrangement Product/Heyns Rearrangement Product
Amino Group
Deoxyosones
Reductones + Dehydroreductones
Sugar Fragmentation
Retro-aldolization
Furfural
(pentoses)
Hydroxymethylfurfural
(hexoses)
NH₃ H₂S
Furanones
Pyranones
Pyrroles
Thiophenes
Hydroxyacetone
Cyclotene
Dihydroxyacetone
Hydroxyacetyl
Glyoxal
Pyruvaldehyde
Glycolaldehyde
Glyceraldehyde Aldehydes + aminoketones
Acetoin
Pyridines
Pyrazines
Oxazoles
Thiazoles
Pyrroles
Imidazoles
heterocyclization
Amino Acid
Strecker Reaction
Figure 1: General overview of the Maillard reaction showing flavor compounds as end
products.
Source: Ikan, R. (1996) [41]
2.3.2.3.1 Chemical Outline of the Maillard Reaction
Most of the literature is subdividing the Maillard reaction in three basic phases. An out-
line of the Maillard reaction, adapted from the Acta Tabacaria Sinica (2004)[42],
matching the following explanations is given in Figure 2.
The initial stage starts with the condensation of the carbonyl group of a reducing sugar
with a free amino group of a protein or an amino acid, which loses a molecule of water
to form N-substituted glycosamine. (Step A). This is unstable and undergoes, in the case
of an aldose sugar, the Amadori rearrangement to form an Amadori product or in the
case of a ketose sugar, the Heyns rearrangement to form a Heyns product (Step B).

State of the Art 31
These products can then react further in three ways in the second phase.
One is the simply further dehydration by the loss of two water molecules into reduc-
tones and dehydro reductones (Step C). These are essentially “caramel” products and in
their reduced state powerful antioxidants.
A second is the production of short chain hydrolytic fission products such as diacetyl,
acetol, pyruvaldehyde, etc. (Step D). These than undergo “Strecker degradation” with
amino acids to aldehydes (Step E) and by condensation to aldols, or they may react in
the absence of amino compounds, to give aldols and high molecular weight, nitrogen-
free polymers (Step F).
A third path is the Schiff’s base-furfural path. This involves the loss of three water mo-
lecules (Step C), then the reaction with amino acids and water.
All these products react further in the final Maillard reaction with amino acids to form
brown nitrogenous polymers and copolymers called melanoidins (Step G). These can be
off flavors (bitter), off aromas (burnt, onion, solvent, rancid, sweaty, cabbage) or posi-
tive aromas (malty, bread crust-like, caramel, coffee, roasted).
Step H illustrates a direct route to fission products from N-substituted glycosylamines,
without the formation of an Amadori rearrangement product.
Aldose N-substituted glycosamineAmino compound A H₂O
Amadori rearrangement products
(1-amino-1-deoxy-2-ketose)
Amadori
rearrangement
Schiff‘s base of
hydroxymethylfurfural
or 2-furaldehyde
Sugar Fission products (acetol, diacetyl, pyruvaldehyde, etc.)
Reductones Dehydroreductones Aldehydes
Hydroxymethylfurfural or
2-furaldehyde
Aldols and nitrogen free
polymers
Melanoidins
(brown nitrogenous polymers and copolymers
B
C DC H
E
E
F F F
F
G G G G G
- amino
compound
+ H₂O
+ amino
compound
+ amino
compound
+ amino
compound
+ amino
compound
+ amino
compound
- H2
+ H2
- 3 H₂O - 2 H₂O
Strecker
degradation
+ amino acid
- CO₂
Figure 2: Outline of the chemical reactions occurring during the Maillard reaction.
Source: Acta Tabacaria Sinica, China Tobacco Society, Bejing/China, 2004

State of the Art 32
2.3.3 Flavor Precursors
Since the Maillard reaction is the most important chemical reaction producing flavor
compounds during extrusion processing, the addition of reactive flavor precursors such
as reducing sugars, proteins and single amino acids can help to increase the amount of
flavor volatiles or to change the aroma profile. It is very important to know about the
influence of different proteins and sugars since they determine the type of flavor com-
ponents formed during extrusion cooking while process parameters such as temperature,
pH, time and water contents influence the kinetics [43].
Several studies are published, examining the influence of different sugars, proteins, and
amino acids alone or in combination with flavor development. Solina et al. [25] ex-
truded wheat starch/glucose mixtures with and without acid-hydrolysed vegetable pro-
tein at 180°C and analyzed differences in flavor formation. They found aroma potent
lipid oxidation products to appear in every sample but showed that Strecker aldehydes,
important flavor components, as well as flavor precursors, are dominant components in
samples containing added protein. It is even more important that pyrazines, responsible
for desired roasted flavor impressions, appeared exclusively in samples containing both,
glucose and protein. These results are confirmed by Bredie et al. [46] who extruded
wheat flour and wheat starch adding the single amino acid cystein and the reducing sug-
ars glucose and xylose. In this study it is shown that cysteine and sugar are important
precursors for nutty/roasted, and popcorn aromas when extruding wheat flour and wheat
starch. The natural occurring contents of fat and protein in wheat flour were also found
of importance, as the formation of more desirable aromas was favored by these in ex-
truded wheat flour compared to wheat starch.
2.3.3.1 Sugar
From the biochemical point of view there are two main groups of sugars, the reducing
and the non-reducing sugars. Only a reducing sugar can act as a catalyst in the Maillard
reaction since it. A reducing sugar is any sugar that, in basic solution, forms some alde-
hyde (aldose sugars) or ketone (ketose sugars). The reactive carbonyl group, terminal in
aldose and linked to two other carbon atoms in ketose (Figure 3), allows the sugar to
act as a reducing agent, important in the Maillard reaction. While no differences are
reported between ketoses and aldoses regarding their influence on the Maillard reaction,
it is well known that pentoses participate in the Maillard reaction at a greater rate than
hexoses because of its shorter chain length [44, 45].

State of the Art 33
H
CH2OH
OOH
OH
OH
H
H
H
H
OH
HOCH2
CH2OH
O
H
OH
OH
OH
HH
Aldose
(Glucose)
Ketose
(Fructose)
Carbonyl Group
Figure 3: Carbonyl group location in ketoses and aldoses.
Well known reducing sugars are the pentoses xylose and ribose and the hexoses glucose
and fructose as well as lactose and maltose, both disaccharides consisting of two hex-
oses.
Common table sugar, known as sucrose or saccharose is a disaccharide as well. It con-
sists of one molecule glucose and one molecule fructose, joined by a glycosidic bond
between carbon atom 1 of the glucose and carbon atom 2 of the fructose unit (Figure 4).
Unlike most polysaccharides, the glycosidic bond is formed between the reducing ends
of both glucose and fructose. Hence it contains no free atomeric carbon atom and is
therefore classified as a non-reducing sugar, ineligible to enhance Maillard reaction
processes.
Figure 4: Saccharose molecule consisting of α-D-Glucose and β-D-Fructose.
Beside the advantage of being a cheap and therefore widely used sugar in the food in-
dustry, it is reported that glucose supports the creation of targeted cereal flavor impres-
sions. In a sensory study, Ames et al. [44] established that extrudates made of wheat
starch and cysteine in combination with glucose were more frequently described as
“biscuit” and “nutty” whereas the use of xylose resulted in “meaty” flavor impressions.
On the other hand Bredie et al. [46] stated that the nature of the added sugar (glucose vs.
xylose) has only a small effect on sensory characteristics or rather on aroma generation.
That underlines the difficulties in evaluating different sugars regarding their influence
on the overall flavor of a final product even if it is undoubted that hexose sugars are

State of the Art 34
responsible for other flavor compounds than pentose sugars. For example, furfural is
generated from pentose sugars whereas hydroxymethylfurfural is formed from hexose,
both important intermediates in the Maillard reaction [24].
However, the relevance of sugar in flavor formation during the thermal treatment of
food is undoubted and independently confirmed by numerous studies [20, 25, 26, 46,
62, 63].
2.3.3.2 Protein and Single Amino Acids
Beside a reducing sugar, free amino groups are necessary for creating flavor compounds
via Maillard reaction. Free amino groups are naturally found in amino acids. An amino
acid is a molecule that contains both amine and carboxyl functional groups (Figure 5).
In biochemistry, this term refers to alpha-amino acids with the general formula
H₂NCHRCOOH, where the R is a hydrogenorganic substituent. In the alpha amino ac-
ids, the amino and the carboxylate groups are attached to the same carbon, which is
called the α-carbon. There are 20 proteinogenic alpha amino acids. They differ in their
side chain (R), attached to the alpha carbon, and are the building blocks of all proteins.
[47]
C
NH2
COOH
R
H
Amino Group
Carboxyl Group
R-Group
Amino Acid
Ala Phe Try Leu
Protein
NH
HR
H
O
O
H
NH
HR
H
O
O
H
NH
HR
H
O
N
R
H
O
O
HH
OH
H+
AA 1 AA 2
Figure 5: Amino acid and its functional groups as a part in the primary structure of a
complex protein.
The effect of different amino acids on the formation of Maillard types of flavor com-
pounds has been widely studied. However, most of the research on the formation of
Maillard-based flavor compounds is on mixtures of sugar and single free amino acids,
and hardly on sugar protein mixtures. Some examples are given by van Boekel [39] who

State of the Art 35
states that meat related flavor compounds are mainly sulfur containing compounds, de-
rived from cysteine, while the amino acid proline gives rise to typical bread, rice and
popcorn flavors. Pyrazines possess typical and desired cereal, roasted, and toasted fla-
vors and are therefore meaningful flavor compounds in this study. Ames et al. [44] pic-
tured the effect of amino acid on the generation of pyrazines in extruded starch model
systems and figured out that the pyrazine level increases in the presence of all amino
acids but cysteine, which enhanced the formation of sulfur compounds. Nevertheless
cysteine and its flavor precursor qualities is investigated intensively because cysteine
contains a nitrogen and a sulfur atom, necessary in heterocyclic flavor chemicals such
as furans, pyrazines and thiazoles [48, 49, 50, 51, 52, 53, 54, 55, 56, 57].
With proteins, but in the absence of free amino acids, the Strecker reaction cannot take
place, and this has consequences on flavor generation. Free amino acids may be gener-
ated during heating from proteins if hydrolysis occurs, but this will be limited during
normal heat treatment of foods. At this, cooking extrusion could make an exception
because of its high temperature treatment in combination with a subsequent dry-
ing/roasting process. Bailey et al. [45] added whey protein concentrate to corn meal at
concentrations ranging from 0% to 20% and measured the flavor and color of the extru-
date. They found that the production of pyrazines, furans, and other heterocyclics in-
creased as the product temperature and concentration of whey protein, an excellent
source of lysine and sulfur containing amino acids, was increased. Recently, Wright et
al. [58] and van Boekel [63] confirmed that whey protein acts as a flavor precursor but
found, that the high amounts of sulfur containing amino acids may cause off-flavors.
What remains in food systems without free amino acids is that sugar degradation prod-
ucts can react with the ε-amino groups of lysine residues, but also with other amino acid
side chains, such as arginine and tryptophan. It is known that Maillard reaction is re-
sponsible for undesired flavor compounds in milk products, which hardly contain free
amino acids. That proofs that the Maillard reaction can take place mainly via the lysine
side chains, the major amino acid in milk.
2.3.4 Selected Flavor Compounds
2.3.4.1 Pyrazines
Pyrazines are heterocyclic, aromatic, organic compounds. The simplest representative is
the pyrazine itself which is shown in Figure 6. Many different ones are known, at least
70 alkylpyrazines, consisting of only carbon, hydrogen, and nitrogen. Most often, pyra-
zines possess roasted, nutty, popcorn-like or green odors, low odor threshold values,
and are responsible for typical food flavors. One often states their formation by the
Strecker synthesis, part of the Maillard reaction [59, 60, 61].

State of the Art 36
N
N
Figure 6: Pyrazine
Many studies were carried out, trying to examine the formation of pyrazines and their
importance for the over-all flavor of starch containing food systems. Many of the pyra-
zines have been reported among the volatile products of heated, reduced-moisture sys-
tems or of extruded food systems. In a range of aqueous food systems, pyrazines have
been reported as relatively minor reaction products whereas they were major compo-
nents in reduced-moisture food systems such in extrusion. The influence of additional
reducing sugar and amino acids is examined by Farouk et al. [62], who extruded wheat
flour with glucose and different single amino acids. He showed that levels of pyrazines
increased in all systems except the one containing cystein. This is undoubtedly ac-
counted for in part by alternative pathways open to glucose degradation products in the
cystein containing systems, due to the availability of highly reactive sulfur reactants
deriving from cystein.
High temperature is very important in generating pyrazines, especially in conventional
food systems without additional free amino acids. Proteins and peptides, natural com-
ponents in food, consist of bounded amino acids, not available for the Strecker reaction
as an essential part for the generation of heterocyclics such as pyrazines (as shown in
Figure 1). As mentioned in 2.3.3.2, free amino acids may be generated during heating
from proteins or peptides if hydrolysis occurs [63, 64].
2.3.4.2 Furanones / Pyranones
Furanones and pyranones are cyclic chemical compounds, containing an unsaturated
fivemembered (furanones) or sixmembered (pyranones) ring with one oxygen atom and
a ketone functional group (Figure 7).
Among the great number of products obtained from carbohydrate degradation, the fu-
ranones 3(2H)- and 2(5H)-furanone belong to the most striking aroma compounds. As
well as maltol, the best know representative of the pyranones, they possess a caramel-
like odor.
Additionally, maltol enhances the sweet taste of food, especially sweetness produced by
sugars, and is able to mask bitterness.

State of the Art 37
Furanones and pyranones are found as secondary products of the Maillard reaction but
Grosch et al. [24] and Baltes [47] describe other formation pathways such as aldol con-
densation, too. Furthermore they address difficulties in quantitative analysis of fu-
ranones due to their good solubility in water what makes them extractable from aqueous
food only with poor yields.
OO
O
OHO
O O
OH
O
O
O
O
O
O
OH
Furanones Pyranones
Basic Structure
Potent Flavor
Representatives
2-Pyrone 4-Pyrone
Maltol3-hydroxy-2-methyl-4H-pyran-4-one
3(2H)-Furanone4-hydroxy-5-methyl-furanone
2(5H)-Furanone3-hydroxy-4,5-dimethylfuranone
Figure 7: Basic structures and potent flavor representatives of furanones and pyra-
nones.
2.3.4.3 Pyrroles / Pyridines
Pyrroles and pyridines are heterocyclic, aromatic, organic compounds. While pyrroles
consist of a five-membered ring, pyridines contain a six-membered ring. Numerous
pyrrole and pyridine derivates are found among the volatile compounds formed by
heating of food. The structural feature shown in Figure 8 is of special interest and
appears to be required for roasted or cracker-like odor. The most potent representatives
with a desired roasted aroma are 2-acetyl-1-pyrroline (white-bread crust, rice, popcorn,
heated meat), 2-propionyl-1-pyrroline (popcorn, heated meat),
2-acetyltetrahydropyridine (white-bread crust, popcorn), and 2-acetylpyridine (white-
bread crust). Independent studies announced 2-acetyl-1-pyrroline to be the outstanding
flavor compound and a significant contributor to the aroma of several cereal products
[27, 56, 65, 66, 67].
Grosch et al. [24] and Schieberle [68] showed in model experiments that 1-pyrroline,
formed by the Strecker degradation of both proline and ornithine in the Maillard

State of the Art 38
reaction, act as the precursor of 2-acetyl-1-pyrroline as well as of 2-
acetyltetrahydropyridine. Suyama et al. [69] presumes that the generation of pyridines
may involve the condensation of aldehydes, ketones, or α,β-unsaturated carbonyl
compounds with ammonia which is degraded from amino acids.
N
O
R
pyrrole derivate pyridine derivate
NO
R
Figure 8: Basic structure of pyrroles and pyridines, required for roasted odor.
2.3.4.4 Aldehydes
Aldehydes are organic compounds containing a terminal carbonyl group. This
functional group, which consists of a carbon atom bonded to a hydrogen atom and
double-bonded to an oxygen atom (chemical formula O=CH-), is called the aldehyde
group.
Aldehydes are potent flavor components in many foods with several flavor impressions.
A short overlook on flavor characteristic are given in Table 3. They are generated by
different pathways. A major group consists of the secondary products of lipid
autoxidation. It is well known that aldehydes with exceptionally strong aromas can be
released in food by autoxidation of some unsaturated fatty acids, even if they are present
in low amounts. Due to their aroma characteristic and low threshold values,
autoxidational generated aldehydes often contribute to off-flavors. It is to say, that
autoxidation products are of less importance within this study since the analyzed
samples contain only very small amounts of free fatty acids due to use of wheat starch
and low levels of fat containing additives.
Furthermore and more importantly, aldehydes are formed in different ways during
Maillard reaction. The most important one is the decomposition of amino acids by the
Strecker degradation mechanism which generates some key odorants for toasted cereal
flavor impressions such as 2- and 3-methylbutanal. Furfural and 5-
hydroxymethylfurfural, both formed by sugar degradation in the Maillard reaction are
further impact flavor compounds in extruded cereals [24].

State of the Art 39
Benzaldehyde, known for its typical bitter-almond odor, is a thermal reaction product as
well. Bruechert et al. [70] explains its generation by thermal reactions of 2,4-decadienal
and hexanal but other pathways are described in literature as well [71].
Table 3: Flavor impressions and formation pathways of selected aldehydes
Aldehyde Flavor Impression pathway
hexanal grassy-flowery lipid autoxidation
octanal fatty lipid autoxidation
nonanal floral-fatty lipid autoxidation
(E,E)-2,4-nonadienal oily lipid autoxidation
(E,E)-2,4-decadienal fatty lipid autoxidation
2-methylbutanal malty Strecker degradation
3-methylbutanal malty Strecker degradation
ethanal sharp, penetrating, fruity Strecker degradation
furfural bread-like, caramelic sugar degradation
5-hydroxymethylfurfural sweet, hey-like, caramel sugar degradation
benzaldehyde bitter almond differently
Source: Belitz, H.D. et al. (2004) [24], Arctander, S. (1969) [59]
2.3.5 Maillard Reaction and its Influence on Acrylamide Formation
Numerous studies have recently been performed on acrylamide and its formation in
thermal processed carbohydrate-rich foods. It has caused worldwide concern because
this compound has been classified as probably carcinogenic in humans. According to
Schlund, World Health Organization (WHO) coordinator of food safety research,
acrylamide probably has about the same potency as heterocyclic amines which caused
cancer in animal tests. However, only little is known about potential health risks in hu-
mans and remains to be investigated.
More is known about its formation. Mottram et al. [72] reported that the Maillard-driven
generation of flavor and color in thermally processed foods can - under particular condi-
tions - be linked to the formation of acrylamide. Researches, addressing the question of
precursor for acrylamide generation in the Maillard reaction pathway, suggest the natu-
rally occurring amino acid L-asparagine as the major precursor when heated under low-

State of the Art 40
moisture conditions in the presence of reducing sugars or carbonyl compounds. This is
accounted to the chemical structure of L-asparagine which already has an amide group
attached to a chain of two carbon atoms. This knowledge is of high importance since L-
asparagine is found to be a major amino acid in cereals, representing, for example, 14%
of the total free amino acids in wheat flour [73].
Beside the Maillard-pathway, the possibility of pyrolytic acrylamide formation in bak-
ing processes is widely discussed. Claus et al. added purified wheat gluten, free of any
reducing sugars, amino acids, and starch to bread roll dough to diminish the content of
L-asparagine and reducing sugar. Nevertheless, he could show a correlation between the
higher proportion of gluten and increased acrylamide content [74, 75].
In a model study, Stadler et al. measured the yields of acrylamide after Pyrolysis of N-
glycoside, an early Maillard product and found the results comparable to those from
amino-acid and reducing sugar precursors under the same conditions [76].
Both studies confirmed the assumption of acrylamide formation in heated foods inde-
pendently from the presence of L-asparagine.
With regard to the present study, acrylamide and its formation were not investigated.
However, based on the named literature it could be hypothesized, that under tested con-
ditions an acryl amide formation that could raise concerns would be unlikely to occur.
Neither severe time-temperature regimes as they are reported by Claus et al., necessary
for pyrolysis, nor relevant precursors such as L-asparagine are used in this model study
in significant amounts.
2.4 Flavor Analysis
Flavor analysis is carried out stepwise and can be subdivided in instrumental and sen-
sory analysis. The main aspect of this thesis is to show the influence of temperature,
sugars, and different amino sources on selected, well known flavor compounds in a
starch based extrusion model system. Therefore, the focus was on detecting and quanti-
fying those compounds.
2.4.1 Flavor Isolation and Concentration
There are several techniques in isolation and concentration of volatile compounds. One
major group uses organic solvents such as ether for extraction or steam distillation while
another rather simple technique use the headspace. Each of them comes along with spe-
cific advantages and disadvantages compared to others. That makes it hard to define the
most suitable method which has to fit the particular bill [77].
In general, more compounds are found when organic solvent extraction or steam distil-
lation methods are used for isolation than when headspace methods are used. However,

State of the Art 41
the use of solvent extraction or steam distillation allows the possibility of artifact forma-
tion or the introduction of impure solvents that increase the number of additional com-
pounds that are identified later. Folkes and Gramshaw [78] isolated a total of 190 vola-
tiles of white bread crust by ether-extraction followed by vacuum distillation while
Chang et al. [79] identified “only” 63 volatile compounds in breads made from hard red
winter wheat and hard white winter wheat by using the headspace.
In the isolation of aroma substances, foods which owe their aroma to the Maillard reac-
tion should not be exposed to temperatures of more than 50°C to avoid accosted artifact
formation or additionally formed compounds, i.e. thiol in the reduction of disulfides by
reductones. Therefore the gentle extraction according to Kutscher-Steudel with a subse-
quent high vacuum distillation is favorable in contrast to the widely used simultaneous
extraction/distillation according to Likens-Nickerson.
2.4.1.1 Simultaneous Extraction/Distillation According to Likens-Nickerson
As mentioned above, Likens and Nickerson designed an apparatus that combines ex-
traction with simultaneous distillation (simultaneous distillation-extraction SDE). In this
process, shown in Figure 9, low-boiling solvents are usually used to make subsequent
concentration of the aroma substances easier. Therefore, this process is carried out at
normal pressure or slightly reduced pressure. The sample is suspended in an aqueous
solution and heated up in a flask above the boiling point (1). A second flask (2) contain-
ing the solvent (e.g. pentane) is heated as well above the solvents boiling point. Due to
the diffusion of rising vapors, flavor compounds carried by the water vapor are assimi-
lated in the reaction area by the solvent vapor. Vapors condense in the condensation
area (3). Water phase and solvent separate in the condensate separator (4) before they
return into their flasks. Within 0.5 to 2 hours, the solvent phase is enriched with flavor
compounds.
Kalio [80] successfully isolated 69 aroma compounds from the press juice of arctic
bramble (raspberry) by steam distillation. In Literature this technique is characterized
by positive attributes like short processing time, small amounts of the required solvent,
and a relatively high flavor concentration in the extract. But it comes along with several
disadvantages such as high thermal treatment of the food samples that can lead to reac-
tions that produce unwanted metabolism products or change the aroma composition.
Furthermore, distillation/extraction according to Likens-Nickerson only allows the trans-
fer of compounds that are soluble in water. Hence, it may not document the important,
water insoluble flavor components [81].

State of the Art 42
Figure 9: Apparatus according to Likens and Nickerson used for simultaneous extrac-
tion and distillation of volatile compounds.
Source: Belitz,H.D. et al. (2004) [24]
2.4.1.2 Liquid-Liquid Extraction According to Kutscher-Steudel
Extraction according to Kutscher-Steudel represents a very gentle liquid-liquid extrac-
tion (LLE) method since it requires low temperatures, normally around the boiling point
of the used solvent. It is therefore recommended for temperature sensitive analytes such
as the above mentioned metabolism products. Additionally, this method includes a
much broader spectrum of flavor compounds due to their solubility in the solvent. The
extraction process itself is very time consuming, requiring a period of about 20 hours
followed by an independent distillation step. The latter might be a reason that only a
few studies used this technique for flavor isolation. Pyysalo et al. [82] successfully ex-
amined the flavor volatiles of wild strawberries by using a modified Kutscher-Steudel
extractor. Dregus et al. [83] analyzed alcohols and acids in rhubarb stalks, comparing it
with simultaneous distillation-extraction (SDE) and vacuum headspace (VHS). They
found that LLD and VHS give good comparable results while heat treatment during
SDE affected the results negatively by higher amounts of heat induced degradation
products.
The basic principle of a Kutscher-Steudel extraction apparatus is depicted in Figure 10.
An appropriate amount of sample material dissolved in water is given into the extractor
flask (1). The used solvent in a separate flask (2) is heated gently above its boiling

State of the Art 43
point. The accruing vapor condenses in the cooler and flows through the fritte into the
water-sample suspension (3). By taking advantage of their differences in density, the
solvent goes up through the water phase, which contains the dissolved flavor com-
pounds of the sample, and thereby assimilates them. Solvent enriched with flavor com-
pounds runs back into the flask (2) and the cycle starts again. Finally, the extract is dis-
tilled by solvent assisted flavor evaporation ( 2.4.1.3).
Cooler
Water Bath
Vapor Flow
Fritte
Solvent (2)
Filter Layer
Solvent
Sample-Water Suspension (3)
1
Figure 10: Liquid-liquid extractor according to Kutscher and Steudel.
2.4.1.3 Solvent Assisted Flavor Evaporation (SAFE)
Solvent assisted flavor evaporation (SAFE) is a relatively new and one of the most ver-
satile techniques for the direct isolation of aroma compounds from complex food matri-
ces. It was developed in 1999 by W. Engel et al. [84] as a fast and careful method for
the isolation of volatiles from solvent extracts, aqueous food, aqueous food suspensions
or even matrices with high oil content. The SAFE apparatus includes a compact distilla-
tion unit as shown in Figure 11 in combination with a high vacuum pump. After appli-

State of the Art 44
cation of high vacuum (~5 mPa) the distillation procedure is started by dropping the
liquid food or the extract from the funnel (1) into the distillation flask which is heated to
35-40°C in a water bath (2). The volatiles including the solvent vapor are transferred
into the distillation head (3). The distillate is condensed by liquid nitrogen in the re-
ceiver (4). The drawer flask (5) protects the vacuum pump (reduced pressure 10-3 Pa).
Solid foods require a previous extraction as described in chapter 2.4.1.1 and 2.4.1.2.
SAFE comes along with several advantages such as higher yields of volatiles compared
with previously used high vacuum transfer techniques, higher yields of more polar fla-
vor substances and odorants from fat-containing matrices. Furthermore, it allows the
direct distillation of aqueous samples such as milk, beer, and orange juice, reliable
quantification of polar and labile trace volatiles in complex matrices, compared with
many other highly sophisticated modern methods, and recovers real authentic flavor
extracts [24, 77, 85, 86].
Figure 11: SAFE apparatus for the distillation of aroma substances from food (for ex-
planations, see text. According to Engel et al. [24, 84])
Source: Belitz, H.D. et al. (2004) [24]

State of the Art 45
2.4.1.4 Headspace Sampling
Headspace collection is widely used because of its simplicity and the possibility of
automation, allowing the analysis of a variety of samples. In general, the sample is
sealed in a container, heated up to the desired temperature and left for a while to estab-
lish a equilibrium between volatiles bound to the sample matrix and those present in the
vapor phase above. The possibility of artifact formation using this procedure is minimal
because neither severe temperatures nor organic solvents are used. Also, losses during
extraction and concentration are eliminated, although other losses may occur. However,
this method can collect only the most volatile compounds. Often, the amounts of sub-
stance isolated in this process are so small that important aroma substances, which are
present in food in very low concentration, give no detector signal. The complete picture
of the flavor may be lacking, making a determination of important compounds possible
only by sniffing the carrier gas stream (olfactometry) [24].
Equipment adjusted to the requirements, given by the sample is very important.
Jennings and Filsoof [87] examined the influence of different gases and polymers on
purging and adsorbing volatiles, showing major differences depending on the used ma-
terials. A comparison of some aroma compound isolation methods including the ac-
costed headspace analysis showed that the results obtained by distillation-extraction
procedure still give the best representation of the composition of the starting solution.
However, the formation of artifacts is critical and the preparation time consuming [24].
The headspace analysis can be subdivided in two classes, the static and the dynamic
procedure. Both show several advantages.
2.4.1.4.1 Static and Dynamic Headspace Analysis
By using static headspace, a given volume of the mentioned headspace is injected into a
gas chromatograph equipped with a suitable separation column. Since the water content
and an excessively large volume of the sample substantially reduce the separation effi-
ciency of the following gas chromatography, only the major volatile compounds are
indicated by the detector. However, the static headspace analysis makes an important
contribution when the positions of the aroma substances in the chromatogram are de-
termined by simultaneous olfactometry.
In the dynamic procedure, also called “purge and trap”, more material is obtained. The
headspace volatiles are flushed out and purged with an inert gas (e.g. N₂, CO₂, He), ad-
sorbed and thus concentrated on a porous, granulated polymer, followed by recovery of
the compounds. Desorption of volatiles is usually achieved stepwise in a temperature
gradient. At low temperatures, the traces of water are removed by elution, while at ele-

State of the Art 46
vated temperatures, volatiles are released and flushed out by a carrier gas into a cold
trap, usually connected to a gas chromatograph.
However, it is difficult to obtain a representative sample by this flushing procedure, a
sample that would match the original headspace composition [24, 88, 89].
2.4.2 Flavor Identification and Quantification
After isolating and concentrating the flavor compounds from the sample, identification
and quantification is mostly carried out by a combined chromatography – mass spec-
trometry.
2.4.2.1 Chromatography
Chromatography is the collective term for a family of techniques for the separation of
mixtures. In 1900, the botanist Michael Semjenowitsch Tswett was the first to separate
several kinds of chlorophyll and xantophyll in a glass column packed with calcium car-
bonate and gave it its name which comes from the Greek chroma, color and grafein, to
write.
Over the years, researchers found that the principles underlying Tswett’s chromatogra-
phy could be applied in many different ways, giving rise to several varieties of chroma-
tography which have all common properties. They all contain the necessary analyte
which is located in the mobile phase, moving in a definite direction, and a stationary
phase. Different chromatographic techniques can be classified by their basic attributes.
One of them is the bed shape which subdivides chromatography in two major groups.
On the one hand there’s the column chromatography which contains a stationary bed
within a tube. The particles of the solid stationary phase or the support coated with a
liquid stationary phase may fill the whole inside volume of the tube (packed column) or
be concentrated on or along the inside tube wall leaving an open, unrestricted path for
the mobile phase in the middle part of the tube (open tubular column).
The planar chromatography is a separation technique in which the stationary phase is
present as or on a plane. The plane can be a chromatography paper, serving as such or
impregnated by a substance as the stationary bed, a so called paper chromatography, or
a layer of solid particles spread on a support such as a glass plate, a so called thin layer
chromatography.
A further way of differentiation is the physical state of the mobile phase which leads to
three main techniques.
One of the most common is the gas chromatography (GC), also known as gas-liquid
chromatography (GLC), a separation process in which the mobile phase is a carrier gas.
It is always carried out in a column which can be packed as well as be capillary. Since

State of the Art 47
GC is extensively used in chemistry research and represents the used analytic method in
this thesis, it will be described more preciously in chapter 2.4.2.2.
The liquid chromatography (LC) on the other hand uses a liquid as the mobile phase. It
can be carried out either in a column or on a plane. The most common LC is the high
performance liquid chromatography (HPLC). At this, the sample is forced through a
packed column by a liquid at high pressure. HPLC is historically divided into two sub-
classes, based on the polarity of the mobile and the stationary phase. A technique in
which the stationary phase is more polar than the mobile phase is called normal phase
liquid chromatography (NPLC) while the opposite is called reversed phase liquid chro-
matography (RPLC).
2.4.2.2 Gas Chromatography (GC)
As mentioned above, GC is a type of chromatography which involves a sample being
vaporized and injected onto the head of the chromatographic column. A principle set-up
is shown in Figure 12. The sample is transported through the column by the flow of a
carrier gas (mobile phase), usually an inert gas such as helium or an unreactive gas such
as nitrogen. The column itself contains a liquid stationary phase, a microscopic layer of
liquid or polymer on an inert solid support, inside glass or metal tubing.
Two types of columns are used in GCs.
Packed columns are 1.5-10 m in length and have an internal diameter of 2-4 mm. The
tubing is usually made of stainless steel or glass and contains a packing of finely di-
vided, inert, solid support material that is coated with a liquid or solid stationary phase.
Capillary columns have a very small internal diameter, on the order of a few tenth of
millimeters, and length between 25-60m are common. The inner walls are coated with
active materials. Most are made of fused-silica with a polyimide outer coating. Those
columns are flexible which makes it possible to wound a very long column into a small
coil.
The nature of the coating material (stationary phase) determines what type of materials
will be most strongly adsorbed. Thus numerous columns are available that are designed
to separate specific types of compounds, for instance depending on their polarity.

State of the Art 48
Figure 12: Principle set-up of a gas chromatograph.
Today, the injection is mostly carried out by an autosampler since automatic insertion
provides better reproducibility and is less time consuming. As the carrier gas sweeps the
analyte molecules through the column, this motion is inhibited by temperature and ad-
sorption of the analyte molecules either onto the column wall or onto packing material
in the column. The rate at which the molecules progress along the column depends on
the strength of adsorption, which in turn depends on the type of molecule and on the
stationary phase materials. This can be influenced by choosing an adequate coated col-
umn depending on the attributes of the analyzed sample.
The rate at which a sample passes through the column is logarithmically influenced by
the temperature of the column. Therefore the column in a GC is contained in an oven,
the temperature of which is precisely controlled electronically. The higher the tempera-
ture, the faster the sample moves through the column. However, the faster the mobile
phase move through the column, the less the analytes interact with the stationary phase,
and the less they are separated. In general, the column temperature is selected to com-
promise between the length of the analysis and the level of separation. There are two
ways of heat control. The isothermal method holds the column at the same temperature
for the entire analysis whereas a so called temperature program increases the column
temperature over the time which allows the analytes that elute early in the analysis to
separate adequately, while it takes a shortening of time for late-eluting analytes to pass
through the column. The individual time each molecule needs to pass the column is
called retention time (rt).
When leaving the column, the separated molecules enter the detector. The detector is a
sensing device used to monitor the concentration profiles of solutes eluted from the gas
chromatography column. There are several detectors and each of them will give differ-
ent types of selectivity. The most common are the flame ionization detector (FID) and

State of the Art 49
the thermal conductivity detector (TCD). Both are sensitive to a wide range of compo-
nents, and both work over a wide range of concentrations. While TCDs are essentially
universal and can be used to detect any component other than the carrier gas, FIDs are
sensitive primarily to hydrocarbons but can’t detect water. Both are quite robust. Other
detectors are flame photometric detector (FPD), mass selective detector (MSD), photo
ionization detector (PID) and other. In most modern applications however the GC is
connected to a mass spectrometer (MS) that is capable of identifying the analytes repre-
sented by the peaks. Since most of the flavor analysis described in literature as well as
the analysis part of this thesis is carried out by using a combined GC-MS apparatus, this
method will be described more detailed in chapter 2.4.2.4. Generally chromatographic
data is presented as a graph of detector response (y-axis) against retention time (x-axis).
This provides a spectrum of peaks for a sample representing the analytes present in a
sample eluting from the column at different times. The retention time can be used to
identify analytes if the method conditions are constant.
Since the area under a peak is proportional to the amount of analyte present, a quantita-
tive analysis becomes possible. By calculating the area of the peak using the mathe-
matical function of integration, the concentration of an analyte in the original sample
can be determined. The concentration is mostly calculated by determining the relative
response factor of an analyte. The relative response factor is the expected ratio of an
analyte to an internal or external standard (a chemical added to the sample at a constant
concentration, with a distinct retention time to the analyte) and is calculated by finding
the response of a known analyte and a constant amount of the standard [24, 90].
2.4.2.3 Mass Spectrometry (MS)
Mass Spectrometry is an analytical technique that measures the mass-to-charge ratio
(Q/m) of charged particles. When presenting data, it is common to use the dimen-
sionless m/z, where z is the number of elementary charges (e) on the ion (z=Q/e).
Early devices were called mass spectrographs since they recorded a spectr-um on a
phot-ograph-ic plate. In 1886, Eugen Goldstein was the first to observe “rays” that trav-
elled through the channels of a perforated cathode in a low pressure gas discharge and
moved toward the anode, in the opposite direction to the negatively charged cathode
rays. In 1899, Wilhelm Wien constructed a device that separated the positive rays ac-
cording to their charge-to-mass ratio via parallel electric and magnetic fields. In the
course of time mass spectrometry was developed further what makes it today a widely
used technique in the fields of analytical chemistry, pharmacokinetics, protein charac-
terization and isotope dating and tracking.
All mass spectrometer consists of three basic parts as shown in Figure 13, an ion
source, a mass analyzer, and a detector system.

State of the Art 50
Sample
Ion Source Mass Analyzer Detector
Data Analysis
Figure 13: Basic parts of a mass spectrometer.
The ion source is the part of the MS that ionizes the analyte. Historically, there are dif-
ferent methods in ionization but only a few are dominating. The most common is the
electron ionization (EI) in combination with gas chromatography for gases and vaporiz-
able liquids and solids. Thereby, electrons with an energy of 5-200eV (most often
70eV) are generated and collide with the analyte molecule. The energy is transmitted on
the molecule and primarily positive ions are generated. Those ions are mostly instable
and brake completely or partly into smaller charged mass fragments. At this, every
molecule breaks in a predictable pattern of ions.
The electrospray ionization (ESI), due to John Fenn, is applicable for larger molecules
such as proteins. A chemical solution of charged or polar substances is sprayed, ionized,
and the so created droplets dried so that ions of the analyte remain. Even by using a
pulsed laser light, the analyte can be evaporated from a solid. This method is called ma-
trix-assisted laser desorption/ionization (MALDI), due to K. Tanaka and separately,
M. Karas and F. Hillenkamp. Thereby the analyte is mixed and co-crystallized in a dis-
proportionately large amount of matrix material. The matrix material has the character-
istic to absorb energy at the wave length of the used laser light. When the laser hits the
matrix, the now positive charged analyte is set free. Further methods are chemical ioni-
zation (CI), field desorption (FD) and atmospheric pressure chemical ionization (APCI).
The mass analyzer separates ions by their masses or more precise, by their mass-to-
charge ratio (m/q). All mass analyzers are based on dynamics of charged particles in
electric and magnetic fields in vacuum where the Lorentz force law and the Newton’s
second law of motion applies.
There are many types of mass analyzer, using both static or dynamic fields, and mag-
netic or electric fields. Each of them has it strengths and weaknesses and they often dif-
fer substantially in their resolution power.

State of the Art 51
The resolution power is defined by the minimal mass difference dm of two ions to be
separated from each other. The resolution of a mass analyzer is given by the unit Th
(Thomson) and is different to the resolution power R which is given most often. The
resolution power is the ratio of a mass to the mass difference of the closest separable
mass (R=m/dm). For example, while obtaining a resolution power of 4000, peaks of
4000 Th and 4001 Th could be separated as well as peaks of 2000 Th and 2000.5 Th,
because 2000/(2000.5-2000)=4000.
Since it is used in this study, the sector field mass analyzer should be explained more
detailed. It uses an electric and/or magnetic field to affect the path and/or velocity of the
charged particles. The radius of the circular path within the fields depends on the energy
(in the electric field) and the impulse (in the magnetic field) of the ions. Knowing the
charge, the energy, and the impulse makes it possible to determine the mass. Sector
field mass analyzer can be designed to image ions of a slightly different speed (velocity
focusing) or slightly different directions (direction focusing) at one point of the detector.
Most modern sector instruments do both by combining a magnetic and an electrostatic
sector field and are called double focusing mass analyzer (Figure 14). The focusing is
necessary to reach an acceptable intensity of the signal at resolution powers up to
R=100.000. That makes them the most precise but also the most expensive mass ana-
lyzer.
Figure 14: Design and function principle of a double focusing mass analyzer.
Other common mass analyzers are for instance time-of-flight (TOF) or quadrupole ana-
lyzer. The former is taking advantage of an identical energy of all ions, entering the
analyzer. Lighter ions reach the detector earlier since they are faster than heavier ones.

State of the Art 52
The resolution power of modern TOF mass spectrometers is about R=15.000. Quadru-
pole mass analyzers use oscillating electrical fields to selectively stabilize or destabilize
ions passing through a radio frequency quadrupole field. They act as mass selective fil-
ters what means that only stable ions of a defined mass (or rather mass-to-charge ratio)
can pass through the alternating field inside four parallel electrodes, regulated by adjust-
ing the frequency ω or voltage U, V.
Further mentionable mass spectrometers are tandem mass spectrometers (MS/MS) and
several types of ion trap spectrometers such as quadrupole ion trap, linear trap,
FT-ICR-MS and orbitrap.
A mass spectrometer is typically utilized in one of two ways. When collecting data in
the full scan mode, a target range of mass fragments is determined. The used range is
largely dictated by the expected fragments in the sample. However, a MS should not be
set to look for mass fragments too low or else one may detect interferences such as air,
found as m/z 28 due to nitrogen or m/z 44 due to carbon dioxide. A typical range of
mass fragments to monitor would be m/z 50 to m/z 400. A range too broad also de-
creases the sensitivity of the instrument due to performing less scans per second, each
detecting a wide range of mass fragments.
The second mode is the selective ion monitoring (SIM). At this, only a certain range of
ion fragments are entered into the instrument method and only those are detected by the
MS. The advantage lies with this limited number of fragments the instrument is looking
for during each scan. Furthermore, more scans take place each second which increases
the accuracy of the results [90, 91].
2.4.2.4 Gas Chromatography–Mass Spectrometry (GC-MS)
GC/MS is a method that combines the features of gas-liquid chromatography (GC) and
mass spectrometry (MS) to identify different substances within a test sample. It is com-
posed of two major building blocks, the gas chromatograph ( 2.4.2.2) and the mass spec-
trometer ( 2.4.2.3). While the GC uses differences in the chemical properties between
different molecules in a mixture to separate the molecules as the sample travels through
the length of the column, the MS downstream captures, ionizes, accelerates, deflects
and detects the molecules, or rather their ionized fragments, separately, using their
mass-to-charge ratio. A simplified set-up of a modern GC/MS is shown in Figure 15.
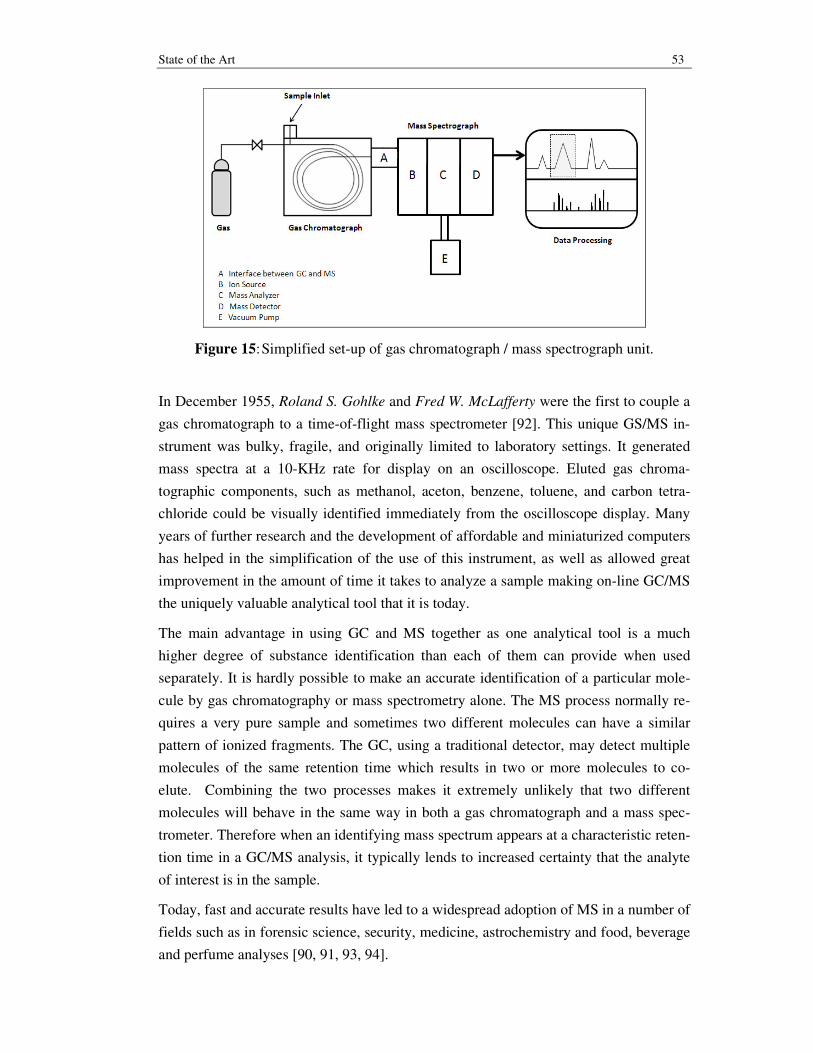
State of the Art 53
Figure 15: Simplified set-up of gas chromatograph / mass spectrograph unit.
In December 1955, Roland S. Gohlke and Fred W. McLafferty were the first to couple a
gas chromatograph to a time-of-flight mass spectrometer [92]. This unique GS/MS in-
strument was bulky, fragile, and originally limited to laboratory settings. It generated
mass spectra at a 10-KHz rate for display on an oscilloscope. Eluted gas chroma-
tographic components, such as methanol, aceton, benzene, toluene, and carbon tetra-
chloride could be visually identified immediately from the oscilloscope display. Many
years of further research and the development of affordable and miniaturized computers
has helped in the simplification of the use of this instrument, as well as allowed great
improvement in the amount of time it takes to analyze a sample making on-line GC/MS
the uniquely valuable analytical tool that it is today.
The main advantage in using GC and MS together as one analytical tool is a much
higher degree of substance identification than each of them can provide when used
separately. It is hardly possible to make an accurate identification of a particular mole-
cule by gas chromatography or mass spectrometry alone. The MS process normally re-
quires a very pure sample and sometimes two different molecules can have a similar
pattern of ionized fragments. The GC, using a traditional detector, may detect multiple
molecules of the same retention time which results in two or more molecules to co-
elute. Combining the two processes makes it extremely unlikely that two different
molecules will behave in the same way in both a gas chromatograph and a mass spec-
trometer. Therefore when an identifying mass spectrum appears at a characteristic reten-
tion time in a GC/MS analysis, it typically lends to increased certainty that the analyte
of interest is in the sample.
Today, fast and accurate results have led to a widespread adoption of MS in a number of
fields such as in forensic science, security, medicine, astrochemistry and food, beverage
and perfume analyses [90, 91, 93, 94].

State of the Art 54
2.4.3 Quantification
2.4.3.1 Internal Standards
An internal standard in analytical chemistry is a chemical substance that is added in a
constant amount to samples. This substance can then be used for calibration by plotting
the ratio of the analyte signal to the internal standard signal as a function of the analyte
concentration of the standards.
Quantification of the eluted species is relatively straightforward in determinations in-
volving a single analyte but is complicated in more usual cases by the large number and
chemical diversity of volatile compounds. Selection of appropriate internal standard(s)
is then difficult, although Molteberg et al. [95] demonstrated that toluene is capable to
quantify a broad range of volatiles.
The internal standard should not be any natural compound of the sample to avoid vari-
ances due to addition but should be a compound that matches as closely, but not com-
pletely, the chemical species of interest in the samples, as the effects of sample prepara-
tion should, relative to the amount of each species, be the same for the signal from the
internal standard as for the analytes signal(s). Since sample preparation affects every
single chemical compound in a different way, the use of conventional standards can
never lead to an accurate quantification.
2.4.3.2 Stable Isotope Dilution Analysis
Stable isotope dilution analysis is a relatively new and powerful technique that has al-
lowed accurate quantification of several compounds in popcorn [96], toasted bread
[97, 98, 99] and sourdough fermentation [100].
In this procedure, isotopomeres are used as internal standards, and many of these must
be synthesized. In mass spectrometry, the non-radiating isotopes 2H (deuterium, D) and 13C are preferably employed and thus, a rich methodology to incorporate isotopic labels
has been developed [90].
The procedure provides highly accurate measurements since unavoidable losses of ana-
lyte during isolation are ideally compensated, although the timing of addition of the
spike must be considered. Zehentbauer and Grosch [98, 99] quantified several volatiles
in white bread crust using stable isotope dilution analysis and spiked the sample with
the relevant isotopomers after grinding it in a frozen state.
The chemical state of the spike vis-à-vis the native analytes is a potential concern as is
adequate mixing of the spike and the sample. However, these are relatively minor con-
siderations, and today the stable isotope dilution analysis represents state of the art in
quantification [66, 101].

State of the Art 55
2.5 Color and Color Measurement
Color is an important factor in determining food preference. People learn to expect cer-
tain colors in their food and any variation from the expected color will lower the prefer-
ence. Brown colors, particularly in cereals, are a key factor in consumer acceptance
[102, Error! Bookmark not defined.].
Extruded cereals show a typically golden to light brown color that is well accepted by
the consumer. Looking at todays popular whole grain cereals, part of this color is due to
natural dyeing pigments, which are xantophyll (lutein type), carotene, flavones, and
cryptoxanthine, located in the outer layers of the kernel.
A second and more important account for brown coloration is the Maillard reaction be-
tween reducing carbohydrates and compounds bearing an amino group, occurring dur-
ing thermal processing of food. Depending on their molecular weight, the colored com-
ponents affecting this nonenzymatic browning may be divided into two classes, namely,
the lower molecular weight colored compounds, consisting of up to four linked rings
with molecular weights <1.000 Da, and the melanoidins, which are assumed to be wa-
ter-soluble, high molecular weight colored compounds with masses up to 100.000 Da.
Especially low molecular weight compounds are often potent flavor compounds [103,
104, 105, 106, 107].
If color can be expressed in concentration units, it might be possible to relate color di-
rectly to the rates of formation what would make color measurement a helpful tool in
process controlling. Until now, only a few attempts are reported, trying to show a corre-
lation between color development and flavor characteristics. Farouk et al. [62] exam-
ined the possibility to obtain products of satisfactory aroma even under conventional
extrusion conditions by increasing the rate of browning reactions during extrusion cook-
ing.
The intensity of browning can be measured in different ways. The main methods in-
volve visual comparison with standard references, chemical pigment extraction, and
light reflectance measurements. In recent years, near-infrared reflectance (NIR) and
near-infrared transmittance (NIT) and, more recently, UV-vis spectrophotometers have
been used to determine color as a parameter useful to assess food quality. However, in
food industries, the most popular color measurement is based on the refractometer color
method. Its reproducibility was studied by Ramirez-Jimenez et al. [108] on commercial
snack bread. The success of this automatic technique can be found in the rapidity and
safety of the procedure in addition to the good correlation found between the conven-
tional chemical extraction and the reflectance measurements [109, 110, 111].
The refractometer color method is using the L*a*b* color-space system, developed by
the Commission Internationale d’Eclairage (CIE) [112]. It describes all the colors visi-

State of the Art 56
ble to the human eye within a three coordinates diagram. In the CIE L*a*b*, L* repre-
sents the lightness (L*=100 yields black, L*=0 indicates white) while a* represents red
and green (negative values = green, positive values = red) and b* yellow and blue
(negative values = blue, positive values = yellow) [108].
Differentiation of red, yellow, green and blue in the L*a*b* color-space system are of
high interest since it is well-known that orange or red pigments are formed in early
stages of nonenzymatic browning, representing compounds of low molecular weight
while green and blue pigments are characteristic of high molecular weight melanoidins.
It has to be taken into account that extrusion cooking represents a short-time process;
favoring the formation of low molecular weight colored compounds in early stages of
the Maillard reaction and the complex interaction of different process parameters such
as retention time, temperature, and additional flavor precursors can influence color and
flavor generation. Hence, it remains unclear if color measurement may help to evaluate
the influence of process parameters on flavor development [62].

Materials and Methods 57
3 Materials and Methods
3.1 Raw materials
Wheat starch (Manildra Milling Corp., Shawnee Mission, KA, USA) was the base of all
generated directly expanded extrudates. “Spray Process Grade A Nonfat Dry Milk”
(Dairy America Inc., Fresno, CA, USA), “Whey Protein Isolate” (Davisco Inc., Le
Sueur, MN, USA), and the amino acids cysteine, proline and leucine and valine (>99%
p.a., Sigma-Aldrich, Buchs, Switzerland) were used as additional amino sources. Com-
positions of the protein additives are shown in Table 4.
Table 4: Proximate composition of protein containing additives used
Components Milk Powder Whey Protein isolated
Moisture [%] 3.9 4.2
Protein [%] 33.4 94.0
Fat [%] 0.8 0.1
Minerals [%] 7.8 1.7
Lactose [%] 54.1 0.0
Wheat starch was enriched with milk powder or whey protein to achieve a total protein
content of 0% to 3%. Both were mixed to the desired ratio in a ploughshare mixer for 5
minutes to ensure the homogeneity of the feeding material before extrusion.
The amino acids were dissolved in distilled water at room temperature and added to the
extrusion process by an electromagnetic flow measuring system “Promag 50” (En-
dress+Hauser, Greenwood, IN, USA) to achieve final concentrations in the analyzed
sample material of 250 and 1.000 ppm.
Salt (Cargill Inc., Minneapolis, MN, USA) and sugar were dissolved in water, creating
slurries which were fed into the extruder by an electromagnetic flow measuring system
“Promag 50” (Endress+Hauser, Greenwood, IN, USA) to achieve a target concentration
in the product of 0.75% salt and 0% to 8% sugar.
Two different sugars, glucose syrup “Howell” (Cargill Inc., Eddyville, IO, USA) and
glucose (Tate & Lyle Ingredients Americas Inc., Dacature, IL, USA), were used sepa-
rately to compare their influence on flavor formation. The glucose syrup used is charac-

Materials and Methods 58
terized by a dextrose equivalent (DE) of 63 containing approximately 37.5% glucose,
34.2% maltose, 16.1% higher sugars and 12.2% dextrins at a solid content of 82%.
3.2 Sample Generation
3.2.1 Experimental Design
Extrusion trials were made using factorial designs. Fractionized factorial trials were
realized by the Central-Composite-Design. A statistical evaluation of the achieved re-
sults was made by ANOVA (Analysis of Variance) and the software “DesignExpert®”
(Version 6.0.5., Stat-Ease, Minneapolis, USA).
Changeable parameters were barrel temperature as well as protein and sugar content,
each varied over 3 levels as shown in Table 5.
Table 5: Designs of the extrusion cooking experiments
Level Parameter
-1 0 +1
Barrel Temperature [°C] 140 160 180
Protein [% DS] 1,3 2,0 2,6
Sugar [% DS] 2 4 6
3 Designs were carried out, differing in the composition of glucose and glucose syrup as
well as whey protein and milk protein. The compositions and their codings are shown in
Table 6.
Table 6: Coding of the experimental trials
Composition
Protein Source/Sugar Coding Total Coding
Milk Powder/Glucose syrup MC
Milk Powder/Glucose MG
Whey Protein/Glucose WG
MC 140 2 4
Sugar Content〔% d.m.〕
Protein Content〔% d.m.〕
Barrel Temperature〔℃〕
Protein/Sugar Composition

Materials and Methods 59
3.2.2 Extrusion Process
The extrusion processing was carried out on a twin-shaft extruder “DNDL-44/28D”
(Bühler AG, Uzwil, Switzerland) with seven barrel sections containing independently
controlled heating (3) and cooling (1) zones. A “circulating liquid temperature control
system” (MOKON, Buffalo, NY, USA) was used to heat the barrels in a range from 140
to 180°C. The gelatinized starch was extruded through a die plate containing 2 round
holes of 2 mm diameter each. The screw consisted of conveying elements with different
pitches only. Seven reverse elements where put in place in the last third of the screw to
increase the input of mechanical energy. The technical data of the extruder are shown in
Table 7. The general profiles of the barrel temperature and the mechanical energy input
are depicted in Figure 16.
Barrel temperature, die temperature, die pressure, shaft torque, extruder power, specific
mechanical energy input (SME), and feed rates were measured and controlled by an
extruder control system “BCTB” (Allen Bradley, Milwaukee, WI, USA). Solid raw ma-
terial was fed into the first barrel section, cooled to room temperature, by a K-Tron se-
ries “K10S” gravimetric feeding system (KTron Ltd., Niederlenz, Switzerland). The
moisture content of the feed was controlled by injecting water at room temperature
(23°C) into the extruder with an electromagnetic flow measuring system “Promag 50”
(Endress+Hauser, Greenwood, IN, USA). The final mass flow rate has been kept con-
stant at 80 kg/h. The screw speed was 350 rpm constantly. The expanded extrudate was
pelletized by an adjustable three blade cutter at the face of the die. It was operated at
1.100 rpm constantly. Due to a constant screw speed, the residence time was expected
to remain constant at around 30 seconds. Therefore, separate measurements have not
been conducted within this thesis.
Table 7: Technical Data of the Twin-Screw-Extruder DNDL-44/28D
Feature Specification
Throughput capacity 20 … 80 kg/h
Motor power at constant torque 18.9 kW
Working torque 190 Nm/shaft
Screw speed 60 … 450 min-1
Screw diameter (D) 44 mm
Screw length (L) 28 x D

Materials and Methods 60
Figure 16: Barrel temperature profile and profile of the mechanical energy input in
the extruder due to the heating of the barrel section and the use of differ-
ent screw elements.
3.2.3 Drying Process
Drying was realized by using a fluid-bed cooler/dryer “OTW 50” (Bühler AG, Uzwil,
Switzerland) coupled with a customized heat exchanger (Xchanger, Inc., Hopkins, MN,
USA).
The pelletized extrudates were conveyed from the extruder to the dryer by an exhaust-
ing pipe, passing a cyclone which separated the extruded pellets from generated dust.
The drying time for each run was 2 minutes at a constant temperature of the heated air
of 134°C. To guarantee the same drying time for each pellet in every single run, a de-
fined amount of sample was collected in a basket that matched the inner dimension of
the dryer before starting the fluid-bed drying process. The undried samples were col-
lected when leaving the cyclone to avoid shrinkage that would have been occurred if the
samples had been collected immediately after extrusion and cutting.
3.2.4 Sampling
After drying, 500g of each sample were collected in plastic polyamid-polyethene bags,
cooled to room temperature, finely ground and stored at -20°C in glass jars until re-
quired for analysis

Materials and Methods 61
3.3 Isolation of Flavor Volatiles
3.3.1 Extraction according to Kutscher-Steudel
50 g of finely ground sample dissolved in 250 mL of distilled water was transferred into
the Kutscher-Steudel extraction flask (shown in Figure 10) and filled up with distilled
water to a total of 1L. The sample solution was covered with the needed amount of di-
ethyl ether, used as the solvent, to reach the outlet of the flask. An additional 100 mL of
diethyl ether was given into the 250 mL receiving flask which was heated in a water
bath up to its boiling point. The evaporating solvent condensed in the condensation area,
flowing through a fritte to the bottom of the extraction flask. Due to their density differ-
ences, the solvent rose through the sample solution accumulating with flavor compo-
nents. The emerging solvent excess flowed back into the receiving flask where the cycle
started again. The diethyl ether got enriched with flavor components over a period of 20
hours.
3.3.2 Solvent Assisted Flavor Evaporation (SAFE Method)
Extract obtained by extraction according to Kutscher-Steudel was added to the dropping
funnel of the SAFE apparatus “BAENG” (Glasbläserei Bahr, Manching, Germany)
( 2.4.1.3), which was heated to 40°C in a water bath. The receiving flask for the distillate
and the safety cooling trap of the instrument were cooled with liquid nitrogen. The
SAFE apparatus was connected to a high vacuum pump “Trivac D16B” (Leybold-
Heraeus, Hanau, Germany) and then the extract in the dropping funnel was added in
small aliquots to the distillation flask over a period of 30 min.
The collected frozen distillate was thawed at room temperature. The extract was dried
over anhydrous sodium sulphate, >99% p.a. (Roth GmbH, Karlsruhe, Germany) and
concentrated to about 1.0 ml using a Vigreux column and water bath at 40-50°C. The
extract was transferred into a vial. The distillation flask was washed with a minimum of
diethyl ether, and the washing was added to the vial. The solvents were carefully re-
moved using a purified nitrogen stream until the total volume was reduced to approxi-
mately 100 µl. The extract was then analyzed by GC/MS ( 3.4.1).
3.3.3 Purge and Trap Headspace Sampling
Purge and Trap dynamic headspace sampling was realized by using a “Tekmar 3000
Concentrator w/2016 ALS” (Teledyne Tekmar, Mason, OH, USA) equipped with a
Tenex trap. 40 µl of 4-heptanone as an internal standard were added to 3 g of finely
ground sample, sealed in a 40 ml vial and put in the auto sampler. The purge and trap
parameters are given in Table 8.

Materials and Methods 62
Table 8: Purge and Trap instrument conditions
Parameter Setting
Purge ready temperature 30°C
Purge temperature 30°C
Turbocooler temperature 100°C
Sample heater ON
Pre purge time 2 min
Pre heat time 3 min
Purge vessel heater 60 °C
Purge time 20 min
Dry purge time 4 min
GC start Des End
Cryofocuser ON
GC cycle time 49 min
Cryo standby temperature 190
Cryofocus temperature -50°C with liquid nitrogen
Injection time 2 min
Cryo injection temperature 190°C
Desorption pre heat temperature 180°C
Desorption temperature 200°C
Desorption 6 min
Sample drain OFF
Bake time 20 min
Bake temperature 210°C
BGB ON
Delay 2
Transfer line temperature 180°C
Valve temperature 150°C
20XX line temperature 130°C
20XX valve temperature 130°C
MCS temperature 100°C
Vial size 40 ml
3.4 Identification and Quantification of Flavor Volatiles
3.4.1 Gas Chromatography / Mass Spectrometry (GC/MS)
When headspace sampling was carried out, a quadrupole GC/MS was used while a dou-
ble focusing GC/MS was used when flavor isolation was realized by extrac-
tion/distillation.

Materials and Methods 63
3.4.1.1 Quadrupole GC/MS
The system consisted of a Gas Chromatograph “Agilent 5890 series-II GC” (Agilent
Technologies, Santa Clara, CA, USA) with a splitless injector and a linear temperature
program (injection temperature 190°C, detector temperature 240°C) coupled with a
quadrupole mass spectrometer “HP 5989 MS-ENGINE” (Hewlett-Packard Co., Palo
Alto, CA, USA). A 30 m long and 0.25 mm i.d. fused silica capillary column
“Rtx® Volatile” (RESTEK, Bellefonte, PA, USA) was used. Helium carrier gas was
used at a column head pressure of 97 kPa (14 psi). The oven temperature was pro-
grammed from 40°C (5 min isothermal) to 240°C (held for 10 min at final temperature)
at 6°C/min.
Important parameters of the MS are given in Table 9. The GC/MS was equipped with
an electronic data processing system “Wiley library 7N” (Wiley, Hoboken, NJ, USA).
Table 9: Parameters of the quadrupole mass spectrometer “HP 5989 MS-ENGINE”
ionization energy 70 eV (electron impact ionization)
scan range 40 to 450 Da
emission n.s.
resolution 4 000
3.4.1.2 Sector field GC/MS
The system consisted of a Gas Chromatograph “HP GC 5890 Series 2” (Hewlett-
Packard Co., Palo Alto, CA, USA) with a split-splitless injector and a linear temperature
program (injection temperature 230°C, detector temperature 280°C) coupled with a
double focusing sector field mass spectrometer “Model 8230” (Varian-MAT, Bremen,
Germany). A 60 m long and 0.32 mm i.d. DB-1 bonded-phase fused silica capillary
column (J&W Scientific, Folsom, CA, USA) was used. Helium carrier gas was used at a
column head pressure of 150 kPa (22 psi). The oven temperature was programmed from
70°C (4 min isothermal) to 280°C (held for 30 min at final temperature) at 2°C/min.
Important parameters of the MS are given in Table 10. The GC/MS was equipped with
an electronic data processing system “Maspec II32” (Mascom, Bremen, Germany).

Materials and Methods 64
Table 10: Parameters of the double focusing sector field mass spectrometer
“Model 8230”
ionization energy 70 eV (electron impact ionization)
scan range 35 to 600 Da
emission 1 mA
resolution 100 000
3.4.2 Quantification
Quantification via stable isotope dilution analysis was carried out by the use of deute-
rium labeled 2,4-decadienal and furanmethanol and by carbon 13 labeled butyric acid.
Additionally, trimethylpyrazine was added as an internal standard in unmodified state to
quantify the amounts of other generated pyrazines and 1-octanol as a common internal
standard, not naturally occurring in the original sample. The added amount of isotopic
labeled standards and of trimethylpyrazine depended on the expected amount of the
analogous analytes in the sample. The used standards and their amounts are listed in
Table 11.
All standards were obtained from the chair for molecular analysis, Department of Bio-
technology at the Technische Universität Berlin (Berlin Institute of Technology), Ger-
many.
Table 11: Used internal standards and their amounts
Internal Standard Concentration
1-Octanol 2 ppm
Trimethylpyrazine 1 ppm
D-2,4-Decadienal 0.2 ppm
13C-Butyric Acid 2 ppm
D-Furanmethanol 2 ppm

Materials and Methods 65
3.5 Color Measurements
Color measurement was carried out with a tristimulus color analyzer “Minolta Chroma
Meter CR-410” (Konica Minolta Sensing Americas, Inc., USA).
The method used is applicable to all non-enrobed puff cereal products and measures the
color on the L*a*b* scale.
Approximately 100 g pre-ground sample material (room temperature) was ground for at
least 20 seconds. After this second particle size reduction a powder was obtained, the
particle size distribution of which was uniform enough to carry out reliable color meas-
urements. Before measuring, the color meter was calibrated as described in the manual.
The tip of the measuring head was pressed firmly onto the surface of the sample, which
was filled into a 100 mL sample cup, by twisting the measurement head 3-4 times. A
pulsed xenon arc lamp provided illumination on the sample surface and the light was
reflected back to the instrument and measured. Three measurements were taken and the
average results were displayed.
The procedure was repeated 3 times for each sample to achieve a maximum of statistic
certainty.

Results and Discussion 66
4 Results and Discussion
The objective of this work was to examine and evaluate the influence of barrel tempera-
ture, protein and sugar content, and protein and sugar type on flavor development in
extrusion cooked starchy raw material. The complex interactions within the process of
extrusion are illustrated in Figure 17. It shows an adaptation of the systems analytical
model developed by Meuser and van Lengerich for extrusion cooking of starch contain-
ing raw materials [113, 114]. It describes the influence of process parameters on system
parameters and final product parameters as well as of system parameters on final prod-
uct parameters. In contrast to former studies using the systems analytical model, the
focus was primarily on how selected process parameters influence specific product pa-
rameters. The influences of process on system parameters as well as of system on prod-
uct parameters were investigated but remained of secondary interest. The results
showed a sufficient characterization of the relation between process and individual
product parameters.
Process Parameters System Parameters Product Parameters
z=f(x)
X Y Zy=f(x) z=f(y)
Extruder
- Barrel Temperature
- Screw Length
- Shaft Speed
- Die Geometry
Composition
- Protein Content
- Protein Source
- Sugar Content
- Sugar Source
- Moisture Content
Product Characteristics
- Color
- Expansion
- Density
Flavor Characteristics
- General Flavor Profile
- Generated Flavor Compounds
- Sensory
- Product Temperature
- Product Pressure
- Specific MechanicaliiEnergy (SME)
- Residence Time
Bold terms indicate changeable, measured, or analyzed parameters
Figure 17: Systems analytical model for the extrusion cooking process

Results and Discussion 67
Aside from evaluating the influence of sugar, protein, and temperature, two different
techniques of sample preparation for flavor analysis were carried out and compared re-
garding their specific advantages and disadvantages.
At last, color measurement was carried out to look for differences between the used
sugars and proteins and to check on possible process controlling properties by color
measurement.
4.1 Flavor Analysis
4.1.1 Comparison of Dynamic Headspace Sampling and Liquid/Liquid
Extraction – SAFE Distillation
Flavor analysis was conducted by using different techniques of sample preparation. Dy-
namic headspace sampling (DHS) was compared to a combination of liquid/liquid ex-
traction and SAFE-distillation (LLE-SAFE). Final analysis was made by gas chroma-
tography/mass spectrometry (GC/MS).
The number of detected compounds depended on the chosen sensitivity of the evalua-
tion software and the sample preparation technique. The total number of volatiles de-
tected in samples analyzed by headspace-GC/MS ranged from 70 to 100 compounds
within a retention time of 30 minutes. Using liquid-liquid extraction and SAFE distilla-
tion, the subsequent GC/MS analysis showed total amounts of 40 to 50 compounds
within the same period of time. This is due to a high number of negligible, aroma inac-
tive components, mostly alkanes, found by headspace analysis. A complete listing of
compounds found by headspace sampling for all analyzed designs is enclosed in the
appendix, Table A 1 to Table A 3.
An exemplary comparison of the resulting gas chromatograms extracted from the extru-
dates is depicted in Figure 18. It shows differences in the detectable volatile com-
pounds depending on the preparation technique and subsequent GC/MS.
Only a fraction of the total amount could definitely be named as aroma active compo-
nents. A total of 28 flavor volatiles were identified. 21 have been found by headspace
analysis and 23 by LLE-SAFE. A general overview on the detected aroma active com-
pounds is given in Table 12.
By comparing the findings of both techniques, one main difference becomes visible. As
already known and confirmed by several studies, more highly volatile compounds were
detected by headspace-GC/MS while more less-volatiles have been found in samples
prepared by extraction/distillation. Pyrazine and 2- and 3-methylbutanal were detected
exclusively by headspace GC/MS. All three are important, high-volatile flavor com-
pounds, responsible for desired caramel-like, roasted, and cereal flavor impressions.

Results and Discussion 68
He
xan
al
Me
thyl
pyr
azi
ne
Fura
nm
eth
an
ol
2,5
-Dim
eth
ylp
yra
zin
e
Ma
lto
l
2,4
-De
cad
ien
al
No
na
na
l
Pyr
azi
ne
Alk
an
es
B)
A)
Figure 18: Chromatograms of extruded wheat starch, containing 6% whey protein and
4% glucose, processed at 160°C. A): headspace sampling with subsequent
quadrupole GC/MS, B): liquid-liquid extraction/SAFE distillation with sub-
sequent sector field GC/MS.

Results and Discussion 69
Table 12: Aroma active volatiles detected in extruded wheat starch samples containing
different proteins and sugars, processed at 160°C, isolated by DHS and
LLE-SAFE
DHS LLE-SAFE Constituents
M/C M/G W/G M/C M/G W/G
Pyrazines
pyrazine x x x n.d. n.d. n.d.
methylpyrazine n.d. x x x x x
2,5-dimethylpyrazine n.d. x x x x x
Aldehydes
2-methylbutanal x x x n.d. n.d. n.d.
3-methylbutanal x x x n.d. n.d. n.d.
2-methylpentanal x x x n.d. n.d. n.d.
hexanal x x x x x x
furancarboxaldehyde x x x x x x
benzaldehyde n.d. n.d. n.d. x x x
2,4-decadienal n.d. n.d. n.d. x x x
heptanal x x x x x x
nonanal x x x x x x
Alcohols
butanol x x x x x x
pentanol x x x x x x
furanmethanol x x x x x x
2,3-butanediol n.d. n.d x n.d. n.d. x
Acids
acetic acid x x x n.d. n.d. n.d.
butyric acide x x x x x x
2 methyl butyric acid n.d. n.d. n.d. x x x
pentanoic acid n.d. n.d. n.d. x x x
hexanoic acid n.d. n.d. n.d. x x x
Ketones
1-hydroxy-2-propanone x x x x x x
2,3-pentanedione x x x x x x
3-hydroxy-2-butanone x x x x x x
4 hydroxy-4-methyl-2-pentanone x x x x x x
Furanones / Pyranones
dihydro-2-methyl-2(3H)-furanone x n.d. n.d x x x
maltol n.d. n.d. n.d. x x x
Furanes / Pyranes
3,4 dihydropyran n.d. n.d. n.d. x x x
2-pentylfuran x x x x x x
x detected n.d. not detected M/C milk protein/glucose syrup M/G milk protein/glucose W/G whey protein/glucose

Results and Discussion 70
Various reasons are conceivable why those compounds have not been found by GC/MS
and previous extraction/distillation. On the one hand, multiple preparation steps may
have led to a loss of high-volatile compounds. On the other hand, the used separation
column might have promoted the separation of less-volatile compounds at the expense
of the high-volatiles.
However, different components were detected in samples prepared by LLE-SAFE that
have not been found by headspace analysis. As an example, diverse acids,
2,4-decadienal, and maltol should be named. Additionally, vanillin was detected in sev-
eral samples in trace amounts but should only be mentioned for the purpose of informa-
tion. It represents a potent flavor compound that is not volatile enough to be detected by
headspace analysis.
It was found that both analysis techniques come along with advantages and disadvan-
tages. None is unambiguously preferable over the other.
On the one hand, headspace analysis offers a rapid analytical method for detecting vola-
tile compounds. The use of an autosampler enables the analysis of up to 50 samples via
headspace-GC/MS within 24 to 48 hours and makes headspace-GC/MS a versatile tool
for industrial flavor analysis. However, less-volatile flavor compounds remain unde-
tected, limiting an accurate analysis.
On the other hand, extraction/distillation is a very time consuming technique that re-
quired at least 24 h for preparation. Additionally, a maximum of 2 samples could be
handled at the same time. One advantage lies within the detection of important less-
volatile flavor compounds. Furthermore, the final analyte contained higher yields of
volatile constituents due to a longer extraction time, resulting in an increased chance of
detection. This is confirmed by findings from Park et al. [86]. Verification within this
study remains complicated since quantification of the detected flavor compounds was
made differently, depending on the preparation technique. 4-hepatanone was used as an
internal standard during headspace analysis, while 1-octanol and different specific iso-
topic labeled standards were used for LLE-SAFE analysis. Comparing obtained concen-
trations of different analytical methods would not be expressive. A closer explanation is
given in 4.1.2. Only 2,5-dimethylpyrazine can confirm the conclusion. In general, it
was detectable by headspace as well as by LLE-SAFE analysis. While it was found in
small amounts in every sample of the milk protein/glucose syrup design when prepared
by extraction/distillation, it could not be detected by headspace analysis.
After all, none of the used preparation techniques showed definite advantages against
the other regarding a complete picture of generated flavor compounds. It depends on the
individual demands which technique is to prefer over the other. However, regarding
time consumption and effectiveness, headspace sampling remains the technique of
choice.

Results and Discussion 71
4.1.2 Quantification by Internal Standards Compared to Stable Isotope
Dilution Analysis (SIDA)
Quantification by common internal standards was compared to the relatively new
method of stable isotope dilution analysis. The aim was to investigate in how far results
obtained by the use of common internal standards differ from the most accurate results
obtained by isotopic labeled reference compounds. As mentioned in 2.4.3.2, iso-
topomeres of investigated flavor compounds were used. As well as the common stan-
dard they were added in fixed amounts to the sample at the beginning of the preparation
process. Unlike usual standards, isotopomeres react the same way as their comparable
analytes. By determining the concentrations of the investigated flavor compound and its
dedicated isotopomere, an accurate quantification was possible. However, it has to be
considered that isotopic labeled standards are not available on the market for every
chemical compound.
Beside isotopic standards, 4-heptanone and 1-octanol were used as usual standards.
Both were selected since they did not occur naturally in the sample material. Further-
more, they were easily detectable by GC/MS and did not interfere with other com-
pounds. 4-heptanone and 1-octanol were used for quantification of all detected com-
pounds. The degree of loss during sample preparation is different for every compound.
Therefore, only relative changes of analyte concentrations could be described, referring
to the internal standard.
As a compromise between isotopic labeling and the use of a one and only internal stan-
dard, unlabeled trimethylpyrazine was added. It did not appear in detectable concentra-
tions in the original samples and was used for quantification of pyrazines only. An ex-
pressive evaluation was possible since all pyrazines react almost in the same way during
sample preparation. Thus, losses could have been ideally compensated. Differences in
real concentrations, found by stable isotope dilution analysis and quantification by
trimethylpyrazine (TMP), and estimated concentrations, referring to 1-octanol, are
shown in Table 13 for samples containing milk protein and glucose syrup, using the
example of methylpyrazine, 2,5-dimethylpyrazine, and butyric acid. The factors indicate
the deviations of 1-octanol from the corresponding specific standard.
It was found that quantifications made by stable isotope dilution analysis, or rather
TMP, and common internal standards showed significant variations between the calcu-
lated concentrations. Higher concentrations were detected when the evaluation was
based on the internal standard 1-octanol. Excluding the outliers, methylpyrazine and
2,5-dimethylpyrazine showed 4 to 8 times higher concentrations compared to evaluation
related to TMP. Less pronounced variations were found for butyric acid at factors rang-
ing from 1.3 to 2.4. The stronger variation of factors ranging from 4 to 8 for pyrazines is
explainable differently. On the one hand it is due to the reaction behavior during sample

Results and Discussion 72
preparation. Thereby, the analytical loss of pyrazines is different to those of 1-octanol
which was found to be more similar to butyric acid, resulting in minor variations. On
the other hand, pyrazines are present in smaller amounts. Quantification was made by
comparing the peak area of the compound of interest with the one of the standard. Thus,
the smaller the peak area, the bigger is the chance of stronger variations due to higher
impacts of inexact calculations.
Table 13: Comparison of concentrations of selected compounds in extrudate samples
produced according to a milk protein/glucose syrup design, determined by
TMP or SIDA and 1-octanol
Sample Methylpyrazine [ppm]
Factor
2,5-Dimethylpyrazine [ppm]
Factor
Butyric Acid [ppm]
FactorTemp. [°C]
Protein [%]
Sugar [%]
TMP 1-Octanol TMP 1-Octanol SIDA 1-Octanol
140
1.3 2 0.36 1.94 5.4 0.08 0.41 5.1 14.10 23.50 1.7
1.3 6 0.00 0.00 0.00 0.00 12.80 1.11 0.1
2.6 2 0.28 2.33 8.3 0.06 0.54 9.0 3.00 7.25 2.4
2.6 6 0.30 1.90 6.3 0.06 0.35 5.8 1.90 4.37 2.3
160
0 4 0.12 0.70 5.8 0.02 0.13 6.5 2.70 3.83 1.4
1.3 4 0.39 1.68 4.3 0.10 0.44 4.4 25.40 46.70 1.8
2 0 0.57 3.29 5.8 0.12 0.69 5.8 11.70 49.25 4.2
2 4 0.57 4.04 7.1 0.10 0.73 7.3 20.10 67.50 2.3
2 8 0.32 2.61 8.2 0.06 0.48 8.0 9.90 46.25 4.7
2.6 4 0.35 2.46 7.0 0.07 0.53 7.6 5.00 11.43 2.3
180
1.3 2 0.63 2.72 4.3 0.15 0.66 4.4 26.20 36.64 1.4
1.3 6 0.14 0.60 4.3 0.04 0.15 3.8 2.60 3.46 1.3
2.6 2 0.70 2.09 3.0 0.17 0.70 4.1 22.50 38.87 1.7
2.6 6 0.46 2.34 5.1 0.09 0.40 4.4 27.4 47.02 1.7
Average Factor 5.8 5.9 2.3
SIDA - stable isotope dilution analysis TMP – trimethylpyrazine outliers marked in grey
As can be seen in Figure 19, quantification by trimethylpyrazine as well as by 1-octanol
showed similar curve progressions for the formation of pyrazines depending on differ-
ent protein concentrations. An additional analysis of variance was made to check on the
stability of the results obtained. This was necessary to see whether variations which are
due to the use of 1-octanol could be easily compensated by including a compensative
factor or not. The results are depicted for methylpyrazine in Figure 20 and for
2,5-dimethylpyrazine in Figure 21. Analysis was made using a linear model as it prom-
ised the most appropriate fit and was suggested by DesignExpert®. Comparisons of the
coefficients of determination (R2) showed higher stabilities when using TMP as quanti-
fication standard. Its stability was found to be 70% higher when quantifying

Results and Discussion 73
methylpyrazine and 14% higher when quantifying 2,5-dimethylpyrazine. By that, the
use of a compensative factor can be ruled out.
0
1
2
3
4
5
1,3 2 2,6
Conc
entr
atio
n [p
pm]
Protein [%]
Concentrations of Methylpyrazine and 2,5-Dimethylpyrazine at
Different Quantification Methods
Methylpyrazine (TMP)
Methylpyrazine (1-Octanol)
2,5-Dimethylpyrazine (TMP)
2,5-Dimethylpyrazine (1-Octanol)
1.3 2.0 2.6
Figure 19: Influence of different quantification methods on the determined concentra-
tion of methylpyrazine and 2,5-dimethylpyrazine in milk protein/glucose
syrup samples containing 4% sugar and differing protein content, processed
at 160°C.
Co
nce
ntr
atio
n [
pp
m]
Protein [%]
Barrel Temperature [%]
1-Octanol
R²=0.416
TMP
R²=0.703
Figure 20: Comparison of methylpyrazine concentration in milk protein/glucose syrup
samples containing 4% glucose syrup obtained by quantification using 1-
octanol and trimethylpyrazine (TMP).
Meth
ylp
yra
zin
e

Results and Discussion 74
1-Octanol
R²=0.660
TMP
R²=0.742
Barrel Temperature [°C]
Protein [%]
2,5
-Dim
eth
ylp
yra
zin
e
Co
nce
ntr
ati
on
[p
pm
]
Figure 21: Comparison of 2,5-dimethylpyrazine concentration in milk protein/glucose
syrup samples containing 4% glucose syrup obtained by quantification using
1-octanol and trimethylpyrazine (TMP).
Butyric acid is affected differently. Its loss during sample preparation and analysis is
more similar to that of 1-octanol, resulting in lower variations with an average factor of
2.3. That means that evaluation showed about twice as much butyric acid when quanti-
fication was made by comparing the peak area of butyric acid with the one of 1-octanol
than with the one of isotopic 13C-butyric acid. Figure 22 shows the development of bu-
tyric acid concentration at varied concentrations of milk protein for both quantification
approaches. Again, similar curve progressions were found.
As for the examined pyrazines, analysis of variance was made to look for the stability of
both attempts of quantification. This time a quadratic model was suggested and chosen,
promising the most appropriate fit.
The obtained coefficients of determination, as can be seen in Figure 23, were found to
be identical with R2=0.740 using SIDA, or rather R2=0.742 using 1-octanol. Thus, in
case of butyric acid, stable isotope dilution analysis did not show advantages over the
common standard 1-octanol regarding statistic stability of the obtained quantification
results. Differences in the calculated amounts of butyric acid, using 1-octanol as stan-
dard, can be corrected by a recalculation using the compensation factor.
2,5
-Dim
eth
ylp
yra
zin
e

Results and Discussion 75
0
20
40
60
80
1,3 2 2,6
Conc
entr
atio
n [p
pm]
Protein [%]
Concentrations of Butyric Acid at Different Quantification Methods
SIDA
1-Octanol
1.3 2.0 2.6
Figure 22: Influence of different quantification methods on the determined concentra-
tion of butyric acid in milk protein/glucose syrup samples containing 4%
sugar and differing in protein content, processed at 160°C.
Barrel Temperature [°C]Protein [%]
Bu
tyri
c A
cid
Co
nce
ntr
atio
n [
pp
m]
SIDA
R²=0.740
1-Octanol
R²=0.742
Figure 23: Comparison of butyric acid concentration in milk protein/glucose syrup sam-
ples containing 4% glucose syrup quantified by using the standards 1-octanol
and C13 labeled butyric acid (stable isotope dilution analysis, SIDA).
Summarizing it can be concluded that the use of conventional internals standards can
help determine general effects caused by different process conditions or ingredient
compositions. However, an accurate quantification as it is often necessary in flavor
analysis is difficult. It was found that the use of a compensating factor becomes possible
if analysis of variance shows high and comparable coefficients of determination. How-

Results and Discussion 76
ever, such a factor has to be calculated for each compound individually every time a
new sample preparation technique or a new GC/MS is used. Precious data can only be
obtained immediately by using SIDA or selected chemical compounds. As mentioned
previously, the latter must not naturally occur in the sample material and have to show
the same reactive behaviors and losses during sample preparation and analysis as the
examined compounds. Ideally, they should be closely related to the examined com-
pound. Finding such compounds is complicated, making trimethylpyrazine as it was
used within this study a rare exception. Its use was possible due to the fact that the ana-
lyzed samples within this model study contained starch, sugar, and protein only. The
varieties and total amounts of flavor compounds were comparatively low. Traditionally
extruded cereal products, containing whole flours, would show a multiple.
4.2 Influence of Process Parameters on Product Parameters
Eight aroma potent compounds were selected and analyzed regarding their formation
depending on changeable process parameters.
Methylpyrazine and 2,5-dimethylpyrazine were analyzed since their appearance is of
the utmost importance for roasted and toasted flavor impressions. Furthermore it is well
known that the Maillard reaction is an important pathway for generating pyrazines and
their formation is positively influenced by protein and high temperatures. The same
applies to maltol, which provides a caramel-like sweet odor and, depending upon its
concentration, a bread-like taste. Additionally, maltol acts as a flavor enhancer, primar-
ily intensifying sweetness. Furanmethanol is a typical sugar degradation product de-
scribed in literature as temperature dependent with a slightly caramel-like up to burning
odor [59]. 2,4-decadienal are breakdown products of fatty acids and indicators of oxida-
tion processes. The influence on the formation of butyric acid, pentanoic acid, and hex-
anoic acid, as representatives of carboxylic acids, was of interest since they might con-
tribute to the overall flavor of the final product. Seen alone, carboxylic acids represent
off-flavor compounds providing fatty-rancid odors.
For broad and expressive evaluations, an accurate knowledge of the concentration
within the sample is necessary. Beside maltol, all analyses and evaluations are based on
quantification results obtained by the use of SIDA or TMP as internal standards. Maltol
was quantified with the help of the internal standard 1-octanol. Because of the previ-
ously mentioned disadvantages of unspecific standards, the obtained results can only
provide tendencies in how changeable parameters influence then formation of maltol
without giving precious concentrations. The results for the 3 designs using whey pro-
tein/glucose, milk protein/glucose and milk protein/glucose syrup are shown in
Table 14 to Table 16. The statistical analyses regarding the influential properties of
changeable process parameters are given in Table 17 to Table 19.

Results and Discussion 77
Table 14: Concentration of selected flavor compounds in extrudate samples produced
according to a whey protein/glucose design, all results in ppm
TrialTemperature
[°C]Protein
[%]Sugar [%]
Methyl-pyrazine
2,5 Dimethyl-pyrazine
Furan-methanol
Maltol
2,4-Decadienal
Butyric Acid
Pentanoic Acid
Hexanoic Acid
E,E E,Z totalW
hey
Prot
ein/
Glu
cose
140 1.3 2 0.66 0.21 2.16 0.93 0.70 3.76 4.45 25.94 5.65 4.92
140 1.3 6 0.42 0.11 1.61 0.57 1.20 3.73 4.92 31.40 8.01 8.06
140 2 4 0.56 0.24 2.24 1.17 0.68 2.84 3.53 27.05 6.24 5.73
140 2.6 2 0.81 0.40 3.17 1.92 0.26 1.84 2.10 25.61 5.73 5.68
140 2.6 6 0.58 0.17 1.87 0.47 0.58 3.13 3.71 25.23 5.58 4.27
160 0 0 0.31 0.14 4.64 0.66 2.60 9.21 11.82 24.48 5.22 4.42
160 0 4 0.41 0.05 1.31 0.00 4.31 7.13 11.44 29.68 3.77 3.20
160 1.3 4 1.69 0.23 2.30 0.53 1.17 4.23 5.39 28.94 2.78 2.08
160 2 0 0.77 0.58 8.67 2.59 0.66 3.62 4.28 21.83 4.02 3.91
160 2 4 2.08 0.32 2.91 0.76 1.51 5.84 7.34 26.05 2.58 1.56
160 2 8 0.68 0.09 1.53 0.75 1.64 5.41 7.06 24.52 2.58 2.05
160 2.6 4 2.09 0.35 3.12 1.23 0.68 3.06 3.74 27.68 2.48 1.87
180 1.3 2 1.14 0.40 3.47 2.54 1.01 4.35 5.36 31.14 7.40 7.50
180 1.3 6 0.78 0.18 2.21 0.77 1.24 3.45 4.69 27.02 5.40 4.72
180 2 4 1.14 0.39 3.61 1.95 0.73 2.35 3.08 28.60 6.23 5.92
180 2.6 2 1.76 0.76 6.24 3.32 0.34 1.83 2.17 28.43 5.73 5.74
180 2.6 6 0.83 0.19 2.56 1.15 0.39 1.91 2.29 27.80 6.40 5.70
Table 15: Concentration of selected flavor compounds in extrudate samples produced
according to a milk protein/glucose design, all results in ppm
TrialTemperature
[°C]Protein
[%]Sugar [%]
Methyl-pyrazine
2,5 Dimethyl-pyrazine
Furan-methanol
Maltol
2,4-Decadienal
Butyric Acid
Pentanoic Acid
Hexanoic Acid
E,E E,Z total
Milk
Pro
tein
/Glu
cose
140 1.3 2 0.59 0.15 7.83 5.27 1.65 4.31 5.97 31.61 8.98 10.03
140 1.3 6 0.28 0.07 3.82 2.89 2.40 4.86 7.25 32.41 9.67 9.70
140 2 4 0.47 0.11 18.27 5.89 1.47 3.54 5.01 30.01 7.61 8.27
140 2.6 2 0.50 0.15 20.15 9.80 0.85 3.01 3.87 28.85 6.60 7.23
140 2.6 6 0.58 0.09 8.12 5.53 0.99 2.99 3.98 27.17 5.20 6.10
160 0 4 0.68 0.08 1.75 2.48 4.09 6.91 11.00 23.45 2.90 1,83
160 1.3 4 1.21 0.16 6.64 2.42 2.23 6.21 8.45 28.99 3.66 2.76
160 2 0 0.49 0.13 35.70 11.06 1.05 3.31 4.36 28.40 5.18 5.67
160 2 4 1.35 0.17 12.13 2.90 1.59 4.58 6.18 29.24 3.54 2.78
160 2 8 0.64 0.09 4.99 1.12 2.38 6.08 8.46 24.24 3.98 3.93
160 2.6 4 1.19 0.19 15.40 3.69 1.46 4.45 5.91 28.42 3.55 3.59
180 1.3 2 0.65 0.22 12.56 5.45 1.29 4.23 5.52 28.38 6.74 5.61
180 1.3 6 0.48 0.11 4.99 2.21 1.37 3.78 5.15 29.98 9.70 8.82
180 2 4 0.78 0.21 22.95 7.05 1.01 3.45 4.47 28.80 7.49 6.92
180 2.6 2 1.45 0.36 56.18 15.87 0.73 2.74 3.47 29.83 6.98 7.10
180 2.6 6 0.64 0.18 17.58 4.87 0.84 2.90 3.74 26.99 6.55 6.17

Results and Discussion 78
Table 16: Concentration of selected flavor compounds in extrudate samples produced
according to a milk protein/glucose syrup design, all results in ppm
TrialTemperature
[°C]Protein
[%]Sugar [%]
Methyl-pyrazine
2,5 Dimethyl-pyrazine
Furan-methanol
Maltol
2,4-Decadienal
Butyric Acid
Pentanoic Acid
Hexanoic Acid
E,E E,Z totalM
ilk P
rote
in/C
orn
Syru
p
140 1.3 2 0.36 0.08 8.13 3.14 1.09 3.61 4.70 14.15 2.83 7.78
140 1.3 6 0.00 0.00 7.09 1.42 0.95 3.84 4.79 12.78 26.32 326.32
140 2 4 0.21 0.05 10.30 3.33 1.02 3.46 4.48 7.97 7.97 90.76
140 2.6 2 0.28 0.06 16.42 5.88 0.96 3.64 4.59 3.05 1.84 21.05
140 2.6 6 0.30 0.06 9.41 2.83 1.01 3.25 4.26 1.90 0.89 7.91
160 0 4 0.12 0.02 1.35 0.46 3.03 6.45 9.48 2.71 1.05 4.82
160 1.3 4 0.39 0.10 12.48 9.08 1.88 6.97 8.85 25.43 4.72 5.88
160 2 0 0.57 0.12 27.78 11.13 0.97 3.33 4.31 11.65 1.82 2.20
160 2 4 0.57 0.10 16.04 14.28 1.75 6.34 8.09 29.10 5.31 6.04
160 2 8 0.32 0.06 7.29 2.75 1.49 4.52 6.01 9.94 1.88 2.91
160 2.6 4 0.35 0.07 17.79 4.72 0.79 2.85 3.64 4.97 1.17 6.64
180 1.3 2 0.63 0.15 19.26 9.52 1.11 4.14 5.25 26.22 5.56 5.65
180 1.3 6 0.14 0.04 4.65 2.61 1.60 5.01 6.61 2.55 1.42 15.06
180 2 4 0.48 0.11 18.90 6.53 1.00 3.84 4.84 19.65 4.21 8.12
180 2.6 2 0.70 0.17 31.45 9.26 0.66 3.06 3.72 22.49 4.10 5.23
180 2.6 6 0.46 0.09 19.91 4.79 0.75 3.15 3.90 27.36 5.77 6.55
Table 17: Regression coefficients and coefficients of determination for the influence of
process parameters on selected flavor compounds using whey protein and
glucose
Source Factor Methyl
pyrazine
2,5-Dimethyl
pyrazine
Furan
methanol Maltol
2,4-
Decadienal
Butyric
Acid
Pentanoic
Acid
Hexanoic
Acid
Model - +1.832) +0.323) +3.161) +0.942) +6.231) +26.28 +2.702) +1.871)
A +0.261) +0.0793) +0.702) +0.473) -0.11 +0.78 -0.0043 +0.091
B +0.14 +0.0753) +0.521) +0.282) -1.081) -0.97 -0.33 -0.40 Linear
C -0.18 -0.143) -1.042) -0.663) +0.29 +0.17 +0.017 -0.20
A2 -0.862) +0.0012 -0.36 +0.531) -2.382) +1.43 +3.493) +3.802)
B2 +0.18 -0.023 -0.58 -0.15 -1.11 +1.92 -0.12 -0.049 Quadratic
C2 -0.31 +0.011 +0.72 +0.17 +0.83 -1.78 +0.19 +0.24
AB +0.044 +0.014 +0.23 +0.032 -0.25 +0.57 +0.21 +0.28
AC -0.10 -0.0582) -0.39 -0.271) -0.33 -1.231) -0.44 -0.57 Interactive
BC -0.071 -0.0592) -0.40 -0.19 +0.24 -0.29 +0.020 -0.23
Coefficient of
Determination 0.9350 0.9816 0.9209 0.9660 0.8919 0.8162 0.9284 0.8941
Bold values indicate significance (1) P>95%, 2) P>99%, 3) P>99.9%)
A=barrel temperature, B=protein, C=sugar

Results and Discussion 79
Table 18: Regression coefficients and coefficients of determination for the influence of
process parameters on selected flavor compounds using milk protein and
glucose
Source Factor Methyl
pyrazine
2,5-Dimethyl
pyrazine
Furan
methanol Maltol
2,4-
Decadienal
Butyric
Acid
Pentanoic
Acid
Hexanoic
Acid
Model - +1.19 +0.162) +14.122) +3.382) +6.452) +28.691) +3.712) +3.172)
A +0.16 +0.0522) +5.611) +0.61 -0.37 -0.61 -0.059 -0.67
B +0.12 +0.0273) +8.162) +2.152) -1.143) -1.012) -0.992) -0.67 Linear
C -0.11 -0.0462) -7.762) -2.593) +0.34 -0.42 +0.12 -0.005
A2 -0.491) +0.00251 +5.50 -2.851) -1.852) +0.99 +3.773) +4.233)
B2 -0.085 +0.020 -4.09 -0.56 +0.59 +0.29 -0.18 -0.19 Quadratic
C2 -0.16 -0.019 +1.13 +0.88 -0.29 -0.63 +0.28 +0.43
AB +0.093 +0.024 +4.951) +0.74 +0.24 +0.811) +0.49 +0.65
AC -0.096 -0.020 -3.76 -0.95 -0.19 -0.046 +0.41 +0.47 Interactive
BC -0.032 -0.006 -4.881) -1.211) -0.067 -0.871) -0.691) -0.62
Coefficient of
Determination 0.8484 0.9308 0.9387 0.9416 0.9325 0.8879 0.9609 0.9430
Bold values indicate significance (1) P>95%, 2) P>99%, 3) P>99.9%)
A=barrel temperature, B=protein, C=sugar
Table 19: Regression coefficients and coefficients of determination for the influence of
process parameters on selected flavor compounds using milk protein and
glucose syrup
Source Factor Methyl
pyrazine
2,5-Dimethyl
pyrazine
Furan
methanol Maltol
2,4-
Decadienal
Butyric
Acid
Pentanoic
Acid
Hexanoic
Acid
Model - +0.491) +0.0981) +16.013) +11.23 +7.16 +22.74 +4.18 +5.62
A +0.132) +0.0311) +4.283) +1.61 +0.15 +5.48 -1.88 -41.32
B +0.054 +0.0079 +4.373) +0.17 -1.011) -2.14 -2.71 -31.3 Linear
C -0.122) -0.0312) -4.453) -2.03 +0.21 -2.22 +2.01 +31.65
A2 -0.11 -0.013 -1.40 -4.781) -2.031) -5.75 +2.47 +44.04
B2 -0.086 -0.006 -0.86 -2.81 -0.45 -4.36 -0.67 +0.85 Quadratic
C2 +0.05 +0.0007 +0.79 +0.90 -0.068 +0.39 -0.036 -1.11
AB +0.021 +0.003 +2.111) -0.28 -0.45 +5.38 +3.66 +37.03
AC -0.048 -0.014 -2.261) -0.83 +0.22 -2.03 -3.13 -36.83 Interactive
BC +0.0801) +0.013 -0.36 +0.14 +0.20 +3.59 -2.33 -42.47
Coefficient of
Determination 0.9120 0.9199 0.9727 0.8137 0.7744 0.7196 0.7513 0.8164
Bold values indicate significance (1) P>95%, 2) P>99%, 3) P>99.9%)
A=barrel temperature, B=protein, C=sugar

Results and Discussion 80
The statistical evaluation showed distinct differences in how process parameters affect
the formation of different flavor compounds. Those differences will be displayed, ana-
lyzed, and evaluated in detail on selected flavor compounds within the following chap-
ters.
4.2.1 Influences on Pyrazine Formation
The group of pyrazines, represented by methylpyrazine and 2,5-dimethylpyrazine, was
found to be significantly influenced by increasing temperatures. As can be seen in
Figure 26, the amount of methylpyrazine rose intensely when temperature was in-
creased from 140°C to 160°C. While already starting with the highest concentration at
140°C, the rate of increase for whey protein/glucose samples was around 400%. Milk
protein samples still showed a 1.5 times higher concentration of methylpyrazine at
160°C compared to those generated at 140°C. A further elevation of temperature to
180°C led to a decreasing methylpyrazine formation. Whereas higher concentrations at
160°C were expected and were in line with reviewed literature [31, 44], the detected
decrease at 180°C has not been reported yet. A possible reason is a higher degree of
degradation processes, leading to the formation of other chemical compounds.
This effect was exclusively to be found for methylpyrazine. 2,4-dimethypyrazine
showed the expected increase at 160°C as well as at 180°C. (Figure 27) Again, this
general trend was independent from the protein or sugar used, with approximately
2 times higher amounts at 180°C compared to those at 140°C. However, the kind of
protein and sugar played an important role for the total amounts of detected
2,5-dimethylpyrazine. As can be seen in Figure 24, comparing analyses of both designs
using glucose clearly showed higher amounts when whey protein was used instead of
milk protein. At all temperatures, their concentrations were about twice as high. Beside
possible differences in the quantity of available nitrogen from the protein, necessary for
nitrogen containing heterocyclic pyrazines, additional sugar from the protein source
milk powder has to be taken into account. The free carbonyl groups of reducing sugars
easily react with free nitrogen, generating a broad spectrum of chemical compounds
beside pyrazines. Hence, higher degrees of sugar negatively influence the pyrazine for-
mation.
Beside temperature and the kind of protein used, the formation of pyrazines was found
to be influenced by the type of sugar as can be seen for 2,5-dimethylpyrazine in
Figure 25. 2,5-dimethylpyrazine as well as methylpyrazine showed significantly higher
degrees of generation when glucose was used instead of glucose syrup.

Results and Discussion 81
2,5
-Dim
eth
ylp
yraz
ine
Co
nce
ntr
atio
n [
pp
m]
Barrel Temperature [°C] Sugar [%]
Whey Protein/Glucose
Milk Protein/Glucose
Figure 24: Influence of different proteins of constant concentration of 2% in the recipe
on the formation of 2,5-dimethylpyrazine in dependence on sugar content
and barrel temperature.
2,5
Dim
eth
ylp
yraz
ine
Co
nce
ntr
atio
n [
pp
m]
Barrel Temperature [°C]Protein [%]
Milk Protein/Corn Syrup
Milk Protein/Glucose
Figure 25: Influence of different sugars of constant concentration of 4% in the recipe on
the formation of 2,5-dimethylpyrazine in dependence on protein content and
barrel temperature.
Milk Protein/Glucose Syrup
Milk Protein/Glucose
Milk Protein/Glucose
Whey Protein/Glucose

Results and Discussion 82
Irrespective of the temperature, the amounts of pyrazine generated in glucose systems
were about twice as high as when using glucose syrup due to its higher reducing power
(as can be seen in Figure 26 and Figure 27).
Figure 26: Influence of barrel temperature on methylpyrazine formation at constant pro-
tein (2%) and sugar (4%) contents.
Figure 27: Influence of barrel temperature on 2,5-dimethylpyrazine formation at con-
stant Protein (2%) and sugar (4%) contents.
Glucose as well as glucose syrup can act as catalysts for pyrazine formation within the
Maillard reaction since both are, or rather contain, reducing sugars. Glucose syrup is a
complex sugar, containing molecules of different length resulting in a limited reducing
power of about 30% compared to glucose. In contrast, glucose only consists of single
Whey Protein /
Glucose
Milk Protein /
Glucose
Milk Protein /
Glucose Syrup
Whey Protein /
Glucose
Milk Protein /
Glucose
Milk Protein /
Glucose Syrup

Results and Discussion 83
glucose molecules, offering more reactive carbonyl groups. Hence, glucose favors the
Maillard reaction at greater rates than glucose syrup and thereby the pyrazine genera-
tion.
The direct influence of different sugar contents on the formation of methylpyrazine and
2,5-dimethylpyrazine at 2% protein constantly for all designs is shown in Figure 28 to
Figure 30. All samples were extruded at 160°C.
0,0
0,5
1,0
1,5
2,0
2,5
0 2 4 6 8
Conc
entr
atio
n [p
pm]
Sugar Content [%]
Influence of Glucose at 2% Whey Protein
Methylpyrazine
2,5 Dimethpyrazine
0.0
0.5
1.0
1.5
2.0
2.5
Figure 28: Concentration of methylpyrazine and 2,5-dimethylpyrazine depending on the
amount of glucose at a constant whey protein content (2%), processed at
160°C.
0,0
0,5
1,0
1,5
2,0
2,5
0 2 4 6 8
Conc
entr
atio
n [p
pm]
Sugar Content [%]
Influence of Glucose at 2% Milk Protein
Methylpyrazine
2,5 Dimethpyrazine
0.0
0.5
1.0
1.5
2.0
2.5
Figure 29: Concentration of methylpyrazine and 2,5-dimethylpyrazine depending on the
amount of glucose at a constant milk protein content (2%), processed at
160°C.

Results and Discussion 84
0,0
0,5
1,0
1,5
2,0
2,5
0 2 4 6 8
Co
nce
ntra
tio
n [
pp
m]
Sugar Content [%]
Influence of Corn Syrup at 2% Milk Protein
Methylpyrazine
2,5 Dimethpyrazine
0.0
0.5
1.0
1.5
2.0
2.5
Figure 30: Concentration of methylpyrazine and 2,5-dimethylpyrazine depending on the
amount of glucose syrup at a constant milk protein content (2%), processed
at 160°C.
What becomes visible is the complex influence of sugar within the process of pyrazine
formation. While 2,5-dimethylpyrazine formation is significantly negatively influenced
by increasing amounts of sugar, methylpyrazine increased with glucose and remained
constant with glucose syrup until reaching a total sugar concentration of 4%. Further
increasing sugar contents resulted in an intensely decreasing methylpyrazine formation.
As mentioned previously, the most likely explanation can be found in an intensified
consumption of nitrogen by the excess of free carbonyl groups of the sugar to form dif-
ferent nitrogen containing chemical compounds. Additionally, higher degrees of sugar
tend to lower the extrusion temperature as explained in 4.3. However, this cannot be an
explanation on its own since the decrease would be expected to be consistently.
The last changeable parameter was protein. Especially 2,5-dimethylpyrazine was sig-
nificantly positively influenced by increasing amounts of whey as well as milk protein,
whereas the influence on methylpyrazine formation did not show any statistical cer-
tainty due to inconsistent increases. (Table 17 to Table 19)
The effect of increasing protein contents at 4% sugar constantly is shown in Figure 31
to Figure 33.
Influence of Glucose Syrup at 2% Milk Protein

Results and Discussion 85
0,0
0,5
1,0
1,5
2,0
2,5
0 0,6 1,3 2 2,6
Co
nce
ntr
atio
n [
pp
m]
Protein Content [%]
Influence of Whey Protein at 4% Glucose
Methylpyrazine
2,5 Dimethpyrazine
0.6 1.3 2.00.0
0.0
0.5
1.0
1.5
2.0
2.5
2.6
Figure 31: Concentration of methylpyrazine and 2,5-dimethylpyrazine depending on the
amount of whey protein at a constant glucose content (4%), processed at
160°C.
0,0
0,5
1,0
1,5
2,0
2,5
0 0,6 1,3 2 2,6
Co
nce
ntr
atio
n [
pp
m]
Protein Content [%]
Influence of Milk Protein at 4% Glucose
Methylpyrazine
2,5 Dimethpyrazine
0.6 1.3 2.00.00.0
0.5
1.0
1.5
2.0
2.5
2.6
Figure 32: Concentration of methylpyrazine and 2,5-dimethylpyrazine depending on the
amount of milk protein at a constant glucose content (4%), processed at
160°C.

Results and Discussion 86
0,0
0,5
1,0
1,5
2,0
2,5
0 0,6 1,3 2 2,6
Co
nce
ntr
atio
n [
pp
m]
Protein Content [%]
Influence of Milk Protein at 4% Corn Syrup
Methylpyrazine
2,5 Dimethpyrazine
2.60.0
0.5
1.0
1.5
2.0
2.5
0.6 1.3 2.00.0
Figure 33: Concentration of methylpyrazine and 2,5-dimethylpyrazine depending on the
amount of milk protein at a constant glucose syrup content (4%), processed
at 160°C.
In contrast to statistical evaluation, increasing amounts of protein from 0 to 2.6%
showed distinct influences on the formation of methylpyrazine as well as of
2,5-dimethylpyrazine. Whey protein showed the strongest impact on the total amounts
as well as on the rate of increases compared to milk protein. When using whey protein,
methylpyrazine quintupled from 0.41 ppm at 0% protein to 2.09 ppm at 2.6% protein
while 2,5-dimethylpyrazine increased from 0.05 to 0.35 ppm, a sevenfold increase.
Samples containing milk protein and glucose started at similar levels of pyrazines.
However, the increase was only about 60% compared to that of whey protein samples.
The methylpyrazine content reached its maximum with 1.35 ppm at 2%, followed by a
decrease at 2.6% protein. The same applied to samples containing milk protein and glu-
cose syrup. By quintupling the total amount of methylpyrazine, the maximum concen-
tration was reached at 2% protein, followed by a decrease at 2.6%. The total increase in
2,5-dimthylpyrazine was similar to that of methylpyrazine but did not show that signifi-
cant drop at 2.6% protein as methylpyrazine did in designs using milk protein.
Again, the abrupt decrease in methylpyrazine at 2.6% protein can be explained by the
additional amounts of sugar from the protein source milk powder. At certain amounts,
the excess of sugar leads to the formation of different nitrogen containing chemical
compounds. Thus, less nitrogen remains to form pyrazines.
Influence of Milk Protein at 4% Glucose Syrup
Results and Discussion 87
4.2.2 Influences on Furanmethanol Formation
Furanmethanol is a typical sugar degradation product, positively influenced by increas-
ing temperatures. It plays a minor role as a flavor compound, but it was found that it
could be produced by the Cannizzaro reaction from furfural, an even more important
aroma compound itself, with a caramel and bread-like flavor [71]. Thus, higher amounts
of furanmethanol may indicate higher furfural concentrations.
Furanmethanol was significantly influenced by all process parameters as can be seen in
Table 17 to Table 19. Temperature and protein positively influenced the formation of
furanmethanol while elevated amounts of sugar led to significant decreases.
The amounts of generated furanmethanol depended strongly on the design or rather the
sugar and protein used. Starting out at concentrations of about 1.5 ppm, detected in
samples without any additional sugar or protein, whey protein/glucose samples reached
a maximum concentration of 8.7 ppm, a nearly sevenfold increase. Replacing whey pro-
tein by milk protein led to an even more distinct increase of up to 56.2 ppm. This more
than 6 times higher maximum value compared to whey protein showed the intense in-
fluence of different proteins. It has to be taken into account that sugar was found to sig-
nificantly decrease the furanmethanol concentration. The fact that using milk powder as
protein source increases the total sugar content, additionally underlines the impact of
milk protein compared to whey protein. Replacing glucose by glucose syrup, using milk
protein further on, resulted in still significant but less intense increases in furanmethanol
formation. The maximum concentration was reached with 31.5 ppm, representing two
fifth of the increase using glucose. A comparison of all 3 designs regarding the influ-
ence of sugar and protein at a constant barrel temperature of 160°C is shown in
Figure 34 and Figure 35.

Results and Discussion 88
0
5
10
15
20
25
30
35
0 2 4 6 8
Co
nce
ntr
atio
n [
pp
m]
Sugar Content [%]
Influence of Different Sugar Concentrations on Furanmethanol Formation
at 2% Protein
Whey Protein / Glucose
Milk Protein / Glucose
Milk Protein / Corn Syrup
Figure 34: Concentration of furanmethanol depending on the amount of sugar at con-
stant protein contents (2%), processed at 160°C.
0
5
10
15
20
25
30
35
0 0,6 1,3 2 2,6
Co
nce
ntr
atio
n [
pp
m]
Protein Content [%]
Influence of Different Protein Concentrations on Furanmethanol
Formation at 4% Sugar
Whey Protein / Glucose
Milk Protein / Glucose
Milk Protein / Corn Syrup
0.6 1.3 2.0 2.60.0
Figure 35: Concentration of furanmethanol depending on the amount of protein at con-
stant sugar contents (4%), processed at 160°C.
Beside the influence of sugar and protein, temperature played an important and signifi-
cant role in furanmethanol formation, as depicted in Figure 36.

Results and Discussion 89
No significant differences in the level of increase were detected from 140°C to 180°C
comparing samples containing whey protein/glucose and milk protein/glucose syrup.
The increase was about 70%. On the contrary, the use of milk protein in combination
with glucose led to an increase of merely 25%. Additionally, an unexpected drop in fu-
ranmethanol concentration was detected at 160°C. This effect could not be explained. It
must be assumed that this might be due to incorrect analytical results. The positive ef-
fect of elevated temperatures on furanmethanol remains definite and is thus in line with
the common state of knowledge. As mentioned previously, furanmethanol may correlate
with furfural concentrations. Both are found to be positively influenced by increasing
temperature and amounts of protein [71]. However, more studies have to be carried out
to confirm this assumption.
Figure 36: Influence of barrel temperature on furanmethanol formation at constant pro-
tein (2%) and sugar (4%) contents.
4.2.3 Influences on 2,4-Decadienal Formation
2,4-decadienal represents a fatty acid aldehyde, characterized by fatty and oily flavor
impressions. It was found in extruded oat flour, responsible for typical off-flavor im-
pressions [115]. The appearance of 2,4-decadienal indicates autoxidation. Thus, a lower
concentration is favorable.
Analysis examined that 2,4-decadienal formation was negatively affected by increasing
protein contents whereas modified amounts of sugar did not show a statistically proven
influence. However, as can be seen in Figure 37, all designs showed an increase in
2,4-decadienal formation until 4% sugar. This increase continued for samples contain-
ing milk protein and glucose until reaching the final sugar content of 8%. The total con-
centration thus nearly doubled from 4.4 to 8.5 ppm. Samples containing combinations
of whey protein and glucose as well as milk protein and glucose syrup, starting out with
Whey Protein /
Glucose
Milk Protein /
Glucose
Milk Protein /
Glucose Syrup

Results and Discussion 90
the highest level of increase, showed a reduced 2,4-decadienal concentration at 6 and
8% sugar. This effect was found to be more pronounced in whey protein/glucose sam-
ples.
The results are ambiguous. An increase as it appeared until 4% sugar and as it continued
in samples using milk protein and glucose was expected. Finding a conclusive reason
for the decreasing concentration is difficult. From the chemical point of view, one may
expect a more or less even increase of 2,4-decadienal at increasing sugar concentrations.
This is due to radicals, formed from sugar by the so called Keto-Enol-Tautomerie and
Fenton reaction. Those reactions are favored by ferric ions and oxygen, available during
extrusion processing. Subsequently, free radicals start autoxidation processes, forming
fatty acid peroxides and carbonyls such as 2,4-decadienal. Every attempted explanation
would raise the question of why milk protein/glucose samples did not show the same
behavior. After all, this question has to remain unanswered. However, it was found that
sugar plays a part in the formation of 2,4-decadienal. Lowest concentrations are attain-
able by using a minimum of additional sugar.
3
4
5
6
7
8
9
10
11
12
0 2 4 6 8
Co
nce
ntr
atio
n [
pp
m]
Sugar Content [%]
Influence of Different Sugar Concentrations on 2,4-Decadienal Formation at
2% Protein
Whey Protein / Glucose
Milk Protein / Glucose
Milk Protein / Corn Syrup
Figure 37: Concentration of 2,4-decadienal depending on the amount of sugar at con-
stant protein contents (2%), processed at 160°C.
As mentioned previously, protein showed a significant negative influence on the forma-
tion of 2,4-decadienal. The concentrations as a function of protein contents between 0%
and 2.6% at a barrel temperature of 160°C and a constant sugar concentration (4%) are
depicted in Figure 38 for all analyzed designs.

Results and Discussion 91
3
4
5
6
7
8
9
10
11
12
0 0,6 1,3 2 2,6
Conc
entr
atio
n [p
pm]
Protein Content [%]
Influence of Different Protein Concentrations on 2,4-Decadienal
Formation at 4% Sugar
Whey Protein / Glucose
Milk Protein / Glucose
Milk Protein / Corn Syrup
0.6 1.3 2.0 2.60.0
Figure 38: Concentration of 2,4-decadienal depending on the amount of protein at con-
stant sugar contents (4%), processed at 160°C.
The changes in concentration were not as even as it was found for pyrazines or furan-
methanol. However, the decrease was still distinct and statistically proven. Lower
2,4-decadienal concentrations at higher protein contents are due to a reduced availabil-
ity of sugar for oxidation processes. More sugar is consumed by protein to form differ-
ent chemical compounds such as pyrazines and furanmethanol. Thus, protein not only
negatively affects the formation of 2,4-decadienal but also positively affects the devel-
opment of different important aroma active compounds.
In contrast to sugar and protein, temperature showed a quadratic influence on the forma-
tion of 2,4-decadienal. This effect, visualized in Figure 39 and Figure 40, was found to
be independent from the sugar-protein composition used. While similar concentrations
were detected in samples processed at 140°C and 180°C, samples processed at 160°C
showed increases from 25% (milk protein/glucose) up to 100% (whey protein/glucose,
milk protein/glucose syrup). When looking on the formation of 2,4-decadienal exclu-
sively, one may recommend barrel temperatures of 140°C or 180°C since both resulted
in lowest concentrations. It is to consider that flavor formation is a complex system with
several variables. While low temperatures may inhibit generating important flavor com-
pounds, high temperature may lead to the formation of different compounds as stated by
Pfannhauser [71]. He found that 2,4-decadienal is reactive at high temperatures forming
benzaldehyde and phenylacetaldehyde as further thermal reaction products. This could
be a possible explanation for the decreasing 2,4-decadienal concentration at 180°C bar-
rel temperature.
What was found is that different concentrations at different barrel temperatures cannot
be attributed to the examined system parameters. Evaluation showed that elevated tem-

Results and Discussion 92
peratures led to consistently decreasing die pressures as well as consistently increasing
die temperatures SME values. Only milk protein/glucose syrup samples showed slightly
higher SME values at 160°C compared to those found at 140°C and 180°C.
Within this study it was found that 2,4-decadienal formation can be strategically influ-
enced by protein, sugar, and temperature. However, the impact of the detected concen-
trations on sensory characteristics has to be examined before a final recommendation
regarding optimized process parameters is possible.
Figure 39: Influence of barrel temperature on 2,4-decadienal formation at constant pro-
tein (2%) and sugar (4%) contents.
Figure 40: Influence of temperature and glucose contents on 2,4-decadienal formation
at a constant milk protein content (2%).
Whey Protein /
Glucose
Milk Protein /
Glucose
Milk Protein /
Glucose Syrup

Results and Discussion 93
4.2.4 Influences on Acid Formation
Individually seen, organic acids such as butyric acid, pentanoic acid, and hexanoic acid
provide powerful, fatty-rancid, and sour odors. Due to interactions with other flavor
compounds, acids may contribute to a balanced flavor impression. Within this study, the
general influence of sugar, protein, and temperature on acid formation should be exam-
ined, regardless of their sensory properties.
Evaluation via DesignExpert® showed a significant influence of protein on the forma-
tion of butyric acid and pentanoic acid in the milk protein/glucose system only. How-
ever, a closer look should help examining basic trends. Figure 41 and Figure 42 show
the influence of different sugar and protein concentrations and compositions on the
formation of all three examined acids. When using glucose syrup, similar curve pro-
gressions at changed sugar concentrations were obtained for all acids. After an intense
increase until 4%, a rapid decrease appeared at 6 and 8% sugar. However, butyric acid
was differently influenced by changed glucose contents compared to pentanoic acid and
hexanoic acid. The latter showed decreasing concentrations from 0 to 4%, followed by
increases, while butyric acid started with increasing concentrations and lower amounts
at 6 and 8%.
Influence of Different Sugar Concentrations on Acid
Formation at 2% Protein
Butyric Acid Pentanoic Acid Hexanoic Acid
Sugar Content [%]
Conc
entr
atio
n [p
pm]
Whey Protein / Glucose
Milk Protein / Glucose
Milk Protein / Corn Syrup
0
5
10
15
20
25
30
35
0
1
2
3
4
5
6
7
0
1
2
3
4
5
6
7
0 2 4 6 8 0 2 4 6 8 0 2 4 6 8
Figure 41: Concentration of butyric acid, pentanoic acid, and hexanoic acid, depending
on the amount of sugar at constant protein contents (2%), processed at
160°C.
Evaluation of acid formation at changeable protein concentration showed partly similar
results. Again, glucose syrup containing samples came along with a distinct increase
until 2% protein, followed by an intense drop at 2.6%. Only hexanoic acid showed a
different curve progression.

Results and Discussion 94
In contrast to changed sugar concentrations, glucose containing designs showed opposi-
tional curve progressions when raising the protein content. On the one hand, an increase
in the milk protein content from 0 to 1.3% resulted in increasing acid concentrations,
followed by more or less unchanged concentrations at 2 and 2.6%. On the other hand,
increasing whey protein contents resulted in decreasing acid concentrations.
Influence of Different Protein Concentrations on Acid
Formation at 4% Sugar
Butyric Acid Pentanoic Acid Hexanoic Acid
Protein Content [%]
Conc
entr
atio
n [p
pm]
Whey Protein / Glucose
Milk Protein / Glucose
Milk Protein / Corn Syrup
0
5
10
15
20
25
30
35
0
1
2
3
4
5
6
7
0
1
2
3
4
5
6
7
0 0.6 1.3 2.0 2.6 0 0.6 1.3 2.0 2.6 0 0.6 1.3 2.0 2.6
Figure 42: Concentration of butyric acid, pentanoic acid, and hexanoic acid, depending
on the amount of protein at constant sugar contents (4%), processed at
160°C.
Obvious similarities in acid concentrations have been found in designs using glucose as
sugar source, regardless of the kind of protein. Explicit differences became visible when
using glucose syrup. Thus, sugar was found to be an influential parameter for acid for-
mation, whereas protein was not. Slightly different increases and decreases in glucose
containing samples depending on the protein source are explicable. Again, it is to taken
into account that the source of milk protein was milk powder, containing 60% milk sug-
ar. Hence, detected differences confirm the observed influence of sugar on acid forma-
tion.

Results and Discussion 95
Figure 43: Influence of barrel temperature on the formation of butyric acid, pentanoic
acid, and hexanoic acid at constant protein (2%) and sugar (4%) contents.
The influence of temperature on acid formation for all designs is shown in Figure 43.
Both glucose designs showed comparable results while the results for butyric acid and
pentanoic acid from samples containing glucose syrup differed. An explanation for the
results is hard to find. The detected minimum concentrations at 160°C barrel tempera-
ture cannot be attributed to any of the examined systems parameter. As mentioned ear-
lier, die temperature and SME showed consistently increasing values at increasing bar-
rel temperatures while the die pressure consistently decreased. The same applies to the
residence time. Even though the screw speed and the total mass flow remained un-
changed, it can be slightly influenced by temperature. As found by Bindzus [116], in-
creasing temperatures lead to decreasing residence times due to lower viscosities and
faster die flows.
Since the influence of measurable system parameters could be ruled out, different
chemical reaction at different temperatures are most likely. A minimum acid concentra-
tion at 160°C barrel temperature might be possible due to a favored formation of at least
one chemical compound at 160° only.
While the chemical pathway of butyric acid and pentanoic acid is unsettled, the forma-
tion of hexanoic acid can be assumed by the cleavage of 2,4-decadienal into hexanal
Whey Protein /
Glucose
Milk Protein /
Glucose
Milk Protein /
Glucose Syrup

Results and Discussion 96
and hexanoic acid. This theory might be confirmed by comparing the obtained results
with those for 2,4-decadienal. While hexanoic acid showed a minimal concentration at
160°C, 2,4-decadienal showed its maximum at the same temperature. It should be em-
phasized that this is only one possible explanation. It does not explain the similarity of
pentanoic acid since it cannot have been synthesized from 2,4-decadienal.
4.2.5 Influences on Maltol Formation
As indicated earlier, the determination of maltol concentration was made with respect to
its importance as an aroma active compound. Results are precarious since no stable iso-
tope dilution analysis was carried out for maltol. All values are based on comparisons
with those for the internal standard 1-octanol. Thus, no real concentrations are displayed
and rough tendencies could be derived only.
As can be seen in Table 17 to Table 19 and in , the influences of all three changeable
parameters strongly depended on the design. While temperature, protein, and sugar
showed significant influences on maltol formation in whey protein/glucose samples, no
significance was found for samples containing milk protein and glucose syrup. The in-
fluence of different sugars and protein as well as their amounts clearly becomes visible
in Figure 44, Figure 45, and Figure 46.
1.332.00
2.662.33
1.66
Protein [%]
Sugar [%]
Mal
tol C
on
cent
rati
on
[p
pm
]
Milk Protein/Corn Syrup
Milk Protein/Glucose
Whey Protein/Glucose
Figure 44: Influence of different protein-sugar compositions on maltol formation at
160°C barrel temperature.

Results and Discussion 97
0
2
4
6
8
10
12
14
16
0 2 4 6 8
Co
nce
ntr
atio
n [
pp
m]
Sugar Content [%]
Influence of Different Sugar Concentrations on Maltol Formation at
2% Protein
Whey Protein / Glucose
Milk Protein / Glucose
Milk Protein / Corn Syrup
Figure 45: Concentration of maltol, depending on the amount of sugar at constant pro-
tein contents (2%), processed at 160°C.
0
2
4
6
8
10
12
14
16
0 0,6 1,3 2 2,6
Co
nce
ntr
atio
n [
pp
m]
Protein Content [%]
Influence of Different Protein Concentrations on Maltol Formation
at 4% Sugar
Whey Protein / Glucose
Milk Protein / Glucose
Milk Protein / Corn Syrup
0.6 1.3 2.0 2.60.0
Figure 46: Concentration of maltol, depending on the amount of protein at constant
sugar contents (4%), processed at 160°C.
Both designs using milk protein started with a five times higher amount of maltol at 0%
sugar compared to the design using whey protein. The reason could be found in the na-
ture of the protein source milk powder, naturally containing milk sugar. Milk sugar as
well as glucose syrup may act as maltol precursors and thereby support maltol forma-
tion, whereas glucose cannot. Since protein was found to promote maltol formation, an
increased glucose concentration may counteract this by forming different compounds,
leading to decreased maltol concentrations at elevated glucose contents. In contrast, the
use of up to 6% glucose syrup at 2% protein led to an increasing maltol formation. As

Results and Discussion 98
mentioned above, glucose syrup contains sugars which may act as maltol precursors. At
glucose syrup concentrations higher than 6%, an excess of sugar molecules faces a lack
of protein. Increasing amounts of glucose, which is a component of glucose syrup as
well, reacts easier with protein forming different flavor compounds leading to decreas-
ing maltol concentrations.
The distinct drop of maltol concentration at 2.6% milk protein and 4% glucose syrup, as
illustrated in Figure 46, was unexpected. A lack of necessary sugar at elevated protein
contents might be a reason but remains unlikely since the decrease was found to be too
distinct. This is in contrast to designs using glucose. Irrespective of the protein used, a
slight and consistent increase was found. Thereby, milk protein/glucose samples consis-
tently showed 1.9 to 2.4 ppm higher concentrations than whey protein/glucose samples.
Again, this was found to be due to milk sugar, partly acting as maltol precursor.
Summarizing it can be stated that sugar was found to be the most influential parameter
on maltol formation. This applies for its concentration as well as for its kind. The use of
different proteins resulted in similar behaviors regarding maltol formation when using
the same sugar. Within this study, differences in the total amount of maltol is most
likely due to the protein source.
The influence of temperature on maltol formation for all three designs is depicted in
Figure 47. Again, glucose containing designs showed similarities while the use of glu-
cose syrup did not. On the contrary, it resulted in oppositional effects.
Figure 47: Influence of barrel temperature on the formation of maltol at constant protein
(2%) and sugar (4%) contents.
Glucose samples are characterized by a minimum maltol concentration at 160°C and
values about twice as high at 140°C and 180°C. Only the total amounts differed, de-
pending on the protein. The use of milk protein resulted in up to 5 times higher concen-

Results and Discussion 99
trations compared to samples containing whey protein. As mentioned previously, this is
due to additional milk sugar from the protein source milk powder. An oppositional ef-
fect was found for glucose syrup. At 160°C, a maximum concentration was found.
Neither the minimum concentration at 160°C in glucose samples nor the maximum con-
centration at 160°C in glucose syrup samples can be explained. Furthermore, no coher-
ences have been found between the obtained minimum or rather maximum concentra-
tions and any system parameter such as SME, die pressure, or die temperature.
Looking at maltol as a desired flavor compound, the use of glucose should be mini-
mized since it limits the maltol formation. The use of alternative sugar might be consid-
ered since investigations showed a positive influence of milk sugar as well as glucose
syrup. Additionally it was found that the formation of maltol rests upon interactions
between sugars and proteins. Thereby, already small amounts of sugar showed high
potentials to form maltol in the presence of protein whereas high amounts led to de-
creasing concentration explainable by the formation of different flavor compounds, fa-
vored at elevated sugar concentrations
4.3 Influence of Process Parameters on System Parameters
Beside the direct influence of the changeable process parameters on flavor develop-
ment, the effect on their derived system parameters was to be examined. Barrel tem-
perature, sugar and protein in different compositions were analyzed regarding their in-
fluence on specific system parameters. In this case, die temperature, representing the
final product temperature, die pressure, and specific mechanical energy (SME) were
measured for designs using milk protein and glucose syrup as well as whey protein and
glucose. They were analyzed for the defined experimental space by statistical evalua-
tion, based on polynomial regression. Table 20 and Table 21 show the calculated re-
gression coefficients, valid for the analyzed experimental designs, using milk protein
and glucose or whey protein and glucose syrup. For the evaluation of functional rela-
tions, only terms showing impact significances >95% (bold values) were used. Addi-
tionally, interactions of all three system parameters were analyzed. The model chosen
for evaluation depended on the recommendation given by the statistic software and
guaranteed the most appropriate fit. The results are shown in Table 22. Thereby, SME
was found to be significantly influenced by increasing die pressure whereas no further
significant interactions could be found.

Results and Discussion 100
Table 20: Regression coefficients and coefficients of determination for the influence of
process parameters on system parameters using milk protein and glucose
syrup
Regression Coefficient Source Factor
Die Temperature Die Pressure SME
Model - +174.282)
+4.041)
+124.121)
Barrel Temperature +3.503) -2.142) +4.941)
Protein -1.301) -0.83 +2.13 Linear
Sugar -1.802) +0.53 -8.312)
Barrel Temperature +2.09 +0.98 -9.501)
Protein -0.91 +0.16 -0.25 Quadratic
Sugar +0.59 +0.38 -0.55
Barrel Temp.-Protein +0.25 +0.82 -0.30
Barrel Temp.-Sugar -1.251) -1.03 -0.90 Interactive
Protein-Sugar 0.000 -0.23 +1.78
Coefficient of Determination 0.9416 0.8731 0.8681
Bold values indicate significance (1) P>95%, 2) P>99%, 3) P>99.9%)
Table 21: Regression coefficients and coefficients of determination for the influence of
process parameters on system parameters using whey protein and glucose
Regression Coefficient Source Factor
Die Temperature Die Pressure SME
Model - +184.692)
+6.412) +120.07
Barrel Temperature +4.303)
-1.923)
+4.281)
Protein 0.000 -2.043) +2.16 Linear
Sugar -2.102 +0.65 -6.33
2)
Barrel Temperature -1.53 +2.212) +0.39
Protein +0.97 -0.41 -0.70 Quadratic
Sugar -1.53 +0.036 -3.66
Barrel Temp.-Protein -0.38 -0.068 +3.19
Barrel Temp.-Sugar +0.13 -1.291) -1.84 Interactive
Protein-Sugar -0.37 -0.23 -2.66
Coefficient of Determination 0.9640 0.8734 0.8387

Results and Discussion 101
Bold values indicate significance (1) P>95%, 2) P>99%, 3) P>99.9%)
Table 22: Statistical correlation of system parameters
Product Temperature
Model: linear
R2=0.5658
Product Pressure
Model: quadratic
R2=0.7236
SME
Model: quadratic
R2=0.736
Product
Temperature -24.66 +33.24
Product
Pressure -5.53 +53.88
1)
SME +5.56 +0.19
Bold values indicate significance (1) P>95%, 2) P>99%, 3) P>99.9%)
As expected, the barrel temperature was the most important parameter influencing all
examined system parameters with high degrees of statistical significance. Beside an
increase in die temperatures, the increase in barrel temperatures led to a significant de-
crease in die pressure, due to lower viscosities at higher temperatures.
Furthermore, analysis showed a significant increase in SME when temperatures were
elevated. This was astonishing and unexpected. In general, increasing temperatures are
accompanied by a simultaneous drop in die pressure due to lower viscosities. As a con-
sequence, decreasing SME values were expected. A possible explanation might be an
interaction of sugar and temperature.
In addition to the barrel temperature, increasing sugar contents significantly influenced
the die temperature and the SME. Both effects were found to be independent from the
kind of sugar. These results are expected. At higher extrusion temperatures more sugar
tends to melt, resulting in a decrease of the viscosity, the prime reason for decreasing
die temperature and SME. Additionally, the melting of the sugar may interfere with the
melting of the starch and thereby may also affect SME. The complex influence of sugar
on system parameters becomes visible when looking at changes in die pressure. No sig-
nificant influence was diagnosed. This lies in the nature of the sugar. The higher the
temperature the more liquid it becomes. At 140°C, increasing sugar contents raise the
die pressure while the already lower die pressure at 180°C remains more or less con-
stant, as illustrated in Figure 48. It is to be added that pressure data as they are given in
this thesis do not represent realistic values. It was found that the used pressure sensor
was most likely not or only insufficiently gauged. Therefore pressure values have to be
seen relatively to each other only.

Results and Discussion 102
Differences among the analyzed designs were found regarding the influence of protein.
While whey protein showed no influence on the die temperature but an expected, sig-
nificant drop in die pressure, the milk protein seemed to influence the die temperature in
a significantly negative way, but not the die pressure. This is due to the protein source,
which was non-fat dried milk powder. Beside 33.4% milk protein it contained 54% milk
sugar, responsible for the found oppositional effects. This explains the results and con-
firms the influence of sugar as stated above.
Figure 48: Changes in die pressure depending on glucose content and barrel tempera-
ture at a constant whey protein content of 2%.
4.4 Influence of System Parameters on Product Parameters
In view of a possible process controlling and optimization, system parameters were
checked for coherences between their variations and the formation of important flavor
compounds. Therefore, methylpyrazine, 2,5-dimethylpyrazine, furanmethanol,
2,4-decadienal, and hexanoic acid were analyzed regarding their interactions with the
system parameters die temperature, die pressure, and SME. After evaluating the most
appropriate fit, the linear model was chosen. This does not allow drawing any conclu-
sions about interactions between system parameters and does not show quadratic coher-
ences. Nevertheless, it is the model of choice since it is significant for most of the cho-
sen product parameters in contrast to the quadratic model as it was used previously.

Results and Discussion 103
Table 23: Regression coefficients and coefficients of determination for the influence of
system parameters on product parameters using whey protein and glucose
Source Factor Methylpyrazine 2,5-Dimethylpyrazine Furanmethanol 2,4-Decadienal Hexanoic Acid
Model - +0.471) +0.263) +2.442) -0.16 +0.97
A +0.75 +0.078 +0.77 +3.65 +2.30
B -0.13 -0.0075 -0.078 +0.36 +0.07 Linear
C +0.31 +0.292) +2.152) -1.53 +0.41
Coefficient of
Determination 0.4693 0.7691 0.6620 0.1338 0.2492
Bold values indicate significance (1) P>95%, 2) P>99%, 3) P>99.9%)
A=die temperature, B=die pressure, C=SME
Table 24: Regression coefficients and coefficients of determination for the influence of
system parameters on product parameters using milk protein and glucose
syrup
Source Factor Methylpyrazine 2,5-Dimethylpyrazine Furanmethanol 2,4-Decadienal Hexanoic Acid
Model - +0.273) +0.0243) +10.002) +6.61 +-0.292)
A +0.19 +0.0852) +7.43 -1.07 +65.50
B -0.025 -0.0049 -0.60 +0.14 +44.72 Linear
C +0.252) +0.0483) +7.981) +1.35 -47.762)
Coefficient of
Determination 0.7725 0.8618 0.6300 0.1153 0.6406
Bold values indicate significance (1) P>95%, 2) P>99%, 3) P>99.9%)
A=die temperature, B=die pressure, C=SME
As can be seen in Table 23 and Table 24, there is only little statistical significance to
be found between system parameters and product parameters. Only SME showed sig-
nificant influences on 2,5-dimethylpyrazine and furanmethanol in both designs. Addi-
tionally, methylpyrazine and hexanoic acid were significantly influenced by SME and
2,5-dimethylpyrazine by the die temperature when using milk protein and glucose
syrup. The influence of SME and die temperature on 2,5-dimethylpyrazine formation is
shown in Figure 49 as an example for the design using milk protein and glucose syrup.
The determined lack of statistical significance did not come unexpectedly. When ana-
lyzing the influence of process parameters on flavor development, only pyrazines and
furanmethanol were found to be influenced by temperature. Both protein and sugar
showed more distinct effects on flavor formation. Furthermore, it must be taken into
account that temperatures, measured at the die, showed smaller ranges compared to the
directly controlled barrel temperature. While the barrel temperature varied from 140°C
to 180°C over a range of 40°C, the measured die temperature was between 171°C to

Results and Discussion 104
183°C for milk protein/glucose and 176°C to 189°C for whey protein/glucose. The re-
sulting range of only 12°C or rather 13°C was too small to allow high degrees of statis-
tical certainty. The die pressure was influenced by too many factors to be an appropriate
influential parameter itself.
Figure 49: Influence of SME and die temperature on 2,5-dimethylpyrazine formation in
a milk protein/glucose syrup design at medium die pressure (approx. 6 bar).
However, what remains is the SME. Finding it positively influencing the formation of
pyrazines as well as furanmethanol is of importance. A higher input of mechanical en-
ergy can be realized by increasing shear forces. The latter can be obtained by modified
screw configurations. This knowledge offers a possibility for future process optimiza-
tion.
4.5 Influence of Single Amino Acids as Potential Flavor
Precursor
Amino acids are important flavor precursor since they provide much more free amino
groups than complex proteins. The concentrations of selected flavor compounds, de-
pending on the added amino acids and their concentrations are listed in Table 25. In
preliminary extrusion trials, starch, whey protein, and glucose were processed without
additional amino acids under similar conditions of temperature, moisture, and screw
speed and at the same starch-protein-sugar composition. The resulting concentrations of
flavor compounds are given as reference values.

Results and Discussion 105
Table 25: Flavor compound concentration depending on amino acids
Trial Amino Acid
[ppm] Methyl- pyrazine
2,5 Dimethyl- pyrazine
Furan- methanol
Maltol 2,4-
Decadienal Butyric
Acid Pentanoic
Acid Hexanoic
Acid
250 2.06 0.38 3.08 0.61 4.4 8.94 0.97 1.66 Valine
1000 2.19 0.51 3.05 0.88 3.6 10.20 1.10 1.85
250 1.97 0.48 3.37 0.95 4.8 9.37 1.19 2.03 Proline
1000 2.33 0.59 3.90 1.41 4.4 10.32 1.46 1.91
250 2.76 0.61 3.76 0.98 7.3 30.09 2.62 2.27 Leucine
1000 2.97 0.66 3.68 0.58 6.8 26.64 1.92 1.30
250 1.47 0.54 3.76 0.99 5.4 23.05 3.92 3.60 Cysteine
1000 2.01 0.68 4.90 1.16 2.63 26.72 3.81 3.48
Reference 0 2.08 0.32 2.91 0.76 7.3 26.05 2.58 1.56
All extrudates processed at 160°C, 4% glucose, 2% whey protein; flavor compound concentrations in ppm
The influence of different amino acids on the formation of examined flavor compounds
was found to be variable, making an overall evaluation impossible. Differences were
found between the amino acids, their concentration and their impact on different com-
pounds.
Pyrazines were affected differently by amino acids. As can be seen in Figure 50, the
most obvious influence was found for 2,5-dimethylpyrazine. Already at 250 ppm added
amino acids, its concentration showed increases from about 20% using valine, up to
100% using leucine. At 1000 ppm, the concentration of 2,5-dimethypyrazine at least
doubled for proline, leucine, and cysteine and even valine led to an increase of about
65%. In contrast, the influence on methylpyrazine formation was quite low. Whereas no
changes at all could be found using valine and proline, the addition of 250 ppm cystein
resulted in a 30% lower concentration compared to the reference sample. Only leucine
showed an increase of about 30% at 250 ppm and nearly 50% at 1000 ppm. All in all,
leucine was the most influential amino acid regarding the formation of both dimeth-
ylpyrazine and 2,5-dimethylpyrazine.
The general increase in pyrazines due to added amino acids did not come unexpectedly.
Pyrazines are important nitrogen-containing flavor compounds which are generally
formed in the reaction of an amino group with a carbonyl group in the Maillard brown-
ing reaction. The results are in line with examinations made by Hwang et al. and
Riha et al., who stated that the formation of most pyrazines is positively influenced by
amino acids, regardless of their type [56, 49]. This is partly confirmed by Farouk et al.
who found pyrazine contents increased with the addition of all amino acids, except cys-
teine which enhanced the formation of sulfur compounds instead of pyrazines [62].

Results and Discussion 106
However, due to the presence of both a sulfur and nitrogen atom on cysteine one may
expect these different classes of compounds to be produced. Within the chemical reac-
tions, resulting in the formation of flavor compounds, sulfur and nitrogen do not have to
compete for necessary carbonyl groups. The latter are available in excess due to added
glucose and are responsible for finding 2,5-dimethylpyrazine formation positively influ-
enced by added cystein.
0
1
2
3
Valine Proline Leucine Cysteine
Amino Acid
Methylpyrazine
0,00
0,20
0,40
0,60
0,80
Valine Proline Leucine Cysteine
Amino Acid
2,5-Dimethylpyrazine
Reference
250 ppm
1000 ppm
Co
nce
ntr
ati
on
[p
pm
]
0.0
0.2
0.4
0.6
0.8
Figure 50: Differences in methylpyrazine and 2,5-dimethylpyrazine formation, depend-
ing on the kind and concentration of added amino acids.
The influence on acid formation strongly depends on the examined acid and the used
amino acid. While the use of valine and proline led to a significantly lower concentra-
tion of butyric and pentanoic acid compared to the reference sample, leucine and cys-
teine samples showed similar or slightly increased concentrations. The concentration of
hexanoic acid rose with all amino acids but most slightly using valine, proline, and leu-
cine with an increase from 0% to 30%. Only the use of cysteine resulted in up to 130%
higher concentrations. Leucine was found to be the only amino acid with distinctly
lower amounts of all three examined acids at 1000 ppm compared to 250 ppm. With
regard to the total acid concentration, changes caused by added amino acids are negligi-
ble. This and their minor role as flavor compounds might be the reason for the fact that
they have never been mentioned in reviewed literature examining the influence of
amino acids.
An only slight but consistent effect was found on furanmethanol formation. All amino
acids led to an increase of about 5% to 30% except cystein at 1000 ppm, resulting in an

Results and Discussion 107
increase of about 70%. Changes in furanmethanol concentrations due to added single
amino acids have not been reported yet. In general, the resulting increases seem to be
too low to significantly influence the final flavor impression.
The influence on maltol formation is depicted in Figure 51. Maltol is an important fla-
vor compound that is found in white bread crust and is well known as a flavor enhancer.
Farouk et al. found maltol to be a major volatile product in extrudates containing glu-
cose and amino acids and underlined its high concentrations while using leucine at con-
centrations of 0.5% and 2% [62].
This is in contrast to results found within this study. As for all examined compounds,
except pyrazines, the addition of leucine resulted in a slightly increasing concentration
at 250 ppm, followed by a decrease at 1000 ppm or rather 0.1%. In how far a further
elevation of the lysine concentration up to a level as it was used by Farouk et al. would
influence the maltol formation cannot be answered. A consistent increase, resulting in
maltol levels up to 100% higher than detected in the reference sample, was found for
proline and cysteine. Both took no part within other studies examining the influence of
single amino acids on the formation of maltol. As a conclusion of this study, the addi-
tional use of proline or cysteine is preferable over the use of valine or leucine.
0,00
0,20
0,40
0,60
0,80
1,00
1,20
1,40
1,60
Valine Proline Leucine Cysteine
Conc
entr
atio
n [p
pm]
Amino Acid
Maltol
Reference
250 ppm
1000 ppm
0.0
0.2
0.4
0.6
0.8
1.0
1.2
1.4
1.6
Figure 51: Differences in maltol formation, depending on the kind and concentration of
added amino acids.
Results found for 2,4-decadienal formation are comprehensible and were expected.
Amino acids have the same effect on the generation of 2,4-decadienal as protein. Both
provide amino groups, necessary for the formation of numerous chemical compounds.
These formations often require sugar as a source of reactive carbonyl groups. As men-
tioned in chapter 4.2.3, this leads to a reduced availability of sugar for oxidation proc-
esses, important for the formation of 2,4-decadienal. The effect of different amino acids

Results and Discussion 108
is shown in Figure 52. Beside leucine, the addition of amino acids resulted in
2,4-decadienal reductions of 25% to 40% at 250 ppm and 40% to 65% at 1000 ppm.
0
1
2
3
4
5
6
7
8
Valine Proline Leucine Cysteine
Conc
entr
atio
n [p
pm]
Amino Acid
2,4-Decadienal
Reference
250 ppm
1000 ppm
Figure 52: Differences in 2,4-decadienal formation, depending on the kind and concen-
tration of added amino acids.
It was found that by addition of selected single amino acids the formation of desired
flavor compounds can be strategically influenced. The results are in line with reviewed
literature, confirming that the generation of flavor components depends on the amino
acid used. For example, leucine exclusively enhanced the formation of methylpyrazine
significantly. Simultaneously, it was the only of the examined amino acids that did not
lead to a distinct reduction of 2,4-decadienal, a potent off-flavor at higher concentra-
tions.
It was found by Hofmann and Schieberle [50] and confirmed within this study that the
addition of cysteine favors the formation of volatiles such as 2,5-dimethylpyrazine, re-
sponsible for desired roasted, popcorn-like flavor impressions. But it remains to be con-
sidered that cysteine may cause unpleasant sulfur odor notes as it was found by
Wright et al. [58].
Because of these specific attributes, the application of single amino acids remains com-
plicated and should not be realized without complex previous sensory studies.

Results and Discussion 109
4.6 Color Measurement
Color plays an important role in the general acceptance of food by the consumer. Color
measurement was carried out to determine the influence of sugar, protein, and tempera-
ture on product lightness. The complete set of data is enclosed in the appendix,
Table A 4. All lightness values are given as relative lightness L, (L=100-L*).
Table 26: Regression coefficients and coefficients of determination for the influence of
process parameters on product lightness L
Regression Coefficient
Source Factor L Milk Protein/
Glucose Syrup
L Milk Pro-
tein/Glucose
L Whey Pro-
tein/Glucose
Model - +29.311) +31.212) +31.723)
Barrel Temperature +0.87 -1.502)
+1.342)
Protein +2.292)
+1.462)
+0.972) Linear
Sugar +1.281)
+2.433)
+3.663)
Barrel Temperature -2.25 -1.471)
-2.012)
Protein -0.37 +0.65 +1.13 Quadratic
Sugar -0.18 -1.16 -1.01
Barrel Temp.-Protein +0.15 -0.26 -0.30
Barrel Temp.-Sugar +0.39 -0.08 +0.69 Interactive
Protein-Sugar +0.92 -0.028 +0.27
Coefficient of Determination 0.8797 0.9571 0.9799
Bold values indicate significance (1) P>95%, 2) P>99%, 3) P>99.9%)
As can be seen in Table 26, all parameters showed significant influences. Only the bar-
rel temperature did not show any significance for samples containing milk protein and
glucose syrup. In general, a quadratic effect of increasing temperatures on color devel-
opment was found, resulting in initially increasing darkening followed by decreases.
The temperature at which a maximum darkening was detected strongly depended on the
sugar-protein composition. For milk protein/glucose it was found to be close to the
minimum temperature of 140°C. This resulted in a significant negative influence of an
increasing barrel temperature since it ranged from 140°C to 180°C. On the other hand,
the most intense color development was found around 170°C for whey protein/glucose
samples, resulting in a significant positive influence within the analyzed design space.
Summarizing it was found that temperature does influence product darkening. However,
the way it influences the color strongly depends on product composition and the chosen
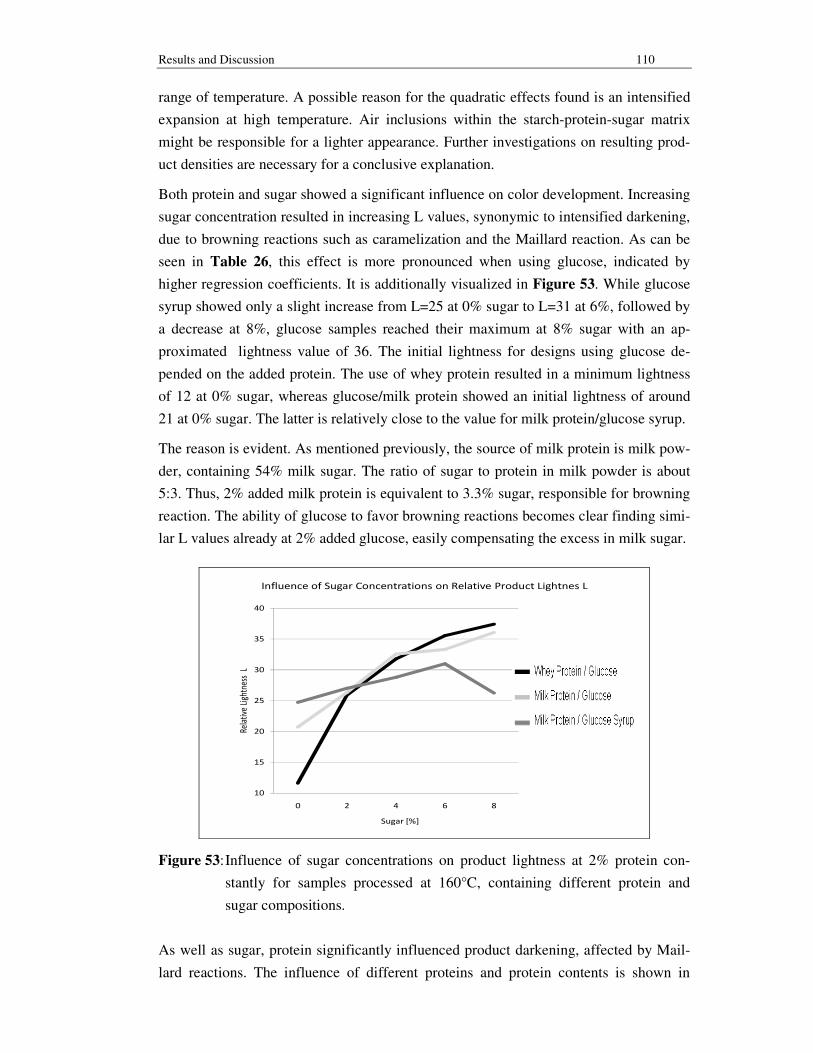
Results and Discussion 110
range of temperature. A possible reason for the quadratic effects found is an intensified
expansion at high temperature. Air inclusions within the starch-protein-sugar matrix
might be responsible for a lighter appearance. Further investigations on resulting prod-
uct densities are necessary for a conclusive explanation.
Both protein and sugar showed a significant influence on color development. Increasing
sugar concentration resulted in increasing L values, synonymic to intensified darkening,
due to browning reactions such as caramelization and the Maillard reaction. As can be
seen in Table 26, this effect is more pronounced when using glucose, indicated by
higher regression coefficients. It is additionally visualized in Figure 53. While glucose
syrup showed only a slight increase from L=25 at 0% sugar to L=31 at 6%, followed by
a decrease at 8%, glucose samples reached their maximum at 8% sugar with an ap-
proximated lightness value of 36. The initial lightness for designs using glucose de-
pended on the added protein. The use of whey protein resulted in a minimum lightness
of 12 at 0% sugar, whereas glucose/milk protein showed an initial lightness of around
21 at 0% sugar. The latter is relatively close to the value for milk protein/glucose syrup.
The reason is evident. As mentioned previously, the source of milk protein is milk pow-
der, containing 54% milk sugar. The ratio of sugar to protein in milk powder is about
5:3. Thus, 2% added milk protein is equivalent to 3.3% sugar, responsible for browning
reaction. The ability of glucose to favor browning reactions becomes clear finding simi-
lar L values already at 2% added glucose, easily compensating the excess in milk sugar.
10
15
20
25
30
35
40
0 2 4 6 8
Rela
tive
Ligh
tnes
s L
Sugar [%]
Influence of Sugar Concentrations on Relative Product Lightnes L
Whey Protein/Glucose
Milk Protein/Glucose
Milk Protein/Corn Syrup
Figure 53: Influence of sugar concentrations on product lightness at 2% protein con-
stantly for samples processed at 160°C, containing different protein and
sugar compositions.
As well as sugar, protein significantly influenced product darkening, affected by Mail-
lard reactions. The influence of different proteins and protein contents is shown in

Results and Discussion 111
Figure 54. Over all 5 protein levels, glucose containing designs showed nearly identical
lightness values. While milk protein/glucose syrup samples showed a similar curve pro-
gression, their L values were consistently about 5 points lower. Again, the ability of
glucose to affect browning reactions became clearly visible. The influence of the exam-
ined proteins was independent of their kind whereas their increasing amounts signifi-
cantly favored color development.
10
15
20
25
30
35
0 0,6 1,3 2 2,6
Rela
tive
Ligh
tnes
s L
Protein [%]
Influence of Protein Concentrations on Relative Product Lightness L
Whey Protein/Glucose
Milk Protein/Glucose
Milk Protein/Corn Syrup
0.0 0.6 1.3 2.0 2.6
Figure 54: Influence of protein concentrations on product lightness at 4% sugar con-
stantly for samples processed at 160°C, containing different protein and
sugar compositions.
For both protein and sugar detected increases were more pronounced from 0 to 1.3%
protein or rather 0 to 4% sugar. Only slight increases or even decreases were detected at
further elevated protein and sugar contents, leading to the assumption that color devel-
opment is characterized by an exponential curve progression. This results in the reach of
a maximum lightness value that cannot be further increased.
After all, increasing sugar and protein contents were found to positively affect color
development. While the used proteins showed no differences in their ability to favor
color development, different sugars did. The results are due to intensified Maillard reac-
tion and are in line with findings made by Köhler [34] who examined the effect of dif-
ferent sugars on the intensity of color development. He found intensified browning in
samples containing the pentose xylose compared to samples containing the hexoses glu-
cose or fructose which is due to its shorter chain length. Glucose syrup consists of a
multiple of different complex sugars which do not favor Maillard reaction with such
intensity as glucose does. Furthermore, it was found that increasing sugar contents re-
sulted in a more distinct color formation than increasing protein contents. A possible

Results and Discussion 112
explanation is the additional formation of colored compounds by caramelization proc-
esses.
It was found that elevated temperatures and increasing protein and sugar contents led to
significant changes in the concentration of selected flavor compounds and to a signifi-
cant color development. However, within this study, coherences between color devel-
opment and the formation of specific flavor compounds could not be found. Again, this
is explainable by the fact that the examined flavor compounds are exclusively formed
during Maillard type reactions whereas different pathways are responsible for the for-
mation of brown color. At extrusion temperature, added sugar easily caramelizes, result-
ing in the formation of colored compounds. Using the example of the whey pro-
tein/glucose model system, the independency of flavor compound concentration and
product lightness is shown in Figure 55.
The gained information may help to specifically influence the color of the final product,
but the color itself cannot be used as an analytical tool regarding the control of flavor
development.
Methylpyrazine 2,5-Dimethylpyrazine Furanmethanol
Maltol 2,4-Decadienal Butyric Acid
R²=0.1864
R²=0.2493 R²=0.0008
Co
nce
ntr
ati
on
[p
pm
]
24.00 27.50 30.50 33.75 37.00
24.00 27.50 30.50 33.75 37.00 24.00 27.50 30.50 33.75 37.00
Lightness L Lightness L Lightness L
Lightness L Lightness L Lightness L
1.02
2.32
3.63
4.94
6.25
24.00 27.50 30.50 33.75 37.00
0.06
0.24
0.41
0.87
0.76 R²=0.1953
24.00 27.50 30.50 33.75 37.00
0.42
0.84
1.25
1.67
2.09
R²=0.0331
Co
nce
ntr
ati
on
[p
pm
]
23.9
28.8
27.7
29.3
31.4
24.00 27.50 30.50 33.75 37.00
R²=0.0206
2.10
3.41
4.72
6.03
7.34
0.00
0.80
1.64
2.48
3.32
Figure 55: One factor plots, showing the influence of selected flavor compound concen-
trations on relative product lightness L (0=white, 100=black) using the ex-
ample of the whey protein/glucose model system.

Appendix
113
Ap
pe
nd
ix
Tab
le A
1: Flavor com
pounds and their concentrations as detected by headspace sam-
pling in samples containing m
ilk protein and glucose syrup
Pro
tein S
ou
rce / Su
ga
r D
ryed
non
-fat M
ilk P
ow
der/C
orn
Sy
rup
Tem
pera
ture [°C
]
140
140
140
140
140
180
180
180
180
180
160
160
160
160
160
160
Pro
tein [%
]
1.3
1.3
2
2.6
2.6
1.3
1.3
2
2.6
2.6
2
2
2
1.3
2
2.6
Su
gar [%
]
2
6
4
2
6
2
6
4
2
6
2
4
6
4
4
4
1-b
uta
no
l0
0
0
0
0
2
1.2
5.6
8.1
5.1
0
0
0
0
1.8
0
1-h
yd
roxy
-2-p
rop
an
on
e
114
62.9
73.4
59.8
53.3
85.8
61.1
70.8
62.8
71.6
42.6
76.6
72.8
32.8
57.6
69.1
2,3
-pen
tan
edio
ne
5.5
4.7
6.7
9.7
5.5
9
4.8
7.5
8.2
6.4
4.4
5.6
6.7
5.5
8.3
7.4
3-h
yd
roxy
-2-b
uta
no
ne
8.5
4.5
5.2
4.6
3.4
6.7
5.1
5.8
5.6
6.4
4.3
8.1
6.4
5.6
6.7
5
py
razin
e
2
0
0.8
1
0
3.9
0
2.4
2.4
2.8
3.3
0
0
0
3.8
2.9
pen
tan
ol
4.1
3.4
4.8
7.9
4.2
4.7
2.9
2.7
2
1.2
1.7
1.8
2.2
0.7
2.9
3.2
bu
tyric a
cid
2.2
0
0
0
0
1.3
0
0
0
0
0
0
0
0
0
0
hex
an
al
61.6
64.8
63.3
110
51.3
91.9
62.7
63.8
61.7
42
41
66.4
44.8
43.8
64.7
64.5
dih
yd
ro-2
-meth
yl-3
(2H
)-fura
no
ne
5.5
1.8
2.9
2.6
1.5
6.2
2.9
4.9
5.4
4.5
3.1
4.8
2.8
2.6
2.4
2.7
meth
ylp
yra
zine
0
0
0
0
0
0
0
0
0
0
0
0
0
0
0
04
-hy
dro
xy
-4-m
ethy
l-2-p
enta
no
ne
17
7.2
8.7
6.8
3.1
8.8
20.5
52.6
70.1
91.7
7.1
9.4
5.4
4.6
7.3
6.2
fura
nca
rboxa
ldeh
yd
e
5.9
3.2
4.5
4.9
4
9.4
6.3
9.9
11.7
10.4
6.9
9.3
6
4.5
7.1
6.6
fura
nm
etha
no
l
58.8
27.8
32.5
26.4
17.3
54.6
16.6
27.1
23.7
16.1
18.9
22.9
13.7
4.9
10.8
11.8
4-h
epta
no
ne
218
218
218
218
218
218
218
218
218
218
218
218
218
218
218
218
3-m
ethy
l-2-b
uta
no
ne
3.9
3
3.7
5.1
2.9
4.1
3.6
3.4
2.8
3.2
2.3
3.6
4.6
3.1
3.9
4.5
hep
tan
al
8.2
4.4
7.4
11.7
4.6
11.8
6.7
7.7
6.8
6
5.9
7.5
5.7
6.1
8.6
7.9
2,5
-dim
ethy
lpy
razin
e
0
0
0
0
0
0
0
0
0
0
0
0
0
0
0
0
2-p
enty
lfura
n
3.8
2.7
3.6
6.2
2.3
12.9
4.7
6.7
6.9
2.7
3.1
4.8
4.5
1.9
4.3
3.4

Appendix
114
Tab
le A
2: Flavor com
pounds and their concentrations as detected by headspace sam-
pling in samples containing m
ilk protein and glucose
Pro
tein S
ou
rce / Su
ga
r D
ryed
no
n-fa
t Milk
Pow
der/G
luco
se
Tem
pera
ture [°C
]
140
140
140
140
140
180
180
180
180
180
160
160
160
160
160
160
Pro
tein [%
]
1.3
1.3
2
2.6
2.6
1.3
1.3
2
2.6
2.6
2
2
2
1.3
2
2.6
Su
ga
r [%]
2
6
4
2
6
2
6
4
2
6
2
4
6
4
4
4
1-b
uta
no
l
15.9
13
9.3
3.8
10.1
9.5
5.6
11.3
16.1
12
5.5
5.4
3.1
9.4
4.7
7.8
1-h
yd
roxy
-2-p
rop
an
on
e
28.4
95.2
98.5
71.1
255
135
149
159
142
214
70.9
121
193
130
170
165
2,3
-pen
tan
edio
ne
18.6
7.7
10.5
7
13.1
12.7
6.8
15.1
11.4
11.6
7.5
6.9
10.2
8.2
10.8
8.8
3-h
yd
roxy
-2-b
uta
no
ne
24.5
21.8
16.5
8.2
17.9
7.2
9,3
9.3
10.5
10.5
6.4
7.8
11.3
10.2
12.8
8.3
py
razin
e
0
0
0
0
0
5.4
4.4
7
9.2
8.5
3.2
2.7
5.5
1.3
6.7
3.4
pen
tan
ol
5.7
2.5
3.4
1.8
5.9
1.4
2.6
2.5
2.1
3.2
0.5
2.9
0.9
0.9
2.1
5.1
bu
tyric a
cid
2.5
8
6.2
3
14.8
7.9
7.5
10.3
10.3
16.2
2.1
4
11.9
2
6.6
6.5
hex
an
al
93.8
49.1
58.1
36.2
79.1
65.7
49.6
62.7
59.5
62.3
37.2
44.1
52.7
50.3
63.5
47.9
dih
yd
ro-2
-meth
yl-3
(2H
)-fura
no
ne
1.5
0
2.8
4.6
6.8
6.2
3.9
12.1
19.6
13.8
4.9
4.3
6.3
4
8.5
6.3
meth
ylp
yra
zine
0
0
0
0
0
4.2
4.5
6.6
8.8
8.2
0
2.3
5.2
0
5.1
4.2
4-h
yd
roxy
-4-m
ethy
l-2-p
enta
no
ne
31.6
11.2
13.1
3.3
10
5.1
5.4
6.9
7.8
8.9
3.6
4.4
6.1
7.5
5.7
12.8
fura
nca
rbo
xa
ldeh
yd
e
15.4
20.7
15.7
10.8
18.9
11.1
9.4
16.7
21.3
22
7.6
9.1
13
11.2
17.8
15.5fu
ran
meth
an
ol
24
8.4
12.5
9.9
13
18.3
8.4
22.4
26.6
32.7
11.2
9.8
16
17.3
22.3
18.8
4-h
epta
no
ne
218
218
218
218
218
218
218
218
218
218
218
218
218
218
218
218
3-m
ethy
l-2-b
uta
no
ne
9.6
5.4
6.1
3.9
9.9
4.4
5.1
5.7
5.6
8.1
3.1
4.6
7.7
6
6.7
6.3
hep
tan
al
17.9
8.5
9.5
5
9.6
6.9
6
7.1
5.9
9
3.7
6
7
7.4
7.1
6.3
2,5
-dim
ethy
lpy
razin
e
7.5
4.8
3.6
1.7
2.2
0
0
0
0
0
0
0
0
0
0
0
2-p
enty
lfura
n
11.2
0
5
3
5.6
5.2
2.9
5.4
4.8
4.8
2.7
3.8
4.4
7.4
6.3
5.2

Appendix
115
Tab
le A
3: Flavor com
pounds and their concentrations as detected by headspace sam-
pling in samples containing w
hey protein and glucose.
Pro
tein S
ou
rce / Su
ga
r W
hey
Pro
tein/G
luco
se
Tem
pera
ture [°C
]
140
140
140
140
140
180
180
180
180
180
160
160
160
160
160
160
Pro
tein [%
]
1.3
1.3
2
2.6
2.6
1.3
1.3
2
2.6
2.6
2
2
2
1.3
2
2.6
Su
ga
r [%]
2
6
4
2
6
2
6
4
2
6
2
4
6
4
4
4
1-b
uta
no
l
3.4
2.8
3.5
5.5
4
4.1
2
2.8
2.5
0.8
6.2
4.6
0.7
2.6
4.1
4.3
1-h
yd
roxy
-2-p
rop
an
on
e
36.4
61.2
77
113
117
128
120
12.8
115
166
113
156
119
9.4
138
162
2,3
-pen
tan
edio
ne
9.9
5.1
11
28.6
14.5
12.9
9.2
13.2
18.3
11.7
22.3
22.8
8.2
10.2
14.2
17.9
3-h
yd
roxy
-2-b
uta
no
ne
32.7
19.3
16.4
10.6
8.5
6.3
6.9
5.9
5.6
8.8
5.1
8.2
6.7
6.8
6.6
7.2
pyra
zine
0
0
1
2.3
1.4
4.3
3.2
4.7
6.6
4.5
4.9
5.9
3.5
2.3
5.3
4.5
pen
tan
ol
2.9
2.2
2.9
4.1
2.9
3.8
2.3
2.9
2.8
2.8
3.8
3.6
2.3
1.8
3.4
2.8
bu
tyric a
cid
2.5
2.1
3.3
4
4.9
6.4
7.3
7.9
6.6
11.4
3.5
4.5
4.6
1.8
4.9
6
hex
an
al
59.2
45.3
61.5
74.3
52.6
61.1
37.5
4.3
45.8
32.1
76.1
67.8
30.7
35.6
55
46.1
dih
yd
ro-2
-meth
yl-3
(2H
)-fura
no
ne
2.5
2
2.6
3.3
2.8
3.7
3
3.1
2.9
3.7
3.8
4.4
2.7
2.8
4.6
4.5
meth
ylp
yra
zine
0
0
1.5
2.5
2.2
7.4
5.8
7.5
7.8
9.6
6.5
5.9
5.3
2.2
8
6.5
4-h
yd
roxy
-4-m
ethy
l-2-p
enta
no
ne
7.5
6.4
7
7.1
6.5
9
5.4
5.3
3.5
5
8.6
9.9
3.5
7.2
6.3
8.3
fura
nca
rbo
xa
ldeh
yd
e
3.3
4.6
4.7
5.4
6.7
5.1
7
6
4.8
9
4.9
8.1
6.4
5.4
7.2
8.2fu
ran
meth
an
ol
8.5
2.7
4.9
7
6.7
4.5
1.9
3.4
4
2.6
8.5
12.4
3.2
5.9
5.9
6
4-h
epta
no
ne
218
218
218
218
218
218
218
218
218
218
218
218
218
218
218
218
3-m
ethy
l-2-b
uta
no
ne
5.1
5.9
6.1
9.3
6
6.1
6.6
6.3
6.6
7.8
8.1
7.8
6
4.7
7.1
8.5
hep
tan
al
7.5
6.7
8.2
11.3
7.2
7.9
4.2
5.6
7.6
4.4
11.2
10.1
4.3
5.7
7.6
7.5
2,5
-dim
ethy
lpy
razin
e
2.2
0
1.9
4
0
1.9
1.1
2.5
4
2.6
3.5
1.4
0.7
0.8
1.4
1.1
2-p
enty
lfura
n
7.3
2.9
6.1
8.5
6.4
9.2
4.2
5.7
6.6
4
9
10.3
4.4
4.9
8.1
7.8

Appendix
116
Tab
le A
4: Color m
easurement data obtained from
samples containing different com
bi-
ations and amounts of w
hey protein or milk protein and glucose syrup or glu-
cose
L
WP/G
25.01
29.73
26.78
32.79
9.13
20.96
27.83
31.83
31.60
33.91
11.61
25.90
31.77
35.55
37.41
26.63
34.29
27.42
35.96
MP/G
27.09
31.43
30.26
34.92
12.22
19.55
27.58
29.90
31.46
33.34
20.71
26.32
32.56
33.30
36.08
24.67
28.90
27.00
31.13
MP/CS
23.77
22.27
26.10
30.49
9.13
14.63
21.84
28.49
30.35
29.12
24.72
27.00
28.79
30.99
26.25
23.36
25.60
28.49
32.23
a*
WP/G
2.35
4.00
3.08
5.09
-3.52
0.18
3.00
4.30
4.55
5.17
-2.30
2.48
4.46
5.89
6.84
2.56
5.23
2.71
5.61
MP/G
3.34
5.17
4.68
6.57
-2.51
-0.12
3.08
4.05
4.75
5.62
1.19
2.96
5.46
5.89
7.06
2.20
3.93
2.90
4.53
MP/CS
2.46
1.85
3.75
5.75
-3.52
-2.05
1.23
4.18
5.01
5.00
2.91
3.73
4.47
5.47
3.45
1.83
3.22
4.29
5.94
b*
WP/G
20.83
21.21
20.44
22.51
14.34
20.89
21.20
21.13
21.66
21.54
16.47
20.72
21.84
21.62
22.39
20.56
21.06
19.50
20.75
MP/G
23.75
24.15
24.77
24.77
17.77
20.45
22.47
22.90
23.36
24.17
22.71
22.81
24.40
24.79
24.82
21.69
22.95
22.09
23.24
MP/CS
26.29
25.92
28.28
29.25
14.34
19.60
23.37
25.96
26.20
27.76
26.05
26.15
26.73
28.09
26.02
22.85
25.46
25.68
27.37
Sample
Temp. [°C]
140
140
140
140
160
160
160
160
160
160
160
160
160
160
160
180
180
180
180
Protein [%]
1.3
1.3
2.6
2.6
0
0
0.6
1.3
2
2.6
2
2
2
2
2
1.3
1.3
2.6
2.6
Sugar [%]
2
6
2
6
0
4
4
4
4
4
0
2
4
6
8
2
6
2
6

Literature 117
Literature
[1] Maga, J.A.: Flavor Formation and Retention during Extrusion, In: Mercier, C.,
Linko P., Harper, J. M. (editors): Extrusion Cooking, American Association of
Cereal Chemistry, St. Paul, Minnesota (1989), 387-398.
[2] Pfaller, W.: Einfluss der Zusammensetzung von Getreidemahlerzeugnissen und
ausgewählten Rezepturen auf das Kochextrusionsverhalten und die Extrudatei-
genschaften, Dissertation, Technische Universität Berlin, 1987.
[3] Cerny, C., Briffod, M.: Effect of pH on the Maillard Reaction of [13C5]Xylose,
Cysteine and Thiamin, Journal of Agricultural and Food Chemistry 55 (2007),
1552-1556.
[4] Ames, J.M., Bailey, R.G., Mann, J.: Analysis of Furanone, Pyranone, and New
Heterocyclic Colored Compounds from Sugar-Glycine Model Maillard Systems,
Journal of Agricultural and Food Chemistry 47 (1999), 438-443.
[5] Moreno, F.J., Molina, E., Olano, A., López-Fandiño, R.: High-Pressure Effects
on Maillard Reaction between Glucose and Lysine, Journal of Agricultural and
Food Chemistry, 51 (2003), 394-400.
[6] Kramhöller, B., Pischetsrieder, M., Severin, T.: Maillard Reaction of Lactose
and Maltose, Journal of Agricultural and Food Chemistry 41 (1993), 347-351.
[7] Majcher, A.A., Jeleń, H.H.: Identification of Potent Flavor Odorants Formed
during the Preparation of Extruded Potato Snacks, Journal of Agricultural and
Food Chemistry 53 (2005), 6432-6437.
[8] Mansour, A.F., Pudil, F., Janda, V., Pokorný, J.: Changes during the Extrusion
of Semolina in Mixture with Sugars, Czech Journal of Food Science 19/1 (2001),
24-30.
[9] Lusas, E.W., Riaz, M.N.: Soy Protein Products: Processing and Use, The Jour-
nal of Nutrition 125 (1995), 573-580.
[10] Solina, M., Baumgartner, P., Johnson, R.L., Whitfield, F.B.: Volatile Aroma
Components of Soy Protein Isolate and Acid-Hydrolyzed Vegetable Protein,
Food Chemistry 90 (2005), 861-873.

Literature 118
[11] Harper, J.M.: Food Extruders and their Applications, In: Mercier, C., Linko P.,
Harper, J. M. (editors): Extrusion Cooking, American Association of Cereal
Chemistry, St. Paul, Minnesota (1989), 1-17.
[12] Hsieh, F., Peng, I.C., Huff, H.E.: Effects of Salt, Sugar and Screw Speed on
Processing and Product Variables of Corn Meal Extruded with a Twin-Screw
Extruder, Journal of Food Science 55 (1990), 224-227.
[13] Harper, J.M.: Extrusion of Foods, Vol. I and II, CRC Press, Boca Raton, Florida,
1981.
[14] Parker, J.K., Hassel, G.M.E., Mottram, D.S., Guy, R.C.E.: Sensory and Instru-
mental Analyses of Volatiles Generated during the Extrusion Cooking of Oat
Flours, Journal of Agricultural and Food Chemistry 48 (2000), 3497-3506.
[15] Yuliani, S., Torley, P.J., D’Arcy, B., Nicholson, T., Bhandari, B.: Effects of Ex-
trusion Parameters on Flavor Retention, Functional and Physical Properties of
Mixtures of Starch and D-Limonene Encapsulated in Milk Protein, International
Journal of Food Science and Technology 41 (2006), 83-94.
[16] Bhandari, B.R., D’Arcy, B.R., Young, G.: Flavour Retention During High Tem-
perature Short Time Extrusion Cooking Process: a Review, International Journal
of Food Science and Technology 36 (2001), 453-461.
[17] Meuser, F., Krüger, E., van Lengerich, B., Groneick, E.: The Use of High Tem-
perature Short Time Extrusion Cooking of Malt in Beer Production, In: Zeuthen,
P., Cheftel, J.C., Eriksson, C., Jul, M., Leninger, H., Linko, P., Varela, G., Vos,
G. (Editors): Thermal Processing and Quality of Foods, London: Elsevier Ap-
plied Science Publications (1984), 127-136.
[18] Krüger, E., Meuser, F., van Lengerich, B., Groneick, E.: HTST-Kochextrusion,
Eine neue technologische Möglichkeit der Bierbereitung?, Monatsschrift für
Brauwissenschaft 2 (1984), 82-88.
[19] Fichtali, J., van de Voort, F.R.: Fundamental and Practical Aspects of Twin
Screw Extrusion, Cereal Foods World 34 (1989), 921-929.
[20] Yaylayan, V.A., Fichtali, J., van de Voort, F.R.: Production of Maillard Reac-
tion Flavour Precursors by Extrusion Processing, Food Research International
25 (1992), 175-180.

Literature 119
[21] Fast, R.B., Manufacturing Technology of Ready to Eat Cereals, In: Fast, R.B.,
Caldwell, E.F. (editors): “Breakfast Cereals and How they are Made”, American
Association of Cereal Chemistry, St. Paul, Minnesota (1993), 15-42.
[22] Huber, G.R., Rokey, G.J.: Extruded Snack, In: Booth, R.G. (editor): “Snack
Food”, Van Nostrand Reinhold, New York (1995).
[23] Liu, Y., Hsieh, F., Heymann, H., Huff, H.E.: Effect of Process Conditions on the
Physical and Sensory Properties of Extruded Oat-Corn Puff, Journal of Food
Science 65 (2000), 1253-1259.
[24] Belitz, H. D., Grosch, W., Schieberle, P.: Food Chemistry, 3rd revised Edition.
Springer Verlag, Berlin Heidelberg, 2004.
[25] Solina, M., Johnson, R.L., Whitfield, F.B.: Effects of Glucose and Acid-
Hydrolysed Vegetable Protein on the Volatile Components of Extruded Wheat
Starch, Food Chemistry 100 (2007), 678-692.
[26] Bredie, W.L.P., Mottram, D.S., Guy, R.C.E.: Aroma Volatiles Generated during
Extrusion Cooking of Maize Flour, Journal of Agricultural and Food Chemistry
46 (1998), 1479-1487.
[27] Grosch, W., Schieberle, P.: Flavor of Cereal Products – A Review, Cereal
Chemistry 74/2 (1997), 91-97.
[28] Bredie, W.L.P., Mottram, D.S., Guy, R.C.E.: Effect of Temperature and pH on
the Generation of Flavor Volatiles in Extrusion Cooking of Wheat Flour, Journal
of Agricultural and Food Chemistry 50 (2002), 1118-1125.
[29] Ames, J.A., Defaye, A.B., Bates, L.: The Effect of pH on the Volatiles Formed in
an Extruded Starch-Glucose-Lysine Model System, Food Chemistry 58/4 (1997),
323-327.
[30] Jusino, M.O., Ho, C.T., Tong, C.H.: Formation Kinetics of 2,5-
Dimethylpyrazine and 2-Methylpyrazine in a Solid Model System Consisting of
Amioca Starch, Lysine and Glucose, Journal of Agricultural and Food Chemistry
45 (1997), 3164-3170.
[31] Bonvehi, J.S., Coll, V.F.: Factors Affecting the Formation of Alkylpyrazines
during Roasting Treatment in Natural and Alkalinized Cocoa Powder, Journal
of Agricultural and Food Chemistry 50 (2002), 3743-3750.

Literature 120
[32] Gimmler, N.: Optimierung der Prozeßbedingungen zur Herstellung von Stärke-
derivaten in einem gleichlaufenden Zweiwellenextruder als Reaktor, Dissertati-
on, Technische Universität Berlin, 1992.
[33] Huang, T.-C., Bruechert, L.T., Ho, C.-T.: Kinetics of Pyrazine Formation in
Amino Acid-Glucose Systems, Journal of Food Science 54 (1989), 1611-1614.
[34] Köhler, F.: Veränderung der ernährungsphysiologischen und physikalischen
Eigenschaften von Getreidemahlerzeugnissen durch Extrusion unter besonderer
Berücksichtigung proteinangereicherter Produkte, Dissertation, Technische U-
niversität Berlin, 1981.
[35] Lusas, E.W., Riaz, M.N.: Soy Protein Products: Processing and Use, The Jour-
nal of Nutrition 125 (1995), 573-580.
[36] Solina, M., Baumgartner, P., Johnson, R.L., Whitfield, F.B.: Volatile Aroma
Components of Soy Protein Isolate and Acid-Hydrolyzed Vegetable Protein,
Food Chemistry 90 (2005), 861-873.
[37] Brands, C.M.J., Wedzicha, B.L., van Boekel, M.A.J.S.: Quantification of
Melanoidin Concentration in Sugar-Casein Systems, Journal of Agricultural and
Food Chemistry 50 (2002), 1178-1183.
[38] Food-Info.net: http://www.food-info.net/uk/colour/caramel, by the Wageningen
University, The Netherlands, 2008.
[39] Van Boekel, M.A.J.S.: Effect of Heating on Maillard Reactions in Milk, Food
Chemistry 62/4 (1998), 403-414.
[40] Mauron, J.: The Maillard Reaction in Food: a Critical Review from the Nutri-
tional Standpoint, Progress in Food Nutrition Science 5 (1981), 5-35.
[41] Ho, C.-T.: Thermal Generation of Maillard Aromas, In: Ikan R. (editor): “The
Maillard Reaction Consequences for the Chemical and Life Science”, Wiley
(1996), 27-53.
[42] Acta Tabacaria Sinica: Maillard Reaction Flavours and Their Use in Tobacco
Products, China Tobacco Society, Bejing/China, 2004.
[43] Jousse, F., Jongen, W., Agterof, W., Russell, S., Braat, P.: Simplified Kinetic
Scheme of Flavour Formation by the Maillard Reaction, Journal of Food Sci-
ence 67 (2002), 2534-2542.
[44] Ames, J.M., Guy, R.C.E., Kipping, G.J.: Effect of pH and Temperature on the
Formation of Volatile Compounds in Cystein/Reducing Sugar/Starch Mixtures

Literature 121
during Extrusion Cooking, Journal of Agricultural and Food Chemistry 49/4
(2001), 1885-1894.
[45] Baily, R.G., Ames, J.M., Monti, S.: An Analysis of Non-Volatile Reaction Prod-
ucts of Aqueous Maillard Model Systems at pH 5, using Reversed-Phase HPLC
with Diode Array Detection, Journal of the Science of Food and Agriculture 72
(1996), 97-103.
[46] Bredie, W.L.P., Hassell, G.M., Guy, R.C.E., Mottram, D.S.: Aroma Characteris-
tics of Extruded Wheat Flour and Wheat Starch Containing Added Cystein and
Reducing Sugar, Journal of Cereal Science 25 (1996), 57-63.
[47] Baltes, W.: Lebensmittelchemie, Springer-Verlag, Berlin Heidelberg, 2000.
[48] Maga, J.A., Sizer, C.E.: Pyrazines in Food, CRC Review, Food Technology,
1973, 39-115.
[49] Riha III, W.E., Hwang, C.-F., Karwe, M.V., Hartman, T.G., Ho, C.-T.: Effect of
Cysteine Addition on the Volatiles of Extruded Wheat Flour, Journal of Agricul-
tural and Food Chemistry 44 (1996), 1847-1850.
[50] Hofmann, T., Schieberle, P.: Identification of Key Aroma Compounds Generated
from Cysteine and Carbohydrates under Roasting Conditions, Zeitschrift für
Lebensmittel- Untersuchung und -Forschung 207 (1998), 229-236.
[51] Koehler, P.E., Mason, M.E., Newell, J.A.: Formation of pyrazine compounds in
sugar-amino acid model systems, Journal of Agricultural and Food Chemistry 17
(1969), 393-396.
[52] Shigematsu, H., Kurata, T., Kato, H., Fujimaki, M.: Volatile compounds formed
on roasting DL-α-Alanine with D-Glucose, Agricultural and Biological Chemis-
try 36 (1972), 1631-1637.
[53] Piloty, M., Baltes, W.: Investigations on the Reaction of Amino Acids with α-
dicarbonyl Compounds. I. Reactivity of Amino Acids in the Reaction with α-
dicarbonyl compounds, Zeitschrift für Lebensmittel- Untersuchung und
-Forschung 168 (1979), 368-373.
[54] Fry, L.K., Stegink, L.D.: Formation of Maillard Reaction Products in Par-
enteral Alimenation Solutions, Journal of Nutrition 112 (1982), 1631-1637.
[55] Ashoor, S.H., Zent, J.B.: Maillard Browning of Common Amino Acids and Sug-
ars, Journal of Food Science 49 (1984), 1206-1207.

Literature 122
[56] Hwang, H.-I., Hartman, T.G., Ho, C.-T.: Relative Reactivities of Amino Acids in
the Formation of Pyridines, Pyrroles, and Oxazoles, Journal of Agricultural and
Food Chemistry 43 (1995), 2917-2921.
[57] Umano, K., Hagi, Y., Nakahara, K., Shyoji, A., Shibamoto, T.: Volatile Chemi-
cals Formed in the Headspace of a Heated D-Glucose/L-Cysteine Maillard
Model System, Journal of Agricultural and Food Chemistry 43/8 (1995), 2212-
2218.
[58] Wright, J.M., Whetstine, M.E.C., Miracle, R.E., Drake, M.: Characterization of
a Cabbage Off-flavor in Whey Protein Isolate, Journal of Food Science 71/2
(2006), 86-90.
[59] Arctander, S.: Perfume and Flavor Chemicals Vol. I and II, Published by the
Author, Montclair, N.J., USA, 1969.
[60] Mihara, S., Masuda, H.: Structure-Odor Relationships for Disubstituted Pyrazi-
nes, Journal of Agricultural and Food Chemistry 36/6 (1988), 1242-1247.
[61] Ames, J.M., Guy, R.C.E., Kipping, G.J.: Effect of pH, Temperature, and Mois-
ture on the Formation of Volatile Compounds in Glycin/Glucose Model Systems,
Journal of Agricultural and Food Chemistry 49 (2001), 4315-4323.
[62] Farouk, A., Pudil, F., Janda, V., Pokorný, J.: Effect of Amino Acids on the Com-
position and Properties of Extruded Mixtures of Wheat Flour and Glucose,
Nahrung 44 (2000), 188-192.
[63] van Boekel, M.A.J.S.: Formation of Flavor Compounds in the Maillard Reac-
tion, Research Review Paper, Wageningen University, the Netherlands, 2005.
[64] Izzo, H.V., Ho, C.-T.: Peptide-Specific Maillard Reaction Products: a new
Pathway for Flavour Chemistry, Trends in Food Science and Technology 3
(1992), 253-257.
[65] Schieberle, P., Grosch, W.: Potent Odorantsof the Wheat Bread Crumb. Differ-
ences from the Crust and Effect of a Longer Dough Fermentation, Zeitschrift für
Lebensmittel- Untersuchung und -Forschung 192 (1991), 130-135.
[66] Zhou, M., Robards, K., Glennie-Holmes, M., Helliwell, S.: Analysis of Volatile
Compounds and Their Contribution to Flavor in Cereals, Journal of Agricultural
and Food Chemistry 47/10 (1999), 3941-3953.
[67] Tanchotikul, U., Hsieh, T.C.Y.: An Improved Method for Quantification of 2-
acetyl-1-pyrroline, a “Popcorn”-Like Aroma, in Aromatic Rice by High-

Literature 123
Resolution Gas Chromatography/Mass Spectrometry/Selected Ion Monitoring,
Journal of Agricultural and Food Chemistry 39 (1991), 944-947.
[68] Schieberle, P.: Primary Odorants in Popcorn, Journal of Agricultural and Food
Chemistry 39 (1991), 1141-1144.
[69] Suyama, K., Adachi, S.: Origin of Alkyl-Substituted Pyridines in Food Flavor:
Formation of the Pyridines from the Reaction of Alkanals with Amino Acids,
Journal of Agricultural and Food Chemistry 28 (1980), 546-549.
[70] Bruechert, L.T., Zhang, Y., Huang T.-C., Hartman, T., Rosen, R.T., Ho, C.-T.:
Contribution of Lipids to Volatile Generation in Extruded Corn-Based Model
Systems, Journal of Food Science 53/5 (2006), 1444-1447.
[71] Pfannhauser. W.: Volatiles Formed during Extrusion Cooking of Cereals, Flavor
and Fragrance Journal 8 (1993), 109-113.
[72] Mottram, S.D., Wedzicha, B.L., Dodson, A.T.: Acrylamide is Formed in the
Maillard Reaction, Nature, 419 (2002) 448-449.
[73] Robert, F., Vuataz, G., Pollien, P., Saucy, F., Alonso, M.-I., Bauwens, I., Blank,
I.: Acrylamide Formation from Asparagine under Low Moisture Maillard Reac-
tion Conditions. 2. Crystalline vs Amorphous Model System, Journal of Agricul-
tural and Food Chemistry 53 (2005), 4628-4632.
[74] Claus, A., Weisz, G., Schieber, A., Carle, R.: Pyrolytic Acrylamide Formation
from Purified Wheat Gluten and Gluten-Supplemented Wheat Bread Rolls, Mo-
lecular Nutrition and Food Research 50 (2006), 87-93.
[75] Claus, A.: Pyrolytic Acrylamide Formation and Impact of Agronomic and Tech-
nological Factors on its Minimization in Bakery Products, Dissertation, Univer-
sität Hohenheim, 2007.
[76] Stadler, R.H., Blank. I., Varga, N., Robert, F., Hau, J., Guy, P.A., Robert, M.-C.,
Riediker, S.: Acrylamide from Maillard Reaction Products, Nature 419 (2002),
449-450.
[77] Marsili R.: Flavor, Fragrance, and Odor Analysis, CRC Press, 2002.
[78] Folkes, D.J., Gramshaw, J.W.: The Flavor and Volatiles of White Bread Crust,
Progress in Food Nutrition and Science 5 (1981), 369.
[79] Chang, C.-Y., Seitz, L.M., Chambers IV, E.: Volatile Flavor Components of
Bread Made from Hard Red Winter Wheat and Hard White Winter Wheat, Ce-
real Chemistry 72/3 (1995), 237-242.

Literature 124
[80] Kallio, H.: Identification of Vacuum Steam-Distilled Aroma Compounds in the
Press Juice of Arctic Bramble, Rubus arcticus L, Journal of Food Science 41
(1976), 555-562.
[81] Kim, J.S.: Einfluss der Temperatur beim Rösten von Sesam auf Aroma und anti-
oxidative Eigenschaften des Öls, Dissertation, Technische Universität Berlin,
2001.
[82] Pyysalo, T., Honkanen, E., Hirvi, T.: Volatiles of Wild Strawberries, Fragaria
vesce L., Compared to Those of Cultivated Berries, Fragaria x ananassa cv.
Senga Sengana, Journal of Agricultural and Food Chemistry 27/1 (1979), 19-22.
[83] Dregus, M., Schmarr, H.-G., Takahisa, E., Engel, K.-H.: Enantioselective Analy-
sis of Methyl-Branched Alcohols and Acids in Rhubarb (Rheum rhabarbarum
L.)Stalks, Journal of Agricultural and Food Chemistry 51 (2003), 7086-7091.
[84] Engel, W., Bahr, W., Schieberle, P.: Solvent Assisted Flavor Evaporation – a
New and Versatile Technique for the Careful and Direct Isolation of Aroma
Compounds from Complex Food Matrices, European Food Research and Tech-
nology 209/3-4 (1999), 237-241.
[85] Pozo-Bayón, M.A., Guichard, E., Cayot, N.: Feasibility an Application of Sol-
vent Assisted Flavor Evaporation and Standard Addition Method to Quantify the
Aroma Compounds in Flavoured Baked Matrices, Food Chemistry 99 (2006),
416-423.
[86] Park, B.-S., Lee, K.-G., Takeoka, G. R.: Comparison of Three Sample Prepara-
tion Methods on the Recovery of Volatiles from Taheebo (Tabebuia impetiginosa
Martius ex DC), Flavor and Fragrance Journal 19 (2004), 287-292.
[87] Jennings, W.G., Filsoof, M.: Comparison of Sample Preparation Techniques for
Gas Chromatographic Analysis, Journal of Agricultural and Food Chemistry 25
(1977), 440.
[88] Lammers, M.: Vergleichende Untersuchungen zum Aromaprofil von Wild-
schweinfleisch und Schweinefleisch sowie gereiften Rohprodukten mittels
Gaschromatographie/Massenspektrometrie, Dissertation, Tierärztliche Hoch-
schule Hanover, 2006.
[89] Wampler, T.P.: Analysis of Food Volatiles using Headspace-
Gaschromatography Techniques. In: Marsili, R. (editor): “Analyzing Food
Aroma”, Marcel Dekker Verlag, New York Basel Hong Kong (1996), 27-57.

Literature 125
[90] Gross, J.H.: Mass Spectrometry, a Textbook, Springer-Verlag, Berlin Heidel-
berg, 2004.
[91] Cammann, K.: Instrumentelle Analytische Chemie, Spektrum Akademischer
Verlag GmbH, Berlin Heidelberg, 2001.
[92] Gohlke, R.S., McLafferty, F.W.: Early Gas Chromatography/Mass Spectrome-
try, Journal of the American Society for Mass Spectrometry 4 (1993), 367-371.
[93] Li, T., Giang, Y., Hsu, J., Cheng, S., Liu, R., Wang, S.: Artifacts in the GC-MS
Profiling of Underivatized Methamphetamine Hydrochloride, Forensic Science
International 162/1 (2006), 113-120.
[94] Heydanek, M.G., McGorrin, J.: Gas Chromatography-Mass Spectroscopy Inves-
tigations on the Flavor Chemistry of Oat Groats, Journal of Agricultural and
Food Chemistry 29 (1981), 950-954.
[95] Molteberg, E.L., Magnus, E.M., Bjǿrge, J.M., Nilsson, A.: Sensory and Chemi-
cal Studies of Lipid Oxidation in Raw and Heat-treated Oat Flours, Cereal
Chemistry 73 (1996), 579-587.
[96] Schieberle, P.: Quantification of Important Roast-Smelling Odorants in Popcorn
by Stable Isotope Dilution Assays and Model Studies on Flavor Formation dur-
ing Popping, Journal of Agricultural and Food Chemistry 43 (1995), 2442-2448.
[97] Zehentbauer, G., Grosch, W.: Apparatus for Quantitative Headspace Analysis of
the Characteristic Odorants of Baguettes, Zeitschrift für Lebensmittel- Unter-
suchung und -Forschung 205 (1997), 262-267.
[98] Zehentbauer, G, Grosch, W.: Crust Aroma of Baguettes. I. Key Odorants of Ba-
guettes Prepared in Two Different Ways, Journal of Cereal Science 28 (1998),
81-92.
[99] Zehentbauer, G, Grosch, W.: Crust Aroma of Baguettes. II. Dependence of the
Concentrations of Key Odorants on Yeast Levels and Dough Processing, Journal
of Cereal Science 28 (1998), 93-96.
[100] Czerny, M., Schieberle, P.: Important Aroma Compounds in Freshly Ground
Wholemeal and White Wheat Flour – Identification and Quantitative Changes
during Sourdough Fermentation, Journal of Agricultural and Food Chemistry 50
(2002), 6835-6840.

Literature 126
[101] Debievre, P., Peiser, H.S.: Basic Equations and Uncertainties in Isotope Dilu-
tion Mass Spectrometry for Traceability to SI of Values Obtained by this Pri-
mary Method, Fresenius’ Journal of Analytical Chemistry 359 (1997), 523-525.
[102] Ag and Food NEWS: Color Plays an Important Role in Food Preference, Jour-
nal of Agricultural and Food Chemistry 17/1 (1953), 1030-1031.
[103] Hofmann, T.: Studies on the Relationship between Molecular Weight and the
Color Potency of Fractions Obtained by Thermal Treatment of Glucose/Amino
Acid and Glucose/Protein Solutions by Using Ultracentrifugation and Color Di-
lution Techniques, Journal of Agricultural and Food Chemistry 46 (1998), 3891-
3895.
[104] Ames, J.M., Defaye, A.B., Bailey, R.G., Bates, L.: Analysis of the Non-Volatile
Maillard Reaction Products Formed in an Extrusion-Cooked Model Food Sys-
tem, Food Chemistry 61/4 (1998), 521-524.
[105] Hofmann, T.: Characterization of the Chemical Structure of Novel Colored
Maillard Reaction Products from Furan-2-Carboxaldehyde and Amino Acids,
Journal of Agricultural and Food Chemistry 46 (1998), 932-940.
[106] Knerr, T., Lerche, H., Pischetsrieder, M., Severin, T.: Formation of a Novel Co-
lored Product during the Maillard Reaction of D-Glucose, Journal of Agricul-
tural and Food Chemistry 49/4 (2001), 1966-1970.
[107] Arnoldi, A., Corain, E.A., Scaglioni, L., Ames, J.M.: New Colored Compounds
from the Maillard Reaction between Xylose and Lysine, Journal of Agricultural
and Food Chemistry 45/3 (1997), 650-655.
[108] Ramirez-Jimenez A., Guerra-Hernandez, E., Garcia-Villanova, B.: Browning
Indicators in Bread, Journal of Agricultural and Food Chemistry 48 (2000),
4176-4181.
[109] Fratianni, A., Irano, M., Panfili, G., Acqustucci, R.: Estimation of Color of Du-
rum Wheat. Comparison of WSB, HPLC, and Reflectance Colorimeter Meas-
urements, Journal of Agricultural and Food Chemistry 53 (2005), 2373-2378.
[110] Johnston, R.A., Quick, J.S., Donnely, B.J.: Note on Comparison of Pigment Ex-
traction and Reflectance Colorimeter Methods for Evaluating Semolina Color,
Cereal Chemistry 57 (1980), 447-448.
[111] Acquistucci, R., Pasqui, L.A.: A Study Concerning a Method for the Rapid De-
termination of Semolina Color, Nahrung 35 (1991), 345-349.

Literature 127
[112] CIE Publication 15.2. Colorimetry, 2nd ed., CIE Central Bureau, Kegelgasse,
Wien, Austria (1986), 27-A-1030.
[113] Meuser, F., van Lengerich, B., Köhler, F.: Einfluss der Extrsuionsparameter auf
die funktionellen Eigenschaften von Weizenstärke, Starch/Stärke 34 (1982), 366-
372.
[114] Meuser, F., van Lengerich, B.: Systems Analytical Model for the Extrusion of
Starches, In: Zeuthen, P., Cheftel, J.C., Eriksson, C., Jul, M., Leninger, H., Lin-
ko, P., Varela, G., Vos, G. (Editors): Thermal Processing and Quality of Foods,
London: Elsevier Applied Science Publications (1984), 175-179.
[115] Guth, H., Grosch, W.: Geruchsstoffe von extrudiertem Hafermehl, Veränderung
bei der Lagerung, Zeitschrift für Lebensmittel- Untersuchung und –Forschung
196 (1993), 22-28.
[116] Bindzus, W.: Untersuchung des Extrusionsverhaltens von Stärkemischungen
unter Verwendung der in-line bestimmten Schubspannung der pastifizierten
Massen als den Prozess- und die Produkteigenschaften charakterisierender Ver-
fahrensparameter, Dissertation, Technische Universität Berlin, 1997.