influence of frequency on fractal dimension€¦ · the influence of frequency on fractal dimension...
TRANSCRIPT

Gašparović, Blaženka; Risović, Dubravko; Ćosović, Božena; Nelson, Andrew. The influence of frequency on fractal dimension of adsorbed layers. // Electrochimica Acta. 52 (2007), 7; 2527-2534. DOI: 10.1016/j.electacta.2006.08.073 –
Postprint Version
1
The Influence of Frequency on Fractal Dimension of Adsorbed Layers
B. Gašparović,1a* D. Risovic1b, B. Ćosović1a, A. Nelson2
1aCenter for Marine and Environmental Research and, 1bMolecular Physics Laboratory Ruđer Bošković
Institute, POB 180, HR-10002 Zagreb, Croatia 2Centre for Self Organising Molecular Systems, School of Chemistry, University of Leeds, LS2 9JT Leeds,
UK
* Corresponding author. Tel: 385-1-45 61 148; fax: 385-1-46 80 242
E-mail address: [email protected] (B. Gašparović)
Abstract
Ac voltammetry and electrochemical impedance spectroscopy are often the methods
of choice for use in study of adsorption of organic molecules. The adsorption of
organic molecules on interface may results in formation of fractal structures, whose
fractal dimension can be estimated using the method of scaling the hanging mercury
drop electrode (HMDE). The aim of present study was to check whether the estimated
fractal dimension, D (or for that matter the fractal ordering of the adsorbed layer)
shows any correlation (dependence) with change of applied frequency, and second, to
check the possibility to extend the method to broad frequency spectrum compatible
with impedance spectroscopy. The investigation included two surfactants nonionic
Triton-X-100 (T-X-100) and anionic sodium dodecyl sulfate (SDS) and alcohol tert-
butanol. All measurements were performed on HMDE at thermodynamic equilibrium
employing broad frequency spectrum. The validity of the approach was checked by
measurements on pure electrolyte and by comparison with previously obtained results
for fractal layers. The results of the investigations show that: (1) the method of scaling
the HMDE to obtain the fractal dimension of adsorbed layer is compatible with
impedance spectroscopy and the combination of these methods can be used as a
powerful tool to investigate fractal aspect of adsorption of organic molecules; (2)
fractal ordering of adsorbed layer and the value of fractal dimension is not influenced
by the frequency of applied sinusoidal voltage perturbations.
Keywords: frequency dependence; adsorption; fractal analysis; impedance spectroscopy;
Triton-X-100; sodium dodecyl sulfate, tert-butanol
Gašparović, Blaženka; Risović, Dubravko; Ćosović, Božena; Nelson, Andrew. The influence of frequency on fractal dimension of adsorbed layers. // Electrochimica Acta. 52 (2007), 7; 2527-2534. DOI: 10.1016/j.electacta.2006.08.073 –
Postprint Version
2
1. Introduction
The adsorbed layers may exhibit fractal properties that change during the adsorption
depending on local conditions and involved molecular interactions. Once, when the fractal
nature of the structure is established and its fractal dimension determined, such structures may
be treated theoretically as stochastic/random fractals whose fractal dimension reflects the
growth mechanism and whose changes can be correlated with the changes of interactions and
structure of the considered system 1-3. Thus estimation and monitoring of fractal dimension
can provide additional valuable insight into the properties and dynamics of the studied
system. Fractal ordering of adsorbed layers can be investigated by different methods
comprehending electrochemical methods 4-7, atomic force microscopy 8, transmission
electron microscopy 9, etc.
Previously we have devised a simple method for determination of fractal dimension, D of
an adsorbed layer by the scaling of a hanging mercury drop electrode (HMDE) that is suitable
for use in ac voltammetry 4. The method was derived from basic principle that for a
statistically scale-invariant structure, (physical realization of a mathematical fractal that
appears the same on all length scales), the considered feature exhibits a power-law scaling.
The “feature” used in the method is the capacitive current at a selected electrode potential and
the “scale” is the electrode surface represented by the radius of the mercury drop:
Ic rD (1)
In the ac voltammetric measurements the size of the mercury drop is varied stepwise over
a broad size-range and D is obtained from the slope of the log-log plot of Ic vs. r. This method
has been successfully used to determine and monitor the fractal dimension of adsorbed layers
of organic substances and to relate it to structural changes, growth mechanisms and properties
of the adlayer 4, 5, 10, 11. However, such ac voltammetric measurements are usually
conducted at a single frequency, typically from the low frequency range (few hundreds Hz or
below). On the other hand, the impedance spectroscopy that is often used in the field of
interfacial electrochemistry employs rather broad frequency spectrum comprehending
frequencies in range from few Hz to many kHz.
In that context the aim of present work was twofold: first, to check whether the estimated
fractal dimension D (or for that matter the fractal ordering of the adsorbed layer) shows any
correlation (dependence) with change of applied frequency, and second, to check the
Gašparović, Blaženka; Risović, Dubravko; Ćosović, Božena; Nelson, Andrew. The influence of frequency on fractal dimension of adsorbed layers. // Electrochimica Acta. 52 (2007), 7; 2527-2534. DOI: 10.1016/j.electacta.2006.08.073 –
Postprint Version
3
possibility to extend the method to a broader frequency spectrum compatible with impedance
spectroscopy. Hence, here, we report and discuss the results of application of the HMDE-
scaling method in impedance spectroscopy for estimation of adsorbed layer's fractal
dimension in a broad frequency spectrum.
2. Experimental
In this study the impedance spectroscopy measurements in combination with scaling of
the HMDE were used. For the electrochemical impedance spectroscopy an Autolab system,
FRA 2 and AUTOLAB Type III interface (Ecochemie, Utrecht, Netherlands), controlled
with Autolab software ware used. All instrumentation was enclosed in a grounded Faraday-
cage. The impedance measurements were performed in a broad frequency spectrum ranging
from 65 kHz – 0.1 Hz, with 0.005 V rms at selected electrode potentials of - 0.35 V and – 0.6
V in respect to Ag/AgCl/3 M KCl reference electrode and with a platinum wire as the
auxiliary electrode. The working electrode was a hanging mercury drop electrode (HMDE) by
Metrohm, Switzerland. The instrument provides the real and imaginary impedance
components of the cell, Z and Z, respectively. Subsequently the measured impedance data
were transformed to the complex capacitance plane, where the complex capacitance axes are
expressed as Re Y-1 and Im Y-1.
The same Autolab system was used in ac mode of operation (900 out of phase) for the
measurements of capacitance current vs. applied electrode potential. The frequency of the ac
voltage was 170 Hz, the amplitude 0.010 V rms, potential step 0.005 V, while the modulation
and interval times were 0.38 s and 1 s, respectively.
All measurements were conducted under the equilibrium -steady state conditions attained
under the diffusion controlled adsorption. The attainment of steady state for the given
experimental conditions (i.e. bulk concentration, electrode potential etc), is manifested as the
lowest and constant capacitance current value in the recorded Ic vs. t curve. The change of
capacitive current with time (Ic – t measurements) during the diffusion-controlled adsorption
was measured by phase sensitive alternating current (ac) voltammetry (90 out of phase) at a
given electrode potential. The ac p-p voltage amplitude was 10 mV at frequency of 170 Hz.

Gašparović, Blaženka; Risović, Dubravko; Ćosović, Božena; Nelson, Andrew. The influence of frequency on fractal dimension of adsorbed layers. // Electrochimica Acta. 52 (2007), 7; 2527-2534. DOI: 10.1016/j.electacta.2006.08.073 –
Postprint Version
4
The Ic vs. t measurements were performed by the EDT-ECP 110 Modular Research
Polarograph (London, England) and digitized afterward.
Prior to each measurement the purity of the electrolyte was checked through Ic – t
measurements (this plot should yield a constant capacitance value or exhibit a minimal decay
rate for the whole investigated time range) and only then the investigated substance was
added.
The experiments were carried out in electrolyte of 0.5 M NaCl and 3 x 10⁻² M NaHCO3
(pH 8.3) under nitrogen atmosphere. All solutions were prepared with deionised water
obtained with the Milly-Q Water System (Millipore, Switzerland). Triton-X-100 (T-X-100),
(CH3)3-CH2-C(CH2)2-C6H6-O-(CH2-CH2-O)9-10H, Mw 600 g/mol (Sigma) was used without
further purification. Sodium dodecyl sulfate (SDS), CH3-(CH2)11-O-SO3Na, Mw = 288.38
g/mol (BDH Chemicals), was recrystalized from absolute ethanol and the purity was tested by
surface tension measurements [12]. As SDS slowly hydrolyses in solution new stock solution
of SDS was prepared each day. Tert-butanol, C(CH3)3OH, Mw = 74.12 g/mol (Merck) was
used without further purifications.
All impedance spectroscopy measurements were performed at the thermodynamic
equilibrium conditions that are specific for the chosen organic molecule and its bulk
concentration. The work under thermodynamic conditions is also desirable from the
experimental point of view i.e. due to fact that the acquisition of the entire impedance
spectrum usually takes several minutes.
For the sake of fractal analysis the electrode surface area was varied stepwise from 8.8 x
10-3 – 3.8 x 10⁻² cm2. The fractal dimension, D, was determined from the slope of the log-log
plot of capacitance vs. electrode size. The capacitances were calculated from the imaginary
part of the measured impedance data for all frequencies from the investigated frequency
spectrum. The measurements were performed each time with a freshly prepared new drop of a
selected size that was not changed during the measurement and repeated at least two times.
The fractal dimension was also estimated from the zero frequency capacitance (ZFC). The
ZFC was obtained by the extrapolation of the semicircle of the complex capacitance plane to
the ImY-1 axis at low frequency 13.

Gašparović, Blaženka; Risović, Dubravko; Ćosović, Božena; Nelson, Andrew. The influence of frequency on fractal dimension of adsorbed layers. // Electrochimica Acta. 52 (2007), 7; 2527-2534. DOI: 10.1016/j.electacta.2006.08.073 –
Postprint Version
5
3. Results and discussion
For this study of possible influence of frequency of sinusoidal voltage perturbations on
the estimation of fractal dimension and/or on the fractal ordering of adsorbed layers on the
HMDE, three different organic substances were chosen: nonionic surfactant Triton-X-100 (T-
X-100), anionic surfactant sodium dodecyl sulphate (SDS) and alcohol, tert-butanol. All
molecules are well known and their adsorption on mercury electrode has been previously
widely studied e.g. 5, 14, 15, thus, providing enough information relevant for the present
study. For the nonionic surfactant T-X-100 it has been shown previously that under certain
experimental conditions the adsorbed layer is fractal 5-7. On the other hand SDS adsorption,
including surface aggregation, formation of hemimicelles and condensation was extensively
studied e.g. 16, 17 but did not include any aspects of possible fractal ordering. Also, many
aspects of tert-butanol adsorption were studied but not regarding possible fractal ordering
e.g. 18, 19.
To select the suitable potentials and bulk concentrations for our investigation we have
first recorded the variation of differential capacitance vs. applied electrode potential for a
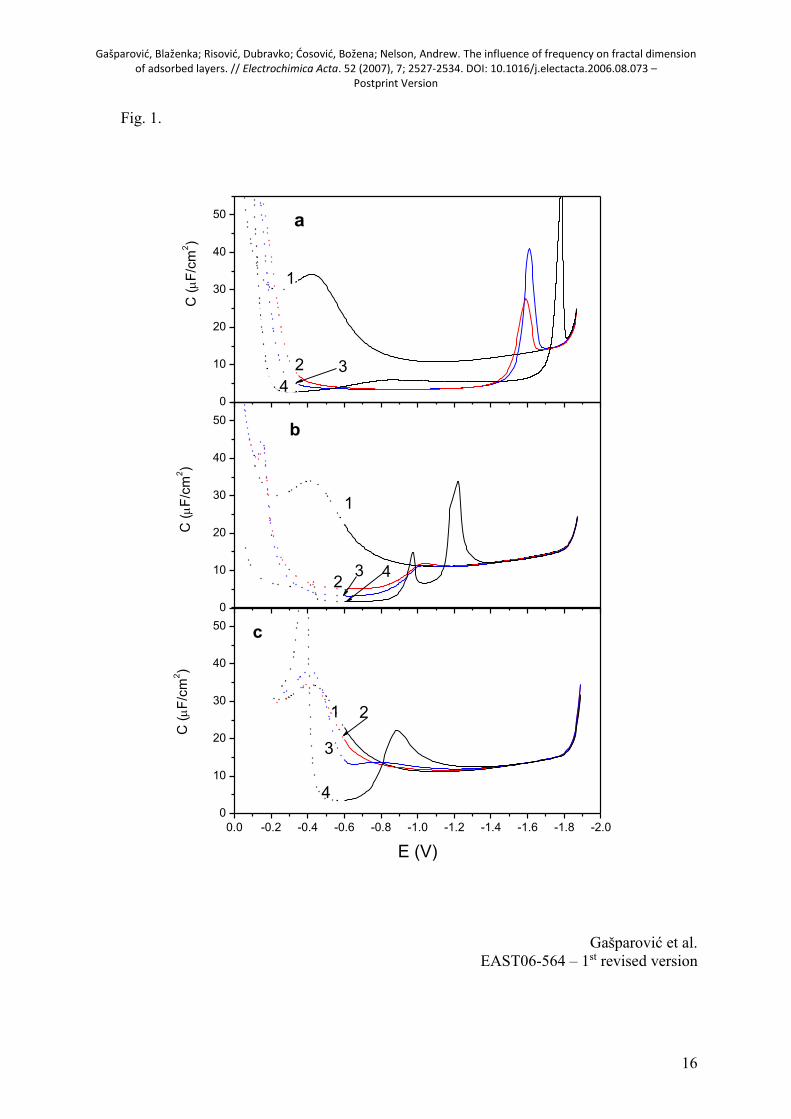
broad potential range and different bulk concentrations of both substances. In Fig. 1 typical C
vs. E curves are plotted for several bulk concentrations of T-X-100, SDS and tert-butanol
together with a curve corresponding to a high bulk concentration at which the relative
electrode surface coverage = 1. The capacitances corresponding to this high surface
coverage at selected potentials were subsequently used as the reference for calculation of
surface coverages corresponding to selected bulk concentrations of T-X-100 and SDS. The
curves were recorded at the steady state conditions, after diffusion controlled adsorption, by
scanning from the selected potentials in the positive and negative direction.
From Fig. 1a it can be seen that T-X-100 is strongly adsorbed at E = - 0.35 V and up to a
highly negative potential of E - 1.6 V. In the bulk concentration range up to 5 mg/dm3 T-X-
100 one desorption peak can be observed at E ≈ − 1.6 V 18. The height of this desorption
peak is proportional to the logarithm of T-X-100 bulk concentration. Such behavior is usually
associated with simple adsorption/desorption processes of monomers. SDS is strongly
adsorbed over wide range of potentials extending to both sides from the potential of zero
charge that, for the given experimental conditions on mercury electrode, occurs at E - 0.6 V.
Occurrence of a central capacitance pit surrounded with well defined plateaus observed at

Gašparović, Blaženka; Risović, Dubravko; Ćosović, Božena; Nelson, Andrew. The influence of frequency on fractal dimension of adsorbed layers. // Electrochimica Acta. 52 (2007), 7; 2527-2534. DOI: 10.1016/j.electacta.2006.08.073 –
Postprint Version
6
bulk concentration of about 10-4 M indicates formation of condensed film. The detailed
discussion of SDS adsorption can be found in the literature e.g. 16, 17. Similarly to SDS
tert-butanol is strongly adsorbed around E = - 0.6 V but at much higher bulk concentrations.
Based on these preliminary observations we have selected the electrode potentials and
bulk concentrations for our further research. The selected electrode potentials for experiments
were: E = - 0.35 V for T-X-100 and E = - 0.6 V for experiments with SDS and tert-butanol.
The first selection was based on the fact that previous investigation has shown that at this
potential T-X-100 indeed forms fractal structure and to facilitate the comparison of the
results, while the second choice was made considering the strength of adsorption and
distances from the desorption peaks and their changes with concentration. At these potentials
the selected molecules are neither reduced nor undergo any chemical reactions. The bulk
concentrations selected for the further investigations with T-X-100 were 0.5, 0.8 and 2
mg/dm3 ( 8.4 x 10⁻⁷ M, 1.34 x 10⁻⁶ M and 3.4 x 10⁻⁶ M, respectively), for SDS: 0.4, 0.7
and 1 mg/dm3 (1.4 x 10⁻⁶ M, 2.4 x 10⁻⁶ M and 3.5 x 10⁻⁶ M, respectively); and for tert-butanol:
2.60, 4.63 and 9.27 g/dm3 (35.1, 62.5 and 125 mM, respectively). The calculated relative
surface coverages for equilibrium adsorption corresponding to the selected T-X-100, SDS and
tert-butanol bulk concentrations are = 0.85, 0.87, and 0.94; = 0.85, 0.91, 0.93 and =
0.15, 0.41 and 0.92, respectively. The fractional surface coverage () was calculated from the
measured capacitance currents from the following relation:
)1(
)(
0
0
c
c
ii
ii (2)
Here, i0 represents the capacitive current corresponding to the interface capacitance
without organic molecules, ic() the capacitive current in the presence of adsorbed organic
molecules and ic( = 1) the capacitive current obtained for the totally covered electrode.
The selection of potential and bulk concentrations for T-X-100 were based on previous
investigations that had shown that at this potential the adsorbed layer is fractal for a broad

Gašparović, Blaženka; Risović, Dubravko; Ćosović, Božena; Nelson, Andrew. The influence of frequency on fractal dimension of adsorbed layers. // Electrochimica Acta. 52 (2007), 7; 2527-2534. DOI: 10.1016/j.electacta.2006.08.073 –
Postprint Version
7
range of T-X-100 bulk concentrations [7]. In the case of SDS to avoid the possible complex
adsorption 16] we have chosen the conditions of relatively low bulk concentration (well
below the CMC that is 4.3 x 10⁻⁴ M in 0.5 M NaCl 16) and the electrode potential of - 0.6 V
at which we do expect a relatively simple monolayer adsorption. The simple monolayer
adsorption is also expected for tert-butanol at E = - 0.6 V 18, 19.
To investigate possible influence of the frequency of imposed sinusoidal voltage
perturbation on determination of fractal dimension and/or fractal ordering of adsorbed layer
we have implemented the HMDE scaling method in impedance spectroscopy measurements
under equilibrium conditions.
The times needed to reach the equilibrium (steady state) at the selected potentials under
diffusion controlled adsorption were estimated from the IC vs. t measurements. These
measurements were made for all substances at all investigated bulk concentrations. The
results obtained for T-X-100 and SDS solutions together with those of pure electrolyte are
depicted in Fig. 2. The purity of the electrolyte is indicated by absence of significant current
decrease with time that would otherwise occur due to the adsorption of impurities (cf. Fig. 2,
curves 1). The times needed to reach equilibrium at the selected tert-butanol bulk
concentrations are almost instantaneous so that they are not included in the figure.
For a given substance the time needed to attain the equilibrium condition depends on the
bulk concentration through an inverse power low. For the T-X-100 solutions with bulk
concentrations of 0.5, 0.8 and 2 mg/dm3 steady state is reached in about 1850 s, 750 s and 270
s, respectively at - 0.35 V. For the SDS solutions the corresponding times needed to reach
steady state for the concentrations of 0.4, 0.7 and 1 mg/dm3 are about 1700 s, 950 s and 500 s,
respectively, at - 0.6 V.
All electrochemical impedance measurements at the selected electrode potentials and at
different electrode sizes (scaling of HMDE for determination of D) were accomplished at
steady state conditions: first for pure electrolyte, and then for the solutions with different bulk
concentrations of T-X-100, SDS and tert-butanol.
Typical Cole-Cole plots in the complex capacitance plane derived from the measured
impedance data for pure electrolyte and the solution of 0.8 mg/dm3 T-X-100 recorded at the
electrode potential E = - 0.35 V for nine HMDE sizes are shown in Fig 3a and b. The plots in
complex capacitance plane are almost ideal semicircles indicating minimal or no capacitance
dispersion at all. Similar results were obtained with SDS and tert-butanol.
Gašparović, Blaženka; Risović, Dubravko; Ćosović, Božena; Nelson, Andrew. The influence of frequency on fractal dimension of adsorbed layers. // Electrochimica Acta. 52 (2007), 7; 2527-2534. DOI: 10.1016/j.electacta.2006.08.073 –
Postprint Version
8
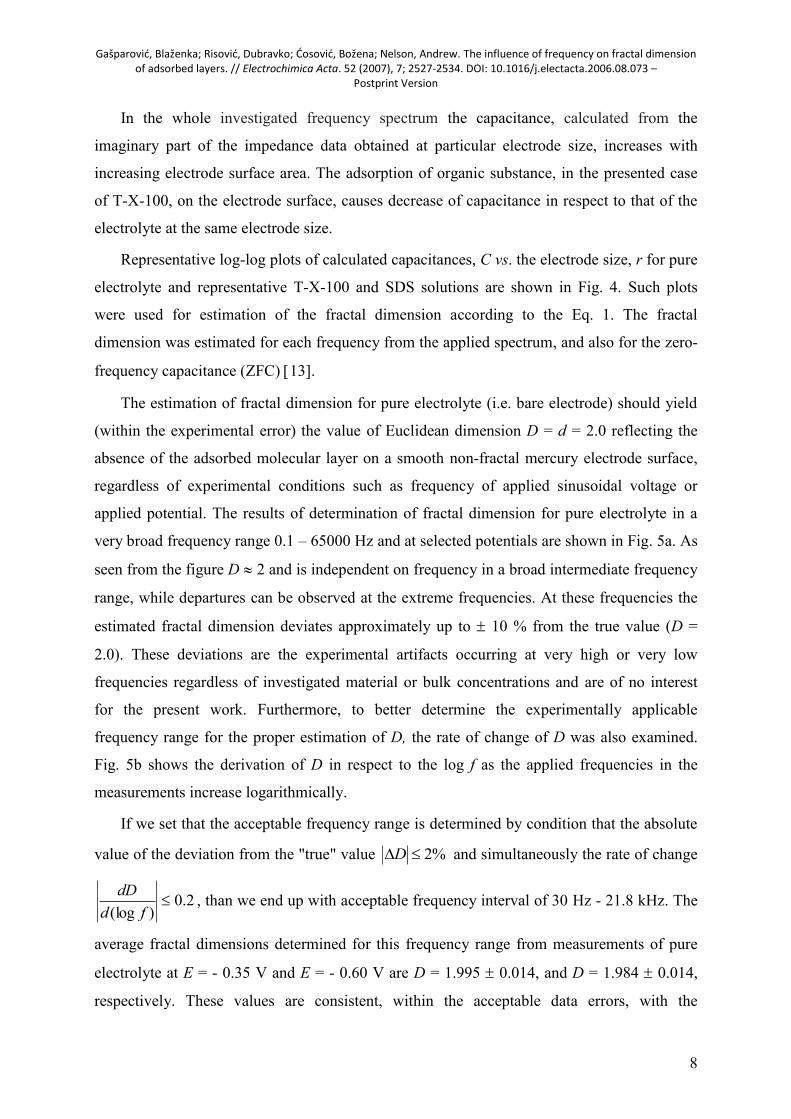
In the whole investigated frequency spectrum the capacitance, calculated from the
imaginary part of the impedance data obtained at particular electrode size, increases with
increasing electrode surface area. The adsorption of organic substance, in the presented case
of T-X-100, on the electrode surface, causes decrease of capacitance in respect to that of the
electrolyte at the same electrode size.
Representative log-log plots of calculated capacitances, C vs. the electrode size, r for pure
electrolyte and representative T-X-100 and SDS solutions are shown in Fig. 4. Such plots
were used for estimation of the fractal dimension according to the Eq. 1. The fractal
dimension was estimated for each frequency from the applied spectrum, and also for the zero-
frequency capacitance (ZFC) 13.
The estimation of fractal dimension for pure electrolyte (i.e. bare electrode) should yield
(within the experimental error) the value of Euclidean dimension D = d = 2.0 reflecting the
absence of the adsorbed molecular layer on a smooth non-fractal mercury electrode surface,
regardless of experimental conditions such as frequency of applied sinusoidal voltage or
applied potential. The results of determination of fractal dimension for pure electrolyte in a
very broad frequency range 0.1 – 65000 Hz and at selected potentials are shown in Fig. 5a. As
seen from the figure D 2 and is independent on frequency in a broad intermediate frequency
range, while departures can be observed at the extreme frequencies. At these frequencies the
estimated fractal dimension deviates approximately up to 10 % from the true value (D =
2.0). These deviations are the experimental artifacts occurring at very high or very low
frequencies regardless of investigated material or bulk concentrations and are of no interest
for the present work. Furthermore, to better determine the experimentally applicable
frequency range for the proper estimation of D, the rate of change of D was also examined.
Fig. 5b shows the derivation of D in respect to the log f as the applied frequencies in the
measurements increase logarithmically.
If we set that the acceptable frequency range is determined by condition that the absolute
value of the deviation from the "true" value %2D and simultaneously the rate of change
2.0)(log
fd
dD, than we end up with acceptable frequency interval of 30 Hz - 21.8 kHz. The
average fractal dimensions determined for this frequency range from measurements of pure
electrolyte at E = - 0.35 V and E = - 0.60 V are D = 1.995 0.014, and D = 1.984 0.014,
respectively. These values are consistent, within the acceptable data errors, with the

Gašparović, Blaženka; Risović, Dubravko; Ćosović, Božena; Nelson, Andrew. The influence of frequency on fractal dimension of adsorbed layers. // Electrochimica Acta. 52 (2007), 7; 2527-2534. DOI: 10.1016/j.electacta.2006.08.073 –
Postprint Version
9
theoretical value D = 2.0 for a uniform, non-fractal electrode. Also, the excellent linear fit
(regression coefficient R2 0.9999) of measured data in log-log plot of C vs. r for pure
electrolyte (cf. Fig. 4) indicates that the mercury drop remains spherical even for the biggest
electrode sizes used in the experiments. The linearity of the fit was preserved to a high degree
in all measurements and remained uncorrelated with T-X-100, SDS or tert-butanol bulk
concentration. This indicates that the change of Hg-electrode surface tension due to the
adsorption does not affect its sphericity. Also, the repeatability of measurement results was
very good: the standard deviation of capacitance determined from repeated measurements at
particular electrode size ranged between 0.05% and 0.6 % with (overall) average value of 0.18
%.
Hence, we conclude that the acceptable frequency range for estimation of fractal
dimension in impedance spectroscopy measurements is 30 Hz - 21.8 kHz. Consequently, in
the next step, all further results obtained from measurements of selected substances are
presented for this frequency range. First we will elaborate the results obtained with T-X-100.
Previously, using ac voltammetry, it has been established [4] that at the selected electrode
potential, E = - 0.35 V, the adsorbed T-X-100 layers exhibit different fractal dimension
depending on the relative electrode surface coverage. Hence, the impedance spectroscopy
measurements were conducted at different electrode sizes at E = - 0.35 V for selected T-X-
100 bulk concentrations/surface coverages at the steady-state conditions. The fractal
dimension of the adsorbed layers in the relevant frequency range (30 Hz - 21.8 kHz) was
calculated from the dependence of measured capacitances vs. size of the HMDE. The
estimated D vs. f for adsorbed layers obtained at the T-X-100 bulk concentrations of 0.5, 0.8
and 2 mg/dm3 are depicted in Fig. 6.
It can be seen that the different fractal dimensions corresponding to the different T-X-100
bulk concentrations (i.e. fractional electrode coverages) remain (within the acceptable data
errors) practically constant in a wide frequency range. The measurement uncertainty at a
particular frequency from the range is lower for higher frequencies (about 0.4 %) and is
higher for frequencies below 100 Hz ( 1 - 2 %) and represented by the corresponding error
bars in the figures. The systematic minor oscillation of average D that can be observed at
lower frequencies from the range, and that was also observed in measurements with SDS and
electrolyte (cf. Figs 7 and 5), is still within the measurement uncertainty limits and hence can
be treated as an experimental artifact associated with measuring system characteristic rather
Gašparović, Blaženka; Risović, Dubravko; Ćosović, Božena; Nelson, Andrew. The influence of frequency on fractal dimension of adsorbed layers. // Electrochimica Acta. 52 (2007), 7; 2527-2534. DOI: 10.1016/j.electacta.2006.08.073 –
Postprint Version
10
than some subtle structural change of the adsorbed fractal layer. In the frequency range 30 Hz
- 21.8 kHz the estimated average fractal dimensions of adsorbed layer of T-X-100 obtained at
bulk concentrations of 0.5, 0.8 and 2.0 mg/dm3 are 2.28 0.02, 2.05 0.02 and 2.02 0.02,
respectively. At relative electrode coverage of about = 0.85 (bulk concentration 0.5 mg/dm3)
the layer exhibits relatively high fractal dimension D = 2.28. With increase of the bulk
concentration the adsorbed layer gets more uniform and smoother as manifested by the
decrease of fractal dimension. At high bulk concentration i.e. at high relative electrode
coverage ( = 0.94) the layer is compact and relatively "smooth" with D 2. These results are
in agreement with previously determined fractal dimensions for the corresponding relative
electrode coverages [5].
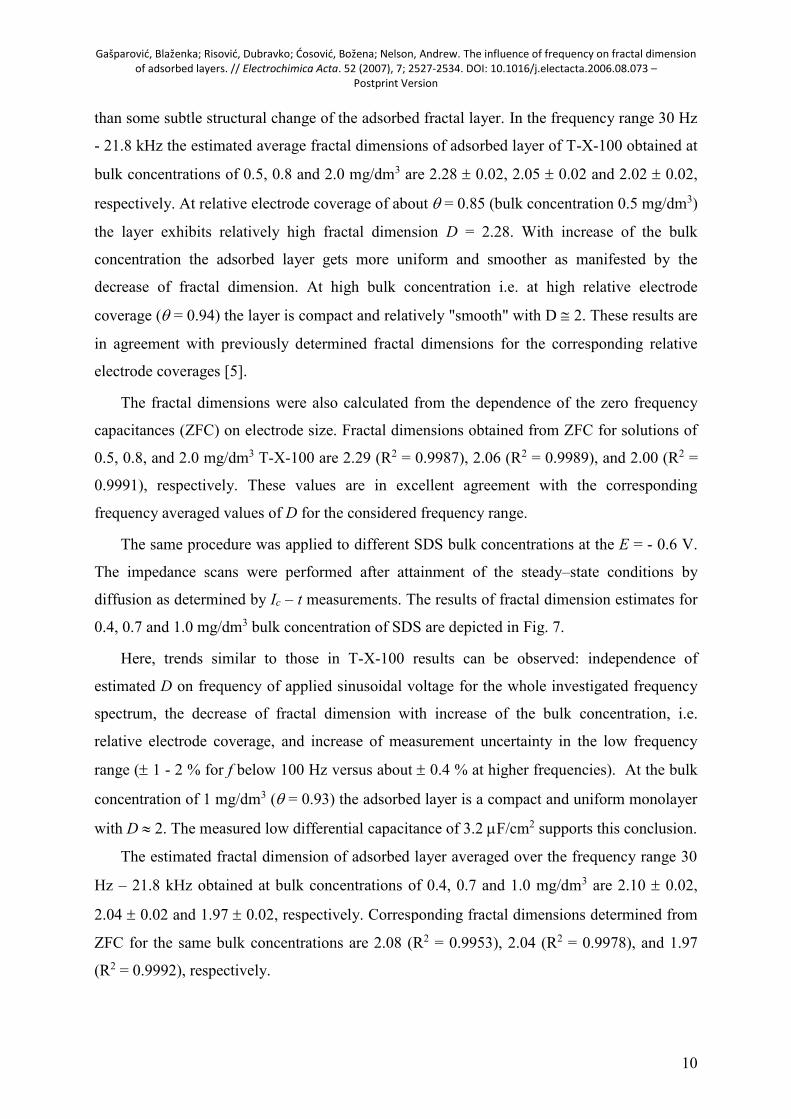
The fractal dimensions were also calculated from the dependence of the zero frequency
capacitances (ZFC) on electrode size. Fractal dimensions obtained from ZFC for solutions of
0.5, 0.8, and 2.0 mg/dm3 T-X-100 are 2.29 (R2 = 0.9987), 2.06 (R2 = 0.9989), and 2.00 (R2 =
0.9991), respectively. These values are in excellent agreement with the corresponding
frequency averaged values of D for the considered frequency range.
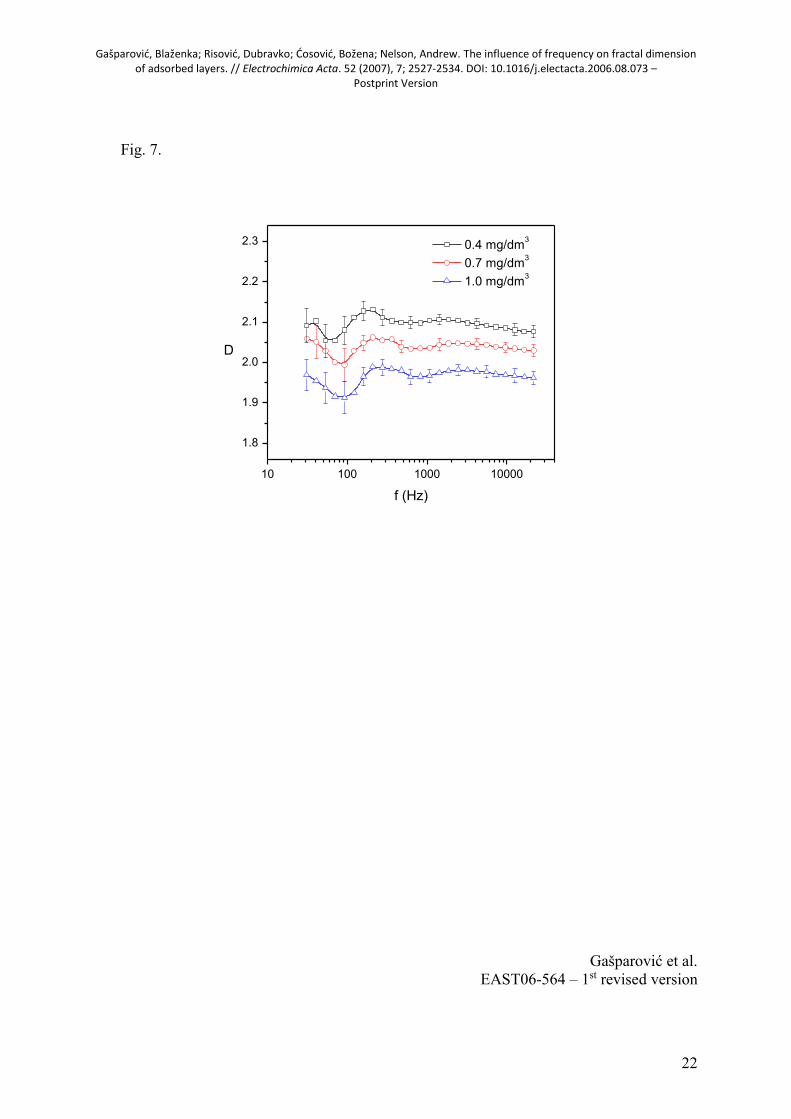
The same procedure was applied to different SDS bulk concentrations at the E = - 0.6 V.
The impedance scans were performed after attainment of the steady–state conditions by
diffusion as determined by Ic – t measurements. The results of fractal dimension estimates for
0.4, 0.7 and 1.0 mg/dm3 bulk concentration of SDS are depicted in Fig. 7.
Here, trends similar to those in T-X-100 results can be observed: independence of
estimated D on frequency of applied sinusoidal voltage for the whole investigated frequency
spectrum, the decrease of fractal dimension with increase of the bulk concentration, i.e.
relative electrode coverage, and increase of measurement uncertainty in the low frequency
range ( 1 - 2 % for f below 100 Hz versus about 0.4 % at higher frequencies). At the bulk
concentration of 1 mg/dm3 ( = 0.93) the adsorbed layer is a compact and uniform monolayer
with D 2. The measured low differential capacitance of 3.2 F/cm2 supports this conclusion.
The estimated fractal dimension of adsorbed layer averaged over the frequency range 30
Hz – 21.8 kHz obtained at bulk concentrations of 0.4, 0.7 and 1.0 mg/dm3 are 2.10 0.02,
2.04 0.02 and 1.97 0.02, respectively. Corresponding fractal dimensions determined from
ZFC for the same bulk concentrations are 2.08 (R2 = 0.9953), 2.04 (R2 = 0.9978), and 1.97
(R2 = 0.9992), respectively.

Gašparović, Blaženka; Risović, Dubravko; Ćosović, Božena; Nelson, Andrew. The influence of frequency on fractal dimension of adsorbed layers. // Electrochimica Acta. 52 (2007), 7; 2527-2534. DOI: 10.1016/j.electacta.2006.08.073 –
Postprint Version
11
The representative results of fractal dimension estimates for 2.60, 4.63 and 9.27 g/dm3
(35.1, 62.5 and 125.0 mM) bulk concentration of tert-butanol (corresponding to the relative
electrode surface coverage = 0.15, 0.41 and 0.92, respectively) are depicted in Fig. 8. It can
be observed that contrary to the adsorbed T-X-100 and SDS layers the adsorbed layers of tert-
butanol do not exhibit fractal structure at any fractional electrode coverage. The fractal
dimension was also estimated for bulk concentrations between 7.8 and 125 mM, that covers
electrode surface coverages = 0.04 to 0.92, resulting in D = d 2 and therefore are not
presented in the figure.
The estimated fractal dimension of adsorbed layer averaged over the frequency range 30
Hz – 21.8 kHz obtained at bulk concentrations of 2.60, 4.63 and 9.27 g/dm3 are 2.01 0.02,
2.00 0.01 and 1.997 0.020, respectively. Corresponding fractal dimensions determined
from ZFC for the same bulk concentrations are 2.017 (R2 = 0.9992), 1.99 (R2 = 0.9995), and
1.999 (R2 = 0.9997), respectively.
For all investigated substances the fractal dimension determined from the ZFC is
practically identical to the average D obtained for the investigated frequency range, thus
providing further evidence that determination of D is not influenced by the frequency applied
in the impedance spectroscopy or ac voltammetric measurements.
4. Conclusions
We have investigated the possible influence of frequency of the sinusoidal excitation
signal in the electrochemical measurements of adsorption phenomena on the estimation of
fractal dimension and/or on the fractal ordering of adsorbed layers on the HMDE. Our results
indicate that:
The method of scaling the HMD to obtain the fractal dimension of adsorbed layer
is compatible with impedance spectroscopy, hence, the combination of the
methods can be used as a powerful tool to investigate fractal aspect of adsorption
of organic molecules,
Gašparović, Blaženka; Risović, Dubravko; Ćosović, Božena; Nelson, Andrew. The influence of frequency on fractal dimension of adsorbed layers. // Electrochimica Acta. 52 (2007), 7; 2527-2534. DOI: 10.1016/j.electacta.2006.08.073 –
Postprint Version
12
The appropriate frequency range for the application of the scaling of HMDE for
determination of fractal dimension in the impedance spectroscopy measurements
is approximately 30 Hz - 21.8 kHz.
In this frequency range the fractal ordering of adsorbed layer and the value of
fractal dimension obtained by the method of HMDE scaling is not influenced by
the frequency of applied sinusoidal voltage perturbations.
The values of fractal dimension, obtained by the scaling of HMDE in electrochemical
impedance spectroscopy of T-X-100 solutions, are in agreement with the values obtained
previously with ac voltammetry [3]. In all cases the fractal dimensions determined from the
ZFC are practically identical to the average D obtained for the investigated frequency range,
thus providing further evidence that determination of D is not influenced by the frequency
applied in the impedance spectroscopy or ac voltammetric measurements. Thus, the value of
fractal dimension of an adsorbed layer and its changes during the adsorption process reflect
the structure and transformations of the layer. In that context the observed decrease of fractal
dimension with bulk concentration reflects the fact that at high relative fractional coverages
corresponding to high bulk concentrations the adsorbed layer tends to be more homogenous
and/or transforms to a compact film that should have D 2. Generally, differences in fractal
structure or its absence, as in this case observed for tert-butanol, are related to specific
molecular interactions and isotropy/no isotropy of molecular structure and shape.
Acknowledgements
This work was funded by the Croatian Ministry of Science, Education and Sport, grants
No. 0098122 and No. 0098029.
References
[1] A.L. Barabási, H.E. Stanley (Eds.) "Fractal Concepts in Surface Growth", Cambridge
University Press, Cambridge (1995) ISBN: 0521483085.

Gašparović, Blaženka; Risović, Dubravko; Ćosović, Božena; Nelson, Andrew. The influence of frequency on fractal dimension of adsorbed layers. // Electrochimica Acta. 52 (2007), 7; 2527-2534. DOI: 10.1016/j.electacta.2006.08.073 –
Postprint Version
13
[2] P. Meakin, "Fractals, Scaling and Growth Far From Equilibrium", Cambridge University
Press, Cambridge (1998) ISBN: 0521452538.
[3] F. Family, T. Vicsek (Eds.) "Dynamics of Fractal Surfaces", World Scientific Pub Co Inc.
(1991), ISBN: 9810207204.
[4] D. Risović, B. Gašparović, B. Ćosović, Langmuir, 17 (2001) 1088.
[5] B. Gašparović, D. Risović, B. Ćosović, Electrochim. Acta 49 (2004) 3383.
[6] L. Pospišil, J. Phys. Chem. 92 (1988) 2501.
[7] M. Hromadová, R. Sokolová, L. Pospišil, N. Fanelli, J. Phys. Chem. B 110 (2006) 4869.
[8] F.L. Leite, L.G. Paterno, C.E. Borato, P.S.P. Herrmann, O.N. Oliviera Jr., L.H.C. Mattoso,
Polymer 46 (2005) 12503.
[9] H. Nygren, Biophys. J. 65 (1993) 1508.
[10] D. Risović, B. Gašparović, B. Ćosović, J. Phys. Chem. B, 106 (2002) 9810.
[11] D. Risović, B. Gašparović, B. Ćosović, Colloid. Surf. A 223, (2003) 145.
[12] N. Filipović-Vinceković, M. Bujan, Đ. Dragčević, N. Nekić, Colloid Polymer Sci. 273
(1995) 182.
[13] A. Nelson, Biophysical J. 80 (2001) 2694.
[14] M. Carla, G. Aloisi, M. L. Foresti, R. Guidelli, J. Electroanal. Chem. 197 (1986) 123.
[15] B. Gašparović, D. Risović, B. Ćosović, J. Electroanal. Chem. 573 (2004) 391.
[16] S. Sotiropolus, P. Nikitas, N. Papadopoulos. J. Electroanal. Chem. 356 (1993) 201.
[17] N. Batina, Z. Kozarac, B. Ćosović, J. Electroanal. Chem, 188 (1985) 153.
[18] H. Jehring. “Elektrosorptionanalyse mit der Wechelstrompolarografie“. Akademie
Verlag, Berlin. P 260, 1974.
[19] F. Pulidori, G. Borghesani, R. Pedriali, C. Bighi, J. Electroanal. Chem. 72 (1976) 65.
Gašparović, Blaženka; Risović, Dubravko; Ćosović, Božena; Nelson, Andrew. The influence of frequency on fractal dimension of adsorbed layers. // Electrochimica Acta. 52 (2007), 7; 2527-2534. DOI: 10.1016/j.electacta.2006.08.073 –
Postprint Version
14
Figure captions:
Fig. 1. Specific capacitance vs. applied potential: a) Pure electrolyte (curve 1), and T-X-
100 at bulk concentrations of 0.5 mg/dm3 (curve 2), 2.0 mg/dm3 (curve 3) and 100 mg/dm3
(curve 4). Dotted lines represent scans from -0.35 V to more positive potentials and full lines
represent scans from -0.35 V to more negative potentials; b) Pure electrolyte (curve 1), and
SDS at bulk concentrations of 0.4 mg/dm3 (curve 2), 1.0 mg/dm3 (curve 3) and 100 mg/dm3
(curve 4). c) Pure electrolyte (curve 1), and tert-butanol at bulk concentrations of 2.60 g/dm3
(curve 2), 4.63 g/dm3 (curve 3) and 9.27 mg/dm3 (curve 4). In b) and c) the dotted lines
represent scans from -0.6 V to more positive potentials and full lines represent scans from -
0.6 V to more negative potentials.
Fig. 2. Capacitive currents vs. t measured at selected potentials a) for pure electrolyte
(curve 1) and T-X-100 at bulk concentrations of 0.5 mg/dm3 (curve 2), 0.8 mg/dm3 (curve 3)
and 2 mg/dm3 (curve 4) at - 0.35 V; b) for pure electrolyte (curve 2) and SDS at bulk
concentrations of 0.4 mg/dm3 (curve 2), 0.7 mg/dm3 (curve 2) and 1 mg/dm3 (curve 2) at – 0.6
V.
Fig. 3. Cole-Cole plots for nine electrode sizes for a) pure electrolyte and b) 0.8 mg/dm3
T-X-100 solution obtained at E = - 0.35 V.
Fig. 4. Typical log-log plots of measured capacitance vs. radius of HMDE used as a scale
for determination of fractal dimension. Depicted are capacitances obtained at 821.9 Hz for
pure electrolyte, 0.5 mg/dm3 T-X-100, and 0.4 mg/dm3 SDS solutions.
Fig. 5. a) Fractal dimension determined for pure electrolyte for a broad frequency
spectrum at electrode potentials of - 0.35 V and - 0.60 V; b) dD/d(logf) vs. f for pure
electrolyte at E = - 0.35 V and E = - 0.6 V.
Fig. 6. Frequency dependence of the estimated fractal dimension obtained at equilibrium
conditions for T-X-100 with different bulk concentrations. Symbols denote measured values
and lines the corresponding B-spline fit.
Gašparović, Blaženka; Risović, Dubravko; Ćosović, Božena; Nelson, Andrew. The influence of frequency on fractal dimension of adsorbed layers. // Electrochimica Acta. 52 (2007), 7; 2527-2534. DOI: 10.1016/j.electacta.2006.08.073 –
Postprint Version
15
Fig. 7. Frequency dependence of the estimated fractal dimension obtained at equilibrium
conditions for SDS at different bulk concentrations. Symbols denote measured values and
lines the corresponding B-spline fit.
Fig 8. Frequency dependence of the estimated fractal dimension obtained at equilibrium
conditions for tert-butanol with different bulk concentrations. Symbols denote measured
values and lines the corresponding B-spline fit.
Gašparović, Blaženka; Risović, Dubravko; Ćosović, Božena; Nelson, Andrew. The influence of frequency on fractal dimension of adsorbed layers. // Electrochimica Acta. 52 (2007), 7; 2527-2534. DOI: 10.1016/j.electacta.2006.08.073 –
Postprint Version
16
0
10
20
30
40
50
0
10
20
30
40
50
0.0 -0.2 -0.4 -0.6 -0.8 -1.0 -1.2 -1.4 -1.6 -1.8 -2.0
0
10
20
30
40
50
C (F
/cm
2)
a
1
2 3
4
C (F
/cm
2)
1
23 4
b
2
3
1
4
c
C (F
/cm
2)
E (V)
Fig. 1.
Gašparović et al.
EAST06-564 – 1st revised version

Gašparović, Blaženka; Risović, Dubravko; Ćosović, Božena; Nelson, Andrew. The influence of frequency on fractal dimension of adsorbed layers. // Electrochimica Acta. 52 (2007), 7; 2527-2534. DOI: 10.1016/j.electacta.2006.08.073 –
Postprint Version
17
0.0
0.1
0.2
0.3
0.4
0.5
0.6
0 250 500 750 1000 1250 1500 1750 2000
0.0
0.1
0.2
0.3
0.4
I (m
A/c
m2)
a1
23
4
I (m
A/c
m2)
t (s)
1
23
4
b
Fig. 2.
Gašparović et al.
EAST06-564 – 1st revised version

Gašparović, Blaženka; Risović, Dubravko; Ćosović, Božena; Nelson, Andrew. The influence of frequency on fractal dimension of adsorbed layers. // Electrochimica Acta. 52 (2007), 7; 2527-2534. DOI: 10.1016/j.electacta.2006.08.073 –
Postprint Version
18
0.0 0.2 0.4 0.6 0.8 1.0 1.2 1.4 1.6
0.0
0.2
0.4
0.6
0.8
1.0
1.2
1.4
1.6
Re
Y
-1
Im Y-1
a
#1
#9
0.0 0.1 0.2 0.3 0.4
0.0
0.1
0.2
0.3
0.4
Re
Y w
-1
Im Y -1
b
#1
#9
Fig. 3.
Gašparović et al.
EAST06-564 – 1st revised version

Gašparović, Blaženka; Risović, Dubravko; Ćosović, Božena; Nelson, Andrew. The influence of frequency on fractal dimension of adsorbed layers. // Electrochimica Acta. 52 (2007), 7; 2527-2534. DOI: 10.1016/j.electacta.2006.08.073 –
Postprint Version
19
0.2 0.3 0.4 0.5 0.6 0.7
0.1
1
Electrolyte
D = 1.995
R2=0.9999
T-X-100
D= 2.285
R2= 0.999
SDS
D= 2.098
R2= 0.9968
C (F
)
r (mm)
Fig. 4.
Gašparović et al.
EAST06-564 – 1st revised version

Gašparović, Blaženka; Risović, Dubravko; Ćosović, Božena; Nelson, Andrew. The influence of frequency on fractal dimension of adsorbed layers. // Electrochimica Acta. 52 (2007), 7; 2527-2534. DOI: 10.1016/j.electacta.2006.08.073 –
Postprint Version
20
0.1 1 10 100 1000 10000
1.6
1.7
1.8
1.9
2.0
2.1
2.2
2.3
2.4
- 0.35 V
- 0.60 V
D
f (Hz)
a
-1 0 1 2 3 4 5
-1.5
-1.0
-0.5
0.0
0.5
1.0
1.5
dD
/d (
log
f)
- 0.35 V
- 0.60 V
log f
b
Fig. 5.
Gašparović et al.
EAST06-564 – 1st revised version

Gašparović, Blaženka; Risović, Dubravko; Ćosović, Božena; Nelson, Andrew. The influence of frequency on fractal dimension of adsorbed layers. // Electrochimica Acta. 52 (2007), 7; 2527-2534. DOI: 10.1016/j.electacta.2006.08.073 –
Postprint Version
21
10 100 1000 10000
1.9
2.0
2.1
2.2
2.3
2.4
0.5 mg/dm3
0.8 mg/dm3
2.0 mg/dm3D
f (Hz)
Fig. 6.
Gašparović et al.
EAST06-564 – 1st revised version
Gašparović, Blaženka; Risović, Dubravko; Ćosović, Božena; Nelson, Andrew. The influence of frequency on fractal dimension of adsorbed layers. // Electrochimica Acta. 52 (2007), 7; 2527-2534. DOI: 10.1016/j.electacta.2006.08.073 –
Postprint Version
22
10 100 1000 10000
1.8
1.9
2.0
2.1
2.2
2.3
D
f (Hz)
0.4 mg/dm3
0.7 mg/dm3
1.0 mg/dm3
Fig. 7.
Gašparović et al.
EAST06-564 – 1st revised version

Gašparović, Blaženka; Risović, Dubravko; Ćosović, Božena; Nelson, Andrew. The influence of frequency on fractal dimension of adsorbed layers. // Electrochimica Acta. 52 (2007), 7; 2527-2534. DOI: 10.1016/j.electacta.2006.08.073 –
Postprint Version
23
10 100 1000 10000
1.8
1.9
2.0
2.1
2.2
2.3
D
f(Hz)
2.60 g/dm3
4.63 g/dm3
9.27 g/dm3
Fig 8.
Gašparović et al.
EAST06-564 – 1st revised version