influence of global vegetation on mid- tropospheric co2
TRANSCRIPT

Jet Propulsion Laboratory!California Institute of Technology!
Influence of Global Vegetation on Mid-Tropospheric CO2 Early Results
AIRS Science Team Meeting
April 25, 2012
Thomas S. Pagano, Hai Nguyen, Ed Olsen California Institute of Technology, Jet Propulsion Laboratory
4800 Oak Grove Drive, Pasadena, CA, USA 91109
[email protected], (818) 393-3917, http://airs.jpl.nasa.gov
© 2012 California Institute of Technology. Government sponsorship acknowledged.

Jet Propulsion Laboratory!California Institute of Technology! Introduction
• AIRS Mid-Tropospheric CO2 shows a high degree of horizontal variability • Ongoing efforts show AIRS data influenced by global circulation patterns
including ENSO and MJO – Jiang, X., M. T. Chahine, E. T. Olsen, L. L. Chen, and Y. L. Yung (2010),
Interannual variability of mid-tropospheric CO2 from Atmospheric Infrared Sounder, Geophys. Res. Lett., 37, L13801, doi:10.1029/2010GL042823
– Li, K. F., B. Tian, D. E. Waliser, Y. L. Yung (2010), Tropical mid-tropospheric CO2 variability driven by the Madden-Julian oscillation, PNAS, 107 (45), 19171-19175, doi:10.1073/pnas.1008222107.
• What is the influence of global vegetation cycle on CO2 seasonal behavior? – Can we correlate mid-trop CO2 seasonal variability with global vegetation for
different regions? – For now: First look at zonal averages and Land Vegetation (ocean biomass
later) – Goal: Sanity Check on AIRS Data Seasonal Cycle, Solicit interest by carbon
cycle community – Outreach Opportunity: International Workshop on Greenhouse Gas
Measurements (IWGGMS) 2012 at CalTech
2

Jet Propulsion Laboratory!California Institute of Technology!
Can Regional Carbon Transport and Storage Be Validated using Satellite Obs?
3
1 Pg = 1015 g x (10-3 kg/g) x (1T/907.2 kg) =1.102 GT
57.8 GT
51.4 GT
How well known are global flux estimates?

Jet Propulsion Laboratory!California Institute of Technology! Agenda
• CO2 Data – AIRS Level 3 – Creation of a “Climatology”
• Land Vegetation Data: GPP Gross Primary Productivity – MODIS Enhanced Vegetation Index – MODIS Land Surface Temperature – GPP Climatology
• Early Zonal Correlation Results
• Future Work
4

Jet Propulsion Laboratory!California Institute of Technology!
AIRS V5 Mid-Tropospheric CO2 Shows Horizontal Variability
AIRS Daily CO2 Yield 1ºx1º Spatial Resolution
AIRS Monthly CO2 Yield 1ºx1º Spatial Resolution
Day/Night, Pole-to-Pole, Land/Ocean/Ice, Cloudy/Clear
AIRS CO2 Data Products Released (2002 to present) http://airs.jpl.nasa.gov/AIRS_CO2_Data

Jet Propulsion Laboratory!California Institute of Technology!
AIRS Mid-Tropospheric CO2 Representations (“Climatologies”)
CO2 Monthly Representation for January
CO2 Monthly Representation for March
CO2 Monthly Representation for May
CO2 Monthly Representation for July
CO2 Monthly Representation for September
CO2 Monthly Representation for November CO2 Monthly Representation for December
CO2 Monthly Representation for October
CO2 Monthly Representation for August
CO2 Monthly Representation for June
CO2 Monthly Representation for April
CO2 Monthly Representation for February
Average of L3 Monthly Data by Month over 8 years
Pagano, T. S., Olsen, E. T., Chahine, M. T., Ruzmaikin, A., Nguyen, H., Jiang, X., “Monthly representations of mid-tropospheric carbon dioxide from the Atmospheric Infrared Sounder,” Proc. SPIE 8158-11, San Diego, CA (2011).

Jet Propulsion Laboratory!California Institute of Technology!
“Depleted Band of CO2 Not Due to Surface Vegetation”
7 CHUNZAI WANG, Atlantic Climate Variability and Its Associated Atmospheric Circulation Cells, Journal of Climate, 2001
Downward Flow of Walker Circulation

Jet Propulsion Laboratory!California Institute of Technology!
Gross Primary Productivity using MODIS Temperature and Greenness (TG)
8
Sims, D. et al., A new model of gross primary productivity for North American ecosystems based solely on the enhanced vegetation index and land surface temperature from MODIS, Remote Sensing of Environment 112 (2008) 1633–1646
Using Average m gives < 18% error
MODIS Night LST
Jet Propulsion Laboratory!California Institute of Technology! Data Sets
• Mirador.gsfc.nasa.gov • MYDVI.005 MODIS/Aqua Monthly Vegetation Indices Global 1x1
degree • MYD11CM1N.005 MODIS/Aqua Monthly mean Night-Time Land
Surface Temperature at 1x1 degree • AIRX3C2M.005 AIRS/Aqua Level 3 Monthly CO2 in the free
troposphere (AIRS+AMSU)
9

Jet Propulsion Laboratory!California Institute of Technology! MODIS EVI needed to make GPP
• EVI – Simple mean EVI (Enhanced Vegetation Index) was calculated from MOD13C2 sds2 CMG
0.05 Deg Monthly EVI only for cells within valid EVI range. Cells with Fill_Values were not included in the analysis. The dataset is produced with full global coverage. Land/water mask is accepted from the original dataset resolution 0.05 degrees. Grid cells with no land surface are assigned the “_FillValue” – 1.0.
• perc_fill_value = (Fill_Cell_Count * 100) / 400 – where Fill_Cell_Count is the number of the 0.05 degree cells with the Fill Value within the 1
degree cell, and 400 is the total number of 0.05 degree cells within the aggregated 1 degree cell. The output values are rounded to the nearest integer. Percent Fill Values were calculated for each 1 degree cell. No “_FillValues” are assigned to this layer.
• perc_good_pixels = (Count_GOOD_pixel * 100) / Count_NonFill_Cell – where Count_GOOD_pixel is the number of 0.05 degree cells flagged as “GOOD” (value 0)
quality within the aggregated 1degree cell, Count_NonFill_Cell is the number of 0.05 degree cells within the valid range of pixel reliability values within the aggregated 1 degree cell. The output values are rounded to the nearest integer. Percent GOOD Quality Data are calculated for each 1 degree cell. No “_FillValues” are assigned to this layer.
– Percent GOOD Quality Data is calculated from MOD13C2 sds13 CMG 0.05 Deg Monthly pixel reliability only for cells within the valid range of values.

Jet Propulsion Laboratory!California Institute of Technology! MODIS EVI Gridded 1x1°Monthly
11

Jet Propulsion Laboratory!California Institute of Technology! MODIS EVI QC Example
12
perc_fill_value = 100/400 x 100 = 25% perc_good_pixels = 70/100 x 100 = 70%
Land
Ocean
30 40
Land Low QC (30)
1°
1°
0.05 degree Climate Modeling Grid global coverage product
Mostly >90% Fill Mostly >0 QC
Ignore perc_fill_value (for now)

Jet Propulsion Laboratory!California Institute of Technology! MODIS Night LST needed to make GPP
• night_lst – The dataset contains global monthly-mean day-time and night-time land surface temperature
averaged within 1 by 1 degree grid cells. The source for the data is MODIS MOD11C3 product (MODIS Monthly mean land surface temperature at 0.05 degree spatial resolution). The dataset covers the time period strating January 2000.
– The MODIS/Aqua V4 LST/E 8-Day L3 Global CMG product (Short name: MYD11C3) is a monthly composited average, derived from the MYD11C1 daily global product, and stored as clear-sky LST values during a month’s period in a 0.05º (5600 meters) geographic CMG. MYD11C3, therefore, inherits all the structural features of its MYD11C1 parent except for the temporal configuration. Please refer to the MYD11C1 product documentation for all algorithm-related details.
– The V4 MYD11C3 product comprises the following Science Data Set (SDS) layers for daytime and nighttime observations: LSTs, quality control assessments, observation times, view zenith angles, clear sky coverages, and emissivities for bands 20, 22, 23, 29, 31, and 32.
– The V4 Aqua/MODIS LST/E products, including MYD11C3, are validated to Stage-1 with well-defined uncertainties over a range of representative conditions. Further details regarding MODIS land product validation for the LST/E products is available from the following URL: http://landval.gsfc.nasa.gov/ProductStatus.php?ProductID=MYD11
13

Jet Propulsion Laboratory!California Institute of Technology!
MODIS Night Land Surface Temperature 1x1°
14
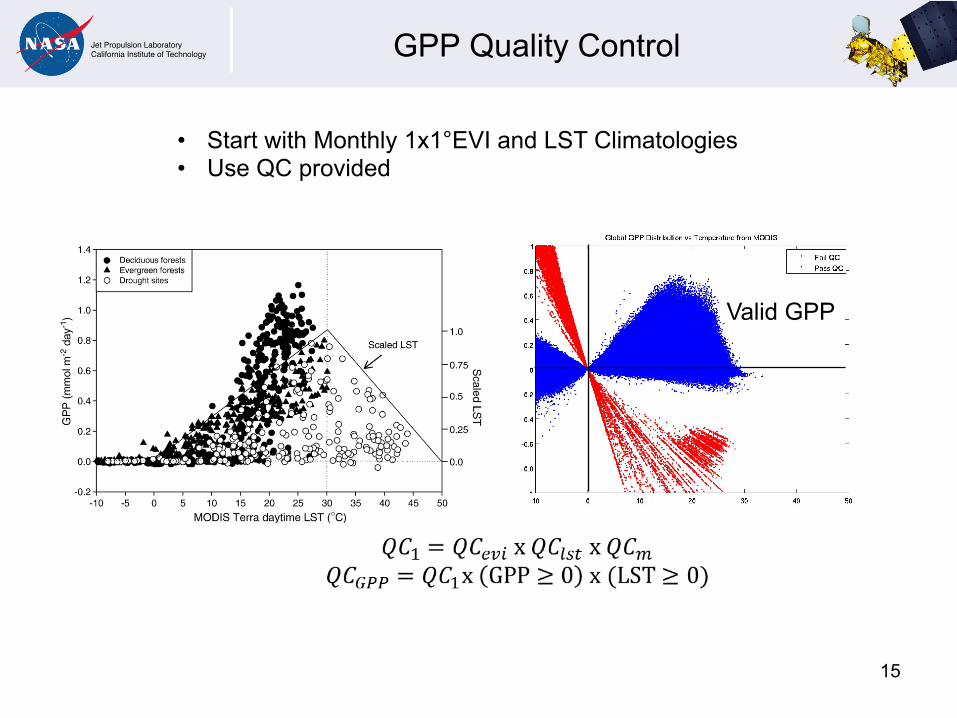
Jet Propulsion Laboratory!California Institute of Technology! GPP Quality Control
15
• Start with Monthly 1x1°EVI and LST Climatologies • Use QC provided
Valid GPP

Jet Propulsion Laboratory!California Institute of Technology!
MODIS GPP Climatology Developed using MODIS EVI and LST
16
UMT GPP

Jet Propulsion Laboratory!California Institute of Technology!
Correlate AIRS CO2 and MODIS Derived GPP to Qualitatively Assess Influence
17
Average Trend Amplitude Phase
We will compare average global and regional averages, seasonal amplitude and phase Trend contains high uncertainties that have not yet been quantified (save for later)

Jet Propulsion Laboratory!California Institute of Technology! First look at Averages
18

Jet Propulsion Laboratory!California Institute of Technology!
Seasonal Response Shows Key Differences
19
GPP CO2
• Based on “Climatology” of 2003-2010 • Peak of GPP Response about 3mo after CO2 • Polar response of CO2 irregular

Jet Propulsion Laboratory!California Institute of Technology!
Seasonal Amplitude Grows as we go Poleward in NH
20
Using Sine Fit
EVI
CO2

Jet Propulsion Laboratory!California Institute of Technology!
Early Phase Analysis shows Correlation between CO2 and EVI + Zonal Dependence
21
3-Month Delay Removed from EVI
and 180 degree Phase Shift applied
Jet Propulsion Laboratory!California Institute of Technology!
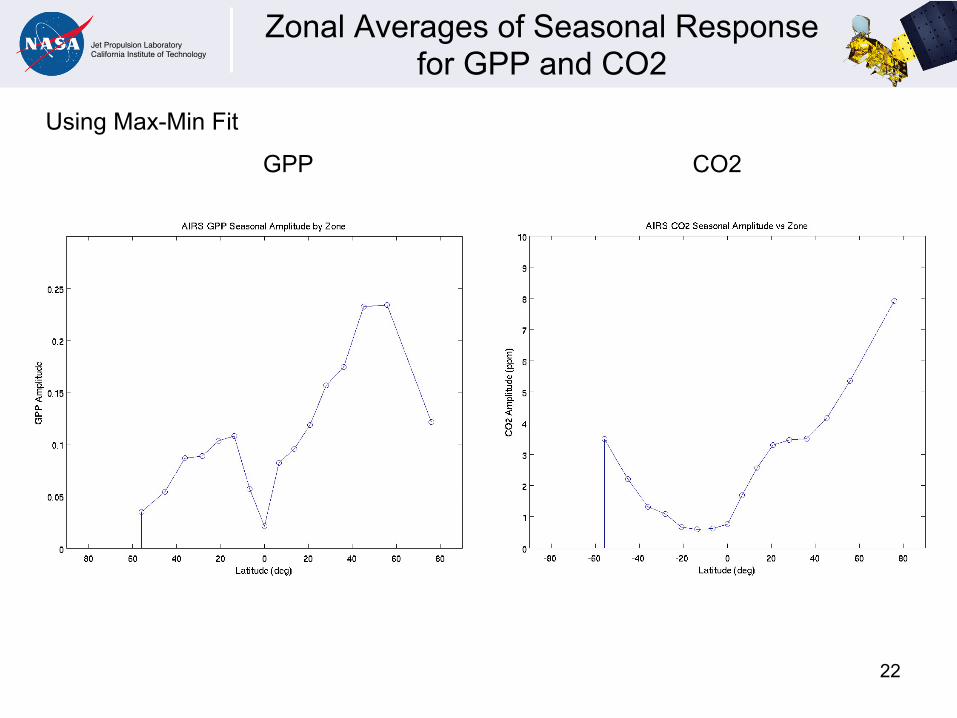
Zonal Averages of Seasonal Response for GPP and CO2
22
GPP CO2
Using Max-Min Fit

Jet Propulsion Laboratory!California Institute of Technology!
CO2 and GPP Seasonal Amplitudes Correlated by Zone
23
Tropics and SH
NH

Jet Propulsion Laboratory!California Institute of Technology!
CO2 and EVI Animation (L. Perkins GSFC/SVS)
24
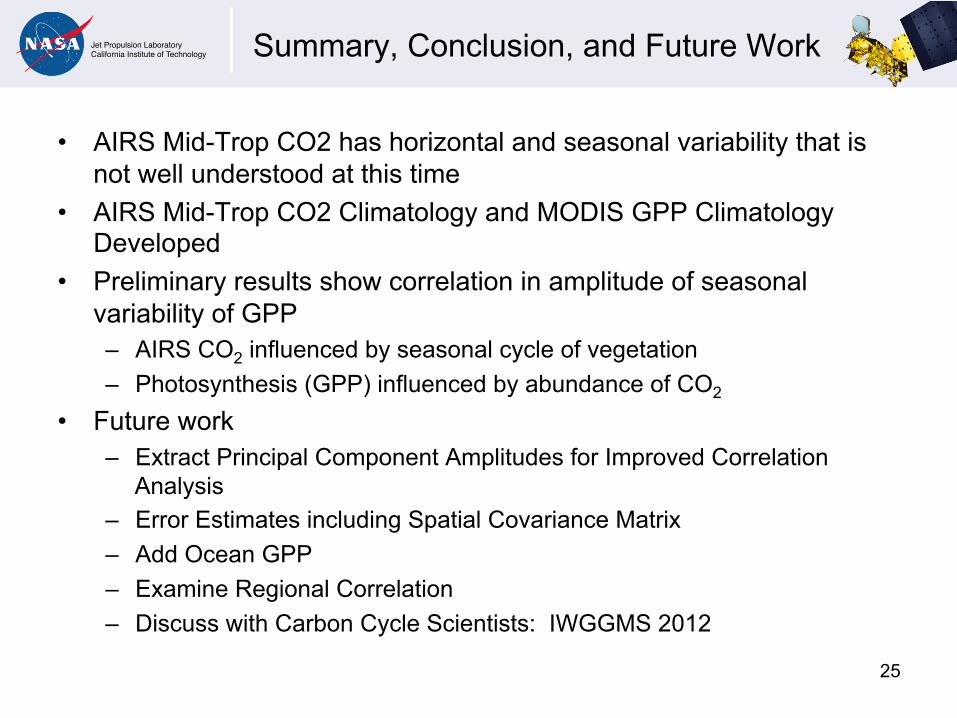
Jet Propulsion Laboratory!California Institute of Technology! Summary, Conclusion, and Future Work
• AIRS Mid-Trop CO2 has horizontal and seasonal variability that is not well understood at this time
• AIRS Mid-Trop CO2 Climatology and MODIS GPP Climatology Developed
• Preliminary results show correlation in amplitude of seasonal variability of GPP – AIRS CO2 influenced by seasonal cycle of vegetation – Photosynthesis (GPP) influenced by abundance of CO2
• Future work – Extract Principal Component Amplitudes for Improved Correlation
Analysis – Error Estimates including Spatial Covariance Matrix – Add Ocean GPP – Examine Regional Correlation – Discuss with Carbon Cycle Scientists: IWGGMS 2012
25