influence of idealized pushover curves on seismic response · influence of idealized pushover...
TRANSCRIPT

INFLUENCE OF IDEALIZED PUSHOVER CURVES
ON
SEISMIC RESPONSE
A THESIS SUBMITTED TO
THE GRADUATE SCHOOL OF NATURAL AND APPLIED SCIENCES
OF
MIDDLE EAST TECHNICAL UNIVERSITY
BY
KORAY KADAŞ
IN PARTIAL FULFILLMENT OF THE REQUIREMENTS
FOR
THE DEGREE OF MASTER OF SCIENCE
IN
CIVIL ENGINEERING
SEPTEMBER 2006

Approval of the Graduate School of Natural and Applied Sciences
Prof. Dr. Canan Özgen Director
I certify that this thesis satisfies all the requirements as a thesis for the degree of Master of
Science.
Prof. Dr. Erdal Çokça Head of Department
This is to certify that we have read this thesis and that in our opinion it is fully adequate,
in scope and quality, as a thesis for the degree of Master of Science.
Assoc. Prof. Dr. Ahmet Yakut
Supervisor
Examining Committee Members
Assoc. Prof. Dr. Sinan AKKAR (METU, CE)
Assoc. Prof. Dr. Ahmet YAKUT (METU, CE)
Assoc. Prof. Dr. Barış BİNİCİ (METU, CE)
Asst. Prof. Dr. Altuğ ERBERİK (METU, CE)
Nejat BAYÜLKE, MSc. (Artı Eng. Consultancy)

I hereby declare that all information in this document has been obtained and
presented in accordance with academic rules and ethical conduct. I also declare that,
as required by these rules and conduct, I have fully cited and referenced all material
and results that are not original to this work.
Name, Last name : Koray KADAŞ
Signature :
iii
ABSTRACT
INFLUENCE OF IDEALIZED PUSHOVER CURVES
ON
SEISMIC RESPONSE
KADAŞ, Koray
M.S., Department of Civil Engineering
Supervisor : Assoc. Prof. Dr. Ahmet YAKUT
September 2006, 320 pages
Contemporary approach performance based engineering generally relies on the
approximate procedures that are based on the use of capacity curve derived from pushover
analysis. The most important parameter in the displacement-based approach is the
inelastic displacement demand computed under a given seismic effect and the most
common procedures employed for this estimation; the Capacity Spectrum Method and the
Displacement Coefficient Method are based on bi-linearization of the capacity curve.
Although there are some recommendations for this approximation, there is a vital need for
rational guidelines towards the selection of the most appropriate method among several
alternatives.
Considering the presence of several idealization alternatives and the absence of
rational guidelines to select the most suitable method, a comprehensive research has been
undertaken to evaluate the influence of several existing alternatives used for
approximating the capacity curve on seismic demands. A number of frames were analyzed
under a set of 100 ground motions employing OpenSees as the structural analysis
platform. In addition to the nonlinear time history analyses conducted on multi-degree-of-
freedom frame systems, nonlinear static analyses were also utilized to obtain the global
response of the frames. The pushover curves obtained were later approximated using
iv
several alternatives and the resulting curves were assigned as the force-deformation
relationships of corresponding equivalent single-degree-of-freedom systems. These
simplified systems were analyzed under the same ground motion database to evaluate the
errors in predicting the seismic responses in terms of displacement, story drift and force
demands.
Using the results of the complex and simplified analyses, the performance of each
approximation method was evaluated in estimating the ‘exact’ inelastic deformations of
the multi-degree-of-freedom systems at various degrees of inelasticity. Dependency of the
errors on ductility, strength reduction factor and period was also investigated for different
alternatives of idealization of the capacity curve. Moreover, the results of common bi-
linearization methods were also compared with the results obtained from the analyses of
multi-linearized capacity curve in order to seek the performance of these methods in
predicting global response. The interpretations made and the conclusions drawn in this
study is believed to clarify the rationality and accuracy of selecting the appropriate
idealization of the capacity curve.
Keywords: Pushover analysis, approximate procedures, bi-linearization, capacity curve
v

ÖZ
BASİTLEŞTİRİLMİŞ PUSHOVER EĞRİLERİNİN
SİSMİK DAVRANIŞ ÜZERİNDEKİ ETKİSİ
KADAŞ, Koray
Yüksek Lisans, İnşaat Mühendisliği Bölümü
Tez Yöneticisi : Doç. Dr. Ahmet YAKUT
Eylül 2006, 320 sayfa
Günümüz yaklaşımı olan performansa dayalı mühendislik genel olarak, binaların
itme analizinden elde edilmiş kapasite eğrilerinin kullanımına dayalı yaklaşık yöntemler
üzerine kurulmuştur. Deplasmana dayalı yaklaşımdaki en önemli parametre belirli bir
sismik etki altında hesaplanmış olan elastik olmayan deplasman talebidir ve bu
parametrenin tahmini için sıkça kullanılan yöntemlerden Kapasite Spektrum ve
Deplasman Katsayısı metotları itme eğrilerinin basitleştirilmiş haline dayanır. Kapasite
eğrilerinin basitleştirilmesi için çeşitli öneriler bulunmasına rağmen, bu önerilerden en
uygun olanının seçilmesine yönelik rasyonel yönergelere ihtiyaç duyulmaktadır.
Birçok idealleştirme alternatifinin bulunması ve en uygun metodun seçilebilmesi
için gereken yönergelerin eksikliği göz önünde bulundurularak, itme eğrilerinin
idealleştirmesinde kullanılan mevcut alternatiflerin sismik davranış üzerindeki etkisini
incelemek üzere detaylı bir araştırma yapılmıştır. Bu amaçla, OpenSees analiz platformu
kullanılarak 7 çerçeve 100 ayrı deprem altında analiz edilmiştir. Çerçevelerin çok
serbestlik dereceli modelleri üzerinde yapılan elastik ötesi dinamik analizlere ek olarak,
çerçevelerin genel davranışını elde edebilmek amacıyla lineer olmayan statik analizler de
yapılmıştır. Elde edilen pushover eğrileri çeşitli alternatifler kullanılarak idealleştirilmiş
ve eşdeğer tek serbestlik dereceli sistemlerin kuvvet-deplasman ilişkisi olarak atanmıştır.
Basitleştirilmiş bu modeller aynı deprem veritabanı kullanılarak analiz edilmiş ve
vi

deplasman, kat ötelenmesi ve kuvvet bazlı sismik davranış parametreleri yaklaşık olarak
da hesaplanmıştır.
Kapsamlı ve basitleştirilmiş analizlerden elde edilmiş sonuçlar, idealleştirme
alternatiflerinin çok serbestlik dereceli sistemin çeşitli elastik ötesi seviyelerindeki
performansının değerlendirilmesinde kullanılmıştır. Ayrıca, alternatiflerin hata oranlarının
süneklik seviyesi, kuvvet azaltım seviyesi ve periyoda bağlı değişimleri de rasyonel olarak
irdelenmiştir. Bununla birlikte, sık olarak kullanılan idealleştirme alternatiflerinin kapasite
eğrisinin orijinal haline göre de değerlendirmesi yapılmış olup, bu metotların genel
davranışı ne kadar iyi yakalayabildikleri de incelenmiştir. Bu çalışmada; elde edilen
sonuçlar ve yapılan yorumlar sayesinde en uygun basitleştirme yönteminin rasyonel olarak
seçilmesine yönelik bilimsel bir katkı sağlandığı düşünülmektedir.
Anahtar Sözcükler: İtme analizi, yaklaşık yöntemler, basitleştirme, kapasite eğrisi
vii

ACKNOWLEDGMENTS
This study was conducted under the supervision of Assoc. Prof. Dr. Ahmet Yakut.
I would like to express my sincere appreciation for the support, guidance and insights that
he has provided me throughout the study.
I would also like to thank Assoc. Prof. Dr. Barış Binici for his productive
comments during the study and I would like to acknowledge the valuable contribution of
Asst. Prof. Dr. Altuğ Erberik by providing his own ground motion database for this study.
The scholarship provided by The Scientific and Technological Research Council
of Turkey (TÜBİTAK) during the graduate study is highly acknowledged.
I want to thank my friends and colleagues at Structural Mechanics Laboratory for
their help and friendship during my assistantship.
My dear Tuba was always alongside with me. Your support, encouragement and
love are priceless for me…
I would like to express my deepest appreciation to my parents -the most precious
people in my life- for their confidence in me and for the support, love and understanding
that they have provided me throughout my life.
viii

TABLE OF CONTENTS
PAGE
PLAGIARISM ............................................................................................. iii ABSTRACT................................................................................................. iv ÖZ ................................................................................................................ vi ACKNOWLEDGMENTS ......................................................................... viii TABLE OF CONTENTS............................................................................. ix CHAPTER
1. INTRODUCTION.................................................................................... 1 1.1 BACKGROUND ......................................................................................... 1
1.2 LITERATURE SURVEY ............................................................................ 2
1.3 OBJECTIVE AND SCOPE ......................................................................... 7
2. DESCRIPTION OF GROUND MOTIONS AND FRAMES ..........10
2.1 GENERAL ................................................................................................. 10
2.2 DESCRIPTION OF FRAMES................................................................... 10 2.3 SELECTED GROUD MOTIONS ............................................................. 11
3. ANALYSES OF FRAMES................................................................... 19 3.1 GENERAL ................................................................................................. 19
3.2 ANALYSES WITH OPENSEES............................................................... 19
3.3 NONLINEAR TIME HISTORY ANALYSES.......................................... 22
3.3.1 Modeling and Assumptions....................................................23
ix
PAGE
3.3.2 Nonlinear Time History Analyses Results .............................23
3.4 NONLINEAR STATIC ANALYSES........................................................ 24
3.4.1 Modeling and Assumptions....................................................24
3.4.2 Nonlinear Static Analyses Results .........................................26
3.5 SINGLE DEGREE OF FREEDOM ANALYSES..................................... 32
3.5.1 Equivalent SDOF from MDOF..............................................33
3.5.2 Idealization of Pushover Curves ............................................35
3.5.3 Equivalent SDOF Analyses Results.......................................42
3.6 COMPARISON OF RESULTS ................................................................. 45
4. INTERPRETATION OF RESULTS ...................................................46
4.1 INTRODUCTION ..................................................................................... 46
4.2 INTERPRETATIONS WITH RESPECT TO ‘EXACT’ RESULTS......... 46
4.2.1 Correlation Studies.................................................................46
4.2.2 Comparison of Methods at Various Levels of Global Drift...51
4.2.3 Period-wise Comparison of Methods.....................................55
4.2.4 Trends and Dependencies on Ductility and Strength
Reduction Factor ....................................................................60
4.3 SUMMARY OF COMPARISONS............................................................ 68
5. CONCLUSIONS AND RECOMMENDATIONS ............................ 72
5.1 SUMMARY .............................................................................................. 72
5.2 CONCLUSIONS ....................................................................................... 73
5.3 FUTURE STUDY RECOMMENDATIONS ............................................ 75
x

PAGE
REFERENCES............................................................................................ 76
APPENDICES
A. FRAME DATA, RESULTS AND COMPARISONS OF ANALYSES............................................................................................79
A.1 DESCRIPTION OF CASE STUDY FRAMES ........................................ 79
A.1.1 F2S2B............................................................................................. 79
A.1.2 F2S2B2........................................................................................... 81
A.1.3 F3S2B............................................................................................. 82
A.1.4 F5S2B............................................................................................. 84
A.1.5 F5S4B............................................................................................. 86
A.1.6 F5S7B............................................................................................. 88
A.1.7 F8S3B............................................................................................. 90
A.2 NONLINEAR TIME HISTORY ANALYSIS RESULTS ........................ 94
A.3 EQUIVALENT SDOF ANALYSIS RESULTS...................................... 101
A.4 COMPARISON RESULTS OF APPROXIMATIONS........................... 129
A.5 COMPARISON OF APPROXIMATE RESULTS
(SCATTER GRAPHS) ............................................................................ 171
A.6 DRIFT-WISE COMPARISON GRAPHS ............................................... 193
A.7 DEPENDENCY GRAPHS ...................................................................... 215
B. INTERPRETATION OF RESULTS WITH RESPECT TO ‘MULTI’ METHOD .............................................................................300
B.1 INTRODUCTION ................................................................................... 300
B.2 INTERPRETATIONS WITH RESPECT TO ‘MULTI’ RESULTS ....... 300
B.2.1 Correlation Studies ..............................................................300
xi
PAGE
B.2.2 Comparison of Methods at Various Levels of
Global Drift ..........................................................................304
B.2.3 Period-wise Comparison of Methods ..................................307
B.2.4 Trends and Dependencies on Ductility and Strength
Reduction Factor ..................................................................309
B.3 SUMMARY OF COMPARISONS.......................................................... 319
xii
CHAPTER 1
INTRODUCTION
1.1 BACKGROUND
Contemporary approach, named as performance based engineering, generally
utilizes approximate procedures rather than conducting nonlinear time history analyses
either to evaluate existing structures or to design new ones. The reason behind employing
approximate procedures is simply the presence of many drawbacks of nonlinear time
history analysis. Since the nonlinear time history analysis method is computationally
complex, structural engineering community does not prefer it for analyzing the structures
most of the time. In contrast to nonlinear time history analysis method, the simplicity
provided considering both modeling and computational scheme in nonlinear static analysis
and the easiness of its use and interpretability, although at the expense of accuracy, have
made this analysis method the an attractive alternative.
The nonlinear static analysis, or shortly the pushover analysis, reflects the global
behavior of a structure through a capacity curve representing the lateral force-deformation
characteristics of the structure and forms the basis of approximate procedures which use
the capacity curve to determine the seismic demands imposed on the structure. The most
important parameter among the engineering demand parameters in performance based
evaluation and design is the inelastic displacement demand under a given seismic event.
To determine the inelastic deformation demand, two widely used approximate procedures
that rely on pushover curve of the structure exist. These procedures, namely the Capacity
Spectrum Method of ATC-40 [3] and the Displacement Coefficient Method of FEMA 356
[10] generally use a bi-linear representation of the original pushover curve to compute the
approximate inelastic displacement demand. The original pushover curve is typically
obtained by applying a load pattern that represents the first mode response of the structure.
1

In these procedures, the multi-degree-of-freedom (MDOF) system is represented by an
equivalent single-degree-of-freedom (SDOF) system with the idealized load-deformation
curve. Then, the equivalent SDOF system is analyzed to obtain the approximate
displacement demand. Further steps of performance assessment of the structure’s
components depend on this approximate displacement demand. Thus, the idealization of
the capacity curve can be an important source of error that can affect the estimation of the
inelastic displacement demand. Although there are some recommendations for this
approximation, there is a crucial need for rational guidelines towards selection of the most
appropriate method among several limited alternatives.
1.2 LITERATURE SURVEY
The idealization concept of force-deformation relationships was first used for the
practical design computations of reinforced concrete elements in which the engineer was
proportioning the members according to the ductility calculations in terms of
displacement, rotation and curvature. Since ductility computation had to be based on
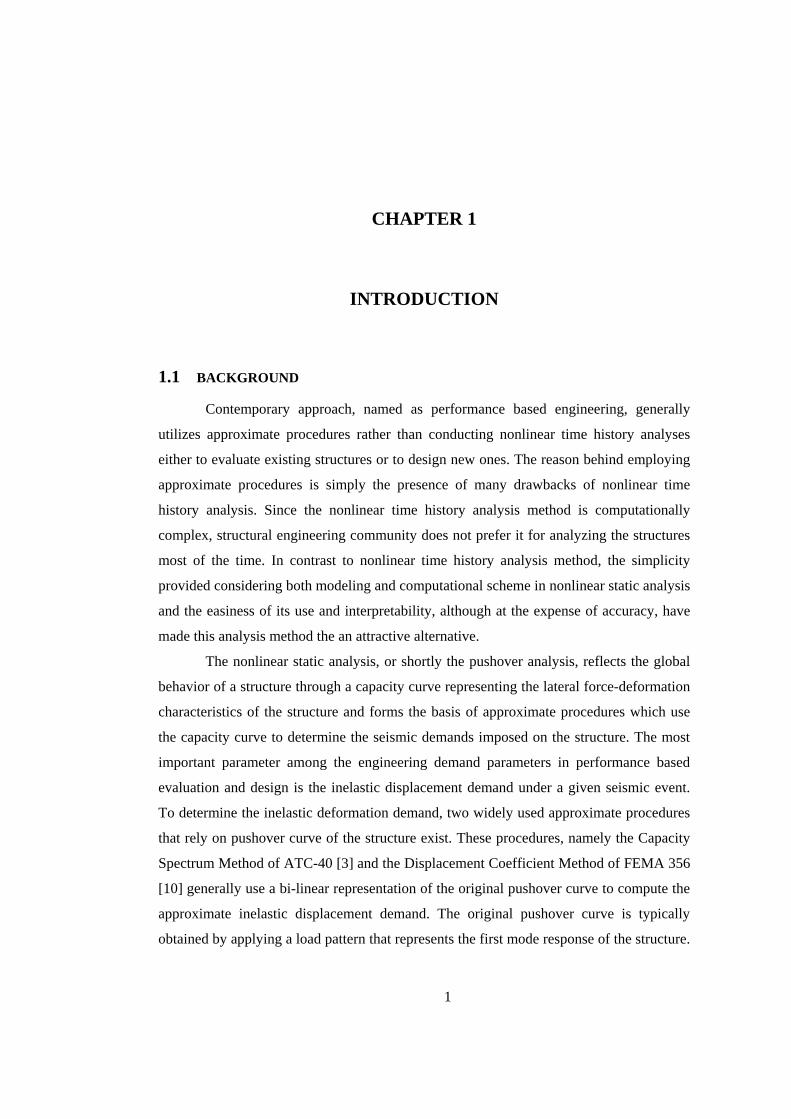
realistic definition of yield deformation, several alternative definitions were used by
previous investigators. As Park [16] expressed, alternative definitions of the yield
displacement are 1) the displacement when longitudinal steel reinforcement yields, 2) the
yield displacement of the equivalent elasto-plastic system with the same elastic stiffness
and ultimate load as the real system, 3) the yield displacement of the equivalent elasto-
plastic system with the same energy absorption as the real system, and 4) the yield
displacement of the equivalent elasto-plastic system with reduced stiffness found as the
secant stiffness at 75% of the ultimate lateral load Hu of the real system, as illustrated in
Figure 1.1. The most realistic definition for the yield displacement for reinforced concrete
structures was proposed as the last definition by Park [16]. The proposition was based on
Priestley and Park [18] that aimed at improving the understanding of seismic performance
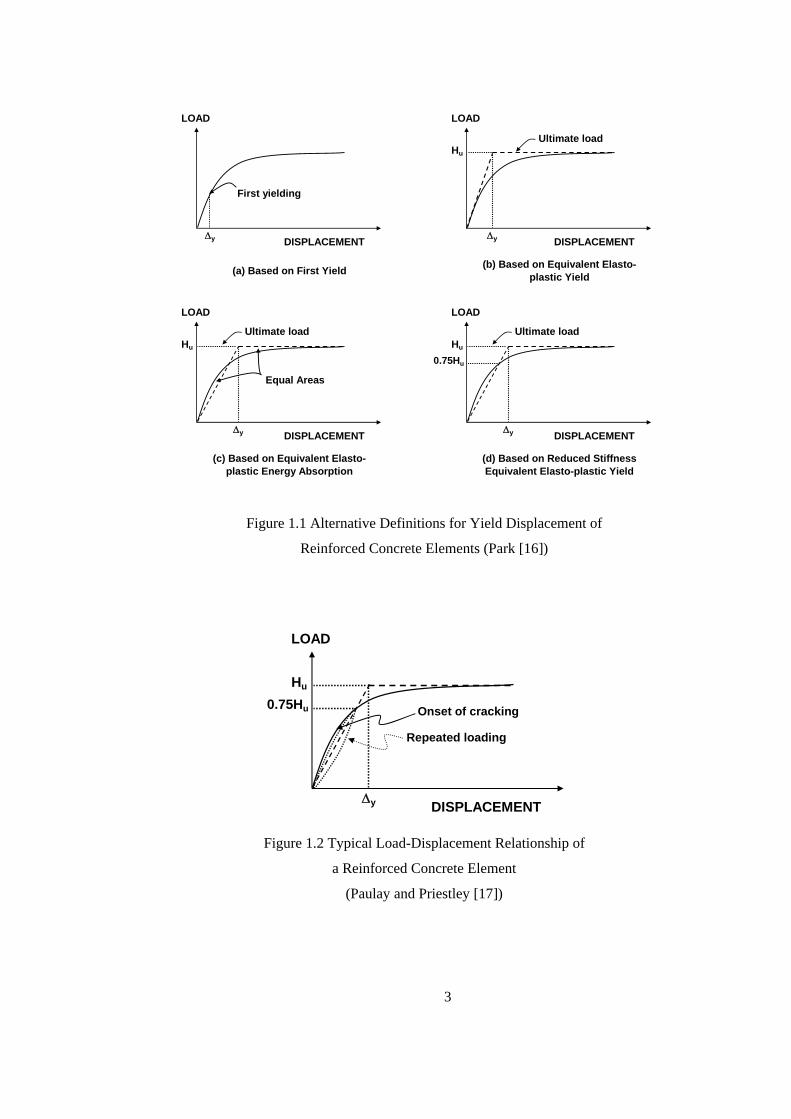
of bridge substructures. As indicated in Priestley and Park [18], Park [16], and Paulay and
Priestley [17], the last definition takes the secant stiffness as described in order to include
the reduction in stiffness due to cracking near the end of the elastic range. The
experiments conducted by Priestley and Park [18] supported the secant stiffness
assumption such that under cyclic loading at high “elastic” response levels, the initial
curved load-displacement characteristic would modify to a curve close to the linear
relationship of the idealized response as depicted in Figure 1.2.
2
(a) Based on First Yield
LOAD
DISPLACEMENT
First yielding
Δy
(b) Based on Equivalent Elasto-
plastic Yield
LOAD
DISPLACEMENT
Ultimate load
Δy
Hu
(c) Based on Equivalent Elasto-plastic Energy Absorption
LOAD
DISPLACEMENTΔy
Hu
Ultimate load
Equal Areas
(d) Based on Reduced Stiffness Equivalent Elasto-plastic Yield
LOAD
DISPLACEMENTΔy
Hu
Ultimate load
0.75Hu
Figure 1.1 Alternative Definitions for Yield Displacement of
Reinforced Concrete Elements (Park [16])
LOAD
DISPLACEMENTΔy
Hu
0.75Hu
Repeated loading
Onset of cracking
Figure 1.2 Typical Load-Displacement Relationship of
a Reinforced Concrete Element
(Paulay and Priestley [17])
3

Using the idea that the reinforced concrete frame systems are composed of
reinforced concrete elements and the global structural behavior will be analogous to the
component behavior, the first examples of idealizing force-displacement relationships of
structures were based on the methods that are mentioned above. As it was recommended
in ATC-19 [2], there were two common methods to idealize the force-deformation of a
building for the purposes of design as illustrated in Figure 1.3.
(a) Paulay & Priestley
Base Shear Force (V)
Displacement (Δ)Δy
VyActual response
0.75Vy
Δm
(b) Equal Energy
Base Shear Force (V)
Displacement (Δ)Δy
Vy
Area 1
Δm
Area 2
Figure 1.3 Bi-linearization Methods of a Force-Displacement Relationship
(ATC-19 [2])
The first approximation, which was based on the method proposed by Paulay and
Priestley [17] and had been developed for characterizing the load-displacement relation
for reinforced concrete elements, assumes a priori knowledge of the yield strength (Vy) of
the frame. The elastic stiffness is based on the secant stiffness of the frame calculated
from the force-displacement curve at the force corresponding to 0.75Vy.
The second method in the idealization of the load-deformation curve of a structure
is commonly named as the equal-energy method. This method assumes that the area
enclosed by the curve above the bi-linear approximation is equal to the area enclosed by
the curve below the bi-linear approximation. According to ATC-19 [2], either of these
methods could be used to estimate yield forces and yield displacements; these two
methods would generally produce similar results for most ductile framing systems.
Later, in 1996, with the introduction of Capacity Spectrum Method (ATC-40 [3])
as a guideline for seismic evaluation, an initial stiffness based idealization method was
4
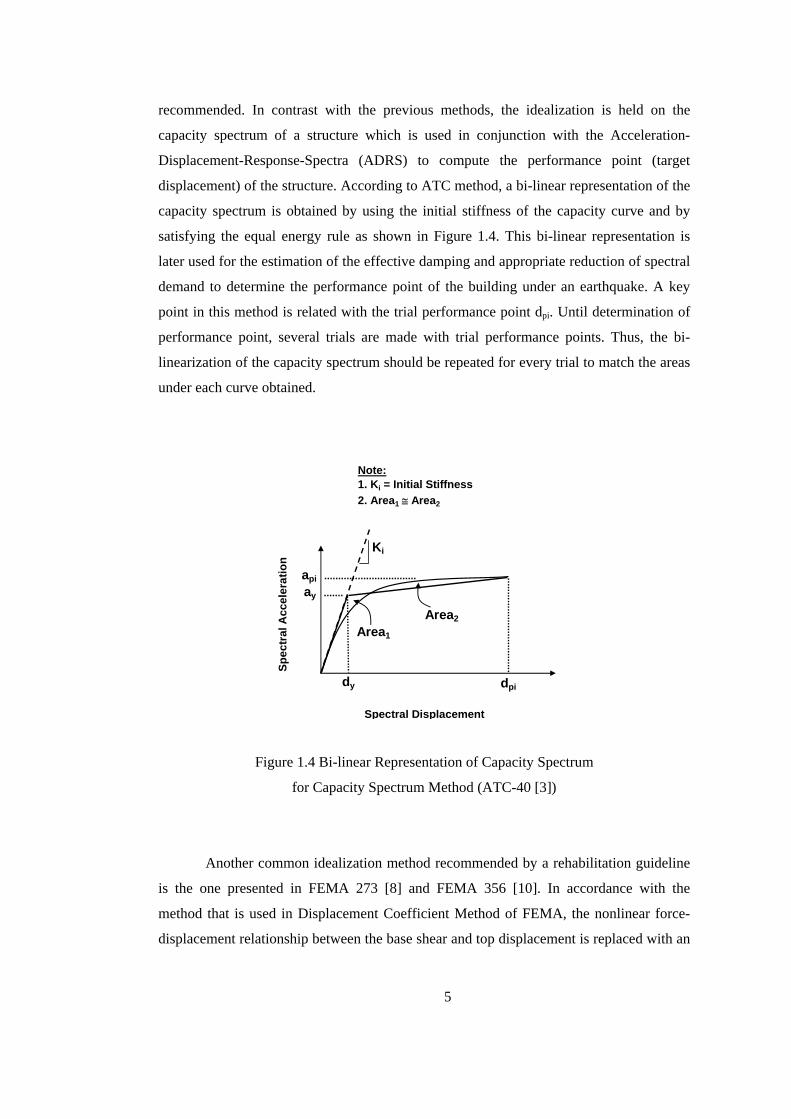
recommended. In contrast with the previous methods, the idealization is held on the
capacity spectrum of a structure which is used in conjunction with the Acceleration-
Displacement-Response-Spectra (ADRS) to compute the performance point (target
displacement) of the structure. According to ATC method, a bi-linear representation of the
capacity spectrum is obtained by using the initial stiffness of the capacity curve and by
satisfying the equal energy rule as shown in Figure 1.4. This bi-linear representation is
later used for the estimation of the effective damping and appropriate reduction of spectral
demand to determine the performance point of the building under an earthquake. A key
point in this method is related with the trial performance point dpi. Until determination of
performance point, several trials are made with trial performance points. Thus, the bi-
linearization of the capacity spectrum should be repeated for every trial to match the areas
under each curve obtained.
Spectral Displacement
Ki
dy
api
Spec
tral
Acc
eler
atio
n
ay
dpi
Area1
Area2
Note:1. Ki = Initial Stiffness2. Area1 ≅ Area2
Figure 1.4 Bi-linear Representation of Capacity Spectrum
for Capacity Spectrum Method (ATC-40 [3])
Another common idealization method recommended by a rehabilitation guideline
is the one presented in FEMA 273 [8] and FEMA 356 [10]. In accordance with the
method that is used in Displacement Coefficient Method of FEMA, the nonlinear force-
displacement relationship between the base shear and top displacement is replaced with an
5

idealized relationship to calculate effective lateral stiffness, Ke, and effective yield
strength, Vy, of the building as shown in Figure 1.5. Line segments on the idealized force-
displacement curve are located using an iterative graphical procedure that approximately
balances the area above and below the curve. The effective lateral stiffness, Ke, is taken as
the secant stiffness calculated at a base shear force equal to 60% of the effective yield
strength of the structure. The post-yield slope, α, is determined by a line segment that
passes through the actual curve at the target displacement calculated. The effective yield
strength is not taken as greater than the maximum base shear force at any point along the
actual curve. In the commentary of FEMA (FEMA 274 [9]), the reason behind selecting
60% value to determine secant stiffness was the fact that the secant stiffness defined at this
level would better represent the apparent fundamental period change with response
amplitude, as a structure responds inelastically to an earthquake due to cracking. However,
the rationality under this assumption was not described. It was also stated in the
commentary that it would be more conservative to use a lower yield displacement and a
lower secant stiffness.
Base Shear Force (V)
Displacement (Δ)
Vy
Approximately balance areas above and below
0.60Vy
δt
Vt
Ke
αKe
Figure 1.5 Idealized Force-Displacement Curve
for Displacement Coefficient Method (FEMA 356 [10])
As an improvement to the guidelines of ATC-40 [3] and FEMA 356 [10], FEMA
440 [4] was presented as the collection of large number of researchers who had devoted
their studies on the accuracy of the approximate procedures by comparing the results with
6

the nonlinear time history analyses and the document provided the latest improvements to
both of these procedures. However, the rationality behind the idealizations and their
consequential effects on seismic response were not presented again in this new guideline.
Apart from the common methods given in the guidelines mentioned, some
attempts were also presented in the determination of the global yield displacement of
either regular or irregular structural systems. Sullivan et al. [20], which is a specific
example to those attempts, bases the idea of yielding on the yield of individual
components that constitute the lateral resisting system. According to the proposition, the
initial stiffness should be taken considering the initial stiffness of each wall weighted with
proportion to the base shear it carries. Although this method could be applied to shear
resisting systems, its use in moment resisting frames would be impractical. Additionally,
the yield definition of an individual component is also a matter of discussion and makes it
more complex. Thus, it would be better to utilize the common methods in sake of practical
use for the engineers.
1.3 OBJECTIVE AND SCOPE
Considering the presence of several idealization alternatives and the absence of
rational guidelines to select the most suitable method, a comprehensive research has been
undertaken to evaluate the influence of several existing alternatives used for
approximating the capacity curve on seismic demands.
In the context of this study, seven reinforced concrete frames were analyzed under
nearly 100 ground motion records. Firstly, nonlinear time history analyses of the MDOF
systems were conducted to compute the ‘exact’ seismic demands, namely maximum roof
displacement, maximum inter-story drift ratio and maximum base shear. Secondly,
nonlinear static analyses (pushover analyses) were utilized to estimate the load-
deformation response of the structures. Using the elastic first mode lateral load pattern
dependent capacity curves, the force-displacement relationships were idealized according
to four methods in the further stages of the study. As the first method, which will be called
as ‘MULTI’ from here on, the pushover curve was idealized using as many linear
segments as needed to fully describe the whole curve. This idealization method was
thought to be the best alternative to represent the nonlinear static response. The original
curve was secondly idealized using the recommendations of ATC-40 [3] utilizing the
initial stiffness definition and will be named as ‘ATC’ in the proceeding stages. As the
third alternative, ‘FEMA’, the suggestions of FEMA 356 [10] were employed to bi-
7
linearize the capacity curve. Finally, the FEMA alternative was slightly modified to
comply with the recommendations of Paulay and Priestley [17] and this method will be
mentioned as ‘75%Vy’. In all alternatives, the requirement of the equal energy concept
was satisfied.
Using the idealized capacity curves, MDOF systems were represented as
equivalent SDOF systems and simplified systems were analyzed under the same ground
motion database to compute the approximate displacement demands. In conjunction with
the results of the nonlinear static analyses, the approximate values of other seismic
demand parameters namely maximum inter-story drift ratio and maximum base shear were
found.
As the next step of the study, results of approximate procedures in terms of roof
displacement, inter-story drift ratio and base shear were compared with the ‘exact’ ones at
various levels of global drift to investigate the effects of idealizations. Correlation studies
were conducted to investigate the success of each method of idealization in estimating
seismic demand parameters. In addition, trends and dependencies on ductility (μ), strength
reduction factor (R) and period were examined. Along with the comparisons with respect
to ‘exact’ values, the results of three common approximate procedures; ATC, FEMA and
75%Vy, were also compared with the results of MULTI method that was thought to fully
describe the nonlinear static response of a structure.
In this study, it was aimed to provide rationality to the selection and the use of
alternative methods of capacity curve idealization, by using the provided statistical results
and the interpretations made over the dependencies and trends.
The thesis is composed of five main chapters and two appendices. Following the
review of relevant idealization alternatives in this chapter, Chapter 2 presents the frames
analyzed and the ground-motion database employed throughout the study. Chapter 3
contains the details of the nonlinear time history, nonlinear static and simplified dynamic
analyses conducted. The modeling assumptions for the analysis methods are explained and
the obtained results are presented. Moreover, a brief discussion is presented on how the
results were compared at the end of the chapter. In Chapter 4, the interpretations of the
analyses results are evaluated to investigate how the results obtained from approximate
analyses correlate well with those obtained from ‘exact’ analyses. The dependencies and
trends on ductility, strength reduction factor and period are also examined in the context of
this chapter. Chapter 5 contains the summary, conclusions and further recommendations
regarding the study. Appendix A includes the detailed descriptions of the frames, the
8

results in terms of maximum roof displacement, maximum inter-story drift ratio and
maximum base shear obtained from nonlinear time history analyses of MDOF and
equivalent SDOF systems, the comparisons of the results and the graphical representations
of the comparisons. Additionally, the comparative investigations of the common
approximations to capture the nonlinear static response (MULTI method) are presented in
Appendix B.
9

CHAPTER 2
DESCRIPTION OF FRAMES AND GROUND MOTIONS
2.1 GENERAL
Seven reinforced concrete frames and a total of 100 ground motions were
employed in this study to evaluate the influence of idealization of pushover curves on the
seismic response of frame structures. The frame set was selected so that there is a uniform
distribution of fundamental period. In addition, the ground motion database was intended
to cover a wide range of earthquake hazard level that would impose response in elastic as
well as inelastic range for the structures analyzed.
The low- to mid-rise frame set used in this study contains two- to eight-story
frames having various numbers of bays. Identifying them according to the number of
stories and bays, the frames include two two-story-two-bay frames named as F2S2B and
F2S2B2, a three-story-two-bay frame called F3S2B, three five story frames having two,
four and seven bays and entitled as F5S2B, F5S4B and F5S7B, respectively, and finally
an eight-story-three-bay frame termed as F8S3B.
The ground motion record set previously used by Erberik and Cullu [7] was
adopted for this study to represent a wide range of seismic hazard level that would reflect
the global response of the selected frames by both elastic and inelastic responses. Since
the earthquake set was thought to be large enough for obtaining various levels of
inelasticity, individual records were employed as unscaled ones.
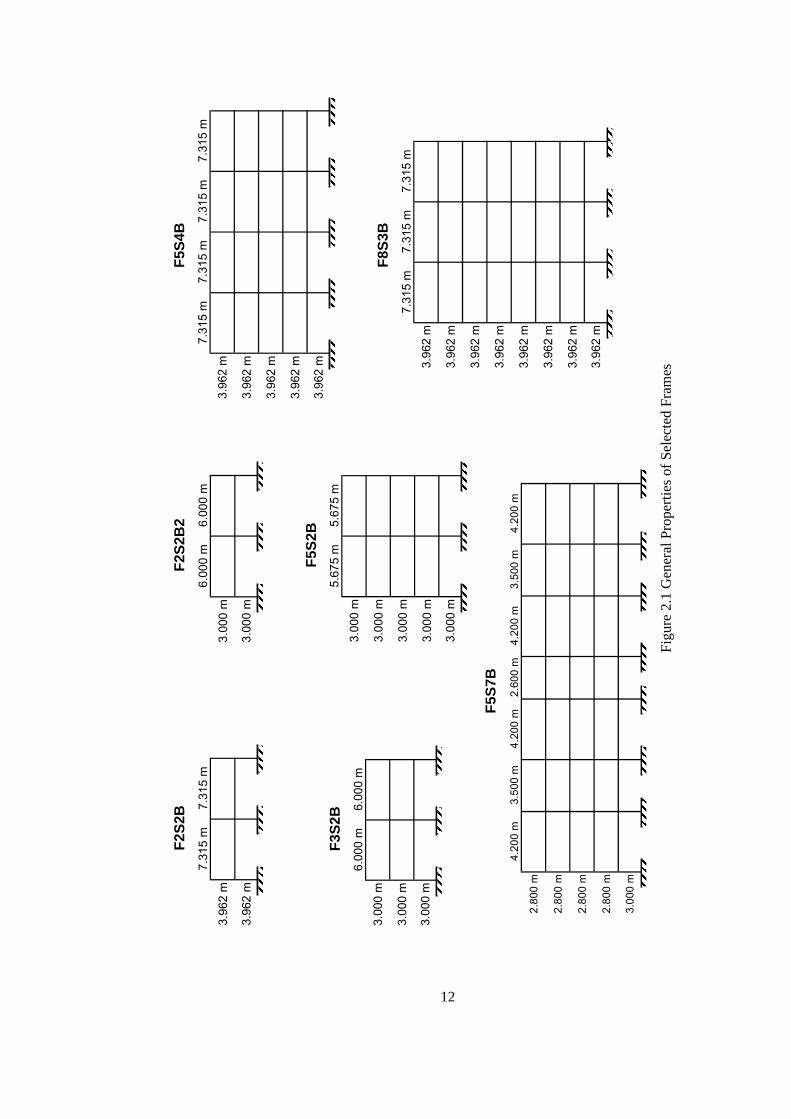
2.2 DESCRIPTION OF SELECTED FRAMES
Seven reinforced concrete frames which have a diverse fundamental period
distribution were selected and analyzed in this study. Among the current frame set
depicted in Figure 2.1, F2S2B, F5S4B and F8S3B were designed in California complying
10

with the Uniform Building Code-1982 [11] whereas F2S2B2, F3S2B, F5S2B and F5S7B
were selected from the existing structures located in the city of Bursa in Turkey. The
eigenvalue analyses of the frames were conducted using OpenSees [15] and the
fundamental period of vibration range was found to be between 0.3 and 1.2 seconds. The
geometric and sectional properties of the selected frames are presented in Appendix A.1
and the dynamic characteristics of the selected frames are given in Table 2.1.
Table 2.1 Dynamic Characteristics of Selected Frames
Total FundamentalModal
Participation Modal MassMass Period Factor Factor
(t) T1 (s) (Γ1) (α1)F2S2B 275.3 0.59 1.339 0.814
F2S2B2 137.6 0.30 1.339 0.815F3S2B 226.5 0.45 1.416 0.768F5S2B 260.2 0.75 1.293 0.794F5S4B 1007.1 0.95 1.362 0.776F5S7B 769.1 0.66 1.285 0.804F8S3B 1816.1 1.20 1.430 0.705
FRAME
2.3 SELECTED GROUND MOTIONS
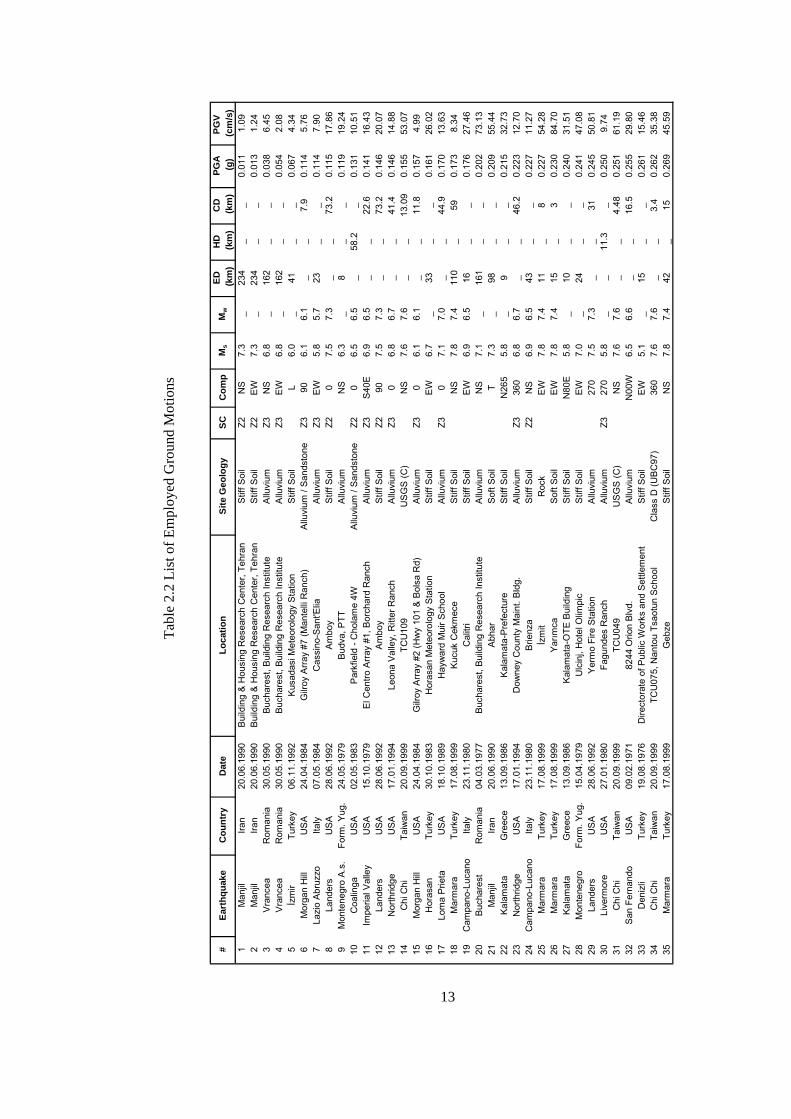
For the nonlinear time history analyses of the case study frames, 100 individual
ground motions were used in this study and the important features of these ground
motions are given in Table 2.2. The earthquake excitations recorded at various sites were
selected to represent a large spectrum of strong motion characteristics in terms of Peak
Ground Velocity (PGV), Peak Ground Acceleration (PGA) and local site conditions.
However, since the reference hazard parameter in Erberik and Cullu [7] was considered as
PGV, the database formation was handled accordingly. Consequently, the uniformity of
PGV distribution is much more significant than the homogeneity of PGA distribution as
shown in Figures 2.2 and 2.3. According to the given features, the distribution of PGV,
accepted to be correlating well with inelastic displacement demand, is ranging from 10 to
120 cm/s whereas PGA values fall mostly in the range of 0.1g-1.0g.
11
7.31
5 m
7.31
5 m
3.96
2 m
3.96
2 m
F2S2
B6.
000
m6.
000
m
3.00
0 m
3.00
0 m
F2S2
B2
6.00
0 m
6.00
0 m
3.00
0 m
3.00
0 m
3.00
0 m
F3S2
B
7.31
5 m
7.31
5 m
3.96
2 m
3.96
2 m
3.96
2 m
3.96
2 m
3.96
2 m
7.31
5 m
7.31
5 m
F5S4
B
5.67
5 m
5.67
5 m
3.00
0 m
3.00
0 m
3.00
0 m
3.00
0 m
3.00
0 m
F5S2
B
4.20
0 m
3.50
0 m
4.20
0 m
2.60
0 m
4.20
0 m
3.50
0 m
4.20
0 m
2.80
0 m
2.80
0 m
2.80
0 m
2.80
0 m
3.00
0 m
F5S7
B
7.31
5 m
3.96
2 m
3.96
2 m
3.96
2 m
7.31
5 m
7.31
5 m
3.96
2 m
3.96
2 m
3.96
2 m
3.96
2 m
3.96
2 m
F8S3
B
Figu
re 2
.1 G
ener
al P
rope
rties
of S
elec
ted
Fram
es
12
EDH
DC
DPG
APG
V (k
m)
(km
) (k
m)
(g)
(cm
/s)
234
__
0.01
11.
0923
4_
_0.
013
1.24
162
__
0.03
86.
4516
2_
_0.
054
2.08
41_
_0.
067
4.34
__
7.9
0.11
45.
7623
__
0.11
47.
90_
_73
.20.
115
17.8
6_
8_
_0.
119
19.2
4_
58.2
_0.
131
10.5
1_
_22
.60.
141
16.4
3_
_73
.20.
146
20.0
7_
_41
.40.
146
14.8
8_
_13
.09
0.15
553
.07
__
11.8
0.15
74.
9933
__
0.16
126
.02
__
44.9
0.17
013
.63
110
_59
0.17
38.
3416
__
0.17
627
.46
161
__
0.20
273
.13
98_
_0.
209
55.4
422
Kal
amat
aG
reec
e13
.09.
1986
Kal
amat
a-P
refe
ctur
eS
tiff S
oil
N26
55.
8_
9_
_0.
215
32.7
323
Nor
thrid
geU
SA
17.0
1.19
94D
owne
y C
ount
y M
aint
. Bld
g.A
lluvi
umZ3
360
6.8
6.7
__
46.2
0.22
312
.70
24C
ampa
no-L
ucan
oIta
ly23
.11.
1980
Brie
nza
Stif
f Soi
lZ2
NS
6.9
6.5
43_
_0.
227
11.2
725
Mar
mar
aTu
rkey
17.0
8.19
99İz
mit
Roc
kE
W7.
87.
411
_8
0.22
754
.28
26M
arm
ara
Turk
ey17
.08.
1999
Yarım
caS
oft S
oil
EW
7.8
7.4
15_
30.
230
84.7
027
Kal
amat
aG
reec
e13
.09.
1986
Kal
amat
a-O
TE B
uild
ing
Stif
f Soi
lN
80E
5.8
_10
__
0.24
031
.51
28M
onte
negr
oFo
rm. Y
ug.
15.0
4.19
79U
lcin
j, H
otel
Olim
pic
Stif
f Soi
lE
W7.
0_
24_
_0.
241
47.0
829
Land
ers
US
A28
.06.
1992
Yer
mo
Fire
Sta
tion
Allu
vium
270
7.5
7.3
__
310.
245
50.8
130
Live
rmor
eU
SA
27.0
1.19
80Fa
gund
es R
anch
Allu
vium
Z327
05.
8_
_11
.3_
0.25
09.
7431
Chi
Chi
Taiw
an20
.09.
1999
TCU
049
US
GS
(C)
NS
7.6
7.6
__
4.48
0.25
161
.19
32S
an F
erna
ndo
US
A09
.02.
1971
8244
Orio
n B
lvd.
Allu
vium
N00
W6.
56.
6_
_16
.50.
255
29.8
033
Den
izli
Turk
ey19
.08.
1976
Dire
ctor
ate
of P
ublic
Wor
ks a
nd S
ettle
men
tS
tiff S
oil
EW
5.1
_15
__
0.26
115
.46
34C
hi C
hiTa
iwan
20.0
9.19
99TC
U07
5, N
anto
u Ts
aotu
n S
choo
lC
lass
D (U
BC
97)
360
7.6
7.6
__
3.4
0.26
235
.38
35M
arm
ara
Turk
ey17
.08.
1999
Geb
zeS
tiff S
oil
NS
7.8
7.4
42_
150.
269
45.5
9
1M
anjil
Iran
20.0
6.19
90B
uild
ing
& H
ousi
ng R
esea
rch
Cen
ter,
Tehr
anS
tiff S
oil
Z2N
S7.
3_
2M
anjil
Iran
20.0
6.19
90B
uild
ing
& H
ousi
ng R
esea
rch
Cen
ter,
Tehr
anS
tiff S
oil
Z2E
W7.
3_
3V
ranc
eaR
oman
ia30
.05.
1990
Buc
hare
st, B
uild
ing
Res
earc
h In
stitu
teA
lluvi
umZ3
NS
6.8
_4
Vra
ncea
Rom
ania
30.0
5.19
90B
ucha
rest
, Bui
ldin
g R
esea
rch
Inst
itute
Allu
vium
Z3E
W6.
8_
5İz
mir
Turk
ey06
.11.
1992
Kus
adas
i Met
eoro
logy
Sta
tion
Stif
f Soi
lL
6.0
_6
Mor
gan
Hill
US
A24
.04.
1984
Gilr
oy A
rray
#7 (M
ante
lli R
anch
)A
lluvi
um /
San
dsto
neZ3
906.
16.
17
Lazi
o A
bruz
zoIta
ly07
.05.
1984
Cas
sino
-San
t'Elia
Allu
vium
Z3E
W5.
85.
78
Land
ers
US
A28
.06.
1992
Am
boy
Stif
f Soi
lZ2
07.
57.
39
Mon
tene
gro
A.s
.Fo
rm. Y
ug.
24.0
5.19
79B
udva
, PTT
Allu
vium
NS
6.3
10C
oalin
gaU
SA
02.0
5.19
83P
arkf
ield
- C
hola
me
4WA
lluvi
um /
San
dsto
neZ2
06.
56.
511
Impe
rial V
alle
yU
SA
15.1
0.19
79E
l Cen
tro A
rray
#1,
Bor
char
d R
anch
Allu
vium
Z3S
40E
6.9
6.5
12La
nder
sU
SA
28.0
6.19
92A
mbo
yS
tiff S
oil
Z290
7.5
7.3
13N
orth
ridge
US
A17
.01.
1994
Leon
a V
alle
y, R
itter
Ran
chA
lluvi
umZ3
06.
86.
714
Chi
Chi
Taiw
an20
.09.
1999
TCU
109
US
GS
(C)
NS
7.6
7.6
15M
orga
n H
illU
SA
24.0
4.19
84G
ilroy
Arra
y #2
(Hw
y 10
1 &
Bol
sa R
d)A
lluvi
umZ3
06.
16.
116
Hor
asan
Turk
ey30
.10.
1983
Hor
asan
Met
eoro
logy
Sta
tion
Stif
f Soi
lE
W6.
7_
17Lo
ma
Prie
taU
SA
18.1
0.19
89H
ayw
ard
Mui
r Sch
ool
Allu
vium
Z30
7.1
7.0
18M
arm
ara
Turk
ey17
.08.
1999
Kuc
uk C
ekm
ece
Stif
f Soi
lN
S7.
87.
419
Cam
pano
-Luc
ano
Italy
23.1
1.19
80C
alitr
iS
tiff S
oil
EW
6.9
6.5
20B
ucha
rest
Rom
ania
04.0
3.19
77B
ucha
rest
, Bui
ldin
g R
esea
rch
Inst
itute
Allu
vium
NS
7.1
_21
Man
jilIra
n20
.06.
1990
Abh
arS
oft S
oil
T7.
3_
Loca
tion
Mw
Site
Geo
logy
SCC
omp
Ms
#Ea
rthq
uake
Cou
ntry
Dat
e
Tabl
e 2.
2 Li
st o
f Em
ploy
ed G
roun
d M
otio
ns
13

EDH
DC
DPG
APG
V (k
m)
(km
) (k
m)
(g)
(cm
/s)
10_
_0.
272
23.5
5_
_10
0.28
442
.71
19_
_0.
289
22.7
2_
_13
.90.
292
21.7
2_
_3.
10.
296
90.4
5_
_10
.60.
301
30.9
525
__
0.30
625
.31
__
3.1
0.31
471
.77
0_
_0.
319
40.6
115
_3
0.32
279
.60
__
12.1
0.32
239
.09
__
4.1
0.32
243
.60
__
3.4
0.33
110
2.02
107
_11
0.33
760
.59
__
3.5
0.33
966
.47
__
9.4
0.35
559
.87
__
14.9
0.36
455
.41
__
12.1
0.36
732
.92
__
5.2
0.36
795
.89
__
12.9
0.36
828
.92
__
17.2
0.36
962
.78
57N
orth
ridge
US
A17
.01.
1994
San
ta M
onic
a, C
ity H
all G
roun
dsA
lluvi
umZ3
360
6.8
6.7
__
27.4
0.37
024
.91
58C
hi C
hiTa
iwan
20.0
9.19
99TC
U07
4, N
anto
u N
angu
ang
Sch
ool
Cla
ss D
(UB
C97
)36
07.
67.
6_
_13
.80.
370
46.2
959
Erz
inca
nTu
rkey
13.0
3.19
92E
rzin
can
Soi
lE
W7.
37.
1_
_2
0.46
992
.05
60W
hitti
er N
arro
ws
US
A01
.10.
1987
Ced
ar H
ill N
urse
ry, T
arza
naA
lluvi
um /
Silt
ston
eZ1
05.
86.
1_
_41
.10.
405
19.1
661
Mar
mar
aTu
rkey
17.0
8.19
99S
akar
yaS
tiff S
oil /
Roc
kE
W7.
87.
440
_7
0.40
779
.80
62D
üzce
Turk
ey12
.11.
1999
Düz
ceS
oft S
oil
NS
7.3
7.1
9.3
_7
0.41
065
.76
63C
hi C
hiTa
iwan
20.0
9.19
99TC
U07
6C
lass
D (U
BC
97)
NS
7.6
7.6
__
3.2
0.41
664
.16
64Im
peria
l Val
ley
US
A15
.10.
1979
El C
entro
Arr
ay #
6, H
usto
n R
oad
Allu
vium
S50
W6.
96.
5_
_3.
50.
437
113.
1165
Lom
a P
rieta
US
A18
.10.
1989
Gilr
oy A
rray
#1
Roc
kZ1
907.
17.
0_
_2.
80.
442
33.8
466
Mon
tene
gro
Form
. Yug
.15
.04.
1979
Pet
rova
c, H
otel
Oliv
aS
tiff S
oil
NS
7.0
_25
__
0.45
438
.82
67E
rzin
can
Turk
ey13
.03.
1992
Erz
inca
nS
oil
EW
7.3
7.1
__
20.
469
92.0
568
Lom
a P
rieta
US
A18
.10.
1989
Cap
itola
Fire
Sta
tion
Allu
vium
07.
17.
0_
_15
.90.
472
36.1
569
Nor
thrid
geU
SA
17.0
1.19
94S
atic
oyA
lluvi
um18
06.
86.
7_
_12
.90.
477
61.4
870
Nor
thrid
geU
SA
17.0
1.19
94R
inal
di R
ecei
ving
Sta
tion
Allu
vium
Z3N
41W
6.8
6.7
__
8.6
0.48
080
.33
36K
alam
ata
Gre
ece
13.0
9.19
86K
alam
ata-
OTE
Bui
ldin
gS
tiff S
oil
N10
W5.
8_
37La
nder
sU
SA
28.0
6.19
92Jo
shua
Tre
e Fi
re S
tatio
nQ
uate
rnar
y90
7.5
7.3
38A
lkio
nG
reec
e24
.02.
1981
Xilo
kast
ro, O
TE B
uild
ing
Allu
vium
L6.
7_
39W
hitti
er N
arro
ws
US
A01
.10.
1987
Frem
ont S
choo
l, A
lham
bra
Allu
vium
180
5.8
6.1
40Im
peria
l Val
ley
US
A15
.10.
1979
Mel
olan
d O
verp
ass
Allu
vium
270
6.9
6.5
41N
orth
ridge
US
A17
.01.
1994
Pac
oim
a K
agel
Can
yon
Terti
ary
San
dsto
neZ2
906.
86.
742
Mon
tene
gro
Form
. Yug
.15
.04.
1979
Pet
rova
c, H
otel
Oliv
aS
tiff S
oil
EW
7.0
_43
Impe
rial V
alle
yU
SA
15.1
0.19
79M
elol
and
Ove
rpas
sA
lluvi
um0
6.9
6.5
44D
inar
Turk
ey01
.10.
1995
Din
ar M
eteo
rolo
gy S
tatio
nS
oft S
oil
EW
6.1
6.0
45M
arm
ara
Turk
ey17
.08.
1999
Yarım
caS
oft S
oil
NS
7.8
7.4
46Lo
ma
Prie
taU
SA
18.1
0.19
89G
ilroy
Arra
y #2
U
SG
S (C
)Z3
337
7.1
7.0
47Lo
ma
Prie
taU
SA
18.1
0.19
89S
arat
oga
Allu
vium
907.
17.
048
Chi
Chi
Taiw
an20
.09.
1999
TCU
075,
Nan
tou
Tsao
tun
Sch
ool
Cla
ss D
(UB
C97
)90
7.6
7.6
49M
arm
ara
Turk
ey17
.08.
1999
Düz
ceS
oft S
oil
NS
7.8
7.4
50Im
peria
l Val
ley
US
A15
.10.
1979
El C
entro
Arr
ay #
6, H
usto
n R
oad
Allu
vium
S40
E6.
96.
551
Nor
thrid
geU
SA
17.0
1.19
94W
Pic
o C
anyo
n B
lvd,
New
hall
Non
mar
ine
Dep
osit
N44
W6.
86.
752
Chi
Chi
Taiw
an20
.09.
1999
CH
Y00
6U
SG
S (C
)E
W7.
67.
653
Lom
a P
rieta
US
A18
.10.
1989
Gilr
oy A
rray
#2
US
GS
(C)
Z367
7.1
7.0
54Im
peria
l Val
ley
US
A15
.10.
1979
El C
entro
Arr
ay #
5, J
ames
Roa
dA
lluvi
umS
50W
6.9
6.5
55N
orth
ridge
US
A17
.01.
1994
Sat
icoy
Allu
vium
906.
86.
756
Lom
a P
rieta
US
A18
.10.
1989
Hol
liste
r - S
outh
St.
And
Pin
e D
r.A
lluvi
um0
7.1
7.0
Loca
tion
Mw
#Ea
rthq
uake
Cou
ntry
Dat
eSi
te G
eolo
gySC
Com
pM
s
Tabl
e 2.
2 C
ontin
ued
14

EDH
DC
DPG
APG
V (k
m)
(km
) (k
m)
(g)
(cm
/s)
6.9
__
110.
503
36.6
07.
0_
_4.
10.
504
41.3
57.
19.
3_
70.
513
86.0
56.
7_
_14
.30.
513
44.5
66.
7_
_24
.10.
514
52.5
66.
5_
_5.
20.
550
49.7
16.
7_
_8.
70.
580
107.
486.
7_
_10
.90.
583
74.8
47.
0_
_15
.90.
589
48.3
06.
7_
_10
.90.
589
94.7
26.
7_
_8.
60.
593
99.2
87.
6_
_13
.80.
595
74.6
46.
9_
_1
0.62
975
.04
84Lo
ma
Prie
taU
SA
18.1
0.19
89C
orra
litos
Land
slid
e D
epos
it0
7.1
7.0
__
2.8
0.63
055
.20
85C
hi C
hiTa
iwan
20.0
9.19
99C
HY
028
US
GS
(C)
EW
7.6
7.6
__
7.31
0.65
372
.78
86C
hi C
hiTa
iwan
20.0
9.19
99TC
U07
1U
SG
S (D
)N
S7.
67.
6_
_4.
90.
655
69.3
887
Cap
e M
endo
cino
US
A25
.04.
1992
Pet
rolia
, Gen
eral
Sto
reA
lluvi
um90
7.1
7.0
__
15.9
0.66
289
.45
88K
obe
Japa
n16
.01.
1995
Taka
razu
US
GS
(D)
0_
6.9
__
1.2
0.69
368
.28
89K
obe
Japa
n16
.01.
1995
Taka
razu
US
GS
(D)
90_
6.9
__
1.2
0.69
485
.25
90N
orth
ridge
US
A17
.01.
1994
Kat
herin
e R
d, S
imi V
alle
yA
lluvi
umN
00E
6.8
6.7
__
14.3
0.72
751
.11
91N
orth
ridge
US
A17
.01.
1994
Sep
ulve
da V
A H
ospi
tal
Allu
vium
270
6.8
6.7
__
9.5
0.75
384
.85
92D
üzce
Turk
ey12
.11.
1999
Bol
uS
oil
NS
7.3
7.1
39_
5.5
0.75
458
.25
93D
üzce
Turk
ey12
.11.
1999
Bol
uS
oil
EW
7.3
7.1
39_
5.5
0.82
266
.92
94K
obe
Japa
n16
.01.
1995
JMA
US
GS
(B)
Z2N
S_
6.9
__
10.
833
90.7
095
Taba
sIra
n16
.09.
1978
Taba
sS
tiff S
oil
N74
E7.
3_
52_
_0.
914
90.2
396
Nor
thrid
geU
SA
17.0
1.19
94S
epul
veda
VA
Hos
pita
lA
lluvi
um36
06.
86.
7_
_9.
50.
939
76.6
097
Nor
thrid
geU
SA
17.0
1.19
94Ta
rzan
a C
edar
Hill
Nur
sery
Allu
vium
Z136
06.
86.
7_
_16
.70.
990
77.1
898
Taba
sIra
n16
.09.
1978
Taba
sS
tiff S
oil
Z2N
16W
7.3
_52
__
1.06
580
.53
99M
orga
n H
illU
SA
24.0
4.19
84C
oyot
e La
ke D
amR
ock
285
6.1
6.1
__
1.5
1.29
880
.79
100
Nor
thrid
geU
SA
17.0
1.19
94Ta
rzan
a C
edar
Hill
Nur
sery
Allu
vium
Z190
6.8
6.7
__
16.7
1.77
811
0.16
Mw
71K
obe
Japa
n16
.01.
1995
Nis
hi-A
kash
iU
SG
S (D
)Z4
90_
72Lo
ma
Prie
taU
SA
18.1
0.19
89S
arat
oga
Allu
vium
07.
173
Düz
ceTu
rkey
12.1
1.19
99D
üzce
Sof
t Soi
lE
W7.
374
Nor
thrid
geU
SA
17.0
1.19
94K
athe
rine
Rd,
Sim
i Val
ley
Allu
vium
N90
E6.
875
Nor
thrid
geU
SA
17.0
1.19
94C
asta
ic O
ld R
idge
Roa
dS
ands
tone
360
6.8
76Im
peria
l Val
ley
US
A15
.10.
1979
El C
entro
Arr
ay #
5, J
ames
Roa
dA
lluvi
umS
40E
6.9
77N
orth
ridge
US
A17
.01.
1994
Sly
mar
, Con
verte
r Sta
tion
Allu
vium
Z3N
38W
6.8
78N
orth
ridge
US
A17
.01.
1994
New
hall
LA C
ount
y Fi
re S
tatio
nA
lluvi
umZ3
906.
879
Cap
e M
endo
cino
US
A25
.04.
1992
Pet
rolia
, Gen
eral
Sto
reA
lluvi
um0
7.1
80N
orth
ridge
US
A17
.01.
1994
New
hall
LA C
ount
y Fi
re S
tatio
nA
lluvi
um36
06.
881
Nor
thrid
geU
SA
17.0
1.19
94Je
nsen
Filt
er P
lant
Allu
vium
292
6.8
82C
hi C
hiTa
iwan
20.0
9.19
99TC
U07
4, N
anto
u N
angu
ang
Sch
ool
Cla
ss D
(UB
C97
)90
7.6
83K
obe
Japa
n16
.01.
1995
JMA
US
GS
(B)
Z2E
W_
Loca
tion
#Ea
rthq
uake
Cou
ntry
Dat
eSi
te G
eolo
gySC
Com
pM
s
Tabl
e 2.
2 C
ontin
ued
15
0
5
10
15
20
25
0.1
0.2
0.3
0.4
0.5
0.6
0.7
0.8
0.9
1.0
1.1
1.2
1.3
1.4
1.5
1.6
1.7
1.8
PGA (g)
Freq
uenc
y
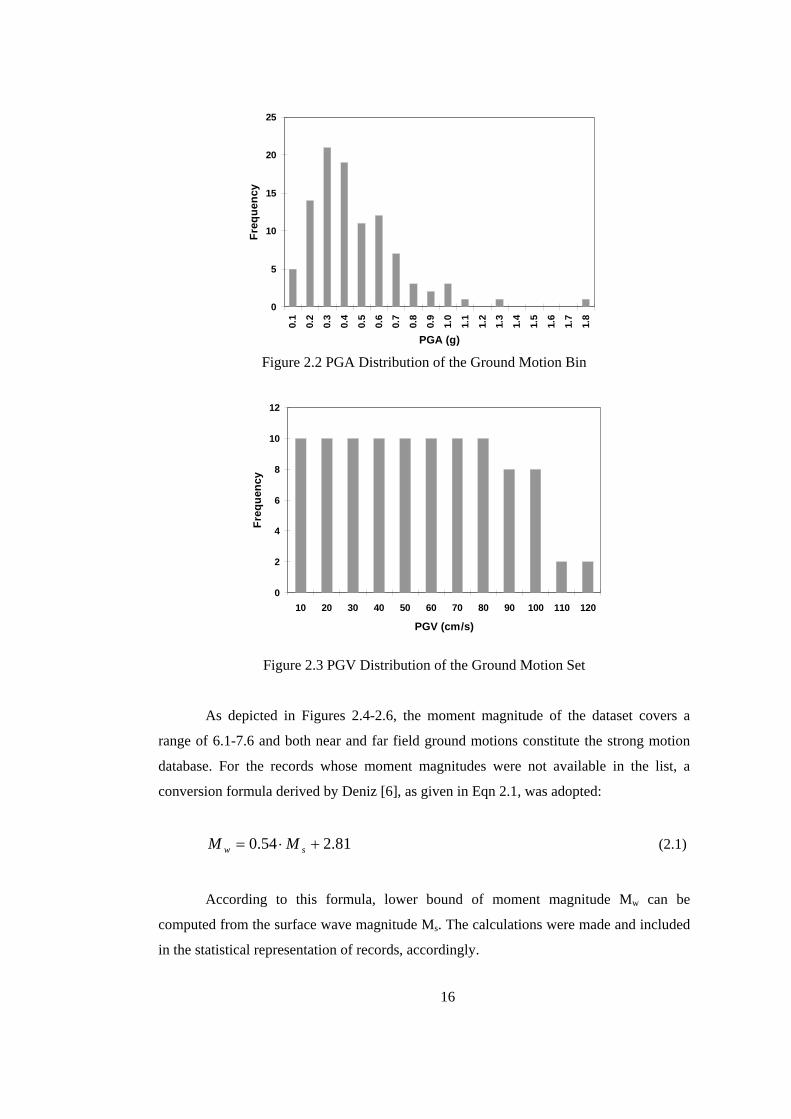
Figure 2.2 PGA Distribution of the Ground Motion Bin
0
2
4
6
8
10
12
10 20 30 40 50 60 70 80 90 100 110 120
PGV (cm/s)
Freq
uenc
y
Figure 2.3 PGV Distribution of the Ground Motion Set
As depicted in Figures 2.4-2.6, the moment magnitude of the dataset covers a
range of 6.1-7.6 and both near and far field ground motions constitute the strong motion
database. For the records whose moment magnitudes were not available in the list, a
conversion formula derived by Deniz [6], as given in Eqn 2.1, was adopted:
81.254.0 +⋅= sw MM (2.1)
According to this formula, lower bound of moment magnitude Mw can be
computed from the surface wave magnitude Ms. The calculations were made and included
in the statistical representation of records, accordingly.
16
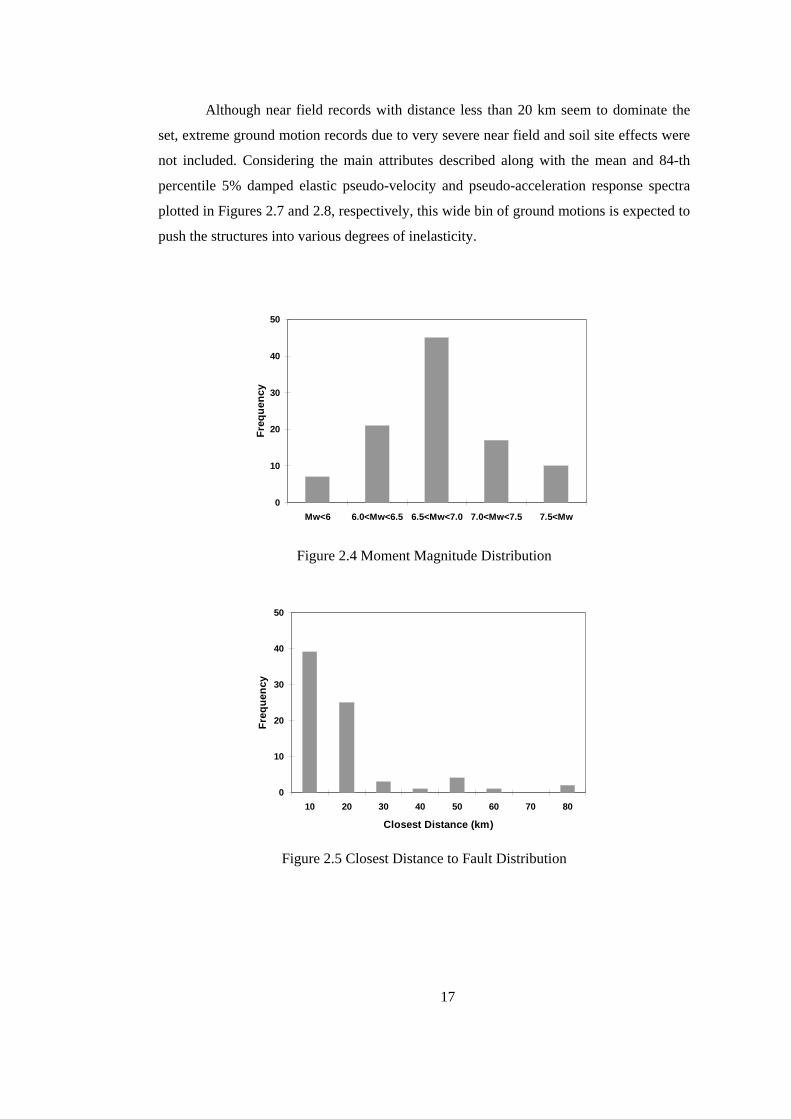
Although near field records with distance less than 20 km seem to dominate the
set, extreme ground motion records due to very severe near field and soil site effects were
not included. Considering the main attributes described along with the mean and 84-th
percentile 5% damped elastic pseudo-velocity and pseudo-acceleration response spectra
plotted in Figures 2.7 and 2.8, respectively, this wide bin of ground motions is expected to
push the structures into various degrees of inelasticity.
0
10
20
30
40
50
Mw<6 6.0<Mw<6.5 6.5<Mw<7.0 7.0<Mw<7.5 7.5<Mw
Freq
uenc
y
Figure 2.4 Moment Magnitude Distribution
0
10
20
30
40
50
10 20 30 40 50 60 70 80
Closest Distance (km)
Freq
uenc
y
Figure 2.5 Closest Distance to Fault Distribution
17

5.0
6.0
7.0
8.0
9.0
0 20 40 60 8
Closest Distance (km)
Mw
0
Figure 2.6 Moment Magnitude versus Closest Distance Plot
0.0
1.0
2.0
3.0
4.0
0.0 0.5 1.0 1.5 2.0
Period (s)
Pseu
do-V
eloc
ity (m
/s)
84th percentileMean
Figure 2.7 Mean and 84-th percentile Pseudo-Velocity Response Spectra
for Ground Motions (5% Damped)
0
10
20
30
40
50
60
0.0 0.5 1.0 1.5 2.0
Period (s)
Pseu
do-A
ccel
erat
ion
(m/s
2 )
84th percentileMean
Figure 2.8 Mean and 84-th percentile Pseudo-Acceleration Response Spectra
for Ground Motions (5% Damped)
18
CHAPTER 3
ANALYSES OF FRAMES
3.1 GENERAL
The influence of idealized capacity curves of frames on their seismic response was
investigated utilizing the well-known open-source software framework OpenSees [15] that
was mainly developed by the University of California at Berkeley. The reason for
choosing OpenSees as the analysis tool in this study is its increasing use by the
researchers for simulation applications in earthquake engineering. Moreover, its ability to
represent the pushover curves as multi-linear segments made it possible that all analyses
can be carried out in OpenSees.
As will be described alternately in the foregoing sections, three types of analyses
were conducted. Firstly, the two dimensional models of the selected frames were prepared
and nonlinear time history analyses were carried out by using the selected ground motions.
The seismic responses such as roof displacements, story drifts and shear forces obtained
from these analyses for each frame were considered as ‘exact’ for the further stages of the
study. After computing ‘exact’ results, nonlinear static analyses were conducted to acquire
the global response capacity for each frame through invariant lateral load patterns. From
the capacity curve of each frame, equivalent SDOF systems were formed and analyzed
under the same strong motion dataset. Responses obtained from the approximate analyses
using equivalent SDOF systems were then compared with the corresponding ‘exact’
values to investigate the effects of capacity curve idealization.
3.2 ANALYSES WITH OPENSEES
OpenSees [15] is an open-source software framework developed for general
purpose finite element analysis and its community code has been continuously improved
19
by the researchers worldwide. Its various modeling and analysis options in a sturdy
environment that could be easily modified for several needs have made OpenSees the
promising program for both structural analysis and simulation tasks in recent years. With
taking the advantage of the ability to define structural components in either element,
section or fiber level using the more versatile command-driven scripting language and
various analysis options such as static pushover and dynamic time series analyses,
OpenSees has been selected as the only tool for this study.
One fundamental feature of this free analysis program that was used in the
analyses is the nonlinear modeling of frame components through fiber-based nonlinear
beam-column elements [21]. Unlike SAP2000 [5] which is a well-known software in
engineering practice, OpenSees has the capability of modeling distributed plasticity and
the ability to represent the nonlinear static and dynamic behavior of structural elements
with a single element type.
The fiber beam-column element developed by Taucer et al. [21] forms the basis of
OpenSees’ nonlinear beam-column element. This flexibility-based fiber element type was
once proposed to be a reliable and computationally efficient beam-column finite element
model for the analysis of reinforced concrete members under cyclic loading conditions
that induce biaxial bending and axial force and has been intensively used for 15 years.
As stated in the research report published in 1991 [21], the element is discretized
into longitudinal steel and concrete fibers such that the section force-deformation relation
is derived by integration of the uniaxial stress-strain relation of the fibers. The nonlinear
behavior of the element derives entirely from the nonlinear stress-strain relation of the
steel and concrete fibers, thus this property eliminates the necessity for the input of force-
deformation of the element.
The beam-column element is based on the assumption that deformations are small
and that plane sections remain plane during the loading history. In addition to this, the
deformations due to shear and torsion are neglected in the formulation of this element. It
was also expressed in the report that for the accuracy of the results which represent the
hysteretic behavior of the elements, the number of sub-divisions called fibers and the
control sections that are needed to form the flexibility matrices of the elements from the
fibers should be wisely defined. Following the recommendations and using the
interpretations of basic sensitivity analyses, the number of integration points for beams
and columns were selected as four and six, respectively. Furthermore, the number of sub-
divisions of a single section which is not very influential along the width of the section in
20

a two dimensional problem was defined in a manner that both optimum accuracy and
minimum calculation time considerations were satisfied. A representation of a fiber
element, shown in Figure 3.1, also designates the necessity of defining reliable
constitutive models which are abundantly available in OpenSees.
Figure 3.1 Graphical Representation of a Fiber Element [21]
As depicted in Figure 3.1, the unconfined and confined concrete models, and
reinforcing steel constitutive models were defined separately. The concrete models, which
were selected as Concrete01 uniaxial material type, are based on Kent-Scott-Park model
(Kent and Park [13], Scott et al. [19]) with degraded linear unloading/reloading according
to the work of Karsan and Jirsa [12] and neglect the tensile strength. The model requires
28-day compressive and crushing strengths, concrete strains at maximum and crushing
strengths as input parameters (Figure 3.2). The parameters were calculated according to
the model expressed and given in Appendix A.1 along with the frames they are related to.
The reinforcements of the reinforced concrete components were modeled as single
steel fibers across the section and the constitutive model was selected as Steel01 which is
a relatively simple model requiring few parameters. The general characteristic of this
model can be expressed as a bilinear steel material model with a kinematic hardening and
apart from the yield strength which differs for each frame, the initial elastic tangent and
21

strain hardening ratio for all over the study were defined as 200000 MPa and 0.005,
respectively.
Concrete01 material
Stress
Strain
σcu
σc
εcu εc0
2*εc0/σc
Steel01 material
σy
−σy
Stress
Strain
E0
$b*E0
Figure 3.2 Concrete01 and Steel01 Material Models [15]
3.3 NONLINEAR TIME HISTORY ANALYSES
In order to evaluate the effects of idealization on seismic response, certain seismic
response values based on approximate analyses must be compared with the ones obtained
from the complex analyses which are detailed enough to include the cyclic behavior of the
structures analyzed and the characteristics of strong ground motions employed. Therefore,
the case study frames were analyzed using the selected earthquakes by utilizing OpenSees
22
to represent the complex structural behavior under seismic excitations. The details
regarding the modeling and other assumptions are presented in the next section.
3.3.1 Modeling and Assumptions
Using the command language of OpenSees, two dimensional structural models
rigidly connected at the ground floor were prepared utilizing the general properties of the
frames given in Appendix A.1. All frame elements based on centerline dimensions were
modeled as fiber based NonlinearBeamColumn elements taking the advantage of
distributed plasticity models [15]. Since the fiber cross-sections make it easy to define
confined regions of concrete, the confinement effect of transverse reinforcement was
taken into account. Although details about the transverse reinforcement are not given in
Appendix A.1, minimum amounts required by the codes each frame complies with were
calculated and assumed to be present in the case study frames. The nonlinear concrete
model parameters for both unconfined and confined regions were then computed
according to Modified Kent and Park [13]. After obtaining the concrete model parameters,
the cross-sections were defined accordingly using the yield strength and the other
parameters of the reinforcements, given previously.
Since the frame elements were defined as massless type, the seismic mass of each
floor due to dead loads and 25% of live loads was lumped at the mass center of
corresponding story. The rigid diaphragm action and P-Δ effects, however, were ignored
for the frames due to their insignificant effects.
Concerning the viscous damping of the structural system under seismic
excitations, the damping phenomenon was represented using Rayleigh Damping. The
Rayleigh Damping for the selected frames was calculated assuming 5% damping ratio and
stiffness proportional damping. Mass proportional damping, however, was neglected due
to its insignificant effect.
3.3.2 Nonlinear Time History Analyses Results
After completing the modeling of the two dimensional frames, nonlinear time
history analyses were carried out using the ground motion data presented in Chapter 2. In
the analyses, tolerance values, which affect element and global convergences in nonlinear
analyses, were defined carefully to obtain accurate results at the expense of calculation
time. During the analyses, certain responses such as element forces, nodal displacements
and story drifts were recorded and then, processed to obtain the maximum base shear ‘V’,
23

maximum top displacement ‘Δ’ and maximum inter-story drift ratio ‘MIDR’ in absolute
values for each ground motion. For the non-converging cases, the results obtained were
not included in the evaluations. It was observed during the post-processing stage that
maximum base shear and top displacement couples did not occur at the same time step.
Apart from these, when finding the maximum inter-story drift ratio under an earthquake
for each frame, the story level was not taken into account and the highest one regardless of
floor level was considered as the ‘critical’ one. This approach was based on the fact that
the interpretations using the maximum inter-story drift ratio would be much more helpful
for global behavior and performance-based design rather than the assessment of
performance of individual floor levels. The earthquake excitation induced responses of the
frames obtained from the nonlinear time history analyses are summarized in tables which
can be found in Appendix A.2.
3.4 NONLINEAR STATIC ANALYSES
The nonlinear time history analysis is complex in its nature due to the fact that it
requires realistic cyclic modeling of structural components and the results are very
sensitive to the ground motions employed for this type of analysis. Moreover, the use of
large numbers of strong motions in various characteristics to obtain a global structural
behavior of the frame analyzed makes it even more difficult to handle with the large
amount of data to be stored, processed and interpreted. The long computation time
required for the nonlinear analyses with so many excitations also hinders the usage of
nonlinear time history analysis. Considering the drawbacks of this analysis method,
engineering profession prefers simplified nonlinear analysis techniques namely nonlinear
static analyses. As this study partly focuses on the nonlinear static analyses by carrying
out research into the effects of idealized pushover curves on seismic response, pushover
analysis was also utilized to achieve the global behavior of the selected frames. The
assumptions and modeling issues with the details of nonlinear static analyses conducted in
this study will be discussed next.
3.4.1 Modeling and Assumptions
The nonlinear static analyses of the previously mentioned two-dimensional
systems were also carried out in OpenSees using the same models developed for nonlinear
time history analyses, because the fiber based nonlinear beam-column elements in
OpenSees with nonlinear stress-strain relationships and cyclic rules made it easy to use
24

single model for both nonlinear static and dynamic analyses. Moreover, the accuracy of
the results was thought to be increased by using the advantage of distributed plasticity that
reflects the nonlinear behavior of the fibers across the element length rather than
representing the nonlinearity of the fibers at lumped plasticity regions (hinges). Another
advantage of fiber based elements is the elimination of moment-curvature or moment-
rotation inputs that dictate the major characteristics of the elements modeled.
A disadvantageous detail about the nonlinear modeling of reinforced concrete
elements that must be expressed is that since the rupture of reinforcement could not have
been defined and taken into account with Steel01 model, the nonlinear behavior of the
elements in high inelastic ranges might not be so accurate. However, this phenomenon
was disregarded, because the crushing of concrete occurred well before longitudinal steel
rupture.
Three different invariant lateral load patterns were applied on the two-dimensional
models to reflect the global behavior of the frames. ‘Uniform’, ‘Triangular’ and ‘Elastic
First Mode’ lateral load patterns were selected, as the first two generally result in upper
and lower bound curves and the last represents the likely distribution of inertial forces due
to first mode response of the structure which is assumed to be predominant over the other
modes of vibration. The details of lateral load pattern calculations are described as
follows:
• ‘Uniform’ Lateral Load Pattern
The lateral force applied at each story is proportional to the mass of that story
level, as given in Eqn. 3.1:
∑=
ii
ii m
mF (3.1)
where Fi and mi denote the lateral force applied and the mass at that story,
respectively.
• ‘Triangular’ Lateral Load Pattern
The lateral force applied at each story is proportional to the story number of that
story level, as described in Eqn. 3.2:
∑=
i
i iiF (3.2)
25
where Fi and i denote the lateral force applied at that story and the story number,
respectively.
• ‘Elastic First Mode’ Lateral Load Pattern
The lateral force applied at each story is proportional to the product of the mass
and the amplitude of the elastic first mode of that story, as expressed in Eqn. 3.3:
( )∑ ⋅⋅
=
iii
iii m
mF
φφ
(3.3)
where Fi, mi and φi denote the lateral force applied at that story, story mass and the
amplitude of the elastic first mode at that level, respectively.
The lateral force profiles of the case study frames determined according to the
patterns described above are illustrated in Figure 3.3. Note that the lateral forces are
proportioned to establish unit base shear at the ground level.
3.4.2 Nonlinear Static Analyses Results
The pushover analyses were conducted in a scheme that gravity analyses due to
dead loads and 25% of the live loads were first carried out and then, lateral load patterns
mentioned were applied and increased to obtain the global behavior of the frames. The
gravity analyses were conducted by force-controlled algorithm, whereas the lateral
pushover analyses were done by displacement-controlled one to push the frames to 2.5%
global drift which was considered to be close to the global drift capacity of the frames
employed. The normalized capacity curves of the frames, whose general properties
regarding total weight and total height are given in Table 3.1, are illustrated along with the
nonlinear time history results in Figures 3.4-3.6.
26
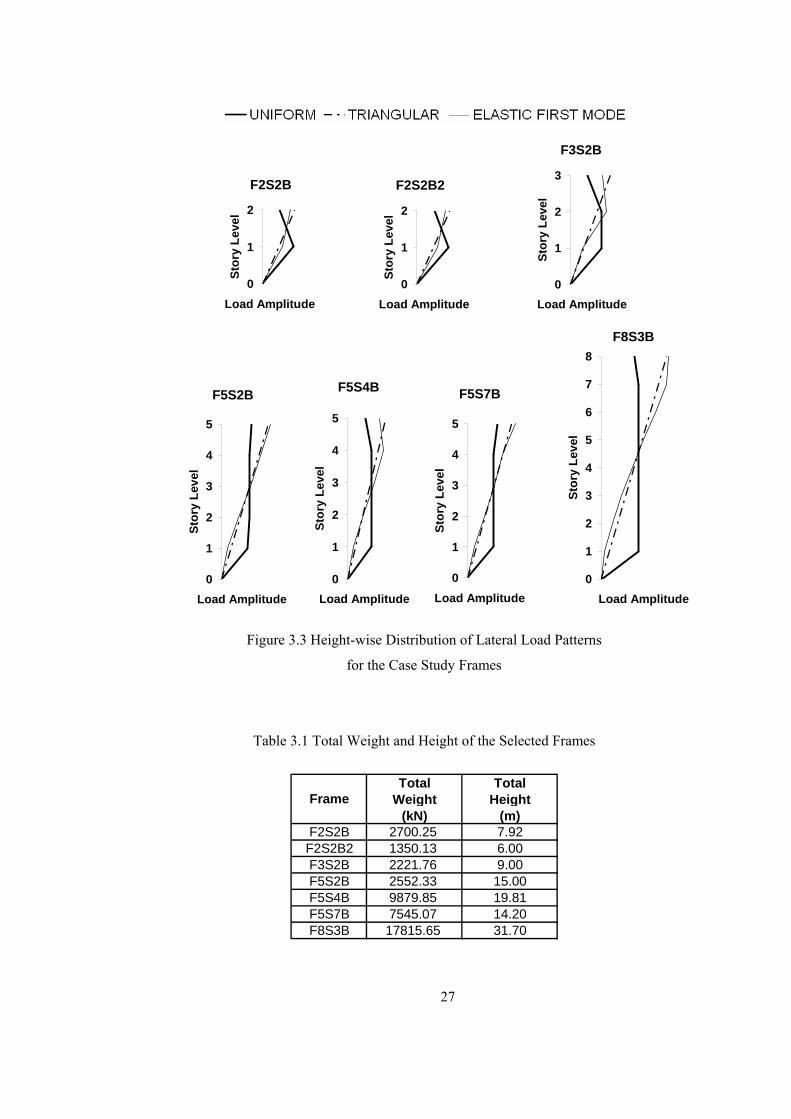
0
1
2
3
Load Amplitude
Stor
y Le
vel
F3S2B
0
1
2
Load Amplitude
Stor
y Le
vel
F2S2B2
0
1
2
Load Amplitude
Stor
y Le
vel
F2S2B
0
1
2
3
4
5
6
7
8
Load Amplitude
Stor
y Le
vel
F8S3B
0
1
2
3
4
5
Load Amplitude
Stor
y Le
vel
F5S7B
0
1
2
3
4
5
Load Amplitude
Stor
y Le
vel
F5S4B
0
1
2
3
4
5
Load Amplitude
Stor
y Le
vel
F5S2B
Figure 3.3 Height-wise Distribution of Lateral Load Patterns
for the Case Study Frames
Table 3.1 Total Weight and Height of the Selected Frames
Total Total
Weight Height(kN) (m)
F2S2B 2700.25 7.92F2S2B2 1350.13 6.00F3S2B 2221.76 9.00F5S2B 2552.33 15.00F5S4B 9879.85 19.81F5S7B 7545.07 14.20F8S3B 17815.65 31.70
Frame
27

0.00
0.15
0.30
0.45
0.60
0.00% 0.50% 1.00% 1.50% 2.00% 2.50%
Global Drift (Δ/H)
Bas
e Sh
ear C
oeffi
cien
t (V/
W)
F2S2B
0.00
0.30
0.60
0.90
1.20
0.00% 0.50% 1.00% 1.50% 2.00% 2.50%
Global Drift (Δ/H)
Bas
e Sh
ear C
oeffi
cien
t (V/
W)
F2S2B2
0.00
0.20
0.40
0.60
0.80
0.00% 0.50% 1.00% 1.50% 2.00% 2.50%
Global Drift (Δ/H)
Bas
e Sh
ear C
oeffi
cien
t (V/
W)
F3S2B
Figure 3.4 Capacity Curves of Frames ‘F2S2B’, ‘F2S2B2’ and ‘F3S2B’
with Nonlinear Time History Analysis Results
28
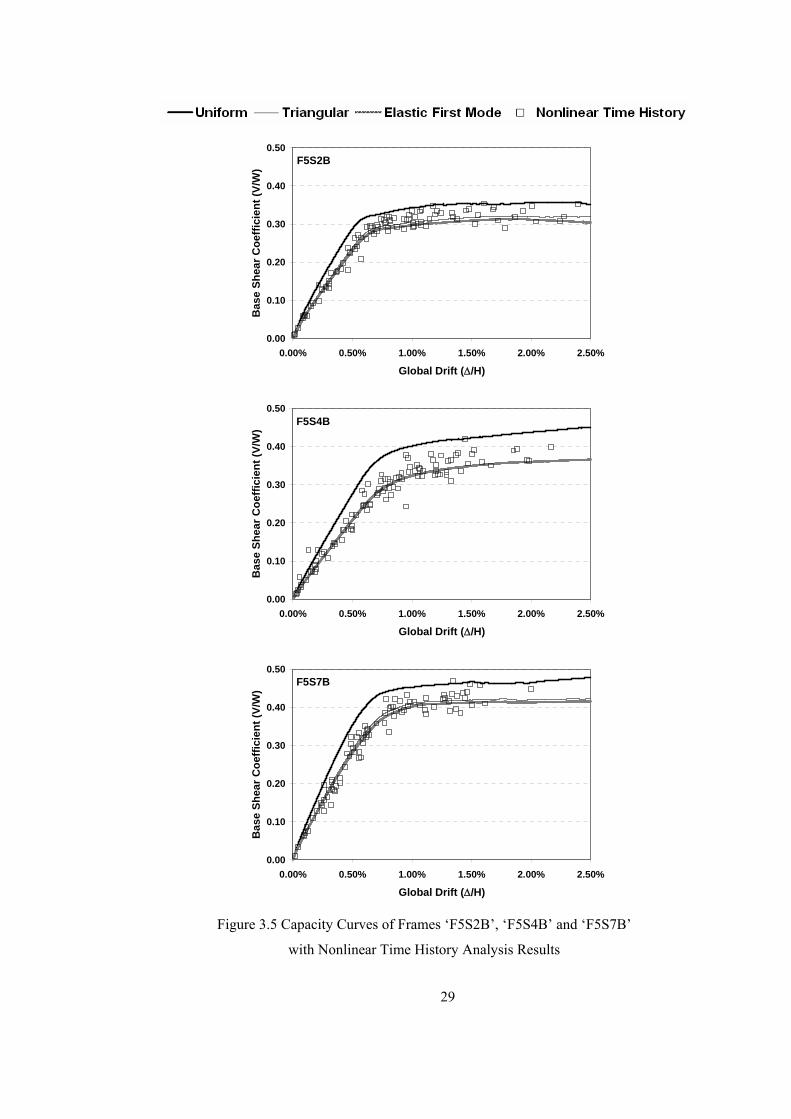
0.00
0.10
0.20
0.30
0.40
0.50
0.00% 0.50% 1.00% 1.50% 2.00% 2.50%
Global Drift (Δ/H)
Bas
e Sh
ear C
oeffi
cien
t (V/
W)
F5S2B
0.00
0.10
0.20
0.30
0.40
0.50
0.00% 0.50% 1.00% 1.50% 2.00% 2.50%
Global Drift (Δ/H)
Bas
e Sh
ear C
oeffi
cien
t (V/
W)
F5S4B
0.00
0.10
0.20
0.30
0.40
0.50
0.00% 0.50% 1.00% 1.50% 2.00% 2.50%
Global Drift (Δ/H)
Bas
e Sh
ear C
oeffi
cien
t (V/
W)
F5S7B
Figure 3.5 Capacity Curves of Frames ‘F5S2B’, ‘F5S4B’ and ‘F5S7B’
with Nonlinear Time History Analysis Results
29
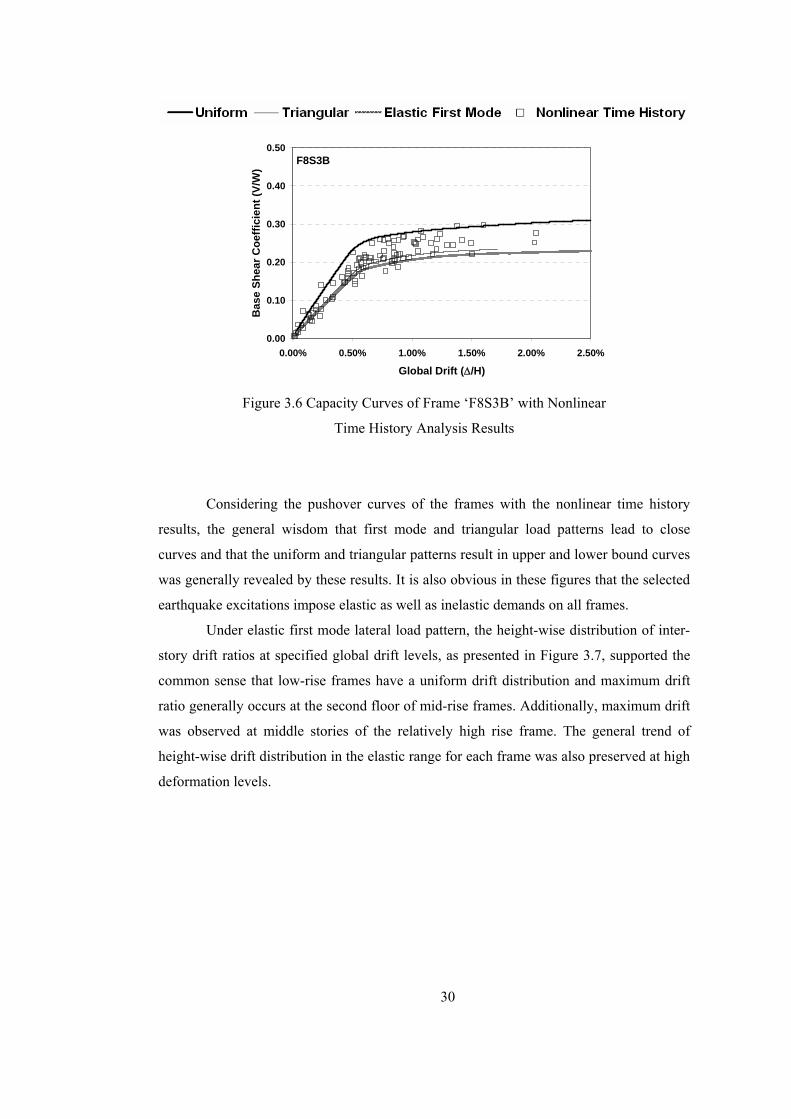
0.00
0.10
0.20
0.30
0.40
0.50
0.00% 0.50% 1.00% 1.50% 2.00% 2.50%
Global Drift (Δ/H)
Bas
e Sh
ear C
oeffi
cien
t (V/
W)
F8S3B
Figure 3.6 Capacity Curves of Frame ‘F8S3B’ with Nonlinear
Time History Analysis Results
Considering the pushover curves of the frames with the nonlinear time history
results, the general wisdom that first mode and triangular load patterns lead to close
curves and that the uniform and triangular patterns result in upper and lower bound curves
was generally revealed by these results. It is also obvious in these figures that the selected
earthquake excitations impose elastic as well as inelastic demands on all frames.
Under elastic first mode lateral load pattern, the height-wise distribution of inter-
story drift ratios at specified global drift levels, as presented in Figure 3.7, supported the
common sense that low-rise frames have a uniform drift distribution and maximum drift
ratio generally occurs at the second floor of mid-rise frames. Additionally, maximum drift
was observed at middle stories of the relatively high rise frame. The general trend of
height-wise drift distribution in the elastic range for each frame was also preserved at high
deformation levels.
30

0
1
2
0.0 1.0 2.0 3.0 4.0Inter-Story Drift Ratio (%)
Stor
y Le
vel
F2S2B
0
1
2
0.0 1.0 2.0 3.0 4.0Inter-Story Drift Ratio (%)
Stor
y Le
vel
F2S2B2
0
1
2
3
0.0 1.0 2.0 3.0 4.0Inter-Story Drift Ratio (%)
Stor
y Le
vel
F3S2B
0
1
2
3
4
5
0.0 1.0 2.0 3.0 4.0Inter-Story Drift Ratio (%)
Stor
y Le
vel
F5S2B
0
1
2
3
4
5
0.0 1.0 2.0 3.0 4.0Inter-Story Drift Ratio (%)
Stor
y Le
vel
F5S4B
0
1
2
3
4
5
0.0 1.0 2.0 3.0 4.0Inter-Story Drift Ratio (%)
Stor
y Le
vel
F5S7B
0
1
2
3
4
5
6
7
8
0.0 1.0 2.0 3.0 4.0Inter-Story Drift Ratio (%)
Stor
y Le
vel
F8S3B
Figure 3.7 Height-wise Distribution of Inter-Story Drift Ratios
31
3.5 SINGLE DEGREE OF FREEDOM ANALYSES
Among the simplified nonlinear analysis methods, Capacity Spectrum Method of
ATC-40 [3] and Displacement Coefficient Method of FEMA-356 [10], of which the
concepts have been recently improved by FEMA-440 [4], are the most widely utilized
nonlinear static analysis methods to determine the seismic displacement demand of a
given structure. The target displacement, that is the expected maximum displacement
demand of the structure under a ground motion, is found in the expense of accuracy by
disregarding the complex hysteretic behavior of the structures and the intricate
characteristics of ground motions to some extent. It is later used to predict the seismic
demand in terms of forces and deformations at target displacement. Therefore, the
accuracy of determining the displacement demand certainly affects the accuracy of the
approximate seismic demand parameters using pushover analysis results.
Apart from the two methods mentioned above, simplified nonlinear dynamic
analysis using equivalent SDOF can also be employed to determine the maximum global
displacement demand of a structure under an individual earthquake of particular interest.
Since this approximate procedure employs the ground motion itself rather than a design
spectrum which is mostly used in nonlinear static analyses, the accuracy of the
displacement demand is generally higher than the one obtained by nonlinear static analysis
methods which have certain additional assumptions. In addition, using the proper
modeling of hysteretic characteristics of the structure also increases the accuracy of the
results.
In the context of this study, the effects of idealization methods on seismic demand
were studied employing the simplified nonlinear dynamic analysis method. The reason
behind choosing this simplified method and neglecting the others was the fact that by
conducting nonlinear time history analyses using equivalent SDOF systems, the further
simplifications and assumptions that are present in nonlinear static analysis techniques
were eliminated and thus, the effects would better be presented.
Based on the elastic first mode lateral load dependent pushover analyses
previously presented, the capacity curve of each frame was simplified using four
alternatives of linearization methods namely MULTI, ATC, FEMA and 75%Vy. Using
these simplified force-deformation curves, equivalent SDOF systems were obtained and
analyzed under the same ground motion database as MDOF nonlinear time history
analyses. Using the elastic stiffnesses of the simplified systems, linear elastic dynamic
32

analyses were also conducted for the ductility and force reduction factor calculations due
to each idealization method for each frame.
The underlying principles for deriving the properties of equivalent SDOF from the
corresponding MDOF, the alternatives of idealization methods of capacity curves and the
results obtained from simplified nonlinear dynamic analyses will be presented in the
following sections.
3.5.1 Equivalent SDOF from MDOF
The basic properties of equivalent SDOF system in this study were obtained by
using the approach presented in ATC-40 [3]. In this approach, MDOF system is
represented by an equivalent SDOF system having an effective mass (M*), an effective
period (Teff) and thus an effective stiffness ( 2
*2* 4
effTMK π
= ) assuming that the deflected
shape of MDOF system is reflected by the elastic first mode of the structure (Figure 3.8).
Δrδ
M*
K*
Vbase Vbase
Figure 3.8 MDOF System Represented by Equivalent SDOF System
(ATC-40 [3])
A capacity curve of the overall structure is obtained by performing a pushover
analysis in the first step of determining the force-displacement relationship of equivalent
SDOF system. The original curve is then converted to an approximate bi-linear shape
using the alternative methods described earlier. As the next step, the bi-linear capacity
curve is converted to acceleration-displacement response spectrum (ADRS) format using
Eqn.s 3.4 and 3.5 (Figure 3.9):
.WαVSa
1
= (3.4)
33

r1,1
r
.ΓΔSdφ
= (3.5)
where W : total weight of building (kN)
V : base shear (kN)
Δr : roof displacement (m)
α1 : modal mass coefficient for the fundamental mode
Γ1 : modal participation factor for the fundamental mode
φ1,r : amplitude of first mode at roof level
Sa : spectral acceleration (m/s2)
Sd : spectral displacement (m)
Bas
e Sh
ear F
orce
(V)
Roof Displacement (Δr)
Vy
Δr,t
Ke
Ks
Δr,y
Spec
tral
Acc
eler
atio
n,Sa
Spectral Displacement, Sd
Say
Sdt
ω2eff
Sdy
Figure 3.9 Conversion of Capacity Curve to Capacity Spectrum
In the final stage, the of equivalent SDOF system is determined from the
initial slope of the bi-linear capacity spectrum and the force-deformation characteristics of
equivalent SDOF system are computed using Eqn.s 3.6, 3.7 and 3.8:
2effω
MM .1* α= (3.6)
*2* .MK effω= (3.7)
*.MSaVF yyy == (3.8)
where M : mass of the building (t)
M* : effective mass of SDOF (t)
K* : effective stiffness of SDOF (kN/m)
ωeff : effective frequency of SDOF (s-1)
Say : yield spectral acceleration (m/s2)
34

Fy : yield force (kN)
Vy : yield base shear (kN)
The force-displacement relationship of SDOF system can then be represented as
shown in Figure 3.10, where α is the ratio of post-yield stiffness (Ks) of bi-linearized
capacity curve to the elastic stiffness of capacity curve (Ke). Utilizing the force-
displacement relationship of the equivalent SDOF system, a nonlinear dynamic analysis is
performed to obtain the inelastic displacement demand of the equivalent SDOF system.
The displacement demand is later converted to global displacement by multiplying the
estimated spectral displacement demand of the equivalent SDOF system with the first
mode participation factor at the roof level.
Displacement
Fy
K*
αK*
δy
Force
F = Sa . W*
r
r
,11 .φδ
ΓΔ
=
Figure 3.10 Force-Displacement Relationship of Equivalent SDOF System
(ATC-40 [3])
3.5.2 Idealization of Pushover Curves
The global behavior of a structure obtained from pushover analysis can only be
represented by simplified force-deformation models in typical softwares such as OpenSees
[15] and NONLIN [14], since the basic hysteretic models that are implemented in the
simplified nonlinear dynamic analyses require the idealized force-deformation definitions.
As mentioned earlier, there are several alternatives and judgments in the idealization of
capacity curves. Amongst these common alternatives, ATC, FEMA and 75%Vy [2] were
employed to idealize the pushover curve of each frame. Apart from these three, since
OpenSees allowed modeling the pushover curve more precisely by multi-linear segments,
a fourth method called MULTI was applied to fully describe the global behavior
(nonlinear static response) of the structure.
35

In the MULTI method, the original curve of each MDOF system was
approximated using as many linear segments as chosen (generally 10-15 segments) to
fully describe the non-degrading load-deformation envelope curve of the system. The
properties of this multi-linear curve were then used to model a parallel spring system that
was composed of many elastic perfectly-plastic springs. That is; the stiffnesses of elastic
perfectly-plastic springs were tuned to obtain the stiffness equal to the one of the global
curve. The parallel spring system was then modeled in OpenSees using Parallel material
definition that combined ElasticPP material definitions equal in number of multi-linear
segments. Considering the system as a whole, the requirement of equal area under the
curves was automatically satisfied, since an almost exact force-deformation relationship
with respect to the original curve was obtained by this method as illustrated in Figure
3.11.
Displacement
Force
Figure 3.11 MULTI Idealization Method
In the ATC bi-linearization method, the pushover curve was approximated using a
bi-linear model as described in ATC-40 [3]. The slope of the elastic portion of this bi-
linear model was defined as equal to the initial stiffness of the MDOF curve and the
nonlinear portion was defined as the line between the yield point and the ultimate point
defined at 2.5% global drift considered as the drift capacity of the frames employed. The
equal energy rule was satisfied by equating the areas under the original and the idealized
curves. A sample bi-linear model of this type is depicted in Figure 3.12.
36
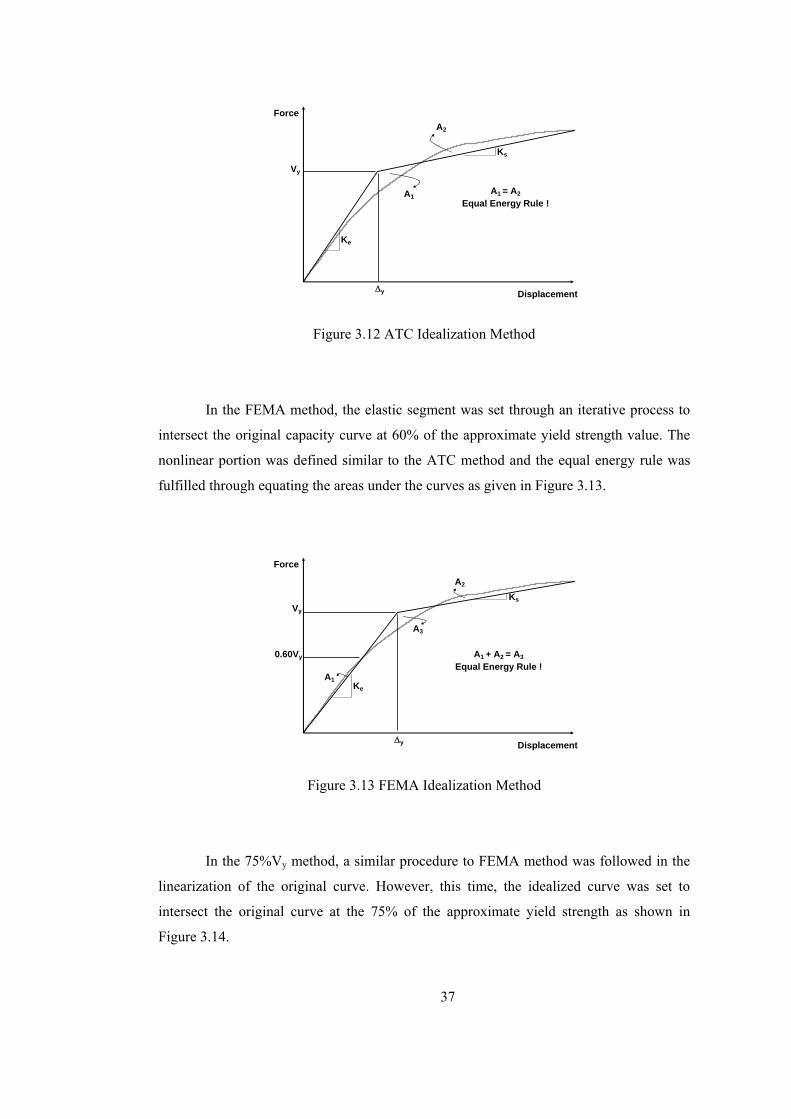
Displacement
Force
Vy
Δy
A1
A2
A1 = A2
Equal Energy Rule !
Ke
Ks
Figure 3.12 ATC Idealization Method
In the FEMA method, the elastic segment was set through an iterative process to
intersect the original capacity curve at 60% of the approximate yield strength value. The
nonlinear portion was defined similar to the ATC method and the equal energy rule was
fulfilled through equating the areas under the curves as given in Figure 3.13.
Displacement
Force
A2
A1
Vy
0.60Vy
Δy
A3
A1 + A2 = A3
Equal Energy Rule !
Ke
Ks
Figure 3.13 FEMA Idealization Method
In the 75%Vy method, a similar procedure to FEMA method was followed in the
linearization of the original curve. However, this time, the idealized curve was set to
intersect the original curve at the 75% of the approximate yield strength as shown in
Figure 3.14.
37
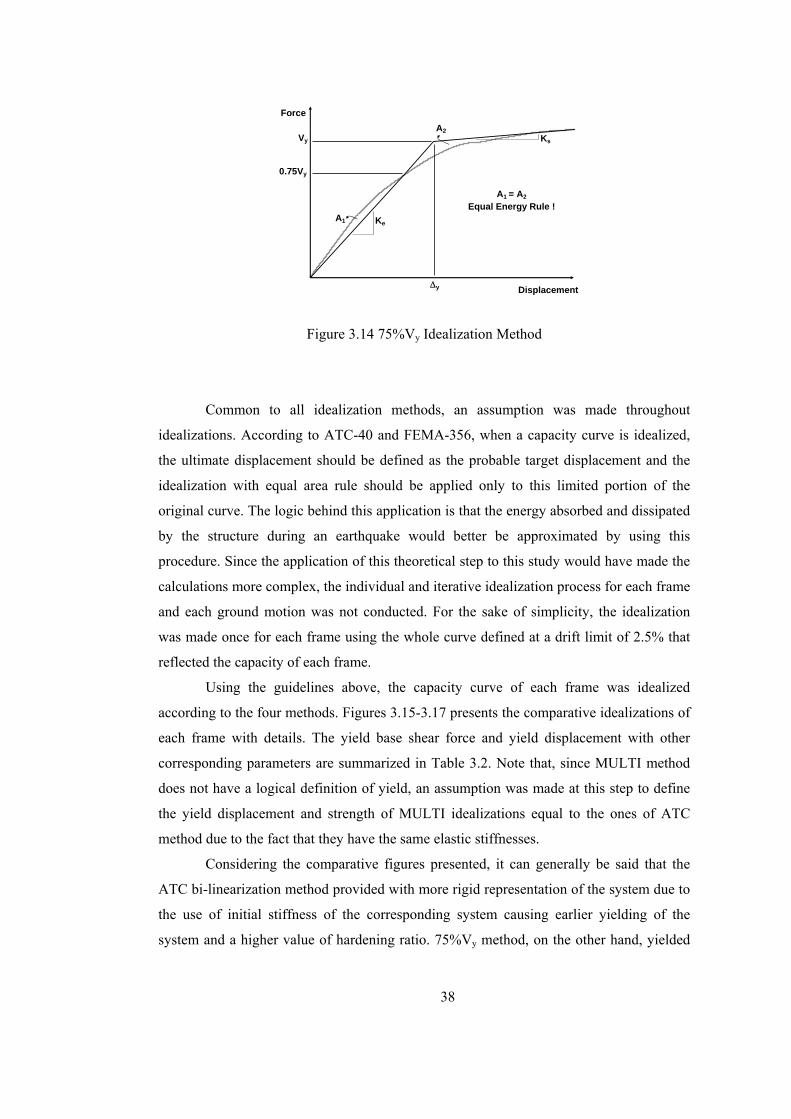
Displacement
Force
Δy
Vy
0.75Vy
A1
A2
Ke
Ks
A1 = A2
Equal Energy Rule !
Figure 3.14 75%Vy Idealization Method
Common to all idealization methods, an assumption was made throughout
idealizations. According to ATC-40 and FEMA-356, when a capacity curve is idealized,
the ultimate displacement should be defined as the probable target displacement and the
idealization with equal area rule should be applied only to this limited portion of the
original curve. The logic behind this application is that the energy absorbed and dissipated
by the structure during an earthquake would better be approximated by using this
procedure. Since the application of this theoretical step to this study would have made the
calculations more complex, the individual and iterative idealization process for each frame
and each ground motion was not conducted. For the sake of simplicity, the idealization
was made once for each frame using the whole curve defined at a drift limit of 2.5% that
reflected the capacity of each frame.
Using the guidelines above, the capacity curve of each frame was idealized
according to the four methods. Figures 3.15-3.17 presents the comparative idealizations of
each frame with details. The yield base shear force and yield displacement with other
corresponding parameters are summarized in Table 3.2. Note that, since MULTI method
does not have a logical definition of yield, an assumption was made at this step to define
the yield displacement and strength of MULTI idealizations equal to the ones of ATC
method due to the fact that they have the same elastic stiffnesses.
Considering the comparative figures presented, it can generally be said that the
ATC bi-linearization method provided with more rigid representation of the system due to
the use of initial stiffness of the corresponding system causing earlier yielding of the
system and a higher value of hardening ratio. 75%Vy method, on the other hand, yielded
38

more flexible models of the original system with the lowest value of post-elastic stiffness.
FEMA method often remained close to 75%Vy, however, represented the system with a
more rigid one. In contrast to this general view, for the capacity curves that are close to bi-
linear curves, some of the approximation methods would yield similar idealized curves.
Table 3.2 Properties of Idealized Pushover Curves
MULTI 882.0 0.0550 0.327 0.69 14.2 3.60ATC 882.0 0.0550 0.327 0.69 14.2 3.60
FEMA 964.8 0.0697 0.357 0.88 13.7 2.8475%Vy 1110.0 0.0937 0.411 1.18 8.1 2.11MULTI 1087.3 0.0396 0.805 0.66 14.4 3.79
ATC 1087.3 0.0396 0.805 0.66 14.4 3.79FEMA 1129.7 0.0430 0.837 0.72 13.5 3.4975%Vy 1145.3 0.0443 0.848 0.74 13.1 3.39MULTI 1029.5 0.0592 0.463 0.66 14.7 3.80
ATC 1029.5 0.0592 0.463 0.66 14.7 3.80FEMA 1076.2 0.0653 0.484 0.73 13.9 3.4575%Vy 1108.2 0.0697 0.499 0.77 13.1 3.23MULTI 721.0 0.0702 0.282 0.47 1.8 5.34
ATC 721.0 0.0702 0.282 0.47 1.8 5.34FEMA 774.7 0.0957 0.303 0.64 0.1 3.9275%Vy 773.6 0.0987 0.303 0.66 0.1 3.80MULTI 3003.0 0.1244 0.304 0.63 6.8 3.98
ATC 3003.0 0.1244 0.304 0.63 6.8 3.98FEMA 3228.9 0.1557 0.327 0.79 5.5 3.1875%Vy 3255.3 0.1593 0.329 0.80 5.2 3.11MULTI 2745.4 0.0695 0.364 0.49 3.4 5.11
ATC 2745.4 0.0695 0.364 0.49 3.4 5.11FEMA 2988.4 0.0972 0.396 0.68 1.8 3.6575%Vy 3058.9 0.1052 0.405 0.74 1.0 3.37MULTI 3396.0 0.1508 0.191 0.42 4.7 5.26
ATC 3396.0 0.1508 0.191 0.42 4.7 5.26FEMA 3639.3 0.1985 0.204 0.56 4.0 3.9975%Vy 3661.7 0.2029 0.206 0.57 3.9 3.91
Ductility @ 2.5%
drift
Post-Yield Slope (%)
F8S3B
F3S2B
F5S2B
F5S4B
F5S7B
Approximation MethodFrame
F2S2B
F2S2B2
Yield Base Shear Force
(kN)
Yield Roof Displacement
(m)
Yield Base Shear
Coefficient
Yield Average Interstory Drift
Ratio (%)
39

0
500
1000
1500
0.00 0.05 0.10 0.15 0.20
Top Displacement Δ (m)
Bas
e Sh
ear V
(kN
)
F2S2B
0
500
1000
1500
0.00 0.03 0.06 0.09 0.12
Top Displacement Δ (m)
Bas
e Sh
ear V
(kN
)
F2S2B2
0
500
1000
1500
0.00 0.05 0.10 0.15 0.20
Top Displacement Δ (m)
Bas
e Sh
ear V
(kN
)
F3S2B
Figure 3.15 Comparative Idealizations of Pushover Curves for Frames
‘F2S2B’, ‘F2S2B2’ and ‘F3S2B’
40
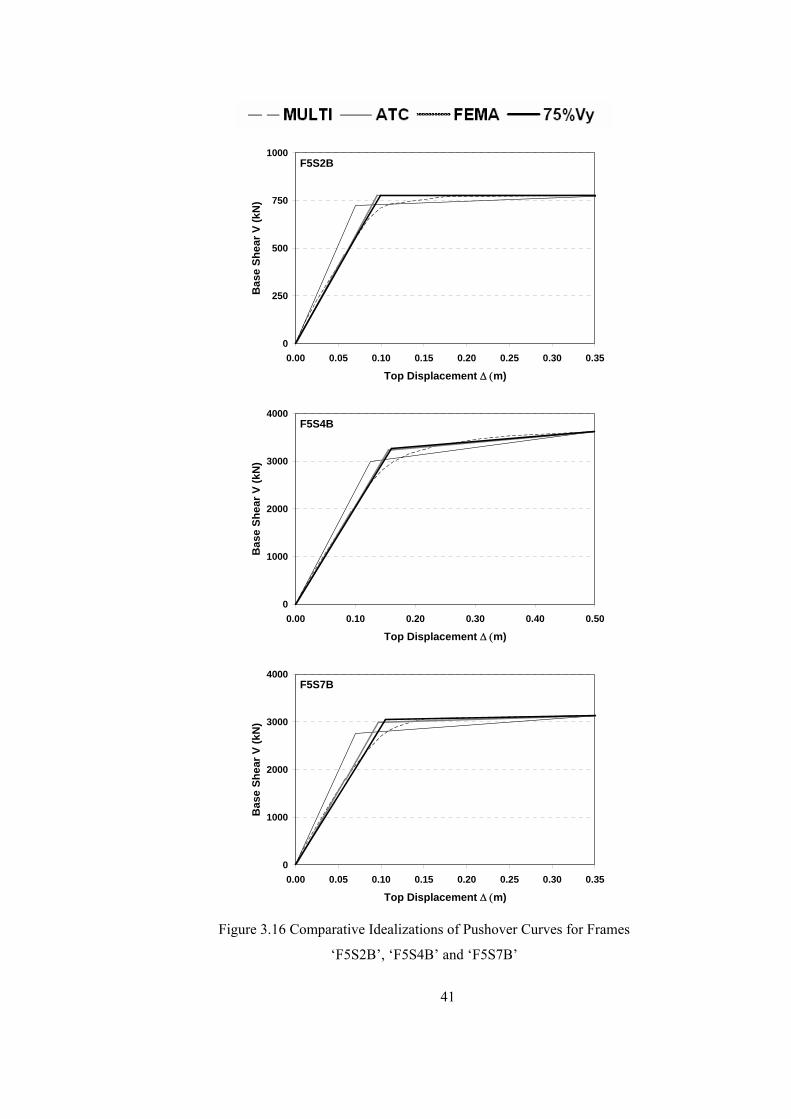
0
250
500
750
1000
0.00 0.05 0.10 0.15 0.20 0.25 0.30 0.35
Top Displacement Δ (m)
Bas
e Sh
ear V
(kN
)
F5S2B
0
1000
2000
3000
4000
0.00 0.10 0.20 0.30 0.40 0.50
Top Displacement Δ (m)
Bas
e Sh
ear V
(kN
)
F5S4B
0
1000
2000
3000
4000
0.00 0.05 0.10 0.15 0.20 0.25 0.30 0.35
Top Displacement Δ (m)
Bas
e Sh
ear V
(kN
)
F5S7B
Figure 3.16 Comparative Idealizations of Pushover Curves for Frames
‘F5S2B’, ‘F5S4B’ and ‘F5S7B’
41
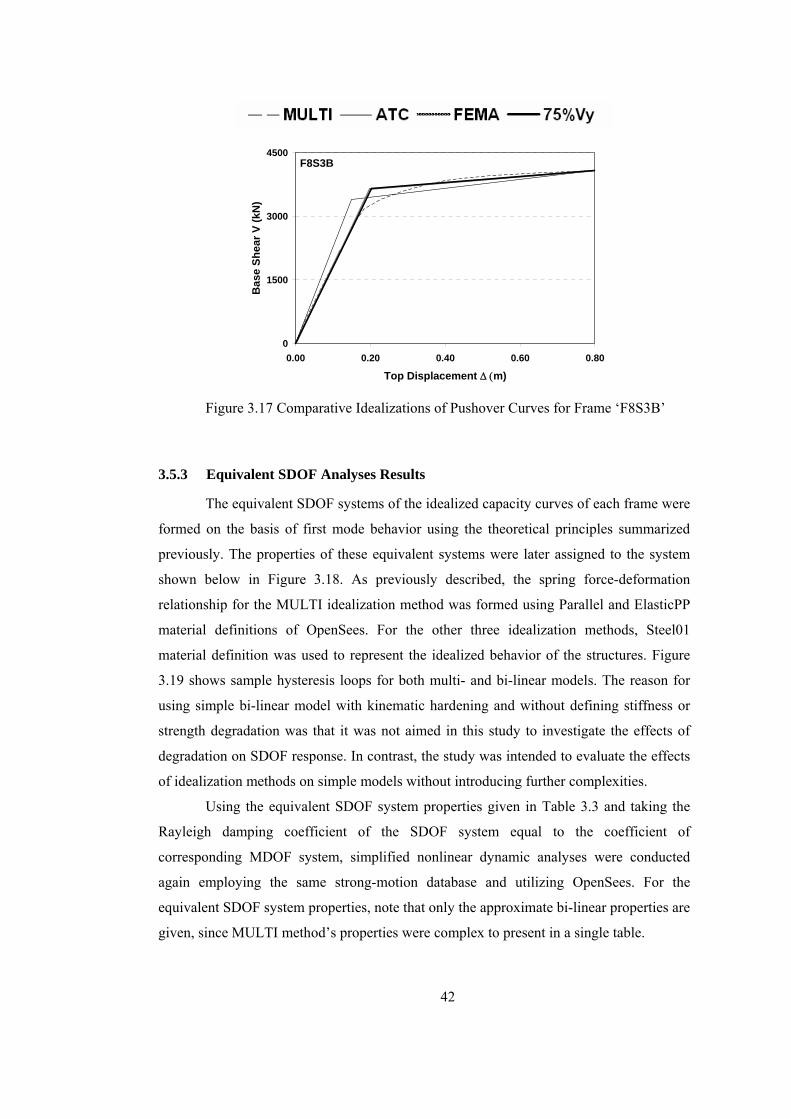
0
1500
3000
4500
0.00 0.20 0.40 0.60 0.80
Top Displacement Δ (m)
Bas
e Sh
ear V
(kN
)
F8S3B
Figure 3.17 Comparative Idealizations of Pushover Curves for Frame ‘F8S3B’
3.5.3 Equivalent SDOF Analyses Results
The equivalent SDOF systems of the idealized capacity curves of each frame were
formed on the basis of first mode behavior using the theoretical principles summarized
previously. The properties of these equivalent systems were later assigned to the system
shown below in Figure 3.18. As previously described, the spring force-deformation
relationship for the MULTI idealization method was formed using Parallel and ElasticPP
material definitions of OpenSees. For the other three idealization methods, Steel01
material definition was used to represent the idealized behavior of the structures. Figure
3.19 shows sample hysteresis loops for both multi- and bi-linear models. The reason for
using simple bi-linear model with kinematic hardening and without defining stiffness or
strength degradation was that it was not aimed in this study to investigate the effects of
degradation on SDOF response. In contrast, the study was intended to evaluate the effects
of idealization methods on simple models without introducing further complexities.
Using the equivalent SDOF system properties given in Table 3.3 and taking the
Rayleigh damping coefficient of the SDOF system equal to the coefficient of
corresponding MDOF system, simplified nonlinear dynamic analyses were conducted
again employing the same strong-motion database and utilizing OpenSees. For the
equivalent SDOF system properties, note that only the approximate bi-linear properties are
given, since MULTI method’s properties were complex to present in a single table.
42
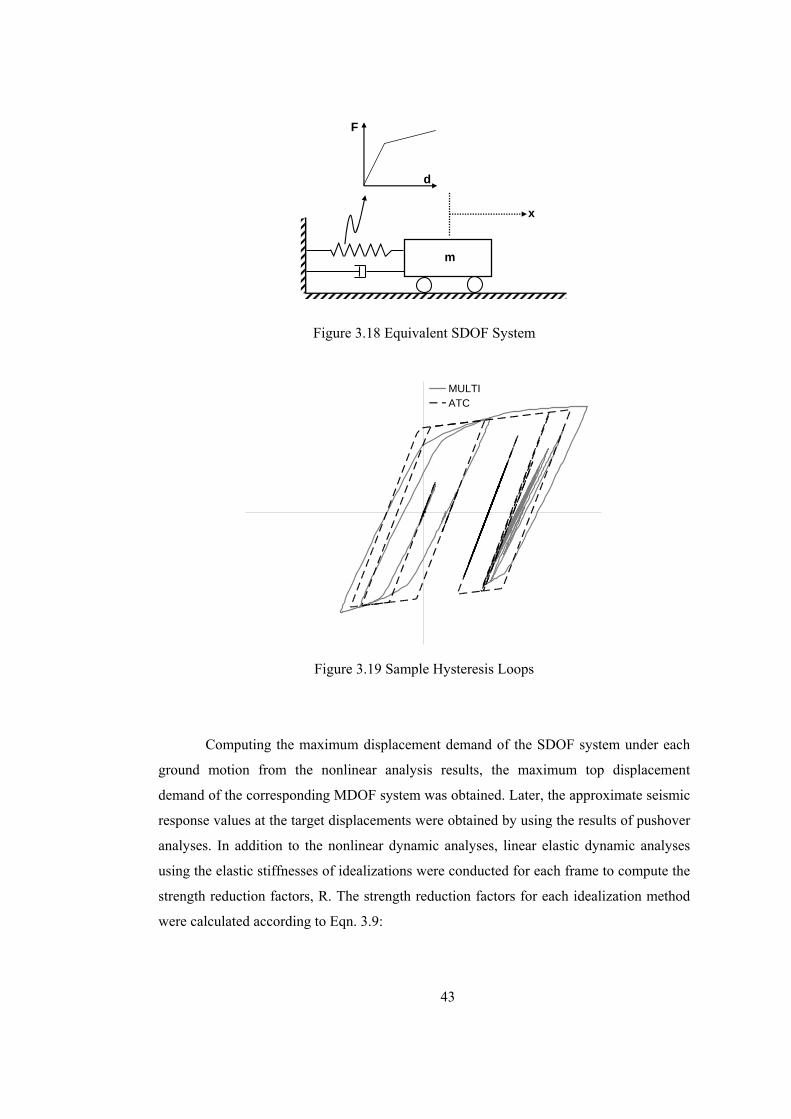
m
x
F
d
Figure 3.18 Equivalent SDOF System
MULTIATC
Figure 3.19 Sample Hysteresis Loops
Computing the maximum displacement demand of the SDOF system under each
ground motion from the nonlinear analysis results, the maximum top displacement
demand of the corresponding MDOF system was obtained. Later, the approximate seismic
response values at the target displacements were obtained by using the results of pushover
analyses. In addition to the nonlinear dynamic analyses, linear elastic dynamic analyses
using the elastic stiffnesses of idealizations were conducted for each frame to compute the
strength reduction factors, R. The strength reduction factors for each idealization method
were calculated according to Eqn. 3.9:
43
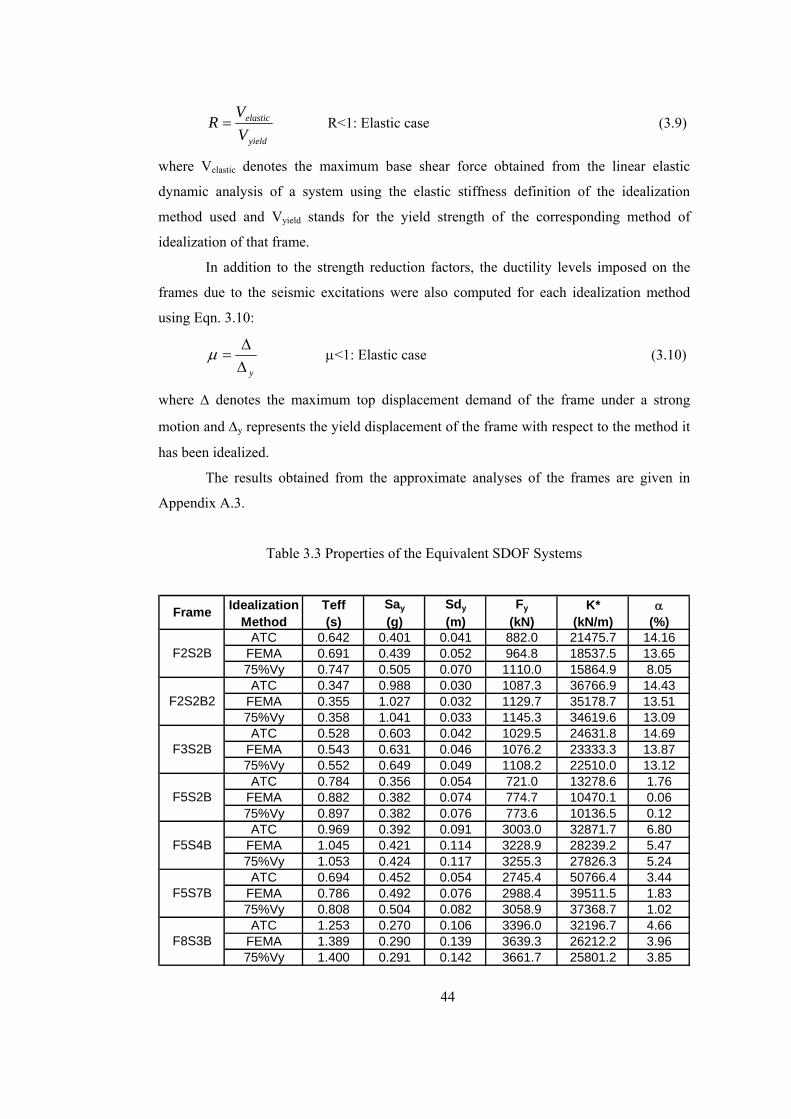
yield
elastic
VV
R = R<1: Elastic case (3.9)
where Velastic denotes the maximum base shear force obtained from the linear elastic
dynamic analysis of a system using the elastic stiffness definition of the idealization
method used and Vyield stands for the yield strength of the corresponding method of
idealization of that frame.
In addition to the strength reduction factors, the ductility levels imposed on the
frames due to the seismic excitations were also computed for each idealization method
using Eqn. 3.10:
yΔΔ
=μ μ<1: Elastic case (3.10)
where Δ denotes the maximum top displacement demand of the frame under a strong
motion and Δy represents the yield displacement of the frame with respect to the method it
has been idealized.
The results obtained from the approximate analyses of the frames are given in
Appendix A.3.
Table 3.3 Properties of the Equivalent SDOF Systems
Idealization Teff Say Sdy Fy K* αMethod (s) (g) (m) (kN) (kN/m) (%)
ATC 0.642 0.401 0.041 882.0 21475.7 14.16FEMA 0.691 0.439 0.052 964.8 18537.5 13.6575%Vy 0.747 0.505 0.070 1110.0 15864.9 8.05ATC 0.347 0.988 0.030 1087.3 36766.9 14.43
FEMA 0.355 1.027 0.032 1129.7 35178.7 13.5175%Vy 0.358 1.041 0.033 1145.3 34619.6 13.09ATC 0.528 0.603 0.042 1029.5 24631.8 14.69
FEMA 0.543 0.631 0.046 1076.2 23333.3 13.8775%Vy 0.552 0.649 0.049 1108.2 22510.0 13.12ATC 0.784 0.356 0.054 721.0 13278.6 1.76
FEMA 0.882 0.382 0.074 774.7 10470.1 0.0675%Vy 0.897 0.382 0.076 773.6 10136.5 0.12ATC 0.969 0.392 0.091 3003.0 32871.7 6.80
FEMA 1.045 0.421 0.114 3228.9 28239.2 5.4775%Vy 1.053 0.424 0.117 3255.3 27826.3 5.24ATC 0.694 0.452 0.054 2745.4 50766.4 3.44
FEMA 0.786 0.492 0.076 2988.4 39511.5 1.8375%Vy 0.808 0.504 0.082 3058.9 37368.7 1.02ATC 1.253 0.270 0.106 3396.0 32196.7 4.66
FEMA 1.389 0.290 0.139 3639.3 26212.2 3.9675%Vy 1.400 0.291 0.142 3661.7 25801.2 3.85
F5S2B
F5S4B
F5S7B
F8S3B
Frame
F2S2B
F2S2B2
F3S2B
44

3.6 COMPARISON OF RESULTS
The seismic demands in terms of maximum roof displacement, maximum base
shear and maximum inter-story drift ratio that were obtained from the equivalent SDOF
analyses were compared with the ‘exact’ results that were obtained from the nonlinear
time history analyses of MDOF systems. In the comparison, as an error indicator for each
idealization method, the approximate results were divided by the ‘exact’ results as shown
in Eqn. 3.11:
exact
eapproximat
ResultResult
Ratio = (3.11)
where ‘Resultapproximate’ denotes the approximate result obtained from one of the
idealization methods ; MULTI, ATC, FEMA and 75%Vy, in terms of maximum top
displacement, maximum inter-story drift ratio and maximum base shear whereas
‘Resultexact’ indicates the corresponding ‘exact’ result.
In the comparisons of maximum inter-story drift ratio values, the location of
maximum drift ratio was not considered and only critical drift ratio throughout the
structure was compared. The selection of maximum inter-story drift ratio throughout the
structure would be a better indicator in performance-based assessment of regular moment
resisting systems.
Apart from the comparisons of the approximate results obtained for each
idealization method with respect to ‘exact’ results of nonlinear time history analyses, the
results of the approximate procedures; ATC, FEMA and 75%Vy, were compared with the
results of MULTI method. This comparison was made because of the assumption that
since the global behavior of a structure is better represented by a capacity curve rather
than individual dynamic analyses whose results are hard to interpret and multi-linear
representation of the capacity curve completely reflects the global behavior of a structure,
it would be better to compare the common idealization methods with respect to multi-
linear method. The assumption here is particularly valid for non-pulse type ground
motions which generally constitute the current ground motion database employed. The
comparison was made similar to Eqn. 3.11. However, for the approximate results only the
ones of ATC, FEMA and 75%Vy were used and as the denominator, MULTI method’s
results were used instead of ‘exact’ results.
The comparisons made with respect to both ‘exact’ and ‘MULTI’ results for the
selected frames are given in tables which can be found in Appendix A.4. The
interpretations of the comparisons will be presented in the next chapter of the thesis.
45

CHAPTER 4
INTERPRETATION OF RESULTS
4.1 INTRODUCTION
Using the results obtained from nonlinear time history analyses of MDOF systems
and simplified time history analyses using equivalent SDOF systems obtained through
idealization of the capacity curve of each frame according to the alternatives presented,
the influence of idealizations on seismic response of structures were investigated.
Comparisons of the approximate results with respect to ‘exact’ results for
maximum top displacement, maximum inter-story drift ratio and maximum base shear
were studied first along with the correlation studies evaluating the accuracy of
approximations with respect to nonlinear time history analyses. Secondly, to investigate
the effects of approximations, the average of ratios, specified as error indicators in the
previous chapter, were summarized graphically at various levels of global drift. As the
final stage, the trends and dependencies of error indicators on ductility, strength reduction
factor and period were evaluated. The details about the statistical studies and the overall
interpretation of results are presented in the next sections.
4.2 INTERPRETATIONS WITH RESPECT TO ‘EXACT’ RESULTS
4.2.1 Correlation Studies
Approximate maximum top displacement, maximum inter-story drift ratio and
maximum base shear demands computed by the simplified analyses were first compared
with ‘exact’ results to investigate the correlation between each other. The comparisons are
presented as scatter diagrams which show the perfect correlation as the diagonal line. In
addition to the graphical comparisons, statistical studies were also conducted to quantify
the correlation. The ‘coefficient of correlation’, ρ, which was used to quantify the
46

correlation between the results of each approximation and the ‘exact’ results, were
calculated according to Eqn. 4.1 [1]:
yx
i
n
ii
ss
yyxx
n ⋅
−⋅−⋅
−=
∑=
)()(
11 1ρ (4.1)
where x , y , sx and sy are, respectively, the sample means and sample standard
deviation of X and Y.
The comparison of maximum top displacement results for each idealization
method with respect to ‘exact’ results for frame ‘F2S2B’ are illustrated in Figure 4.1 on
which the correlation coefficient values are also indicated. For the other frames, graphical
comparisons can be found in Appendix A.5.
0.00
0.15
0.30
0.45
0.60
0.00 0.15 0.30 0.45 0.60
Top Displacement (m) (EXACT)
Top
Dis
plac
emen
t (m
) (M
ULT
I) F2S2B
ρ = 0.924
0.00
0.15
0.30
0.45
0.60
0.00 0.15 0.30 0.45 0.60
Top Displacement (m) (EXACT)
Top
Dis
plac
emen
t (m
) (A
TC) F2S2B
ρ = 0.876
0.00
0.15
0.30
0.45
0.60
0.00 0.15 0.30 0.45 0.60
Top Displacement (m) (EXACT)
Top
Dis
plac
emen
t (m
) (FE
MA
) F2S2B
ρ = 0.895
0.00
0.15
0.30
0.45
0.60
0.00 0.15 0.30 0.45 0.60
Top Displacement (m) (EXACT)
Top
Dis
plac
emen
t (m
) (75
%Vy
) F2S2B
ρ = 0.919
Figure 4.1 Comparison of Approximate Results with respect to ‘EXACT’ Values of
Maximum Top Displacement for Frame ‘F2S2B’
Considering the maximum top displacement demand comparisons as depicted in
Figure 4.1 and Figures A.5.2-A.5.7, all approximations captured ‘exact’ behavior very
47

well up to the yield displacement of each frame. After yield of the systems, however,
dispersions increased. Both under-estimations and over-estimations of the methods were
observed after these points. ATC method gave the most dispersed results and it generally
under-estimated maximum displacement demands except for frame ‘F5S2B’. FEMA and
75%Vy methods usually showed the same trend in predicting the displacement demands.
Excluding frame ‘F5S2B’ which demonstrated large variations in results, as a general
tendency both methods over-estimated the demands after yield. On the other hand,
MULTI method gave the least scattered results which were also supported by the
correlation coefficient calculations. Based on the correlation coefficient computations as
summarized in Table 4.1, all methods could be said to have strong correlation with ‘exact’
results with the exception of ATC approximation which mostly gave the lowest coefficient
of correlation values.
Table 4.1 Coefficient of Correlation Values of Approximation Alternatives
at Predicting Maximum Top Displacement Demands
FRAME MULTI ATC FEMA 75%Vy
F2S2B 0.924 0.876 0.895 0.919F2S2B2 0.971 0.954 0.967 0.971F3S2B 0.978 0.961 0.961 0.961F5S2B 0.938 0.910 0.866 0.877F5S4B 0.979 0.942 0.964 0.965F5S7B 0.992 0.890 0.975 0.980F8S3B 0.972 0.939 0.957 0.961Overall Mean 0.965 0.925 0.941 0.948
Using the similar graphical comparisons for maximum inter-story drift ratio that
are illustrated in Figure 4.2 for frame ‘F2S2B’ and Figures A.5.9-A.5.14 for other frames,
all methods presented perfect correlation in low maximum inter-story drift ratio values
corresponding to the elastic range. Nevertheless, at high drift ratios, the performance of
idealization methods at capturing ‘exact’ behavior decreased and the methods showed a
general tendency to under-estimate drift demands. In contrast to this general tendency,
there were some cases in which the methods slightly over-estimated the results. Based on
the quantified results of correlation as given in Table 4.2, except for frames ‘F2S2B’ and
48

‘F5S2B’ for which low correlation coefficient values were observed, all methods showed
strong correlation; ATC method generally yielding the lowest ones.
0
2
4
6
8
10
0 2 4 6 8 10
MIDR (%) (EXACT)
MID
R (%
) (M
ULT
I)
F2S2B
ρ = 0.861
0
2
4
6
8
10
0 2 4 6 8 10
MIDR (%) (EXACT)
MID
R (%
) (A
TC)
F2S2B
ρ = 0.811
0
2
4
6
8
10
0 2 4 6 8 10
MIDR (%) (EXACT)
MID
R (%
) (FE
MA
)
F2S2B
ρ = 0.830
0
2
4
6
8
10
0 2 4 6 8 10
MIDR (%) (EXACT)
MID
R (%
) (75
%Vy
)
F2S2B
ρ = 0.863
Figure 4.2 Comparison of Approximate Results with respect to ‘EXACT’ Values of
Maximum Inter-Story Drift Ratio for Frame ‘F2S2B’
Table 4.2 Coefficient of Correlation Values of Approximation Alternatives
at Predicting Maximum Inter-Story Drift Ratio Demands
FRAME MULTI ATC FEMA 75%Vy
F2S2B 0.861 0.811 0.830 0.863F2S2B2 0.973 0.959 0.970 0.973F3S2B 0.980 0.964 0.964 0.966F5S2B 0.883 0.840 0.811 0.817F5S4B 0.981 0.946 0.970 0.971F5S7B 0.926 0.756 0.906 0.927F8S3B 0.951 0.938 0.943 0.946Overall Mean 0.936 0.888 0.914 0.923
49

The graphical comparisons for maximum base shear values are depicted in Figure
4.3 and Figures A.5.16-A.5.21. All idealization methods performed well on the average in
the elastic range. In yield base shear range of frames, the approximate results were
dispersed widely pointing out the poor performance of the methods in these regions. The
general behavior after yielding of systems could be expressed as under-estimation of
maximum base shear values. Among the alternatives, ATC method showed the most
scattered results which was also supported by the correlation studies as summarized in
Table 4.3. The methods MULTI, FEMA and 75%Vy showed high correlation with the
‘exact’ results considering the whole data. In addition, the case of dispersed results
showing under-estimations as well as over-estimations for mid-rise buildings changed into
the case of definite under-estimations for the relatively high rise frame indicating the
significance of higher mode effects.
0
500
1000
1500
2000
0 500 1000 1500 2000
Base Shear (kN) (EXACT)
Bas
e Sh
ear (
kN) (
MU
LTI)
F2S2B
ρ = 0.971
0
500
1000
1500
2000
0 500 1000 1500 2000
Base Shear (kN) (EXACT)
Bas
e Sh
ear (
kN) (
ATC
)
F2S2B
ρ = 0.954
0
500
1000
1500
2000
0 500 1000 1500 2000
Base Shear (kN) (EXACT)
Bas
e Sh
ear (
kN) (
FEM
A)
F2S2B
ρ = 0.968
0
500
1000
1500
2000
0 500 1000 1500 2000
Base Shear (kN) (EXACT)
Bas
e Sh
ear (
kN) (
75%
Vy)
F2S2B
ρ = 0.968
Figure 4.3 Comparison of Approximate Results with respect to ‘EXACT’ Values of
Maximum Base Shear for Frame ‘F2S2B’
50

Table 4.3 Coefficient of Correlation Values of Approximation Alternatives
at Predicting Maximum Base Shear Demands
FRAME MULTI ATC FEMA 75%Vy
F2S2B 0.971 0.954 0.968 0.968F2S2B2 0.980 0.965 0.978 0.982F3S2B 0.976 0.962 0.968 0.973F5S2B 0.977 0.941 0.982 0.980F5S4B 0.970 0.951 0.971 0.972F5S7B 0.979 0.934 0.982 0.982F8S3B 0.956 0.937 0.955 0.956Overall Mean 0.973 0.949 0.972 0.973
4.2.2 Comparison of Methods at Various Levels of Global Drift
Apart from the correlation studies, the approximation methods were also
compared at various levels of global drift. The selection of drift level instead of ductility
level was based on the fact that each idealization method has its own yield displacement
definition and thus causing different ductility values. On the other hand, by using drift
based comparisons, it would be easier to figure out the unbiased error level in the
prediction of the demand parameter sought at the level of global drift considered.
Using the comparison results in terms of ratios as error indicators previously
given, the results were clustered at each 0.5% global drift increments for each
approximation method. That is, for 1% global drift, the results in the range between 0.75%
and 1.25% global drift were collected. If the number of data collected from this range was
less than 3, the data was discarded. For each method, mean, standard deviation, minimum
and maximum values were calculated using the data within the above pre-defined drift
levels. Later, for every frame, these statistical results were expressed as minimum,
maximum, mean, mean minus/plus one standard deviation values at the specified global
drift levels.
Figures 4.4 to 4.9 present the statistical features of the error indicators calculated
based on the approximations employed. In these figures, solid boxes show the mean value
(center line of the box) and plus/minus one standard deviation (upper and lower edges of
the box). Vertical lines passing through the center of the boxes depict the upper and lower
limits of the values that are maximum and minimum values. In certain cases, due to
rigidity and strength of the individual frames, results could not be calculated at high drift
ratios.
51

Considering the prediction capability of approximations in terms of maximum
displacement demand as given in Figure 4.4 and Figures A.6.2-A.6.7, it was observed that
the results were highly affected by individual ground motions since some methods yielded
even 60% under-estimations and 70% over-estimations for some of the frames.
Nonetheless, as a general behavior, the mean error in computing the displacement demand
remained around 20%. Up to average yield drift ratios which are in the range of 0.4 to 1.2,
MULTI and ATC methods under-estimated the ‘exact’ displacement as much as 15%. In
contrast, FEMA and 75%Vy methods usually remained close to exact prediction line with
the latter one giving the highest displacement demand. After the yield global drift levels,
the general trend to under-estimate or to over-estimate was observed to be unclear, but the
dispersion of each method at high drift levels was noticed to be increased. MULTI method
commonly showed little dispersion whereas ATC method indicated the most scattered
results. Having higher standard deviations as opposed to MULTI method, FEMA method
globally gave very close results with respect to the ‘exact’ maximum top displacement
demands. Hence, when the roof displacement demand predictions are of concern, FEMA
method was observed to be the most accurate one among the alternatives employed.
0.00
0.50
1.00
1.50
2.00
0.50 1.00 1.50 2.00 2.50 3.00 3.50 4.00
Roof Drift (%)
Δ ap
prox
. / Δ
exac
t
75%VyFEMAATCMULTI
F2S2B
Figure 4.4 Comparison of Approximations with respect to ‘EXACT’ Values of Maximum
Top Displacement at Specified Global Roof Drifts for Frame ‘F2S2B’
52

Similar to maximum roof displacement predictions, the errors indicating the ratios
of maximum inter-story drift were also summarized as previously described. As illustrated
through Figure 4.5 and Figures A.6.9-A.6.14, both lower and upper limits for mean errors
at indicated drift levels were around 25%. However, in some methods, the errors
approached to 85% with both under-estimations and over-estimations indicating that the
results were highly affected from the ground motion characteristics. MULTI and ATC
methods gave very close results and generally under-estimated the response. On the
contrary, FEMA and 75%Vy methods predicted the critical inter-story drift demands in a
better sense with relatively small under-estimations as well as slightly conservative results
for some cases. MULTI method again usually showed the least dispersion in results with
75%Vy being the second.
0.00
0.50
1.00
1.50
2.00
0.50 1.00 1.50 2.00 2.50 3.00 3.50 4.00
Roof Drift (%)
MID
R ap
prox
. / M
IDR
exac
t
75%VyFEMAATCMULTI
F2S2B
Figure 4.5 Comparison of Approximations with respect to ‘EXACT’ Values of Maximum
Inter-Story Drift Ratio at Specified Global Roof Drifts for Frame ‘F2S2B’
Similarly, the effects of approximation methods on maximum base shear
predictions are also summarized in Figure 4.6 and Figures A.6.16-A.6.21. The
53
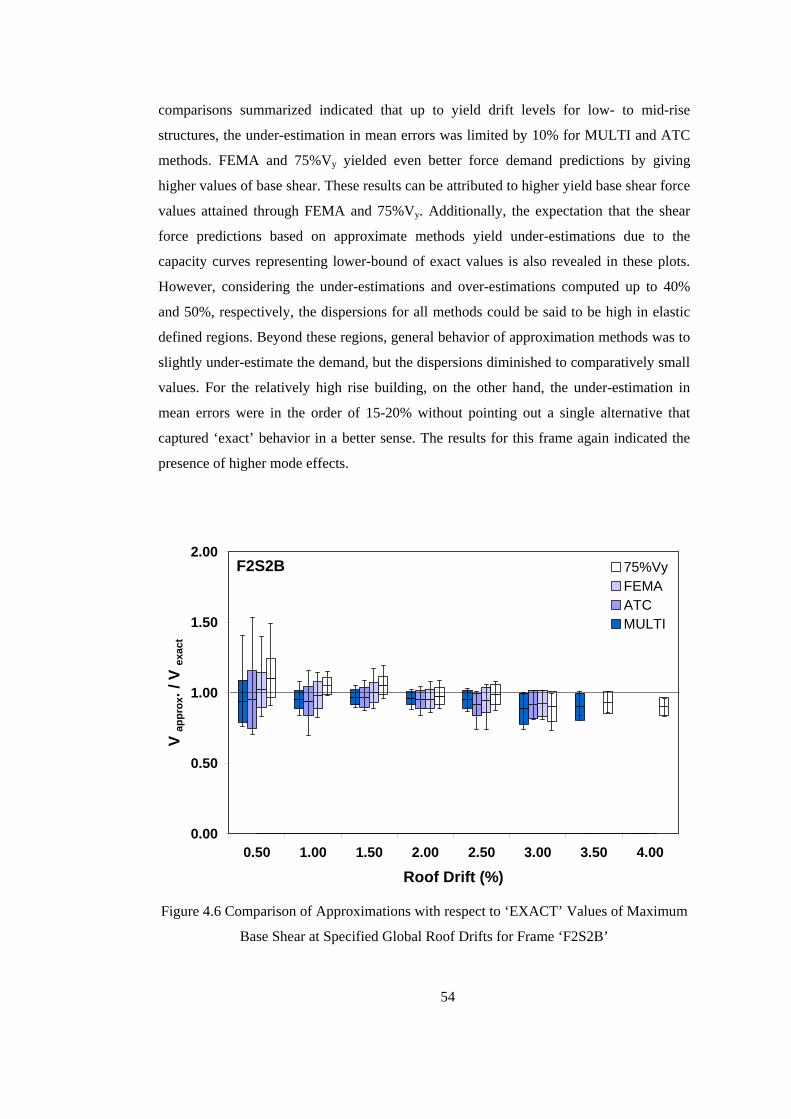
comparisons summarized indicated that up to yield drift levels for low- to mid-rise
structures, the under-estimation in mean errors was limited by 10% for MULTI and ATC
methods. FEMA and 75%Vy yielded even better force demand predictions by giving
higher values of base shear. These results can be attributed to higher yield base shear force
values attained through FEMA and 75%Vy. Additionally, the expectation that the shear
force predictions based on approximate methods yield under-estimations due to the
capacity curves representing lower-bound of exact values is also revealed in these plots.
However, considering the under-estimations and over-estimations computed up to 40%
and 50%, respectively, the dispersions for all methods could be said to be high in elastic
defined regions. Beyond these regions, general behavior of approximation methods was to
slightly under-estimate the demand, but the dispersions diminished to comparatively small
values. For the relatively high rise building, on the other hand, the under-estimation in
mean errors were in the order of 15-20% without pointing out a single alternative that
captured ‘exact’ behavior in a better sense. The results for this frame again indicated the
presence of higher mode effects.
0.00
0.50
1.00
1.50
2.00
0.50 1.00 1.50 2.00 2.50 3.00 3.50 4.00
Roof Drift (%)
V ap
prox
. / V
exac
t
75%VyFEMAATCMULTI
F2S2B
Figure 4.6 Comparison of Approximations with respect to ‘EXACT’ Values of Maximum
Base Shear at Specified Global Roof Drifts for Frame ‘F2S2B’
54

In general, ATC method showed the most dispersion in elastic regions according
to standard deviation, minimum, and maximum values. Unlike MULTI and ATC, FEMA
and 75%Vy were able to capture the ‘exact’ base shear demands satisfactorily up to the
yield of systems. After yielding, all methods gave similar results.
4.2.3 Period-wise Comparison of Methods
The results of the previous section were re-evaluated to represent the error
distribution with respect to period. The mean error ratios for maximum displacement
demands of each frame, as illustrated in Figure 4.7, showed that ATC and MULTI
methods gave very close results and generally under-estimated ‘exact’ demands as much
as 10%, whereas FEMA and 75%Vy, being the second couple, yielded better predictions
of the roof displacement demands with conservative results in some cases. Despite the fact
that the results highly vary due to record-to-record variability, it was observed that
MULTI exhibited the least scatter, although it under-estimated the response at all periods.
On the contrary, FEMA was observed to be the best alternative by yielding results very
close to the ‘exact’ results with relatively small dispersion.
0.00
0.50
1.00
1.50
2.00
0.30 0.45 0.59 0.66 0.75 0.95 1.20
Period
Δ ap
prox
. / Δ
exac
t
75%VyFEMAATCMULTI
Figure 4.7 Period-wise Distribution of Comparisons for
Maximum Displacement Demands with respect to ‘EXACT’ Results
55
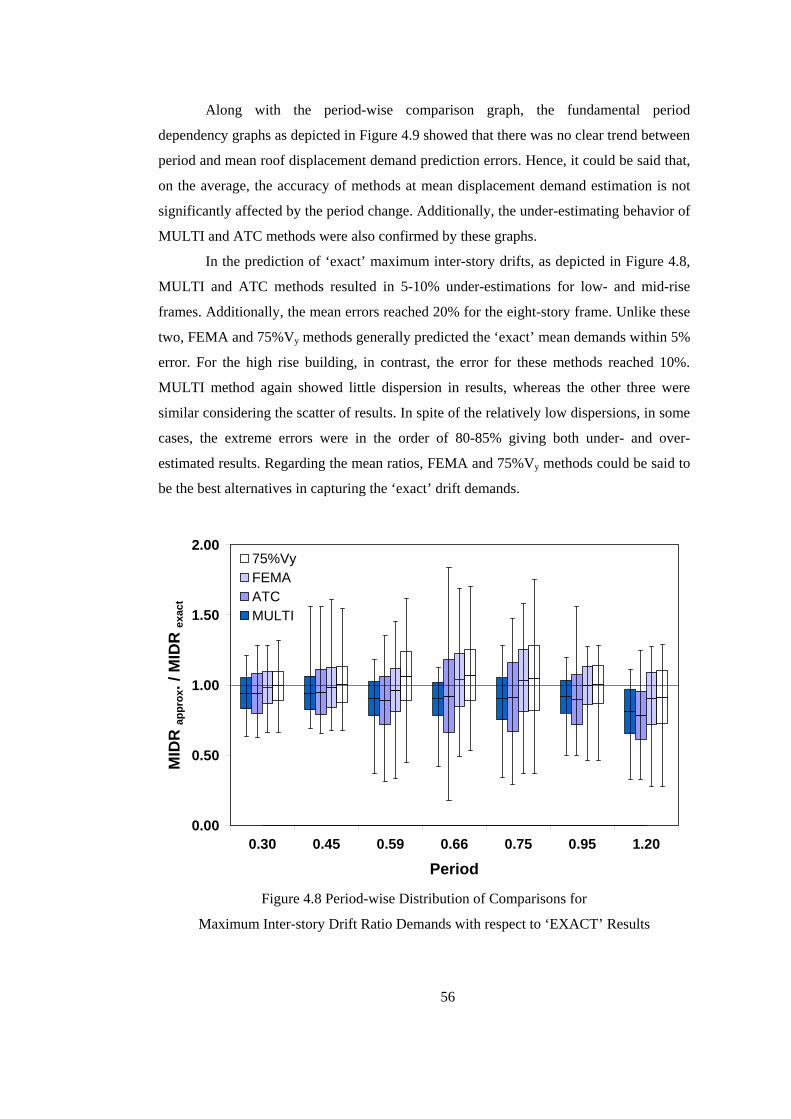
Along with the period-wise comparison graph, the fundamental period
dependency graphs as depicted in Figure 4.9 showed that there was no clear trend between
period and mean roof displacement demand prediction errors. Hence, it could be said that,
on the average, the accuracy of methods at mean displacement demand estimation is not
significantly affected by the period change. Additionally, the under-estimating behavior of
MULTI and ATC methods were also confirmed by these graphs.
In the prediction of ‘exact’ maximum inter-story drifts, as depicted in Figure 4.8,
MULTI and ATC methods resulted in 5-10% under-estimations for low- and mid-rise
frames. Additionally, the mean errors reached 20% for the eight-story frame. Unlike these
two, FEMA and 75%Vy methods generally predicted the ‘exact’ mean demands within 5%
error. For the high rise building, in contrast, the error for these methods reached 10%.
MULTI method again showed little dispersion in results, whereas the other three were
similar considering the scatter of results. In spite of the relatively low dispersions, in some
cases, the extreme errors were in the order of 80-85% giving both under- and over-
estimated results. Regarding the mean ratios, FEMA and 75%Vy methods could be said to
be the best alternatives in capturing the ‘exact’ drift demands.
0.00
0.50
1.00
1.50
2.00
0.30 0.45 0.59 0.66 0.75 0.95 1.20
Period
MID
R ap
prox
. / M
IDR
exac
t
75%VyFEMAATCMULTI
Figure 4.8 Period-wise Distribution of Comparisons for
Maximum Inter-story Drift Ratio Demands with respect to ‘EXACT’ Results
56

0.00
0.50
1.00
1.50
2.00
0.00
0.20
0.40
0.60
0.80
1.00
1.20
1.40
Perio
d (s
)
Δ approx. / Δ exact
MU
LTI
0.00
0.50
1.00
1.50
2.00
0.00
0.20
0.40
0.60
0
Perio
d (
Δ approx. / Δ exact
ATC
.80
1.00
1.20
1.40
s)
0.00
0.50
0.00
0.20
0.40
0.60
0.80
1.00
1.20
1.40
Perio
d (s
)
Δ appro
1.00
1.50
2.00
x. / Δ exact
FEM
A
0.00
0.50
0.00
0.20
0.40
0.60
0.80
1.00
1.20
1.40
Perio
d (s
)Δ appro
1.00
1.50
2.00
x. / Δ exact
75%
V y
Figu
re 4
.9 D
epen
denc
y on
Per
iod
(Max
imum
Top
Dis
plac
emen
t)
57
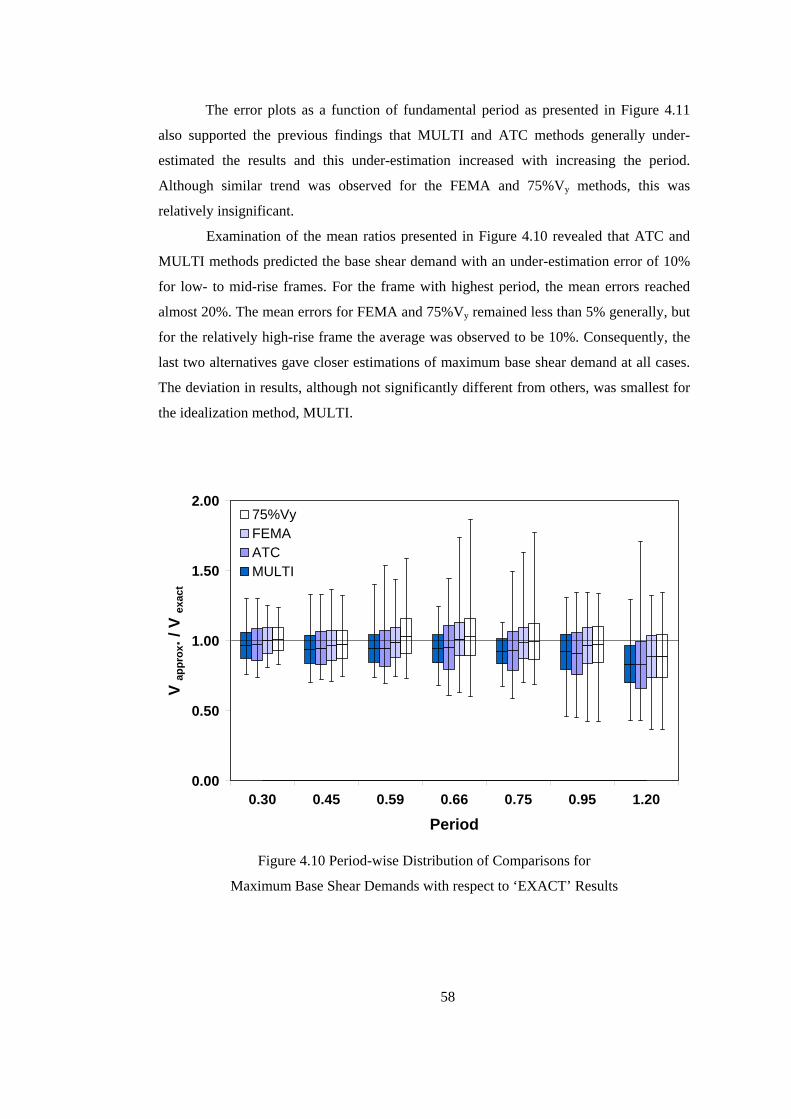
The error plots as a function of fundamental period as presented in Figure 4.11
also supported the previous findings that MULTI and ATC methods generally under-
estimated the results and this under-estimation increased with increasing the period.
Although similar trend was observed for the FEMA and 75%Vy methods, this was
relatively insignificant.
Examination of the mean ratios presented in Figure 4.10 revealed that ATC and
MULTI methods predicted the base shear demand with an under-estimation error of 10%
for low- to mid-rise frames. For the frame with highest period, the mean errors reached
almost 20%. The mean errors for FEMA and 75%Vy remained less than 5% generally, but
for the relatively high-rise frame the average was observed to be 10%. Consequently, the
last two alternatives gave closer estimations of maximum base shear demand at all cases.
The deviation in results, although not significantly different from others, was smallest for
the idealization method, MULTI.
0.00
0.50
1.00
1.50
2.00
0.30 0.45 0.59 0.66 0.75 0.95 1.20
Period
V ap
prox
. / V
exac
t
75%VyFEMAATCMULTI
Figure 4.10 Period-wise Distribution of Comparisons for
Maximum Base Shear Demands with respect to ‘EXACT’ Results
58
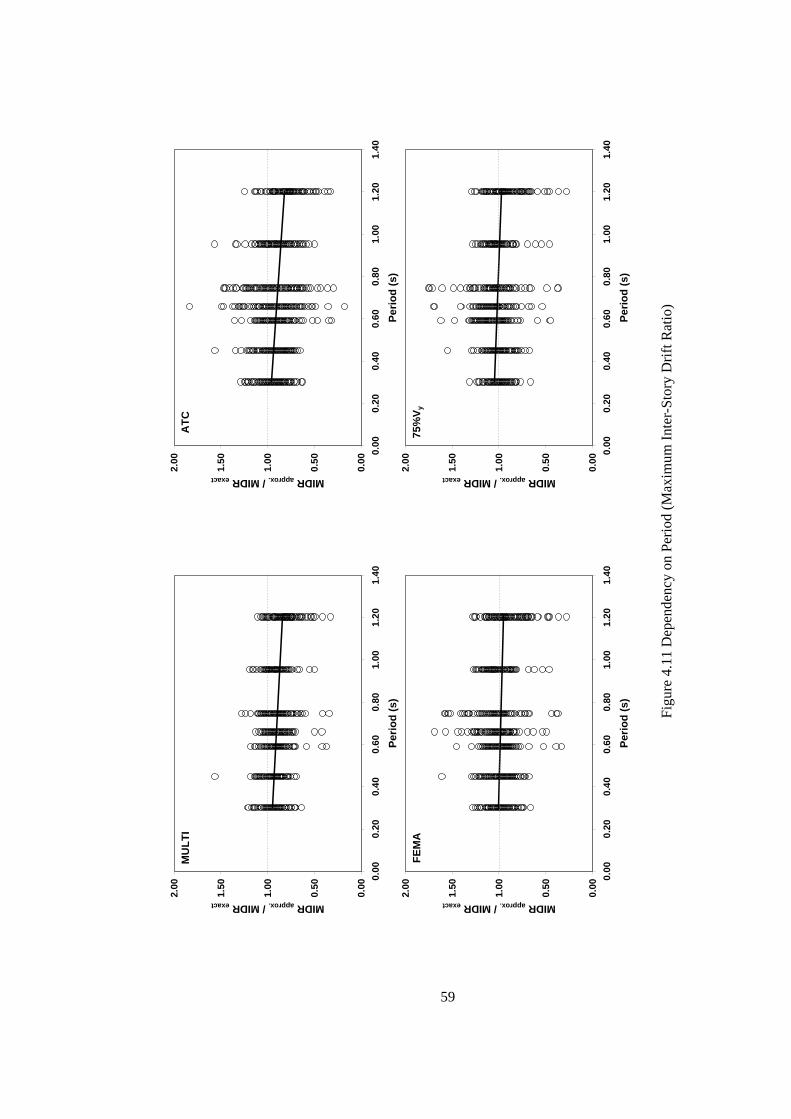
0.00
0.50
1.00
1.50
2.00
0.00
0.20
0.40
0.60
0.80
1.00
1.20
1.40
Perio
d (s
)
MIDR approx. / MIDR exact
MU
LTI
0.00
0.50
1.00
1.50
2.00
0.00
0.20
0.40
0.60 Pe
riod
(
MIDR approx. / MIDR exact
ATC
0.80
1.00
1.20
1.40
s)
0.00
0.50
0.00
0.20
0.40
0.60
0.80
1.00
1.20
1.40
Perio
d (s
)
MIDR approx
1.00
1.50
2.00
. / MIDR exact
FEM
A
0.00
0.50
0.00
0.20
0.40
0.60
0.80
1.00
1.20
1.40
Perio
d (s
)MIDR approx
1.00
1.50
2.00
. / MIDR exact
75%
V y
Figu
re 4
.11
Dep
ende
ncy
on P
erio
d (M
axim
um In
ter-
Stor
y D
rift R
atio
)
59

Similar to the observations made for the inter story drift, the effect of period
change on the prediction capability of idealization alternatives was observed to be a
decrease in accuracy with increasing periods as illustrated in Figure 4.12. It was also
noticed that the decrease in accuracy of MULTI and ATC methods were higher with
respect to the decrease in accuracy of FEMA and 75%Vy methods. This reveals that the
MULTI and ATC methods’ prediction capabilities at estimating force demands are weaker
at high periods.
4.2.4 Trends and Dependencies on Ductility and Strength Reduction Factor
Apart from the comparisons of methods at specified global drift levels, the likely
error dependency on ductility (μ) and strength reduction factor (R) were also investigated.
When seeking for dependencies on ductility and strength reduction factor, for each seismic
demand parameter and each frame, all results were shown as data points and linear
regression line was obtained from these data points. By using the linear trend lines, it
would be possible to identify the dependencies of errors on ductility and strength
reduction factor. It must be noted here that μ=1 and R=1 indicates the elastic cases.
Considering the error plots as functions of ductility and strength reduction factor
(dependency graphs) with respect to ‘exact’ values in terms of maximum top
displacement, as given in Figures 4.13-4.14 and Figures A.7.1-A.7.14, the error ratios
generally tended to decrease with increasing degrees of inelasticity for low-rise frames. In
contrast, for mid- to high-rise frames, the general trend was to increase with increasing
levels of ductility. The strength reduction factor dependency was similar to the ductility
dependency in most of the cases. This shows that the accuracy of predictions depend on
the degree of inelasticity in all cases such that the degree of under-estimation increases for
low-rise frames whereas the opposite trend is observed for mid- to high-rise frames.
Figures 4.15-4.16 and Figures A.7.15-A.7.28 showed that in maximum inter-story
drift ratio predictions, the ratios tended to decrease for low-rise frames as the inelasticity
degree increased. In mid- to high- rise frames, the general tendency was an increase in the
amount of under-estimation with increasing ductility level, leading to over-estimations at
large ductility values. Moreover, the dependencies on strength reduction factor again
generally complied with the ductility dependencies except that in a few cases FEMA and
75%Vy showed insignificant opposite trends between μ and R.
60

0.00
0.50
1.00
1.50
2.00
0.00
0.20
0.40
0.60
0.80
1.00
1.20
1.40
Perio
d (s
)
V approx. / V exact
MU
LTI
0.00
0.50
1.00
1.50
2.00
0.00
0.20
0.40
0.60 Pe
riod
(
V approx. / V exact
ATC
0.80
1.00
1.20
1.40
s)
0.00
0.50
0.00
0.20
0.40
0.60
0.80
1.00
1.20
1.40
Perio
d (s
)
V appr
1.00
1.50
2.00
ox. / V exact
FEM
A
0.00
0.50
0.00
0.20
0.40
0.60
0.80
1.00
1.20
1.40
Perio
d (s
)V appr
1.00
1.50
2.00
ox. / V exact
75%
V y
Figu
re 4
.12
Dep
ende
ncy
on P
erio
d (M
axim
um B
ase
Shea
r)
61
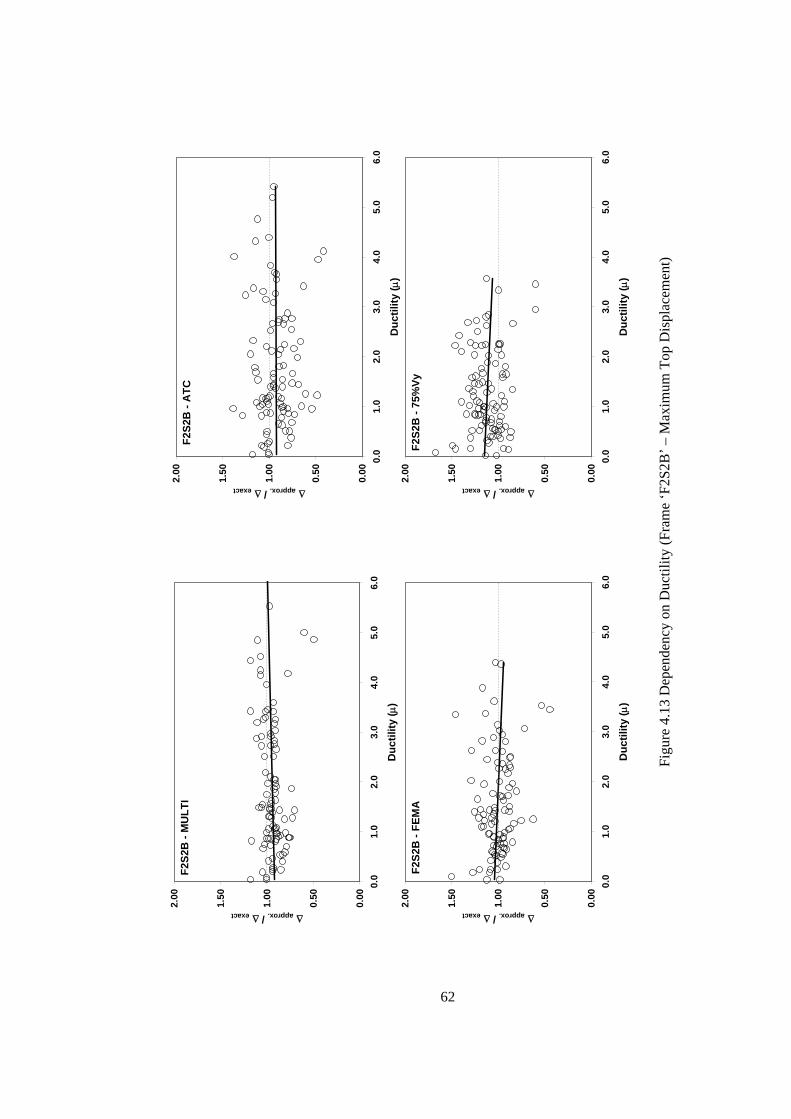
0.00
0.50
1.00
1.50
2.00
0.0
1.0
2.0
3.0
4.0
5.0
6.0
Duc
tility
(μ)
Δ approx. / Δ exact
F2S2
B -
MU
LTI
0.00
0.50
1.00
1.50
2.00
0.0
1.0
2.0
3.0
Duc
tility
Δ approx. / Δ exact
F2S2
B -
ATC
4.0
5.0
6.0
(μ)
0.00
0.50
0.0
1.0
2.0
3.0
4.0
5.0
6.0
Duc
tility
(μ)
Δ appro
1.00
1.50
2.00
x. / Δ exact
F2S2
B -
FEM
A
0.00
0.50
0.0
1.0
2.0
3.0
4.0
5.0
6.0
Duc
tility
(μ)
Δ appro
1.00
1.50
2.00
x. / Δ exact
F2S2
B -
75%
Vy
Figu
re 4
.13
Dep
ende
ncy
on D
uctil
ity (F
ram
e ‘F
2S2B
’ – M
axim
um T
op D
ispl
acem
ent)
62
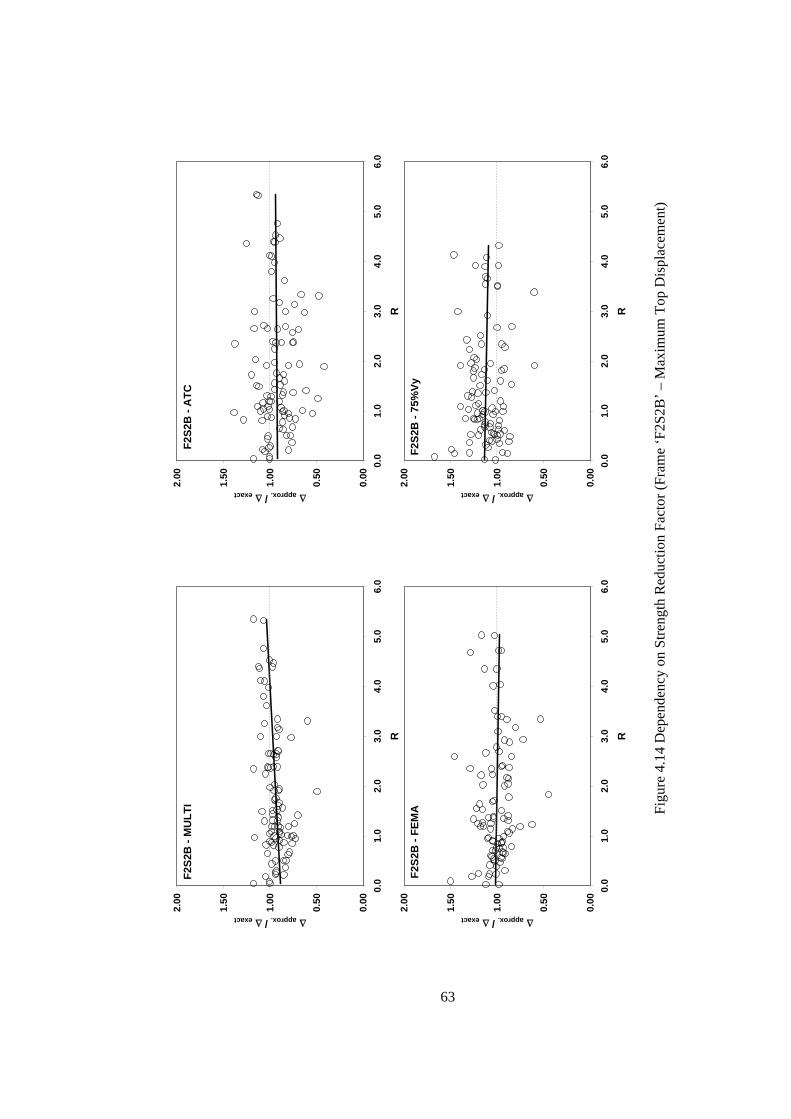
0.00
0.50
1.00
1.50
2.00
0.0
1.0
2.0
3.0
4.0
5.0
6.0
R
Δ approx. / Δ exactF2
S2B
- M
ULT
I
0.00
0.50
1.00
1.50
2.00
0.0
1.0
2.0
3.0 R
Δ approx. / Δ exact
F2S2
B -
ATC
4.0
5.0
6.0
0.00
0.50
0.0
1.0
2.0
3.0
4.0
5.0
6.0
R
Δ approx
1.00
1.50
2.00
. / Δ exact
F2S2
B -
FEM
A
0.00
0.50
0.0
1.0
2.0
3.0
4.0
5.0
6.0
RΔ approx
1.00
1.50
2.00
. / Δ exact
F2S2
B -
75%
Vy
Figu
re 4
.14
Dep
ende
ncy
on S
treng
th R
educ
tion
Fact
or (F
ram
e ‘F
2S2B
’ – M
axim
um T
op D
ispl
acem
ent)
63

0.00
0.50
1.00
1.50
2.00
0.0
1.0
2.0
3.0
4.0
5.0
6.0
Duc
tility
(μ)
MIDR approx. / MIDR exact
F2S2
B -
MU
LTI
0.00
0.50
1.00
1.50
2.00
0.0
1.0
2.0
3.0
Duc
tility
MIDR approx. / MIDR exac
4.0
5.0
6.0
(μ)
F2S2
B -
ATC
t
0.00
0.50
1.00
1.50
2.00
0.0
1.0
2.0
3.0
4.0
5.0
6.0
Duc
tility
(μ)
MIDR approx. / MIDR exact
F2S2
B -
FEM
A
0.00
0.50
1.00
1.50
2.00
0.0
1.0
2.0
3.0
4.0
5.0
6.0
Duc
tility
(μ)
MIDR approx. / MIDR exact
F2S2
B -
75%
Vy
Figu
re 4
.15
Dep
ende
ncy
on D
uctil
ity (F
ram
e ‘F
2S2B
’ – M
axim
um In
ter-
Stor
y D
rift R
atio
)
64

0.00
0.50
1.00
1.50
2.00
0.0
1.0
2.0
3.0
4.0
5.0
6.0
R
MIDR approx. / MIDR exact
F2S2
B -
MU
LTI
0.00
0.50
1.00
1.50
2.00
0.0
1.0
2.0
3.0 R
MIDR approx. / MIDR exact
F2S2
B -
ATC
4.0
5.0
6.0
0.00
0.50
0.0
1.0
2.0
3.0
4.0
5.0
6.0
R
MIDR approx
1.00
1.50
2.00
. / MIDR exact
F2S2
B -
FEM
A
0.00
0.50
0.0
1.0
2.0
3.0
4.0
5.0
6.0
RMIDR approx
1.00
1.50
2.00
. / MIDR exact
F2S2
B -
75%
Vy
Figu
re 4
.16
Dep
ende
ncy
on S
treng
th R
educ
tion
Fact
or (F
ram
e ‘F
2S2B
’ – M
axim
um In
ter-
Stor
y D
rift R
atio
)
65
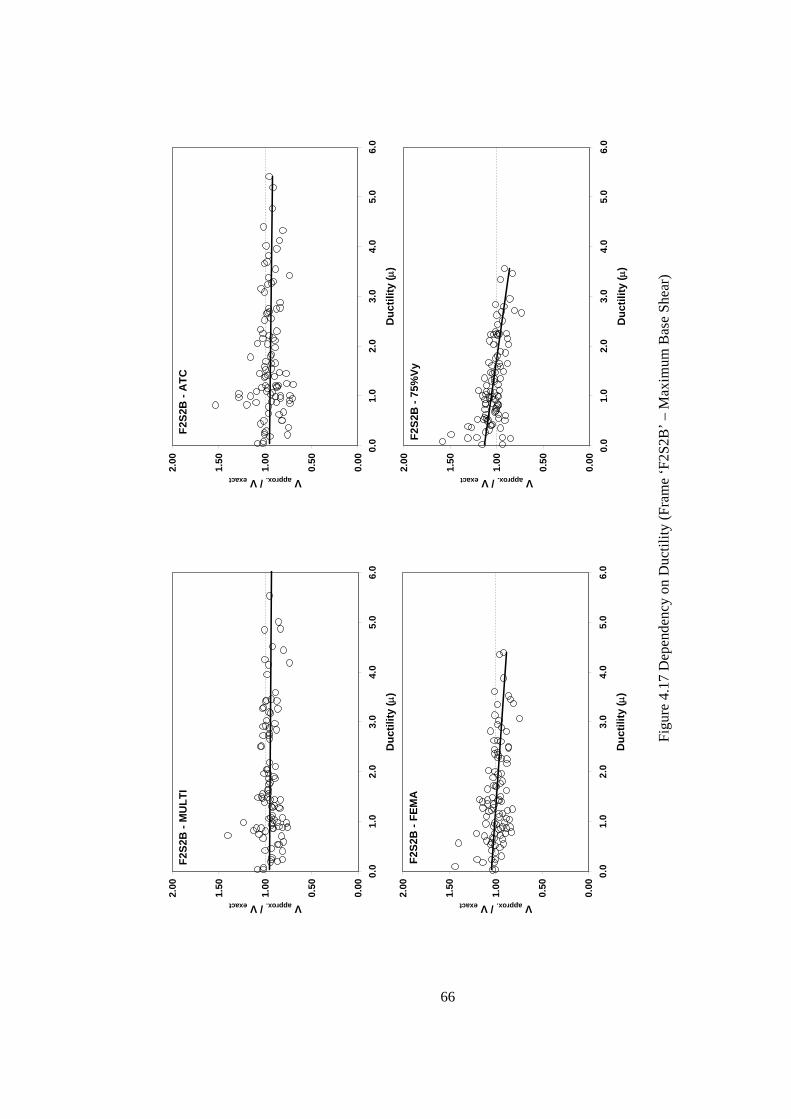
0.00
0.50
1.00
1.50
2.00
0.0
1.0
2.0
3.0
4.0
5.0
6.0
Duc
tility
(μ)
V approx. / V exact
F2S2
B -
MU
LTI
0.00
0.50
1.00
1.50
2.00
0.0
1.0
2.0
3.0
Duc
tility
V approx. / V exact
F2S2
B -
ATC
4.0
5.0
6.0
(μ)
0.00
0.50
0.0
1.0
2.0
3.0
4.0
5.0
6.0
Duc
tility
(μ)
V approx
1.00
1.50
2.00
. / V exact
F2S2
B -
FEM
A
0.00
0.50
0.0
1.0
2.0
3.0
4.0
5.0
6.0
Duc
tility
(μ)
V approx
1.00
1.50
2.00
. / V exact
F2S2
B -
75%
Vy
Figu
re 4
.17
Dep
ende
ncy
on D
uctil
ity (F
ram
e ‘F
2S2B
’ – M
axim
um B
ase
Shea
r)
66
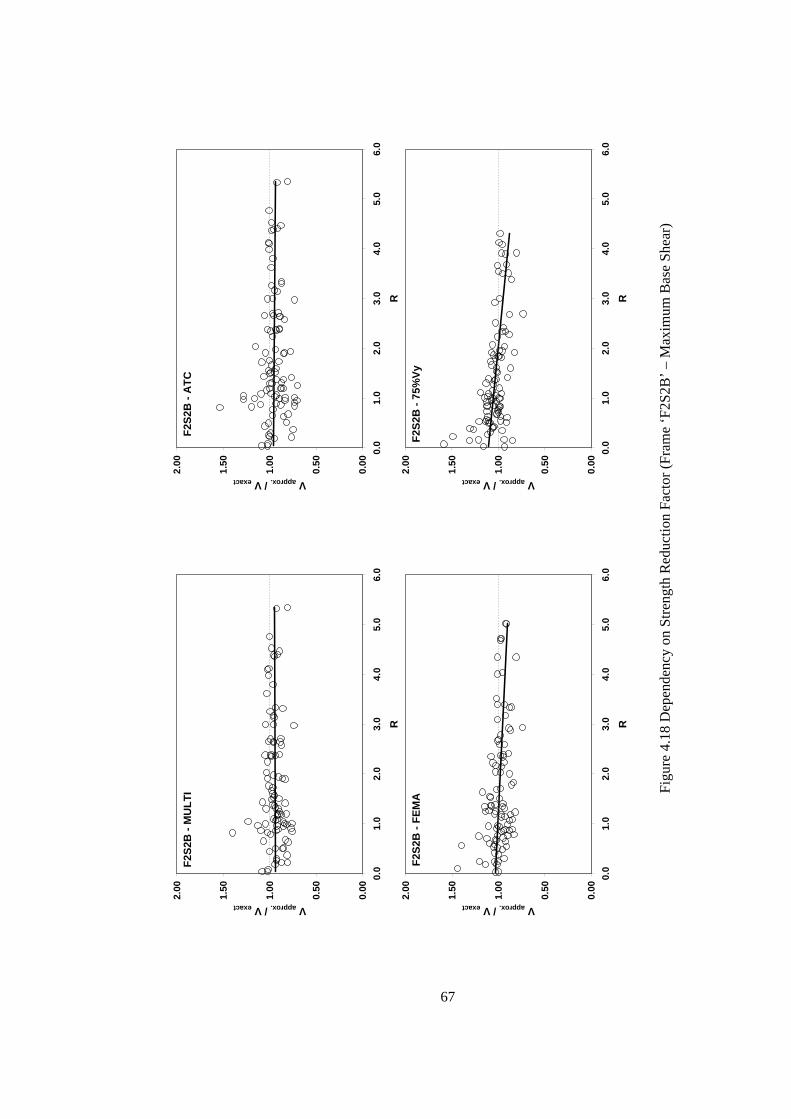
0.00
0.50
1.00
1.50
2.00
0.0
1.0
2.0
3.0
4.0
5.0
6.0
R
V approx. / V exact
F2S2
B -
MU
LTI
0.00
0.50
1.00
1.50
2.00
0.0
1.0
2.0
3.0 R
V approx. / V exact
F2S2
B -
ATC
4.0
5.0
6.0
0.00
0.50
0.0
1.0
2.0
3.0
4.0
5.0
6.0
R
V approx
1.00
1.50
2.00
. / V exact
F2S2
B -
FEM
A
0.00
0.50
0.0
1.0
2.0
3.0
4.0
5.0
6.0
RV approx
1.00
1.50
2.00
. / V exact
F2S2
B -
75%
Vy
Figu
re 4
.18
Dep
ende
ncy
on S
treng
th R
educ
tion
Fact
or (F
ram
e ‘F
2S2B
’ – M
axim
um B
ase
Shea
r)
67

It was observed in the trend graphs of maximum base shear force demand
predictions, as depicted in Figures 4.17-4.18 and Figures A.7.29-A.7.42, that no
systematic trend was present all over the cases. However, it could be said that for FEMA
and 75%Vy methods the ratios showed a general tendency to decrease with increasing
ductility and strength reduction factor levels.
4.3 SUMMARY OF COMPARISONS
The comparison of most widely employed demand parameters computed from
approximations employed with the exact results were presented in the previous sections.
These comparisons were made at different drift, ductility and strength reduction values to
investigate the accuracy of the approximations in the elastic as well as inelastic response
regions. The overall evaluations, as summarized in Tables 4.4-4.6, suggest no superiority
of one approach over the others. The behavior, in general, seemed to have a mild
dependency on the level of inelastic response.
Table 4.4 Error Statistics for Maximum Top Displacement Estimations
Mean σ Mean σ Mean σ Mean σF2S2B 0.942 0.115 0.926 0.179 1.005 0.157 1.117 0.173
F2S2B2 0.930 0.114 0.930 0.150 0.971 0.122 0.984 0.111F3S2B 0.939 0.125 0.946 0.169 0.982 0.154 1.005 0.138F5S2B 0.940 0.134 0.947 0.221 1.064 0.201 1.078 0.210F5S4B 0.928 0.096 0.907 0.161 1.005 0.112 1.014 0.110F5S7B 0.925 0.086 0.937 0.216 1.055 0.146 1.088 0.152F8S3B 0.922 0.102 0.897 0.155 1.021 0.139 1.029 0.135
75%VyFRAME MULTI ATC FEMA
Table 4.5 Error Statistics for Maximum Inter-Story Drift Ratio Estimations
Mean σ Mean σ Mean σ Mean σF2S2B 0.904 0.121 0.891 0.172 0.965 0.155 1.065 0.176
F2S2B2 0.941 0.110 0.941 0.142 0.981 0.115 0.994 0.104F3S2B 0.944 0.120 0.951 0.160 0.985 0.144 1.007 0.128F5S2B 0.903 0.151 0.913 0.246 1.033 0.223 1.049 0.232F5S4B 0.917 0.116 0.895 0.178 0.997 0.137 1.007 0.135F5S7B 0.901 0.117 0.922 0.258 1.037 0.185 1.071 0.181F8S3B 0.812 0.156 0.785 0.171 0.905 0.188 0.913 0.189
75%VyFRAME MULTI ATC FEMA
68
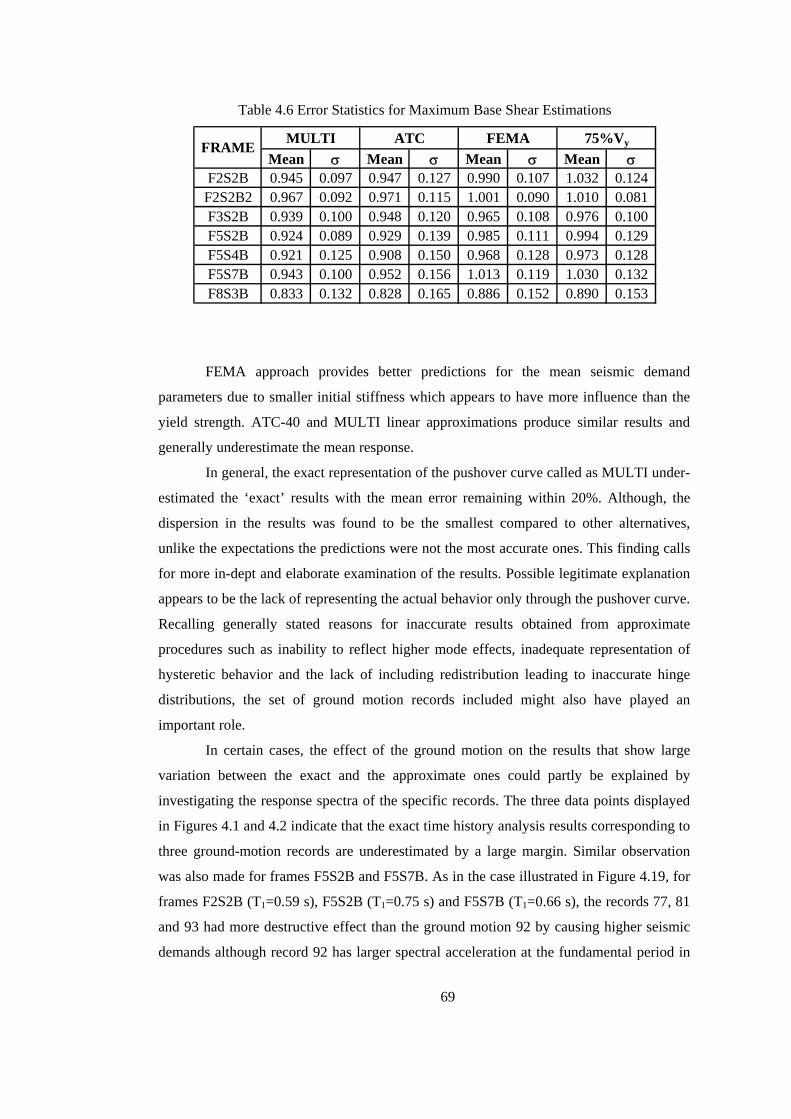
Table 4.6 Error Statistics for Maximum Base Shear Estimations
Mean σ Mean σ Mean σ Mean σF2S2B 0.945 0.097 0.947 0.127 0.990 0.107 1.032 0.124
F2S2B2 0.967 0.092 0.971 0.115 1.001 0.090 1.010 0.081F3S2B 0.939 0.100 0.948 0.120 0.965 0.108 0.976 0.100F5S2B 0.924 0.089 0.929 0.139 0.985 0.111 0.994 0.129F5S4B 0.921 0.125 0.908 0.150 0.968 0.128 0.973 0.128F5S7B 0.943 0.100 0.952 0.156 1.013 0.119 1.030 0.132F8S3B 0.833 0.132 0.828 0.165 0.886 0.152 0.890 0.153
FRAME MULTI ATC FEMA 75%Vy
FEMA approach provides better predictions for the mean seismic demand
parameters due to smaller initial stiffness which appears to have more influence than the
yield strength. ATC-40 and MULTI linear approximations produce similar results and
generally underestimate the mean response.
In general, the exact representation of the pushover curve called as MULTI under-
estimated the ‘exact’ results with the mean error remaining within 20%. Although, the
dispersion in the results was found to be the smallest compared to other alternatives,
unlike the expectations the predictions were not the most accurate ones. This finding calls
for more in-dept and elaborate examination of the results. Possible legitimate explanation
appears to be the lack of representing the actual behavior only through the pushover curve.
Recalling generally stated reasons for inaccurate results obtained from approximate
procedures such as inability to reflect higher mode effects, inadequate representation of
hysteretic behavior and the lack of including redistribution leading to inaccurate hinge
distributions, the set of ground motion records included might also have played an
important role.
In certain cases, the effect of the ground motion on the results that show large
variation between the exact and the approximate ones could partly be explained by
investigating the response spectra of the specific records. The three data points displayed
in Figures 4.1 and 4.2 indicate that the exact time history analysis results corresponding to
three ground-motion records are underestimated by a large margin. Similar observation
was also made for frames F5S2B and F5S7B. As in the case illustrated in Figure 4.19, for
frames F2S2B (T1=0.59 s), F5S2B (T1=0.75 s) and F5S7B (T1=0.66 s), the records 77, 81
and 93 had more destructive effect than the ground motion 92 by causing higher seismic
demands although record 92 has larger spectral acceleration at the fundamental period in
69

certain cases. This situation was believed to be related to the shape and area under the
response spectra. As the seismic excitation pushes the structure into the inelastic range,
the increase in the spectral ordinates corresponding to the elongated period of the structure
imposes large demands. According to Figure 4.19, as the period increases, the pseudo-
acceleration that this deformed system will be exposed also increases under the ground
motions 77, 81 and 93, which is not the case for record 92. This large demand can be
captured by the nonlinear time history analyses of the MDOF system. Equivalent SDOF
systems seem to be unable to reflect this. Consequently, higher seismic demands in terms
of roof displacement and critical inter-story drift ratio are attained by MDOF systems.
0
5
10
15
20
25
0.0 0.5 1.0 1.5
Period (s)
Pseu
do-A
ccel
erat
ion
(m/s
2 )
2.0
EQ 77EQ 81EQ 92EQ 93
0.59 0.750.66
Figure 4.19 Response Spectra for Ground Motions 77, 81, 92 and 93
Ignoring all these factors which are common to all methods of approximations
employed in this study, it is expected to obtain the most accurate results from MULTI that
describes the pushover curve the best. It appears that the idealization of the pushover
curve using MULTI reduces the dispersion significantly but does not improve prediction
of the mean demand values. So, bi-linearizing the capacity curve using a reasonable
approach such as FEMA would yield relatively good results. FEMA approach appears to
be a conservative approach with smaller dispersion than ATC method.
70
As it was expressed previously, the bi-linear approximation methods were also
compared with the results of MULTI method in order to evaluate the performance of the
methods at capturing the global behavior. The interpretations made over these
comparisons can be found in Appendix B. It has been observed that correlation between
the MULTI method and other procedures is quite high for all response parameters
investigated here. ATC method generally provides similar results with the MULTI
approach especially in the elastic range since both procedures use the same initial
stiffness. Although, errors with respect to MULTI method were in certain cases over 50%,
the predictions in the mean parameters were generally within 20 percent. These
comparisons verify that the simplified approaches employed provide reasonable results as
compared to the MULTI method which provides the most accurate representation of the
actual capacity curve.
71

CHAPTER 5
CONCLUSIONS AND RECOMMENDATIONS
5.1 SUMMARY
A comprehensive research has been undertaken to evaluate the influence of
several existing alternatives used for approximating capacity curves on seismic demands.
In order to achieve this goal, seven reinforced concrete frames were analyzed under nearly
100 ground motions utilizing OpenSees. Firstly, nonlinear time history analyses were
conducted to compute the ‘exact’ seismic demands in terms of maximum top
displacement, maximum inter-story drift ratio and maximum base shear under given
ground motions. After obtaining the seismic responses, nonlinear static analyses namely
pushover analyses were conducted to obtain the global behavior of each frame based on
‘elastic first mode’ lateral load pattern. The capacity curve of each frame was later
approximated using four alternative methods:
• In MULTI method, the capacity curve was approximated using many
linear segments to fully describe the curve.
• In ATC method, the curve was approximated using the initial stiffness
approach as ATC-40 recommends.
• In FEMA method, the pushover curve was idealized using the effective
secant stiffness approach by applying FEMA-356 propositions.
• In modified FEMA method (75%Vy), the capacity curves was idealized
again using an effective secant stiffness approach but this time the
recommendations of Paulay and Priestley [17] were followed in
conjunction with equal energy rule.
72
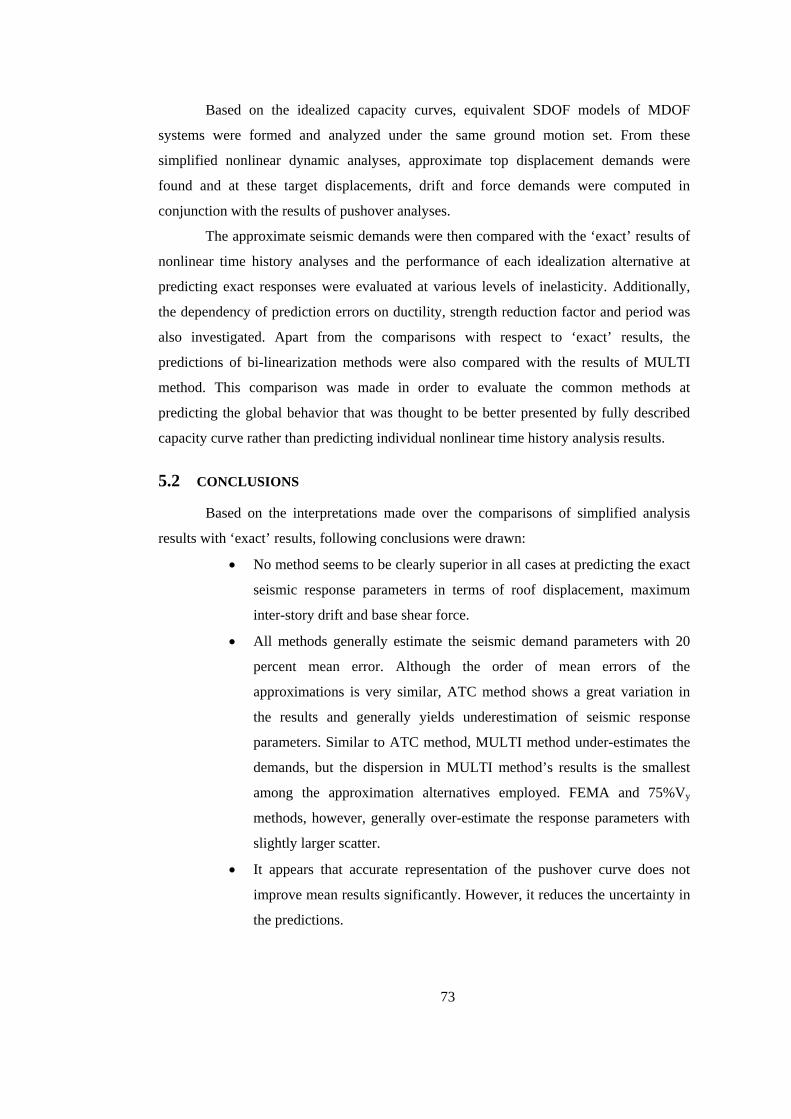
Based on the idealized capacity curves, equivalent SDOF models of MDOF
systems were formed and analyzed under the same ground motion set. From these
simplified nonlinear dynamic analyses, approximate top displacement demands were
found and at these target displacements, drift and force demands were computed in
conjunction with the results of pushover analyses.
The approximate seismic demands were then compared with the ‘exact’ results of
nonlinear time history analyses and the performance of each idealization alternative at
predicting exact responses were evaluated at various levels of inelasticity. Additionally,
the dependency of prediction errors on ductility, strength reduction factor and period was
also investigated. Apart from the comparisons with respect to ‘exact’ results, the
predictions of bi-linearization methods were also compared with the results of MULTI
method. This comparison was made in order to evaluate the common methods at
predicting the global behavior that was thought to be better presented by fully described
capacity curve rather than predicting individual nonlinear time history analysis results.
5.2 CONCLUSIONS
Based on the interpretations made over the comparisons of simplified analysis
results with ‘exact’ results, following conclusions were drawn:
• No method seems to be clearly superior in all cases at predicting the exact
seismic response parameters in terms of roof displacement, maximum
inter-story drift and base shear force.
• All methods generally estimate the seismic demand parameters with 20
percent mean error. Although the order of mean errors of the
approximations is very similar, ATC method shows a great variation in
the results and generally yields underestimation of seismic response
parameters. Similar to ATC method, MULTI method under-estimates the
demands, but the dispersion in MULTI method’s results is the smallest
among the approximation alternatives employed. FEMA and 75%Vy
methods, however, generally over-estimate the response parameters with
slightly larger scatter.
• It appears that accurate representation of the pushover curve does not
improve mean results significantly. However, it reduces the uncertainty in
the predictions.
73

• It seems that other factors such as hysteretic behavior (loading-unloading
model), ground motion characteristics and frame properties play more
important role than the accurate representation of the capacity curve.
• The maximum top displacement prediction performance of approximation
alternatives does not seem to depend on period. In contrast, for the global
force demand predictions, all methods tend to under-estimate the exact
demand with increasing period. Moreover, MULTI and ATC methods’
under-estimation of maximum inter-story drift demands also decrease
with increasing period.
• The behavior, in general, seems to be not significantly depending on the
degree of inelastic response. That is, no general trend in the prediction
errors is observed with an increase in both ductility level and strength
reduction factor.
• For frames whose idealized capacity curves do not differ very much from
each other, the yield definitions for displacement and strength would also
not be so different from each other. However, for frames that do have
parabolic capacity curves with unclear yield point, the approximations
would yield very contrasting yield definitions.
• Although MULTI seems to provide relatively better results, due to
difficulty of its representation simpler models such as FEMA and ATC
are recommended.
• Among the simpler idealization methods, FEMA approach appears to be a
conservative approach with smaller dispersion than ATC method, thus it
would be better to use FEMA method in order to estimate the seismic
demand parameters in terms of top displacement, maximum inter-story
drift and base shear force.
In addition to the evaluation of the approximation alternatives at predicting the
exact results, ATC, FEMA and 75%Vy methods were also evaluated at estimating the
response parameters with respect to global behavior that was represented by MULTI
method. ATC method seems to be definitely exceptional in all cases by correlating very
well with MULTI method results. FEMA and 75%Vy methods generally over-estimate the
displacement and drift demands and the degree of over-estimation seems to decrease with
increasing period, ductility and strength reduction factor. However, the mean errors
74

remain in reasonable limits supporting the idea that bi-linear models can be used in
simplified analyses instead of the complex model formed by multi-linear segments.
5.3 FUTURE STUDY RECOMMENDATIONS
Seven reinforced concrete frames, which do not have strength degradation in their
nonlinear static response, were analyzed in this study. Although the fundamental period of
vibration distribution was almost uniform, the study should be broadened with a larger
frame database of having various fundamental periods and global behavior characteristics.
Degrading models might also be included in an extended study to evaluate the effects of
idealized pushover curves on these building types.
Although 100 ground motions were employed in this study to push the structures
into various degrees of inelasticity, the equality of number of results at each ductility level
could not have been satisfied, i.e. the inelasticity was not evenly distributed under given
ground motion set. Thus, in order to have a better statistical distribution, larger ground
motion database may be utilized or present earthquakes may be scaled to generate new
ones.
An assumption was made when idealizing the capacity curves that the maximum
displacement was always assumed to be at 2.5% global drift of the building and the last
point of the idealized curve was defined accordingly. In the future studies, either the effect
of this assumption should be identified or this assumption might be disregarded by
updating the trial performance point at each step which would increase computational
steps.
In the nonlinear dynamic analyses of equivalent SDOF systems, non-degrading
SDOF systems with kinematic hardening type were used. The studies should be extended
to include also the degrading models.
Apart from equivalent SDOF analyses on the approximated capacity models,
seismic response calculations using Capacity Spectrum Method and Displacement
Coefficient Method might be also studied in order to investigate and include the effects of
further approximations that are present in approximate procedures.
75

REFERENCES
[1] Ang A.H-S. and Tang W.H., 1975, Probability Concepts in Engineering Planning
and Design, Volume I Basic Principles, John Wiley & Sons.
[2] Applied Technology Council, ATC-19, 1995, Structural Response Modification
Factors, Redwood City, California.
[3] Applied Technology Council, ATC-40, 1996, Seismic Evaluation and Retrofit of
Concrete Buildings, Volume 1-2, Redwood City, California.
[4] Applied Technology Council, 2004, FEMA-440 Improvement of Nonlinear Static
Seismic Analysis Procedures, ATC-55 Project Report, prepared by the Applied
Technology Council for the Federal Emergency Management Agency, Washington,
DC.
[5] Computers and Structures Inc. (CSI), 1998, SAP2000 Three Dimensional Static and
Dynamic Finite Element Analysis and Design of Structures V7.40N, Berkeley,
California.
[6] Deniz A., 2006, Estimation of Earthquake Insurance Premium Rates Based on
Stochastic Methods, MSc Thesis, Middle East Technical University, Ankara,
Turkey.
[7] Erberik M.A. and Cullu S., 2006, Assessment of Seismic Fragility Curves for Low-
and Mid-Rise Reinforced Concrete Frame Buildings Using Düzce Field Database,
Proceedings of the NATO Science for Peace Workshop on Advances in Earthquake
Engineering for Urban Risk Reduction, May 30-June 1, 2005, Istanbul, Turkey,
NATO Science Series, IV. Earth and Environmental Sciences - Vol. 66, 151-166.
76

[8] Federal Emergency Management Agency (FEMA), 1997, NEHRP Guidelines for
the Seismic Rehabilitation of Buildings, FEMA-273, Washington, DC.
[9] Federal Emergency Management Agency (FEMA), 1997, NEHRP Commentary on
the Guidelines for the Seismic Rehabilitation of Buildings, FEMA-274,
Washington, DC.
[10] Federal Emergency Management Agency (FEMA), 2000, Prestandard and
Commentary for the Rehabilitation of Buildings, FEMA-356, Washington, DC.
[11] International Conference on Building Officials (ICBO), 1982, Uniform Building
Code, Whittier, CA.
[12] Karsan I. D. and Jirsa J.O., 1969, Behavior of Concrete under Compressive
Loadings, Journal the Structural Division, American Society of Civil Engineers,
New York, Vol. 95, 2543-2563.
[13] Kent D.C. and Park R., 1971, Flexural Members with Confined Concrete, Journal
the Structural Division, American Society of Civil Engineers, New York, Vol. 97,
ST7.
[14] Nonlinear Dynamic Time History Analysis of Single Degree of Freedom Systems
(NONLIN), developed by Dr. Finley A. Charney, Advanced Structural Concepts,
Golden, Colorado and Schnabel Engineering, Denver, Colorado.
[15] OpenSees Development Team, 2006, OpenSees: Open System for Earthquake
Engineering Simulation Manual, OpenSees version: 1.7.0, Pacific Earthquake
Engineering Research Center, University of California, Berkeley, California.
[16] Park R., 1988, State-of-the Art Report – Ductility Evaluation From Laboratory and
Analytical Testing, Proceedings of Ninth World Conference on Earthquake
Engineering, August 2-9, 1988, Tokyo-Kyoto, Japan, Vol. VIII, 605-616.
77

[17] Paulay T. and Priestley M.J.N., 1992, Seismic Design of Reinforced Concrete and
Masonry Buildings, John Wiley & Sons, Inc.
[18] Priestley M.J.N. and Park R., 1987, Strength and Ductility of Concrete Bridge
Columns under Seismic Loading, ACI Structural Journal, January-February 1987,
61-76.
[19] Scott B. D., Park R. and Priestley M.J.N., 1982, Stress-Strain Behavior of Concrete
Confined by Overlapping Hoops at Low and High Strain Rates, ACI Structural
Journal, Vol. 79, 13-27.
[20] Sullivan T.J., Calvi G.M. and Priestley M.J.N., 2004, Initial Stiffness versus Secant
Stiffness in Displacement Based Design, Proceedings of the 13th World Conference
on Earthquake Engineering, August 1-6, 2004, Vancouver, B.C., Canada, Paper
No. 2888.
[21] Taucer F.F., Enrico S. and Filippou F.C., 1991, A Fiber Beam-Column Element for
Seismic Response Analysis of Reinforced Concrete Structures, Report No.
UCB/EERC-91/17, Earthquake Engineering Research Center, College of
Engineering, University of California, Berkeley.
78

APPENDIX A
FRAME DATA, RESULTS AND COMPARISON OF ANALYSES
A.1 DESCRIPTION OF SELECTED FRAMES
A.1.1 F2S2B
C1 C1 C1
C1 C1 C1
7.3152 m 7.3152 m
B2 B2
B1 B1
3.96
24 m
3.96
24 m
Figure A.1.1 Frame F2S2B
h = 556 mmclear cover = 56 mm
b = 305 mmh = 508 mm
clear cover = 51 mm
BEAM B1 BEAM B2
b = 305 mm
b
h
1342 mm2 1342 mm2
3148 mm2 2503 mm2
79

b = 609.6 mm
h =
609.
6 m
m
clear cover = 61 mm
COLUMN C1
Area = 645.2 mm2
Section fc (MPa) εc0 fcu (MPa) εcuAll 26.000 0.002 0.001 0.0057
Section fcc (MPa) εc0c fcuc (MPa) εcucC1 34.153 0.0026 6.831 0.048B1 29.692 0.0023 5.938 0.017B2 29.670 0.0023 5.934 0.018
Section fy (MPa) fyw (MPa) Hardening Ratio E (MPa)
All 494.000 494.000 0.005 200000
Material Properties
Unconfined Concrete Properties
Confined Concrete Properties
Reinforcing Steel Properties
T1 (s)T2 (s)
Story12
Beam DL LLB1 24.71 1.95B2 19.23 0.98
Beam Loading (kN/m)
Mass (ton)177.701497.5535
Modal Properties0.5920.174
Story Masses
80
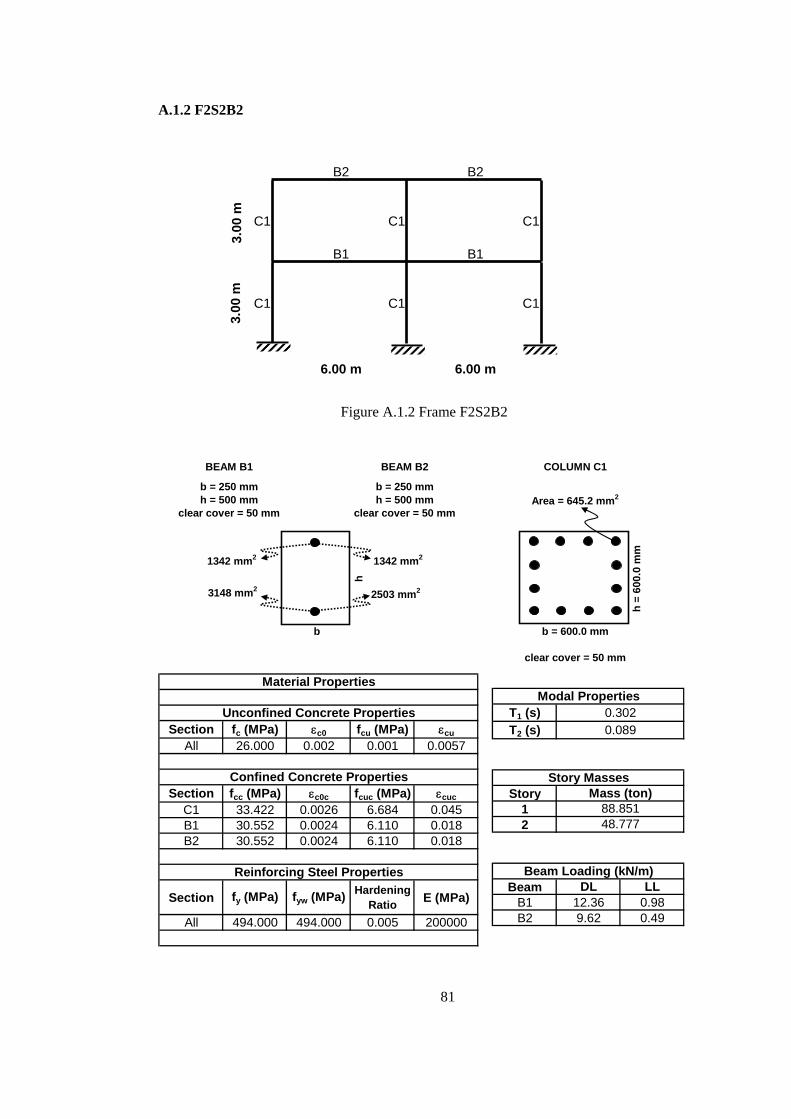
A.1.2 F2S2B2
C1 C1 C1
C1 C1 C1
6.00 m 6.00 m
B2 B2
B1 B13.
00 m
3.00
m
Figure A.1.2 Frame F2S2B2
BEAM B1 BEAM B2
b = 250 mm
b
h
h = 500 mmclear cover = 50 mm
b = 250 mmh = 500 mm
clear cover = 50 mm
1342 mm2 1342 mm2
3148 mm2 2503 mm2
COLUMN C1
b = 600.0 mmh
= 60
0.0
mm
clear cover = 50 mm
Area = 645.2 mm2
Section fc (MPa) εc0 fcu (MPa) εcuAll 26.000 0.002 0.001 0.0057
Section fcc (MPa) εc0c fcuc (MPa) εcucC1 33.422 0.0026 6.684 0.045B1 30.552 0.0024 6.110 0.018B2 30.552 0.0024 6.110 0.018
Section fy (MPa) fyw (MPa) Hardening Ratio E (MPa)
All 494.000 494.000 0.005 200000
Material Properties
Unconfined Concrete Properties
Confined Concrete Properties
Reinforcing Steel Properties
T1 (s)T2 (s)
Story12
Beam DL LLB1 12.36 0.98B2 9.62 0.49
Modal Properties0.3020.089
Story Masses
Beam Loading (kN/m)
Mass (ton)88.85148.777
81

A.1.3 F3S2B
C1 C1 C1
C1 C1 C1
C1 C1 C1
B2 B2
6.00 m 6.00 m
B1 B1
B1 B1
3.00
m3.
00 m
3.00
m
Figure A.1.3 Frame F3S2B
BEAM B2
b = 250 mm
b
h
h = 500 mmclear cover = 50 mm
b = 250 mmh = 500 mm
clear cover = 50 mm
BEAM B1
1342 mm2 1342 mm2
3148 mm2 2503 mm2
COLUMN C1
b = 700.0 mm
h =
700.
0 m
m
clear cover = 50 mm
Area = 645.2 mm2
82

Section fc (MPa) εc0 fcu (MPa) εcuAll 26.000 0.002 0.001 0.0057
Section fcc (MPa) εc0c fcuc (MPa) εcucC1 33.422 0.0026 6.684 0.045B1 30.552 0.0024 6.110 0.018B2 30.552 0.0024 6.110 0.018
Section fy (MPa) fyw (MPa) Hardening Ratio E (MPa)
All 494.000 494.000 0.005 200000
Material Properties
Unconfined Concrete Properties
Confined Concrete Properties
Reinforcing Steel Properties
T1 (s)T2 (s)T3 (s)
Story123
Beam DL LLB1 12.36 0.98B2 9.62 0.49
Beam Loading (kN/m)
Mass (ton)88.85188.85148.777
Modal Properties0.4500.118
Story Masses
0.058
83

A.1.4 F5S2B
C1 C1 C1
C1 C1 C1
C1 C1 C1
C1 C1 C1
C1 C1 C1
B1 B1
B1 B1
B1 B1
5.675 m 5.675 m
B1 B1
B1 B1
3.00
m3.
00 m
3.00
m3.
00 m
3.00
m
Figure A.1.4 Frame F5S2B
BEAM B1
b = 250 mm
b
h
h = 600 mmclear cover = 50 mm
2500 mm2
1650 mm2
COLUMN C1
b = 600.0 mm
h =
600.
0 m
m
clear cover = 50 mm
Area = 254 mm2
84

Section fc (MPa) εc0 fcu (MPa) εcuAll 20.000 0.002 0.001 0.0075
Section fcc (MPa) εc0c fcuc (MPa) εcucC1 26.692 0.0027 5.338 0.049B1 23.659 0.0024 4.732 0.019
Section fy (MPa) fyw (MPa) Hardening Ratio E (MPa)
All 420.000 420.000 0.005 200000
Material Properties
Unconfined Concrete Properties
Confined Concrete Properties
Reinforcing Steel Properties
T1 (s) 0.746 T4 (s) 0.094T2 (s) 0.221 T5 (s) 0.072T3 (s) 0.113
Story Mass (ton) Story Mass (ton)1 47.505 4 52.1772 52.177 5 56.1403 52.177
DL LL12.36 0.989.62 0.49
BeamB1
B1 - Top Floor
Modal Properties
Story Masses
Beam Loading (kN/m)
85
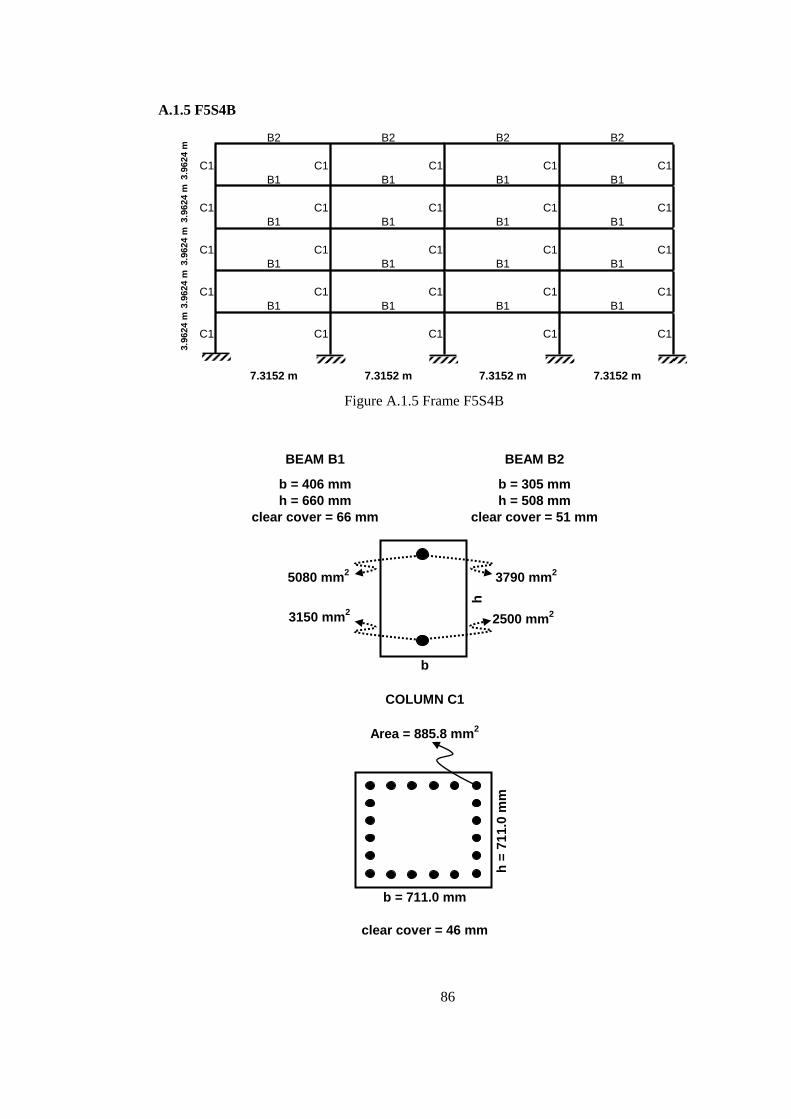
A.1.5 F5S4B
C1 C1 C1 C1 C1
C1 C1 C1 C1 C1
C1 C1 C1 C1 C1
C1 C1 C1 C1 C1
C1 C1 C1 C1 C1
7.3152 m 7.3152 m7.3152 m 7.3152 m
B2 B2
B1 B1
B1 B1
B1
B1
B1 B1
B1
B1
B2 B2
B1 B1
B1 B1
B1 B1
3.96
24 m
3.96
24 m
3.96
24 m
3.96
24 m
3.96
24 m
Figure A.1.5 Frame F5S4B
BEAM B1 BEAM B2
b = 406 mm b = 305 mmh = 660 mm h = 508 mm
clear cover = 66 mm clear cover = 51 mm
h
b
5080 mm2 3790 mm2
3150 mm2 2500 mm2
clear cover = 46 mm
b = 711.0 mm
COLUMN C1
h =
711.
0 m
m
Area = 885.8 mm2
86

Section fc (MPa) εc0 fcu (MPa) εcuAll 28.000 0.002 0.001 0.0054
Section fcc (MPa) εc0c fcuc (MPa) εcucC1 36.173 0.0026 7.235 0.058B1 31.997 0.0023 6.399 0.022B2 33.328 0.0024 6.666 0.024
Section fy (MPa) fyw (MPa) Hardening Ratio E (MPa)
All 459.000 459.000 0.005 200000
Material Properties
Unconfined Concrete Properties
Confined Concrete Properties
Reinforcing Steel Properties
T1 (s) 0.954 T4 (s) 0.138T2 (s) 0.298 T5 (s) 0.107T3 (s) 0.158
Story Mass (ton) Story Mass (ton)1 212.430 4 212.4302 212.430 5 157.4003 212.430
DL LL20.49 1.3115.64 0.53
BeamB1B2
Modal Properties
Story Masses
Beam Loading (kN/m)
87

A.1.6 F5S7B
C1 C3 C5 C7 C7 C5 C3 C1
C1 C3 C5 C7 C7 C5 C3 C1
C1 C3 C5 C7 C7 C5 C3 C1
C1 C3 C5 C7 C7 C5 C3 C1
C1 C2 C4 C6 C6 C4 C2 C1
4.20 m 2.60 m4.20 m 3.50 m
B1 B1
B2 B2
B1 B1
B2 B2
B1 B1
B1
B1 B1
B1
B1 B1 B1
B1 B1
B1
B2 B2 B2
B1 B1 B1
B1 B1 B1
B1 B1 B1
B1 B1 B1
4.20 m 3.50 m 4.20 m
2.80
m2.
80 m
2.80
m2.
80 m
2.80
m
Figure A.1.6 Frame F5S7B
BEAM B1
b = 200 mm
BEAM B2
clear cover = 50 mm
h
b
b = 200 mmh = 600 mm h = 600 mm
clear cover = 50 mm
4000 mm2 2500 mm2
2500 mm2 1500 mm2
clear cover = 50 mm
b = 250.0 mm
COLUMN C1 (25x70)
h =7
00.0
mm
Area = 1125 mm2
clear cover = 50 mm
b = 400.0 mm
COLUMN C2 (40x70)
h =7
00.0
mm
Area = 1330 mm2
88
clear cover = 50 mm
b = 300.0 mm
COLUMN C3 (30x70)
h =7
00.0
mm
Area = 1370 mm2
clear cover = 50 mm
b = 400.0 mm
COLUMN C4 (40x60)
h =6
00.0
mm
Area = 1330 mm2
clear cover = 50 mm
b = 250.0 mm
COLUMN C5 (25x70)
h =6
00.0
mm
Area = 1330 mm2
clear cover = 50 mm
b = 700.0 mm
COLUMN C6 (70x40)
h =4
00.0
mm
Area = 2370 mm2
clear cover = 50 mm
b = 700.0 mm
COLUMN C7 (70x30)
h =3
00.0
mm
Area = 2370 mm2
89
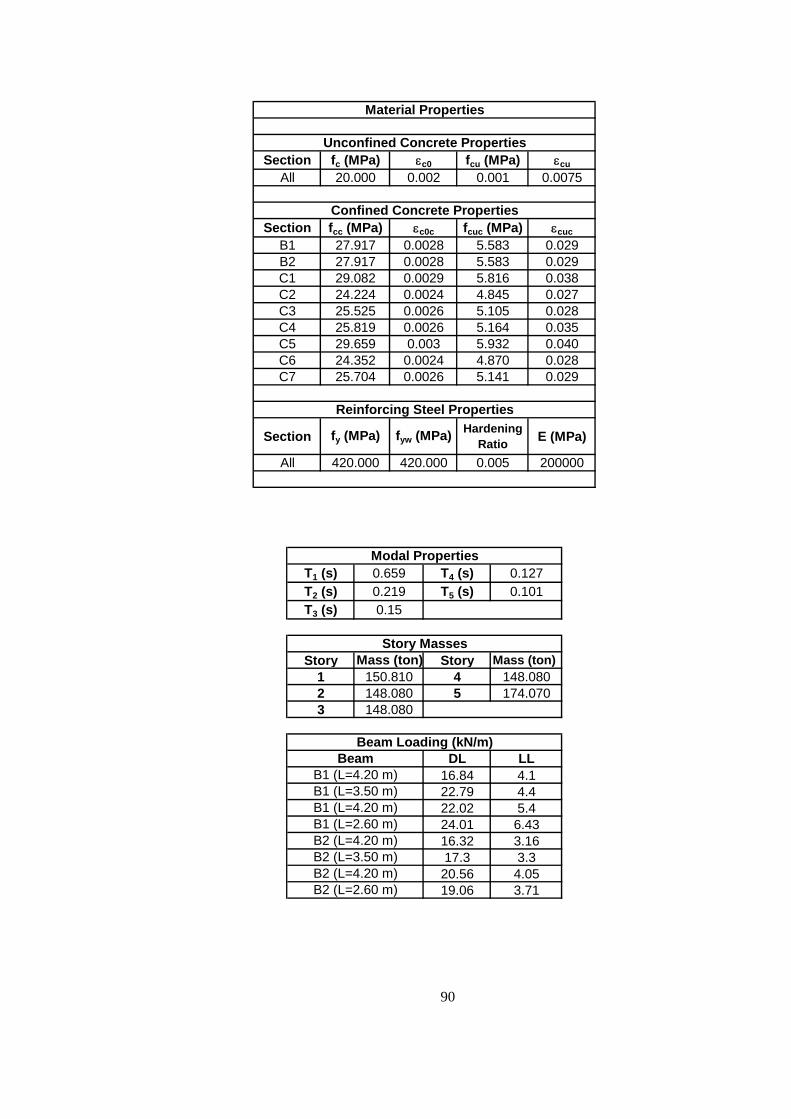
Section fc (MPa) εc0 fcu (MPa) εcuAll 20.000 0.002 0.001 0.0075
Section fcc (MPa) εc0c fcuc (MPa) εcucB1 27.917 0.0028 5.583 0.029B2 27.917 0.0028 5.583 0.029C1 29.082 0.0029 5.816 0.038C2 24.224 0.0024 4.845 0.027C3 25.525 0.0026 5.105 0.028C4 25.819 0.0026 5.164 0.035C5 29.659 0.003 5.932 0.040C6 24.352 0.0024 4.870 0.028C7 25.704 0.0026 5.141 0.029
Section fy (MPa) fyw (MPa) Hardening Ratio E (MPa)
All 420.000 420.000 0.005 200000
Material Properties
Unconfined Concrete Properties
Confined Concrete Properties
Reinforcing Steel Properties
T1 (s) 0.659 T4 (s) 0.127T2 (s) 0.219 T5 (s) 0.101T3 (s) 0.15
Story Mass (ton) Story Mass (ton)1 150.810 4 148.0802 148.080 5 174.0703 148.080
DL LL16.84 4.122.79 4.422.02 5.424.01 6.4316.32 3.1617.3 3.320.56 4.0519.06 3.71
B2 (L=4.20 m)B2 (L=2.60 m)
B1 (L=4.20 m)B1 (L=2.60 m)B2 (L=4.20 m)B2 (L=3.50 m)
BeamB1 (L=4.20 m)B1 (L=3.50 m)
Modal Properties
Story Masses
Beam Loading (kN/m)
90

A.1.7 F8S3B
C3 C3 C3 C3
C3 C3 C3 C3
C2 C2 C2 C2
C2 C2 C2 C2
C2 C2 C2 C2
C1 C1 C1 C1
C1 C1 C1 C1
C1 C1 C1 C1
B3
B1
B2
B2
B2
7.3152 m
B1
B1
B1
B3 B3
7.3152 m 7.3152 m
B1
B1
B1
B1
B2 B2
B2
B2
B1
B1
B2
B2
B1
B1
3.96
24
m3.
9624
m
3.96
24
m3.
9624
m
3.96
24
m3.
9624
m
3.96
24
m3.
9624
m
Figure A.1.7 Frame F8S3B
b = 500 mmh = 900 mm
BEAM B1
clear cover = 50 mm
b
h
5400 mm2
4800 mm2
h
b
b = 300 mmh = 750 mm h = 600 mm
clear cover = 50 mm clear cover = 50 mm
BEAM B3BEAM B2
b = 400 mm
4500 mm2 1800 mm2
3600 mm2 1125 mm2
91
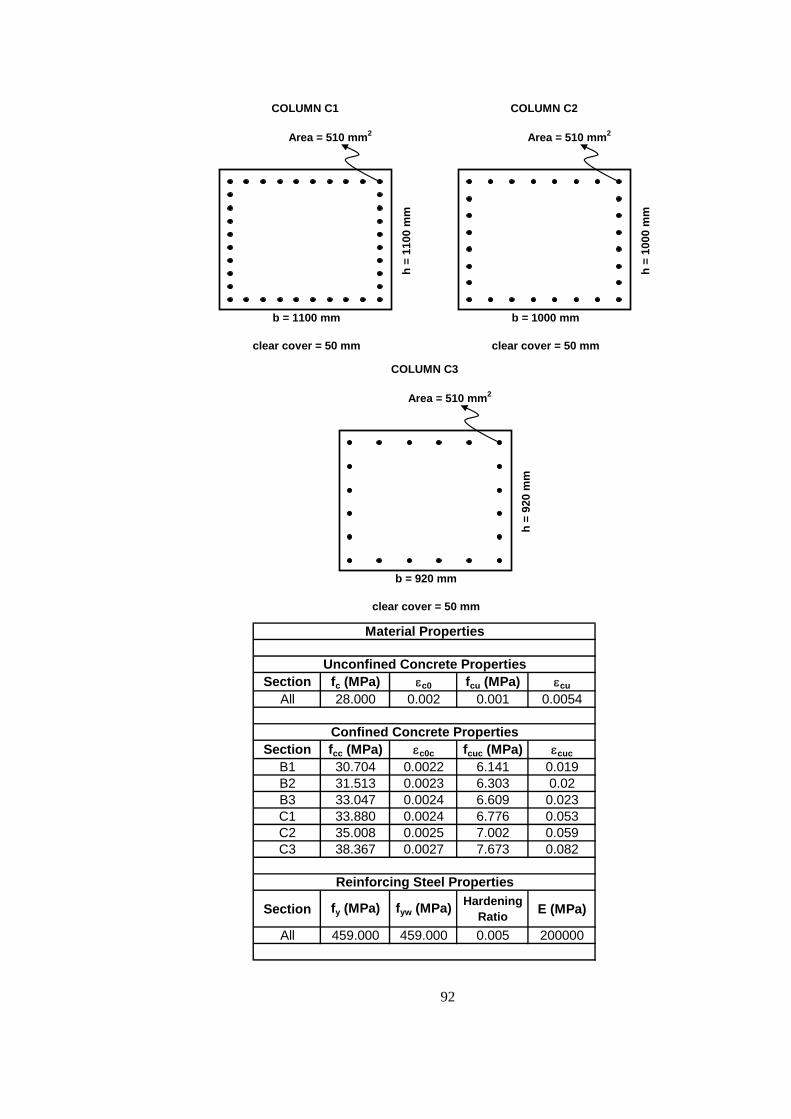
b = 1100 mm
h =
1100
mm
clear cover = 50 mm
COLUMN C1
Area = 510 mm2
clear cover = 50 mm
COLUMN C2
h =
1000
mm
b = 1000 mm
Area = 510 mm2
clear cover = 50 mm
COLUMN C3
h =
920
mm
b = 920 mm
Area = 510 mm2
Section fc (MPa) εc0 fcu (MPa) εcuAll 28.000 0.002 0.001 0.0054
Section fcc (MPa) εc0c fcuc (MPa) εcucB1 30.704 0.0022 6.141 0.019B2 31.513 0.0023 6.303 0.02B3 33.047 0.0024 6.609 0.023C1 33.880 0.0024 6.776 0.053C2 35.008 0.0025 7.002 0.059C3 38.367 0.0027 7.673 0.082
Section fy (MPa) fyw (MPa) Hardening Ratio E (MPa)
All 459.000 459.000 0.005 200000
Material Properties
Unconfined Concrete Properties
Confined Concrete Properties
Reinforcing Steel Properties
92

T1 (s) 1.203 T5 (s) 0.262T2 (s) 0.481 T6 (s) 0.252T3 (s) 0.414 T7 (s) 0.218T4 (s) 0.281 T8 (s) 0.2
Story Mass (ton) Story Mass (ton)1 230.450 5 230.4502 230.450 6 230.4503 230.450 7 230.4504 230.450 8 202.920
DL LL18.64 1.2118.64 1.2114.55 0.49
BeamB1B2
Modal Properties
Story Masses
Beam Loading (kN/m)
B3
93
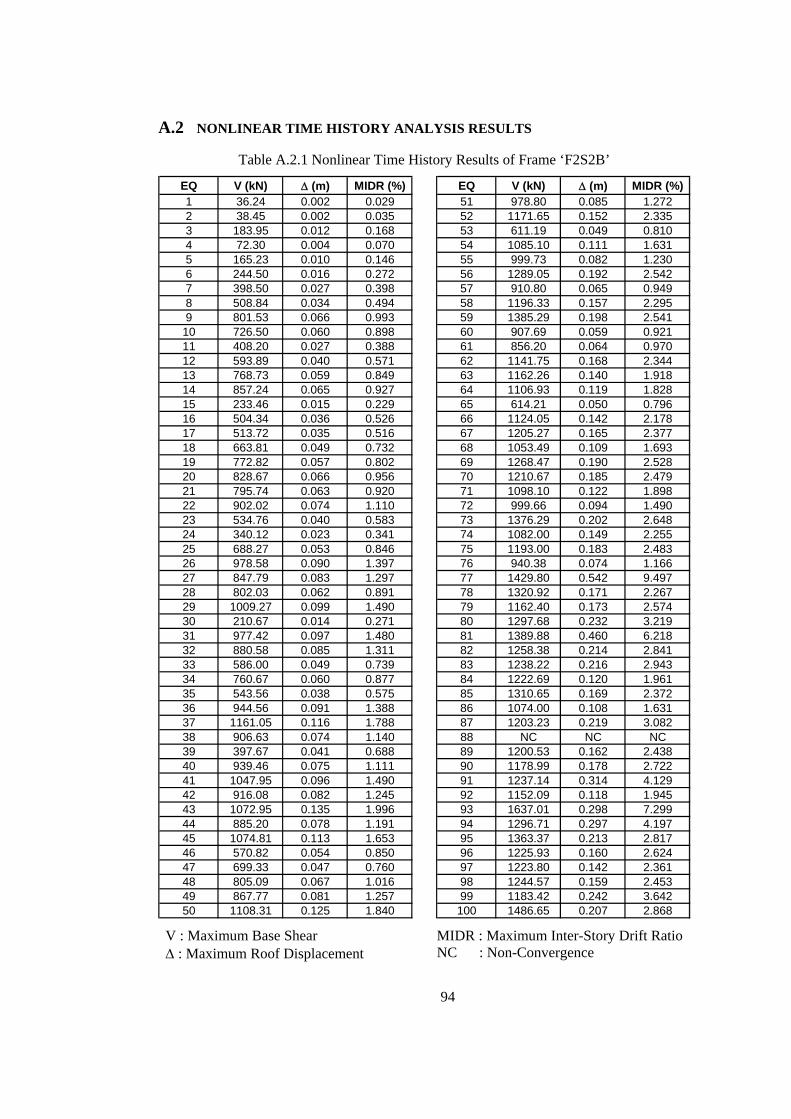
A.2 NONLINEAR TIME HISTORY ANALYSIS RESULTS
Table A.2.1 Nonlinear Time History Results of Frame ‘F2S2B’
EQ V (kN) Δ (m) MIDR (%) EQ V (kN) Δ (m) MIDR (%)1 36.24 0.002 0.029 51 978.80 0.085 1.2722 38.45 0.002 0.035 52 1171.65 0.152 2.3353 183.95 0.012 0.168 53 611.19 0.049 0.8104 72.30 0.004 0.070 54 1085.10 0.111 1.6315 165.23 0.010 0.146 55 999.73 0.082 1.2306 244.50 0.016 0.272 56 1289.05 0.192 2.5427 398.50 0.027 0.398 57 910.80 0.065 0.9498 508.84 0.034 0.494 58 1196.33 0.157 2.2959 801.53 0.066 0.993 59 1385.29 0.198 2.54110 726.50 0.060 0.898 60 907.69 0.059 0.92111 408.20 0.027 0.388 61 856.20 0.064 0.97012 593.89 0.040 0.571 62 1141.75 0.168 2.34413 768.73 0.059 0.849 63 1162.26 0.140 1.91814 857.24 0.065 0.927 64 1106.93 0.119 1.82815 233.46 0.015 0.229 65 614.21 0.050 0.79616 504.34 0.036 0.526 66 1124.05 0.142 2.17817 513.72 0.035 0.516 67 1205.27 0.165 2.37718 663.81 0.049 0.732 68 1053.49 0.109 1.69319 772.82 0.057 0.802 69 1268.47 0.190 2.52820 828.67 0.066 0.956 70 1210.67 0.185 2.47921 795.74 0.063 0.920 71 1098.10 0.122 1.89822 902.02 0.074 1.110 72 999.66 0.094 1.49023 534.76 0.040 0.583 73 1376.29 0.202 2.64824 340.12 0.023 0.341 74 1082.00 0.149 2.25525 688.27 0.053 0.846 75 1193.00 0.183 2.48326 978.58 0.090 1.397 76 940.38 0.074 1.16627 847.79 0.083 1.297 77 1429.80 0.542 9.49728 802.03 0.062 0.891 78 1320.92 0.171 2.26729 1009.27 0.099 1.490 79 1162.40 0.173 2.57430 210.67 0.014 0.271 80 1297.68 0.232 3.21931 977.42 0.097 1.480 81 1389.88 0.460 6.21832 880.58 0.085 1.311 82 1258.38 0.214 2.84133 586.00 0.049 0.739 83 1238.22 0.216 2.94334 760.67 0.060 0.877 84 1222.69 0.120 1.96135 543.56 0.038 0.575 85 1310.65 0.169 2.37236 944.56 0.091 1.388 86 1074.00 0.108 1.63137 1161.05 0.116 1.788 87 1203.23 0.219 3.08238 906.63 0.074 1.140 88 NC NC NC39 397.67 0.041 0.688 89 1200.53 0.162 2.43840 939.46 0.075 1.111 90 1178.99 0.178 2.72241 1047.95 0.096 1.490 91 1237.14 0.314 4.12942 916.08 0.082 1.245 92 1152.09 0.118 1.94543 1072.95 0.135 1.996 93 1637.01 0.298 7.29944 885.20 0.078 1.191 94 1296.71 0.297 4.19745 1074.81 0.113 1.653 95 1363.37 0.213 2.81746 570.82 0.054 0.850 96 1225.93 0.160 2.62447 699.33 0.047 0.760 97 1223.80 0.142 2.36148 805.09 0.067 1.016 98 1244.57 0.159 2.45349 867.77 0.081 1.257 99 1183.42 0.242 3.64250 1108.31 0.125 1.840 100 1486.65 0.207 2.868
V : Maximum Base Shear MIDR : Maximum Inter-Story Drift Ratio Δ : Maximum Roof Displacement NC : Non-Convergence
94
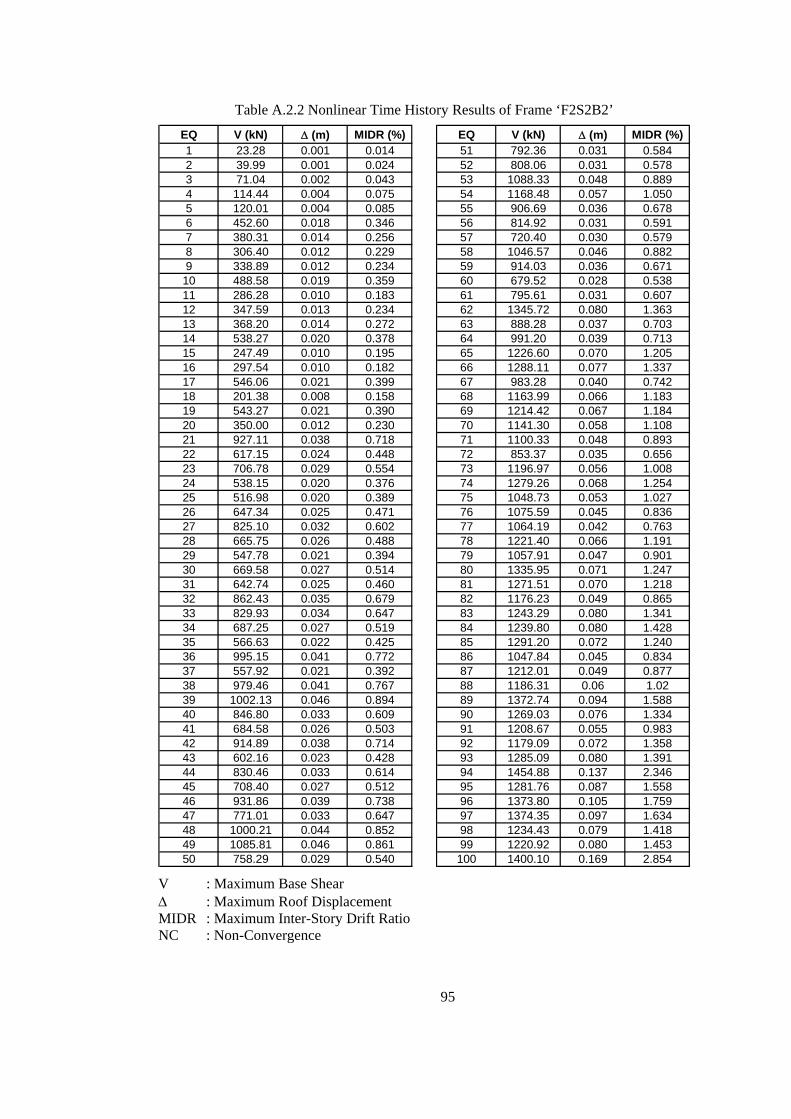
Table A.2.2 Nonlinear Time History Results of Frame ‘F2S2B2’
EQ V (kN) Δ (m) MIDR (%) EQ V (kN) Δ (m) MIDR (%)1 23.28 0.001 0.014 51 792.36 0.031 0.5842 39.99 0.001 0.024 52 808.06 0.031 0.5783 71.04 0.002 0.043 53 1088.33 0.048 0.8894 114.44 0.004 0.075 54 1168.48 0.057 1.0505 120.01 0.004 0.085 55 906.69 0.036 0.6786 452.60 0.018 0.346 56 814.92 0.031 0.5917 380.31 0.014 0.256 57 720.40 0.030 0.5798 306.40 0.012 0.229 58 1046.57 0.046 0.8829 338.89 0.012 0.234 59 914.03 0.036 0.67110 488.58 0.019 0.359 60 679.52 0.028 0.53811 286.28 0.010 0.183 61 795.61 0.031 0.60712 347.59 0.013 0.234 62 1345.72 0.080 1.36313 368.20 0.014 0.272 63 888.28 0.037 0.70314 538.27 0.020 0.378 64 991.20 0.039 0.71315 247.49 0.010 0.195 65 1226.60 0.070 1.20516 297.54 0.010 0.182 66 1288.11 0.077 1.33717 546.06 0.021 0.399 67 983.28 0.040 0.74218 201.38 0.008 0.158 68 1163.99 0.066 1.18319 543.27 0.021 0.390 69 1214.42 0.067 1.18420 350.00 0.012 0.230 70 1141.30 0.058 1.10821 927.11 0.038 0.718 71 1100.33 0.048 0.89322 617.15 0.024 0.448 72 853.37 0.035 0.65623 706.78 0.029 0.554 73 1196.97 0.056 1.00824 538.15 0.020 0.376 74 1279.26 0.068 1.25425 516.98 0.020 0.389 75 1048.73 0.053 1.02726 647.34 0.025 0.471 76 1075.59 0.045 0.83627 825.10 0.032 0.602 77 1064.19 0.042 0.76328 665.75 0.026 0.488 78 1221.40 0.066 1.19129 547.78 0.021 0.394 79 1057.91 0.047 0.90130 669.58 0.027 0.514 80 1335.95 0.071 1.24731 642.74 0.025 0.460 81 1271.51 0.070 1.21832 862.43 0.035 0.679 82 1176.23 0.049 0.86533 829.93 0.034 0.647 83 1243.29 0.080 1.34134 687.25 0.027 0.519 84 1239.80 0.080 1.42835 566.63 0.022 0.425 85 1291.20 0.072 1.24036 995.15 0.041 0.772 86 1047.84 0.045 0.83437 557.92 0.021 0.392 87 1212.01 0.049 0.87738 979.46 0.041 0.767 88 1186.31 0.06 1.0239 1002.13 0.046 0.894 89 1372.74 0.094 1.58840 846.80 0.033 0.609 90 1269.03 0.076 1.33441 684.58 0.026 0.503 91 1208.67 0.055 0.98342 914.89 0.038 0.714 92 1179.09 0.072 1.35843 602.16 0.023 0.428 93 1285.09 0.080 1.39144 830.46 0.033 0.614 94 1454.88 0.137 2.34645 708.40 0.027 0.512 95 1281.76 0.087 1.55846 931.86 0.039 0.738 96 1373.80 0.105 1.75947 771.01 0.033 0.647 97 1374.35 0.097 1.63448 1000.21 0.044 0.852 98 1234.43 0.079 1.41849 1085.81 0.046 0.861 99 1220.92 0.080 1.45350 758.29 0.029 0.540 100 1400.10 0.169 2.854
V : Maximum Base Shear Δ : Maximum Roof Displacement MIDR : Maximum Inter-Story Drift Ratio NC : Non-Convergence
95

Table A.2.3 Nonlinear Time History Results of Frame ‘F3S2B’
EQ V (kN) Δ (m) MIDR (%) EQ V (kN) Δ (m) MIDR (%)1 33.57 0.001 0.019 51 1066.37 0.077 1.0632 41.37 0.002 0.028 52 1296.88 0.121 1.5733 128.68 0.007 0.094 53 706.22 0.047 0.6564 100.95 0.005 0.069 54 1255.34 0.093 1.2455 105.41 0.006 0.084 55 1088.94 0.071 0.9776 281.78 0.016 0.214 56 1374.16 0.133 1.7037 404.58 0.022 0.303 57 871.47 0.059 0.8218 393.57 0.023 0.316 58 1275.90 0.124 1.6169 538.20 0.032 0.436 59 1185.95 0.078 1.06810 465.75 0.028 0.392 60 745.42 0.046 0.63911 342.00 0.019 0.264 61 830.01 0.053 0.72412 423.34 0.023 0.324 62 1152.33 0.084 1.15313 546.95 0.033 0.452 63 1112.13 0.078 1.07314 801.82 0.049 0.685 64 1104.49 0.074 1.02715 249.34 0.013 0.185 65 916.18 0.082 1.13416 550.11 0.032 0.449 66 1327.33 0.145 1.82217 829.64 0.052 0.721 67 1273.86 0.109 1.43318 533.69 0.029 0.402 68 1244.78 0.111 1.45719 908.29 0.057 0.795 69 1313.11 0.109 1.42020 805.01 0.048 0.665 70 1351.56 0.101 1.33621 937.09 0.060 0.830 71 1140.45 0.088 1.20922 922.03 0.057 0.788 72 1107.46 0.072 0.99923 466.76 0.026 0.365 73 1262.43 0.121 1.58524 361.50 0.022 0.303 74 1264.80 0.140 1.80525 729.14 0.044 0.617 75 1398.44 0.135 1.72826 1124.82 0.085 1.161 76 972.87 0.071 0.98227 883.37 0.067 0.930 77 1231.08 0.078 1.06628 817.28 0.048 0.657 78 1389.46 0.146 1.86629 916.31 0.056 0.777 79 1321.13 0.137 1.76030 310.75 0.020 0.284 80 1570.40 0.232 2.84031 799.60 0.048 0.662 81 1464.85 0.164 2.07232 1061.71 0.075 1.032 82 1346.85 0.222 2.68833 784.75 0.057 0.798 83 1508.51 0.263 3.18534 786.47 0.045 0.629 84 1180.81 0.105 1.40835 805.69 0.047 0.651 85 1340.12 0.153 1.86936 910.45 0.069 0.955 86 1096.25 0.073 1.02337 1013.58 0.065 0.899 87 1424.82 0.163 2.06338 864.66 0.057 0.786 88 1410.11 0.19 2.4039 728.52 0.058 0.812 89 1396.07 0.176 2.21240 1179.88 0.083 1.138 90 1387.51 0.140 1.78541 1119.65 0.085 1.165 91 1458.20 0.199 2.45042 1128.94 0.093 1.260 92 1192.00 0.119 1.56143 1197.05 0.087 1.187 93 1495.66 0.146 1.83944 971.89 0.062 0.863 94 1603.11 0.352 4.19745 1011.82 0.068 0.940 95 1381.29 0.140 1.72146 931.66 0.065 0.903 96 1365.12 0.133 1.75447 817.86 0.053 0.733 97 1324.87 0.179 2.24848 1159.64 0.090 1.212 98 1380.60 0.181 2.28849 1069.47 0.080 1.104 99 1560.18 0.242 2.94750 1152.64 0.075 1.028 100 1489.12 0.312 3.839
V : Maximum Base Shear Δ : Maximum Roof Displacement MIDR : Maximum Inter-Story Drift Ratio NC : Non-Convergence
96

Table A.2.4 Nonlinear Time History Results of Frame ‘F5S2B’
EQ V (kN) Δ (m) MIDR (%) EQ V (kN) Δ (m) MIDR (%)1 25.55 0.002 0.016 51 810.07 0.154 1.5962 31.62 0.003 0.027 52 760.46 0.161 1.5483 155.26 0.015 0.132 53 461.82 0.061 0.5344 68.95 0.006 0.053 54 NC NC NC5 148.85 0.013 0.110 55 737.99 0.098 0.8506 134.66 0.012 0.115 56 739.85 0.267 5.4217 329.58 0.036 0.338 57 614.24 0.081 0.7228 453.08 0.056 0.500 58 778.59 0.162 1.6569 363.57 0.046 0.402 59 898.08 0.359 4.36310 248.65 0.033 0.288 60 751.56 0.099 0.94011 236.52 0.025 0.220 61 716.30 0.106 0.98612 442.45 0.055 0.491 62 750.88 0.153 1.48213 718.51 0.098 0.892 63 797.40 0.206 2.17114 791.81 0.115 1.139 64 826.49 0.146 1.49715 151.74 0.014 0.120 65 532.78 0.086 0.76116 343.69 0.042 0.383 66 770.08 0.152 1.47917 570.30 0.072 0.646 67 809.18 0.202 2.20118 324.73 0.037 0.324 68 746.24 0.131 1.26119 742.31 0.120 1.119 69 855.03 0.182 2.02420 855.11 0.150 1.608 70 862.53 0.252 2.79721 576.83 0.072 0.644 71 696.66 0.102 0.92022 743.13 0.093 0.869 72 796.02 0.111 1.07623 381.19 0.045 0.407 73 855.82 0.219 2.33624 218.81 0.023 0.204 74 796.32 0.140 1.37425 603.44 0.069 0.651 75 826.54 0.234 2.50026 770.24 0.116 1.122 76 810.26 0.119 1.21527 600.93 0.078 0.673 77 916.71 0.728 7.92328 782.93 0.122 1.215 78 883.35 0.176 2.04529 775.44 0.117 1.142 79 746.24 0.152 1.48830 152.59 0.018 0.153 80 783.94 0.336 3.34431 693.13 0.082 0.773 81 NC NC NC32 672.52 0.078 0.720 82 782.19 0.306 3.46633 337.24 0.046 0.416 83 767.52 0.229 2.35434 437.81 0.048 0.445 84 790.03 0.123 1.19035 662.69 0.093 0.818 85 865.94 0.221 2.42136 504.70 0.063 0.561 86 839.42 0.187 2.01037 776.66 0.161 1.765 87 850.02 0.289 2.41638 748.79 0.107 0.997 88 815.53 0.20 2.1039 360.44 0.032 0.359 89 902.91 0.241 3.03940 760.11 0.106 1.000 90 754.26 0.167 1.60541 734.19 0.140 1.289 91 815.41 0.342 3.63542 460.37 0.070 0.609 92 849.62 0.160 1.71843 790.87 0.143 1.443 93 883.28 0.301 3.45744 797.80 0.146 1.501 94 788.56 0.258 2.61545 802.79 0.127 1.291 95 879.95 0.253 2.68646 347.13 0.041 0.358 96 795.68 0.172 1.61147 675.01 0.086 0.792 97 811.34 0.121 1.15548 752.46 0.097 0.888 98 828.77 0.179 1.75649 715.92 0.120 1.103 99 840.77 0.200 2.20750 859.15 0.162 1.714 100 810.96 0.280 6.419
V : Maximum Base Shear Δ : Maximum Roof Displacement MIDR : Maximum Inter-Story Drift Ratio NC : Non-Convergence
97

Table A.2.5 Nonlinear Time History Results of Frame ‘F5S4B’
EQ V (kN) Δ (m) MIDR (%) EQ V (kN) Δ (m) MIDR (%)1 124.99 0.005 0.033 51 3373.82 0.211 1.5502 163.52 0.006 0.040 52 3116.47 0.182 1.2573 490.47 0.022 0.140 53 2022.99 0.088 0.5774 238.49 0.009 0.058 54 3320.32 0.237 1.7245 313.78 0.013 0.080 55 3110.88 0.158 1.0876 366.47 0.013 0.102 56 3579.28 0.258 1.9277 721.75 0.033 0.212 57 2784.09 0.149 1.0208 1381.58 0.066 0.443 58 3393.53 0.209 1.5289 1520.12 0.082 0.528 59 3943.35 0.430 3.21910 701.02 0.037 0.238 60 2301.41 0.123 0.79411 880.01 0.037 0.253 61 3053.80 0.147 1.00412 1797.30 0.085 0.581 62 3102.38 0.153 1.07113 2468.96 0.128 0.846 63 3309.03 0.280 1.96514 2868.41 0.153 1.051 64 3042.21 0.161 1.08515 698.00 0.030 0.203 65 2811.90 0.116 0.76816 1221.43 0.051 0.357 66 2863.79 0.175 1.22217 1897.86 0.098 0.654 67 3214.54 0.255 1.83718 771.17 0.039 0.257 68 3311.79 0.203 1.46519 2440.39 0.128 0.852 69 3740.70 0.271 1.91720 3591.12 0.233 1.737 70 3761.34 0.299 2.23021 2188.97 0.098 0.665 71 1787.35 0.099 0.66022 3031.96 0.162 1.146 72 3475.70 0.206 1.46923 1465.98 0.069 0.467 73 3717.68 0.246 1.87924 1172.14 0.049 0.343 74 3658.31 0.191 1.35625 1782.08 0.084 0.571 75 3048.15 0.263 1.82026 2861.24 0.143 0.986 76 3224.93 0.147 0.98327 2178.04 0.106 0.693 77 3844.41 0.513 3.65628 3415.26 0.195 1.373 78 3761.03 0.230 1.74829 2914.01 0.167 1.171 79 2397.90 0.188 1.31230 573.87 0.011 0.129 80 3595.29 0.389 2.66631 2740.49 0.142 0.979 81 3698.16 0.695 4.51632 2445.04 0.118 0.810 82 3459.33 0.329 2.30033 994.83 0.039 0.293 83 3242.10 0.241 1.75434 2410.92 0.117 0.793 84 2703.54 0.163 1.09835 1421.61 0.070 0.464 85 3512.86 0.291 2.04236 1825.58 0.097 0.638 86 3202.42 0.237 1.71137 3323.27 0.216 1.565 87 3601.51 0.263 1.94138 2887.27 0.159 1.102 88 3869.50 0.30 2.1939 1268.35 0.026 0.335 89 4144.83 0.286 2.16040 3139.68 0.171 1.198 90 3176.78 0.215 1.49641 2428.04 0.122 0.803 91 3578.07 0.393 2.70542 1062.48 0.059 0.398 92 3300.56 0.192 1.38243 2692.77 0.140 0.963 93 3544.77 0.315 2.17344 3223.66 0.245 1.713 94 3850.06 0.367 2.55845 3154.14 0.177 1.251 95 3893.19 0.372 2.71346 1272.90 0.041 0.297 96 3181.32 0.208 1.49347 2714.71 0.119 0.778 97 3742.09 0.189 1.31848 2978.48 0.125 0.900 98 3288.00 0.256 1.82949 2580.58 0.156 1.028 99 3466.58 0.238 1.72850 3253.42 0.181 1.357 100 3784.12 0.274 2.063
V : Maximum Base Shear Δ : Maximum Roof Displacement MIDR : Maximum Inter-Story Drift Ratio NC : Non-Convergence
98

Table A.2.6 Nonlinear Time History Results of Frame ‘F5S7B’
EQ V (kN) Δ (m) MIDR (%) EQ V (kN) Δ (m) MIDR (%)1 74.97 0.002 0.018 51 3026.34 0.120 1.2402 77.07 0.002 0.019 52 2876.44 0.159 1.6623 471.24 0.013 0.120 53 1458.64 0.051 0.4874 246.77 0.006 0.057 54 3183.84 0.122 1.2775 485.19 0.013 0.123 55 2502.27 0.079 0.8396 656.16 0.016 0.154 56 3092.60 0.229 2.4997 1082.10 0.034 0.316 57 2042.31 0.068 0.6728 1126.69 0.033 0.312 58 NC NC NC9 1615.76 0.056 0.516 59 3464.15 0.223 2.81910 1353.58 0.050 0.448 60 2301.03 0.083 0.81611 964.95 0.029 0.270 61 2431.65 0.069 0.67312 1385.46 0.043 0.406 62 3015.14 0.168 1.79513 2104.10 0.064 0.646 63 3473.29 0.211 4.55014 2420.96 0.076 0.761 64 2940.03 0.123 1.24415 537.99 0.015 0.142 65 1518.14 0.056 0.51716 1192.20 0.037 0.336 66 2930.41 0.130 1.32317 1481.60 0.037 0.371 67 3183.49 0.179 1.88818 1396.39 0.047 0.430 68 2850.93 0.121 1.17719 2565.55 0.089 0.894 69 3232.20 0.195 2.02620 2651.16 0.086 0.867 70 3320.10 0.207 2.30121 2135.21 0.073 0.700 71 2530.84 0.114 1.14022 2408.91 0.083 0.827 72 2468.70 0.089 0.85223 1239.58 0.041 0.378 73 NC NC NC24 832.63 0.024 0.228 74 2967.98 0.158 1.62725 1577.29 0.046 0.450 75 3203.62 0.205 4.70626 2896.31 0.110 1.109 76 2705.46 0.109 1.09627 2024.39 0.081 0.748 77 3283.98 0.370 5.38228 2289.41 0.069 0.694 78 2990.78 0.194 2.11929 2436.32 0.087 0.861 79 2951.29 0.187 2.05030 577.92 0.018 0.161 80 NC NC NC31 3008.16 0.115 1.215 81 NC NC NC32 2590.39 0.090 0.909 82 NC NC NC33 1375.45 0.049 0.448 83 3059.42 0.214 2.29734 1540.24 0.046 0.434 84 3183.53 0.111 1.12235 1831.68 0.062 0.591 85 3144.56 0.186 1.89136 2122.64 0.073 0.708 86 3121.22 0.139 1.78337 3138.30 0.128 1.372 87 NC NC NC38 2476.06 0.090 0.897 88 3300.04 0.20 2.2139 968.07 0.037 0.367 89 2902.63 0.200 2.77240 2459.76 0.087 0.862 90 3201.67 0.182 1.89241 2956.84 0.132 1.319 91 NC NC NC42 2019.85 0.079 0.749 92 3266.16 0.136 1.43143 3113.67 0.145 1.543 93 3381.59 0.284 3.36044 2694.91 0.100 1.026 94 NC NC NC45 3033.14 0.117 1.243 95 3278.57 0.190 2.10846 1077.52 0.046 0.403 96 3201.47 0.158 1.60047 1542.00 0.046 0.439 97 3049.22 0.138 1.43648 2215.75 0.071 0.674 98 3263.06 0.180 1.96949 2129.46 0.079 0.749 99 NC NC NC50 3051.84 0.152 1.622 100 3535.19 0.191 2.262
V : Maximum Base Shear Δ : Maximum Roof Displacement MIDR : Maximum Inter-Story Drift Ratio NC : Non-Convergence
99
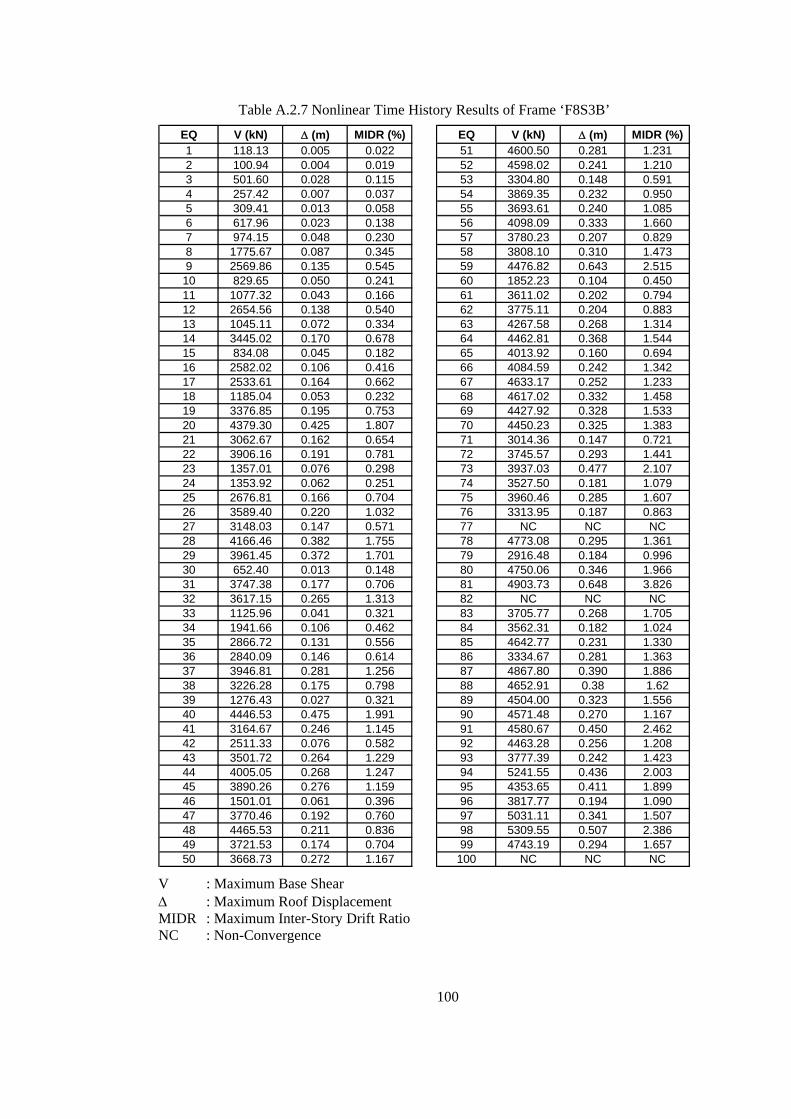
Table A.2.7 Nonlinear Time History Results of Frame ‘F8S3B’
EQ V (kN) Δ (m) MIDR (%) EQ V (kN) Δ (m) MIDR (%)1 118.13 0.005 0.022 51 4600.50 0.281 1.2312 100.94 0.004 0.019 52 4598.02 0.241 1.2103 501.60 0.028 0.115 53 3304.80 0.148 0.5914 257.42 0.007 0.037 54 3869.35 0.232 0.9505 309.41 0.013 0.058 55 3693.61 0.240 1.0856 617.96 0.023 0.138 56 4098.09 0.333 1.6607 974.15 0.048 0.230 57 3780.23 0.207 0.8298 1775.67 0.087 0.345 58 3808.10 0.310 1.4739 2569.86 0.135 0.545 59 4476.82 0.643 2.51510 829.65 0.050 0.241 60 1852.23 0.104 0.45011 1077.32 0.043 0.166 61 3611.02 0.202 0.79412 2654.56 0.138 0.540 62 3775.11 0.204 0.88313 1045.11 0.072 0.334 63 4267.58 0.268 1.31414 3445.02 0.170 0.678 64 4462.81 0.368 1.54415 834.08 0.045 0.182 65 4013.92 0.160 0.69416 2582.02 0.106 0.416 66 4084.59 0.242 1.34217 2533.61 0.164 0.662 67 4633.17 0.252 1.23318 1185.04 0.053 0.232 68 4617.02 0.332 1.45819 3376.85 0.195 0.753 69 4427.92 0.328 1.53320 4379.30 0.425 1.807 70 4450.23 0.325 1.38321 3062.67 0.162 0.654 71 3014.36 0.147 0.72122 3906.16 0.191 0.781 72 3745.57 0.293 1.44123 1357.01 0.076 0.298 73 3937.03 0.477 2.10724 1353.92 0.062 0.251 74 3527.50 0.181 1.07925 2676.81 0.166 0.704 75 3960.46 0.285 1.60726 3589.40 0.220 1.032 76 3313.95 0.187 0.86327 3148.03 0.147 0.571 77 NC NC NC28 4166.46 0.382 1.755 78 4773.08 0.295 1.36129 3961.45 0.372 1.701 79 2916.48 0.184 0.99630 652.40 0.013 0.148 80 4750.06 0.346 1.96631 3747.38 0.177 0.706 81 4903.73 0.648 3.82632 3617.15 0.265 1.313 82 NC NC NC33 1125.96 0.041 0.321 83 3705.77 0.268 1.70534 1941.66 0.106 0.462 84 3562.31 0.182 1.02435 2866.72 0.131 0.556 85 4642.77 0.231 1.33036 2840.09 0.146 0.614 86 3334.67 0.281 1.36337 3946.81 0.281 1.256 87 4867.80 0.390 1.88638 3226.28 0.175 0.798 88 4652.91 0.38 1.6239 1276.43 0.027 0.321 89 4504.00 0.323 1.55640 4446.53 0.475 1.991 90 4571.48 0.270 1.16741 3164.67 0.246 1.145 91 4580.67 0.450 2.46242 2511.33 0.076 0.582 92 4463.28 0.256 1.20843 3501.72 0.264 1.229 93 3777.39 0.242 1.42344 4005.05 0.268 1.247 94 5241.55 0.436 2.00345 3890.26 0.276 1.159 95 4353.65 0.411 1.89946 1501.01 0.061 0.396 96 3817.77 0.194 1.09047 3770.46 0.192 0.760 97 5031.11 0.341 1.50748 4465.53 0.211 0.836 98 5309.55 0.507 2.38649 3721.53 0.174 0.704 99 4743.19 0.294 1.65750 3668.73 0.272 1.167 100 NC NC NC
V : Maximum Base Shear Δ : Maximum Roof Displacement MIDR : Maximum Inter-Story Drift Ratio NC : Non-Convergence
100

A.3 EQUIVALENT SDOF ANALYSIS RESULTS
Table A.3.1 Results of SDOF Analyses of Frame ‘F2S2B’ (MULTI Idealization Method)
μ MULTI RMULTI V (kN) Δ (m) MIDR (%) μ MULTI RMULTI V (kN) Δ (m) MIDR
(%)1 0.041 0.041 39.22 0.002 0.035 51 1.256 1.013 822.96 0.069 1.0242 0.041 0.041 39.34 0.002 0.035 52 2.921 3.257 1167.97 0.161 2.1953 0.198 0.228 160.33 0.011 0.162 53 0.810 0.779 607.61 0.045 0.6494 0.082 0.082 73.60 0.005 0.069 54 1.863 1.523 1040.77 0.102 1.5235 0.191 0.193 155.53 0.011 0.157 55 1.445 1.510 900.18 0.079 1.1866 0.278 0.297 226.79 0.015 0.225 56 3.460 2.367 1205.05 0.190 2.5437 0.460 0.499 372.92 0.025 0.369 57 1.072 1.200 744.09 0.059 0.8658 0.536 0.515 432.38 0.029 0.430 58 2.735 2.633 1149.81 0.150 2.0809 1.088 1.061 751.02 0.060 0.879 59 3.261 1.909 1196.90 0.179 2.412
10 0.932 0.863 677.05 0.051 0.747 60 0.971 0.915 698.39 0.053 0.77911 0.407 0.373 331.62 0.022 0.327 61 0.884 0.845 649.70 0.049 0.70812 0.592 0.632 475.98 0.033 0.475 62 2.915 1.911 1167.35 0.160 2.19213 1.057 1.095 737.43 0.058 0.852 63 1.864 1.249 1041.11 0.103 1.52414 0.889 1.005 652.37 0.049 0.712 64 1.971 1.602 1067.20 0.108 1.60315 0.234 0.220 189.46 0.013 0.191 65 0.870 0.999 641.59 0.048 0.69716 0.541 0.511 436.00 0.030 0.434 66 2.727 4.106 1149.01 0.150 2.07517 0.667 0.823 525.37 0.037 0.535 67 2.762 3.172 1152.73 0.152 2.09718 0.709 0.678 549.34 0.039 0.568 68 1.969 2.659 1066.81 0.108 1.60219 0.901 1.037 659.44 0.050 0.722 69 3.179 3.343 1192.20 0.175 2.35920 1.117 0.958 763.64 0.061 0.904 70 3.421 2.376 1203.54 0.188 2.51721 0.881 0.990 648.12 0.048 0.706 71 2.047 2.384 1081.86 0.113 1.65622 1.304 1.319 843.28 0.072 1.066 72 1.633 1.725 970.74 0.090 1.34323 0.745 0.653 570.08 0.041 0.597 73 3.422 2.582 1203.58 0.188 2.51824 0.418 0.440 340.41 0.023 0.336 74 2.516 2.995 1128.07 0.138 1.94525 0.858 1.087 634.86 0.047 0.688 75 3.035 2.701 1180.48 0.167 2.26726 1.561 1.736 944.46 0.086 1.283 76 1.313 1.194 846.95 0.072 1.07427 1.477 1.439 912.57 0.081 1.213 77 4.870 1.898 1193.37 0.268 3.53028 1.034 1.303 727.24 0.057 0.832 78 2.840 2.715 1160.35 0.156 2.14629 1.639 1.380 972.82 0.090 1.348 79 3.264 3.623 1197.02 0.179 2.41330 0.241 0.261 195.57 0.013 0.196 80 4.517 5.326 1198.68 0.248 3.27931 1.281 0.953 833.80 0.070 1.047 81 5.012 3.309 1190.65 0.276 3.63132 1.467 2.032 908.70 0.081 1.205 82 4.149 3.801 1211.18 0.228 3.02033 0.870 0.872 641.58 0.048 0.697 83 3.957 4.527 1214.13 0.218 2.88334 0.973 1.165 699.12 0.053 0.780 84 2.102 2.397 1091.15 0.116 1.69335 0.818 0.969 611.85 0.045 0.655 85 2.970 4.469 1173.46 0.163 2.22636 1.437 1.562 896.75 0.079 1.179 86 1.783 1.373 1017.71 0.098 1.46137 1.908 1.942 1052.54 0.105 1.557 87 4.250 4.766 1207.11 0.234 3.09238 1.277 1.189 832.22 0.070 1.043 88 NC NC NC NC NC39 0.723 0.816 557.56 0.040 0.580 89 2.661 3.137 1143.68 0.146 2.03540 1.489 1.490 917.31 0.082 1.223 90 3.292 3.983 1198.30 0.181 2.43241 1.744 1.979 1006.14 0.096 1.431 91 5.533 4.390 1184.08 0.304 3.99242 1.551 2.245 940.89 0.085 1.275 92 2.186 2.659 1101.50 0.120 1.74743 2.507 2.381 1126.89 0.138 1.939 93 4.184 2.973 1210.07 0.230 3.04544 1.494 1.298 919.28 0.082 1.227 94 6.056 4.398 1184.56 0.333 4.35945 1.436 1.418 896.64 0.079 1.179 95 3.600 2.643 1210.34 0.198 2.63646 0.981 1.044 703.47 0.054 0.787 96 3.426 2.347 1203.73 0.188 2.52147 0.863 0.887 637.84 0.047 0.692 97 2.877 4.362 1163.44 0.158 2.16848 0.979 1.192 702.57 0.054 0.786 98 3.198 2.999 1193.38 0.176 2.37149 1.382 1.761 875.13 0.076 1.133 99 4.851 4.123 1193.29 0.267 3.51650 2.053 1.663 1083.11 0.113 1.660 100 4.443 5.348 1199.25 0.244 3.228
EQ EQMULTIMULTI
V : Maximum Base Shear MIDR : Maximum Inter-Story Drift Ratio Δ : Maximum Roof Displacement NC : Non-Convergence
101

Table A.3.2 Results of SDOF Analyses of Frame ‘F2S2B’
(ATC Idealization Method)
μ ATC RATC V (kN) Δ (m) MIDR (%) μ ATC RATC V (kN) Δ (m) MIDR
(%)1 0.041 0.041 39.23 0.002 0.035 51 1.013 1.013 718.07 0.074 0.8142 0.041 0.041 39.35 0.002 0.035 52 2.673 3.257 1144.77 0.170 2.0433 0.228 0.228 184.59 0.013 0.186 53 0.779 0.779 589.70 0.046 0.6244 0.082 0.082 73.61 0.007 0.069 54 1.801 1.523 1023.10 0.098 1.4755 0.193 0.193 156.55 0.013 0.158 55 1.693 1.510 990.78 0.073 1.3916 0.296 0.296 242.07 0.017 0.240 56 3.268 2.367 1197.20 0.202 2.4167 0.499 0.499 404.06 0.027 0.401 57 1.188 1.200 794.17 0.076 0.9668 0.515 0.515 415.94 0.033 0.413 58 1.979 2.634 1068.99 0.126 1.6099 1.064 1.062 740.55 0.077 0.858 59 2.876 1.909 1163.36 0.173 2.167
10 0.864 0.864 638.19 0.067 0.692 60 0.915 0.915 667.29 0.062 0.73311 0.373 0.373 304.54 0.029 0.301 61 0.845 0.845 627.51 0.061 0.67712 0.632 0.632 504.93 0.038 0.507 62 3.153 1.911 1190.62 0.196 2.34213 1.101 1.095 756.43 0.059 0.890 63 1.230 1.249 811.98 0.087 1.00214 1.005 1.005 714.47 0.055 0.807 64 1.829 1.602 1031.26 0.105 1.49715 0.220 0.220 177.89 0.016 0.180 65 0.999 0.999 711.81 0.047 0.80216 0.511 0.511 413.03 0.037 0.410 66 2.526 4.106 1129.37 0.140 1.95117 0.822 0.822 614.60 0.036 0.659 67 2.695 3.173 1146.60 0.166 2.05618 0.678 0.678 531.84 0.045 0.544 68 2.331 2.659 1107.68 0.141 1.82919 1.037 1.036 728.72 0.053 0.835 69 2.304 3.342 1106.29 0.181 1.81420 0.958 0.958 691.77 0.062 0.768 70 2.554 2.376 1133.01 0.163 1.96921 0.990 0.990 708.16 0.060 0.795 71 1.662 2.384 980.77 0.119 1.36722 1.171 1.319 786.66 0.085 0.951 72 2.054 1.725 1083.21 0.115 1.66123 0.653 0.653 517.30 0.043 0.524 73 2.768 2.582 1153.27 0.174 2.10024 0.440 0.440 357.38 0.022 0.353 74 2.254 2.994 1105.45 0.131 1.78725 1.090 1.086 751.78 0.053 0.881 75 2.761 2.701 1152.58 0.159 2.09626 1.396 1.736 880.84 0.094 1.145 76 1.209 1.194 803.24 0.089 0.98427 1.445 1.439 899.90 0.089 1.186 77 4.121 1.898 1211.94 0.241 3.00028 1.159 1.303 781.60 0.068 0.940 78 3.306 2.714 1198.92 0.157 2.44129 1.545 1.381 938.82 0.103 1.270 79 2.660 3.623 1143.64 0.165 2.03530 0.261 0.261 212.38 0.017 0.212 80 4.761 5.327 1194.83 0.271 3.45231 0.953 0.953 689.20 0.081 0.764 81 3.956 3.309 1214.13 0.246 2.88232 1.782 2.032 1017.60 0.101 1.461 82 3.827 3.802 1213.78 0.211 2.79333 0.872 0.872 642.72 0.049 0.699 83 3.694 4.528 1212.32 0.205 2.70034 1.174 1.164 788.08 0.063 0.954 84 2.118 2.397 1093.35 0.113 1.70435 0.969 0.969 697.29 0.041 0.777 85 2.751 4.468 1151.47 0.151 2.09036 1.585 1.562 953.24 0.100 1.303 86 1.473 1.374 911.02 0.100 1.21037 1.446 1.942 900.64 0.123 1.187 87 3.659 4.766 1211.69 0.219 2.67638 1.206 1.189 801.98 0.069 0.982 88 NC NC NC NC NC39 0.816 0.816 610.96 0.040 0.654 89 2.164 3.137 1099.44 0.137 1.73440 1.536 1.490 935.59 0.081 1.263 90 3.086 3.984 1185.77 0.183 2.30041 1.659 1.978 979.60 0.099 1.364 91 5.410 4.390 1185.03 0.304 3.90842 1.413 2.244 887.35 0.094 1.159 92 2.211 2.658 1102.95 0.136 1.76243 2.152 2.381 1097.94 0.120 1.726 93 3.418 2.973 1203.39 0.214 2.51544 1.398 1.299 881.56 0.097 1.146 94 5.194 4.400 1186.12 0.306 3.75845 1.255 1.418 822.51 0.085 1.024 95 3.550 2.644 1208.46 0.196 2.60246 1.044 1.043 731.98 0.053 0.841 96 4.014 2.347 1213.79 0.234 2.92447 0.887 0.887 651.28 0.050 0.711 97 3.239 4.362 1195.79 0.183 2.39748 1.212 1.192 804.46 0.066 0.987 98 3.377 2.998 1201.81 0.158 2.48849 1.373 1.761 871.48 0.084 1.125 99 4.397 4.124 1200.25 0.252 3.19650 2.044 1.663 1081.38 0.119 1.654 100 4.319 5.347 1202.49 0.235 3.141
EQ EQATCATC
V : Maximum Base Shear Δ : Maximum Roof Displacement MIDR : Maximum Inter-Story Drift Ratio NC : Not Considered
102

Table A.3.3 Results of SDOF Analyses of Frame ‘F2S2B’
(FEMA Idealization Method)
μ FEMA RFEMA V (kN) Δ (m) MIDR (%) μ FEMA RFEMA V (kN) Δ (m) MIDR
(%)1 0.031 0.031 37.45 0.002 0.033 51 1.066 1.063 862.64 0.074 1.1072 0.032 0.032 38.53 0.002 0.034 52 2.442 2.665 1186.50 0.170 2.3053 0.182 0.182 186.68 0.013 0.188 53 0.660 0.660 622.98 0.046 0.6714 0.097 0.097 104.04 0.007 0.102 54 1.405 1.315 1016.94 0.098 1.4595 0.183 0.183 187.96 0.013 0.189 55 1.044 1.092 850.86 0.073 1.0826 0.238 0.238 245.89 0.017 0.244 56 2.893 2.240 1211.82 0.202 2.6817 0.388 0.388 398.16 0.027 0.395 57 1.095 1.191 877.64 0.076 1.1388 0.478 0.478 486.00 0.033 0.485 58 1.812 3.175 1106.70 0.126 1.8109 1.104 1.262 881.97 0.077 1.147 59 2.479 1.781 1189.97 0.173 2.335
10 0.954 0.954 803.24 0.067 0.984 60 0.890 0.890 768.41 0.062 0.91411 0.416 0.416 425.73 0.029 0.423 61 0.868 0.868 756.28 0.061 0.89012 0.550 0.550 542.49 0.038 0.559 62 2.818 2.222 1209.28 0.196 2.61713 0.847 0.847 744.74 0.059 0.867 63 1.250 1.236 953.10 0.087 1.30314 0.791 0.791 713.66 0.055 0.805 64 1.507 1.403 1052.98 0.105 1.55815 0.235 0.235 243.22 0.016 0.241 65 0.677 0.677 635.05 0.047 0.68816 0.536 0.536 532.19 0.037 0.544 66 2.008 3.101 1131.82 0.140 1.96317 0.516 0.516 517.97 0.036 0.524 67 2.382 2.784 1178.75 0.166 2.25718 0.647 0.647 613.52 0.045 0.658 68 2.028 2.354 1135.10 0.141 1.97919 0.759 0.759 693.73 0.053 0.772 69 2.604 2.394 1198.62 0.181 2.43720 0.892 0.892 769.36 0.062 0.916 70 2.335 2.149 1172.35 0.163 2.22021 0.860 0.860 751.85 0.060 0.881 71 1.712 2.694 1100.20 0.119 1.73822 1.222 1.199 939.99 0.085 1.273 72 1.653 1.550 1090.26 0.115 1.68923 0.610 0.610 586.43 0.043 0.620 73 2.499 2.884 1191.49 0.174 2.35124 0.309 0.309 319.02 0.022 0.315 74 1.883 2.045 1113.29 0.131 1.86325 0.762 0.762 695.21 0.053 0.774 75 2.285 2.371 1165.41 0.159 2.18026 1.352 1.688 996.78 0.094 1.407 76 1.277 1.250 965.18 0.089 1.33027 1.275 1.246 964.52 0.089 1.329 77 3.453 1.833 1200.61 0.241 3.18128 0.969 0.969 811.38 0.068 1.001 78 2.253 2.003 1161.61 0.157 2.15529 1.482 1.387 1045.05 0.103 1.535 79 2.361 3.399 1175.93 0.165 2.24030 0.244 0.244 253.01 0.017 0.250 80 3.882 5.029 1193.46 0.271 3.56531 1.157 1.142 908.59 0.081 1.204 81 3.523 3.344 1198.82 0.246 3.24332 1.447 1.639 1032.79 0.101 1.501 82 3.029 4.719 1213.86 0.211 2.80133 0.710 0.710 658.43 0.049 0.721 83 2.946 4.718 1213.01 0.205 2.72834 0.907 0.907 777.65 0.063 0.932 84 1.627 2.412 1084.74 0.113 1.66635 0.581 0.581 565.56 0.041 0.591 85 2.173 3.341 1151.83 0.151 2.09236 1.430 1.368 1026.63 0.100 1.485 86 1.431 1.349 1026.91 0.100 1.48537 1.764 2.344 1104.28 0.123 1.776 87 3.140 4.348 1214.01 0.219 2.89938 0.986 0.986 820.33 0.069 1.019 88 NC NC NC NC NC39 0.569 0.569 556.82 0.040 0.578 89 1.970 2.592 1125.59 0.137 1.93340 1.156 1.141 907.88 0.081 1.203 90 2.625 3.521 1199.80 0.183 2.45541 1.422 1.708 1023.50 0.099 1.476 91 4.359 4.037 1184.14 0.304 3.98742 1.350 1.536 996.19 0.094 1.405 92 1.954 2.025 1122.82 0.136 1.91943 1.728 2.175 1101.74 0.120 1.749 93 3.073 2.929 1214.15 0.214 2.84044 1.397 1.340 1013.82 0.097 1.451 94 4.391 5.014 1183.85 0.306 4.01445 1.217 1.192 938.04 0.085 1.268 95 2.809 2.923 1208.84 0.196 2.60946 0.754 0.754 690.49 0.053 0.766 96 3.354 2.600 1207.10 0.234 3.09347 0.717 0.717 663.56 0.050 0.728 97 2.621 4.680 1199.59 0.183 2.45248 0.947 0.947 799.46 0.066 0.977 98 2.266 3.391 1162.91 0.158 2.16449 1.205 1.359 931.95 0.084 1.255 99 3.616 4.007 1198.20 0.252 3.32650 1.702 1.515 1098.56 0.119 1.729 100 3.370 4.349 1204.77 0.235 3.106
EQ EQFEMAFEMA
V : Maximum Base Shear Δ : Maximum Roof Displacement MIDR : Maximum Inter-Story Drift Ratio NC : Not Considered
103

Table A.3.4 Results of SDOF Analyses of Frame ‘F2S2B’
(75%Vy Idealization Method)
μ 75%Vy R75%Vy V (kN) Δ (m) MIDR (%) μ 75%Vy R75%Vy V (kN) Δ (m) MIDR
(%)1 0.021 0.021 33.95 0.002 0.030 51 1.090 1.147 1039.15 0.102 1.5192 0.027 0.027 44.47 0.003 0.040 52 2.036 1.800 1205.37 0.191 2.5493 0.161 0.161 222.77 0.015 0.222 53 0.546 0.546 675.70 0.051 0.7454 0.080 0.080 114.67 0.008 0.113 54 1.107 1.098 1046.87 0.104 1.5415 0.156 0.156 216.25 0.015 0.216 55 1.001 1.001 994.55 0.094 1.4016 0.165 0.165 229.12 0.015 0.228 56 2.510 2.041 1204.64 0.235 3.1107 0.372 0.372 506.20 0.035 0.508 57 0.833 0.833 890.06 0.078 1.1658 0.357 0.357 487.81 0.033 0.487 58 1.586 2.342 1147.19 0.149 2.0609 0.845 0.845 898.28 0.079 1.182 59 2.034 1.603 1205.23 0.191 2.546
10 0.727 0.727 815.40 0.068 1.009 60 0.850 0.850 901.43 0.080 1.18911 0.321 0.321 441.42 0.030 0.439 61 0.852 0.852 902.77 0.080 1.19212 0.517 0.517 648.35 0.048 0.707 62 2.229 2.069 1213.57 0.209 2.77213 0.680 0.680 781.29 0.064 0.940 63 1.762 1.514 1176.91 0.165 2.24614 0.779 0.779 853.01 0.073 1.087 64 1.229 1.201 1089.96 0.115 1.68815 0.144 0.144 198.17 0.013 0.199 65 0.564 0.564 693.44 0.053 0.77116 0.404 0.404 537.70 0.038 0.552 66 2.109 1.912 1210.08 0.198 2.63117 0.408 0.408 541.28 0.038 0.557 67 2.290 2.230 1214.17 0.215 2.84518 0.622 0.622 738.72 0.058 0.855 68 1.468 1.665 1126.08 0.138 1.93519 0.682 0.682 783.25 0.064 0.944 69 2.688 2.426 1198.28 0.252 3.32420 0.752 0.752 833.43 0.070 1.046 70 2.246 1.836 1213.78 0.210 2.79321 0.837 0.837 892.65 0.078 1.170 71 1.614 1.865 1151.33 0.151 2.08922 0.959 0.959 971.20 0.090 1.344 72 1.061 1.059 1024.93 0.099 1.48023 0.427 0.427 560.23 0.040 0.583 73 2.151 2.679 1211.79 0.202 2.68024 0.276 0.276 380.65 0.026 0.377 74 1.345 1.531 1106.77 0.126 1.80825 0.544 0.544 674.13 0.051 0.743 75 1.806 1.845 1184.85 0.169 2.29326 1.212 1.386 1085.21 0.114 1.668 76 1.097 1.092 1042.24 0.103 1.52727 0.927 0.927 951.38 0.087 1.299 77 3.458 1.918 1184.56 0.324 4.24328 0.605 0.605 726.13 0.057 0.830 78 1.866 1.416 1192.25 0.175 2.35929 0.994 0.994 990.96 0.093 1.392 79 2.033 2.919 1205.15 0.190 2.54530 0.226 0.226 313.81 0.021 0.310 80 2.801 3.895 1194.62 0.262 3.46031 1.361 1.302 1106.57 0.128 1.822 81 2.951 3.386 1190.01 0.276 3.64132 1.115 1.110 1050.48 0.104 1.551 82 2.246 3.915 1213.78 0.210 2.79233 0.535 0.535 665.85 0.050 0.731 83 2.258 4.315 1213.91 0.212 2.80734 0.630 0.630 744.54 0.059 0.866 84 1.494 2.344 1131.84 0.140 1.96335 0.525 0.525 656.00 0.049 0.717 85 1.653 2.284 1158.21 0.155 2.13136 0.994 0.994 990.57 0.093 1.391 86 1.288 1.373 1102.07 0.121 1.75237 1.590 1.963 1147.66 0.149 2.064 87 2.624 3.544 1198.75 0.246 3.24738 1.028 1.028 1008.41 0.096 1.437 88 NC NC NC NC NC39 0.385 0.385 519.23 0.036 0.526 89 1.654 1.814 1158.32 0.155 2.13240 0.934 0.934 955.80 0.088 1.309 90 2.231 2.510 1213.60 0.209 2.77441 1.303 1.279 1103.36 0.122 1.767 91 3.336 3.503 1182.94 0.313 4.09642 0.982 0.982 984.36 0.092 1.375 92 1.356 1.951 1106.18 0.127 1.81743 1.672 1.739 1161.08 0.157 2.151 93 2.668 2.692 1198.66 0.250 3.30044 0.806 0.806 871.29 0.075 1.125 94 3.564 3.689 1184.54 0.334 4.37045 1.452 1.360 1122.55 0.136 1.918 95 2.255 3.512 1213.87 0.211 2.80346 0.496 0.496 627.17 0.046 0.677 96 2.431 2.995 1211.37 0.228 3.01547 0.505 0.505 636.71 0.047 0.690 97 2.224 4.132 1213.51 0.208 2.76648 0.709 0.709 802.78 0.066 0.983 98 1.889 4.083 1194.56 0.177 2.38449 1.004 1.004 996.10 0.094 1.405 99 2.841 3.660 1193.35 0.266 3.50750 1.471 1.612 1126.68 0.138 1.938 100 2.725 3.919 1196.25 0.255 3.369
EQ EQ75%Vy75%Vy
V : Maximum Base Shear Δ : Maximum Roof Displacement MIDR : Maximum Inter-Story Drift Ratio NC : Not Considered
104
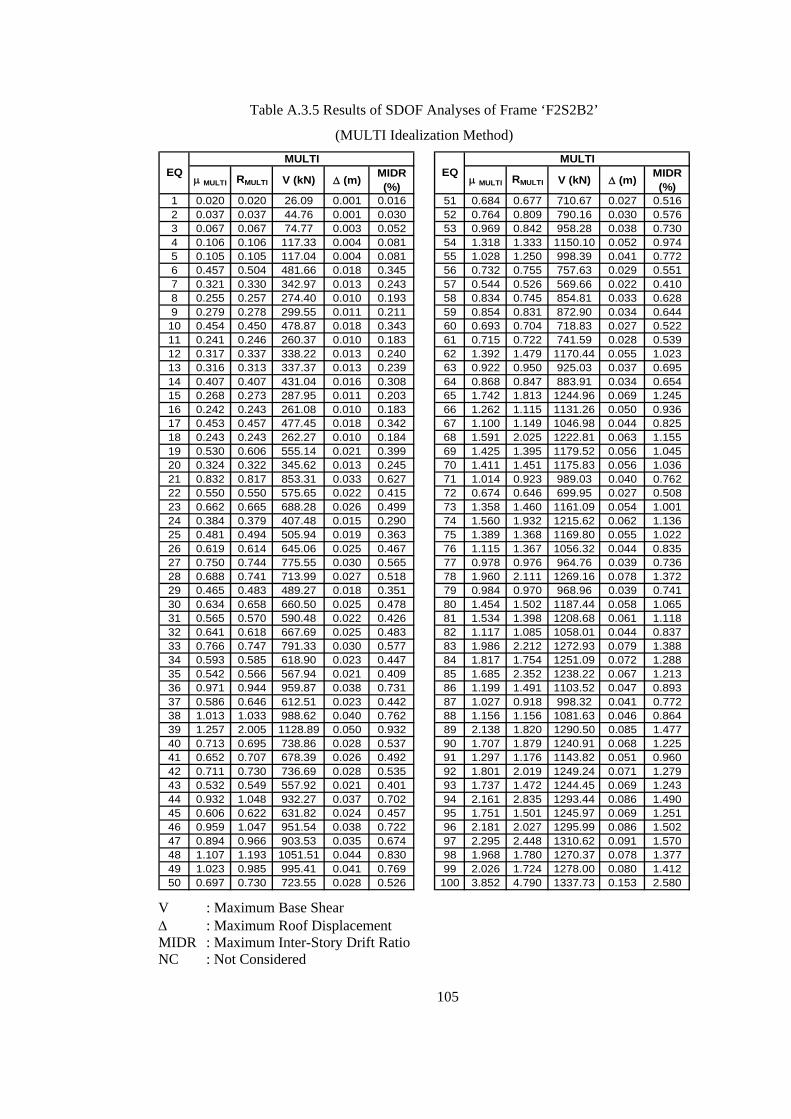
Table A.3.5 Results of SDOF Analyses of Frame ‘F2S2B2’
(MULTI Idealization Method)
μ MULTI RMULTI V (kN) Δ (m) MIDR (%) μ MULTI RMULTI V (kN) Δ (m) MIDR
(%)1 0.020 0.020 26.09 0.001 0.016 51 0.684 0.677 710.67 0.027 0.5162 0.037 0.037 44.76 0.001 0.030 52 0.764 0.809 790.16 0.030 0.5763 0.067 0.067 74.77 0.003 0.052 53 0.969 0.842 958.28 0.038 0.7304 0.106 0.106 117.33 0.004 0.081 54 1.318 1.333 1150.10 0.052 0.9745 0.105 0.105 117.04 0.004 0.081 55 1.028 1.250 998.39 0.041 0.7726 0.457 0.504 481.66 0.018 0.345 56 0.732 0.755 757.63 0.029 0.5517 0.321 0.330 342.97 0.013 0.243 57 0.544 0.526 569.66 0.022 0.4108 0.255 0.257 274.40 0.010 0.193 58 0.834 0.745 854.81 0.033 0.6289 0.279 0.278 299.55 0.011 0.211 59 0.854 0.831 872.90 0.034 0.644
10 0.454 0.450 478.87 0.018 0.343 60 0.693 0.704 718.83 0.027 0.52211 0.241 0.246 260.37 0.010 0.183 61 0.715 0.722 741.59 0.028 0.53912 0.317 0.337 338.22 0.013 0.240 62 1.392 1.479 1170.44 0.055 1.02313 0.316 0.313 337.37 0.013 0.239 63 0.922 0.950 925.03 0.037 0.69514 0.407 0.407 431.04 0.016 0.308 64 0.868 0.847 883.91 0.034 0.65415 0.268 0.273 287.95 0.011 0.203 65 1.742 1.813 1244.96 0.069 1.24516 0.242 0.243 261.08 0.010 0.183 66 1.262 1.115 1131.26 0.050 0.93617 0.453 0.457 477.45 0.018 0.342 67 1.100 1.149 1046.98 0.044 0.82518 0.243 0.243 262.27 0.010 0.184 68 1.591 2.025 1222.81 0.063 1.15519 0.530 0.606 555.14 0.021 0.399 69 1.425 1.395 1179.52 0.056 1.04520 0.324 0.322 345.62 0.013 0.245 70 1.411 1.451 1175.83 0.056 1.03621 0.832 0.817 853.31 0.033 0.627 71 1.014 0.923 989.03 0.040 0.76222 0.550 0.550 575.65 0.022 0.415 72 0.674 0.646 699.95 0.027 0.50823 0.662 0.665 688.28 0.026 0.499 73 1.358 1.460 1161.09 0.054 1.00124 0.384 0.379 407.48 0.015 0.290 74 1.560 1.932 1215.62 0.062 1.13625 0.481 0.494 505.94 0.019 0.363 75 1.389 1.368 1169.80 0.055 1.02226 0.619 0.614 645.06 0.025 0.467 76 1.115 1.367 1056.32 0.044 0.83527 0.750 0.744 775.55 0.030 0.565 77 0.978 0.976 964.76 0.039 0.73628 0.688 0.741 713.99 0.027 0.518 78 1.960 2.111 1269.16 0.078 1.37229 0.465 0.483 489.27 0.018 0.351 79 0.984 0.970 968.96 0.039 0.74130 0.634 0.658 660.50 0.025 0.478 80 1.454 1.502 1187.44 0.058 1.06531 0.565 0.570 590.48 0.022 0.426 81 1.534 1.398 1208.68 0.061 1.11832 0.641 0.618 667.69 0.025 0.483 82 1.117 1.085 1058.01 0.044 0.83733 0.766 0.747 791.33 0.030 0.577 83 1.986 2.212 1272.93 0.079 1.38834 0.593 0.585 618.90 0.023 0.447 84 1.817 1.754 1251.09 0.072 1.28835 0.542 0.566 567.94 0.021 0.409 85 1.685 2.352 1238.22 0.067 1.21336 0.971 0.944 959.87 0.038 0.731 86 1.199 1.491 1103.52 0.047 0.89337 0.586 0.646 612.51 0.023 0.442 87 1.027 0.918 998.32 0.041 0.77238 1.013 1.033 988.62 0.040 0.762 88 1.156 1.156 1081.63 0.046 0.86439 1.257 2.005 1128.89 0.050 0.932 89 2.138 1.820 1290.50 0.085 1.47740 0.713 0.695 738.86 0.028 0.537 90 1.707 1.879 1240.91 0.068 1.22541 0.652 0.707 678.39 0.026 0.492 91 1.297 1.176 1143.82 0.051 0.96042 0.711 0.730 736.69 0.028 0.535 92 1.801 2.019 1249.24 0.071 1.27943 0.532 0.549 557.92 0.021 0.401 93 1.737 1.472 1244.45 0.069 1.24344 0.932 1.048 932.27 0.037 0.702 94 2.161 2.835 1293.44 0.086 1.49045 0.606 0.622 631.82 0.024 0.457 95 1.751 1.501 1245.97 0.069 1.25146 0.959 1.047 951.54 0.038 0.722 96 2.181 2.027 1295.99 0.086 1.50247 0.894 0.966 903.53 0.035 0.674 97 2.295 2.448 1310.62 0.091 1.57048 1.107 1.193 1051.51 0.044 0.830 98 1.968 1.780 1270.37 0.078 1.37749 1.023 0.985 995.41 0.041 0.769 99 2.026 1.724 1278.00 0.080 1.41250 0.697 0.730 723.55 0.028 0.526 100 3.852 4.790 1337.73 0.153 2.580
EQ EQMULTIMULTI
V : Maximum Base Shear Δ : Maximum Roof Displacement MIDR : Maximum Inter-Story Drift Ratio NC : Not Considered
105

Table A.3.6 Results of SDOF Analyses of Frame ‘F2S2B2’
(ATC Idealization Method)
μ ATC RATC V (kN) Δ (m) MIDR (%) μ ATC RATC V (kN) Δ (m) MIDR
(%)1 0.020 0.020 26.09 0.001 0.016 51 0.677 0.677 702.92 0.027 0.5102 0.037 0.037 44.77 0.001 0.030 52 0.809 0.809 833.41 0.032 0.6093 0.067 0.067 74.77 0.003 0.052 53 0.842 0.842 861.92 0.033 0.6344 0.106 0.106 117.33 0.004 0.081 54 1.213 1.333 1109.66 0.048 0.9025 0.105 0.105 117.04 0.004 0.081 55 1.114 1.250 1056.30 0.044 0.8356 0.504 0.504 529.44 0.020 0.380 56 0.755 0.755 781.00 0.030 0.5697 0.330 0.330 351.70 0.013 0.249 57 0.526 0.526 552.01 0.021 0.3978 0.257 0.257 276.82 0.010 0.195 58 0.745 0.745 770.94 0.030 0.5619 0.278 0.278 298.49 0.011 0.211 59 0.831 0.831 852.16 0.033 0.626
10 0.450 0.450 474.68 0.018 0.340 60 0.704 0.704 730.15 0.028 0.53011 0.246 0.246 265.40 0.010 0.187 61 0.722 0.722 748.18 0.029 0.54412 0.337 0.337 359.05 0.013 0.255 62 1.269 1.479 1133.77 0.050 0.94013 0.313 0.313 334.14 0.012 0.237 63 0.950 0.950 945.05 0.038 0.71614 0.407 0.407 430.37 0.016 0.307 64 0.847 0.847 866.88 0.034 0.63915 0.273 0.273 292.65 0.011 0.206 65 1.570 1.813 1218.01 0.062 1.14216 0.243 0.243 262.11 0.010 0.184 66 1.114 1.115 1055.71 0.044 0.83417 0.457 0.457 481.30 0.018 0.345 67 1.161 1.149 1084.24 0.046 0.86718 0.243 0.243 262.04 0.010 0.184 68 1.382 2.025 1167.76 0.055 1.01719 0.606 0.606 632.46 0.024 0.457 69 1.236 1.395 1119.74 0.049 0.91820 0.322 0.322 344.00 0.013 0.244 70 1.448 1.451 1185.76 0.057 1.06121 0.817 0.817 840.14 0.032 0.615 71 0.923 0.923 926.13 0.037 0.69622 0.550 0.550 575.54 0.022 0.415 72 0.646 0.646 672.15 0.026 0.48723 0.665 0.665 691.21 0.026 0.501 73 1.432 1.460 1181.50 0.057 1.05024 0.379 0.379 402.31 0.015 0.286 74 1.437 1.932 1182.86 0.057 1.05425 0.494 0.494 518.77 0.020 0.372 75 1.400 1.368 1172.78 0.055 1.02926 0.615 0.615 640.75 0.024 0.463 76 1.157 1.366 1082.35 0.046 0.86527 0.744 0.744 769.60 0.029 0.560 77 0.976 0.976 963.41 0.039 0.73528 0.741 0.741 766.61 0.029 0.558 78 1.822 2.111 1251.76 0.072 1.29129 0.483 0.483 508.18 0.019 0.365 79 0.970 0.970 958.86 0.038 0.73030 0.658 0.658 684.08 0.026 0.496 80 1.201 1.502 1104.48 0.048 0.89431 0.570 0.570 595.93 0.023 0.430 81 1.380 1.398 1167.29 0.055 1.01632 0.618 0.618 643.87 0.024 0.466 82 1.090 1.085 1040.43 0.043 0.81833 0.747 0.747 772.93 0.030 0.563 83 1.674 2.212 1236.65 0.066 1.20634 0.585 0.585 610.98 0.023 0.441 84 1.781 1.754 1248.37 0.071 1.26835 0.566 0.566 591.80 0.022 0.427 85 1.747 2.353 1245.55 0.069 1.24936 0.944 0.944 941.19 0.037 0.712 86 1.378 1.491 1166.57 0.055 1.01437 0.646 0.646 672.34 0.026 0.487 87 0.918 0.918 922.35 0.036 0.69238 1.035 1.033 1003.38 0.041 0.778 88 1.109 1.156 1052.45 0.044 0.83139 1.230 2.005 1117.06 0.049 0.914 89 2.000 1.820 1274.85 0.079 1.39640 0.695 0.695 721.16 0.028 0.524 90 1.693 1.879 1239.24 0.067 1.21741 0.707 0.707 732.73 0.028 0.532 91 1.206 1.176 1106.83 0.048 0.89842 0.730 0.730 755.65 0.029 0.550 92 1.912 2.019 1262.17 0.076 1.34343 0.549 0.549 574.42 0.022 0.414 93 1.664 1.472 1235.14 0.066 1.20044 1.049 1.048 1013.22 0.042 0.788 94 2.133 2.835 1289.97 0.084 1.47445 0.622 0.622 648.17 0.025 0.469 95 1.621 1.501 1228.16 0.064 1.17446 1.026 1.047 997.32 0.041 0.771 96 2.257 2.027 1305.47 0.089 1.54747 0.966 0.966 956.50 0.038 0.728 97 2.313 2.447 1313.14 0.092 1.58148 1.096 1.193 1044.32 0.043 0.822 98 2.060 1.780 1281.77 0.082 1.43149 0.986 0.986 969.78 0.039 0.742 99 2.187 1.724 1296.75 0.087 1.50650 0.730 0.730 756.13 0.029 0.550 100 3.520 4.789 1350.44 0.139 2.354
EQ EQATCATC
V : Maximum Base Shear Δ : Maximum Roof Displacement MIDR : Maximum Inter-Story Drift Ratio NC : Not Considered
106
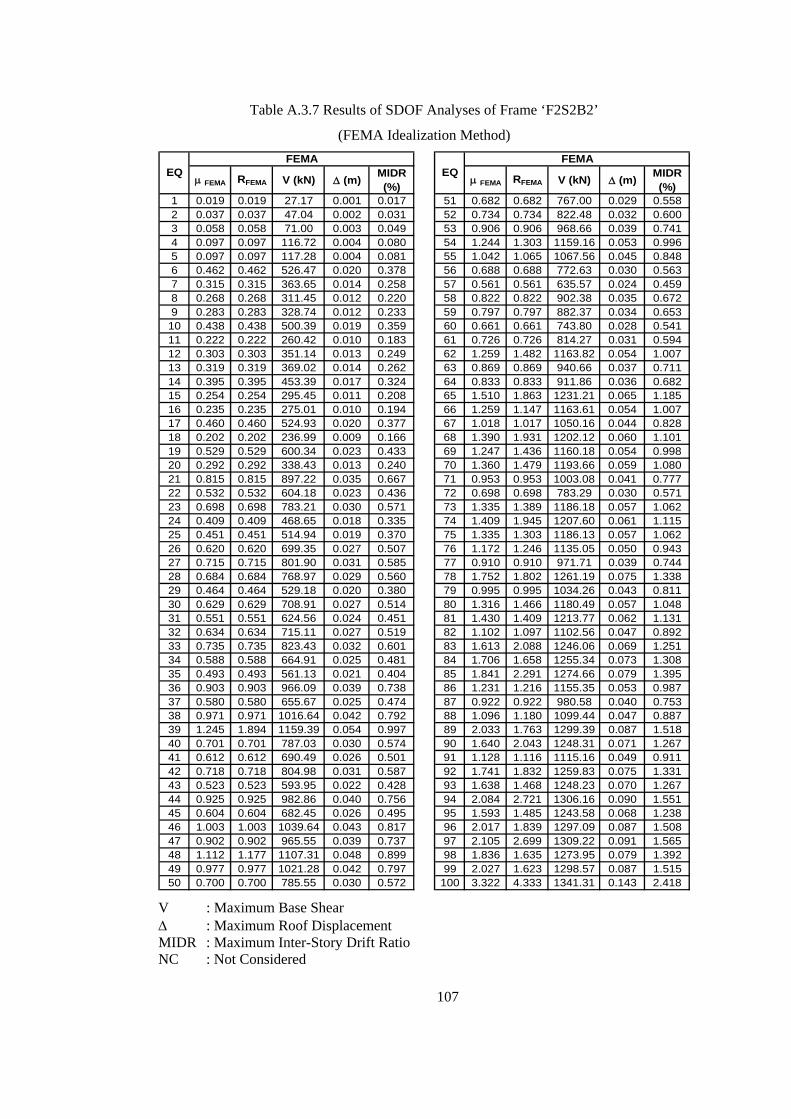
Table A.3.7 Results of SDOF Analyses of Frame ‘F2S2B2’
(FEMA Idealization Method)
μ FEMA RFEMA V (kN) Δ (m) MIDR (%) μ FEMA RFEMA V (kN) Δ (m) MIDR
(%)1 0.019 0.019 27.17 0.001 0.017 51 0.682 0.682 767.00 0.029 0.5582 0.037 0.037 47.04 0.002 0.031 52 0.734 0.734 822.48 0.032 0.6003 0.058 0.058 71.00 0.003 0.049 53 0.906 0.906 968.66 0.039 0.7414 0.097 0.097 116.72 0.004 0.080 54 1.244 1.303 1159.16 0.053 0.9965 0.097 0.097 117.28 0.004 0.081 55 1.042 1.065 1067.56 0.045 0.8486 0.462 0.462 526.47 0.020 0.378 56 0.688 0.688 772.63 0.030 0.5637 0.315 0.315 363.65 0.014 0.258 57 0.561 0.561 635.57 0.024 0.4598 0.268 0.268 311.45 0.012 0.220 58 0.822 0.822 902.38 0.035 0.6729 0.283 0.283 328.74 0.012 0.233 59 0.797 0.797 882.37 0.034 0.653
10 0.438 0.438 500.39 0.019 0.359 60 0.661 0.661 743.80 0.028 0.54111 0.222 0.222 260.42 0.010 0.183 61 0.726 0.726 814.27 0.031 0.59412 0.303 0.303 351.14 0.013 0.249 62 1.259 1.482 1163.82 0.054 1.00713 0.319 0.319 369.02 0.014 0.262 63 0.869 0.869 940.66 0.037 0.71114 0.395 0.395 453.39 0.017 0.324 64 0.833 0.833 911.86 0.036 0.68215 0.254 0.254 295.45 0.011 0.208 65 1.510 1.863 1231.21 0.065 1.18516 0.235 0.235 275.01 0.010 0.194 66 1.259 1.147 1163.61 0.054 1.00717 0.460 0.460 524.93 0.020 0.377 67 1.018 1.017 1050.16 0.044 0.82818 0.202 0.202 236.99 0.009 0.166 68 1.390 1.931 1202.12 0.060 1.10119 0.529 0.529 600.34 0.023 0.433 69 1.247 1.436 1160.18 0.054 0.99820 0.292 0.292 338.43 0.013 0.240 70 1.360 1.479 1193.66 0.059 1.08021 0.815 0.815 897.22 0.035 0.667 71 0.953 0.953 1003.08 0.041 0.77722 0.532 0.532 604.18 0.023 0.436 72 0.698 0.698 783.29 0.030 0.57123 0.698 0.698 783.21 0.030 0.571 73 1.335 1.389 1186.18 0.057 1.06224 0.409 0.409 468.65 0.018 0.335 74 1.409 1.945 1207.60 0.061 1.11525 0.451 0.451 514.94 0.019 0.370 75 1.335 1.303 1186.13 0.057 1.06226 0.620 0.620 699.35 0.027 0.507 76 1.172 1.246 1135.05 0.050 0.94327 0.715 0.715 801.90 0.031 0.585 77 0.910 0.910 971.71 0.039 0.74428 0.684 0.684 768.97 0.029 0.560 78 1.752 1.802 1261.19 0.075 1.33829 0.464 0.464 529.18 0.020 0.380 79 0.995 0.995 1034.26 0.043 0.81130 0.629 0.629 708.91 0.027 0.514 80 1.316 1.466 1180.49 0.057 1.04831 0.551 0.551 624.56 0.024 0.451 81 1.430 1.409 1213.77 0.062 1.13132 0.634 0.634 715.11 0.027 0.519 82 1.102 1.097 1102.56 0.047 0.89233 0.735 0.735 823.43 0.032 0.601 83 1.613 2.088 1246.06 0.069 1.25134 0.588 0.588 664.91 0.025 0.481 84 1.706 1.658 1255.34 0.073 1.30835 0.493 0.493 561.13 0.021 0.404 85 1.841 2.291 1274.66 0.079 1.39536 0.903 0.903 966.09 0.039 0.738 86 1.231 1.216 1155.35 0.053 0.98737 0.580 0.580 655.67 0.025 0.474 87 0.922 0.922 980.58 0.040 0.75338 0.971 0.971 1016.64 0.042 0.792 88 1.096 1.180 1099.44 0.047 0.88739 1.245 1.894 1159.39 0.054 0.997 89 2.033 1.763 1299.39 0.087 1.51840 0.701 0.701 787.03 0.030 0.574 90 1.640 2.043 1248.31 0.071 1.26741 0.612 0.612 690.49 0.026 0.501 91 1.128 1.116 1115.16 0.049 0.91142 0.718 0.718 804.98 0.031 0.587 92 1.741 1.832 1259.83 0.075 1.33143 0.523 0.523 593.95 0.022 0.428 93 1.638 1.468 1248.23 0.070 1.26744 0.925 0.925 982.86 0.040 0.756 94 2.084 2.721 1306.16 0.090 1.55145 0.604 0.604 682.45 0.026 0.495 95 1.593 1.485 1243.58 0.068 1.23846 1.003 1.003 1039.64 0.043 0.817 96 2.017 1.839 1297.09 0.087 1.50847 0.902 0.902 965.55 0.039 0.737 97 2.105 2.699 1309.22 0.091 1.56548 1.112 1.177 1107.31 0.048 0.899 98 1.836 1.635 1273.95 0.079 1.39249 0.977 0.977 1021.28 0.042 0.797 99 2.027 1.623 1298.57 0.087 1.51550 0.700 0.700 785.55 0.030 0.572 100 3.322 4.333 1341.31 0.143 2.418
EQ EQFEMAFEMA
V : Maximum Base Shear Δ : Maximum Roof Displacement MIDR : Maximum Inter-Story Drift Ratio NC : Not Considered
107

Table A.3.8 Results of SDOF Analyses of Frame ‘F2S2B2’
(75%Vy Idealization Method)
μ 75%Vy R75%Vy V (kN) Δ (m) MIDR (%) μ 75%Vy R75%Vy V (kN) Δ (m) MIDR
(%)1 0.019 0.019 27.59 0.001 0.017 51 0.682 0.682 788.53 0.030 0.5752 0.037 0.037 48.23 0.002 0.032 52 0.706 0.706 815.37 0.031 0.5953 0.055 0.055 69.15 0.002 0.048 53 0.924 0.924 1002.21 0.041 0.7764 0.095 0.095 118.01 0.004 0.081 54 1.251 1.292 1172.53 0.055 1.0285 0.095 0.095 117.43 0.004 0.081 55 0.998 0.998 1057.34 0.044 0.8366 0.448 0.448 526.22 0.020 0.378 56 0.692 0.692 799.98 0.031 0.5837 0.309 0.309 367.34 0.014 0.261 57 0.586 0.586 682.04 0.026 0.4948 0.267 0.267 319.71 0.012 0.226 58 0.851 0.851 946.78 0.038 0.7179 0.285 0.285 340.49 0.013 0.241 59 0.784 0.784 890.94 0.035 0.661
10 0.434 0.434 510.06 0.019 0.366 60 0.647 0.647 749.52 0.029 0.54511 0.213 0.213 257.48 0.009 0.181 61 0.720 0.720 829.89 0.032 0.60612 0.290 0.290 345.55 0.013 0.245 62 1.281 1.478 1181.67 0.057 1.05113 0.318 0.318 378.39 0.014 0.269 63 0.846 0.846 942.65 0.037 0.71314 0.403 0.403 475.72 0.018 0.341 64 0.823 0.823 924.38 0.036 0.69415 0.243 0.243 291.56 0.011 0.206 65 1.500 1.874 1237.28 0.066 1.20816 0.234 0.234 281.22 0.010 0.198 66 1.342 1.201 1199.97 0.059 1.09617 0.455 0.455 534.13 0.020 0.384 67 0.973 0.973 1039.37 0.043 0.81618 0.185 0.185 224.59 0.008 0.157 68 1.381 1.927 1211.53 0.061 1.12519 0.499 0.499 584.26 0.022 0.421 69 1.243 1.441 1170.13 0.055 1.02320 0.283 0.283 337.97 0.013 0.239 70 1.311 1.517 1190.75 0.058 1.07321 0.809 0.809 912.45 0.036 0.682 71 0.955 0.955 1025.67 0.042 0.80222 0.526 0.526 614.49 0.023 0.444 72 0.702 0.702 810.67 0.031 0.59123 0.696 0.696 803.93 0.031 0.586 73 1.298 1.363 1186.96 0.058 1.06424 0.419 0.419 493.32 0.019 0.354 74 1.408 1.949 1219.20 0.062 1.14525 0.431 0.431 507.09 0.019 0.364 75 1.282 1.260 1181.91 0.057 1.05126 0.615 0.615 713.77 0.027 0.518 76 1.122 1.183 1128.29 0.050 0.93127 0.706 0.706 815.37 0.031 0.595 77 0.885 0.885 972.60 0.039 0.74528 0.652 0.652 755.04 0.029 0.549 78 1.793 1.692 1275.67 0.079 1.40029 0.460 0.460 539.51 0.020 0.388 79 1.034 1.033 1082.07 0.046 0.86530 0.616 0.616 715.85 0.027 0.520 80 1.373 1.465 1209.22 0.061 1.11931 0.552 0.552 643.74 0.024 0.466 81 1.453 1.405 1228.97 0.064 1.17732 0.663 0.663 768.00 0.029 0.559 82 1.110 1.100 1122.23 0.049 0.92233 0.730 0.730 839.66 0.032 0.615 83 1.590 2.048 1248.23 0.070 1.26734 0.590 0.590 686.37 0.026 0.498 84 1.689 1.619 1259.68 0.075 1.33035 0.471 0.471 552.94 0.021 0.398 85 1.842 2.221 1281.86 0.082 1.43236 0.888 0.888 975.28 0.039 0.748 86 1.112 1.096 1123.55 0.049 0.92437 0.543 0.543 634.09 0.024 0.458 87 0.924 0.924 1002.70 0.041 0.77738 0.948 0.948 1020.38 0.042 0.796 88 1.099 1.171 1116.93 0.049 0.91439 1.214 1.832 1161.20 0.054 1.001 89 2.052 1.738 1310.70 0.091 1.57140 0.702 0.702 810.69 0.031 0.591 90 1.602 2.082 1248.96 0.071 1.27441 0.585 0.585 680.99 0.026 0.493 91 1.099 1.093 1117.03 0.049 0.91442 0.707 0.707 816.66 0.031 0.596 92 1.655 1.761 1255.24 0.073 1.30843 0.515 0.515 602.18 0.023 0.434 93 1.621 1.464 1250.70 0.072 1.28644 0.881 0.881 969.57 0.039 0.742 94 2.028 2.639 1306.90 0.090 1.55445 0.605 0.605 703.27 0.027 0.510 95 1.603 1.485 1249.02 0.071 1.27546 0.982 0.982 1046.00 0.044 0.824 96 1.864 1.761 1284.48 0.083 1.44647 0.863 0.863 955.88 0.038 0.727 97 2.066 2.847 1312.85 0.092 1.58048 1.132 1.154 1132.75 0.050 0.938 98 1.761 1.587 1270.71 0.078 1.37949 0.973 0.973 1039.54 0.043 0.817 99 1.934 1.576 1293.85 0.086 1.49250 0.689 0.689 796.77 0.031 0.581 100 3.282 4.259 1338.95 0.145 2.461
EQ EQ75%Vy75%Vy
V : Maximum Base Shear Δ : Maximum Roof Displacement MIDR : Maximum Inter-Story Drift Ratio NC : Not Considered
108

Table A.3.9 Results of SDOF Analyses of Frame ‘F3S2B’
(MULTI Idealization Method)
μ MULTI RMULTI V (kN) Δ (m) MIDR (%) μ MULTI RMULTI V (kN) Δ (m) MIDR
(%)1 0.037 0.037 44.69 0.002 0.029 51 1.432 1.447 1102.83 0.085 1.1622 0.038 0.038 45.68 0.002 0.030 52 1.696 1.638 1171.90 0.100 1.3513 0.122 0.122 129.02 0.007 0.097 53 0.854 0.914 813.10 0.051 0.7014 0.096 0.096 102.19 0.006 0.076 54 1.525 1.530 1129.05 0.090 1.2295 0.103 0.103 109.55 0.006 0.081 55 0.997 1.261 899.94 0.059 0.8206 0.311 0.314 313.23 0.018 0.253 56 2.071 2.311 1229.08 0.123 1.6017 0.359 0.376 358.68 0.021 0.292 57 0.933 0.950 861.51 0.055 0.7668 0.439 0.473 434.97 0.026 0.358 58 1.747 2.329 1182.26 0.103 1.3869 0.497 0.579 490.69 0.029 0.407 59 1.191 1.057 1008.18 0.070 0.978
10 0.474 0.485 468.64 0.028 0.387 60 0.711 0.708 691.55 0.042 0.58311 0.366 0.373 365.19 0.022 0.298 61 0.881 0.919 829.43 0.052 0.72312 0.390 0.413 388.47 0.023 0.318 62 1.380 1.877 1087.12 0.082 1.12513 0.445 0.416 441.00 0.026 0.363 63 1.368 1.879 1083.04 0.081 1.11614 0.950 1.066 871.79 0.056 0.780 64 1.038 1.041 923.40 0.061 0.85315 0.248 0.255 252.20 0.015 0.201 65 1.446 1.669 1106.79 0.086 1.17216 0.512 0.543 504.72 0.030 0.419 66 1.824 2.671 1195.93 0.108 1.43817 0.690 0.687 671.93 0.041 0.565 67 1.565 1.712 1140.13 0.093 1.25818 0.409 0.418 407.10 0.024 0.334 68 1.508 1.278 1124.39 0.089 1.21719 0.819 0.813 788.81 0.048 0.671 69 1.699 2.377 1172.36 0.101 1.35220 0.787 0.788 761.93 0.047 0.645 70 1.652 1.659 1162.03 0.098 1.32021 0.991 1.313 896.22 0.059 0.814 71 1.299 1.441 1057.72 0.077 1.06422 0.831 0.841 797.54 0.049 0.681 72 1.060 0.972 936.01 0.063 0.87123 0.419 0.410 416.24 0.025 0.342 73 1.712 1.575 1175.19 0.101 1.36124 0.388 0.413 386.85 0.023 0.317 74 2.118 3.137 1235.86 0.125 1.63325 0.519 0.548 511.55 0.031 0.425 75 2.187 2.441 1247.26 0.129 1.67926 1.387 1.375 1089.40 0.082 1.130 76 1.262 1.525 1042.46 0.075 1.03527 0.906 0.880 845.17 0.054 0.744 77 1.122 0.999 971.09 0.066 0.92228 0.736 0.711 714.36 0.044 0.603 78 2.560 2.544 1302.14 0.152 1.92829 0.875 0.865 825.90 0.052 0.718 79 2.042 1.908 1225.14 0.121 1.58230 0.345 0.349 345.13 0.020 0.281 80 4.056 2.779 1311.13 0.240 2.94131 0.755 0.752 731.86 0.045 0.618 81 2.344 2.586 1270.43 0.139 1.78532 1.208 1.144 1017.09 0.072 0.993 82 2.728 2.275 1324.83 0.161 2.04333 0.960 0.975 877.90 0.057 0.789 83 3.746 1.984 1314.61 0.222 2.73434 0.668 0.696 650.99 0.040 0.547 84 1.717 2.221 1176.22 0.102 1.36535 0.863 0.943 818.21 0.051 0.708 85 2.735 3.044 1325.37 0.162 2.04736 1.111 1.303 964.79 0.066 0.913 86 1.345 1.397 1074.99 0.080 1.09837 0.828 0.789 795.48 0.049 0.679 87 2.434 2.727 1283.33 0.144 1.84438 0.827 0.901 794.67 0.049 0.678 88 3.091 2.249 1337.61 0.183 2.28939 0.794 0.841 767.99 0.047 0.651 89 2.793 2.908 1329.63 0.165 2.08740 1.249 1.225 1036.58 0.074 1.025 90 2.227 2.294 1253.50 0.132 1.70641 1.245 1.310 1035.09 0.074 1.022 91 2.935 2.645 1336.19 0.174 2.18342 1.398 2.257 1092.63 0.083 1.137 92 1.948 2.727 1212.43 0.115 1.52043 1.230 1.105 1027.72 0.073 1.010 93 2.729 2.141 1324.88 0.162 2.04344 0.920 0.939 853.49 0.054 0.755 94 4.155 3.039 1307.49 0.246 3.00945 0.793 0.750 767.20 0.047 0.650 95 2.152 1.903 1241.42 0.127 1.65546 1.000 1.006 901.78 0.059 0.822 96 2.619 2.666 1311.85 0.155 1.96847 0.697 0.745 678.33 0.041 0.571 97 2.751 3.058 1326.58 0.163 2.05848 1.274 1.116 1047.35 0.075 1.044 98 3.011 3.235 1338.05 0.178 2.23549 1.284 1.308 1051.73 0.076 1.052 99 4.092 2.809 1312.83 0.242 2.96750 1.101 1.011 958.86 0.065 0.905 100 5.192 4.510 1280.53 0.307 3.712
EQ EQMULTIMULTI
V : Maximum Base Shear Δ : Maximum Roof Displacement MIDR : Maximum Inter-Story Drift Ratio NC : Not Considered
109

Table A.3.10 Results of SDOF Analyses of Frame ‘F3S2B’
(ATC Idealization Method)
μ ATC RATC V (kN) Δ (m) MIDR (%) μ ATC RATC V (kN) Δ (m) MIDR
(%)1 0.037 0.037 44.69 0.002 0.029 51 1.582 1.447 1144.51 0.094 1.2702 0.038 0.038 45.68 0.002 0.030 52 1.458 1.638 1110.51 0.086 1.1813 0.122 0.122 129.02 0.007 0.097 53 0.914 0.914 850.02 0.054 0.7504 0.096 0.096 102.19 0.006 0.076 54 1.645 1.530 1160.35 0.097 1.3155 0.103 0.103 109.55 0.006 0.081 55 1.221 1.261 1023.59 0.072 1.0036 0.314 0.314 315.85 0.019 0.255 56 2.038 2.311 1224.47 0.121 1.5797 0.376 0.376 375.36 0.022 0.307 57 0.950 0.950 871.92 0.056 0.7808 0.473 0.473 467.19 0.028 0.386 58 1.853 2.329 1201.05 0.110 1.4589 0.579 0.579 567.64 0.034 0.474 59 1.060 1.057 935.73 0.063 0.871
10 0.485 0.485 479.10 0.029 0.397 60 0.708 0.708 688.62 0.042 0.58011 0.373 0.373 372.20 0.022 0.304 61 0.919 0.919 852.92 0.054 0.75412 0.413 0.413 410.29 0.024 0.337 62 1.551 1.877 1136.25 0.092 1.24813 0.416 0.416 413.63 0.025 0.340 63 1.457 1.879 1110.14 0.086 1.18014 1.069 1.066 941.09 0.063 0.879 64 1.042 1.041 925.78 0.062 0.85715 0.255 0.255 259.48 0.015 0.207 65 1.644 1.668 1160.12 0.097 1.31416 0.543 0.543 534.09 0.032 0.444 66 1.610 2.671 1151.84 0.095 1.29017 0.687 0.687 669.21 0.041 0.563 67 1.548 1.712 1135.38 0.092 1.24618 0.418 0.418 415.16 0.025 0.341 68 1.298 1.278 1057.22 0.077 1.06319 0.813 0.813 783.52 0.048 0.666 69 1.723 2.377 1177.61 0.102 1.36920 0.788 0.788 762.23 0.047 0.645 70 1.720 1.659 1177.01 0.102 1.36721 1.213 1.313 1019.56 0.072 0.997 71 1.265 1.441 1043.42 0.075 1.03722 0.841 0.841 804.20 0.050 0.689 72 0.972 0.972 885.08 0.058 0.79923 0.410 0.410 407.98 0.024 0.335 73 1.519 1.575 1127.31 0.090 1.22524 0.413 0.413 410.50 0.024 0.337 74 1.691 3.137 1170.82 0.100 1.34725 0.548 0.548 538.58 0.032 0.448 75 2.269 2.441 1259.55 0.134 1.73426 1.459 1.375 1110.61 0.086 1.182 76 1.652 1.525 1161.98 0.098 1.32027 0.880 0.880 828.86 0.052 0.722 77 0.999 0.999 900.97 0.059 0.82128 0.711 0.711 690.86 0.042 0.582 78 2.789 2.544 1329.34 0.165 2.08429 0.865 0.865 819.38 0.051 0.709 79 1.683 1.908 1168.98 0.100 1.34130 0.349 0.349 349.20 0.021 0.284 80 3.902 2.779 1312.38 0.231 2.83831 0.752 0.752 729.49 0.045 0.616 81 2.163 2.586 1243.31 0.128 1.66332 1.115 1.144 966.75 0.066 0.916 82 2.931 2.276 1336.08 0.174 2.18133 0.975 0.975 886.73 0.058 0.801 83 3.391 1.984 1321.33 0.201 2.49134 0.696 0.696 676.97 0.041 0.570 84 1.668 2.221 1165.76 0.099 1.33135 0.943 0.943 867.86 0.056 0.775 85 2.404 3.044 1279.05 0.142 1.82436 1.277 1.303 1048.74 0.076 1.047 86 1.456 1.397 1109.85 0.086 1.18037 0.789 0.789 763.16 0.047 0.646 87 2.189 2.727 1247.52 0.130 1.68138 0.901 0.901 842.24 0.053 0.740 88 2.906 2.249 1335.12 0.172 2.16339 0.841 0.841 804.41 0.050 0.690 89 2.478 2.908 1289.54 0.147 1.87440 1.231 1.225 1028.52 0.073 1.011 90 2.120 2.294 1236.14 0.125 1.63441 1.232 1.310 1028.98 0.073 1.012 91 2.813 2.645 1330.81 0.167 2.10042 1.432 2.257 1102.65 0.085 1.162 92 2.129 2.727 1237.62 0.126 1.64043 1.116 1.105 967.63 0.066 0.917 93 2.942 2.141 1336.46 0.174 2.18844 0.939 0.939 865.48 0.056 0.771 94 3.954 3.039 1311.82 0.234 2.87245 0.750 0.750 727.97 0.044 0.615 95 1.956 1.903 1213.30 0.116 1.52546 1.006 1.006 905.35 0.060 0.827 96 2.758 2.666 1327.11 0.163 2.06347 0.745 0.745 723.08 0.044 0.610 97 2.604 3.058 1309.44 0.154 1.95848 1.127 1.116 973.86 0.067 0.927 98 2.938 3.235 1336.31 0.174 2.18549 1.269 1.308 1045.42 0.075 1.041 99 3.875 2.809 1312.57 0.229 2.82050 1.011 1.011 907.90 0.060 0.831 100 4.732 4.510 1293.67 0.280 3.399
EQ EQATCATC
V : Maximum Base Shear Δ : Maximum Roof Displacement MIDR : Maximum Inter-Story Drift Ratio NC : Not Considered
110

Table A.3.11 Results of SDOF Analyses of Frame ‘F3S2B’
(FEMA Idealization Method)
μ FEMA RFEMA V (kN) Δ (m) MIDR (%) μ FEMA RFEMA V (kN) Δ (m) MIDR
(%)1 0.035 0.035 45.83 0.002 0.030 51 1.367 1.316 1124.58 0.089 1.2182 0.037 0.037 47.92 0.002 0.032 52 1.440 1.576 1146.51 0.094 1.2753 0.127 0.127 147.11 0.008 0.112 53 0.811 0.811 838.36 0.053 0.7354 0.087 0.087 102.48 0.006 0.076 54 1.488 1.378 1159.73 0.097 1.3135 0.098 0.098 115.67 0.006 0.086 55 1.182 1.197 1059.62 0.077 1.0686 0.237 0.237 264.98 0.015 0.212 56 1.965 2.245 1244.14 0.128 1.6677 0.339 0.339 373.72 0.022 0.305 57 0.921 0.921 911.46 0.060 0.8368 0.379 0.379 415.17 0.025 0.341 58 1.893 2.388 1231.60 0.124 1.6139 0.493 0.493 534.31 0.032 0.445 59 1.028 1.028 978.16 0.067 0.933
10 0.460 0.460 499.88 0.030 0.415 60 0.654 0.654 701.29 0.043 0.59111 0.317 0.317 349.97 0.021 0.285 61 0.905 0.905 900.71 0.059 0.82112 0.344 0.344 378.91 0.022 0.310 62 1.606 1.828 1186.91 0.105 1.40313 0.432 0.432 471.01 0.028 0.389 63 1.329 1.725 1113.02 0.087 1.18814 0.955 0.955 932.69 0.062 0.867 64 0.967 0.967 939.96 0.063 0.87715 0.228 0.228 256.00 0.015 0.204 65 1.447 1.410 1148.50 0.095 1.28116 0.503 0.503 545.47 0.033 0.454 66 1.494 2.355 1161.13 0.098 1.31717 0.709 0.709 757.53 0.046 0.641 67 1.487 1.679 1159.36 0.097 1.31218 0.427 0.427 465.88 0.028 0.385 68 1.254 1.380 1088.29 0.082 1.12719 0.797 0.797 828.62 0.052 0.722 69 1.667 2.248 1198.67 0.109 1.44820 0.723 0.723 771.40 0.047 0.654 70 1.674 1.497 1199.97 0.109 1.45421 1.048 1.047 990.53 0.068 0.951 71 1.279 1.278 1096.76 0.084 1.14722 0.795 0.795 827.15 0.052 0.720 72 0.985 0.985 951.11 0.064 0.89323 0.393 0.393 430.48 0.026 0.354 73 1.543 1.603 1173.22 0.101 1.35524 0.352 0.352 387.33 0.023 0.317 74 1.635 2.897 1192.52 0.107 1.42525 0.523 0.523 565.75 0.034 0.472 75 2.125 2.390 1270.45 0.139 1.78526 1.345 1.294 1117.85 0.088 1.200 76 1.317 1.326 1109.21 0.086 1.17827 0.881 0.881 885.34 0.058 0.799 77 0.862 0.862 872.93 0.056 0.78228 0.679 0.679 727.01 0.044 0.614 78 2.601 2.579 1333.68 0.170 2.14029 0.830 0.830 851.41 0.054 0.752 79 1.689 1.945 1202.56 0.110 1.46530 0.309 0.309 342.21 0.020 0.278 80 3.551 2.667 1312.23 0.232 2.84931 0.708 0.708 756.71 0.046 0.640 81 2.065 2.412 1260.98 0.135 1.74132 1.147 1.219 1043.81 0.075 1.038 82 2.385 2.317 1314.04 0.156 1.97733 0.892 0.892 892.25 0.058 0.809 83 3.126 1.950 1318.89 0.204 2.53334 0.649 0.649 696.52 0.042 0.587 84 1.570 2.066 1179.61 0.103 1.37635 0.927 0.927 915.23 0.061 0.841 85 2.349 2.750 1307.41 0.153 1.95036 1.242 1.219 1083.75 0.081 1.117 86 1.391 1.394 1131.78 0.091 1.23637 0.784 0.784 819.52 0.051 0.709 87 2.090 2.767 1265.01 0.137 1.75938 0.851 0.851 865.25 0.056 0.771 88 2.819 2.266 1336.86 0.184 2.30239 0.735 0.735 782.33 0.048 0.665 89 2.487 2.213 1326.08 0.162 2.05440 1.237 1.207 1081.86 0.081 1.113 90 2.037 2.318 1256.56 0.133 1.72041 1.253 1.261 1088.12 0.082 1.127 91 2.692 2.610 1337.41 0.176 2.20842 1.367 1.822 1124.43 0.089 1.217 92 2.114 2.799 1268.81 0.138 1.77743 1.130 1.117 1035.98 0.074 1.024 93 2.475 2.073 1325.08 0.162 2.04544 0.899 0.899 896.80 0.059 0.815 94 3.558 2.837 1312.14 0.232 2.85445 0.764 0.764 806.17 0.050 0.692 95 1.866 1.865 1227.51 0.122 1.59446 0.936 0.936 920.74 0.061 0.849 96 2.672 2.634 1336.70 0.175 2.19347 0.679 0.679 726.99 0.044 0.614 97 2.485 3.109 1325.94 0.162 2.05248 1.211 1.188 1071.82 0.079 1.092 98 2.880 3.221 1330.28 0.188 2.34649 1.269 1.305 1093.30 0.083 1.139 99 3.650 2.620 1311.56 0.238 2.92250 1.000 1.000 960.52 0.065 0.907 100 4.387 4.119 1292.05 0.287 3.473
EQ EQFEMAFEMA
V : Maximum Base Shear Δ : Maximum Roof Displacement MIDR : Maximum Inter-Story Drift Ratio NC : Not Considered
111

Table A.3.12 Results of SDOF Analyses of Frame ‘F3S2B’
(75%Vy Idealization Method)
μ 75%Vy R75%Vy V (kN) Δ (m) MIDR (%) μ 75%Vy R75%Vy V (kN) Δ (m) MIDR
(%)1 0.031 0.031 44.33 0.002 0.029 51 1.228 1.240 1107.01 0.086 1.1732 0.035 0.035 49.13 0.002 0.033 52 1.387 1.592 1157.73 0.097 1.3073 0.129 0.129 159.43 0.009 0.122 53 0.741 0.741 824.52 0.052 0.7164 0.081 0.081 101.98 0.006 0.076 54 1.347 1.284 1145.79 0.094 1.2735 0.094 0.094 118.52 0.007 0.089 55 1.077 1.125 1045.31 0.075 1.0416 0.193 0.193 232.36 0.013 0.184 56 1.927 2.153 1259.65 0.134 1.7347 0.322 0.322 378.43 0.022 0.309 57 0.883 0.883 924.55 0.062 0.8558 0.327 0.327 383.92 0.023 0.314 58 1.768 2.351 1230.81 0.123 1.6099 0.464 0.464 537.17 0.032 0.447 59 1.016 1.016 1011.45 0.071 0.984
10 0.422 0.422 490.75 0.029 0.407 60 0.634 0.634 724.47 0.044 0.61211 0.266 0.266 314.64 0.019 0.254 61 0.843 0.843 897.31 0.059 0.81612 0.349 0.349 408.86 0.024 0.336 62 1.588 1.687 1203.67 0.111 1.47013 0.448 0.448 519.27 0.031 0.431 63 1.215 1.572 1102.50 0.085 1.16214 0.836 0.836 892.80 0.058 0.810 64 0.986 0.986 993.35 0.069 0.95515 0.215 0.215 257.42 0.015 0.205 65 1.318 1.286 1136.63 0.092 1.24916 0.475 0.475 549.74 0.033 0.458 66 1.491 2.131 1183.98 0.104 1.39217 0.738 0.738 822.75 0.051 0.714 67 1.439 1.659 1171.64 0.100 1.35018 0.434 0.434 503.67 0.030 0.418 68 1.257 1.439 1116.66 0.088 1.19719 0.797 0.797 865.01 0.056 0.771 69 1.602 2.085 1205.81 0.112 1.48020 0.701 0.701 794.17 0.049 0.677 70 1.573 1.445 1201.01 0.110 1.45821 0.980 0.980 989.04 0.068 0.949 71 1.208 1.189 1100.04 0.084 1.15622 0.813 0.813 876.74 0.057 0.787 72 0.986 0.986 993.11 0.069 0.95523 0.398 0.398 463.43 0.028 0.383 73 1.568 1.606 1200.04 0.109 1.45424 0.317 0.317 372.16 0.022 0.304 74 1.633 2.675 1209.88 0.114 1.50425 0.514 0.514 592.58 0.036 0.496 75 2.035 2.338 1278.08 0.142 1.82026 1.257 1.227 1116.74 0.088 1.197 76 1.140 1.201 1074.28 0.079 1.09727 0.921 0.921 949.83 0.064 0.892 77 0.867 0.867 913.95 0.060 0.84028 0.658 0.658 751.24 0.046 0.635 78 2.461 2.529 1334.84 0.172 2.15929 0.799 0.799 866.66 0.056 0.773 79 1.691 1.961 1217.90 0.118 1.54930 0.284 0.284 336.03 0.020 0.273 80 3.376 2.621 1311.82 0.235 2.88831 0.687 0.687 781.11 0.048 0.664 81 2.015 2.267 1274.58 0.140 1.80432 1.088 1.202 1050.40 0.076 1.050 82 2.180 2.242 1303.56 0.152 1.93433 0.835 0.835 892.22 0.058 0.809 83 2.980 1.920 1318.57 0.208 2.57534 0.648 0.648 740.13 0.045 0.626 84 1.514 1.961 1188.76 0.106 1.41035 0.828 0.828 887.01 0.058 0.801 85 2.281 2.537 1321.00 0.159 2.01536 1.171 1.158 1086.68 0.082 1.124 86 1.322 1.310 1137.82 0.092 1.25237 0.768 0.768 844.56 0.054 0.743 87 2.058 2.779 1281.91 0.144 1.83838 0.787 0.787 857.85 0.055 0.761 88 2.757 2.280 1327.85 0.192 2.39339 0.755 0.755 834.95 0.053 0.730 89 2.488 2.180 1336.04 0.173 2.18040 1.205 1.180 1098.99 0.084 1.153 90 1.979 2.306 1268.41 0.138 1.77541 1.317 1.233 1136.20 0.092 1.248 91 2.599 2.582 1338.06 0.181 2.26942 1.290 1.793 1127.52 0.090 1.225 92 2.064 2.799 1282.99 0.144 1.84343 1.129 1.118 1069.72 0.079 1.088 93 2.195 2.031 1306.35 0.153 1.94644 0.909 0.909 941.94 0.063 0.880 94 3.312 2.793 1312.39 0.231 2.83745 0.779 0.779 852.39 0.054 0.754 95 1.830 1.835 1242.11 0.128 1.65846 0.908 0.908 941.66 0.063 0.880 96 2.602 2.503 1338.04 0.181 2.27147 0.709 0.709 800.24 0.049 0.685 97 2.536 3.210 1337.84 0.177 2.21948 1.241 1.213 1111.71 0.087 1.184 98 2.844 3.094 1323.36 0.198 2.46349 1.242 1.287 1111.90 0.087 1.185 99 3.542 2.511 1306.49 0.247 3.02250 0.988 0.988 994.21 0.069 0.956 100 4.190 3.960 1289.48 0.292 3.538
EQ EQ75%Vy75%Vy
V : Maximum Base Shear Δ : Maximum Roof Displacement MIDR : Maximum Inter-Story Drift Ratio NC : Not Considered
112
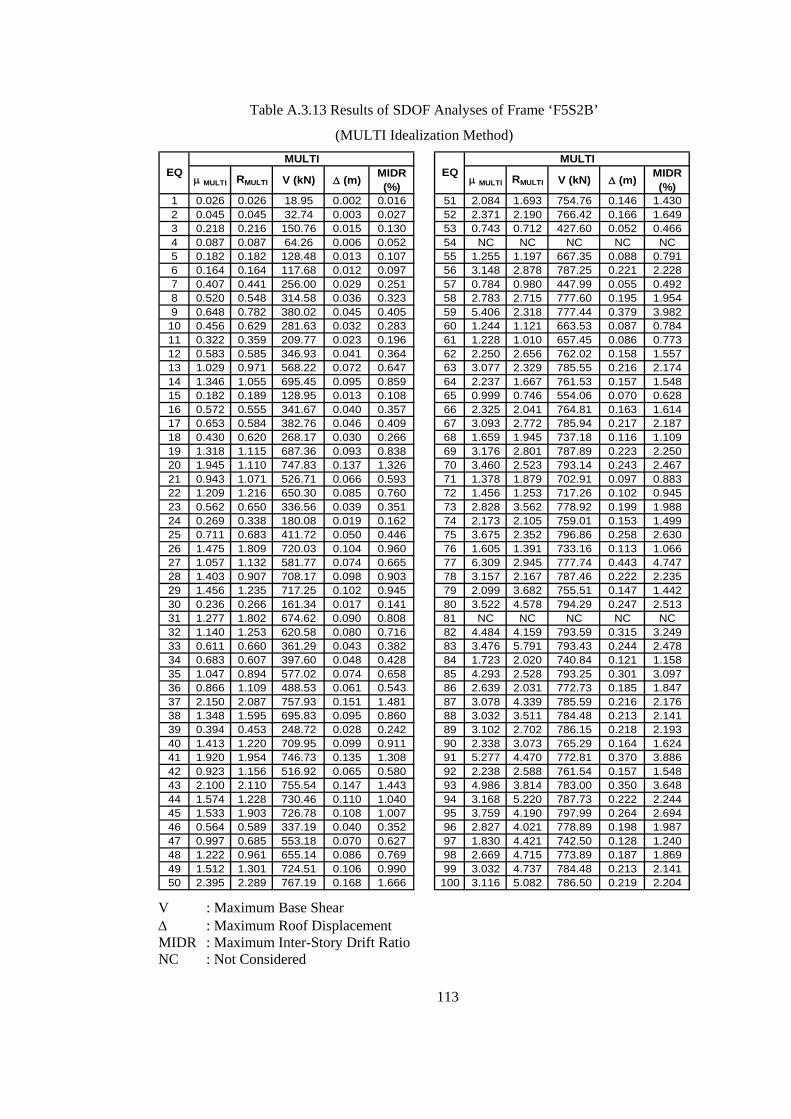
Table A.3.13 Results of SDOF Analyses of Frame ‘F5S2B’
(MULTI Idealization Method)
μ MULTI RMULTI V (kN) Δ (m) MIDR (%) μ MULTI RMULTI V (kN) Δ (m) MIDR
(%)1 0.026 0.026 18.95 0.002 0.016 51 2.084 1.693 754.76 0.146 1.4302 0.045 0.045 32.74 0.003 0.027 52 2.371 2.190 766.42 0.166 1.6493 0.218 0.216 150.76 0.015 0.130 53 0.743 0.712 427.60 0.052 0.4664 0.087 0.087 64.26 0.006 0.052 54 NC NC NC NC NC5 0.182 0.182 128.48 0.013 0.107 55 1.255 1.197 667.35 0.088 0.7916 0.164 0.164 117.68 0.012 0.097 56 3.148 2.878 787.25 0.221 2.2287 0.407 0.441 256.00 0.029 0.251 57 0.784 0.980 447.99 0.055 0.4928 0.520 0.548 314.58 0.036 0.323 58 2.783 2.715 777.60 0.195 1.9549 0.648 0.782 380.02 0.045 0.405 59 5.406 2.318 777.44 0.379 3.982
10 0.456 0.629 281.63 0.032 0.283 60 1.244 1.121 663.53 0.087 0.78411 0.322 0.359 209.77 0.023 0.196 61 1.228 1.010 657.45 0.086 0.77312 0.583 0.585 346.93 0.041 0.364 62 2.250 2.656 762.02 0.158 1.55713 1.029 0.971 568.22 0.072 0.647 63 3.077 2.329 785.55 0.216 2.17414 1.346 1.055 695.45 0.095 0.859 64 2.237 1.667 761.53 0.157 1.54815 0.182 0.189 128.95 0.013 0.108 65 0.999 0.746 554.06 0.070 0.62816 0.572 0.555 341.67 0.040 0.357 66 2.325 2.041 764.81 0.163 1.61417 0.653 0.584 382.76 0.046 0.409 67 3.093 2.772 785.94 0.217 2.18718 0.430 0.620 268.17 0.030 0.266 68 1.659 1.945 737.18 0.116 1.10919 1.318 1.115 687.36 0.093 0.838 69 3.176 2.801 787.89 0.223 2.25020 1.945 1.110 747.83 0.137 1.326 70 3.460 2.523 793.14 0.243 2.46721 0.943 1.071 526.71 0.066 0.593 71 1.378 1.879 702.91 0.097 0.88322 1.209 1.216 650.30 0.085 0.760 72 1.456 1.253 717.26 0.102 0.94523 0.562 0.650 336.56 0.039 0.351 73 2.828 3.562 778.92 0.199 1.98824 0.269 0.338 180.08 0.019 0.162 74 2.173 2.105 759.01 0.153 1.49925 0.711 0.683 411.72 0.050 0.446 75 3.675 2.352 796.86 0.258 2.63026 1.475 1.809 720.03 0.104 0.960 76 1.605 1.391 733.16 0.113 1.06627 1.057 1.132 581.77 0.074 0.665 77 6.309 2.945 777.74 0.443 4.74728 1.403 0.907 708.17 0.098 0.903 78 3.157 2.167 787.46 0.222 2.23529 1.456 1.235 717.25 0.102 0.945 79 2.099 3.682 755.51 0.147 1.44230 0.236 0.266 161.34 0.017 0.141 80 3.522 4.578 794.29 0.247 2.51331 1.277 1.802 674.62 0.090 0.808 81 NC NC NC NC NC32 1.140 1.253 620.58 0.080 0.716 82 4.484 4.159 793.59 0.315 3.24933 0.611 0.660 361.29 0.043 0.382 83 3.476 5.791 793.43 0.244 2.47834 0.683 0.607 397.60 0.048 0.428 84 1.723 2.020 740.84 0.121 1.15835 1.047 0.894 577.02 0.074 0.658 85 4.293 2.528 793.25 0.301 3.09736 0.866 1.109 488.53 0.061 0.543 86 2.639 2.031 772.73 0.185 1.84737 2.150 2.087 757.93 0.151 1.481 87 3.078 4.339 785.59 0.216 2.17638 1.348 1.595 695.83 0.095 0.860 88 3.032 3.511 784.48 0.213 2.14139 0.394 0.453 248.72 0.028 0.242 89 3.102 2.702 786.15 0.218 2.19340 1.413 1.220 709.95 0.099 0.911 90 2.338 3.073 765.29 0.164 1.62441 1.920 1.954 746.73 0.135 1.308 91 5.277 4.470 772.81 0.370 3.88642 0.923 1.156 516.92 0.065 0.580 92 2.238 2.588 761.54 0.157 1.54843 2.100 2.110 755.54 0.147 1.443 93 4.986 3.814 783.00 0.350 3.64844 1.574 1.228 730.46 0.110 1.040 94 3.168 5.220 787.73 0.222 2.24445 1.533 1.903 726.78 0.108 1.007 95 3.759 4.190 797.99 0.264 2.69446 0.564 0.589 337.19 0.040 0.352 96 2.827 4.021 778.89 0.198 1.98747 0.997 0.685 553.18 0.070 0.627 97 1.830 4.421 742.50 0.128 1.24048 1.222 0.961 655.14 0.086 0.769 98 2.669 4.715 773.89 0.187 1.86949 1.512 1.301 724.51 0.106 0.990 99 3.032 4.737 784.48 0.213 2.14150 2.395 2.289 767.19 0.168 1.666 100 3.116 5.082 786.50 0.219 2.204
EQ EQMULTIMULTI
V : Maximum Base Shear Δ : Maximum Roof Displacement MIDR : Maximum Inter-Story Drift Ratio NC : Not Considered
113

Table A.3.14 Results of SDOF Analyses of Frame ‘F5S2B’
(ATC Idealization Method)
μ ATC RATC V (kN) Δ (m) MIDR (%) μ ATC RATC V (kN) Δ (m) MIDR
(%)1 0.026 0.026 18.94 0.002 0.016 51 1.865 1.693 744.07 0.131 1.2662 0.045 0.045 32.72 0.003 0.027 52 2.296 2.191 763.74 0.161 1.5923 0.216 0.216 149.25 0.015 0.128 53 0.712 0.712 412.24 0.050 0.4464 0.087 0.087 64.28 0.006 0.052 54 NC NC NC NC NC5 0.183 0.183 129.08 0.013 0.108 55 1.148 1.197 624.17 0.081 0.7216 0.164 0.164 117.71 0.012 0.097 56 2.755 2.878 776.74 0.193 1.9337 0.442 0.442 274.02 0.031 0.273 57 0.980 0.980 544.88 0.069 0.6168 0.548 0.548 329.32 0.038 0.342 58 1.960 2.717 748.49 0.138 1.3379 0.782 0.782 447.22 0.055 0.491 59 4.662 2.318 788.79 0.327 3.391
10 0.630 0.630 370.77 0.044 0.394 60 1.173 1.121 635.70 0.082 0.73711 0.359 0.359 230.15 0.025 0.220 61 1.011 1.011 559.63 0.071 0.63512 0.585 0.585 348.35 0.041 0.366 62 2.948 2.657 782.30 0.207 2.07813 0.971 0.971 540.23 0.068 0.610 63 3.422 2.328 792.41 0.240 2.43814 1.058 1.055 581.79 0.074 0.665 64 2.032 1.667 752.10 0.143 1.39115 0.189 0.189 133.26 0.013 0.112 65 0.746 0.746 429.09 0.052 0.46816 0.555 0.555 332.57 0.039 0.346 66 2.580 2.043 770.45 0.181 1.80317 0.584 0.584 347.69 0.041 0.365 67 3.183 2.773 788.05 0.223 2.25518 0.621 0.621 366.45 0.044 0.388 68 1.759 1.946 741.72 0.124 1.18619 1.119 1.114 610.95 0.079 0.703 69 3.572 2.803 795.17 0.251 2.55220 1.114 1.110 608.46 0.078 0.700 70 2.722 2.523 775.73 0.191 1.90921 1.051 1.071 578.84 0.074 0.661 71 1.964 1.880 748.68 0.138 1.34022 1.246 1.216 664.32 0.088 0.786 72 1.287 1.253 677.69 0.090 0.81523 0.650 0.650 380.97 0.046 0.407 73 2.329 3.562 764.96 0.164 1.61724 0.339 0.339 218.99 0.024 0.207 74 2.629 2.105 772.38 0.185 1.84025 0.683 0.683 397.79 0.048 0.428 75 4.593 2.353 789.50 0.322 3.33626 1.395 1.809 706.73 0.098 0.897 76 1.315 1.391 686.36 0.092 0.83627 1.142 1.132 621.42 0.080 0.717 77 6.756 2.945 786.89 0.474 5.12328 0.907 0.907 508.99 0.064 0.570 78 3.529 2.166 794.42 0.248 2.51929 1.340 1.236 693.84 0.094 0.855 79 2.258 3.683 762.34 0.159 1.56330 0.266 0.266 178.37 0.019 0.160 80 3.391 4.581 791.81 0.238 2.41431 1.668 1.802 737.76 0.117 1.116 81 NC NC NC NC NC32 1.300 1.253 681.87 0.091 0.825 82 3.502 4.163 793.92 0.246 2.49833 0.660 0.660 386.22 0.046 0.413 83 3.888 5.792 795.29 0.273 2.79234 0.607 0.607 359.45 0.043 0.380 84 1.675 2.022 738.20 0.118 1.12135 0.894 0.894 502.47 0.063 0.561 85 4.153 2.530 800.15 0.292 2.99036 1.116 1.109 609.59 0.078 0.701 86 2.202 2.030 760.34 0.155 1.52137 2.286 2.088 763.37 0.160 1.584 87 2.769 4.340 777.19 0.194 1.94438 1.362 1.595 699.08 0.096 0.871 88 2.885 3.512 780.56 0.203 2.03139 0.453 0.453 280.00 0.032 0.280 89 3.082 2.701 785.67 0.216 2.17840 1.123 1.220 612.85 0.079 0.706 90 2.628 3.075 772.35 0.185 1.83941 1.724 1.953 740.87 0.121 1.159 91 5.477 4.470 777.91 0.384 4.03542 1.167 1.157 633.12 0.082 0.733 92 2.011 2.588 750.99 0.141 1.37543 1.745 2.111 741.79 0.123 1.175 93 5.252 3.813 779.52 0.369 3.86144 1.464 1.227 718.52 0.103 0.951 94 4.153 5.219 800.15 0.292 2.99045 1.666 1.903 737.65 0.117 1.114 95 3.402 4.192 792.03 0.239 2.42346 0.589 0.589 350.16 0.041 0.368 96 2.495 4.021 770.21 0.175 1.74147 0.685 0.685 398.88 0.048 0.429 97 2.442 4.426 768.65 0.171 1.70148 0.961 0.961 535.44 0.067 0.604 98 2.821 4.719 778.72 0.198 1.98349 1.293 1.301 679.52 0.091 0.819 99 2.853 4.737 779.66 0.200 2.00750 2.337 2.288 765.24 0.164 1.623 100 2.676 5.084 774.18 0.188 1.875
EQ EQATCATC
V : Maximum Base Shear Δ : Maximum Roof Displacement MIDR : Maximum Inter-Story Drift Ratio NC : Not Considered
114

Table A.3.15 Results of SDOF Analyses of Frame ‘F5S2B’
(FEMA Idealization Method)
μ FEMA RFEMA V (kN) Δ (m) MIDR (%) μ FEMA RFEMA V (kN) Δ (m) MIDR
(%)1 0.031 0.031 30.36 0.003 0.025 51 1.740 1.741 766.40 0.166 1.6482 0.051 0.051 51.48 0.005 0.042 52 1.761 1.954 767.36 0.168 1.6703 0.190 0.190 174.67 0.018 0.156 53 0.633 0.633 487.00 0.061 0.5414 0.060 0.060 60.29 0.006 0.049 54 NC NC NC NC NC5 0.154 0.154 145.65 0.015 0.125 55 1.066 1.064 716.77 0.102 0.9436 0.111 0.111 109.23 0.011 0.090 56 2.094 2.535 779.68 0.200 2.0087 0.405 0.405 331.13 0.039 0.344 57 0.822 0.822 611.52 0.079 0.7048 0.718 0.718 543.74 0.069 0.615 58 2.283 2.426 786.39 0.218 2.2019 0.448 0.448 360.90 0.043 0.381 59 4.187 2.329 778.69 0.401 4.208
10 0.350 0.350 292.51 0.033 0.296 60 1.162 1.151 731.28 0.111 1.04811 0.238 0.238 211.35 0.023 0.198 61 1.164 1.150 731.50 0.111 1.05012 0.583 0.583 452.99 0.056 0.498 62 1.831 2.042 770.20 0.175 1.74013 0.969 0.969 688.10 0.093 0.840 63 3.122 2.116 794.10 0.299 3.06714 1.142 1.126 728.91 0.109 1.026 64 1.606 1.424 759.70 0.154 1.51015 0.193 0.193 176.59 0.018 0.158 65 0.850 0.850 629.22 0.081 0.72816 0.432 0.432 350.16 0.041 0.368 66 1.881 1.723 770.11 0.180 1.79117 0.756 0.756 568.70 0.072 0.647 67 2.515 2.031 792.51 0.241 2.44218 0.334 0.334 281.33 0.032 0.282 68 1.440 1.500 748.62 0.138 1.33919 1.183 1.267 733.71 0.113 1.071 69 2.763 2.153 798.07 0.264 2.69920 1.327 1.253 741.53 0.127 1.223 70 2.538 2.337 793.10 0.243 2.46521 0.763 0.763 573.46 0.073 0.654 71 1.086 1.083 720.74 0.104 0.96422 0.971 0.971 688.66 0.093 0.841 72 1.160 1.300 731.02 0.111 1.04523 0.518 0.518 409.20 0.050 0.442 73 2.225 2.943 784.47 0.213 2.14124 0.337 0.337 282.94 0.032 0.284 74 2.197 2.084 783.50 0.210 2.11325 0.717 0.717 543.23 0.069 0.614 75 3.063 3.229 800.29 0.293 3.00626 1.341 1.346 742.38 0.128 1.237 76 1.277 1.570 741.59 0.122 1.17127 0.808 0.808 602.57 0.077 0.692 77 3.520 3.284 787.12 0.337 3.49928 0.998 0.998 698.63 0.095 0.869 78 2.679 2.251 796.46 0.256 2.61129 1.074 1.134 718.46 0.103 0.951 79 1.709 2.556 764.97 0.164 1.61730 0.138 0.138 132.18 0.013 0.111 80 2.325 3.064 787.73 0.222 2.24431 0.982 0.982 693.04 0.094 0.852 81 NC NC NC NC NC32 0.801 0.801 598.18 0.077 0.686 82 3.512 3.872 787.10 0.336 3.49133 0.441 0.441 356.24 0.042 0.376 83 2.819 4.650 798.84 0.270 2.75634 0.603 0.603 466.73 0.058 0.516 84 1.293 1.428 739.45 0.124 1.18735 0.963 0.963 685.46 0.092 0.834 85 3.685 2.580 781.75 0.353 3.67536 0.676 0.676 515.70 0.065 0.578 86 2.146 2.175 781.65 0.205 2.06037 1.824 1.580 769.95 0.174 1.734 87 2.247 3.162 785.20 0.215 2.16338 1.113 1.211 724.98 0.106 0.993 88 2.307 3.007 787.16 0.221 2.22539 0.295 0.295 253.01 0.028 0.248 89 2.133 2.525 781.17 0.204 2.04740 1.120 1.109 726.03 0.107 1.001 90 1.806 2.308 769.21 0.173 1.71541 1.791 1.934 768.61 0.171 1.700 91 4.032 3.673 777.98 0.386 4.04742 0.755 0.755 567.95 0.072 0.646 92 1.643 2.310 761.59 0.157 1.54943 1.695 1.505 764.24 0.162 1.603 93 3.581 3.693 785.52 0.343 3.56344 1.349 1.330 742.86 0.129 1.246 94 2.330 4.974 787.88 0.223 2.24945 1.362 1.283 743.62 0.130 1.259 95 3.678 4.242 782.22 0.352 3.66846 0.405 0.405 331.54 0.039 0.345 96 2.606 3.207 794.82 0.249 2.53647 0.917 0.917 665.59 0.088 0.788 97 1.724 2.159 765.69 0.165 1.63348 0.985 0.985 694.45 0.094 0.856 98 2.016 2.550 776.52 0.193 1.92849 1.224 1.205 737.75 0.117 1.115 99 2.250 3.947 785.31 0.215 2.16750 1.668 1.996 762.89 0.160 1.575 100 2.538 3.571 793.11 0.243 2.466
EQ EQFEMAFEMA
V : Maximum Base Shear Δ : Maximum Roof Displacement MIDR : Maximum Inter-Story Drift Ratio NC : Not Considered
115

Table A.3.16 Results of SDOF Analyses of Frame ‘F5S2B’
(75%Vy Idealization Method)
μ 75%Vy R75%Vy V (kN) Δ (m) MIDR (%) μ 75%Vy R75%Vy V (kN) Δ (m) MIDR
(%)1 0.033 0.033 34.18 0.003 0.028 51 1.698 1.737 766.95 0.168 1.6612 0.054 0.054 56.08 0.005 0.046 52 1.744 1.883 768.94 0.172 1.7093 0.190 0.190 178.87 0.019 0.161 53 0.647 0.647 510.13 0.064 0.5714 0.058 0.058 60.41 0.006 0.049 54 NC NC NC NC NC5 0.146 0.146 142.81 0.014 0.122 55 0.977 0.977 701.84 0.096 0.8806 0.114 0.114 114.96 0.011 0.095 56 2.060 2.531 780.85 0.203 2.0397 0.387 0.387 326.96 0.038 0.339 57 0.885 0.885 663.25 0.087 0.7848 0.722 0.722 561.76 0.071 0.638 58 1.950 2.657 776.29 0.192 1.9239 0.412 0.412 345.32 0.041 0.362 59 4.144 2.344 779.12 0.409 4.302
10 0.368 0.368 313.25 0.036 0.322 60 1.130 1.122 731.77 0.112 1.05211 0.234 0.234 213.79 0.023 0.201 61 1.122 1.114 730.70 0.111 1.04212 0.564 0.564 452.34 0.056 0.497 62 1.718 1.968 767.84 0.170 1.68113 1.005 1.005 709.89 0.099 0.911 63 3.025 2.030 794.46 0.298 3.06514 1.195 1.167 738.52 0.118 1.125 64 1.539 1.389 758.55 0.152 1.49115 0.179 0.179 169.84 0.018 0.151 65 0.858 0.858 649.41 0.085 0.75816 0.422 0.422 352.60 0.042 0.371 66 1.958 1.812 776.65 0.193 1.93117 0.800 0.800 613.47 0.079 0.706 67 2.496 2.019 794.03 0.246 2.50318 0.327 0.327 283.44 0.032 0.285 68 1.393 1.454 748.41 0.137 1.33619 1.262 1.260 739.95 0.125 1.196 69 2.644 2.212 797.44 0.261 2.66220 1.361 1.273 746.36 0.134 1.302 70 2.516 2.325 794.54 0.248 2.52421 0.751 0.751 581.06 0.074 0.664 71 1.032 1.032 716.44 0.102 0.94122 0.957 0.957 694.99 0.094 0.858 72 1.143 1.308 733.22 0.113 1.06623 0.476 0.476 390.49 0.047 0.419 73 2.236 2.853 787.13 0.221 2.22424 0.348 0.348 298.74 0.034 0.304 74 2.066 2.103 781.09 0.204 2.04525 0.776 0.776 597.45 0.077 0.685 75 2.952 3.254 800.13 0.291 2.98726 1.330 1.273 744.32 0.131 1.270 76 1.273 1.541 740.73 0.126 1.20927 0.784 0.784 602.85 0.077 0.692 77 3.731 3.207 779.32 0.368 3.85628 1.020 1.020 713.64 0.101 0.928 78 2.555 2.245 795.48 0.252 2.56629 1.131 1.204 731.84 0.112 1.053 79 1.675 2.393 765.86 0.165 1.63630 0.133 0.133 131.47 0.013 0.110 80 2.259 3.020 787.87 0.223 2.24931 0.892 0.892 667.11 0.088 0.791 81 NC NC NC NC NC32 0.805 0.805 616.74 0.079 0.711 82 3.347 4.124 784.42 0.330 3.43033 0.420 0.420 350.90 0.041 0.369 83 2.713 4.499 798.57 0.268 2.73534 0.641 0.641 506.21 0.063 0.566 84 1.252 1.386 740.98 0.124 1.18635 0.953 0.953 693.71 0.094 0.854 85 3.761 2.788 774.18 0.371 3.89336 0.639 0.639 504.46 0.063 0.564 86 2.148 2.195 784.15 0.212 2.13137 1.628 1.532 763.47 0.161 1.587 87 2.229 3.065 786.91 0.220 2.21738 1.129 1.236 731.55 0.111 1.050 88 2.152 2.957 784.28 0.212 2.13539 0.280 0.280 248.46 0.028 0.242 89 2.021 2.492 779.30 0.199 1.99840 1.112 1.103 729.54 0.110 1.032 90 1.692 2.209 766.64 0.167 1.65441 1.767 1.925 769.90 0.174 1.732 91 3.941 3.602 778.16 0.389 4.08142 0.715 0.715 557.02 0.071 0.632 92 1.620 2.351 763.06 0.160 1.57843 1.580 1.450 761.02 0.156 1.535 93 3.386 3.676 787.09 0.334 3.47044 1.373 1.387 747.19 0.136 1.315 94 2.235 4.910 787.11 0.221 2.22445 1.342 1.272 745.12 0.132 1.282 95 3.516 3.978 784.09 0.347 3.61246 0.396 0.396 333.80 0.039 0.347 96 2.794 2.948 797.01 0.276 2.82047 0.960 0.960 696.02 0.095 0.861 97 1.402 1.998 748.95 0.138 1.34548 0.990 0.990 706.04 0.098 0.894 98 2.045 2.366 780.25 0.202 2.02349 1.234 1.214 741.33 0.122 1.167 99 2.208 3.844 786.20 0.218 2.19550 1.575 1.995 760.77 0.155 1.529 100 2.362 3.518 790.62 0.233 2.360
EQ EQ75%Vy75%Vy
V : Maximum Base Shear Δ : Maximum Roof Displacement MIDR : Maximum Inter-Story Drift Ratio NC : Not Considered
116

Table A.3.17 Results of SDOF Analyses of Frame ‘F5S4B’
(MULTI Idealization Method)
μ MULTI RMULTI V (kN) Δ (m) MIDR (%) μ MULTI RMULTI V (kN) Δ (m) MIDR
(%)1 0.038 0.038 110.55 0.005 0.030 51 1.592 1.509 3192.96 0.198 1.4202 0.051 0.051 151.14 0.006 0.040 52 1.458 1.561 3110.08 0.181 1.2923 0.173 0.171 495.88 0.022 0.141 53 0.624 0.621 1628.13 0.078 0.5244 0.064 0.064 192.31 0.008 0.050 54 2.001 1.742 3358.08 0.249 1.8025 0.096 0.097 287.16 0.012 0.076 55 0.985 0.761 2497.09 0.123 0.8326 0.097 0.099 289.99 0.012 0.077 56 2.180 2.548 3405.24 0.271 1.9657 0.225 0.244 630.97 0.028 0.185 57 1.014 0.761 2556.20 0.126 0.8588 0.488 0.470 1292.58 0.061 0.409 58 1.783 2.063 3281.67 0.222 1.6009 0.553 0.456 1452.40 0.069 0.464 59 3.491 2.243 3577.14 0.434 3.076
10 0.274 0.287 755.66 0.034 0.227 60 0.916 0.877 2336.67 0.114 0.77311 0.243 0.244 674.99 0.030 0.200 61 0.963 0.994 2446.43 0.120 0.81212 0.549 0.547 1442.18 0.068 0.460 62 1.216 1.498 2882.57 0.151 1.05313 0.912 0.904 2327.16 0.114 0.769 63 1.895 1.680 3325.36 0.236 1.70514 1.177 1.182 2832.52 0.146 1.014 64 1.268 1.145 2943.14 0.158 1.10515 0.190 0.189 538.24 0.024 0.155 65 0.811 0.802 2084.29 0.101 0.68416 0.398 0.378 1067.81 0.049 0.332 66 1.309 1.643 2983.43 0.163 1.14517 0.678 0.629 1760.61 0.084 0.570 67 2.108 1.852 3385.94 0.262 1.89918 0.277 0.288 761.59 0.034 0.229 68 1.444 1.061 3099.64 0.180 1.27819 0.908 1.023 2315.68 0.113 0.765 69 2.103 2.287 3384.82 0.262 1.89520 1.727 1.270 3256.46 0.215 1.547 70 2.288 2.132 3429.57 0.285 2.06321 0.642 0.661 1671.64 0.080 0.540 71 0.761 0.789 1962.47 0.095 0.64122 1.039 0.840 2602.78 0.129 0.881 72 1.335 1.162 3008.14 0.166 1.17023 0.384 0.360 1032.25 0.048 0.320 73 1.674 2.078 3235.14 0.208 1.49724 0.322 0.308 876.71 0.040 0.267 74 1.700 1.873 3243.52 0.211 1.52225 0.617 0.727 1609.55 0.077 0.518 75 2.112 2.802 3387.11 0.263 1.90326 1.026 0.888 2579.19 0.128 0.869 76 1.072 1.141 2665.28 0.133 0.91227 0.630 0.643 1642.72 0.078 0.530 77 5.157 3.053 3711.98 0.642 4.37528 1.406 1.176 3069.52 0.175 1.241 78 1.763 1.961 3272.93 0.219 1.58129 1.347 1.302 3018.93 0.168 1.182 79 1.504 1.692 3140.70 0.187 1.33630 0.091 0.092 271.68 0.011 0.072 80 2.711 2.902 3507.54 0.337 2.43231 1.012 0.830 2551.51 0.126 0.856 81 5.087 3.979 3708.68 0.633 4.32032 0.768 0.684 1979.96 0.096 0.647 82 2.629 3.785 3494.47 0.327 2.36233 0.287 0.311 787.22 0.036 0.237 83 1.881 3.425 3321.02 0.234 1.69234 0.883 0.792 2256.60 0.110 0.744 84 1.225 1.081 2894.38 0.152 1.06335 0.635 0.742 1656.03 0.079 0.534 85 2.403 2.811 3452.45 0.299 2.16636 0.673 0.590 1748.67 0.084 0.566 86 1.877 1.992 3319.57 0.233 1.68837 1.643 1.400 3220.43 0.204 1.468 87 2.081 2.618 3379.83 0.259 1.87538 1.220 1.186 2888.18 0.152 1.057 88 2.382 2.413 3448.15 0.296 2.14739 0.205 0.204 579.10 0.026 0.168 89 2.313 2.143 3434.51 0.288 2.08540 1.205 0.938 2869.23 0.150 1.042 90 1.687 1.901 3238.80 0.210 1.51041 1.013 1.451 2554.26 0.126 0.857 91 3.116 3.021 3546.97 0.388 2.76542 0.464 0.537 1232.60 0.058 0.388 92 1.658 1.990 3227.87 0.206 1.48243 1.163 1.142 2813.39 0.145 1.000 93 2.818 3.106 3523.06 0.351 2.52344 1.632 1.431 3214.27 0.203 1.457 94 2.880 4.105 3531.57 0.358 2.57745 1.242 0.975 2914.49 0.155 1.080 95 1.993 2.561 3356.05 0.248 1.79546 0.298 0.310 815.89 0.037 0.247 96 1.269 1.826 2943.71 0.158 1.10647 0.878 0.925 2244.13 0.109 0.740 97 1.147 1.361 2791.16 0.143 0.98548 0.994 0.945 2516.12 0.124 0.840 98 1.739 1.673 3262.04 0.216 1.55849 1.149 1.132 2793.89 0.143 0.986 99 1.973 2.984 3350.50 0.245 1.77750 1.493 1.651 3133.88 0.186 1.326 100 2.070 2.378 3377.07 0.257 1.865
EQ EQMULTIMULTI
V : Maximum Base Shear Δ : Maximum Roof Displacement MIDR : Maximum Inter-Story Drift Ratio NC : Not Considered
117

Table A.3.18 Results of SDOF Analyses of Frame ‘F5S4B’
(ATC Idealization Method)
μ ATC RATC V (kN) Δ (m) MIDR (%) μ ATC RATC V (kN) Δ (m) MIDR
(%)1 0.038 0.038 110.52 0.005 0.030 51 1.285 1.510 2960.92 0.160 1.1222 0.051 0.051 151.13 0.006 0.040 52 1.540 1.561 3163.23 0.192 1.3703 0.171 0.171 490.79 0.021 0.139 53 0.621 0.621 1620.43 0.077 0.5224 0.064 0.064 192.24 0.008 0.050 54 2.102 1.742 3384.48 0.262 1.8945 0.097 0.097 290.44 0.012 0.077 55 0.761 0.761 1962.07 0.095 0.6416 0.099 0.099 295.38 0.012 0.078 56 1.996 2.548 3356.77 0.248 1.7987 0.244 0.244 679.16 0.030 0.201 57 0.761 0.761 1961.14 0.095 0.6408 0.470 0.470 1248.46 0.058 0.394 58 1.819 2.064 3296.89 0.226 1.6339 0.456 0.456 1212.23 0.057 0.381 59 3.448 2.243 3570.93 0.429 3.042
10 0.287 0.287 788.29 0.036 0.238 60 0.877 0.877 2241.76 0.109 0.73911 0.244 0.244 678.88 0.030 0.201 61 0.994 0.994 2515.89 0.124 0.83912 0.547 0.547 1437.87 0.068 0.459 62 1.383 1.498 3050.21 0.172 1.21813 0.904 0.904 2307.12 0.112 0.762 63 1.545 1.680 3165.97 0.192 1.37514 1.209 1.182 2874.45 0.150 1.046 64 1.164 1.145 2814.54 0.145 1.00115 0.189 0.189 536.38 0.023 0.154 65 0.802 0.802 2060.40 0.100 0.67516 0.378 0.378 1017.62 0.047 0.315 66 1.693 1.643 3240.74 0.211 1.51617 0.630 0.630 1641.86 0.078 0.529 67 2.176 1.852 3404.22 0.271 1.96118 0.288 0.288 791.37 0.036 0.239 68 1.063 1.060 2648.51 0.132 0.90419 1.023 1.023 2573.83 0.127 0.866 69 1.679 2.287 3237.03 0.209 1.50220 1.343 1.270 3015.08 0.167 1.178 70 2.360 2.132 3443.50 0.294 2.12821 0.661 0.661 1717.97 0.082 0.556 71 0.789 0.789 2029.40 0.098 0.66422 0.840 0.840 2153.66 0.105 0.708 72 1.188 1.162 2846.73 0.148 1.02423 0.360 0.360 973.91 0.045 0.300 73 1.814 2.079 3294.70 0.226 1.62924 0.308 0.308 840.82 0.038 0.255 74 1.596 1.873 3194.89 0.199 1.42325 0.727 0.727 1879.59 0.090 0.612 75 2.039 2.802 3368.81 0.254 1.83726 0.888 0.888 2268.93 0.110 0.749 76 1.064 1.141 2649.46 0.132 0.90427 0.643 0.643 1675.45 0.080 0.541 77 4.570 3.052 3669.04 0.569 3.92228 1.125 1.176 2756.69 0.140 0.963 78 1.989 1.961 3354.92 0.247 1.79229 1.220 1.302 2888.37 0.152 1.058 79 1.498 1.692 3137.26 0.186 1.33130 0.092 0.092 273.33 0.011 0.072 80 2.102 2.902 3384.42 0.261 1.89431 0.830 0.830 2128.89 0.103 0.699 81 4.032 3.979 3621.01 0.502 3.50632 0.684 0.684 1774.34 0.085 0.575 82 3.465 3.785 3573.25 0.431 3.05533 0.311 0.311 848.94 0.039 0.258 83 1.961 3.426 3346.98 0.244 1.76634 0.791 0.791 2035.28 0.098 0.666 84 1.066 1.081 2653.39 0.133 0.90635 0.742 0.742 1915.39 0.092 0.624 85 2.661 2.811 3499.93 0.331 2.38936 0.590 0.590 1543.84 0.073 0.495 86 1.815 1.992 3295.39 0.226 1.63037 1.469 1.400 3117.89 0.183 1.302 87 1.934 2.619 3338.31 0.241 1.74138 1.105 1.186 2722.72 0.137 0.944 88 1.913 2.414 3331.06 0.238 1.72239 0.204 0.204 576.88 0.025 0.167 89 2.159 2.143 3399.75 0.269 1.94640 0.938 0.938 2388.70 0.117 0.791 90 1.473 1.901 3120.68 0.183 1.30641 1.422 1.451 3082.10 0.177 1.256 91 3.187 3.021 3554.92 0.396 2.82442 0.537 0.537 1412.86 0.067 0.450 92 1.736 1.990 3260.70 0.216 1.55643 1.153 1.142 2799.28 0.143 0.990 93 2.753 3.106 3513.70 0.343 2.46844 1.400 1.431 3064.58 0.174 1.235 94 2.427 4.105 3457.44 0.302 2.18745 0.975 0.975 2474.70 0.121 0.823 95 1.693 2.562 3240.40 0.211 1.51546 0.310 0.310 846.01 0.039 0.257 96 1.752 1.827 3268.09 0.218 1.57147 0.925 0.925 2357.19 0.115 0.780 97 1.439 1.361 3095.77 0.179 1.27348 0.945 0.945 2404.61 0.118 0.797 98 1.717 1.673 3251.97 0.214 1.53849 1.140 1.132 2780.72 0.142 0.978 99 1.852 2.984 3310.16 0.230 1.66450 1.420 1.652 3080.84 0.177 1.254 100 2.117 2.379 3388.52 0.263 1.908
EQ EQATCATC
V : Maximum Base Shear Δ : Maximum Roof Displacement MIDR : Maximum Inter-Story Drift Ratio NC : Not Considered
118
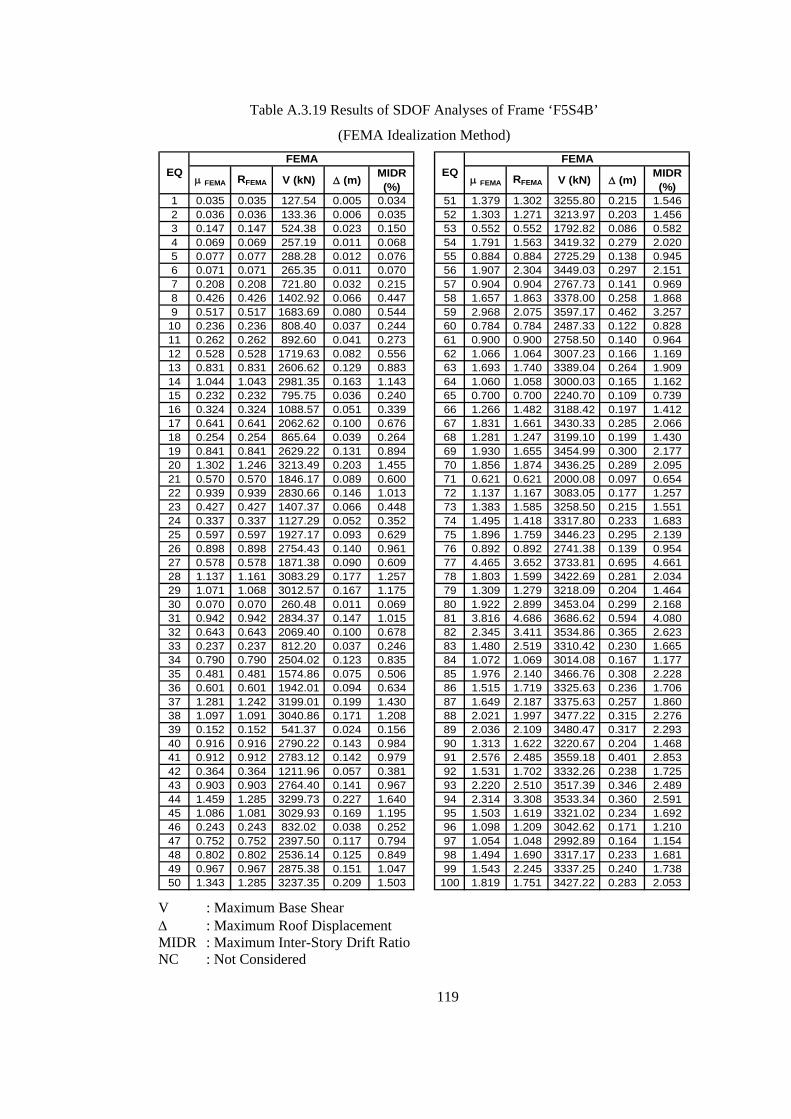
Table A.3.19 Results of SDOF Analyses of Frame ‘F5S4B’
(FEMA Idealization Method)
μ FEMA RFEMA V (kN) Δ (m) MIDR (%) μ FEMA RFEMA V (kN) Δ (m) MIDR
(%)1 0.035 0.035 127.54 0.005 0.034 51 1.379 1.302 3255.80 0.215 1.5462 0.036 0.036 133.36 0.006 0.035 52 1.303 1.271 3213.97 0.203 1.4563 0.147 0.147 524.38 0.023 0.150 53 0.552 0.552 1792.82 0.086 0.5824 0.069 0.069 257.19 0.011 0.068 54 1.791 1.563 3419.32 0.279 2.0205 0.077 0.077 288.28 0.012 0.076 55 0.884 0.884 2725.29 0.138 0.9456 0.071 0.071 265.35 0.011 0.070 56 1.907 2.304 3449.03 0.297 2.1517 0.208 0.208 721.80 0.032 0.215 57 0.904 0.904 2767.73 0.141 0.9698 0.426 0.426 1402.92 0.066 0.447 58 1.657 1.863 3378.00 0.258 1.8689 0.517 0.517 1683.69 0.080 0.544 59 2.968 2.075 3597.17 0.462 3.257
10 0.236 0.236 808.40 0.037 0.244 60 0.784 0.784 2487.33 0.122 0.82811 0.262 0.262 892.60 0.041 0.273 61 0.900 0.900 2758.50 0.140 0.96412 0.528 0.528 1719.63 0.082 0.556 62 1.066 1.064 3007.23 0.166 1.16913 0.831 0.831 2606.62 0.129 0.883 63 1.693 1.740 3389.04 0.264 1.90914 1.044 1.043 2981.35 0.163 1.143 64 1.060 1.058 3000.03 0.165 1.16215 0.232 0.232 795.75 0.036 0.240 65 0.700 0.700 2240.70 0.109 0.73916 0.324 0.324 1088.57 0.051 0.339 66 1.266 1.482 3188.42 0.197 1.41217 0.641 0.641 2062.62 0.100 0.676 67 1.831 1.661 3430.33 0.285 2.06618 0.254 0.254 865.64 0.039 0.264 68 1.281 1.247 3199.10 0.199 1.43019 0.841 0.841 2629.22 0.131 0.894 69 1.930 1.655 3454.99 0.300 2.17720 1.302 1.246 3213.49 0.203 1.455 70 1.856 1.874 3436.25 0.289 2.09521 0.570 0.570 1846.17 0.089 0.600 71 0.621 0.621 2000.08 0.097 0.65422 0.939 0.939 2830.66 0.146 1.013 72 1.137 1.167 3083.05 0.177 1.25723 0.427 0.427 1407.37 0.066 0.448 73 1.383 1.585 3258.50 0.215 1.55124 0.337 0.337 1127.29 0.052 0.352 74 1.495 1.418 3317.80 0.233 1.68325 0.597 0.597 1927.17 0.093 0.629 75 1.896 1.759 3446.23 0.295 2.13926 0.898 0.898 2754.43 0.140 0.961 76 0.892 0.892 2741.38 0.139 0.95427 0.578 0.578 1871.38 0.090 0.609 77 4.465 3.652 3733.81 0.695 4.66128 1.137 1.161 3083.29 0.177 1.257 78 1.803 1.599 3422.69 0.281 2.03429 1.071 1.068 3012.57 0.167 1.175 79 1.309 1.279 3218.09 0.204 1.46430 0.070 0.070 260.48 0.011 0.069 80 1.922 2.899 3453.04 0.299 2.16831 0.942 0.942 2834.37 0.147 1.015 81 3.816 4.686 3686.62 0.594 4.08032 0.643 0.643 2069.40 0.100 0.678 82 2.345 3.411 3534.86 0.365 2.62333 0.237 0.237 812.20 0.037 0.246 83 1.480 2.519 3310.42 0.230 1.66534 0.790 0.790 2504.02 0.123 0.835 84 1.072 1.069 3014.08 0.167 1.17735 0.481 0.481 1574.86 0.075 0.506 85 1.976 2.140 3466.76 0.308 2.22836 0.601 0.601 1942.01 0.094 0.634 86 1.515 1.719 3325.63 0.236 1.70637 1.281 1.242 3199.01 0.199 1.430 87 1.649 2.187 3375.63 0.257 1.86038 1.097 1.091 3040.86 0.171 1.208 88 2.021 1.997 3477.22 0.315 2.27639 0.152 0.152 541.37 0.024 0.156 89 2.036 2.109 3480.47 0.317 2.29340 0.916 0.916 2790.22 0.143 0.984 90 1.313 1.622 3220.67 0.204 1.46841 0.912 0.912 2783.12 0.142 0.979 91 2.576 2.485 3559.18 0.401 2.85342 0.364 0.364 1211.96 0.057 0.381 92 1.531 1.702 3332.26 0.238 1.72543 0.903 0.903 2764.40 0.141 0.967 93 2.220 2.510 3517.39 0.346 2.48944 1.459 1.285 3299.73 0.227 1.640 94 2.314 3.308 3533.34 0.360 2.59145 1.086 1.081 3029.93 0.169 1.195 95 1.503 1.619 3321.02 0.234 1.69246 0.243 0.243 832.02 0.038 0.252 96 1.098 1.209 3042.62 0.171 1.21047 0.752 0.752 2397.50 0.117 0.794 97 1.054 1.048 2992.89 0.164 1.15448 0.802 0.802 2536.14 0.125 0.849 98 1.494 1.690 3317.17 0.233 1.68149 0.967 0.967 2875.38 0.151 1.047 99 1.543 2.245 3337.25 0.240 1.73850 1.343 1.285 3237.35 0.209 1.503 100 1.819 1.751 3427.22 0.283 2.053
EQ EQFEMAFEMA
V : Maximum Base Shear Δ : Maximum Roof Displacement MIDR : Maximum Inter-Story Drift Ratio NC : Not Considered
119

Table A.3.20 Results of SDOF Analyses of Frame ‘F5S4B’
(75%Vy Idealization Method)
μ 75%Vy R75%Vy V (kN) Δ (m) MIDR (%) μ 75%Vy R75%Vy V (kN) Δ (m) MIDR
(%)1 0.033 0.033 125.88 0.005 0.034 51 1.351 1.284 3257.65 0.215 1.5502 0.034 0.034 128.71 0.005 0.034 52 1.271 1.244 3212.28 0.202 1.4533 0.145 0.145 527.90 0.023 0.151 53 0.543 0.543 1803.65 0.087 0.5854 0.068 0.068 261.97 0.011 0.069 54 1.741 1.537 3416.69 0.277 2.0105 0.075 0.075 286.17 0.012 0.076 55 0.904 0.904 2805.37 0.144 0.9956 0.071 0.071 269.90 0.011 0.071 56 1.898 2.265 3458.03 0.302 2.1907 0.212 0.212 747.80 0.034 0.224 57 0.900 0.900 2797.73 0.143 0.9898 0.417 0.417 1406.83 0.066 0.448 58 1.627 1.885 3380.35 0.259 1.8779 0.520 0.520 1729.08 0.083 0.559 59 2.922 2.057 3598.76 0.465 3.279
10 0.231 0.231 812.02 0.037 0.246 60 0.773 0.773 2507.60 0.123 0.83611 0.263 0.263 913.34 0.042 0.280 61 0.905 0.905 2807.80 0.144 0.99612 0.523 0.523 1741.08 0.083 0.564 62 1.022 1.022 2983.66 0.163 1.14513 0.819 0.819 2621.20 0.130 0.890 63 1.681 1.713 3398.02 0.268 1.94014 1.019 1.019 2980.37 0.162 1.142 64 1.052 1.050 3019.11 0.168 1.18315 0.239 0.239 837.19 0.038 0.254 65 0.688 0.688 2250.63 0.110 0.74216 0.318 0.318 1091.94 0.051 0.340 66 1.242 1.440 3192.22 0.198 1.41817 0.632 0.632 2077.99 0.101 0.681 67 1.799 1.640 3432.85 0.287 2.07818 0.255 0.255 888.40 0.041 0.271 68 1.273 1.240 3213.57 0.203 1.45519 0.814 0.814 2610.97 0.130 0.885 69 1.951 1.582 3471.66 0.311 2.25020 1.302 1.245 3232.09 0.207 1.490 70 1.795 1.844 3431.69 0.286 2.07221 0.576 0.576 1904.91 0.092 0.621 71 0.606 0.606 1998.68 0.097 0.65422 0.951 0.951 2885.66 0.152 1.055 72 1.175 1.175 3140.94 0.187 1.33623 0.427 0.427 1437.84 0.068 0.459 73 1.391 1.536 3280.73 0.222 1.59824 0.341 0.341 1164.54 0.054 0.365 74 1.468 1.400 3320.75 0.234 1.69125 0.579 0.579 1915.20 0.092 0.624 75 1.720 1.685 3410.27 0.274 1.98526 0.907 0.907 2810.08 0.144 0.998 76 0.874 0.874 2746.01 0.139 0.95727 0.591 0.591 1951.91 0.094 0.637 77 4.398 3.702 3735.36 0.701 4.68928 1.170 1.182 3136.91 0.186 1.330 78 1.785 1.561 3429.12 0.284 2.06129 1.040 1.039 3005.73 0.166 1.168 79 1.265 1.242 3207.87 0.201 1.44530 0.070 0.070 266.16 0.011 0.070 80 1.903 2.891 3459.45 0.303 2.19631 0.935 0.935 2859.25 0.149 1.034 81 3.821 4.706 3696.54 0.609 4.17032 0.659 0.659 2162.36 0.105 0.711 82 2.206 3.337 3524.08 0.351 2.53033 0.232 0.232 815.45 0.037 0.247 83 1.445 2.438 3309.70 0.230 1.66334 0.763 0.763 2478.84 0.122 0.825 84 1.072 1.069 3040.50 0.171 1.20735 0.455 0.455 1527.06 0.073 0.490 85 1.936 2.093 3468.08 0.308 2.23436 0.599 0.599 1977.49 0.095 0.646 86 1.484 1.690 3326.48 0.236 1.71037 1.316 1.269 3238.35 0.210 1.507 87 1.624 2.142 3379.67 0.259 1.87438 1.082 1.078 3051.83 0.172 1.220 88 2.023 1.962 3487.90 0.322 2.32939 0.148 0.148 536.79 0.024 0.154 89 2.012 2.109 3485.55 0.321 2.31740 0.920 0.920 2833.24 0.147 1.015 90 1.330 1.579 3245.31 0.212 1.52541 0.861 0.861 2718.12 0.137 0.941 91 2.521 2.432 3559.77 0.402 2.85742 0.345 0.345 1178.32 0.055 0.370 92 1.496 1.655 3331.85 0.238 1.72443 0.884 0.884 2767.55 0.141 0.969 93 2.164 2.453 3516.29 0.345 2.48344 1.428 1.260 3301.21 0.228 1.643 94 2.288 3.228 3535.17 0.365 2.61945 1.079 1.074 3048.39 0.172 1.216 95 1.431 1.575 3302.82 0.228 1.64746 0.238 0.238 833.33 0.038 0.253 96 1.076 1.148 3044.95 0.171 1.21247 0.734 0.734 2392.27 0.117 0.792 97 1.009 1.009 2967.14 0.161 1.12948 0.786 0.786 2540.40 0.125 0.851 98 1.489 1.675 3328.66 0.237 1.71649 0.945 0.945 2876.38 0.151 1.048 99 1.516 2.180 3340.83 0.242 1.74850 1.290 1.247 3225.06 0.206 1.476 100 1.858 1.751 3447.60 0.296 2.145
EQ EQ75%Vy75%Vy
V : Maximum Base Shear Δ : Maximum Roof Displacement MIDR : Maximum Inter-Story Drift Ratio NC : Not Considered
120

Table A.3.21 Results of SDOF Analyses of Frame ‘F5S7B’
(MULTI Idealization Method)
μ MULTI RMULTI V (kN) Δ (m) MIDR (%) μ MULTI RMULTI V (kN) Δ (m) MIDR
(%)1 0.029 0.029 81.60 0.002 0.018 51 1.591 1.037 2831.89 0.111 1.1282 0.030 0.030 86.01 0.002 0.019 52 2.365 2.471 3080.12 0.164 1.7553 0.180 0.173 450.30 0.013 0.116 53 0.648 0.633 1430.74 0.045 0.4204 0.091 0.091 246.78 0.006 0.058 54 1.479 1.258 2743.04 0.103 1.0365 0.158 0.171 400.66 0.011 0.102 55 1.127 1.030 2281.97 0.078 0.7636 0.215 0.224 526.23 0.015 0.139 56 3.283 2.150 3120.16 0.228 2.4417 0.345 0.360 804.11 0.024 0.224 57 0.841 1.083 1796.61 0.058 0.5578 0.387 0.437 892.23 0.027 0.251 58 NC NC NC NC NC9 0.730 1.159 1591.43 0.051 0.478 59 3.199 1.713 3111.54 0.222 2.383
10 0.643 0.881 1421.42 0.045 0.417 60 1.027 0.848 2122.58 0.071 0.68911 0.354 0.390 822.81 0.025 0.229 61 0.896 0.817 1897.91 0.062 0.59612 0.478 0.504 1082.51 0.033 0.310 62 2.447 2.105 3083.90 0.170 1.81713 0.857 0.802 1826.43 0.060 0.569 63 2.571 1.197 3087.85 0.179 1.91114 0.896 0.752 1896.80 0.062 0.596 64 1.716 1.348 2903.32 0.119 1.23115 0.190 0.216 472.99 0.013 0.123 65 0.774 0.648 1673.62 0.054 0.51016 0.489 0.498 1105.28 0.034 0.317 66 1.976 2.837 3010.49 0.137 1.44317 0.442 0.475 1005.94 0.031 0.286 67 2.631 2.545 3090.88 0.183 1.95518 0.541 0.614 1212.76 0.038 0.351 68 1.563 2.192 2811.96 0.109 1.10519 0.940 0.711 1974.75 0.065 0.627 69 2.937 2.221 3106.03 0.204 2.18520 1.101 0.854 2240.91 0.076 0.743 70 3.051 2.041 3113.41 0.212 2.27121 0.904 0.784 1912.29 0.063 0.602 71 1.648 2.470 2869.02 0.115 1.17522 1.142 1.130 2304.14 0.079 0.774 72 1.259 1.428 2469.57 0.088 0.86723 0.498 0.557 1123.96 0.035 0.323 73 NC NC NC NC NC24 0.256 0.289 614.19 0.018 0.165 74 2.135 1.934 3055.90 0.148 1.57825 0.665 0.711 1465.70 0.046 0.432 75 3.147 2.205 3115.73 0.219 2.34226 1.406 1.582 2664.11 0.098 0.979 76 1.232 1.188 2432.17 0.086 0.84427 1.118 1.173 2267.76 0.078 0.756 77 5.100 1.777 3132.07 0.354 3.89828 0.934 0.882 1964.10 0.065 0.623 78 2.669 1.870 3094.10 0.185 1.98329 1.150 1.288 2315.50 0.080 0.780 79 2.690 3.186 3095.71 0.187 1.99930 0.202 0.227 499.29 0.014 0.131 80 NC NC NC NC NC31 1.553 1.110 2804.34 0.108 1.097 81 NC NC NC NC NC32 1.098 1.509 2236.43 0.076 0.741 82 NC NC NC NC NC33 0.660 0.675 1454.80 0.046 0.428 83 2.960 4.500 3107.39 0.206 2.20334 0.675 0.827 1485.85 0.047 0.439 84 1.573 2.288 2819.48 0.109 1.11335 0.710 0.553 1553.86 0.049 0.464 85 2.296 3.094 3078.15 0.160 1.70236 0.984 1.271 2051.61 0.068 0.658 86 1.845 1.299 2964.43 0.128 1.33537 1.612 2.186 2845.27 0.112 1.145 87 NC NC NC NC NC38 1.258 0.937 2467.79 0.087 0.866 88 3.032 3.222 3111.73 0.211 2.25839 0.480 0.540 1085.89 0.033 0.311 89 2.743 2.377 3099.13 0.191 2.03840 1.128 1.086 2284.03 0.078 0.764 90 2.668 3.251 3094.06 0.185 1.98341 1.517 1.562 2775.81 0.105 1.068 91 NC NC NC NC NC42 1.135 1.423 2293.48 0.079 0.769 92 1.955 1.944 3004.31 0.136 1.42543 2.111 2.049 3049.05 0.147 1.558 93 4.324 2.813 3121.06 0.300 3.26744 1.099 1.221 2237.81 0.076 0.742 94 NC NC NC NC NC45 1.658 1.133 2874.48 0.115 1.182 95 2.832 2.835 3098.20 0.197 2.10446 0.603 0.711 1339.67 0.042 0.391 96 2.055 2.511 3032.12 0.143 1.51047 0.660 0.678 1456.08 0.046 0.429 97 2.186 4.267 3067.98 0.152 1.61848 0.835 0.879 1785.50 0.058 0.553 98 2.378 3.133 3081.17 0.165 1.76649 1.099 1.272 2237.65 0.076 0.742 99 NC NC NC NC NC50 2.100 1.437 3045.79 0.146 1.549 100 2.845 4.092 3099.19 0.198 2.114
EQ EQMULTIMULTI
V : Maximum Base Shear Δ : Maximum Roof Displacement MIDR : Maximum Inter-Story Drift Ratio NC : Not Considered
121

Table A.3.22 Results of SDOF Analyses of Frame ‘F5S7B’
(ATC Idealization Method)
μ ATC RATC V (kN) Δ (m) MIDR (%) μ ATC RATC V (kN) Δ (m) MIDR
(%)1 0.029 0.029 81.60 0.002 0.018 51 1.038 1.037 2139.76 0.072 0.6972 0.030 0.030 86.01 0.002 0.019 52 2.522 2.471 3086.79 0.175 1.8753 0.173 0.173 435.69 0.012 0.112 53 0.633 0.633 1400.51 0.044 0.4114 0.091 0.091 246.62 0.006 0.058 54 1.330 1.258 2565.33 0.092 0.9215 0.171 0.171 430.98 0.012 0.111 55 1.031 1.030 2129.33 0.072 0.6926 0.224 0.224 546.38 0.016 0.145 56 3.101 2.150 3115.81 0.216 2.3097 0.360 0.360 835.89 0.025 0.233 57 1.088 1.083 2220.00 0.076 0.7338 0.437 0.437 995.96 0.030 0.283 58 NC NC NC NC NC9 1.121 1.159 2273.20 0.078 0.759 59 2.501 1.713 3085.31 0.174 1.859
10 0.881 0.881 1870.44 0.061 0.586 60 0.848 0.848 1810.47 0.059 0.56211 0.390 0.390 898.17 0.027 0.253 61 0.817 0.817 1752.19 0.057 0.54012 0.504 0.504 1135.29 0.035 0.327 62 2.784 2.105 3098.51 0.193 2.06813 0.802 0.802 1724.03 0.056 0.529 63 1.195 1.197 2382.02 0.083 0.81514 0.752 0.752 1631.49 0.052 0.493 64 1.440 1.348 2703.90 0.100 1.00515 0.216 0.216 528.91 0.015 0.140 65 0.648 0.648 1432.65 0.045 0.42116 0.498 0.498 1123.98 0.035 0.323 66 2.448 2.837 3083.89 0.170 1.81817 0.475 0.475 1075.54 0.033 0.308 67 2.803 2.545 3097.87 0.195 2.08218 0.614 0.614 1362.84 0.043 0.399 68 1.894 2.192 2983.98 0.132 1.37519 0.711 0.711 1555.78 0.049 0.465 69 3.064 2.221 3114.31 0.213 2.28020 0.854 0.854 1821.69 0.059 0.567 70 2.320 2.041 3078.80 0.161 1.72021 0.784 0.784 1691.58 0.054 0.516 71 1.635 2.470 2860.53 0.114 1.16422 1.142 1.130 2304.67 0.079 0.775 72 1.526 1.428 2783.20 0.106 1.07523 0.557 0.557 1244.14 0.039 0.361 73 NC NC NC NC NC24 0.289 0.289 685.25 0.020 0.187 74 1.840 1.934 2962.28 0.128 1.33025 0.711 0.711 1554.49 0.049 0.464 75 2.243 2.205 3074.35 0.156 1.66326 1.276 1.582 2492.84 0.089 0.880 76 1.208 1.188 2398.78 0.084 0.82527 1.188 1.173 2371.25 0.083 0.809 77 3.824 1.777 3110.68 0.266 2.86228 0.882 0.882 1873.04 0.061 0.587 78 2.765 1.870 3099.86 0.192 2.05429 1.349 1.288 2590.36 0.094 0.935 79 2.145 3.186 3058.47 0.149 1.58530 0.227 0.227 552.17 0.016 0.147 80 NC NC NC NC NC31 1.119 1.110 2269.11 0.078 0.757 81 NC NC NC NC NC32 1.332 1.509 2567.92 0.093 0.922 82 NC NC NC NC NC33 0.675 0.675 1484.39 0.047 0.439 83 3.253 4.500 3117.51 0.226 2.42034 0.826 0.826 1770.20 0.057 0.547 84 1.859 2.288 2970.13 0.129 1.34635 0.553 0.553 1237.21 0.038 0.359 85 2.247 3.094 3073.97 0.156 1.66536 1.315 1.271 2545.23 0.091 0.909 86 1.368 1.299 2616.28 0.095 0.95037 2.065 2.186 3035.60 0.144 1.519 87 NC NC NC NC NC38 0.937 0.937 1969.31 0.065 0.625 88 3.004 3.222 3109.79 0.209 2.23639 0.540 0.540 1209.32 0.038 0.350 89 1.877 2.377 2977.51 0.130 1.36140 1.093 1.086 2228.64 0.076 0.737 90 2.569 3.251 3087.90 0.179 1.90941 1.512 1.562 2771.65 0.105 1.063 91 NC NC NC NC NC42 1.350 1.423 2592.29 0.094 0.936 92 2.113 1.944 3049.86 0.147 1.56043 1.675 2.049 2883.56 0.116 1.197 93 3.195 2.813 3111.28 0.222 2.38044 1.249 1.221 2455.26 0.087 0.858 94 NC NC NC NC NC45 1.159 1.133 2329.54 0.081 0.787 95 3.798 2.835 3111.49 0.264 2.84046 0.711 0.711 1555.69 0.049 0.465 96 3.918 2.511 3113.54 0.272 2.93847 0.678 0.678 1491.55 0.047 0.441 97 2.886 4.267 3102.93 0.201 2.14648 0.879 0.879 1867.71 0.061 0.585 98 2.100 3.133 3045.95 0.146 1.54949 1.156 1.272 2324.36 0.080 0.785 99 NC NC NC NC NC50 1.621 1.437 2851.24 0.113 1.152 100 3.922 4.092 3113.69 0.273 2.941
EQ EQATCATC
V : Maximum Base Shear Δ : Maximum Roof Displacement MIDR : Maximum Inter-Story Drift Ratio NC : Not Considered
122
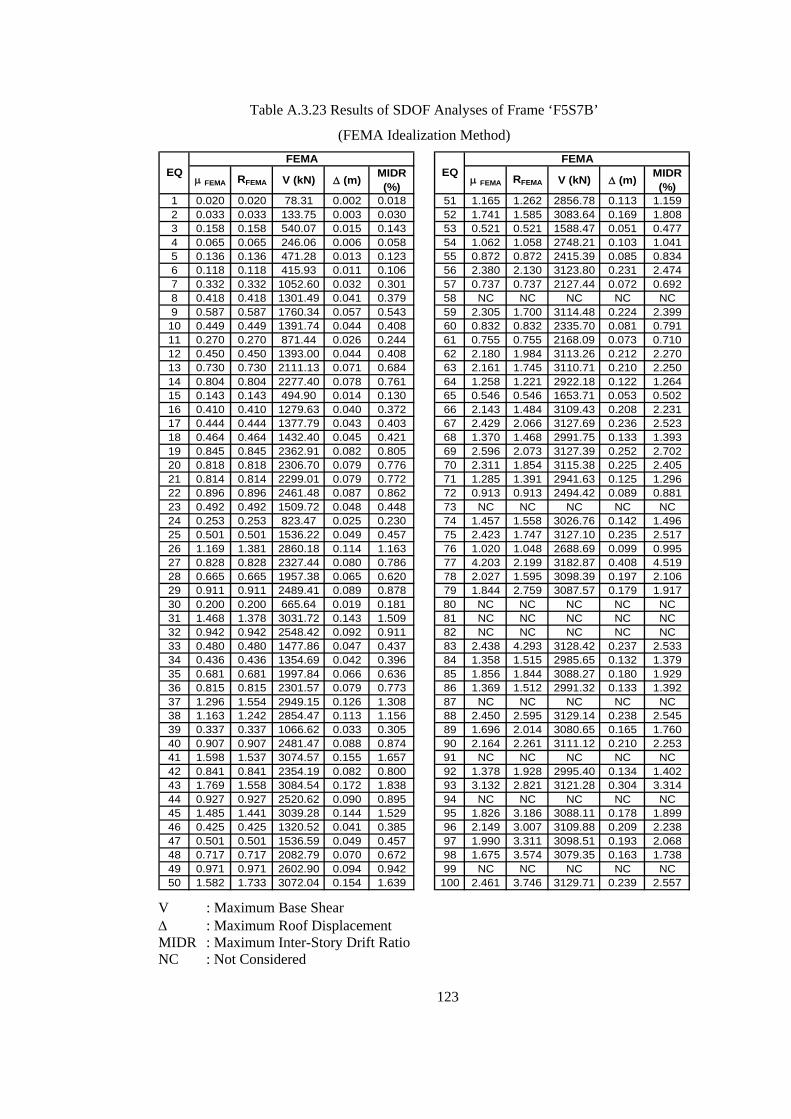
Table A.3.23 Results of SDOF Analyses of Frame ‘F5S7B’
(FEMA Idealization Method)
μ FEMA RFEMA V (kN) Δ (m) MIDR (%) μ FEMA RFEMA V (kN) Δ (m) MIDR
(%)1 0.020 0.020 78.31 0.002 0.018 51 1.165 1.262 2856.78 0.113 1.1592 0.033 0.033 133.75 0.003 0.030 52 1.741 1.585 3083.64 0.169 1.8083 0.158 0.158 540.07 0.015 0.143 53 0.521 0.521 1588.47 0.051 0.4774 0.065 0.065 246.06 0.006 0.058 54 1.062 1.058 2748.21 0.103 1.0415 0.136 0.136 471.28 0.013 0.123 55 0.872 0.872 2415.39 0.085 0.8346 0.118 0.118 415.93 0.011 0.106 56 2.380 2.130 3123.80 0.231 2.4747 0.332 0.332 1052.60 0.032 0.301 57 0.737 0.737 2127.44 0.072 0.6928 0.418 0.418 1301.49 0.041 0.379 58 NC NC NC NC NC9 0.587 0.587 1760.34 0.057 0.543 59 2.305 1.700 3114.48 0.224 2.399
10 0.449 0.449 1391.74 0.044 0.408 60 0.832 0.832 2335.70 0.081 0.79111 0.270 0.270 871.44 0.026 0.244 61 0.755 0.755 2168.09 0.073 0.71012 0.450 0.450 1393.00 0.044 0.408 62 2.180 1.984 3113.26 0.212 2.27013 0.730 0.730 2111.13 0.071 0.684 63 2.161 1.745 3110.71 0.210 2.25014 0.804 0.804 2277.40 0.078 0.761 64 1.258 1.221 2922.18 0.122 1.26415 0.143 0.143 494.90 0.014 0.130 65 0.546 0.546 1653.71 0.053 0.50216 0.410 0.410 1279.63 0.040 0.372 66 2.143 1.484 3109.43 0.208 2.23117 0.444 0.444 1377.79 0.043 0.403 67 2.429 2.066 3127.69 0.236 2.52318 0.464 0.464 1432.40 0.045 0.421 68 1.370 1.468 2991.75 0.133 1.39319 0.845 0.845 2362.91 0.082 0.805 69 2.596 2.073 3127.39 0.252 2.70220 0.818 0.818 2306.70 0.079 0.776 70 2.311 1.854 3115.38 0.225 2.40521 0.814 0.814 2299.01 0.079 0.772 71 1.285 1.391 2941.63 0.125 1.29622 0.896 0.896 2461.48 0.087 0.862 72 0.913 0.913 2494.42 0.089 0.88123 0.492 0.492 1509.72 0.048 0.448 73 NC NC NC NC NC24 0.253 0.253 823.47 0.025 0.230 74 1.457 1.558 3026.76 0.142 1.49625 0.501 0.501 1536.22 0.049 0.457 75 2.423 1.747 3127.10 0.235 2.51726 1.169 1.381 2860.18 0.114 1.163 76 1.020 1.048 2688.69 0.099 0.99527 0.828 0.828 2327.44 0.080 0.786 77 4.203 2.199 3182.87 0.408 4.51928 0.665 0.665 1957.38 0.065 0.620 78 2.027 1.595 3098.39 0.197 2.10629 0.911 0.911 2489.41 0.089 0.878 79 1.844 2.759 3087.57 0.179 1.91730 0.200 0.200 665.64 0.019 0.181 80 NC NC NC NC NC31 1.468 1.378 3031.72 0.143 1.509 81 NC NC NC NC NC32 0.942 0.942 2548.42 0.092 0.911 82 NC NC NC NC NC33 0.480 0.480 1477.86 0.047 0.437 83 2.438 4.293 3128.42 0.237 2.53334 0.436 0.436 1354.69 0.042 0.396 84 1.358 1.515 2985.65 0.132 1.37935 0.681 0.681 1997.84 0.066 0.636 85 1.856 1.844 3088.27 0.180 1.92936 0.815 0.815 2301.57 0.079 0.773 86 1.369 1.512 2991.32 0.133 1.39237 1.296 1.554 2949.15 0.126 1.308 87 NC NC NC NC NC38 1.163 1.242 2854.47 0.113 1.156 88 2.450 2.595 3129.14 0.238 2.54539 0.337 0.337 1066.62 0.033 0.305 89 1.696 2.014 3080.65 0.165 1.76040 0.907 0.907 2481.47 0.088 0.874 90 2.164 2.261 3111.12 0.210 2.25341 1.598 1.537 3074.57 0.155 1.657 91 NC NC NC NC NC42 0.841 0.841 2354.19 0.082 0.800 92 1.378 1.928 2995.40 0.134 1.40243 1.769 1.558 3084.54 0.172 1.838 93 3.132 2.821 3121.28 0.304 3.31444 0.927 0.927 2520.62 0.090 0.895 94 NC NC NC NC NC45 1.485 1.441 3039.28 0.144 1.529 95 1.826 3.186 3088.11 0.178 1.89946 0.425 0.425 1320.52 0.041 0.385 96 2.149 3.007 3109.88 0.209 2.23847 0.501 0.501 1536.59 0.049 0.457 97 1.990 3.311 3098.51 0.193 2.06848 0.717 0.717 2082.79 0.070 0.672 98 1.675 3.574 3079.35 0.163 1.73849 0.971 0.971 2602.90 0.094 0.942 99 NC NC NC NC NC50 1.582 1.733 3072.04 0.154 1.639 100 2.461 3.746 3129.71 0.239 2.557
EQ EQFEMAFEMA
V : Maximum Base Shear Δ : Maximum Roof Displacement MIDR : Maximum Inter-Story Drift Ratio NC : Not Considered
123
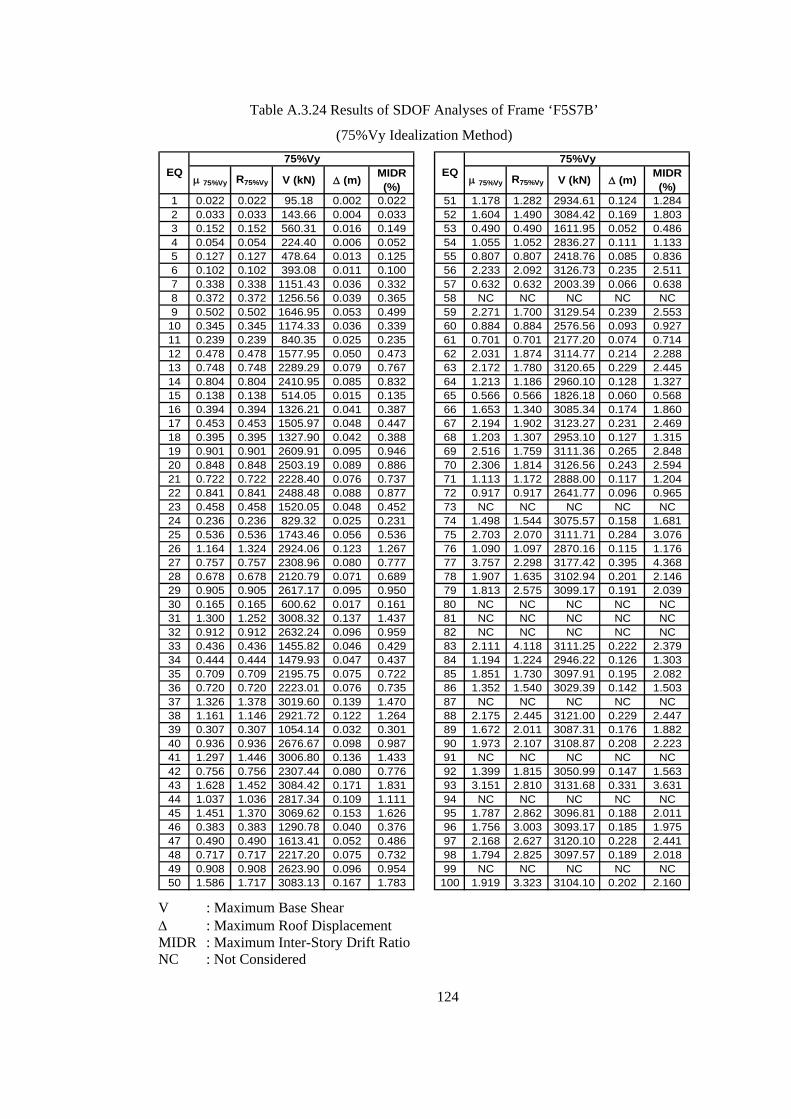
Table A.3.24 Results of SDOF Analyses of Frame ‘F5S7B’
(75%Vy Idealization Method)
μ 75%Vy R75%Vy V (kN) Δ (m) MIDR (%) μ 75%Vy R75%Vy V (kN) Δ (m) MIDR
(%)1 0.022 0.022 95.18 0.002 0.022 51 1.178 1.282 2934.61 0.124 1.2842 0.033 0.033 143.66 0.004 0.033 52 1.604 1.490 3084.42 0.169 1.8033 0.152 0.152 560.31 0.016 0.149 53 0.490 0.490 1611.95 0.052 0.4864 0.054 0.054 224.40 0.006 0.052 54 1.055 1.052 2836.27 0.111 1.1335 0.127 0.127 478.64 0.013 0.125 55 0.807 0.807 2418.76 0.085 0.8366 0.102 0.102 393.08 0.011 0.100 56 2.233 2.092 3126.73 0.235 2.5117 0.338 0.338 1151.43 0.036 0.332 57 0.632 0.632 2003.39 0.066 0.6388 0.372 0.372 1256.56 0.039 0.365 58 NC NC NC NC NC9 0.502 0.502 1646.95 0.053 0.499 59 2.271 1.700 3129.54 0.239 2.553
10 0.345 0.345 1174.33 0.036 0.339 60 0.884 0.884 2576.56 0.093 0.92711 0.239 0.239 840.35 0.025 0.235 61 0.701 0.701 2177.20 0.074 0.71412 0.478 0.478 1577.95 0.050 0.473 62 2.031 1.874 3114.77 0.214 2.28813 0.748 0.748 2289.29 0.079 0.767 63 2.172 1.780 3120.65 0.229 2.44514 0.804 0.804 2410.95 0.085 0.832 64 1.213 1.186 2960.10 0.128 1.32715 0.138 0.138 514.05 0.015 0.135 65 0.566 0.566 1826.18 0.060 0.56816 0.394 0.394 1326.21 0.041 0.387 66 1.653 1.340 3085.34 0.174 1.86017 0.453 0.453 1505.97 0.048 0.447 67 2.194 1.902 3123.27 0.231 2.46918 0.395 0.395 1327.90 0.042 0.388 68 1.203 1.307 2953.10 0.127 1.31519 0.901 0.901 2609.91 0.095 0.946 69 2.516 1.759 3111.36 0.265 2.84820 0.848 0.848 2503.19 0.089 0.886 70 2.306 1.814 3126.56 0.243 2.59421 0.722 0.722 2228.40 0.076 0.737 71 1.113 1.172 2888.00 0.117 1.20422 0.841 0.841 2488.48 0.088 0.877 72 0.917 0.917 2641.77 0.096 0.96523 0.458 0.458 1520.05 0.048 0.452 73 NC NC NC NC NC24 0.236 0.236 829.32 0.025 0.231 74 1.498 1.544 3075.57 0.158 1.68125 0.536 0.536 1743.46 0.056 0.536 75 2.703 2.070 3111.71 0.284 3.07626 1.164 1.324 2924.06 0.123 1.267 76 1.090 1.097 2870.16 0.115 1.17627 0.757 0.757 2308.96 0.080 0.777 77 3.757 2.298 3177.42 0.395 4.36828 0.678 0.678 2120.79 0.071 0.689 78 1.907 1.635 3102.94 0.201 2.14629 0.905 0.905 2617.17 0.095 0.950 79 1.813 2.575 3099.17 0.191 2.03930 0.165 0.165 600.62 0.017 0.161 80 NC NC NC NC NC31 1.300 1.252 3008.32 0.137 1.437 81 NC NC NC NC NC32 0.912 0.912 2632.24 0.096 0.959 82 NC NC NC NC NC33 0.436 0.436 1455.82 0.046 0.429 83 2.111 4.118 3111.25 0.222 2.37934 0.444 0.444 1479.93 0.047 0.437 84 1.194 1.224 2946.22 0.126 1.30335 0.709 0.709 2195.75 0.075 0.722 85 1.851 1.730 3097.91 0.195 2.08236 0.720 0.720 2223.01 0.076 0.735 86 1.352 1.540 3029.39 0.142 1.50337 1.326 1.378 3019.60 0.139 1.470 87 NC NC NC NC NC38 1.161 1.146 2921.72 0.122 1.264 88 2.175 2.445 3121.00 0.229 2.44739 0.307 0.307 1054.14 0.032 0.301 89 1.672 2.011 3087.31 0.176 1.88240 0.936 0.936 2676.67 0.098 0.987 90 1.973 2.107 3108.87 0.208 2.22341 1.297 1.446 3006.80 0.136 1.433 91 NC NC NC NC NC42 0.756 0.756 2307.44 0.080 0.776 92 1.399 1.815 3050.99 0.147 1.56343 1.628 1.452 3084.42 0.171 1.831 93 3.151 2.810 3131.68 0.331 3.63144 1.037 1.036 2817.34 0.109 1.111 94 NC NC NC NC NC45 1.451 1.370 3069.62 0.153 1.626 95 1.787 2.862 3096.81 0.188 2.01146 0.383 0.383 1290.78 0.040 0.376 96 1.756 3.003 3093.17 0.185 1.97547 0.490 0.490 1613.41 0.052 0.486 97 2.168 2.627 3120.10 0.228 2.44148 0.717 0.717 2217.20 0.075 0.732 98 1.794 2.825 3097.57 0.189 2.01849 0.908 0.908 2623.90 0.096 0.954 99 NC NC NC NC NC50 1.586 1.717 3083.13 0.167 1.783 100 1.919 3.323 3104.10 0.202 2.160
EQ EQ75%Vy75%Vy
V : Maximum Base Shear Δ : Maximum Roof Displacement MIDR : Maximum Inter-Story Drift Ratio NC : Not Considered
124

Table A.3.25 Results of SDOF Analyses of Frame ‘F8S3B’
(MULTI Idealization Method)
μ MULTI RMULTI V (kN) Δ (m) MIDR (%) μ MULTI RMULTI V (kN) Δ (m) MIDR
(%)1 0.034 0.034 115.24 0.005 0.020 51 1.920 1.895 3599.79 0.290 1.2472 0.024 0.024 82.96 0.004 0.015 52 1.308 0.971 3259.63 0.197 0.7973 0.177 0.177 563.81 0.027 0.106 53 0.916 0.865 2507.81 0.138 0.5434 0.047 0.047 163.80 0.007 0.028 54 1.575 1.422 3432.64 0.238 0.9965 0.081 0.081 277.20 0.012 0.048 55 1.585 1.628 3437.62 0.239 1.0036 0.118 0.119 391.13 0.018 0.070 56 1.930 2.214 3603.80 0.291 1.2547 0.290 0.297 874.06 0.044 0.173 57 1.206 1.122 3160.59 0.182 0.7188 0.467 0.546 1343.08 0.070 0.278 58 2.027 1.906 3644.58 0.306 1.3239 0.726 0.756 2019.78 0.110 0.431 59 4.341 2.876 4026.35 0.655 2.661
10 0.299 0.294 898.17 0.045 0.178 60 0.644 0.771 1805.80 0.097 0.38311 0.276 0.260 836.89 0.042 0.165 61 1.309 1.357 3260.59 0.197 0.79812 0.665 0.571 1860.31 0.100 0.395 62 1.023 1.156 2780.09 0.154 0.60613 0.470 0.635 1353.37 0.071 0.280 63 1.626 2.217 3460.05 0.245 1.03414 0.911 0.876 2494.63 0.137 0.540 64 2.233 1.444 3720.47 0.337 1.46715 0.218 0.279 676.41 0.033 0.130 65 1.047 0.983 2841.04 0.158 0.62016 0.638 0.532 1790.93 0.096 0.379 66 1.277 1.023 3233.51 0.193 0.77317 0.888 0.841 2435.98 0.134 0.527 67 1.549 1.952 3418.43 0.234 0.97718 0.297 0.337 893.19 0.045 0.177 68 2.180 2.443 3701.76 0.329 1.43019 1.053 1.119 2856.09 0.159 0.624 69 2.092 3.182 3669.54 0.315 1.36920 2.927 2.357 3890.27 0.441 1.905 70 2.184 3.214 3703.42 0.329 1.43321 0.890 1.046 2441.96 0.134 0.528 71 0.761 0.888 2110.01 0.115 0.45222 1.267 1.319 3224.97 0.191 0.765 72 1.785 1.694 3538.43 0.269 1.14923 0.458 0.448 1320.94 0.069 0.273 73 3.028 2.749 3906.13 0.457 1.96424 0.350 0.386 1033.75 0.053 0.208 74 1.207 1.446 3162.47 0.182 0.71925 0.966 0.819 2637.05 0.146 0.573 75 2.267 1.655 3731.73 0.342 1.48926 1.224 1.710 3183.11 0.185 0.730 76 1.145 1.355 3058.45 0.173 0.67727 0.868 0.846 2385.04 0.131 0.515 77 NC NC NC NC NC28 2.475 2.080 3797.61 0.373 1.630 78 1.748 2.813 3521.14 0.264 1.12229 2.251 1.994 3726.44 0.339 1.479 79 1.075 1.158 2906.54 0.162 0.63630 0.083 0.083 282.10 0.012 0.049 80 2.226 4.019 3717.84 0.336 1.46131 1.211 1.251 3167.98 0.183 0.721 81 4.798 4.863 4055.98 0.724 2.89632 1.641 1.388 3467.87 0.247 1.045 82 NC NC NC NC NC33 0.265 0.262 807.42 0.040 0.158 83 1.551 2.124 3419.70 0.234 0.97834 0.628 0.697 1763.86 0.095 0.373 84 1.032 0.931 2803.53 0.156 0.61235 0.703 0.505 1960.67 0.106 0.418 85 1.616 2.271 3454.32 0.244 1.02636 0.866 0.845 2379.34 0.131 0.514 86 1.826 1.874 3557.34 0.275 1.17937 1.523 1.933 3404.36 0.230 0.957 87 2.666 2.202 3845.09 0.402 1.75338 1.053 1.138 2857.68 0.159 0.624 88 2.522 2.828 3810.55 0.380 1.66139 0.177 0.191 562.23 0.027 0.105 89 2.528 2.954 3811.97 0.381 1.66540 2.902 1.792 3885.94 0.438 1.890 90 1.505 1.419 3394.02 0.227 0.94441 1.528 1.443 3407.33 0.230 0.961 91 2.649 2.466 3841.13 0.399 1.74242 0.401 0.385 1169.96 0.060 0.239 92 1.700 1.554 3497.54 0.256 1.08743 1.586 1.215 3438.41 0.239 1.004 93 1.639 2.522 3466.45 0.247 1.04344 1.760 2.351 3526.90 0.265 1.131 94 2.699 3.099 3851.79 0.407 1.77245 1.806 1.697 3548.42 0.272 1.165 95 3.283 3.124 3939.34 0.495 2.10746 0.361 0.315 1064.98 0.054 0.215 96 1.186 1.728 3128.70 0.179 0.70447 1.079 0.900 2915.79 0.163 0.639 97 1.436 1.551 3352.68 0.217 0.89348 1.223 0.999 3182.17 0.184 0.730 98 1.949 1.746 3611.99 0.294 1.26749 1.085 0.952 2929.18 0.164 0.642 99 1.948 2.257 3611.72 0.294 1.26750 1.715 1.552 3505.11 0.259 1.099 100 NC NC NC NC NC
EQ EQMULTIMULTI
V : Maximum Base Shear Δ : Maximum Roof Displacement MIDR : Maximum Inter-Story Drift Ratio NC : Not Considered
125

Table A.3.26 Results of SDOF Analyses of Frame ‘F8S3B’
(ATC Idealization Method)
μ ATC RATC V (kN) Δ (m) MIDR (%) μ ATC RATC V (kN) Δ (m) MIDR
(%)1 0.034 0.034 115.23 0.005 0.020 51 1.578 1.895 3434.25 0.238 0.9982 0.024 0.024 82.97 0.004 0.015 52 0.971 0.971 2649.06 0.146 0.5763 0.177 0.177 563.11 0.027 0.106 53 0.865 0.865 2378.02 0.130 0.5134 0.047 0.047 163.79 0.007 0.028 54 1.333 1.422 3279.15 0.201 0.8165 0.081 0.081 277.14 0.012 0.048 55 1.344 1.628 3287.13 0.203 0.8246 0.119 0.119 394.16 0.018 0.071 56 1.696 2.214 3495.65 0.256 1.0857 0.297 0.297 891.78 0.045 0.177 57 1.104 1.122 2971.82 0.166 0.6528 0.547 0.547 1552.86 0.082 0.325 58 1.466 1.906 3371.11 0.221 0.9159 0.756 0.756 2096.88 0.114 0.449 59 4.080 2.876 4007.57 0.615 2.526
10 0.294 0.294 885.36 0.044 0.176 60 0.772 0.772 2136.67 0.116 0.45811 0.260 0.260 791.82 0.039 0.155 61 1.448 1.357 3360.18 0.218 0.90212 0.571 0.571 1617.06 0.086 0.340 62 1.092 1.156 2945.10 0.165 0.64613 0.635 0.635 1782.73 0.096 0.377 63 2.152 2.217 3691.82 0.324 1.41114 0.876 0.876 2405.59 0.132 0.520 64 1.648 1.444 3471.16 0.248 1.05015 0.279 0.279 843.77 0.042 0.166 65 0.983 0.983 2678.91 0.148 0.58316 0.532 0.532 1514.71 0.080 0.317 66 1.023 1.023 2781.66 0.154 0.60717 0.841 0.841 2316.69 0.127 0.499 67 1.635 1.952 3464.56 0.247 1.04018 0.337 0.337 1000.24 0.051 0.201 68 1.620 2.443 3456.75 0.244 1.02919 1.132 1.119 3032.05 0.171 0.668 69 2.096 3.182 3671.18 0.316 1.37220 2.264 2.357 3730.84 0.341 1.487 70 2.246 3.214 3724.74 0.339 1.47521 1.048 1.046 2843.53 0.158 0.621 71 0.888 0.888 2435.48 0.134 0.52722 1.150 1.320 3067.71 0.173 0.680 72 1.733 1.694 3514.05 0.261 1.11223 0.448 0.448 1293.28 0.067 0.267 73 2.453 2.749 3791.33 0.370 1.61524 0.386 0.386 1130.76 0.058 0.230 74 1.210 1.446 3165.93 0.182 0.72025 0.819 0.819 2258.53 0.123 0.486 75 2.359 1.655 3762.10 0.356 1.55226 1.401 1.710 3328.60 0.211 0.867 76 1.328 1.355 3275.12 0.200 0.81227 0.846 0.846 2327.28 0.128 0.502 77 NC NC NC NC NC28 2.254 2.080 3727.50 0.340 1.481 78 1.642 2.813 3468.15 0.248 1.04529 1.637 1.994 3465.77 0.247 1.042 79 1.131 1.158 3031.52 0.171 0.66830 0.083 0.083 282.11 0.012 0.049 80 2.612 4.019 3832.61 0.394 1.71931 1.293 1.251 3247.39 0.195 0.786 81 4.308 4.863 4024.11 0.650 2.64432 1.255 1.388 3214.19 0.189 0.756 82 NC NC NC NC NC33 0.262 0.262 797.48 0.039 0.156 83 1.627 2.124 3460.44 0.245 1.03534 0.697 0.697 1943.72 0.105 0.414 84 0.931 0.931 2547.32 0.140 0.55235 0.505 0.505 1443.95 0.076 0.301 85 1.716 2.271 3505.60 0.259 1.09936 0.845 0.845 2325.64 0.127 0.501 86 1.947 1.875 3611.48 0.294 1.26737 1.315 1.933 3265.28 0.198 0.802 87 2.526 2.203 3811.44 0.381 1.66338 1.057 1.138 2866.58 0.159 0.626 88 1.972 2.828 3621.98 0.297 1.28439 0.191 0.191 602.56 0.029 0.114 89 2.069 2.954 3660.88 0.312 1.35340 2.241 1.792 3723.24 0.338 1.472 90 1.715 1.419 3504.99 0.259 1.09841 1.300 1.442 3252.87 0.196 0.791 91 2.952 2.466 3894.24 0.445 1.91942 0.385 0.385 1126.51 0.058 0.229 92 1.688 1.554 3491.60 0.255 1.07943 1.242 1.215 3201.80 0.187 0.745 93 1.946 2.523 3611.03 0.293 1.26644 1.626 2.351 3459.70 0.245 1.034 94 2.199 3.099 3708.45 0.332 1.44345 1.598 1.696 3445.02 0.241 1.013 95 3.761 3.124 3987.22 0.567 2.36346 0.315 0.315 940.70 0.047 0.188 96 1.311 1.729 3262.02 0.198 0.79947 0.900 0.900 2467.80 0.136 0.534 97 1.794 1.551 3542.95 0.271 1.15648 0.999 0.999 2719.55 0.151 0.592 98 2.039 1.746 3649.11 0.307 1.33249 0.952 0.952 2600.17 0.144 0.565 99 1.970 2.258 3621.19 0.297 1.28350 1.781 1.552 3536.52 0.269 1.146 100 NC NC NC NC NC
EQ EQATCATC
V : Maximum Base Shear Δ : Maximum Roof Displacement MIDR : Maximum Inter-Story Drift Ratio NC : Not Considered
126
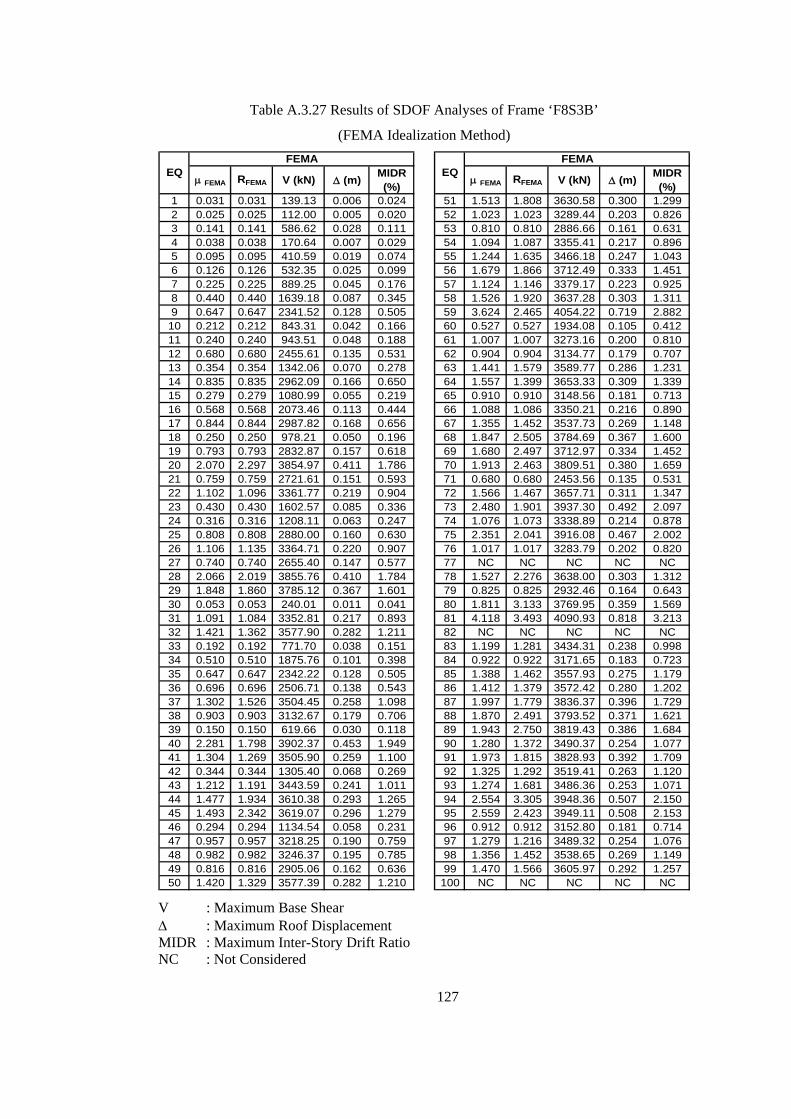
Table A.3.27 Results of SDOF Analyses of Frame ‘F8S3B’
(FEMA Idealization Method)
μ FEMA RFEMA V (kN) Δ (m) MIDR (%) μ FEMA RFEMA V (kN) Δ (m) MIDR
(%)1 0.031 0.031 139.13 0.006 0.024 51 1.513 1.808 3630.58 0.300 1.2992 0.025 0.025 112.00 0.005 0.020 52 1.023 1.023 3289.44 0.203 0.8263 0.141 0.141 586.62 0.028 0.111 53 0.810 0.810 2886.66 0.161 0.6314 0.038 0.038 170.64 0.007 0.029 54 1.094 1.087 3355.41 0.217 0.8965 0.095 0.095 410.59 0.019 0.074 55 1.244 1.635 3466.18 0.247 1.0436 0.126 0.126 532.35 0.025 0.099 56 1.679 1.866 3712.49 0.333 1.4517 0.225 0.225 889.25 0.045 0.176 57 1.124 1.146 3379.17 0.223 0.9258 0.440 0.440 1639.18 0.087 0.345 58 1.526 1.920 3637.28 0.303 1.3119 0.647 0.647 2341.52 0.128 0.505 59 3.624 2.465 4054.22 0.719 2.882
10 0.212 0.212 843.31 0.042 0.166 60 0.527 0.527 1934.08 0.105 0.41211 0.240 0.240 943.51 0.048 0.188 61 1.007 1.007 3273.16 0.200 0.81012 0.680 0.680 2455.61 0.135 0.531 62 0.904 0.904 3134.77 0.179 0.70713 0.354 0.354 1342.06 0.070 0.278 63 1.441 1.579 3589.77 0.286 1.23114 0.835 0.835 2962.09 0.166 0.650 64 1.557 1.399 3653.33 0.309 1.33915 0.279 0.279 1080.99 0.055 0.219 65 0.910 0.910 3148.56 0.181 0.71316 0.568 0.568 2073.46 0.113 0.444 66 1.088 1.086 3350.21 0.216 0.89017 0.844 0.844 2987.82 0.168 0.656 67 1.355 1.452 3537.73 0.269 1.14818 0.250 0.250 978.21 0.050 0.196 68 1.847 2.505 3784.69 0.367 1.60019 0.793 0.793 2832.87 0.157 0.618 69 1.680 2.497 3712.97 0.334 1.45220 2.070 2.297 3854.97 0.411 1.786 70 1.913 2.463 3809.51 0.380 1.65921 0.759 0.759 2721.61 0.151 0.593 71 0.680 0.680 2453.56 0.135 0.53122 1.102 1.096 3361.77 0.219 0.904 72 1.566 1.467 3657.71 0.311 1.34723 0.430 0.430 1602.57 0.085 0.336 73 2.480 1.901 3937.30 0.492 2.09724 0.316 0.316 1208.11 0.063 0.247 74 1.076 1.073 3338.89 0.214 0.87825 0.808 0.808 2880.00 0.160 0.630 75 2.351 2.041 3916.08 0.467 2.00226 1.106 1.135 3364.71 0.220 0.907 76 1.017 1.017 3283.79 0.202 0.82027 0.740 0.740 2655.40 0.147 0.577 77 NC NC NC NC NC28 2.066 2.019 3855.76 0.410 1.784 78 1.527 2.276 3638.00 0.303 1.31229 1.848 1.860 3785.12 0.367 1.601 79 0.825 0.825 2932.46 0.164 0.64330 0.053 0.053 240.01 0.011 0.041 80 1.811 3.133 3769.95 0.359 1.56931 1.091 1.084 3352.81 0.217 0.893 81 4.118 3.493 4090.93 0.818 3.21332 1.421 1.362 3577.90 0.282 1.211 82 NC NC NC NC NC33 0.192 0.192 771.70 0.038 0.151 83 1.199 1.281 3434.31 0.238 0.99834 0.510 0.510 1875.76 0.101 0.398 84 0.922 0.922 3171.65 0.183 0.72335 0.647 0.647 2342.22 0.128 0.505 85 1.388 1.462 3557.93 0.275 1.17936 0.696 0.696 2506.71 0.138 0.543 86 1.412 1.379 3572.42 0.280 1.20237 1.302 1.526 3504.45 0.258 1.098 87 1.997 1.779 3836.37 0.396 1.72938 0.903 0.903 3132.67 0.179 0.706 88 1.870 2.491 3793.52 0.371 1.62139 0.150 0.150 619.66 0.030 0.118 89 1.943 2.750 3819.43 0.386 1.68440 2.281 1.798 3902.37 0.453 1.949 90 1.280 1.372 3490.37 0.254 1.07741 1.304 1.269 3505.90 0.259 1.100 91 1.973 1.815 3828.93 0.392 1.70942 0.344 0.344 1305.40 0.068 0.269 92 1.325 1.292 3519.41 0.263 1.12043 1.212 1.191 3443.59 0.241 1.011 93 1.274 1.681 3486.36 0.253 1.07144 1.477 1.934 3610.38 0.293 1.265 94 2.554 3.305 3948.36 0.507 2.15045 1.493 2.342 3619.07 0.296 1.279 95 2.559 2.423 3949.11 0.508 2.15346 0.294 0.294 1134.54 0.058 0.231 96 0.912 0.912 3152.80 0.181 0.71447 0.957 0.957 3218.25 0.190 0.759 97 1.279 1.216 3489.32 0.254 1.07648 0.982 0.982 3246.37 0.195 0.785 98 1.356 1.452 3538.65 0.269 1.14949 0.816 0.816 2905.06 0.162 0.636 99 1.470 1.566 3605.97 0.292 1.25750 1.420 1.329 3577.39 0.282 1.210 100 NC NC NC NC NC
EQ EQFEMAFEMA
V : Maximum Base Shear Δ : Maximum Roof Displacement MIDR : Maximum Inter-Story Drift Ratio NC : Not Considered
127
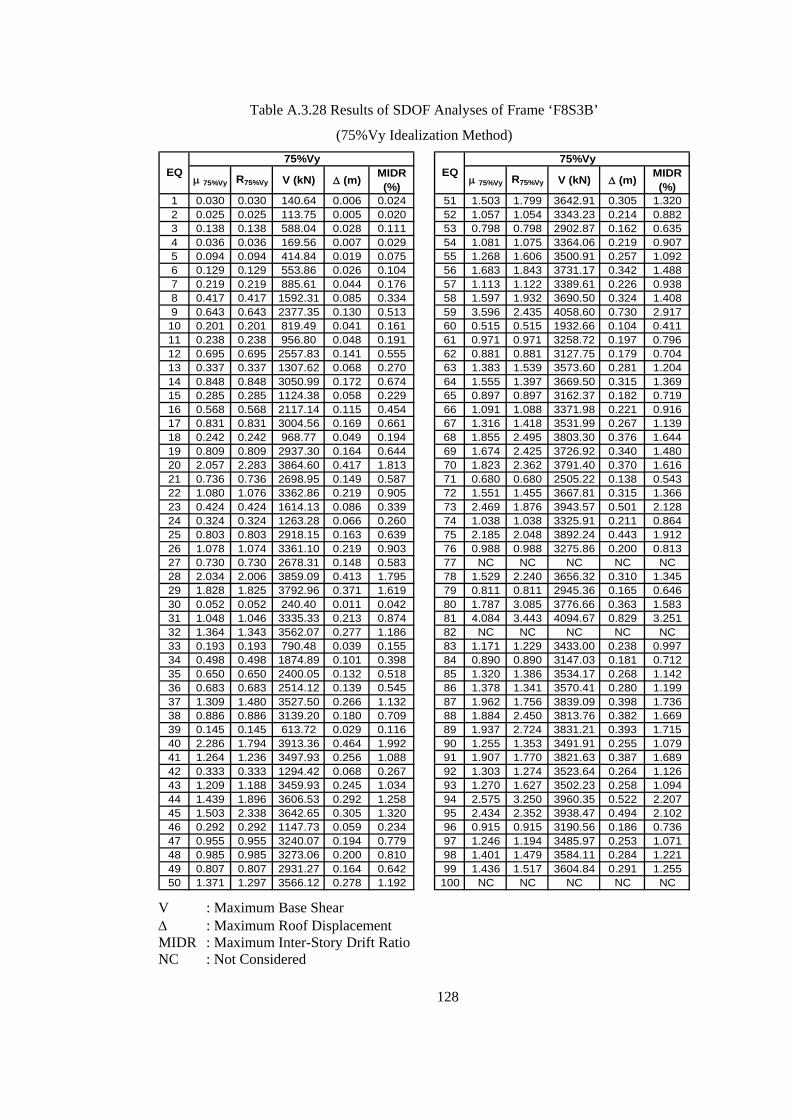
Table A.3.28 Results of SDOF Analyses of Frame ‘F8S3B’
(75%Vy Idealization Method)
μ 75%Vy R75%Vy V (kN) Δ (m) MIDR (%) μ 75%Vy R75%Vy V (kN) Δ (m) MIDR
(%)1 0.030 0.030 140.64 0.006 0.024 51 1.503 1.799 3642.91 0.305 1.3202 0.025 0.025 113.75 0.005 0.020 52 1.057 1.054 3343.23 0.214 0.8823 0.138 0.138 588.04 0.028 0.111 53 0.798 0.798 2902.87 0.162 0.6354 0.036 0.036 169.56 0.007 0.029 54 1.081 1.075 3364.06 0.219 0.9075 0.094 0.094 414.84 0.019 0.075 55 1.268 1.606 3500.91 0.257 1.0926 0.129 0.129 553.86 0.026 0.104 56 1.683 1.843 3731.17 0.342 1.4887 0.219 0.219 885.61 0.044 0.176 57 1.113 1.122 3389.61 0.226 0.9388 0.417 0.417 1592.31 0.085 0.334 58 1.597 1.932 3690.50 0.324 1.4089 0.643 0.643 2377.35 0.130 0.513 59 3.596 2.435 4058.60 0.730 2.917
10 0.201 0.201 819.49 0.041 0.161 60 0.515 0.515 1932.66 0.104 0.41111 0.238 0.238 956.80 0.048 0.191 61 0.971 0.971 3258.72 0.197 0.79612 0.695 0.695 2557.83 0.141 0.555 62 0.881 0.881 3127.75 0.179 0.70413 0.337 0.337 1307.62 0.068 0.270 63 1.383 1.539 3573.60 0.281 1.20414 0.848 0.848 3050.99 0.172 0.674 64 1.555 1.397 3669.50 0.315 1.36915 0.285 0.285 1124.38 0.058 0.229 65 0.897 0.897 3162.37 0.182 0.71916 0.568 0.568 2117.14 0.115 0.454 66 1.091 1.088 3371.98 0.221 0.91617 0.831 0.831 3004.56 0.169 0.661 67 1.316 1.418 3531.99 0.267 1.13918 0.242 0.242 968.77 0.049 0.194 68 1.855 2.495 3803.30 0.376 1.64419 0.809 0.809 2937.30 0.164 0.644 69 1.674 2.425 3726.92 0.340 1.48020 2.057 2.283 3864.60 0.417 1.813 70 1.823 2.362 3791.40 0.370 1.61621 0.736 0.736 2698.95 0.149 0.587 71 0.680 0.680 2505.22 0.138 0.54322 1.080 1.076 3362.86 0.219 0.905 72 1.551 1.455 3667.81 0.315 1.36623 0.424 0.424 1614.13 0.086 0.339 73 2.469 1.876 3943.57 0.501 2.12824 0.324 0.324 1263.28 0.066 0.260 74 1.038 1.038 3325.91 0.211 0.86425 0.803 0.803 2918.15 0.163 0.639 75 2.185 2.048 3892.24 0.443 1.91226 1.078 1.074 3361.10 0.219 0.903 76 0.988 0.988 3275.86 0.200 0.81327 0.730 0.730 2678.31 0.148 0.583 77 NC NC NC NC NC28 2.034 2.006 3859.09 0.413 1.795 78 1.529 2.240 3656.32 0.310 1.34529 1.828 1.825 3792.96 0.371 1.619 79 0.811 0.811 2945.36 0.165 0.64630 0.052 0.052 240.40 0.011 0.042 80 1.787 3.085 3776.66 0.363 1.58331 1.048 1.046 3335.33 0.213 0.874 81 4.084 3.443 4094.67 0.829 3.25132 1.364 1.343 3562.07 0.277 1.186 82 NC NC NC NC NC33 0.193 0.193 790.48 0.039 0.155 83 1.171 1.229 3433.00 0.238 0.99734 0.498 0.498 1874.89 0.101 0.398 84 0.890 0.890 3147.03 0.181 0.71235 0.650 0.650 2400.05 0.132 0.518 85 1.320 1.386 3534.17 0.268 1.14236 0.683 0.683 2514.12 0.139 0.545 86 1.378 1.341 3570.41 0.280 1.19937 1.309 1.480 3527.50 0.266 1.132 87 1.962 1.756 3839.09 0.398 1.73638 0.886 0.886 3139.20 0.180 0.709 88 1.884 2.450 3813.76 0.382 1.66939 0.145 0.145 613.72 0.029 0.116 89 1.937 2.724 3831.21 0.393 1.71540 2.286 1.794 3913.36 0.464 1.992 90 1.255 1.353 3491.91 0.255 1.07941 1.264 1.236 3497.93 0.256 1.088 91 1.907 1.770 3821.63 0.387 1.68942 0.333 0.333 1294.42 0.068 0.267 92 1.303 1.274 3523.64 0.264 1.12643 1.209 1.188 3459.93 0.245 1.034 93 1.270 1.627 3502.23 0.258 1.09444 1.439 1.896 3606.53 0.292 1.258 94 2.575 3.250 3960.35 0.522 2.20745 1.503 2.338 3642.65 0.305 1.320 95 2.434 2.352 3938.47 0.494 2.10246 0.292 0.292 1147.73 0.059 0.234 96 0.915 0.915 3190.56 0.186 0.73647 0.955 0.955 3240.07 0.194 0.779 97 1.246 1.194 3485.97 0.253 1.07148 0.985 0.985 3273.06 0.200 0.810 98 1.401 1.479 3584.11 0.284 1.22149 0.807 0.807 2931.27 0.164 0.642 99 1.436 1.517 3604.84 0.291 1.25550 1.371 1.297 3566.12 0.278 1.192 100 NC NC NC NC NC
EQ EQ75%Vy75%Vy
V : Maximum Base Shear Δ : Maximum Roof Displacement MIDR : Maximum Inter-Story Drift Ratio NC : Not Considered
128

A.4 COMPARISON RESULTS OF APPROXIMATIONS
Table A.4.1 Comparison Results of Approximations with respect to ‘EXACT’ Values of
Maximum Top Displacement for Frame ‘F2S2B’
EQ MULTI ATC FEMA 75%Vy EQ MULTI ATC FEMA 75%Vy
1 1.175 1.175 1.121 1.015 51 0.810 0.653 0.871 1.1972 1.001 1.001 0.980 1.137 52 1.056 0.967 1.119 1.2543 0.938 1.083 1.095 1.298 53 0.904 0.869 0.934 1.0374 1.003 1.003 1.497 1.672 54 0.923 0.892 0.882 0.9345 1.047 1.054 1.271 1.455 55 0.974 1.141 0.891 1.1496 0.933 0.995 1.010 0.943 56 0.990 0.935 1.048 1.2237 0.939 1.021 1.005 1.297 57 0.912 1.010 1.180 1.2078 0.858 0.824 0.969 0.973 58 0.959 0.694 0.805 0.9489 0.901 0.881 1.158 1.193 59 0.906 0.799 0.873 0.963
10 0.851 0.789 1.104 1.130 60 0.898 0.846 1.043 1.34011 0.832 0.763 1.078 1.119 61 0.762 0.729 0.949 1.25212 0.805 0.860 0.947 1.198 62 0.957 1.035 1.172 1.24613 0.983 1.024 0.999 1.077 63 0.734 0.485 0.624 1.18214 0.752 0.850 0.848 1.123 64 0.909 0.844 0.881 0.96615 0.850 0.799 1.082 0.888 65 0.957 1.099 0.944 1.05816 0.828 0.783 1.040 1.054 66 1.059 0.981 0.988 1.39617 1.041 1.283 1.021 1.084 67 0.920 0.897 1.005 1.29918 0.788 0.754 0.912 1.178 68 0.989 1.171 1.291 1.25719 0.876 1.008 0.936 1.131 69 0.919 0.666 0.954 1.32420 0.933 0.801 0.945 1.070 70 1.016 0.758 0.879 1.13721 0.767 0.862 0.949 1.241 71 0.922 0.749 0.978 1.23922 0.968 0.869 1.149 1.213 72 0.952 1.197 1.221 1.05323 1.026 0.900 1.066 1.003 73 0.933 0.755 0.864 0.99924 0.979 1.030 0.916 1.099 74 0.929 0.833 0.881 0.84725 0.895 1.137 1.007 0.967 75 0.912 0.830 0.870 0.92426 0.954 0.854 1.047 1.262 76 0.978 0.901 1.206 1.39227 0.974 0.953 1.066 1.042 77 0.494 0.418 0.444 0.59828 0.920 1.032 1.094 0.918 78 0.915 1.065 0.920 1.02529 0.908 0.855 1.040 0.938 79 1.039 0.847 0.952 1.10230 0.935 1.012 1.200 1.490 80 1.069 1.127 1.164 1.13031 0.726 0.540 0.831 1.314 81 0.600 0.473 0.534 0.60132 0.948 1.152 1.186 1.228 82 1.067 0.984 0.987 0.98433 0.982 0.984 1.015 1.030 83 1.007 0.940 0.950 0.97934 0.890 1.074 1.052 0.982 84 0.962 0.969 0.943 1.16435 1.169 1.386 1.054 1.280 85 0.965 0.894 0.895 0.91536 0.865 0.954 1.092 1.019 86 0.910 0.752 0.926 1.12137 0.901 0.683 1.056 1.279 87 1.070 0.921 1.001 1.12538 0.952 0.899 0.931 1.306 88 NC NC NC NC39 0.960 1.084 0.959 0.872 89 0.902 0.733 0.846 0.95540 1.085 1.119 1.067 1.160 90 1.018 0.954 1.029 1.17541 0.999 0.950 1.032 1.272 91 0.970 0.948 0.968 0.99642 1.046 0.953 1.154 1.129 92 1.016 1.028 1.151 1.07443 1.024 0.879 0.894 1.163 93 0.773 0.632 0.720 0.84044 1.056 0.988 1.251 0.970 94 1.122 0.962 1.031 1.12545 0.700 0.612 0.752 1.206 95 0.931 0.918 0.921 0.99346 1.003 1.067 0.977 0.863 96 1.175 1.377 1.458 1.42147 1.000 1.028 1.053 0.998 97 1.112 1.251 1.283 1.46348 0.800 0.990 0.981 0.987 98 1.106 1.168 0.993 1.11249 0.937 0.931 1.035 1.160 99 1.105 1.001 1.044 1.10250 0.905 0.901 0.950 1.104 100 1.179 1.146 1.133 1.232
NC : Not Considered
129

Table A.4.2 Comparison Results of Approximations with respect to ‘EXACT’ Values of
Maximum Inter-story Drift Ratio for Frame ‘F2S2B’
EQ MULTI ATC FEMA 75%Vy EQ MULTI ATC FEMA 75%Vy
1 1.184 1.184 1.129 1.023 51 0.806 0.640 0.870 1.1942 1.006 1.006 0.985 1.142 52 0.940 0.875 0.987 1.0923 0.963 1.107 1.119 1.319 53 0.802 0.771 0.828 0.9204 0.987 0.987 1.455 1.620 54 0.934 0.905 0.895 0.9455 1.071 1.078 1.293 1.472 55 0.965 1.131 0.880 1.1396 0.830 0.883 0.897 0.838 56 1.001 0.951 1.055 1.2247 0.928 1.008 0.992 1.278 57 0.912 1.018 1.200 1.2278 0.870 0.836 0.982 0.985 58 0.906 0.701 0.789 0.8989 0.885 0.864 1.155 1.191 59 0.949 0.853 0.919 1.002
10 0.832 0.771 1.096 1.124 60 0.846 0.796 0.992 1.29111 0.844 0.774 1.090 1.132 61 0.730 0.698 0.917 1.22912 0.831 0.887 0.978 1.237 62 0.935 0.999 1.116 1.18313 1.004 1.048 1.021 1.107 63 0.794 0.522 0.679 1.17114 0.769 0.871 0.869 1.172 64 0.877 0.819 0.853 0.92315 0.833 0.784 1.053 0.869 65 0.876 1.007 0.864 0.96916 0.825 0.780 1.035 1.049 66 0.953 0.896 0.901 1.20817 1.036 1.277 1.016 1.079 67 0.882 0.865 0.950 1.19718 0.776 0.743 0.898 1.168 68 0.946 1.080 1.169 1.14319 0.901 1.041 0.962 1.177 69 0.933 0.717 0.964 1.31520 0.946 0.804 0.958 1.094 70 1.016 0.794 0.896 1.12721 0.768 0.864 0.958 1.272 71 0.872 0.720 0.915 1.10022 0.960 0.856 1.147 1.211 72 0.901 1.114 1.133 0.99323 1.024 0.898 1.063 1.000 73 0.951 0.793 0.888 1.01224 0.986 1.036 0.923 1.106 74 0.863 0.792 0.826 0.80225 0.813 1.041 0.915 0.878 75 0.913 0.844 0.878 0.92426 0.918 0.819 1.007 1.194 76 0.921 0.845 1.141 1.31027 0.935 0.914 1.025 1.002 77 0.372 0.316 0.335 0.44728 0.934 1.056 1.124 0.932 78 0.946 1.077 0.950 1.04129 0.905 0.852 1.030 0.934 79 0.938 0.790 0.870 0.98930 0.724 0.781 0.923 1.141 80 1.019 1.073 1.108 1.07531 0.707 0.516 0.814 1.231 81 0.584 0.464 0.522 0.58632 0.919 1.114 1.145 1.183 82 1.063 0.983 0.986 0.98333 0.944 0.946 0.976 0.990 83 0.980 0.918 0.927 0.95434 0.890 1.087 1.063 0.988 84 0.864 0.869 0.850 1.00135 1.140 1.352 1.028 1.248 85 0.938 0.881 0.882 0.89836 0.850 0.939 1.070 1.002 86 0.896 0.741 0.910 1.07437 0.871 0.664 0.994 1.155 87 1.003 0.868 0.940 1.05338 0.915 0.861 0.894 1.260 88 NC NC NC NC39 0.843 0.951 0.841 0.765 89 0.835 0.711 0.793 0.87440 1.101 1.137 1.083 1.178 90 0.894 0.845 0.902 1.01941 0.961 0.916 0.991 1.186 91 0.967 0.946 0.965 0.99242 1.024 0.931 1.129 1.105 92 0.898 0.906 0.987 0.93443 0.971 0.865 0.876 1.078 93 0.417 0.345 0.389 0.45244 1.030 0.962 1.218 0.944 94 1.039 0.895 0.956 1.04145 0.713 0.619 0.767 1.160 95 0.936 0.924 0.926 0.99546 0.926 0.990 0.901 0.796 96 0.961 1.114 1.179 1.14947 0.910 0.935 0.958 0.908 97 0.918 1.015 1.038 1.17148 0.774 0.972 0.961 0.968 98 0.967 1.014 0.882 0.97249 0.901 0.895 0.998 1.118 99 0.965 0.878 0.913 0.96350 0.902 0.899 0.940 1.053 100 1.125 1.095 1.083 1.175
NC : Not Considered
130

Table A.4.3 Comparison Results of Approximations with respect to ‘EXACT’ Values of
Maximum Base Shear for Frame ‘F2S2B’
EQ MULTI ATC FEMA 75%Vy EQ MULTI ATC FEMA 75%Vy
1 1.082 1.082 1.033 0.937 51 0.841 0.734 0.881 1.0622 1.023 1.023 1.002 1.156 52 0.997 0.977 1.013 1.0293 0.872 1.003 1.015 1.211 53 0.994 0.965 1.019 1.1064 1.018 1.018 1.439 1.586 54 0.959 0.943 0.937 0.9655 0.941 0.947 1.138 1.309 55 0.900 0.991 0.851 0.9956 0.928 0.990 1.006 0.937 56 0.935 0.929 0.940 0.9357 0.936 1.014 0.999 1.270 57 0.817 0.872 0.964 0.9778 0.850 0.817 0.955 0.959 58 0.961 0.894 0.925 0.9599 0.937 0.924 1.100 1.121 59 0.864 0.840 0.859 0.870
10 0.932 0.878 1.106 1.122 60 0.769 0.735 0.847 0.99311 0.812 0.746 1.043 1.081 61 0.759 0.733 0.883 1.05412 0.801 0.850 0.913 1.092 62 1.022 1.043 1.059 1.06313 0.959 0.984 0.969 1.016 63 0.896 0.699 0.820 1.01314 0.761 0.833 0.833 0.995 64 0.964 0.932 0.951 0.98515 0.812 0.762 1.042 0.849 65 1.045 1.159 1.034 1.12916 0.865 0.819 1.055 1.066 66 1.022 1.005 1.007 1.07717 1.023 1.196 1.008 1.054 67 0.956 0.951 0.978 1.00718 0.828 0.801 0.924 1.113 68 1.013 1.051 1.077 1.06919 0.853 0.943 0.898 1.014 69 0.940 0.872 0.945 0.94520 0.922 0.835 0.928 1.006 70 0.994 0.936 0.968 1.00321 0.814 0.890 0.945 1.122 71 0.985 0.893 1.002 1.04822 0.935 0.872 1.042 1.077 72 0.971 1.084 1.091 1.02523 1.066 0.967 1.097 1.048 73 0.875 0.838 0.866 0.88024 1.001 1.051 0.938 1.119 74 1.043 1.022 1.029 1.02325 0.922 1.092 1.010 0.979 75 0.990 0.966 0.977 0.99326 0.965 0.900 1.019 1.109 76 0.901 0.854 1.026 1.10827 1.076 1.061 1.138 1.122 77 0.835 0.848 0.840 0.82828 0.907 0.975 1.012 0.905 78 0.878 0.908 0.879 0.90329 0.964 0.930 1.035 0.982 79 1.030 0.984 1.012 1.03730 0.928 1.008 1.201 1.490 80 0.924 0.921 0.920 0.92131 0.853 0.705 0.930 1.132 81 0.857 0.874 0.863 0.85632 1.032 1.156 1.173 1.193 82 0.962 0.965 0.965 0.96533 1.095 1.097 1.124 1.136 83 0.981 0.979 0.980 0.98034 0.919 1.036 1.022 0.979 84 0.892 0.894 0.887 0.92635 1.126 1.283 1.040 1.207 85 0.895 0.879 0.879 0.88436 0.949 1.009 1.087 1.049 86 0.948 0.848 0.956 1.02637 0.907 0.776 0.951 0.988 87 1.003 1.007 1.009 0.99638 0.918 0.885 0.905 1.112 88 NC NC NC NC39 1.402 1.536 1.400 1.306 89 0.953 0.916 0.938 0.96540 0.976 0.996 0.966 1.017 90 1.016 1.006 1.018 1.02941 0.960 0.935 0.977 1.053 91 0.957 0.958 0.957 0.95642 1.027 0.969 1.087 1.075 92 0.956 0.957 0.975 0.96043 1.050 1.023 1.027 1.082 93 0.739 0.735 0.742 0.73244 1.038 0.996 1.145 0.984 94 0.914 0.915 0.913 0.91345 0.834 0.765 0.873 1.044 95 0.888 0.886 0.887 0.89046 1.232 1.282 1.210 1.099 96 0.982 0.990 0.985 0.98847 0.912 0.931 0.949 0.910 97 0.951 0.977 0.980 0.99248 0.873 0.999 0.993 0.997 98 0.959 0.966 0.934 0.96049 1.008 1.004 1.074 1.148 99 1.008 1.014 1.012 1.00850 0.977 0.976 0.991 1.017 100 0.807 0.809 0.810 0.805
NC : Not Considered
131
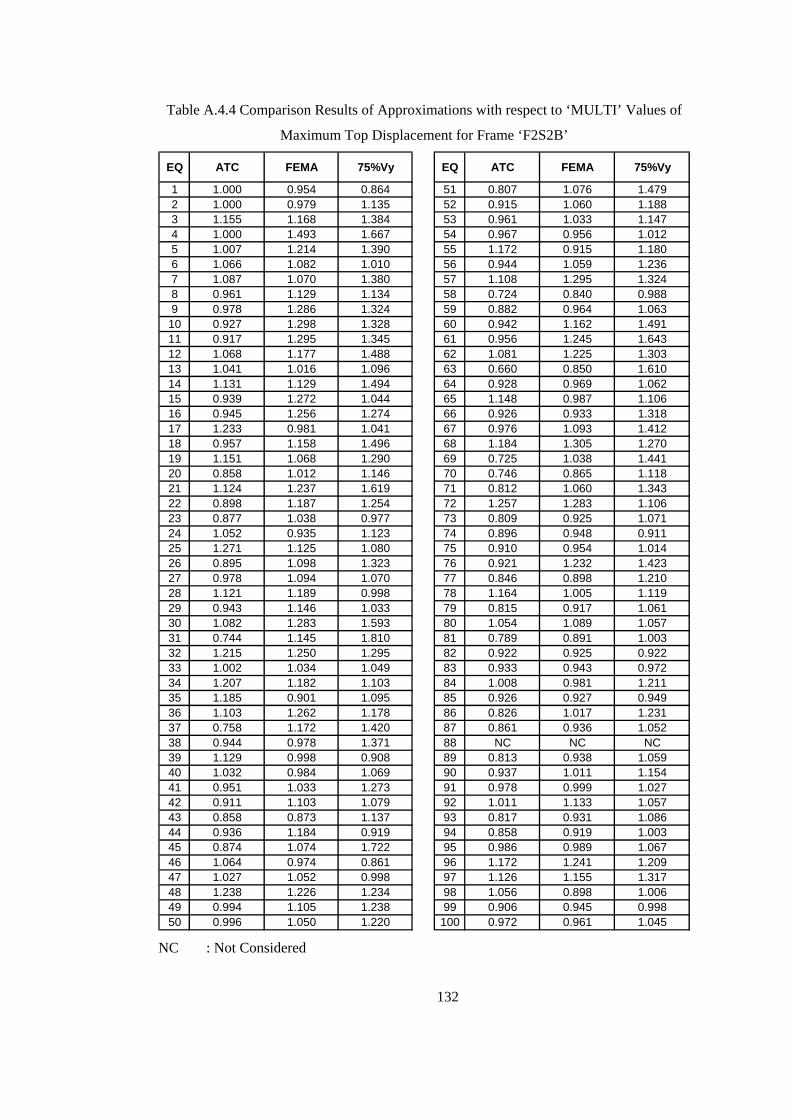
Table A.4.4 Comparison Results of Approximations with respect to ‘MULTI’ Values of
Maximum Top Displacement for Frame ‘F2S2B’
EQ ATC FEMA 75%Vy EQ ATC FEMA 75%Vy
1 1.000 0.954 0.864 51 0.807 1.076 1.4792 1.000 0.979 1.135 52 0.915 1.060 1.1883 1.155 1.168 1.384 53 0.961 1.033 1.1474 1.000 1.493 1.667 54 0.967 0.956 1.0125 1.007 1.214 1.390 55 1.172 0.915 1.1806 1.066 1.082 1.010 56 0.944 1.059 1.2367 1.087 1.070 1.380 57 1.108 1.295 1.3248 0.961 1.129 1.134 58 0.724 0.840 0.9889 0.978 1.286 1.324 59 0.882 0.964 1.06310 0.927 1.298 1.328 60 0.942 1.162 1.49111 0.917 1.295 1.345 61 0.956 1.245 1.64312 1.068 1.177 1.488 62 1.081 1.225 1.30313 1.041 1.016 1.096 63 0.660 0.850 1.61014 1.131 1.129 1.494 64 0.928 0.969 1.06215 0.939 1.272 1.044 65 1.148 0.987 1.10616 0.945 1.256 1.274 66 0.926 0.933 1.31817 1.233 0.981 1.041 67 0.976 1.093 1.41218 0.957 1.158 1.496 68 1.184 1.305 1.27019 1.151 1.068 1.290 69 0.725 1.038 1.44120 0.858 1.012 1.146 70 0.746 0.865 1.11821 1.124 1.237 1.619 71 0.812 1.060 1.34322 0.898 1.187 1.254 72 1.257 1.283 1.10623 0.877 1.038 0.977 73 0.809 0.925 1.07124 1.052 0.935 1.123 74 0.896 0.948 0.91125 1.271 1.125 1.080 75 0.910 0.954 1.01426 0.895 1.098 1.323 76 0.921 1.232 1.42327 0.978 1.094 1.070 77 0.846 0.898 1.21028 1.121 1.189 0.998 78 1.164 1.005 1.11929 0.943 1.146 1.033 79 0.815 0.917 1.06130 1.082 1.283 1.593 80 1.054 1.089 1.05731 0.744 1.145 1.810 81 0.789 0.891 1.00332 1.215 1.250 1.295 82 0.922 0.925 0.92233 1.002 1.034 1.049 83 0.933 0.943 0.97234 1.207 1.182 1.103 84 1.008 0.981 1.21135 1.185 0.901 1.095 85 0.926 0.927 0.94936 1.103 1.262 1.178 86 0.826 1.017 1.23137 0.758 1.172 1.420 87 0.861 0.936 1.05238 0.944 0.978 1.371 88 NC NC NC39 1.129 0.998 0.908 89 0.813 0.938 1.05940 1.032 0.984 1.069 90 0.937 1.011 1.15441 0.951 1.033 1.273 91 0.978 0.999 1.02742 0.911 1.103 1.079 92 1.011 1.133 1.05743 0.858 0.873 1.137 93 0.817 0.931 1.08644 0.936 1.184 0.919 94 0.858 0.919 1.00345 0.874 1.074 1.722 95 0.986 0.989 1.06746 1.064 0.974 0.861 96 1.172 1.241 1.20947 1.027 1.052 0.998 97 1.126 1.155 1.31748 1.238 1.226 1.234 98 1.056 0.898 1.00649 0.994 1.105 1.238 99 0.906 0.945 0.99850 0.996 1.050 1.220 100 0.972 0.961 1.045
NC : Not Considered
132

Table A.4.5 Comparison Results of Approximations with respect to ‘MULTI’ Values of
Maximum Inter-story Drift Ratio for Frame ‘F2S2B’
EQ ATC FEMA 75%Vy EQ ATC FEMA 75%Vy
1 1.000 0.954 0.864 51 0.795 1.080 1.4822 1.000 0.979 1.135 52 0.931 1.050 1.1613 1.150 1.162 1.370 53 0.961 1.033 1.1474 1.000 1.475 1.642 54 0.969 0.958 1.0115 1.007 1.207 1.375 55 1.173 0.912 1.1816 1.064 1.081 1.010 56 0.950 1.054 1.2237 1.086 1.070 1.377 57 1.116 1.315 1.3468 0.961 1.129 1.133 58 0.774 0.870 0.9919 0.976 1.305 1.345 59 0.899 0.968 1.05610 0.927 1.318 1.351 60 0.941 1.173 1.52611 0.918 1.292 1.341 61 0.956 1.256 1.68212 1.068 1.176 1.488 62 1.069 1.194 1.26513 1.044 1.017 1.103 63 0.658 0.855 1.47414 1.133 1.131 1.525 64 0.934 0.972 1.05315 0.941 1.264 1.043 65 1.150 0.987 1.10616 0.946 1.255 1.273 66 0.940 0.946 1.26817 1.233 0.981 1.041 67 0.980 1.076 1.35618 0.957 1.158 1.505 68 1.142 1.236 1.20819 1.156 1.068 1.307 69 0.769 1.033 1.40920 0.850 1.013 1.156 70 0.782 0.882 1.10921 1.125 1.247 1.657 71 0.825 1.049 1.26122 0.892 1.194 1.261 72 1.237 1.258 1.10223 0.877 1.038 0.977 73 0.834 0.934 1.06424 1.051 0.936 1.121 74 0.919 0.958 0.93025 1.281 1.125 1.080 75 0.925 0.961 1.01226 0.892 1.096 1.300 76 0.917 1.239 1.42227 0.978 1.095 1.071 77 0.850 0.901 1.20228 1.130 1.203 0.997 78 1.138 1.004 1.10029 0.942 1.139 1.033 79 0.843 0.928 1.05430 1.079 1.275 1.577 80 1.053 1.087 1.05531 0.730 1.151 1.741 81 0.794 0.893 1.00332 1.213 1.246 1.288 82 0.925 0.927 0.92533 1.002 1.034 1.049 83 0.937 0.946 0.97334 1.222 1.195 1.110 84 1.006 0.984 1.16035 1.186 0.901 1.095 85 0.939 0.940 0.95736 1.105 1.259 1.180 86 0.828 1.017 1.19937 0.763 1.141 1.326 87 0.865 0.937 1.05038 0.941 0.977 1.377 88 NC NC NC39 1.129 0.998 0.908 89 0.852 0.950 1.04740 1.032 0.983 1.070 90 0.946 1.009 1.14141 0.953 1.032 1.235 91 0.979 0.999 1.02642 0.909 1.102 1.079 92 1.008 1.098 1.04043 0.890 0.902 1.109 93 0.826 0.933 1.08444 0.934 1.182 0.916 94 0.862 0.921 1.00345 0.868 1.076 1.627 95 0.987 0.990 1.06346 1.069 0.973 0.860 96 1.160 1.227 1.19647 1.027 1.052 0.998 97 1.106 1.131 1.27648 1.256 1.243 1.252 98 1.049 0.913 1.00549 0.993 1.108 1.240 99 0.909 0.946 0.99850 0.996 1.041 1.167 100 0.973 0.962 1.044
NC : Not Considered
133
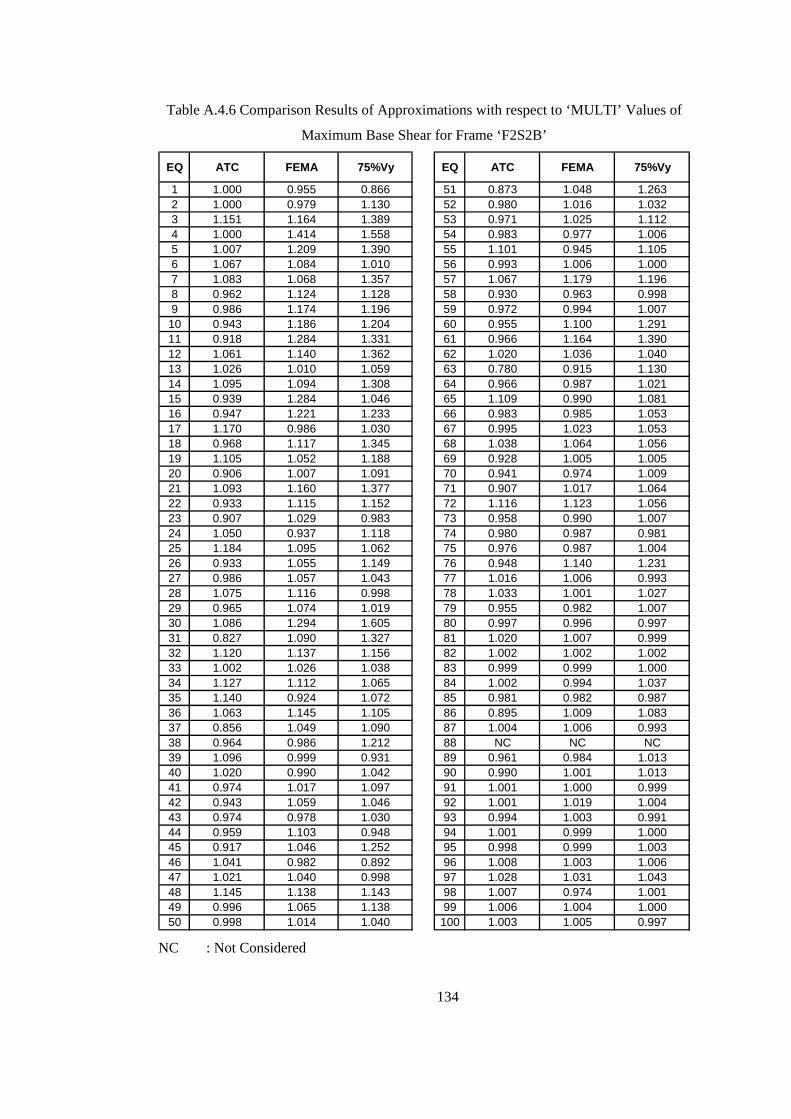
Table A.4.6 Comparison Results of Approximations with respect to ‘MULTI’ Values of
Maximum Base Shear for Frame ‘F2S2B’
EQ ATC FEMA 75%Vy EQ ATC FEMA 75%Vy
1 1.000 0.955 0.866 51 0.873 1.048 1.2632 1.000 0.979 1.130 52 0.980 1.016 1.0323 1.151 1.164 1.389 53 0.971 1.025 1.1124 1.000 1.414 1.558 54 0.983 0.977 1.0065 1.007 1.209 1.390 55 1.101 0.945 1.1056 1.067 1.084 1.010 56 0.993 1.006 1.0007 1.083 1.068 1.357 57 1.067 1.179 1.1968 0.962 1.124 1.128 58 0.930 0.963 0.9989 0.986 1.174 1.196 59 0.972 0.994 1.00710 0.943 1.186 1.204 60 0.955 1.100 1.29111 0.918 1.284 1.331 61 0.966 1.164 1.39012 1.061 1.140 1.362 62 1.020 1.036 1.04013 1.026 1.010 1.059 63 0.780 0.915 1.13014 1.095 1.094 1.308 64 0.966 0.987 1.02115 0.939 1.284 1.046 65 1.109 0.990 1.08116 0.947 1.221 1.233 66 0.983 0.985 1.05317 1.170 0.986 1.030 67 0.995 1.023 1.05318 0.968 1.117 1.345 68 1.038 1.064 1.05619 1.105 1.052 1.188 69 0.928 1.005 1.00520 0.906 1.007 1.091 70 0.941 0.974 1.00921 1.093 1.160 1.377 71 0.907 1.017 1.06422 0.933 1.115 1.152 72 1.116 1.123 1.05623 0.907 1.029 0.983 73 0.958 0.990 1.00724 1.050 0.937 1.118 74 0.980 0.987 0.98125 1.184 1.095 1.062 75 0.976 0.987 1.00426 0.933 1.055 1.149 76 0.948 1.140 1.23127 0.986 1.057 1.043 77 1.016 1.006 0.99328 1.075 1.116 0.998 78 1.033 1.001 1.02729 0.965 1.074 1.019 79 0.955 0.982 1.00730 1.086 1.294 1.605 80 0.997 0.996 0.99731 0.827 1.090 1.327 81 1.020 1.007 0.99932 1.120 1.137 1.156 82 1.002 1.002 1.00233 1.002 1.026 1.038 83 0.999 0.999 1.00034 1.127 1.112 1.065 84 1.002 0.994 1.03735 1.140 0.924 1.072 85 0.981 0.982 0.98736 1.063 1.145 1.105 86 0.895 1.009 1.08337 0.856 1.049 1.090 87 1.004 1.006 0.99338 0.964 0.986 1.212 88 NC NC NC39 1.096 0.999 0.931 89 0.961 0.984 1.01340 1.020 0.990 1.042 90 0.990 1.001 1.01341 0.974 1.017 1.097 91 1.001 1.000 0.99942 0.943 1.059 1.046 92 1.001 1.019 1.00443 0.974 0.978 1.030 93 0.994 1.003 0.99144 0.959 1.103 0.948 94 1.001 0.999 1.00045 0.917 1.046 1.252 95 0.998 0.999 1.00346 1.041 0.982 0.892 96 1.008 1.003 1.00647 1.021 1.040 0.998 97 1.028 1.031 1.04348 1.145 1.138 1.143 98 1.007 0.974 1.00149 0.996 1.065 1.138 99 1.006 1.004 1.00050 0.998 1.014 1.040 100 1.003 1.005 0.997
NC : Not Considered
134

Table A.4.7 Comparison Results of Approximations with respect to ‘EXACT’ Values of
Maximum Top Displacement for Frame ‘F2S2B2’
EQ MULTI ATC FEMA 75%Vy EQ MULTI ATC FEMA 75%Vy
1 1.141 1.141 1.193 1.215 51 0.874 0.864 0.946 0.9742 1.186 1.186 1.258 1.296 52 0.980 1.037 1.022 1.0133 1.161 1.161 1.099 1.068 53 0.805 0.700 0.818 0.8594 1.061 1.061 1.056 1.067 54 0.917 0.844 0.940 0.9735 0.956 0.956 0.958 0.959 55 1.135 1.231 1.251 1.2336 1.002 1.105 1.098 1.098 56 0.920 0.950 0.939 0.9747 0.922 0.946 0.980 0.990 57 0.721 0.698 0.808 0.8708 0.844 0.852 0.963 0.989 58 0.710 0.635 0.760 0.8119 0.887 0.884 0.977 1.013 59 0.942 0.916 0.955 0.967
10 0.950 0.941 0.994 1.014 60 0.983 0.999 1.019 1.02711 0.984 1.004 0.984 0.973 61 0.909 0.918 1.003 1.02312 0.993 1.057 1.033 1.016 62 0.690 0.629 0.678 0.71013 0.874 0.865 0.959 0.984 63 0.988 1.018 1.011 1.01414 0.798 0.796 0.840 0.883 64 0.886 0.865 0.923 0.94015 1.059 1.077 1.088 1.073 65 0.980 0.884 0.923 0.94416 0.965 0.969 1.018 1.042 66 0.652 0.575 0.706 0.77617 0.852 0.859 0.940 0.957 67 1.092 1.152 1.097 1.08018 1.212 1.211 1.090 1.031 68 0.955 0.830 0.906 0.92819 1.010 1.157 1.096 1.065 69 0.843 0.731 0.801 0.82220 1.029 1.024 1.007 1.006 70 0.971 0.996 1.017 1.00921 0.865 0.850 0.921 0.942 71 0.832 0.758 0.849 0.87722 0.915 0.915 0.962 0.979 72 0.772 0.740 0.868 0.90023 0.912 0.916 1.043 1.072 73 0.960 1.012 1.024 1.02624 0.761 0.751 0.880 0.928 74 0.904 0.832 0.886 0.91325 0.935 0.959 0.952 0.937 75 1.036 1.044 1.081 1.06926 0.986 0.979 1.072 1.095 76 0.988 1.026 1.128 1.11327 0.928 0.920 0.961 0.977 77 0.923 0.921 0.933 0.93428 1.053 1.134 1.137 1.116 78 1.182 1.099 1.147 1.21029 0.877 0.912 0.952 0.971 79 0.833 0.821 0.915 0.97930 0.932 0.967 1.003 1.013 80 0.811 0.670 0.797 0.85731 0.910 0.918 0.964 0.995 81 0.870 0.783 0.881 0.92232 0.716 0.689 0.769 0.828 82 0.907 0.885 0.971 1.00833 0.894 0.872 0.932 0.953 83 0.988 0.833 0.872 0.88534 0.864 0.853 0.931 0.962 84 0.899 0.881 0.916 0.93435 0.960 1.002 0.948 0.934 85 0.923 0.957 1.094 1.12836 0.934 0.908 0.943 0.956 86 1.066 1.225 1.189 1.10737 1.121 1.235 1.203 1.162 87 0.828 0.740 0.807 0.83338 0.982 1.003 1.022 1.027 88 0.820 0.787 0.845 0.87239 1.079 1.055 1.160 1.166 89 0.897 0.840 0.927 0.96440 0.866 0.844 0.925 0.954 90 0.893 0.886 0.932 0.93841 0.979 1.061 0.997 0.983 91 0.931 0.866 0.880 0.88342 0.747 0.768 0.820 0.832 92 0.986 1.047 1.035 1.01443 0.929 0.958 0.991 1.006 93 0.862 0.826 0.883 0.90144 1.131 1.274 1.219 1.196 94 0.624 0.616 0.653 0.65545 0.878 0.901 0.951 0.981 95 0.794 0.735 0.784 0.81346 0.977 1.045 1.109 1.119 96 0.823 0.852 0.826 0.78747 1.074 1.161 1.177 1.160 97 0.942 0.949 0.938 0.94848 0.994 0.984 1.084 1.137 98 0.985 1.031 0.997 0.98649 0.873 0.841 0.906 0.929 99 1.005 1.084 1.091 1.07350 0.954 0.999 1.039 1.055 100 0.900 0.823 0.843 0.858
NC : Not Considered
135

Table A.4.8 Comparison Results of Approximations with respect to ‘EXACT’ Values of
Maximum Inter-story Drift Ratio for Frame ‘F2S2B2’
EQ MULTI ATC FEMA 75%Vy EQ MULTI ATC FEMA 75%Vy
1 1.145 1.145 1.197 1.218 51 0.883 0.873 0.956 0.9842 1.208 1.208 1.279 1.316 52 0.996 1.054 1.038 1.0293 1.206 1.206 1.144 1.112 53 0.821 0.713 0.833 0.8734 1.077 1.077 1.072 1.083 54 0.928 0.860 0.949 0.9805 0.950 0.950 0.952 0.953 55 1.139 1.231 1.250 1.2336 0.997 1.099 1.093 1.092 56 0.933 0.963 0.952 0.9887 0.950 0.975 1.010 1.020 57 0.708 0.686 0.793 0.8538 0.842 0.850 0.959 0.986 58 0.712 0.636 0.762 0.8139 0.904 0.901 0.995 1.032 59 0.960 0.933 0.973 0.985
10 0.955 0.947 1.000 1.020 60 0.971 0.986 1.006 1.01411 1.000 1.020 1.000 0.988 61 0.889 0.897 0.980 1.00012 1.022 1.087 1.062 1.045 62 0.751 0.690 0.739 0.77113 0.878 0.869 0.963 0.988 63 0.988 1.018 1.011 1.01414 0.814 0.813 0.858 0.902 64 0.918 0.896 0.957 0.97415 1.042 1.059 1.070 1.055 65 1.033 0.947 0.983 1.00216 1.010 1.014 1.066 1.090 66 0.700 0.624 0.753 0.82017 0.858 0.865 0.946 0.963 67 1.112 1.169 1.117 1.10118 1.167 1.166 1.051 0.994 68 0.976 0.859 0.931 0.95119 1.023 1.171 1.109 1.079 69 0.883 0.776 0.844 0.86420 1.065 1.060 1.043 1.041 70 0.935 0.957 0.975 0.96821 0.872 0.856 0.929 0.950 71 0.854 0.780 0.871 0.89822 0.926 0.926 0.973 0.991 72 0.774 0.743 0.871 0.90223 0.901 0.905 1.031 1.059 73 0.993 1.042 1.054 1.05524 0.771 0.761 0.891 0.939 74 0.906 0.840 0.890 0.91425 0.933 0.957 0.950 0.935 75 0.995 1.002 1.034 1.02426 0.990 0.983 1.076 1.099 76 0.999 1.035 1.128 1.11427 0.938 0.931 0.972 0.989 77 0.965 0.963 0.974 0.97628 1.062 1.143 1.147 1.125 78 1.152 1.084 1.123 1.17529 0.890 0.925 0.965 0.984 79 0.822 0.810 0.900 0.96030 0.930 0.964 1.001 1.011 80 0.854 0.717 0.840 0.89831 0.925 0.934 0.981 1.012 81 0.918 0.834 0.928 0.96632 0.712 0.686 0.765 0.824 82 0.968 0.945 1.031 1.06633 0.892 0.870 0.930 0.951 83 1.035 0.899 0.933 0.94534 0.861 0.850 0.928 0.959 84 0.902 0.888 0.916 0.93135 0.963 1.005 0.951 0.937 85 0.978 1.006 1.125 1.15436 0.947 0.921 0.955 0.968 86 1.070 1.215 1.183 1.10737 1.128 1.242 1.211 1.169 87 0.880 0.789 0.858 0.88538 0.994 1.014 1.033 1.038 88 0.848 0.815 0.871 0.89739 1.043 1.022 1.115 1.120 89 0.930 0.879 0.956 0.98940 0.882 0.860 0.942 0.972 90 0.918 0.912 0.950 0.95541 0.978 1.059 0.996 0.981 91 0.977 0.914 0.927 0.93042 0.750 0.770 0.823 0.835 92 0.942 0.989 0.980 0.96343 0.937 0.966 1.000 1.014 93 0.894 0.863 0.911 0.92544 1.144 1.284 1.231 1.208 94 0.635 0.628 0.661 0.66245 0.891 0.915 0.965 0.996 95 0.803 0.753 0.795 0.81846 0.979 1.045 1.106 1.116 96 0.854 0.880 0.857 0.82247 1.042 1.125 1.140 1.124 97 0.961 0.967 0.957 0.96748 0.974 0.965 1.055 1.102 98 0.971 1.009 0.982 0.97249 0.893 0.862 0.926 0.949 99 0.971 1.036 1.042 1.02750 0.973 1.018 1.059 1.075 100 0.904 0.825 0.847 0.862
NC : Not Considered
136
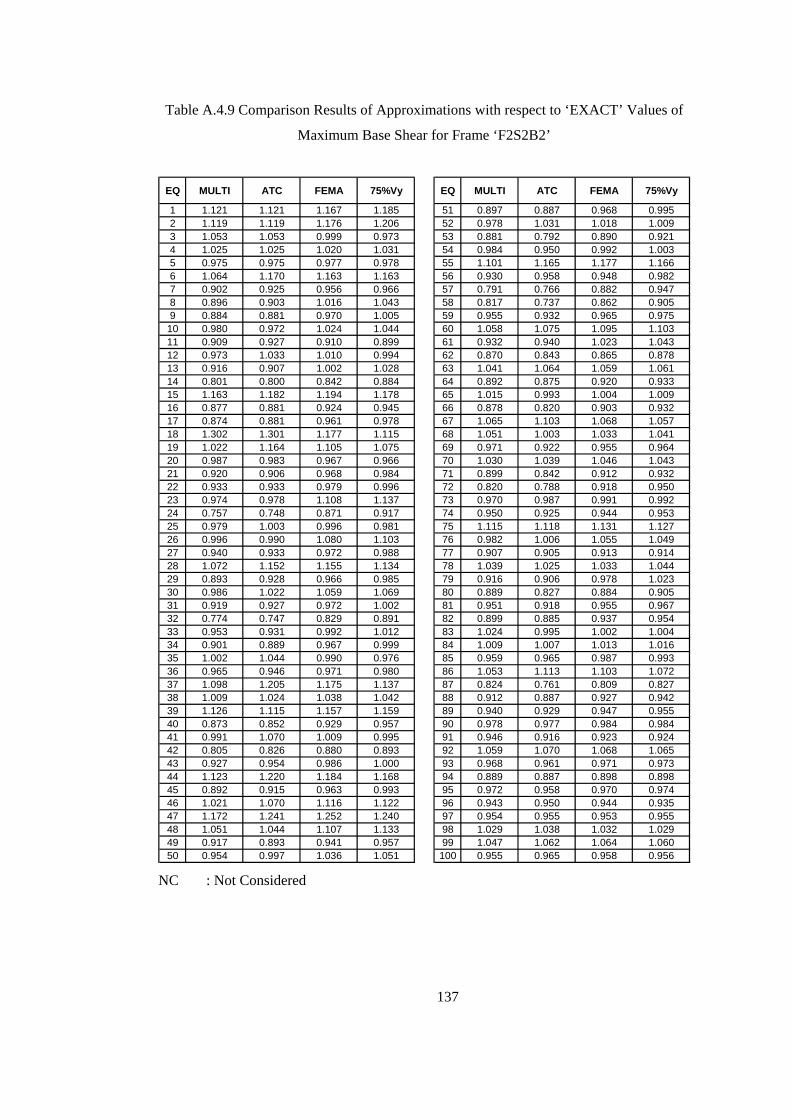
Table A.4.9 Comparison Results of Approximations with respect to ‘EXACT’ Values of
Maximum Base Shear for Frame ‘F2S2B2’
EQ MULTI ATC FEMA 75%Vy EQ MULTI ATC FEMA 75%Vy
1 1.121 1.121 1.167 1.185 51 0.897 0.887 0.968 0.9952 1.119 1.119 1.176 1.206 52 0.978 1.031 1.018 1.0093 1.053 1.053 0.999 0.973 53 0.881 0.792 0.890 0.9214 1.025 1.025 1.020 1.031 54 0.984 0.950 0.992 1.0035 0.975 0.975 0.977 0.978 55 1.101 1.165 1.177 1.1666 1.064 1.170 1.163 1.163 56 0.930 0.958 0.948 0.9827 0.902 0.925 0.956 0.966 57 0.791 0.766 0.882 0.9478 0.896 0.903 1.016 1.043 58 0.817 0.737 0.862 0.9059 0.884 0.881 0.970 1.005 59 0.955 0.932 0.965 0.975
10 0.980 0.972 1.024 1.044 60 1.058 1.075 1.095 1.10311 0.909 0.927 0.910 0.899 61 0.932 0.940 1.023 1.04312 0.973 1.033 1.010 0.994 62 0.870 0.843 0.865 0.87813 0.916 0.907 1.002 1.028 63 1.041 1.064 1.059 1.06114 0.801 0.800 0.842 0.884 64 0.892 0.875 0.920 0.93315 1.163 1.182 1.194 1.178 65 1.015 0.993 1.004 1.00916 0.877 0.881 0.924 0.945 66 0.878 0.820 0.903 0.93217 0.874 0.881 0.961 0.978 67 1.065 1.103 1.068 1.05718 1.302 1.301 1.177 1.115 68 1.051 1.003 1.033 1.04119 1.022 1.164 1.105 1.075 69 0.971 0.922 0.955 0.96420 0.987 0.983 0.967 0.966 70 1.030 1.039 1.046 1.04321 0.920 0.906 0.968 0.984 71 0.899 0.842 0.912 0.93222 0.933 0.933 0.979 0.996 72 0.820 0.788 0.918 0.95023 0.974 0.978 1.108 1.137 73 0.970 0.987 0.991 0.99224 0.757 0.748 0.871 0.917 74 0.950 0.925 0.944 0.95325 0.979 1.003 0.996 0.981 75 1.115 1.118 1.131 1.12726 0.996 0.990 1.080 1.103 76 0.982 1.006 1.055 1.04927 0.940 0.933 0.972 0.988 77 0.907 0.905 0.913 0.91428 1.072 1.152 1.155 1.134 78 1.039 1.025 1.033 1.04429 0.893 0.928 0.966 0.985 79 0.916 0.906 0.978 1.02330 0.986 1.022 1.059 1.069 80 0.889 0.827 0.884 0.90531 0.919 0.927 0.972 1.002 81 0.951 0.918 0.955 0.96732 0.774 0.747 0.829 0.891 82 0.899 0.885 0.937 0.95433 0.953 0.931 0.992 1.012 83 1.024 0.995 1.002 1.00434 0.901 0.889 0.967 0.999 84 1.009 1.007 1.013 1.01635 1.002 1.044 0.990 0.976 85 0.959 0.965 0.987 0.99336 0.965 0.946 0.971 0.980 86 1.053 1.113 1.103 1.07237 1.098 1.205 1.175 1.137 87 0.824 0.761 0.809 0.82738 1.009 1.024 1.038 1.042 88 0.912 0.887 0.927 0.94239 1.126 1.115 1.157 1.159 89 0.940 0.929 0.947 0.95540 0.873 0.852 0.929 0.957 90 0.978 0.977 0.984 0.98441 0.991 1.070 1.009 0.995 91 0.946 0.916 0.923 0.92442 0.805 0.826 0.880 0.893 92 1.059 1.070 1.068 1.06543 0.927 0.954 0.986 1.000 93 0.968 0.961 0.971 0.97344 1.123 1.220 1.184 1.168 94 0.889 0.887 0.898 0.89845 0.892 0.915 0.963 0.993 95 0.972 0.958 0.970 0.97446 1.021 1.070 1.116 1.122 96 0.943 0.950 0.944 0.93547 1.172 1.241 1.252 1.240 97 0.954 0.955 0.953 0.95548 1.051 1.044 1.107 1.133 98 1.029 1.038 1.032 1.02949 0.917 0.893 0.941 0.957 99 1.047 1.062 1.064 1.06050 0.954 0.997 1.036 1.051 100 0.955 0.965 0.958 0.956
NC : Not Considered
137
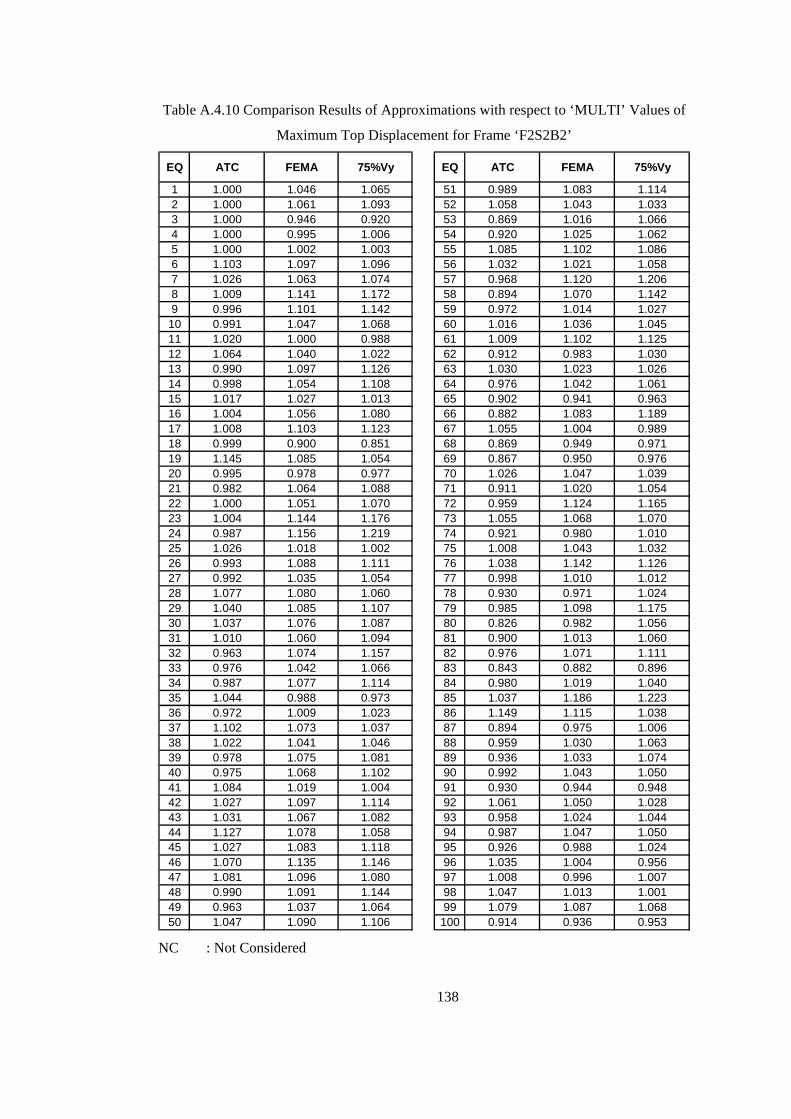
Table A.4.10 Comparison Results of Approximations with respect to ‘MULTI’ Values of
Maximum Top Displacement for Frame ‘F2S2B2’
EQ ATC FEMA 75%Vy EQ ATC FEMA 75%Vy
1 1.000 1.046 1.065 51 0.989 1.083 1.1142 1.000 1.061 1.093 52 1.058 1.043 1.0333 1.000 0.946 0.920 53 0.869 1.016 1.0664 1.000 0.995 1.006 54 0.920 1.025 1.0625 1.000 1.002 1.003 55 1.085 1.102 1.0866 1.103 1.097 1.096 56 1.032 1.021 1.0587 1.026 1.063 1.074 57 0.968 1.120 1.2068 1.009 1.141 1.172 58 0.894 1.070 1.1429 0.996 1.101 1.142 59 0.972 1.014 1.02710 0.991 1.047 1.068 60 1.016 1.036 1.04511 1.020 1.000 0.988 61 1.009 1.102 1.12512 1.064 1.040 1.022 62 0.912 0.983 1.03013 0.990 1.097 1.126 63 1.030 1.023 1.02614 0.998 1.054 1.108 64 0.976 1.042 1.06115 1.017 1.027 1.013 65 0.902 0.941 0.96316 1.004 1.056 1.080 66 0.882 1.083 1.18917 1.008 1.103 1.123 67 1.055 1.004 0.98918 0.999 0.900 0.851 68 0.869 0.949 0.97119 1.145 1.085 1.054 69 0.867 0.950 0.97620 0.995 0.978 0.977 70 1.026 1.047 1.03921 0.982 1.064 1.088 71 0.911 1.020 1.05422 1.000 1.051 1.070 72 0.959 1.124 1.16523 1.004 1.144 1.176 73 1.055 1.068 1.07024 0.987 1.156 1.219 74 0.921 0.980 1.01025 1.026 1.018 1.002 75 1.008 1.043 1.03226 0.993 1.088 1.111 76 1.038 1.142 1.12627 0.992 1.035 1.054 77 0.998 1.010 1.01228 1.077 1.080 1.060 78 0.930 0.971 1.02429 1.040 1.085 1.107 79 0.985 1.098 1.17530 1.037 1.076 1.087 80 0.826 0.982 1.05631 1.010 1.060 1.094 81 0.900 1.013 1.06032 0.963 1.074 1.157 82 0.976 1.071 1.11133 0.976 1.042 1.066 83 0.843 0.882 0.89634 0.987 1.077 1.114 84 0.980 1.019 1.04035 1.044 0.988 0.973 85 1.037 1.186 1.22336 0.972 1.009 1.023 86 1.149 1.115 1.03837 1.102 1.073 1.037 87 0.894 0.975 1.00638 1.022 1.041 1.046 88 0.959 1.030 1.06339 0.978 1.075 1.081 89 0.936 1.033 1.07440 0.975 1.068 1.102 90 0.992 1.043 1.05041 1.084 1.019 1.004 91 0.930 0.944 0.94842 1.027 1.097 1.114 92 1.061 1.050 1.02843 1.031 1.067 1.082 93 0.958 1.024 1.04444 1.127 1.078 1.058 94 0.987 1.047 1.05045 1.027 1.083 1.118 95 0.926 0.988 1.02446 1.070 1.135 1.146 96 1.035 1.004 0.95647 1.081 1.096 1.080 97 1.008 0.996 1.00748 0.990 1.091 1.144 98 1.047 1.013 1.00149 0.963 1.037 1.064 99 1.079 1.087 1.06850 1.047 1.090 1.106 100 0.914 0.936 0.953
NC : Not Considered
138
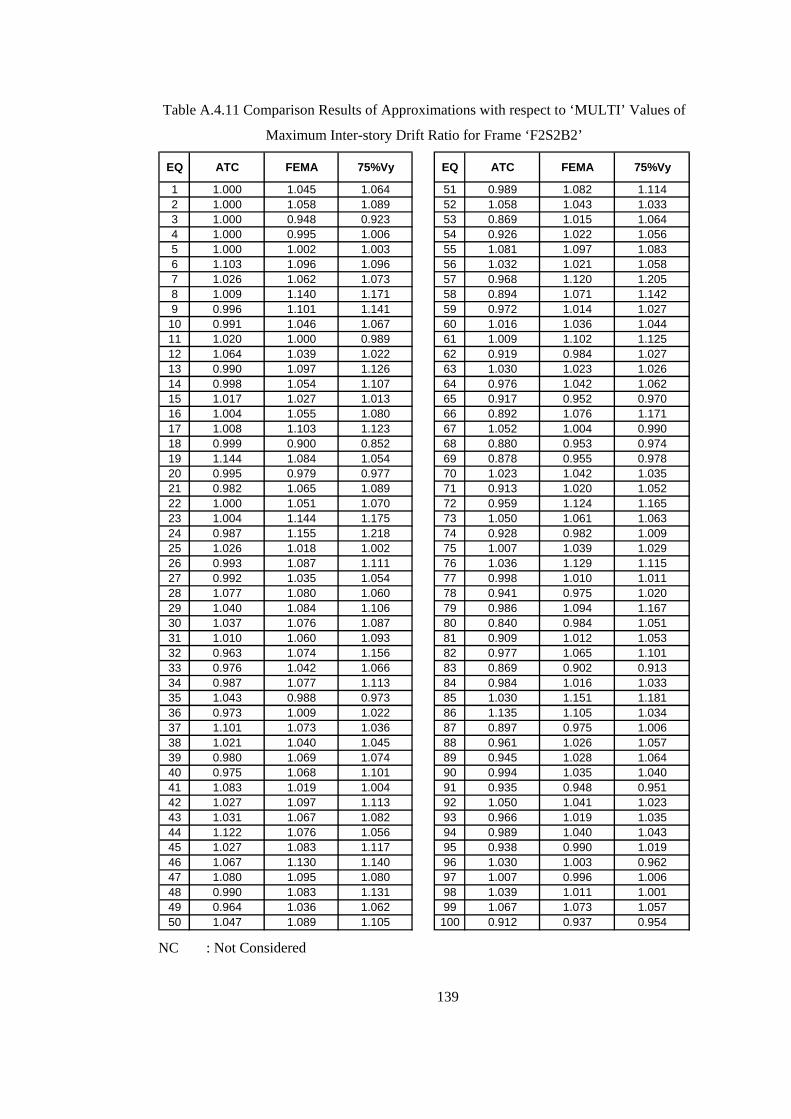
Table A.4.11 Comparison Results of Approximations with respect to ‘MULTI’ Values of
Maximum Inter-story Drift Ratio for Frame ‘F2S2B2’
EQ ATC FEMA 75%Vy EQ ATC FEMA 75%Vy
1 1.000 1.045 1.064 51 0.989 1.082 1.1142 1.000 1.058 1.089 52 1.058 1.043 1.0333 1.000 0.948 0.923 53 0.869 1.015 1.0644 1.000 0.995 1.006 54 0.926 1.022 1.0565 1.000 1.002 1.003 55 1.081 1.097 1.0836 1.103 1.096 1.096 56 1.032 1.021 1.0587 1.026 1.062 1.073 57 0.968 1.120 1.2058 1.009 1.140 1.171 58 0.894 1.071 1.1429 0.996 1.101 1.141 59 0.972 1.014 1.02710 0.991 1.046 1.067 60 1.016 1.036 1.04411 1.020 1.000 0.989 61 1.009 1.102 1.12512 1.064 1.039 1.022 62 0.919 0.984 1.02713 0.990 1.097 1.126 63 1.030 1.023 1.02614 0.998 1.054 1.107 64 0.976 1.042 1.06215 1.017 1.027 1.013 65 0.917 0.952 0.97016 1.004 1.055 1.080 66 0.892 1.076 1.17117 1.008 1.103 1.123 67 1.052 1.004 0.99018 0.999 0.900 0.852 68 0.880 0.953 0.97419 1.144 1.084 1.054 69 0.878 0.955 0.97820 0.995 0.979 0.977 70 1.023 1.042 1.03521 0.982 1.065 1.089 71 0.913 1.020 1.05222 1.000 1.051 1.070 72 0.959 1.124 1.16523 1.004 1.144 1.175 73 1.050 1.061 1.06324 0.987 1.155 1.218 74 0.928 0.982 1.00925 1.026 1.018 1.002 75 1.007 1.039 1.02926 0.993 1.087 1.111 76 1.036 1.129 1.11527 0.992 1.035 1.054 77 0.998 1.010 1.01128 1.077 1.080 1.060 78 0.941 0.975 1.02029 1.040 1.084 1.106 79 0.986 1.094 1.16730 1.037 1.076 1.087 80 0.840 0.984 1.05131 1.010 1.060 1.093 81 0.909 1.012 1.05332 0.963 1.074 1.156 82 0.977 1.065 1.10133 0.976 1.042 1.066 83 0.869 0.902 0.91334 0.987 1.077 1.113 84 0.984 1.016 1.03335 1.043 0.988 0.973 85 1.030 1.151 1.18136 0.973 1.009 1.022 86 1.135 1.105 1.03437 1.101 1.073 1.036 87 0.897 0.975 1.00638 1.021 1.040 1.045 88 0.961 1.026 1.05739 0.980 1.069 1.074 89 0.945 1.028 1.06440 0.975 1.068 1.101 90 0.994 1.035 1.04041 1.083 1.019 1.004 91 0.935 0.948 0.95142 1.027 1.097 1.113 92 1.050 1.041 1.02343 1.031 1.067 1.082 93 0.966 1.019 1.03544 1.122 1.076 1.056 94 0.989 1.040 1.04345 1.027 1.083 1.117 95 0.938 0.990 1.01946 1.067 1.130 1.140 96 1.030 1.003 0.96247 1.080 1.095 1.080 97 1.007 0.996 1.00648 0.990 1.083 1.131 98 1.039 1.011 1.00149 0.964 1.036 1.062 99 1.067 1.073 1.05750 1.047 1.089 1.105 100 0.912 0.937 0.954
NC : Not Considered
139

Table A.4.12 Comparison Results of Approximations with respect to ‘MULTI’ Values of
Maximum Base Shear for Frame ‘F2S2B2’
EQ ATC FEMA 75%Vy EQ ATC FEMA 75%Vy
1 1.000 1.041 1.058 51 0.989 1.079 1.1102 1.000 1.051 1.077 52 1.055 1.041 1.0323 1.000 0.949 0.925 53 0.899 1.011 1.0464 1.000 0.995 1.006 54 0.965 1.008 1.0205 1.000 1.002 1.003 55 1.058 1.069 1.0596 1.099 1.093 1.093 56 1.031 1.020 1.0567 1.025 1.060 1.071 57 0.969 1.116 1.1978 1.009 1.135 1.165 58 0.902 1.056 1.1089 0.996 1.097 1.137 59 0.976 1.011 1.02110 0.991 1.045 1.065 60 1.016 1.035 1.04311 1.019 1.000 0.989 61 1.009 1.098 1.11912 1.062 1.038 1.022 62 0.969 0.994 1.01013 0.990 1.094 1.122 63 1.022 1.017 1.01914 0.998 1.052 1.104 64 0.981 1.032 1.04615 1.016 1.026 1.013 65 0.978 0.989 0.99416 1.004 1.053 1.077 66 0.933 1.029 1.06117 1.008 1.099 1.119 67 1.036 1.003 0.99318 0.999 0.904 0.856 68 0.955 0.983 0.99119 1.139 1.081 1.052 69 0.949 0.984 0.99220 0.995 0.979 0.978 70 1.008 1.015 1.01321 0.985 1.051 1.069 71 0.936 1.014 1.03722 1.000 1.050 1.067 72 0.960 1.119 1.15823 1.004 1.138 1.168 73 1.018 1.022 1.02224 0.987 1.150 1.211 74 0.973 0.993 1.00325 1.025 1.018 1.002 75 1.003 1.014 1.01026 0.993 1.084 1.107 76 1.025 1.075 1.06827 0.992 1.034 1.051 77 0.999 1.007 1.00828 1.074 1.077 1.057 78 0.986 0.994 1.00529 1.039 1.082 1.103 79 0.990 1.067 1.11730 1.036 1.073 1.084 80 0.930 0.994 1.01831 1.009 1.058 1.090 81 0.966 1.004 1.01732 0.964 1.071 1.150 82 0.983 1.042 1.06133 0.977 1.041 1.061 83 0.972 0.979 0.98134 0.987 1.074 1.109 84 0.998 1.003 1.00735 1.042 0.988 0.974 85 1.006 1.029 1.03536 0.981 1.006 1.016 86 1.057 1.047 1.01837 1.098 1.070 1.035 87 0.924 0.982 1.00438 1.015 1.028 1.032 88 0.973 1.016 1.03339 0.990 1.027 1.029 89 0.988 1.007 1.01640 0.976 1.065 1.097 90 0.999 1.006 1.00641 1.080 1.018 1.004 91 0.968 0.975 0.97742 1.026 1.093 1.109 92 1.010 1.008 1.00543 1.030 1.065 1.079 93 0.993 1.003 1.00544 1.087 1.054 1.040 94 0.997 1.010 1.01045 1.026 1.080 1.113 95 0.986 0.998 1.00246 1.048 1.093 1.099 96 1.007 1.001 0.99147 1.059 1.069 1.058 97 1.002 0.999 1.00248 0.993 1.053 1.077 98 1.009 1.003 1.00049 0.974 1.026 1.044 99 1.015 1.016 1.01250 1.045 1.086 1.101 100 1.010 1.003 1.001
NC : Not Considered
140
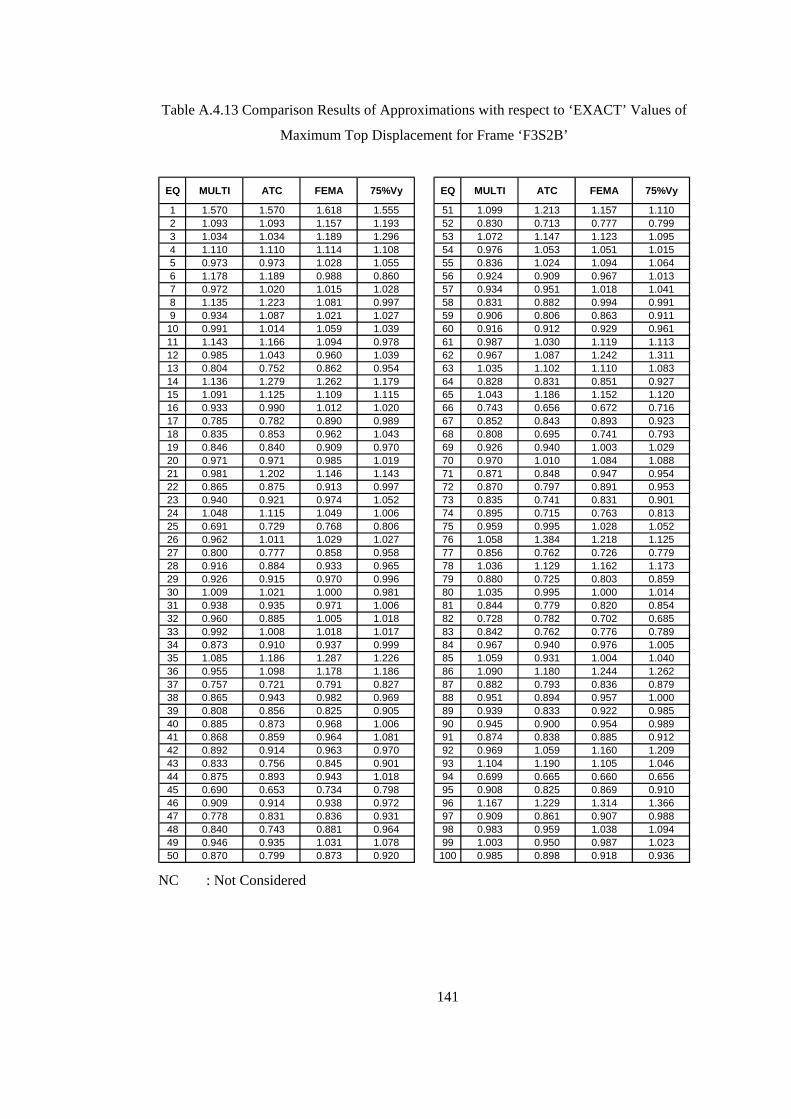
Table A.4.13 Comparison Results of Approximations with respect to ‘EXACT’ Values of
Maximum Top Displacement for Frame ‘F3S2B’
EQ MULTI ATC FEMA 75%Vy EQ MULTI ATC FEMA 75%Vy
1 1.570 1.570 1.618 1.555 51 1.099 1.213 1.157 1.1102 1.093 1.093 1.157 1.193 52 0.830 0.713 0.777 0.7993 1.034 1.034 1.189 1.296 53 1.072 1.147 1.123 1.0954 1.110 1.110 1.114 1.108 54 0.976 1.053 1.051 1.0155 0.973 0.973 1.028 1.055 55 0.836 1.024 1.094 1.0646 1.178 1.189 0.988 0.860 56 0.924 0.909 0.967 1.0137 0.972 1.020 1.015 1.028 57 0.934 0.951 1.018 1.0418 1.135 1.223 1.081 0.997 58 0.831 0.882 0.994 0.9919 0.934 1.087 1.021 1.027 59 0.906 0.806 0.863 0.911
10 0.991 1.014 1.059 1.039 60 0.916 0.912 0.929 0.96111 1.143 1.166 1.094 0.978 61 0.987 1.030 1.119 1.11312 0.985 1.043 0.960 1.039 62 0.967 1.087 1.242 1.31113 0.804 0.752 0.862 0.954 63 1.035 1.102 1.110 1.08314 1.136 1.279 1.262 1.179 64 0.828 0.831 0.851 0.92715 1.091 1.125 1.109 1.115 65 1.043 1.186 1.152 1.12016 0.933 0.990 1.012 1.020 66 0.743 0.656 0.672 0.71617 0.785 0.782 0.890 0.989 67 0.852 0.843 0.893 0.92318 0.835 0.853 0.962 1.043 68 0.808 0.695 0.741 0.79319 0.846 0.840 0.909 0.970 69 0.926 0.940 1.003 1.02920 0.971 0.971 0.985 1.019 70 0.970 1.010 1.084 1.08821 0.981 1.202 1.146 1.143 71 0.871 0.848 0.947 0.95422 0.865 0.875 0.913 0.997 72 0.870 0.797 0.891 0.95323 0.940 0.921 0.974 1.052 73 0.835 0.741 0.831 0.90124 1.048 1.115 1.049 1.006 74 0.895 0.715 0.763 0.81325 0.691 0.729 0.768 0.806 75 0.959 0.995 1.028 1.05226 0.962 1.011 1.029 1.027 76 1.058 1.384 1.218 1.12527 0.800 0.777 0.858 0.958 77 0.856 0.762 0.726 0.77928 0.916 0.884 0.933 0.965 78 1.036 1.129 1.162 1.17329 0.926 0.915 0.970 0.996 79 0.880 0.725 0.803 0.85930 1.009 1.021 1.000 0.981 80 1.035 0.995 1.000 1.01431 0.938 0.935 0.971 1.006 81 0.844 0.779 0.820 0.85432 0.960 0.885 1.005 1.018 82 0.728 0.782 0.702 0.68533 0.992 1.008 1.018 1.017 83 0.842 0.762 0.776 0.78934 0.873 0.910 0.937 0.999 84 0.967 0.940 0.976 1.00535 1.085 1.186 1.287 1.226 85 1.059 0.931 1.004 1.04036 0.955 1.098 1.178 1.186 86 1.090 1.180 1.244 1.26237 0.757 0.721 0.791 0.827 87 0.882 0.793 0.836 0.87938 0.865 0.943 0.982 0.969 88 0.951 0.894 0.957 1.00039 0.808 0.856 0.825 0.905 89 0.939 0.833 0.922 0.98540 0.885 0.873 0.968 1.006 90 0.945 0.900 0.954 0.98941 0.868 0.859 0.964 1.081 91 0.874 0.838 0.885 0.91242 0.892 0.914 0.963 0.970 92 0.969 1.059 1.160 1.20943 0.833 0.756 0.845 0.901 93 1.104 1.190 1.105 1.04644 0.875 0.893 0.943 1.018 94 0.699 0.665 0.660 0.65645 0.690 0.653 0.734 0.798 95 0.908 0.825 0.869 0.91046 0.909 0.914 0.938 0.972 96 1.167 1.229 1.314 1.36647 0.778 0.831 0.836 0.931 97 0.909 0.861 0.907 0.98848 0.840 0.743 0.881 0.964 98 0.983 0.959 1.038 1.09449 0.946 0.935 1.031 1.078 99 1.003 0.950 0.987 1.02350 0.870 0.799 0.873 0.920 100 0.985 0.898 0.918 0.936
NC : Not Considered
141

Table A.4.14 Comparison Results of Approximations with respect to ‘EXACT’ Values of
Maximum Inter-story Drift Ratio for Frame ‘F3S2B’
EQ MULTI ATC FEMA 75%Vy EQ MULTI ATC FEMA 75%Vy
1 1.563 1.563 1.610 1.547 51 1.094 1.195 1.146 1.1032 1.085 1.085 1.149 1.183 52 0.859 0.751 0.811 0.8313 1.028 1.029 1.187 1.296 53 1.069 1.145 1.121 1.0924 1.101 1.101 1.104 1.098 54 0.987 1.056 1.054 1.0225 0.974 0.974 1.031 1.059 55 0.839 1.027 1.093 1.0666 1.185 1.195 0.991 0.861 56 0.940 0.927 0.978 1.0187 0.965 1.013 1.008 1.022 57 0.933 0.950 1.018 1.0418 1.135 1.224 1.081 0.995 58 0.858 0.902 0.998 0.9969 0.933 1.086 1.020 1.025 59 0.916 0.816 0.874 0.921
10 0.989 1.012 1.058 1.038 60 0.911 0.907 0.924 0.95711 1.130 1.153 1.080 0.965 61 0.998 1.041 1.133 1.12612 0.980 1.038 0.955 1.035 62 0.975 1.082 1.217 1.27413 0.804 0.752 0.862 0.954 63 1.039 1.100 1.106 1.08214 1.139 1.283 1.265 1.182 64 0.831 0.834 0.854 0.93015 1.085 1.119 1.103 1.109 65 1.034 1.159 1.129 1.10216 0.934 0.991 1.013 1.021 66 0.789 0.708 0.723 0.76417 0.784 0.780 0.889 0.989 67 0.878 0.869 0.916 0.94218 0.832 0.849 0.958 1.040 68 0.835 0.729 0.773 0.82119 0.845 0.838 0.908 0.970 69 0.952 0.964 1.020 1.04220 0.971 0.971 0.985 1.019 70 0.988 1.024 1.088 1.09121 0.981 1.200 1.145 1.143 71 0.880 0.858 0.949 0.95622 0.865 0.875 0.913 0.998 72 0.872 0.799 0.894 0.95523 0.937 0.917 0.970 1.049 73 0.859 0.773 0.855 0.91724 1.046 1.114 1.047 1.004 74 0.904 0.746 0.789 0.83325 0.689 0.727 0.766 0.804 75 0.972 1.004 1.033 1.05326 0.973 1.017 1.033 1.031 76 1.054 1.344 1.200 1.11727 0.800 0.776 0.859 0.959 77 0.866 0.770 0.733 0.78828 0.917 0.885 0.934 0.967 78 1.034 1.117 1.147 1.15729 0.925 0.913 0.969 0.996 79 0.899 0.762 0.832 0.88030 0.989 1.002 0.980 0.962 80 1.036 0.999 1.003 1.01731 0.933 0.930 0.967 1.002 81 0.861 0.803 0.840 0.87132 0.962 0.888 1.006 1.018 82 0.760 0.811 0.736 0.72033 0.988 1.004 1.014 1.014 83 0.858 0.782 0.795 0.80834 0.869 0.905 0.933 0.994 84 0.969 0.945 0.977 1.00135 1.087 1.190 1.293 1.231 85 1.095 0.976 1.043 1.07836 0.956 1.096 1.170 1.176 86 1.074 1.153 1.209 1.22437 0.756 0.719 0.790 0.827 87 0.894 0.814 0.853 0.89138 0.863 0.942 0.982 0.969 88 0.955 0.902 0.960 0.99839 0.802 0.850 0.819 0.900 89 0.944 0.847 0.929 0.98640 0.901 0.889 0.978 1.013 90 0.956 0.916 0.964 0.99541 0.877 0.868 0.967 1.071 91 0.891 0.857 0.901 0.92642 0.903 0.922 0.966 0.972 92 0.974 1.051 1.139 1.18143 0.851 0.773 0.863 0.916 93 1.111 1.190 1.112 1.05844 0.875 0.894 0.945 1.020 94 0.717 0.684 0.680 0.67645 0.692 0.654 0.736 0.801 95 0.962 0.886 0.926 0.96446 0.910 0.916 0.940 0.974 96 1.122 1.176 1.250 1.29547 0.779 0.833 0.838 0.934 97 0.915 0.871 0.913 0.98748 0.862 0.764 0.901 0.977 98 0.977 0.955 1.025 1.07649 0.953 0.943 1.032 1.073 99 1.007 0.957 0.992 1.02550 0.880 0.808 0.882 0.930 100 0.967 0.885 0.905 0.921
NC : Not Considered
142

Table A.4.15 Comparison Results of Approximations with respect to ‘EXACT’ Values of
Maximum Base Shear for Frame ‘F3S2B’
EQ MULTI ATC FEMA 75%Vy EQ MULTI ATC FEMA 75%Vy
1 1.331 1.331 1.365 1.321 51 1.034 1.073 1.055 1.0382 1.104 1.104 1.158 1.187 52 0.904 0.856 0.884 0.8933 1.003 1.003 1.143 1.239 53 1.151 1.204 1.187 1.1684 1.012 1.012 1.015 1.010 54 0.899 0.924 0.924 0.9135 1.039 1.039 1.097 1.124 55 0.826 0.940 0.973 0.9606 1.112 1.121 0.940 0.825 56 0.894 0.891 0.905 0.9177 0.887 0.928 0.924 0.935 57 0.989 1.001 1.046 1.0618 1.105 1.187 1.055 0.975 58 0.927 0.941 0.965 0.9659 0.912 1.055 0.993 0.998 59 0.850 0.789 0.825 0.853
10 1.006 1.029 1.073 1.054 60 0.928 0.924 0.941 0.97211 1.068 1.088 1.023 0.920 61 0.999 1.028 1.085 1.08112 0.918 0.969 0.895 0.966 62 0.943 0.986 1.030 1.04513 0.806 0.756 0.861 0.949 63 0.974 0.998 1.001 0.99114 1.087 1.174 1.163 1.113 64 0.836 0.838 0.851 0.89915 1.011 1.041 1.027 1.032 65 1.208 1.266 1.254 1.24116 0.917 0.971 0.992 0.999 66 0.901 0.868 0.875 0.89217 0.810 0.807 0.913 0.992 67 0.895 0.891 0.910 0.92018 0.763 0.778 0.873 0.944 68 0.903 0.849 0.874 0.89719 0.868 0.863 0.912 0.952 69 0.893 0.897 0.913 0.91820 0.946 0.947 0.958 0.987 70 0.860 0.871 0.888 0.88921 0.956 1.088 1.057 1.055 71 0.927 0.915 0.962 0.96522 0.865 0.872 0.897 0.951 72 0.845 0.799 0.859 0.89723 0.892 0.874 0.922 0.993 73 0.931 0.893 0.929 0.95124 1.070 1.136 1.071 1.029 74 0.977 0.926 0.943 0.95725 0.702 0.739 0.776 0.813 75 0.892 0.901 0.908 0.91426 0.969 0.987 0.994 0.993 76 1.072 1.194 1.140 1.10427 0.957 0.938 1.002 1.075 77 0.789 0.732 0.709 0.74228 0.874 0.845 0.890 0.919 78 0.937 0.957 0.960 0.96129 0.901 0.894 0.929 0.946 79 0.927 0.885 0.910 0.92230 1.111 1.124 1.101 1.081 80 0.835 0.836 0.836 0.83531 0.915 0.912 0.946 0.977 81 0.867 0.849 0.861 0.87032 0.958 0.911 0.983 0.989 82 0.984 0.992 0.976 0.96833 1.119 1.130 1.137 1.137 83 0.871 0.876 0.874 0.87434 0.828 0.861 0.886 0.941 84 0.996 0.987 0.999 1.00735 1.016 1.077 1.136 1.101 85 0.989 0.954 0.976 0.98636 1.060 1.152 1.190 1.194 86 0.981 1.012 1.032 1.03837 0.785 0.753 0.809 0.833 87 0.901 0.876 0.888 0.90038 0.919 0.974 1.001 0.992 88 0.949 0.947 0.948 0.94239 1.054 1.104 1.074 1.146 89 0.952 0.924 0.950 0.95740 0.879 0.872 0.917 0.931 90 0.903 0.891 0.906 0.91441 0.924 0.919 0.972 1.015 91 0.916 0.913 0.917 0.91842 0.968 0.977 0.996 0.999 92 1.017 1.038 1.064 1.07643 0.859 0.808 0.865 0.894 93 0.886 0.894 0.886 0.87344 0.878 0.891 0.923 0.969 94 0.816 0.818 0.818 0.81945 0.758 0.719 0.797 0.842 95 0.899 0.878 0.889 0.89946 0.968 0.972 0.988 1.011 96 0.961 0.972 0.979 0.98047 0.829 0.884 0.889 0.978 97 1.001 0.988 1.001 1.01048 0.903 0.840 0.924 0.959 98 0.969 0.968 0.964 0.95949 0.983 0.978 1.022 1.040 99 0.841 0.841 0.841 0.83750 0.832 0.788 0.833 0.863 100 0.860 0.869 0.868 0.866
NC : Not Considered
143
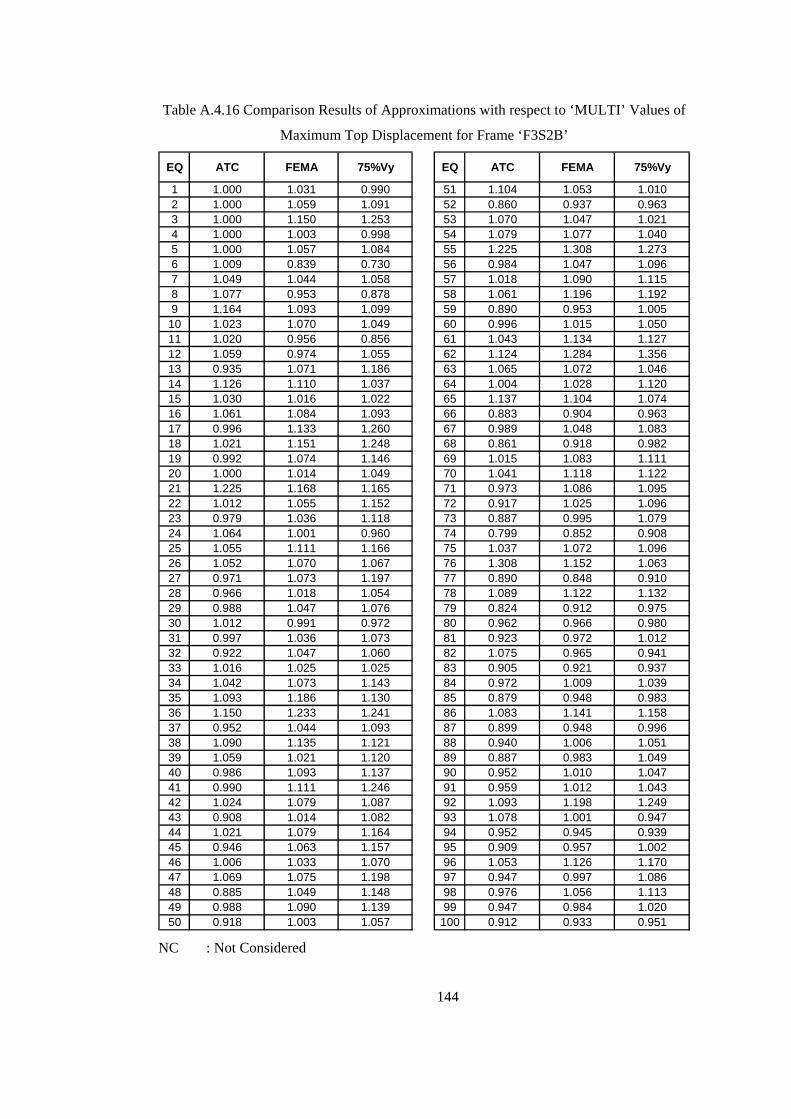
Table A.4.16 Comparison Results of Approximations with respect to ‘MULTI’ Values of
Maximum Top Displacement for Frame ‘F3S2B’
EQ ATC FEMA 75%Vy EQ ATC FEMA 75%Vy
1 1.000 1.031 0.990 51 1.104 1.053 1.0102 1.000 1.059 1.091 52 0.860 0.937 0.9633 1.000 1.150 1.253 53 1.070 1.047 1.0214 1.000 1.003 0.998 54 1.079 1.077 1.0405 1.000 1.057 1.084 55 1.225 1.308 1.2736 1.009 0.839 0.730 56 0.984 1.047 1.0967 1.049 1.044 1.058 57 1.018 1.090 1.1158 1.077 0.953 0.878 58 1.061 1.196 1.1929 1.164 1.093 1.099 59 0.890 0.953 1.00510 1.023 1.070 1.049 60 0.996 1.015 1.05011 1.020 0.956 0.856 61 1.043 1.134 1.12712 1.059 0.974 1.055 62 1.124 1.284 1.35613 0.935 1.071 1.186 63 1.065 1.072 1.04614 1.126 1.110 1.037 64 1.004 1.028 1.12015 1.030 1.016 1.022 65 1.137 1.104 1.07416 1.061 1.084 1.093 66 0.883 0.904 0.96317 0.996 1.133 1.260 67 0.989 1.048 1.08318 1.021 1.151 1.248 68 0.861 0.918 0.98219 0.992 1.074 1.146 69 1.015 1.083 1.11120 1.000 1.014 1.049 70 1.041 1.118 1.12221 1.225 1.168 1.165 71 0.973 1.086 1.09522 1.012 1.055 1.152 72 0.917 1.025 1.09623 0.979 1.036 1.118 73 0.887 0.995 1.07924 1.064 1.001 0.960 74 0.799 0.852 0.90825 1.055 1.111 1.166 75 1.037 1.072 1.09626 1.052 1.070 1.067 76 1.308 1.152 1.06327 0.971 1.073 1.197 77 0.890 0.848 0.91028 0.966 1.018 1.054 78 1.089 1.122 1.13229 0.988 1.047 1.076 79 0.824 0.912 0.97530 1.012 0.991 0.972 80 0.962 0.966 0.98031 0.997 1.036 1.073 81 0.923 0.972 1.01232 0.922 1.047 1.060 82 1.075 0.965 0.94133 1.016 1.025 1.025 83 0.905 0.921 0.93734 1.042 1.073 1.143 84 0.972 1.009 1.03935 1.093 1.186 1.130 85 0.879 0.948 0.98336 1.150 1.233 1.241 86 1.083 1.141 1.15837 0.952 1.044 1.093 87 0.899 0.948 0.99638 1.090 1.135 1.121 88 0.940 1.006 1.05139 1.059 1.021 1.120 89 0.887 0.983 1.04940 0.986 1.093 1.137 90 0.952 1.010 1.04741 0.990 1.111 1.246 91 0.959 1.012 1.04342 1.024 1.079 1.087 92 1.093 1.198 1.24943 0.908 1.014 1.082 93 1.078 1.001 0.94744 1.021 1.079 1.164 94 0.952 0.945 0.93945 0.946 1.063 1.157 95 0.909 0.957 1.00246 1.006 1.033 1.070 96 1.053 1.126 1.17047 1.069 1.075 1.198 97 0.947 0.997 1.08648 0.885 1.049 1.148 98 0.976 1.056 1.11349 0.988 1.090 1.139 99 0.947 0.984 1.02050 0.918 1.003 1.057 100 0.912 0.933 0.951
NC : Not Considered
144

Table A.4.17 Comparison Results of Approximations with respect to ‘MULTI’ Values of
Maximum Inter-story Drift Ratio for Frame ‘F3S2B’
EQ ATC FEMA 75%Vy EQ ATC FEMA 75%Vy
1 1.000 1.030 0.990 51 1.093 1.047 1.0092 1.000 1.059 1.091 52 0.875 0.944 0.9683 1.000 1.154 1.260 53 1.071 1.048 1.0224 1.000 1.003 0.998 54 1.070 1.068 1.0365 1.000 1.059 1.087 55 1.224 1.303 1.2706 1.009 0.837 0.727 56 0.986 1.041 1.0837 1.049 1.044 1.058 57 1.019 1.091 1.1168 1.078 0.952 0.877 58 1.052 1.164 1.1619 1.165 1.093 1.100 59 0.890 0.953 1.00510 1.023 1.070 1.050 60 0.996 1.015 1.05011 1.020 0.956 0.854 61 1.044 1.136 1.12912 1.059 0.974 1.055 62 1.110 1.248 1.30713 0.935 1.072 1.187 63 1.058 1.064 1.04114 1.127 1.111 1.038 64 1.004 1.028 1.11915 1.031 1.016 1.022 65 1.121 1.093 1.06616 1.061 1.085 1.094 66 0.897 0.916 0.96817 0.996 1.134 1.263 67 0.990 1.043 1.07318 1.021 1.152 1.251 68 0.873 0.926 0.98419 0.992 1.075 1.148 69 1.013 1.071 1.09520 1.000 1.014 1.050 70 1.036 1.101 1.10421 1.224 1.168 1.165 71 0.975 1.079 1.08622 1.012 1.056 1.155 72 0.916 1.025 1.09523 0.979 1.036 1.120 73 0.900 0.995 1.06824 1.065 1.001 0.960 74 0.825 0.873 0.92125 1.055 1.111 1.167 75 1.032 1.063 1.08426 1.046 1.062 1.060 76 1.275 1.138 1.05927 0.971 1.074 1.198 77 0.890 0.847 0.91028 0.966 1.019 1.054 78 1.081 1.110 1.11929 0.988 1.048 1.077 79 0.848 0.926 0.97930 1.012 0.991 0.972 80 0.965 0.969 0.98231 0.997 1.036 1.074 81 0.932 0.975 1.01132 0.923 1.046 1.058 82 1.068 0.968 0.94733 1.016 1.026 1.026 83 0.911 0.927 0.94234 1.042 1.073 1.144 84 0.975 1.008 1.03335 1.095 1.189 1.132 85 0.891 0.952 0.98436 1.146 1.223 1.230 86 1.074 1.126 1.14037 0.952 1.045 1.094 87 0.911 0.954 0.99638 1.091 1.137 1.123 88 0.945 1.006 1.04639 1.059 1.021 1.122 89 0.898 0.984 1.04540 0.987 1.086 1.125 90 0.958 1.008 1.04141 0.990 1.103 1.221 91 0.962 1.011 1.03942 1.022 1.070 1.077 92 1.079 1.169 1.21343 0.909 1.014 1.077 93 1.071 1.001 0.95244 1.022 1.080 1.165 94 0.954 0.948 0.94345 0.945 1.064 1.159 95 0.921 0.963 1.00246 1.006 1.033 1.070 96 1.048 1.114 1.15447 1.069 1.075 1.199 97 0.952 0.997 1.07848 0.887 1.045 1.134 98 0.978 1.050 1.10249 0.989 1.082 1.126 99 0.950 0.985 1.01850 0.919 1.003 1.057 100 0.916 0.936 0.953
NC : Not Considered
145

Table A.4.18 Comparison Results of Approximations with respect to ‘MULTI’ Values of
Maximum Base Shear for Frame ‘F3S2B’
EQ ATC FEMA 75%Vy EQ ATC FEMA 75%Vy
1 1.000 1.026 0.992 51 1.038 1.020 1.0042 1.000 1.049 1.075 52 0.948 0.978 0.9883 1.000 1.140 1.236 53 1.045 1.031 1.0144 1.000 1.003 0.998 54 1.028 1.027 1.0155 1.000 1.056 1.082 55 1.137 1.177 1.1626 1.008 0.846 0.742 56 0.996 1.012 1.0257 1.047 1.042 1.055 57 1.012 1.058 1.0738 1.074 0.954 0.883 58 1.016 1.042 1.0419 1.157 1.089 1.095 59 0.928 0.970 1.00310 1.022 1.067 1.047 60 0.996 1.014 1.04811 1.019 0.958 0.862 61 1.028 1.086 1.08212 1.056 0.975 1.052 62 1.045 1.092 1.10713 0.938 1.068 1.177 63 1.025 1.028 1.01814 1.079 1.070 1.024 64 1.003 1.018 1.07615 1.029 1.015 1.021 65 1.048 1.038 1.02716 1.058 1.081 1.089 66 0.963 0.971 0.99017 0.996 1.127 1.224 67 0.996 1.017 1.02818 1.020 1.144 1.237 68 0.940 0.968 0.99319 0.993 1.050 1.097 69 1.004 1.022 1.02920 1.000 1.012 1.042 70 1.013 1.033 1.03421 1.138 1.105 1.104 71 0.986 1.037 1.04022 1.008 1.037 1.099 72 0.946 1.016 1.06123 0.980 1.034 1.113 73 0.959 0.998 1.02124 1.061 1.001 0.962 74 0.947 0.965 0.97925 1.053 1.106 1.158 75 1.010 1.019 1.02526 1.019 1.026 1.025 76 1.115 1.064 1.03127 0.981 1.048 1.124 77 0.928 0.899 0.94128 0.967 1.018 1.052 78 1.021 1.024 1.02529 0.992 1.031 1.049 79 0.954 0.982 0.99430 1.012 0.992 0.974 80 1.001 1.001 1.00131 0.997 1.034 1.067 81 0.979 0.993 1.00332 0.951 1.026 1.033 82 1.008 0.992 0.98433 1.010 1.016 1.016 83 1.005 1.003 1.00334 1.040 1.070 1.137 84 0.991 1.003 1.01135 1.061 1.119 1.084 85 0.965 0.986 0.99736 1.087 1.123 1.126 86 1.032 1.053 1.05837 0.959 1.030 1.062 87 0.972 0.986 0.99938 1.060 1.089 1.080 88 0.998 0.999 0.99339 1.047 1.019 1.087 89 0.970 0.997 1.00540 0.992 1.044 1.060 90 0.986 1.002 1.01241 0.994 1.051 1.098 91 0.996 1.001 1.00142 1.009 1.029 1.032 92 1.021 1.046 1.05843 0.942 1.008 1.041 93 1.009 1.000 0.98644 1.014 1.051 1.104 94 1.003 1.004 1.00445 0.949 1.051 1.111 95 0.977 0.989 1.00146 1.004 1.021 1.044 96 1.012 1.019 1.02047 1.066 1.072 1.180 97 0.987 1.000 1.00848 0.930 1.023 1.061 98 0.999 0.994 0.98949 0.994 1.040 1.057 99 1.000 0.999 0.99550 0.947 1.002 1.037 100 1.010 1.009 1.007
NC : Not Considered
146

Table A.4.19 Comparison Results of Approximations with respect to ‘EXACT’ Values of
Maximum Top Displacement for Frame ‘F5S2B’
EQ MULTI ATC FEMA 75%Vy EQ MULTI ATC FEMA 75%Vy
1 1.016 1.016 1.632 1.839 51 0.950 0.851 1.081 1.0892 1.027 1.026 1.601 1.741 52 1.032 0.999 1.044 1.0673 1.020 1.008 1.211 1.245 53 0.852 0.816 0.989 1.0424 0.987 0.988 0.927 0.929 54 NC NC NC NC5 0.982 0.987 1.135 1.110 55 0.895 0.818 1.036 0.9796 0.933 0.933 0.860 0.909 56 0.828 0.725 0.751 0.7627 0.787 0.852 1.065 1.049 57 0.682 0.853 0.975 1.0828 0.649 0.685 1.222 1.269 58 1.207 0.850 1.350 1.1899 0.994 1.200 0.936 0.889 59 1.056 0.911 1.115 1.138
10 0.960 1.326 1.004 1.089 60 0.883 0.832 1.123 1.12711 0.907 1.012 0.915 0.928 61 0.814 0.670 1.051 1.04512 0.744 0.747 1.013 1.011 62 1.035 1.356 1.148 1.11113 0.735 0.693 0.943 1.009 63 1.047 1.165 1.448 1.44714 0.823 0.646 0.951 1.027 64 1.075 0.976 1.051 1.03915 0.936 0.972 1.349 1.288 65 0.819 0.612 0.950 0.98916 0.951 0.922 0.979 0.987 66 1.077 1.195 1.187 1.27417 0.636 0.569 1.003 1.095 67 1.076 1.107 1.192 1.22018 0.818 1.180 0.865 0.873 68 0.892 0.945 1.054 1.05219 0.771 0.655 0.943 1.038 69 1.226 1.379 1.454 1.43420 0.911 0.522 0.847 0.896 70 0.962 0.757 0.962 0.98321 0.925 1.031 1.020 1.036 71 0.945 1.347 1.015 0.99622 0.915 0.944 1.002 1.018 72 0.919 0.813 0.998 1.01423 0.874 1.010 1.098 1.040 73 0.908 0.748 0.974 1.01024 0.813 1.024 1.386 1.478 74 1.092 1.321 1.504 1.45925 0.722 0.694 0.992 1.108 75 1.105 1.381 1.255 1.24726 0.894 0.846 1.108 1.134 76 0.947 0.776 1.027 1.05627 0.951 1.027 0.990 0.991 77 0.609 0.652 0.463 0.50628 0.807 0.522 0.782 0.825 78 1.257 1.406 1.454 1.43029 0.874 0.805 0.879 0.955 79 0.972 1.046 1.079 1.09030 0.922 1.037 0.732 0.727 80 0.735 0.708 0.661 0.66331 1.091 1.425 1.143 1.071 81 NC NC NC NC32 1.031 1.176 0.988 1.023 82 1.028 0.803 1.097 1.07933 0.938 1.014 0.923 0.907 83 1.064 1.190 1.176 1.16734 0.996 0.886 1.198 1.315 84 0.986 0.959 1.008 1.00735 0.793 0.677 0.994 1.015 85 1.361 1.317 1.592 1.67636 0.966 1.246 1.028 1.002 86 0.991 0.827 1.098 1.13437 0.935 0.994 1.081 0.995 87 0.747 0.672 0.743 0.76038 0.884 0.893 0.995 1.041 88 1.054 1.003 1.093 1.05239 0.856 0.985 0.873 0.855 89 0.904 0.898 0.847 0.82840 0.935 0.743 1.009 1.034 90 0.982 1.104 1.034 0.99941 0.960 0.862 1.220 1.242 91 1.084 1.125 1.129 1.13842 0.929 1.175 1.035 1.012 92 0.982 0.882 0.982 0.99943 1.031 0.857 1.134 1.090 93 1.163 1.225 1.138 1.11044 0.755 0.702 0.882 0.926 94 0.861 1.128 0.863 0.85445 0.846 0.919 1.023 1.040 95 1.042 0.943 1.389 1.37046 0.964 1.008 0.946 0.953 96 1.153 1.018 1.449 1.60247 0.815 0.560 1.022 1.103 97 1.061 1.415 1.361 1.14248 0.883 0.694 0.970 1.006 98 1.046 1.106 1.077 1.12749 0.888 0.759 0.979 1.018 99 1.065 1.002 1.077 1.09050 1.038 1.013 0.985 0.959 100 0.782 0.672 0.868 0.833
NC : Not Considered
147
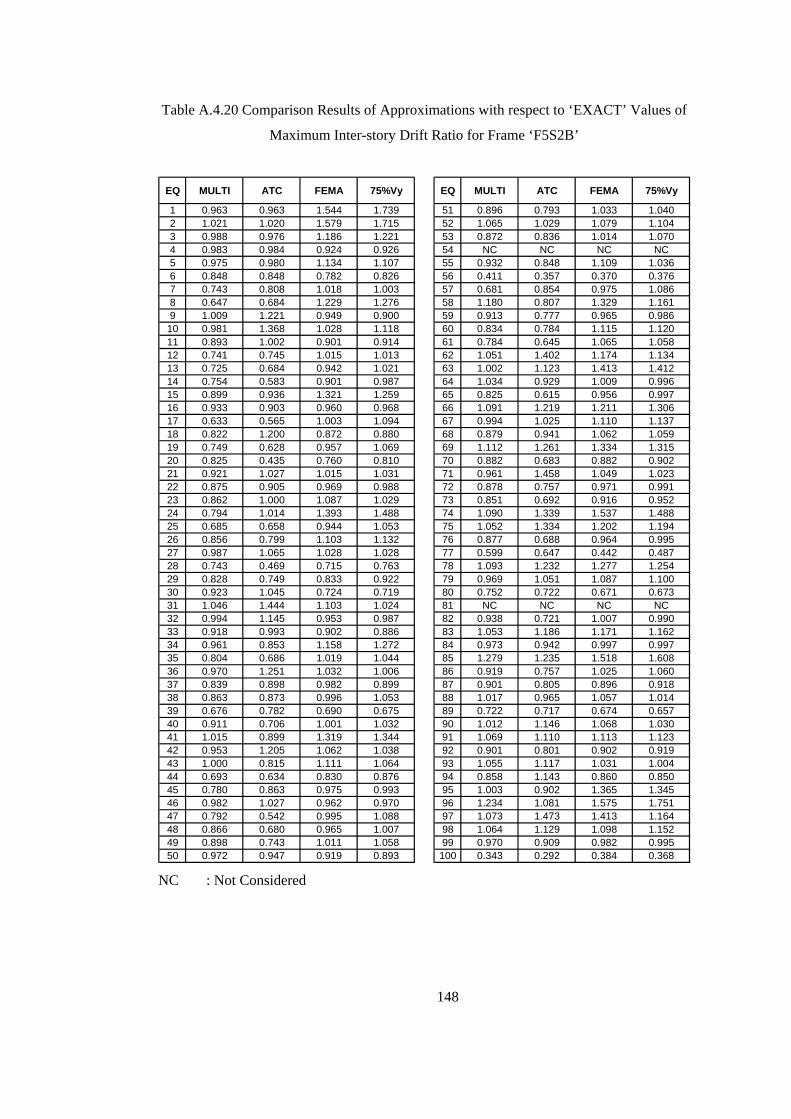
Table A.4.20 Comparison Results of Approximations with respect to ‘EXACT’ Values of
Maximum Inter-story Drift Ratio for Frame ‘F5S2B’
EQ MULTI ATC FEMA 75%Vy EQ MULTI ATC FEMA 75%Vy
1 0.963 0.963 1.544 1.739 51 0.896 0.793 1.033 1.0402 1.021 1.020 1.579 1.715 52 1.065 1.029 1.079 1.1043 0.988 0.976 1.186 1.221 53 0.872 0.836 1.014 1.0704 0.983 0.984 0.924 0.926 54 NC NC NC NC5 0.975 0.980 1.134 1.107 55 0.932 0.848 1.109 1.0366 0.848 0.848 0.782 0.826 56 0.411 0.357 0.370 0.3767 0.743 0.808 1.018 1.003 57 0.681 0.854 0.975 1.0868 0.647 0.684 1.229 1.276 58 1.180 0.807 1.329 1.1619 1.009 1.221 0.949 0.900 59 0.913 0.777 0.965 0.986
10 0.981 1.368 1.028 1.118 60 0.834 0.784 1.115 1.12011 0.893 1.002 0.901 0.914 61 0.784 0.645 1.065 1.05812 0.741 0.745 1.015 1.013 62 1.051 1.402 1.174 1.13413 0.725 0.684 0.942 1.021 63 1.002 1.123 1.413 1.41214 0.754 0.583 0.901 0.987 64 1.034 0.929 1.009 0.99615 0.899 0.936 1.321 1.259 65 0.825 0.615 0.956 0.99716 0.933 0.903 0.960 0.968 66 1.091 1.219 1.211 1.30617 0.633 0.565 1.003 1.094 67 0.994 1.025 1.110 1.13718 0.822 1.200 0.872 0.880 68 0.879 0.941 1.062 1.05919 0.749 0.628 0.957 1.069 69 1.112 1.261 1.334 1.31520 0.825 0.435 0.760 0.810 70 0.882 0.683 0.882 0.90221 0.921 1.027 1.015 1.031 71 0.961 1.458 1.049 1.02322 0.875 0.905 0.969 0.988 72 0.878 0.757 0.971 0.99123 0.862 1.000 1.087 1.029 73 0.851 0.692 0.916 0.95224 0.794 1.014 1.393 1.488 74 1.090 1.339 1.537 1.48825 0.685 0.658 0.944 1.053 75 1.052 1.334 1.202 1.19426 0.856 0.799 1.103 1.132 76 0.877 0.688 0.964 0.99527 0.987 1.065 1.028 1.028 77 0.599 0.647 0.442 0.48728 0.743 0.469 0.715 0.763 78 1.093 1.232 1.277 1.25429 0.828 0.749 0.833 0.922 79 0.969 1.051 1.087 1.10030 0.923 1.045 0.724 0.719 80 0.752 0.722 0.671 0.67331 1.046 1.444 1.103 1.024 81 NC NC NC NC32 0.994 1.145 0.953 0.987 82 0.938 0.721 1.007 0.99033 0.918 0.993 0.902 0.886 83 1.053 1.186 1.171 1.16234 0.961 0.853 1.158 1.272 84 0.973 0.942 0.997 0.99735 0.804 0.686 1.019 1.044 85 1.279 1.235 1.518 1.60836 0.970 1.251 1.032 1.006 86 0.919 0.757 1.025 1.06037 0.839 0.898 0.982 0.899 87 0.901 0.805 0.896 0.91838 0.863 0.873 0.996 1.053 88 1.017 0.965 1.057 1.01439 0.676 0.782 0.690 0.675 89 0.722 0.717 0.674 0.65740 0.911 0.706 1.001 1.032 90 1.012 1.146 1.068 1.03041 1.015 0.899 1.319 1.344 91 1.069 1.110 1.113 1.12342 0.953 1.205 1.062 1.038 92 0.901 0.801 0.902 0.91943 1.000 0.815 1.111 1.064 93 1.055 1.117 1.031 1.00444 0.693 0.634 0.830 0.876 94 0.858 1.143 0.860 0.85045 0.780 0.863 0.975 0.993 95 1.003 0.902 1.365 1.34546 0.982 1.027 0.962 0.970 96 1.234 1.081 1.575 1.75147 0.792 0.542 0.995 1.088 97 1.073 1.473 1.413 1.16448 0.866 0.680 0.965 1.007 98 1.064 1.129 1.098 1.15249 0.898 0.743 1.011 1.058 99 0.970 0.909 0.982 0.99550 0.972 0.947 0.919 0.893 100 0.343 0.292 0.384 0.368
NC : Not Considered
148

Table A.4.21 Comparison Results of Approximations with respect to ‘EXACT’ Values of
Maximum Base Shear for Frame ‘F5S2B’
EQ MULTI ATC FEMA 75%Vy EQ MULTI ATC FEMA 75%Vy
1 0.742 0.741 1.188 1.338 51 0.932 0.919 0.946 0.9472 1.036 1.035 1.628 1.774 52 1.008 1.004 1.009 1.0113 0.971 0.961 1.125 1.152 53 0.926 0.893 1.055 1.1054 0.932 0.932 0.874 0.876 54 NC NC NC NC5 0.863 0.867 0.978 0.959 55 0.904 0.846 0.971 0.9516 0.874 0.874 0.811 0.854 56 1.064 1.050 1.054 1.0557 0.777 0.831 1.005 0.992 57 0.729 0.887 0.996 1.0808 0.694 0.727 1.200 1.240 58 0.999 0.961 1.010 0.9979 1.045 1.230 0.993 0.950 59 0.866 0.878 0.867 0.868
10 1.133 1.491 1.176 1.260 60 0.883 0.846 0.973 0.97411 0.887 0.973 0.894 0.904 61 0.918 0.781 1.021 1.02012 0.784 0.787 1.024 1.022 62 1.015 1.042 1.026 1.02313 0.791 0.752 0.958 0.988 63 0.985 0.994 0.996 0.99614 0.878 0.735 0.921 0.933 64 0.921 0.910 0.919 0.91815 0.850 0.878 1.164 1.119 65 1.040 0.805 1.181 1.21916 0.994 0.968 1.019 1.026 66 0.993 1.000 1.000 1.00917 0.671 0.610 0.997 1.076 67 0.971 0.974 0.979 0.98118 0.826 1.128 0.866 0.873 68 0.988 0.994 1.003 1.00319 0.926 0.823 0.988 0.997 69 0.921 0.930 0.933 0.93320 0.875 0.712 0.867 0.873 70 0.920 0.899 0.920 0.92121 0.913 1.003 0.994 1.007 71 1.009 1.075 1.035 1.02822 0.875 0.894 0.927 0.935 72 0.901 0.851 0.918 0.92123 0.883 0.999 1.073 1.024 73 0.910 0.894 0.917 0.92024 0.823 1.001 1.293 1.365 74 0.953 0.970 0.984 0.98125 0.682 0.659 0.900 0.990 75 0.964 0.955 0.968 0.96826 0.935 0.918 0.964 0.966 76 0.905 0.847 0.915 0.91427 0.968 1.034 1.003 1.003 77 0.848 0.858 0.859 0.85028 0.905 0.650 0.892 0.912 78 0.891 0.899 0.902 0.90129 0.925 0.895 0.927 0.944 79 1.012 1.022 1.025 1.02630 1.057 1.169 0.866 0.862 80 1.013 1.010 1.005 1.00531 0.973 1.064 1.000 0.962 81 NC NC NC NC32 0.923 1.014 0.889 0.917 82 1.015 1.015 1.006 1.00333 1.071 1.145 1.056 1.041 83 1.034 1.036 1.041 1.04034 0.908 0.821 1.066 1.156 84 0.938 0.934 0.936 0.93835 0.871 0.758 1.034 1.047 85 0.916 0.924 0.903 0.89436 0.968 1.208 1.022 1.000 86 0.921 0.906 0.931 0.93437 0.976 0.983 0.991 0.983 87 0.924 0.914 0.924 0.92638 0.929 0.934 0.968 0.977 88 0.962 0.957 0.965 0.96239 0.690 0.777 0.702 0.689 89 0.871 0.870 0.865 0.86340 0.934 0.806 0.955 0.960 90 1.015 1.024 1.020 1.01641 1.017 1.009 1.047 1.049 91 0.948 0.954 0.954 0.95442 1.123 1.375 1.234 1.210 92 0.896 0.884 0.896 0.89843 0.955 0.938 0.966 0.962 93 0.886 0.883 0.889 0.89144 0.916 0.901 0.931 0.937 94 0.999 1.015 0.999 0.99845 0.905 0.919 0.926 0.928 95 0.907 0.900 0.889 0.89146 0.971 1.009 0.955 0.962 96 0.979 0.968 0.999 1.00247 0.820 0.591 0.986 1.031 97 0.915 0.947 0.944 0.92348 0.871 0.712 0.923 0.938 98 0.934 0.940 0.937 0.94149 1.012 0.949 1.030 1.036 99 0.933 0.927 0.934 0.93550 0.893 0.891 0.888 0.885 100 0.970 0.955 0.978 0.975
NC : Not Considered
149
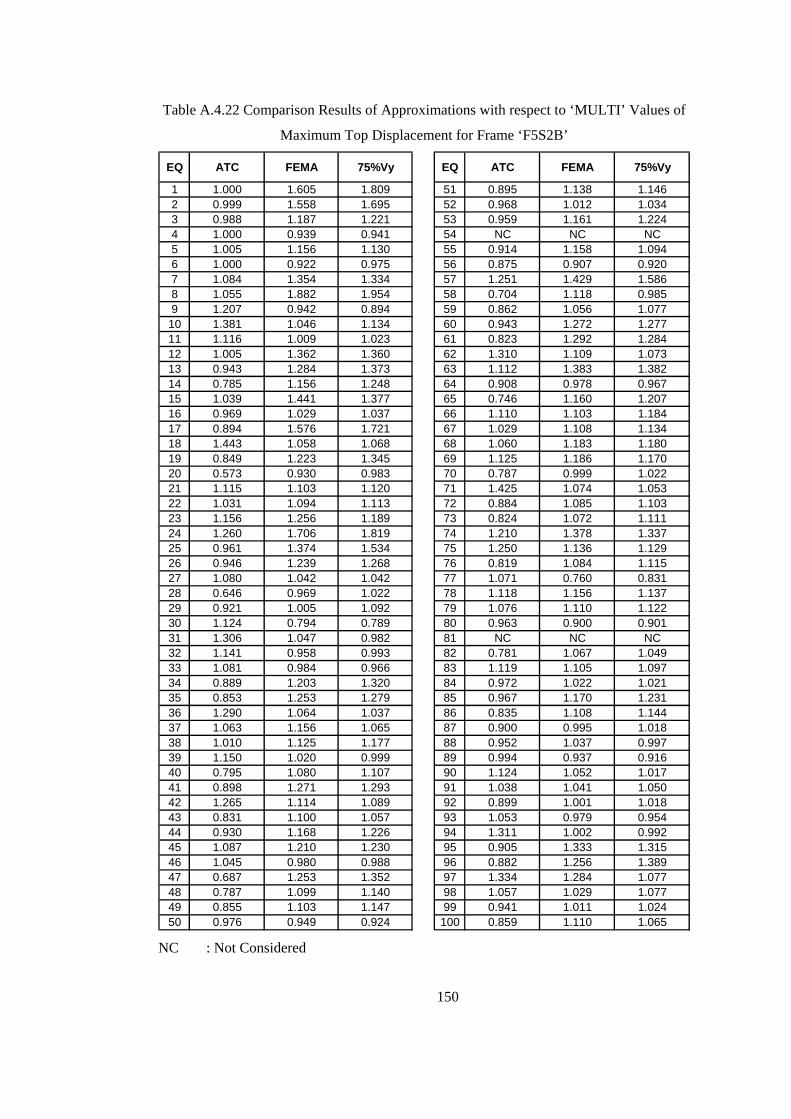
Table A.4.22 Comparison Results of Approximations with respect to ‘MULTI’ Values of
Maximum Top Displacement for Frame ‘F5S2B’
EQ ATC FEMA 75%Vy EQ ATC FEMA 75%Vy
1 1.000 1.605 1.809 51 0.895 1.138 1.1462 0.999 1.558 1.695 52 0.968 1.012 1.0343 0.988 1.187 1.221 53 0.959 1.161 1.2244 1.000 0.939 0.941 54 NC NC NC5 1.005 1.156 1.130 55 0.914 1.158 1.0946 1.000 0.922 0.975 56 0.875 0.907 0.9207 1.084 1.354 1.334 57 1.251 1.429 1.5868 1.055 1.882 1.954 58 0.704 1.118 0.9859 1.207 0.942 0.894 59 0.862 1.056 1.07710 1.381 1.046 1.134 60 0.943 1.272 1.27711 1.116 1.009 1.023 61 0.823 1.292 1.28412 1.005 1.362 1.360 62 1.310 1.109 1.07313 0.943 1.284 1.373 63 1.112 1.383 1.38214 0.785 1.156 1.248 64 0.908 0.978 0.96715 1.039 1.441 1.377 65 0.746 1.160 1.20716 0.969 1.029 1.037 66 1.110 1.103 1.18417 0.894 1.576 1.721 67 1.029 1.108 1.13418 1.443 1.058 1.068 68 1.060 1.183 1.18019 0.849 1.223 1.345 69 1.125 1.186 1.17020 0.573 0.930 0.983 70 0.787 0.999 1.02221 1.115 1.103 1.120 71 1.425 1.074 1.05322 1.031 1.094 1.113 72 0.884 1.085 1.10323 1.156 1.256 1.189 73 0.824 1.072 1.11124 1.260 1.706 1.819 74 1.210 1.378 1.33725 0.961 1.374 1.534 75 1.250 1.136 1.12926 0.946 1.239 1.268 76 0.819 1.084 1.11527 1.080 1.042 1.042 77 1.071 0.760 0.83128 0.646 0.969 1.022 78 1.118 1.156 1.13729 0.921 1.005 1.092 79 1.076 1.110 1.12230 1.124 0.794 0.789 80 0.963 0.900 0.90131 1.306 1.047 0.982 81 NC NC NC32 1.141 0.958 0.993 82 0.781 1.067 1.04933 1.081 0.984 0.966 83 1.119 1.105 1.09734 0.889 1.203 1.320 84 0.972 1.022 1.02135 0.853 1.253 1.279 85 0.967 1.170 1.23136 1.290 1.064 1.037 86 0.835 1.108 1.14437 1.063 1.156 1.065 87 0.900 0.995 1.01838 1.010 1.125 1.177 88 0.952 1.037 0.99739 1.150 1.020 0.999 89 0.994 0.937 0.91640 0.795 1.080 1.107 90 1.124 1.052 1.01741 0.898 1.271 1.293 91 1.038 1.041 1.05042 1.265 1.114 1.089 92 0.899 1.001 1.01843 0.831 1.100 1.057 93 1.053 0.979 0.95444 0.930 1.168 1.226 94 1.311 1.002 0.99245 1.087 1.210 1.230 95 0.905 1.333 1.31546 1.045 0.980 0.988 96 0.882 1.256 1.38947 0.687 1.253 1.352 97 1.334 1.284 1.07748 0.787 1.099 1.140 98 1.057 1.029 1.07749 0.855 1.103 1.147 99 0.941 1.011 1.02450 0.976 0.949 0.924 100 0.859 1.110 1.065
NC : Not Considered
150
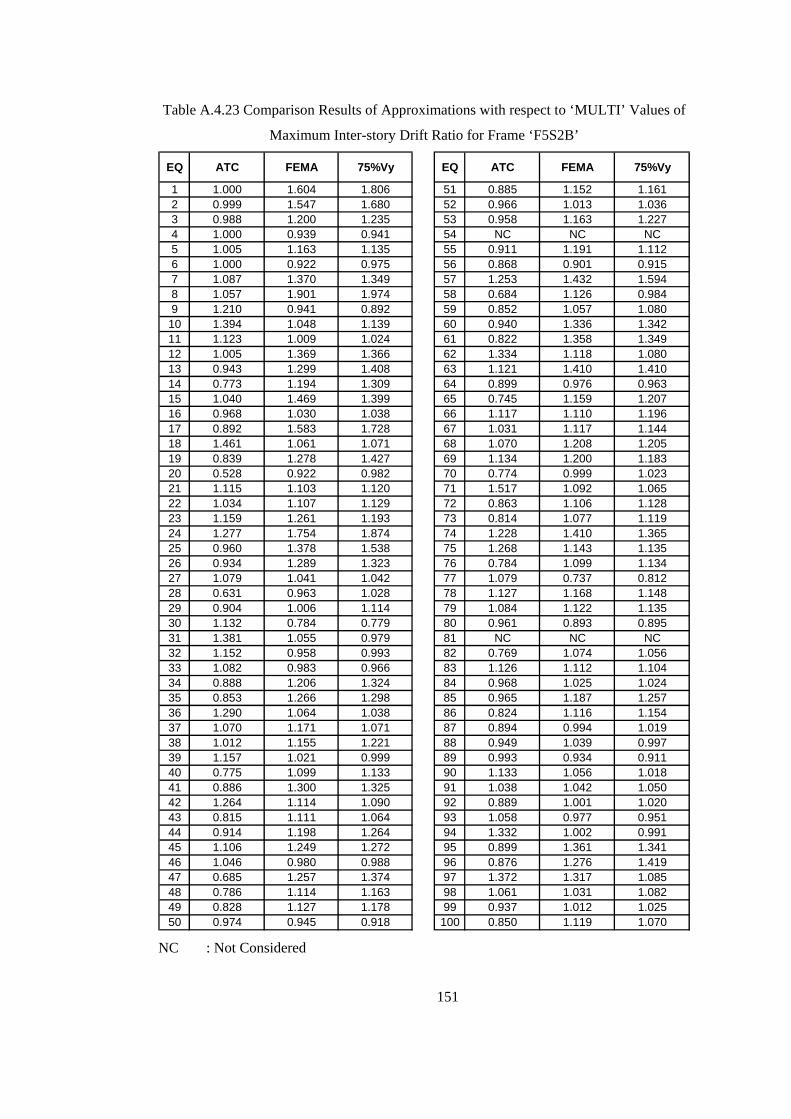
Table A.4.23 Comparison Results of Approximations with respect to ‘MULTI’ Values of
Maximum Inter-story Drift Ratio for Frame ‘F5S2B’
EQ ATC FEMA 75%Vy EQ ATC FEMA 75%Vy
1 1.000 1.604 1.806 51 0.885 1.152 1.1612 0.999 1.547 1.680 52 0.966 1.013 1.0363 0.988 1.200 1.235 53 0.958 1.163 1.2274 1.000 0.939 0.941 54 NC NC NC5 1.005 1.163 1.135 55 0.911 1.191 1.1126 1.000 0.922 0.975 56 0.868 0.901 0.9157 1.087 1.370 1.349 57 1.253 1.432 1.5948 1.057 1.901 1.974 58 0.684 1.126 0.9849 1.210 0.941 0.892 59 0.852 1.057 1.08010 1.394 1.048 1.139 60 0.940 1.336 1.34211 1.123 1.009 1.024 61 0.822 1.358 1.34912 1.005 1.369 1.366 62 1.334 1.118 1.08013 0.943 1.299 1.408 63 1.121 1.410 1.41014 0.773 1.194 1.309 64 0.899 0.976 0.96315 1.040 1.469 1.399 65 0.745 1.159 1.20716 0.968 1.030 1.038 66 1.117 1.110 1.19617 0.892 1.583 1.728 67 1.031 1.117 1.14418 1.461 1.061 1.071 68 1.070 1.208 1.20519 0.839 1.278 1.427 69 1.134 1.200 1.18320 0.528 0.922 0.982 70 0.774 0.999 1.02321 1.115 1.103 1.120 71 1.517 1.092 1.06522 1.034 1.107 1.129 72 0.863 1.106 1.12823 1.159 1.261 1.193 73 0.814 1.077 1.11924 1.277 1.754 1.874 74 1.228 1.410 1.36525 0.960 1.378 1.538 75 1.268 1.143 1.13526 0.934 1.289 1.323 76 0.784 1.099 1.13427 1.079 1.041 1.042 77 1.079 0.737 0.81228 0.631 0.963 1.028 78 1.127 1.168 1.14829 0.904 1.006 1.114 79 1.084 1.122 1.13530 1.132 0.784 0.779 80 0.961 0.893 0.89531 1.381 1.055 0.979 81 NC NC NC32 1.152 0.958 0.993 82 0.769 1.074 1.05633 1.082 0.983 0.966 83 1.126 1.112 1.10434 0.888 1.206 1.324 84 0.968 1.025 1.02435 0.853 1.266 1.298 85 0.965 1.187 1.25736 1.290 1.064 1.038 86 0.824 1.116 1.15437 1.070 1.171 1.071 87 0.894 0.994 1.01938 1.012 1.155 1.221 88 0.949 1.039 0.99739 1.157 1.021 0.999 89 0.993 0.934 0.91140 0.775 1.099 1.133 90 1.133 1.056 1.01841 0.886 1.300 1.325 91 1.038 1.042 1.05042 1.264 1.114 1.090 92 0.889 1.001 1.02043 0.815 1.111 1.064 93 1.058 0.977 0.95144 0.914 1.198 1.264 94 1.332 1.002 0.99145 1.106 1.249 1.272 95 0.899 1.361 1.34146 1.046 0.980 0.988 96 0.876 1.276 1.41947 0.685 1.257 1.374 97 1.372 1.317 1.08548 0.786 1.114 1.163 98 1.061 1.031 1.08249 0.828 1.127 1.178 99 0.937 1.012 1.02550 0.974 0.945 0.918 100 0.850 1.119 1.070
NC : Not Considered
151

Table A.4.24 Comparison Results of Approximations with respect to ‘MULTI’ Values of
Maximum Base Shear for Frame ‘F5S2B’
EQ ATC FEMA 75%Vy EQ ATC FEMA 75%Vy
1 1.000 1.602 1.804 51 0.986 1.015 1.0162 0.999 1.572 1.713 52 0.997 1.001 1.0033 0.990 1.159 1.186 53 0.964 1.139 1.1934 1.000 0.938 0.940 54 NC NC NC5 1.005 1.134 1.112 55 0.935 1.074 1.0526 1.000 0.928 0.977 56 0.987 0.990 0.9927 1.070 1.293 1.277 57 1.216 1.365 1.4808 1.047 1.728 1.786 58 0.963 1.011 0.9989 1.177 0.950 0.909 59 1.015 1.002 1.00210 1.317 1.039 1.112 60 0.958 1.102 1.10311 1.097 1.008 1.019 61 0.851 1.113 1.11112 1.004 1.306 1.304 62 1.027 1.011 1.00813 0.951 1.211 1.249 63 1.009 1.011 1.01114 0.837 1.048 1.062 64 0.988 0.998 0.99615 1.033 1.369 1.317 65 0.774 1.136 1.17216 0.973 1.025 1.032 66 1.007 1.007 1.01517 0.908 1.486 1.603 67 1.003 1.008 1.01018 1.367 1.049 1.057 68 1.006 1.016 1.01519 0.889 1.067 1.077 69 1.009 1.013 1.01220 0.814 0.992 0.998 70 0.978 1.000 1.00221 1.099 1.089 1.103 71 1.065 1.025 1.01922 1.022 1.059 1.069 72 0.945 1.019 1.02223 1.132 1.216 1.160 73 0.982 1.007 1.01124 1.216 1.571 1.659 74 1.018 1.032 1.02925 0.966 1.319 1.451 75 0.991 1.004 1.00426 0.982 1.031 1.034 76 0.936 1.012 1.01027 1.068 1.036 1.036 77 1.012 1.012 1.00228 0.719 0.987 1.008 78 1.009 1.011 1.01029 0.967 1.002 1.020 79 1.009 1.013 1.01430 1.106 0.819 0.815 80 0.997 0.992 0.99231 1.094 1.027 0.989 81 NC NC NC32 1.099 0.964 0.994 82 1.000 0.992 0.98833 1.069 0.986 0.971 83 1.002 1.007 1.00634 0.904 1.174 1.273 84 0.996 0.998 1.00035 0.871 1.188 1.202 85 1.009 0.985 0.97636 1.248 1.056 1.033 86 0.984 1.012 1.01537 1.007 1.016 1.007 87 0.989 0.999 1.00238 1.005 1.042 1.051 88 0.995 1.003 1.00039 1.126 1.017 0.999 89 0.999 0.994 0.99140 0.863 1.023 1.028 90 1.009 1.005 1.00241 0.992 1.029 1.031 91 1.007 1.007 1.00742 1.225 1.099 1.078 92 0.986 1.000 1.00243 0.982 1.012 1.007 93 0.996 1.003 1.00544 0.984 1.017 1.023 94 1.016 1.000 0.99945 1.015 1.023 1.025 95 0.993 0.980 0.98346 1.038 0.983 0.990 96 0.989 1.020 1.02347 0.721 1.203 1.258 97 1.035 1.031 1.00948 0.817 1.060 1.078 98 1.006 1.003 1.00849 0.938 1.018 1.023 99 0.994 1.001 1.00250 0.997 0.994 0.992 100 0.984 1.008 1.005
NC : Not Considered
152
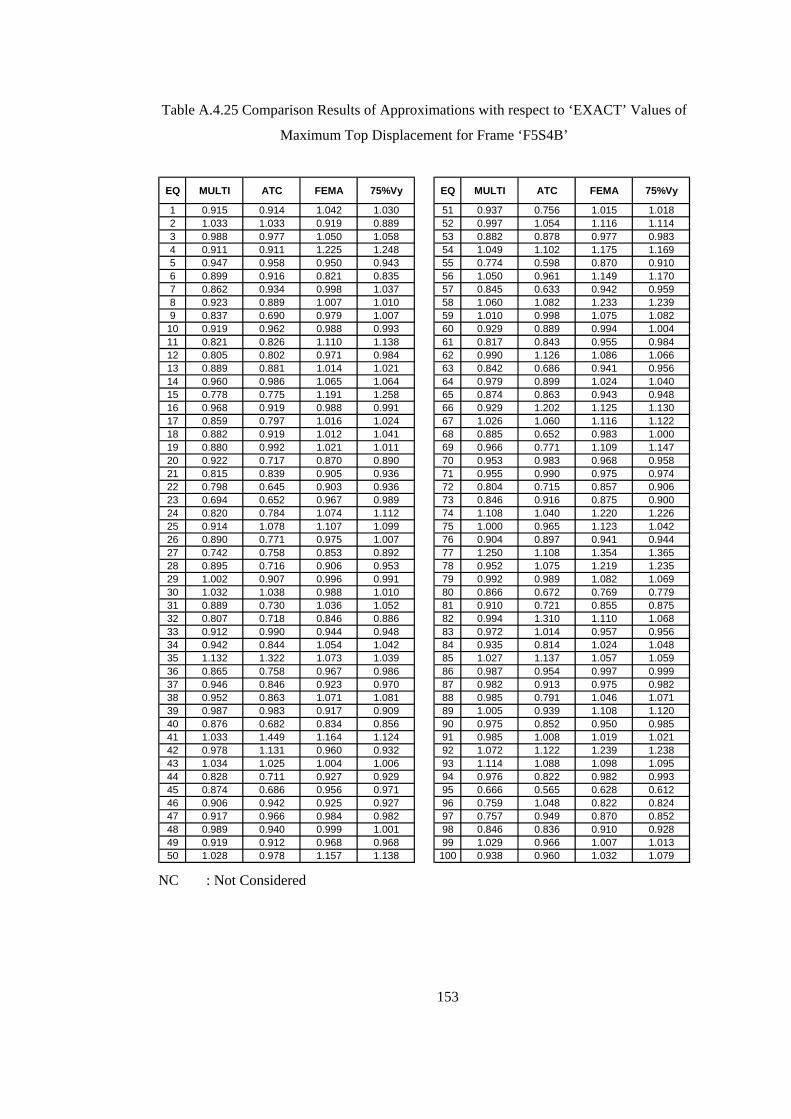
Table A.4.25 Comparison Results of Approximations with respect to ‘EXACT’ Values of
Maximum Top Displacement for Frame ‘F5S4B’
EQ MULTI ATC FEMA 75%Vy EQ MULTI ATC FEMA 75%Vy
1 0.915 0.914 1.042 1.030 51 0.937 0.756 1.015 1.0182 1.033 1.033 0.919 0.889 52 0.997 1.054 1.116 1.1143 0.988 0.977 1.050 1.058 53 0.882 0.878 0.977 0.9834 0.911 0.911 1.225 1.248 54 1.049 1.102 1.175 1.1695 0.947 0.958 0.950 0.943 55 0.774 0.598 0.870 0.9106 0.899 0.916 0.821 0.835 56 1.050 0.961 1.149 1.1707 0.862 0.934 0.998 1.037 57 0.845 0.633 0.942 0.9598 0.923 0.889 1.007 1.010 58 1.060 1.082 1.233 1.2399 0.837 0.690 0.979 1.007 59 1.010 0.998 1.075 1.082
10 0.919 0.962 0.988 0.993 60 0.929 0.889 0.994 1.00411 0.821 0.826 1.110 1.138 61 0.817 0.843 0.955 0.98412 0.805 0.802 0.971 0.984 62 0.990 1.126 1.086 1.06613 0.889 0.881 1.014 1.021 63 0.842 0.686 0.941 0.95614 0.960 0.986 1.065 1.064 64 0.979 0.899 1.024 1.04015 0.778 0.775 1.191 1.258 65 0.874 0.863 0.943 0.94816 0.968 0.919 0.988 0.991 66 0.929 1.202 1.125 1.13017 0.859 0.797 1.016 1.024 67 1.026 1.060 1.116 1.12218 0.882 0.919 1.012 1.041 68 0.885 0.652 0.983 1.00019 0.880 0.992 1.021 1.011 69 0.966 0.771 1.109 1.14720 0.922 0.717 0.870 0.890 70 0.953 0.983 0.968 0.95821 0.815 0.839 0.905 0.936 71 0.955 0.990 0.975 0.97422 0.798 0.645 0.903 0.936 72 0.804 0.715 0.857 0.90623 0.694 0.652 0.967 0.989 73 0.846 0.916 0.875 0.90024 0.820 0.784 1.074 1.112 74 1.108 1.040 1.220 1.22625 0.914 1.078 1.107 1.099 75 1.000 0.965 1.123 1.04226 0.890 0.771 0.975 1.007 76 0.904 0.897 0.941 0.94427 0.742 0.758 0.853 0.892 77 1.250 1.108 1.354 1.36528 0.895 0.716 0.906 0.953 78 0.952 1.075 1.219 1.23529 1.002 0.907 0.996 0.991 79 0.992 0.989 1.082 1.06930 1.032 1.038 0.988 1.010 80 0.866 0.672 0.769 0.77931 0.889 0.730 1.036 1.052 81 0.910 0.721 0.855 0.87532 0.807 0.718 0.846 0.886 82 0.994 1.310 1.110 1.06833 0.912 0.990 0.944 0.948 83 0.972 1.014 0.957 0.95634 0.942 0.844 1.054 1.042 84 0.935 0.814 1.024 1.04835 1.132 1.322 1.073 1.039 85 1.027 1.137 1.057 1.05936 0.865 0.758 0.967 0.986 86 0.987 0.954 0.997 0.99937 0.946 0.846 0.923 0.970 87 0.982 0.913 0.975 0.98238 0.952 0.863 1.071 1.081 88 0.985 0.791 1.046 1.07139 0.987 0.983 0.917 0.909 89 1.005 0.939 1.108 1.12040 0.876 0.682 0.834 0.856 90 0.975 0.852 0.950 0.98541 1.033 1.449 1.164 1.124 91 0.985 1.008 1.019 1.02142 0.978 1.131 0.960 0.932 92 1.072 1.122 1.239 1.23843 1.034 1.025 1.004 1.006 93 1.114 1.088 1.098 1.09544 0.828 0.711 0.927 0.929 94 0.976 0.822 0.982 0.99345 0.874 0.686 0.956 0.971 95 0.666 0.565 0.628 0.61246 0.906 0.942 0.925 0.927 96 0.759 1.048 0.822 0.82447 0.917 0.966 0.984 0.982 97 0.757 0.949 0.870 0.85248 0.989 0.940 0.999 1.001 98 0.846 0.836 0.910 0.92849 0.919 0.912 0.968 0.968 99 1.029 0.966 1.007 1.01350 1.028 0.978 1.157 1.138 100 0.938 0.960 1.032 1.079
NC : Not Considered
153

Table A.4.26 Comparison Results of Approximations with respect to ‘EXACT’ Values of
Maximum Inter-story Drift Ratio for Frame ‘F5S4B’
EQ MULTI ATC FEMA 75%Vy EQ MULTI ATC FEMA 75%Vy
1 0.918 0.918 1.046 1.033 51 0.916 0.724 0.997 1.0002 0.989 0.989 0.879 0.850 52 1.027 1.090 1.158 1.1563 1.009 0.997 1.075 1.084 53 0.909 0.904 1.008 1.0144 0.871 0.871 1.171 1.193 54 1.045 1.099 1.172 1.1665 0.955 0.967 0.959 0.951 55 0.765 0.589 0.869 0.9156 0.749 0.765 0.683 0.695 56 1.020 0.933 1.116 1.1367 0.872 0.947 1.014 1.055 57 0.841 0.628 0.950 0.9698 0.922 0.888 1.008 1.011 58 1.047 1.069 1.223 1.2299 0.879 0.723 1.030 1.060 59 0.956 0.945 1.012 1.019
10 0.952 0.998 1.026 1.031 60 0.973 0.931 1.043 1.05311 0.790 0.796 1.079 1.107 61 0.809 0.836 0.960 0.99212 0.792 0.790 0.958 0.970 62 0.983 1.138 1.092 1.06913 0.909 0.901 1.043 1.052 63 0.868 0.700 0.972 0.98714 0.964 0.995 1.087 1.086 64 1.019 0.923 1.071 1.09015 0.763 0.760 1.185 1.253 65 0.890 0.879 0.961 0.96616 0.931 0.884 0.951 0.954 66 0.937 1.240 1.155 1.16017 0.872 0.809 1.033 1.041 67 1.034 1.068 1.125 1.13118 0.889 0.927 1.024 1.054 68 0.873 0.617 0.976 0.99419 0.898 1.017 1.049 1.039 69 0.988 0.783 1.135 1.17320 0.891 0.678 0.838 0.858 70 0.925 0.954 0.939 0.92921 0.811 0.835 0.902 0.933 71 0.972 1.007 0.992 0.99122 0.769 0.618 0.884 0.921 72 0.797 0.697 0.856 0.90923 0.686 0.643 0.960 0.983 73 0.796 0.867 0.826 0.85024 0.780 0.745 1.029 1.066 74 1.122 1.049 1.241 1.24725 0.907 1.072 1.101 1.093 75 1.045 1.009 1.175 1.09026 0.882 0.760 0.976 1.013 76 0.929 0.920 0.971 0.97427 0.764 0.781 0.879 0.920 77 1.197 1.073 1.275 1.28328 0.904 0.701 0.916 0.969 78 0.904 1.025 1.163 1.17929 1.010 0.903 1.004 0.997 79 1.018 1.014 1.115 1.10130 0.555 0.559 0.532 0.544 80 0.912 0.710 0.813 0.82431 0.874 0.714 1.037 1.056 81 0.957 0.776 0.904 0.92332 0.799 0.711 0.838 0.878 82 1.027 1.328 1.140 1.10033 0.810 0.880 0.838 0.842 83 0.964 1.007 0.949 0.94834 0.939 0.841 1.053 1.041 84 0.967 0.825 1.072 1.09935 1.150 1.345 1.090 1.054 85 1.060 1.170 1.091 1.09436 0.888 0.777 0.994 1.013 86 0.987 0.953 0.997 1.00037 0.938 0.832 0.914 0.963 87 0.966 0.897 0.958 0.96638 0.960 0.857 1.096 1.107 88 0.979 0.785 1.037 1.06139 0.502 0.500 0.465 0.460 89 0.966 0.901 1.062 1.07340 0.870 0.660 0.821 0.847 90 1.009 0.873 0.981 1.01941 1.067 1.564 1.219 1.172 91 1.022 1.044 1.055 1.05642 0.976 1.131 0.958 0.929 92 1.072 1.126 1.248 1.24743 1.039 1.029 1.005 1.007 93 1.161 1.135 1.145 1.14244 0.850 0.721 0.957 0.959 94 1.007 0.855 1.013 1.02445 0.863 0.658 0.955 0.972 95 0.662 0.558 0.624 0.60746 0.830 0.864 0.848 0.849 96 0.741 1.052 0.810 0.81247 0.952 1.003 1.021 1.019 97 0.747 0.966 0.876 0.85648 0.933 0.885 0.943 0.945 98 0.852 0.841 0.919 0.93849 0.960 0.951 1.019 1.019 99 1.028 0.963 1.006 1.01150 0.977 0.924 1.108 1.088 100 0.904 0.925 0.995 1.040
NC : Not Considered
154

Table A.4.27 Comparison Results of Approximations with respect to ‘EXACT’ Values of
Maximum Base Shear for Frame ‘F5S4B’
EQ MULTI ATC FEMA 75%Vy EQ MULTI ATC FEMA 75%Vy
1 0.884 0.884 1.020 1.007 51 0.946 0.878 0.965 0.9662 0.924 0.924 0.816 0.787 52 0.998 1.015 1.031 1.0313 1.011 1.001 1.069 1.076 53 0.805 0.801 0.886 0.8924 0.806 0.806 1.078 1.098 54 1.011 1.019 1.030 1.0295 0.915 0.926 0.919 0.912 55 0.803 0.631 0.876 0.9026 0.791 0.806 0.724 0.736 56 0.951 0.938 0.964 0.9667 0.874 0.941 1.000 1.036 57 0.918 0.704 0.994 1.0058 0.936 0.904 1.015 1.018 58 0.967 0.972 0.995 0.9969 0.955 0.797 1.108 1.137 59 0.907 0.906 0.912 0.913
10 1.078 1.125 1.153 1.158 60 1.015 0.974 1.081 1.09011 0.767 0.771 1.014 1.038 61 0.801 0.824 0.903 0.91912 0.802 0.800 0.957 0.969 62 0.929 0.983 0.969 0.96213 0.943 0.934 1.056 1.062 63 1.005 0.957 1.024 1.02714 0.987 1.002 1.039 1.039 64 0.967 0.925 0.986 0.99215 0.771 0.768 1.140 1.199 65 0.741 0.733 0.797 0.80016 0.874 0.833 0.891 0.894 66 1.042 1.132 1.113 1.11517 0.928 0.865 1.087 1.095 67 1.053 1.059 1.067 1.06818 0.988 1.026 1.122 1.152 68 0.936 0.800 0.966 0.97019 0.949 1.055 1.077 1.070 69 0.905 0.865 0.924 0.92820 0.907 0.840 0.895 0.900 70 0.912 0.915 0.914 0.91221 0.764 0.785 0.843 0.870 71 1.098 1.135 1.119 1.11822 0.858 0.710 0.934 0.952 72 0.865 0.819 0.887 0.90423 0.704 0.664 0.960 0.981 73 0.870 0.886 0.876 0.88224 0.748 0.717 0.962 0.994 74 0.887 0.873 0.907 0.90825 0.903 1.055 1.081 1.075 75 1.111 1.105 1.131 1.11926 0.901 0.793 0.963 0.982 76 0.826 0.822 0.850 0.85127 0.754 0.769 0.859 0.896 77 0.966 0.954 0.971 0.97228 0.899 0.807 0.903 0.918 78 0.870 0.892 0.910 0.91229 1.036 0.991 1.034 1.031 79 1.310 1.308 1.342 1.33830 0.473 0.476 0.454 0.464 80 0.976 0.941 0.960 0.96231 0.931 0.777 1.034 1.043 81 1.003 0.979 0.997 1.00032 0.810 0.726 0.846 0.884 82 1.010 1.033 1.022 1.01933 0.791 0.853 0.816 0.820 83 1.024 1.032 1.021 1.02134 0.936 0.844 1.039 1.028 84 1.071 0.981 1.115 1.12535 1.165 1.347 1.108 1.074 85 0.983 0.996 0.987 0.98736 0.958 0.846 1.064 1.083 86 1.037 1.029 1.038 1.03937 0.969 0.938 0.963 0.974 87 0.938 0.927 0.937 0.93838 1.000 0.943 1.053 1.057 88 0.891 0.861 0.899 0.90139 0.457 0.455 0.427 0.423 89 0.829 0.820 0.840 0.84140 0.914 0.761 0.889 0.902 90 1.020 0.982 1.014 1.02241 1.052 1.269 1.146 1.119 91 0.991 0.994 0.995 0.99542 1.160 1.330 1.141 1.109 92 0.978 0.988 1.010 1.00943 1.045 1.040 1.027 1.028 93 0.994 0.991 0.992 0.99244 0.997 0.951 1.024 1.024 94 0.917 0.898 0.918 0.91845 0.924 0.785 0.961 0.966 95 0.862 0.832 0.853 0.84846 0.641 0.665 0.654 0.655 96 0.925 1.027 0.956 0.95747 0.827 0.868 0.883 0.881 97 0.746 0.827 0.800 0.79348 0.845 0.807 0.851 0.853 98 0.992 0.989 1.009 1.01249 1.083 1.078 1.114 1.115 99 0.967 0.955 0.963 0.96450 0.963 0.947 0.995 0.991 100 0.892 0.895 0.906 0.911
NC : Not Considered
155
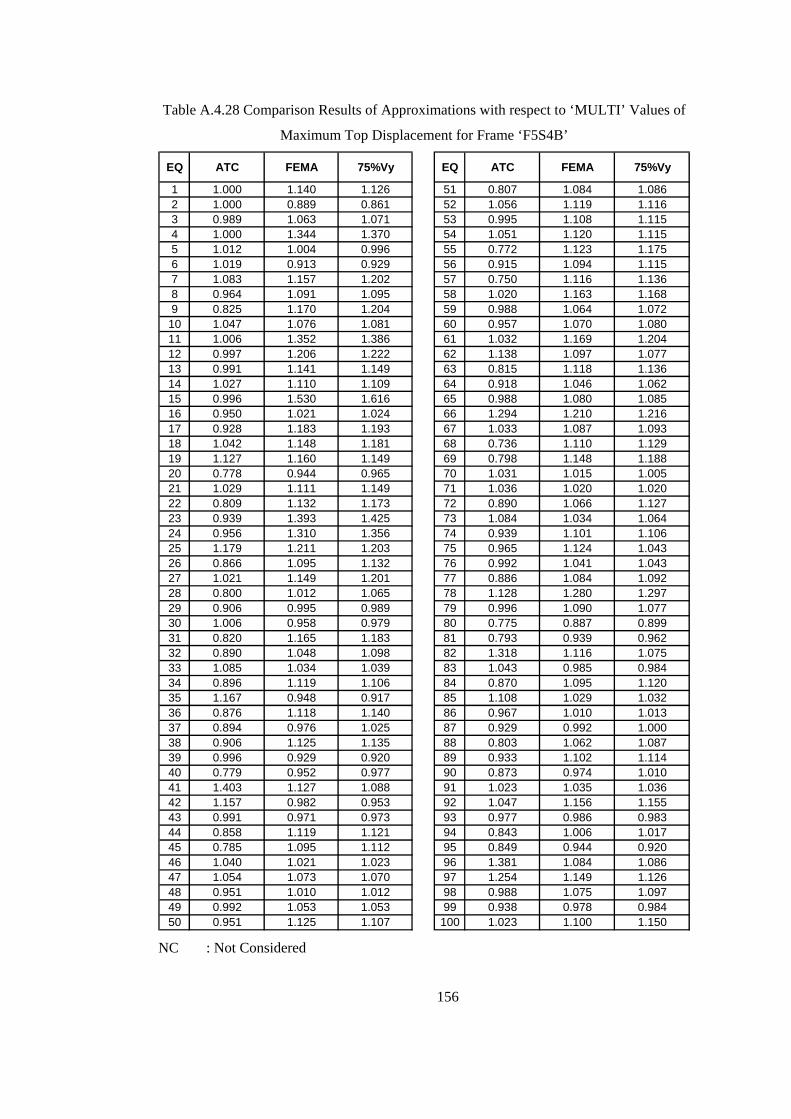
Table A.4.28 Comparison Results of Approximations with respect to ‘MULTI’ Values of
Maximum Top Displacement for Frame ‘F5S4B’
EQ ATC FEMA 75%Vy EQ ATC FEMA 75%Vy
1 1.000 1.140 1.126 51 0.807 1.084 1.0862 1.000 0.889 0.861 52 1.056 1.119 1.1163 0.989 1.063 1.071 53 0.995 1.108 1.1154 1.000 1.344 1.370 54 1.051 1.120 1.1155 1.012 1.004 0.996 55 0.772 1.123 1.1756 1.019 0.913 0.929 56 0.915 1.094 1.1157 1.083 1.157 1.202 57 0.750 1.116 1.1368 0.964 1.091 1.095 58 1.020 1.163 1.1689 0.825 1.170 1.204 59 0.988 1.064 1.07210 1.047 1.076 1.081 60 0.957 1.070 1.08011 1.006 1.352 1.386 61 1.032 1.169 1.20412 0.997 1.206 1.222 62 1.138 1.097 1.07713 0.991 1.141 1.149 63 0.815 1.118 1.13614 1.027 1.110 1.109 64 0.918 1.046 1.06215 0.996 1.530 1.616 65 0.988 1.080 1.08516 0.950 1.021 1.024 66 1.294 1.210 1.21617 0.928 1.183 1.193 67 1.033 1.087 1.09318 1.042 1.148 1.181 68 0.736 1.110 1.12919 1.127 1.160 1.149 69 0.798 1.148 1.18820 0.778 0.944 0.965 70 1.031 1.015 1.00521 1.029 1.111 1.149 71 1.036 1.020 1.02022 0.809 1.132 1.173 72 0.890 1.066 1.12723 0.939 1.393 1.425 73 1.084 1.034 1.06424 0.956 1.310 1.356 74 0.939 1.101 1.10625 1.179 1.211 1.203 75 0.965 1.124 1.04326 0.866 1.095 1.132 76 0.992 1.041 1.04327 1.021 1.149 1.201 77 0.886 1.084 1.09228 0.800 1.012 1.065 78 1.128 1.280 1.29729 0.906 0.995 0.989 79 0.996 1.090 1.07730 1.006 0.958 0.979 80 0.775 0.887 0.89931 0.820 1.165 1.183 81 0.793 0.939 0.96232 0.890 1.048 1.098 82 1.318 1.116 1.07533 1.085 1.034 1.039 83 1.043 0.985 0.98434 0.896 1.119 1.106 84 0.870 1.095 1.12035 1.167 0.948 0.917 85 1.108 1.029 1.03236 0.876 1.118 1.140 86 0.967 1.010 1.01337 0.894 0.976 1.025 87 0.929 0.992 1.00038 0.906 1.125 1.135 88 0.803 1.062 1.08739 0.996 0.929 0.920 89 0.933 1.102 1.11440 0.779 0.952 0.977 90 0.873 0.974 1.01041 1.403 1.127 1.088 91 1.023 1.035 1.03642 1.157 0.982 0.953 92 1.047 1.156 1.15543 0.991 0.971 0.973 93 0.977 0.986 0.98344 0.858 1.119 1.121 94 0.843 1.006 1.01745 0.785 1.095 1.112 95 0.849 0.944 0.92046 1.040 1.021 1.023 96 1.381 1.084 1.08647 1.054 1.073 1.070 97 1.254 1.149 1.12648 0.951 1.010 1.012 98 0.988 1.075 1.09749 0.992 1.053 1.053 99 0.938 0.978 0.98450 0.951 1.125 1.107 100 1.023 1.100 1.150
NC : Not Considered
156

Table A.4.29 Comparison Results of Approximations with respect to ‘MULTI’ Values of
Maximum Inter-story Drift Ratio for Frame ‘F5S4B’
EQ ATC FEMA 75%Vy EQ ATC FEMA 75%Vy
1 1.000 1.139 1.125 51 0.791 1.089 1.0922 1.000 0.889 0.860 52 1.061 1.127 1.1253 0.988 1.066 1.074 53 0.995 1.109 1.1164 1.000 1.344 1.370 54 1.051 1.121 1.1155 1.012 1.004 0.996 55 0.770 1.136 1.1966 1.020 0.911 0.927 56 0.915 1.095 1.1147 1.087 1.163 1.210 57 0.746 1.130 1.1538 0.963 1.093 1.096 58 1.021 1.168 1.1739 0.822 1.172 1.206 59 0.989 1.059 1.06610 1.048 1.078 1.083 60 0.957 1.072 1.08211 1.006 1.365 1.400 61 1.033 1.186 1.22712 0.997 1.208 1.225 62 1.157 1.111 1.08813 0.991 1.147 1.157 63 0.806 1.120 1.13814 1.032 1.127 1.126 64 0.906 1.051 1.07015 0.996 1.553 1.643 65 0.988 1.081 1.08616 0.949 1.021 1.025 66 1.324 1.233 1.23917 0.928 1.185 1.194 67 1.033 1.088 1.09418 1.044 1.153 1.186 68 0.707 1.119 1.13919 1.132 1.168 1.156 69 0.792 1.149 1.18720 0.761 0.941 0.963 70 1.031 1.015 1.00521 1.030 1.113 1.151 71 1.037 1.021 1.02022 0.804 1.150 1.198 72 0.875 1.074 1.14123 0.938 1.401 1.434 73 1.088 1.037 1.06824 0.955 1.318 1.366 74 0.935 1.106 1.11125 1.181 1.213 1.205 75 0.965 1.124 1.04326 0.862 1.106 1.148 76 0.991 1.046 1.04927 1.021 1.150 1.203 77 0.897 1.065 1.07228 0.776 1.013 1.072 78 1.133 1.286 1.30429 0.894 0.994 0.988 79 0.996 1.096 1.08230 1.006 0.958 0.979 80 0.779 0.892 0.90331 0.817 1.186 1.208 81 0.812 0.945 0.96532 0.889 1.048 1.099 82 1.293 1.111 1.07133 1.087 1.035 1.040 83 1.044 0.984 0.98334 0.895 1.121 1.108 84 0.853 1.108 1.13635 1.169 0.947 0.916 85 1.103 1.029 1.03236 0.875 1.119 1.141 86 0.966 1.011 1.01337 0.887 0.974 1.027 87 0.929 0.992 1.00038 0.893 1.142 1.154 88 0.802 1.060 1.08539 0.996 0.926 0.917 89 0.933 1.099 1.11140 0.759 0.944 0.974 90 0.865 0.973 1.01041 1.465 1.142 1.098 91 1.021 1.032 1.03342 1.159 0.982 0.952 92 1.050 1.164 1.16343 0.990 0.967 0.969 93 0.978 0.986 0.98444 0.848 1.126 1.128 94 0.849 1.005 1.01645 0.762 1.107 1.127 95 0.844 0.942 0.91746 1.041 1.022 1.024 96 1.421 1.094 1.09647 1.054 1.073 1.071 97 1.293 1.172 1.14648 0.949 1.011 1.013 98 0.987 1.079 1.10149 0.991 1.061 1.062 99 0.936 0.978 0.98350 0.946 1.134 1.114 100 1.023 1.101 1.150
NC : Not Considered
157

Table A.4.30 Comparison Results of Approximations with respect to ‘MULTI’ Values of
Maximum Base Shear for Frame ‘F5S4B’
EQ ATC FEMA 75%Vy EQ ATC FEMA 75%Vy
1 1.000 1.154 1.139 51 0.927 1.020 1.0202 1.000 0.882 0.852 52 1.017 1.033 1.0333 0.990 1.057 1.065 53 0.995 1.101 1.1084 1.000 1.337 1.362 54 1.008 1.018 1.0175 1.011 1.004 0.997 55 0.786 1.091 1.1236 1.019 0.915 0.931 56 0.986 1.013 1.0167 1.076 1.144 1.185 57 0.767 1.083 1.0948 0.966 1.085 1.088 58 1.005 1.029 1.0309 0.835 1.159 1.190 59 0.998 1.006 1.00610 1.043 1.070 1.075 60 0.959 1.064 1.07311 1.006 1.322 1.353 61 1.028 1.128 1.14812 0.997 1.192 1.207 62 1.058 1.043 1.03513 0.991 1.120 1.126 63 0.952 1.019 1.02214 1.015 1.053 1.052 64 0.956 1.019 1.02615 0.997 1.478 1.555 65 0.989 1.075 1.08016 0.953 1.019 1.023 66 1.086 1.069 1.07017 0.933 1.172 1.180 67 1.005 1.013 1.01418 1.039 1.137 1.167 68 0.854 1.032 1.03719 1.111 1.135 1.128 69 0.956 1.021 1.02620 0.926 0.987 0.993 70 1.004 1.002 1.00121 1.028 1.104 1.140 71 1.034 1.019 1.01822 0.827 1.088 1.109 72 0.946 1.025 1.04423 0.943 1.363 1.393 73 1.018 1.007 1.01424 0.959 1.286 1.328 74 0.985 1.023 1.02425 1.168 1.197 1.190 75 0.995 1.017 1.00726 0.880 1.068 1.090 76 0.994 1.029 1.03027 1.020 1.139 1.188 77 0.988 1.006 1.00628 0.898 1.004 1.022 78 1.025 1.046 1.04829 0.957 0.998 0.996 79 0.999 1.025 1.02130 1.006 0.959 0.980 80 0.965 0.984 0.98631 0.834 1.111 1.121 81 0.976 0.994 0.99732 0.896 1.045 1.092 82 1.023 1.012 1.00833 1.078 1.032 1.036 83 1.008 0.997 0.99734 0.902 1.110 1.098 84 0.917 1.041 1.05035 1.157 0.951 0.922 85 1.014 1.004 1.00536 0.883 1.111 1.131 86 0.993 1.002 1.00237 0.968 0.993 1.006 87 0.988 0.999 1.00038 0.943 1.053 1.057 88 0.966 1.008 1.01239 0.996 0.935 0.927 89 0.990 1.013 1.01540 0.833 0.972 0.987 90 0.964 0.994 1.00241 1.207 1.090 1.064 91 1.002 1.003 1.00442 1.146 0.983 0.956 92 1.010 1.032 1.03243 0.995 0.983 0.984 93 0.997 0.998 0.99844 0.953 1.027 1.027 94 0.979 1.000 1.00145 0.849 1.040 1.046 95 0.966 0.990 0.98446 1.037 1.020 1.021 96 1.110 1.034 1.03447 1.050 1.068 1.066 97 1.109 1.072 1.06348 0.956 1.008 1.010 98 0.997 1.017 1.02049 0.995 1.029 1.030 99 0.988 0.996 0.99750 0.983 1.033 1.029 100 1.003 1.015 1.021
NC : Not Considered
158

Table A.4.31 Comparison Results of Approximations with respect to ‘EXACT’ Values of
Maximum Top Displacement for Frame ‘F5S7B’
EQ MULTI ATC FEMA 75%Vy EQ MULTI ATC FEMA 75%Vy
1 0.977 0.977 0.938 1.138 51 0.925 0.603 0.948 1.0372 0.984 0.984 1.535 1.654 52 1.033 1.102 1.064 1.0613 0.976 0.940 1.199 1.250 53 0.884 0.863 0.995 1.0124 0.978 0.977 0.975 0.879 54 0.843 0.759 0.847 0.9115 0.821 0.892 0.987 1.005 55 0.994 0.910 1.076 1.0786 0.917 0.957 0.702 0.658 56 0.996 0.941 1.010 1.0267 0.700 0.731 0.941 1.038 57 0.865 1.119 1.060 0.9848 0.805 0.909 1.216 1.170 58 NC NC NC NC9 0.901 1.383 1.013 0.938 59 0.998 0.780 1.005 1.072
10 0.892 1.222 0.872 0.725 60 0.859 0.709 0.972 1.11911 0.850 0.936 0.906 0.870 61 0.896 0.817 1.056 1.06112 0.780 0.822 1.026 1.180 62 1.011 1.150 1.260 1.27013 0.930 0.869 1.107 1.228 63 0.848 0.394 0.997 1.08414 0.818 0.687 1.027 1.111 64 0.973 0.816 0.997 1.04015 0.890 1.010 0.937 0.978 65 0.966 0.809 0.953 1.06916 0.921 0.938 1.080 1.122 66 1.059 1.313 1.607 1.34117 0.831 0.894 1.170 1.291 67 1.023 1.090 1.321 1.29118 0.798 0.905 0.956 0.880 68 0.897 1.088 1.100 1.04619 0.738 0.558 0.928 1.070 69 1.045 1.090 1.292 1.35520 0.893 0.694 0.928 1.042 70 1.022 0.777 1.083 1.16921 0.863 0.748 1.086 1.042 71 1.002 0.993 1.092 1.02322 0.951 0.951 1.044 1.060 72 0.985 1.193 0.999 1.08523 0.839 0.937 1.158 1.167 73 NC NC NC NC24 0.742 0.839 1.029 1.037 74 0.940 0.810 0.897 0.99925 0.994 1.062 1.048 1.214 75 1.067 0.760 1.149 1.38726 0.890 0.808 1.035 1.116 76 0.785 0.769 0.909 1.05127 0.959 1.019 0.993 0.982 77 0.958 0.719 1.105 1.06928 0.935 0.884 0.932 1.028 78 0.954 0.988 1.013 1.03229 0.916 1.075 1.015 1.091 79 1.000 0.797 0.959 1.02030 0.784 0.879 1.084 0.966 80 NC NC NC NC31 0.937 0.675 1.240 1.188 81 NC NC NC NC32 0.848 1.029 1.018 1.066 82 NC NC NC NC33 0.944 0.965 0.961 0.945 83 0.961 1.056 1.107 1.03834 1.023 1.252 0.924 1.018 84 0.984 1.163 1.188 1.13135 0.794 0.618 1.065 1.198 85 0.858 0.840 0.970 1.04736 0.936 1.251 1.085 1.036 86 0.921 0.683 0.955 1.02137 0.876 1.122 0.985 1.090 87 NC NC NC NC38 0.966 0.719 1.249 1.350 88 1.041 1.032 1.177 1.13039 0.890 1.001 0.873 0.862 89 0.954 0.653 0.825 0.88140 0.900 0.872 1.012 1.130 90 1.020 0.982 1.157 1.14141 0.796 0.794 1.173 1.031 91 NC NC NC NC42 1.001 1.191 1.037 1.009 92 0.996 1.077 0.982 1.07943 1.014 0.805 1.189 1.184 93 1.057 0.781 1.071 1.16644 0.766 0.871 0.904 1.095 94 NC NC NC NC45 0.984 0.688 1.233 1.303 95 1.036 1.389 0.934 0.99046 0.915 1.079 0.900 0.878 96 0.902 1.720 1.319 1.16647 0.999 1.026 1.061 1.123 97 1.104 1.458 1.406 1.65848 0.812 0.856 0.976 1.057 98 0.919 0.811 0.905 1.04949 0.961 1.011 1.188 1.202 99 NC NC NC NC50 0.963 0.744 1.015 1.101 100 1.036 1.428 1.254 1.058
NC : Not Considered
159

Table A.4.32 Comparison Results of Approximations with respect to ‘EXACT’ Values of
Maximum Inter-story Drift Ratio for Frame ‘F5S7B’
EQ MULTI ATC FEMA 75%Vy EQ MULTI ATC FEMA 75%Vy
1 1.005 1.005 0.965 1.172 51 0.910 0.562 0.935 1.0362 1.009 1.009 1.571 1.690 52 1.056 1.129 1.088 1.0853 0.972 0.936 1.196 1.247 53 0.864 0.844 0.980 0.9984 1.016 1.015 1.012 0.913 54 0.812 0.721 0.815 0.8875 0.831 0.903 1.000 1.018 55 0.909 0.825 0.994 0.9976 0.904 0.944 0.692 0.648 56 0.977 0.924 0.990 1.0057 0.707 0.738 0.951 1.050 57 0.829 1.092 1.030 0.9518 0.803 0.907 1.215 1.169 58 NC NC NC NC9 0.926 1.469 1.051 0.967 59 0.845 0.660 0.851 0.906
10 0.932 1.307 0.910 0.757 60 0.845 0.689 0.969 1.13611 0.849 0.936 0.905 0.869 61 0.886 0.802 1.055 1.06112 0.764 0.805 1.006 1.165 62 1.012 1.152 1.265 1.27513 0.880 0.819 1.059 1.186 63 0.420 0.179 0.495 0.53714 0.783 0.648 0.999 1.092 64 0.990 0.808 1.017 1.06715 0.869 0.986 0.915 0.955 65 0.986 0.815 0.971 1.10016 0.944 0.962 1.108 1.152 66 1.091 1.374 1.686 1.40617 0.771 0.829 1.086 1.202 67 1.035 1.103 1.337 1.30818 0.818 0.928 0.980 0.902 68 0.939 1.168 1.184 1.11719 0.701 0.519 0.900 1.058 69 1.078 1.125 1.333 1.40620 0.857 0.654 0.894 1.021 70 0.987 0.747 1.045 1.12721 0.860 0.737 1.102 1.053 71 1.031 1.021 1.137 1.05722 0.937 0.937 1.043 1.061 72 1.018 1.262 1.034 1.13323 0.855 0.955 1.185 1.194 73 NC NC NC NC24 0.726 0.821 1.008 1.016 74 0.970 0.818 0.920 1.03325 0.960 1.030 1.015 1.191 75 0.498 0.353 0.535 0.65426 0.883 0.794 1.049 1.143 76 0.771 0.753 0.908 1.07327 1.010 1.082 1.051 1.038 77 0.724 0.532 0.840 0.81228 0.897 0.845 0.893 0.992 78 0.936 0.969 0.994 1.01329 0.906 1.086 1.020 1.104 79 0.975 0.773 0.935 0.99530 0.813 0.911 1.125 1.002 80 NC NC NC NC31 0.903 0.623 1.242 1.183 81 NC NC NC NC32 0.816 1.015 1.003 1.056 82 NC NC NC NC33 0.955 0.979 0.974 0.956 83 0.959 1.054 1.103 1.03634 1.012 1.260 0.913 1.008 84 0.992 1.200 1.229 1.16235 0.784 0.607 1.076 1.222 85 0.900 0.880 1.020 1.10136 0.930 1.284 1.092 1.038 86 0.749 0.533 0.781 0.84337 0.835 1.107 0.954 1.071 87 NC NC NC NC38 0.965 0.696 1.289 1.408 88 1.024 1.014 1.154 1.11039 0.849 0.955 0.832 0.822 89 0.735 0.491 0.635 0.67940 0.886 0.855 1.013 1.145 90 1.048 1.009 1.191 1.17541 0.809 0.806 1.256 1.086 91 NC NC NC NC42 1.027 1.250 1.069 1.036 92 0.996 1.090 0.980 1.09243 1.010 0.776 1.191 1.187 93 0.972 0.708 0.986 1.08144 0.723 0.837 0.873 1.083 94 NC NC NC NC45 0.951 0.633 1.230 1.308 95 0.998 1.347 0.901 0.95446 0.971 1.152 0.955 0.932 96 0.944 1.837 1.399 1.23447 0.976 1.005 1.042 1.108 97 1.127 1.494 1.440 1.70048 0.821 0.868 0.997 1.087 98 0.897 0.787 0.882 1.02549 0.990 1.048 1.258 1.274 99 NC NC NC NC50 0.955 0.711 1.011 1.099 100 0.935 1.300 1.130 0.955
NC : Not Considered
160

Table A.4.33 Comparison Results of Approximations with respect to ‘EXACT’ Values of
Maximum Base Shear for Frame ‘F5S7B’
EQ MULTI ATC FEMA 75%Vy EQ MULTI ATC FEMA 75%Vy
1 1.088 1.088 1.045 1.270 51 0.936 0.707 0.944 0.9702 1.116 1.116 1.735 1.864 52 1.071 1.073 1.072 1.0723 0.956 0.925 1.146 1.189 53 0.981 0.960 1.089 1.1054 1.000 0.999 0.997 0.909 54 0.862 0.806 0.863 0.8915 0.826 0.888 0.971 0.987 55 0.912 0.851 0.965 0.9676 0.802 0.833 0.634 0.599 56 1.009 1.008 1.010 1.0117 0.743 0.772 0.973 1.064 57 0.880 1.087 1.042 0.9818 0.792 0.884 1.155 1.115 58 NC NC NC NC9 0.985 1.407 1.089 1.019 59 0.898 0.891 0.899 0.903
10 1.050 1.382 1.028 0.868 60 0.922 0.787 1.015 1.12011 0.853 0.931 0.903 0.871 61 0.781 0.721 0.892 0.89512 0.781 0.819 1.005 1.139 62 1.023 1.028 1.033 1.03313 0.868 0.819 1.003 1.088 63 0.889 0.686 0.896 0.89814 0.783 0.674 0.941 0.996 64 0.988 0.920 0.994 1.00715 0.879 0.983 0.920 0.955 65 1.102 0.944 1.089 1.20316 0.927 0.943 1.073 1.112 66 1.027 1.052 1.061 1.05317 0.679 0.726 0.930 1.016 67 0.971 0.973 0.982 0.98118 0.868 0.976 1.026 0.951 68 0.986 1.047 1.049 1.03619 0.770 0.606 0.921 1.017 69 0.961 0.964 0.968 0.96320 0.845 0.687 0.870 0.944 70 0.938 0.927 0.938 0.94221 0.896 0.792 1.077 1.044 71 1.134 1.130 1.162 1.14122 0.957 0.957 1.022 1.033 72 1.000 1.127 1.010 1.07023 0.907 1.004 1.218 1.226 73 NC NC NC NC24 0.738 0.823 0.989 0.996 74 1.030 0.998 1.020 1.03625 0.929 0.986 0.974 1.105 75 0.973 0.960 0.976 0.97126 0.920 0.861 0.988 1.010 76 0.899 0.887 0.994 1.06127 1.120 1.171 1.150 1.141 77 0.954 0.947 0.969 0.96828 0.858 0.818 0.855 0.926 78 1.035 1.036 1.036 1.03829 0.950 1.063 1.022 1.074 79 1.049 1.036 1.046 1.05030 0.864 0.955 1.152 1.039 80 NC NC NC NC31 0.932 0.754 1.008 1.000 81 NC NC NC NC32 0.863 0.991 0.984 1.016 82 NC NC NC NC33 1.058 1.079 1.074 1.058 83 1.016 1.019 1.023 1.01734 0.965 1.149 0.880 0.961 84 0.886 0.933 0.938 0.92535 0.848 0.675 1.091 1.199 85 0.979 0.978 0.982 0.98536 0.967 1.199 1.084 1.047 86 0.950 0.838 0.958 0.97137 0.907 0.967 0.940 0.962 87 0.958 0.950 0.957 0.95338 0.997 0.795 1.153 1.180 88 0.943 0.942 0.948 0.94639 1.122 1.249 1.102 1.089 89 1.068 1.026 1.061 1.06440 0.929 0.906 1.009 1.088 90 0.966 0.964 0.972 0.97141 0.939 0.937 1.040 1.017 91 NC NC NC NC42 1.135 1.283 1.166 1.142 92 0.920 0.934 0.917 0.93443 0.979 0.926 0.991 0.991 93 0.923 0.920 0.923 0.92644 0.830 0.911 0.935 1.045 94 NC NC NC NC45 0.948 0.768 1.002 1.012 95 0.945 0.949 0.942 0.94546 1.243 1.444 1.226 1.198 96 0.947 0.973 0.971 0.96647 0.944 0.967 0.996 1.046 97 1.006 1.018 1.016 1.02348 0.806 0.843 0.940 1.001 98 0.944 0.933 0.944 0.94949 1.051 1.092 1.222 1.232 99 NC NC NC NC50 0.998 0.934 1.007 1.010 100 0.877 0.881 0.885 0.878
NC : Not Considered
161
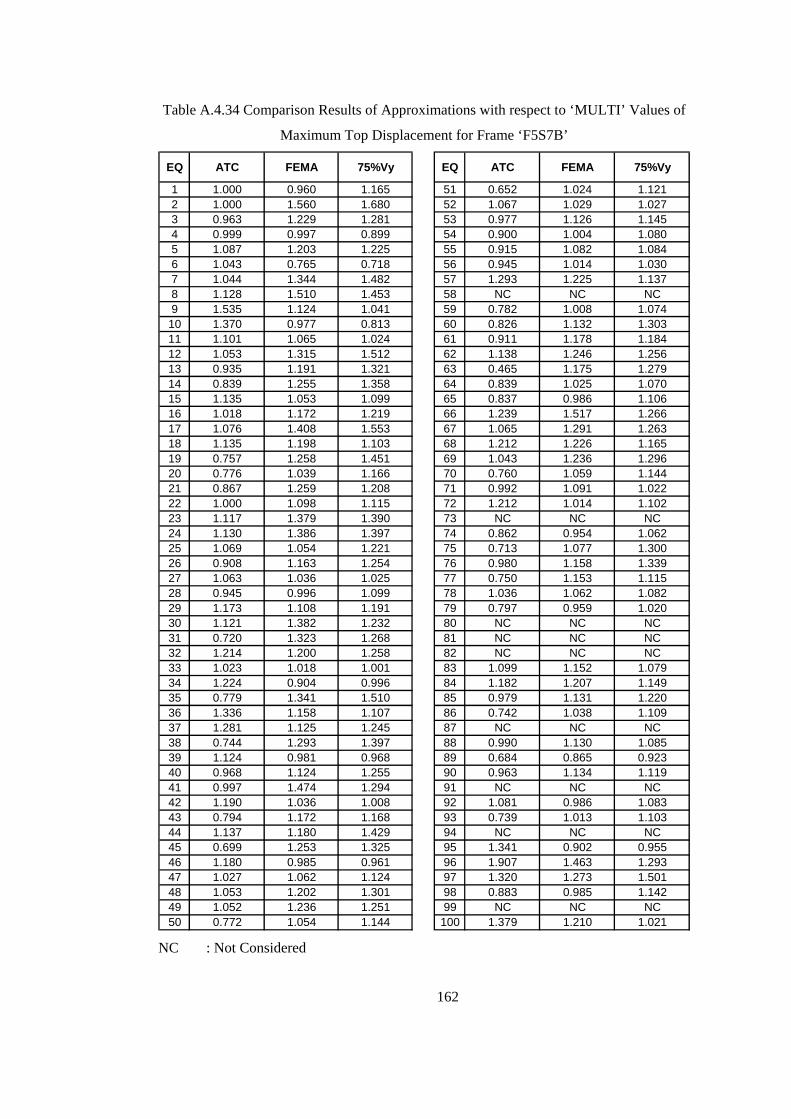
Table A.4.34 Comparison Results of Approximations with respect to ‘MULTI’ Values of
Maximum Top Displacement for Frame ‘F5S7B’
EQ ATC FEMA 75%Vy EQ ATC FEMA 75%Vy
1 1.000 0.960 1.165 51 0.652 1.024 1.1212 1.000 1.560 1.680 52 1.067 1.029 1.0273 0.963 1.229 1.281 53 0.977 1.126 1.1454 0.999 0.997 0.899 54 0.900 1.004 1.0805 1.087 1.203 1.225 55 0.915 1.082 1.0846 1.043 0.765 0.718 56 0.945 1.014 1.0307 1.044 1.344 1.482 57 1.293 1.225 1.1378 1.128 1.510 1.453 58 NC NC NC9 1.535 1.124 1.041 59 0.782 1.008 1.07410 1.370 0.977 0.813 60 0.826 1.132 1.30311 1.101 1.065 1.024 61 0.911 1.178 1.18412 1.053 1.315 1.512 62 1.138 1.246 1.25613 0.935 1.191 1.321 63 0.465 1.175 1.27914 0.839 1.255 1.358 64 0.839 1.025 1.07015 1.135 1.053 1.099 65 0.837 0.986 1.10616 1.018 1.172 1.219 66 1.239 1.517 1.26617 1.076 1.408 1.553 67 1.065 1.291 1.26318 1.135 1.198 1.103 68 1.212 1.226 1.16519 0.757 1.258 1.451 69 1.043 1.236 1.29620 0.776 1.039 1.166 70 0.760 1.059 1.14421 0.867 1.259 1.208 71 0.992 1.091 1.02222 1.000 1.098 1.115 72 1.212 1.014 1.10223 1.117 1.379 1.390 73 NC NC NC24 1.130 1.386 1.397 74 0.862 0.954 1.06225 1.069 1.054 1.221 75 0.713 1.077 1.30026 0.908 1.163 1.254 76 0.980 1.158 1.33927 1.063 1.036 1.025 77 0.750 1.153 1.11528 0.945 0.996 1.099 78 1.036 1.062 1.08229 1.173 1.108 1.191 79 0.797 0.959 1.02030 1.121 1.382 1.232 80 NC NC NC31 0.720 1.323 1.268 81 NC NC NC32 1.214 1.200 1.258 82 NC NC NC33 1.023 1.018 1.001 83 1.099 1.152 1.07934 1.224 0.904 0.996 84 1.182 1.207 1.14935 0.779 1.341 1.510 85 0.979 1.131 1.22036 1.336 1.158 1.107 86 0.742 1.038 1.10937 1.281 1.125 1.245 87 NC NC NC38 0.744 1.293 1.397 88 0.990 1.130 1.08539 1.124 0.981 0.968 89 0.684 0.865 0.92340 0.968 1.124 1.255 90 0.963 1.134 1.11941 0.997 1.474 1.294 91 NC NC NC42 1.190 1.036 1.008 92 1.081 0.986 1.08343 0.794 1.172 1.168 93 0.739 1.013 1.10344 1.137 1.180 1.429 94 NC NC NC45 0.699 1.253 1.325 95 1.341 0.902 0.95546 1.180 0.985 0.961 96 1.907 1.463 1.29347 1.027 1.062 1.124 97 1.320 1.273 1.50148 1.053 1.202 1.301 98 0.883 0.985 1.14249 1.052 1.236 1.251 99 NC NC NC50 0.772 1.054 1.144 100 1.379 1.210 1.021
NC : Not Considered
162

Table A.4.35 Comparison Results of Approximations with respect to ‘MULTI’ Values of
Maximum Inter-story Drift Ratio for Frame ‘F5S7B’
EQ ATC FEMA 75%Vy EQ ATC FEMA 75%Vy
1 1.000 0.960 1.166 51 0.618 1.028 1.1392 1.000 1.557 1.676 52 1.068 1.030 1.0273 0.963 1.230 1.282 53 0.977 1.135 1.1564 0.999 0.997 0.898 54 0.888 1.005 1.0935 1.087 1.204 1.226 55 0.908 1.094 1.0966 1.044 0.765 0.717 56 0.946 1.013 1.0297 1.044 1.346 1.484 57 1.317 1.242 1.1468 1.129 1.512 1.455 58 NC NC NC9 1.587 1.136 1.044 59 0.780 1.007 1.07210 1.403 0.977 0.812 60 0.816 1.147 1.34511 1.102 1.066 1.024 61 0.905 1.190 1.19712 1.053 1.316 1.525 62 1.138 1.249 1.25913 0.930 1.204 1.348 63 0.427 1.178 1.27914 0.828 1.276 1.396 64 0.817 1.027 1.07815 1.135 1.053 1.099 65 0.826 0.985 1.11616 1.018 1.173 1.220 66 1.260 1.546 1.28917 1.076 1.409 1.560 67 1.065 1.291 1.26318 1.135 1.198 1.104 68 1.244 1.261 1.19019 0.741 1.284 1.509 69 1.044 1.236 1.30420 0.763 1.044 1.192 70 0.757 1.059 1.14221 0.858 1.282 1.225 71 0.991 1.103 1.02522 1.000 1.113 1.133 72 1.240 1.016 1.11323 1.117 1.386 1.397 73 NC NC NC24 1.131 1.388 1.398 74 0.843 0.948 1.06625 1.074 1.058 1.241 75 0.710 1.074 1.31326 0.899 1.188 1.295 76 0.977 1.178 1.39327 1.071 1.040 1.028 77 0.734 1.159 1.12128 0.942 0.996 1.106 78 1.036 1.062 1.08229 1.198 1.125 1.218 79 0.793 0.959 1.02030 1.121 1.384 1.233 80 NC NC NC31 0.690 1.376 1.310 81 NC NC NC32 1.244 1.229 1.295 82 NC NC NC33 1.024 1.019 1.001 83 1.099 1.150 1.08034 1.244 0.902 0.995 84 1.209 1.238 1.17135 0.774 1.372 1.557 85 0.978 1.133 1.22336 1.381 1.174 1.116 86 0.712 1.043 1.12737 1.327 1.143 1.284 87 NC NC NC38 0.722 1.336 1.460 88 0.990 1.127 1.08439 1.125 0.981 0.968 89 0.668 0.864 0.92340 0.965 1.143 1.292 90 0.963 1.136 1.12141 0.996 1.552 1.342 91 NC NC NC42 1.218 1.041 1.009 92 1.095 0.983 1.09743 0.768 1.180 1.175 93 0.728 1.014 1.11144 1.157 1.207 1.498 94 NC NC NC45 0.666 1.294 1.376 95 1.350 0.902 0.95646 1.187 0.984 0.960 96 1.945 1.482 1.30747 1.029 1.067 1.134 97 1.326 1.278 1.50848 1.058 1.216 1.325 98 0.877 0.984 1.14349 1.058 1.270 1.287 99 NC NC NC50 0.744 1.058 1.151 100 1.391 1.210 1.022
NC : Not Considered
163
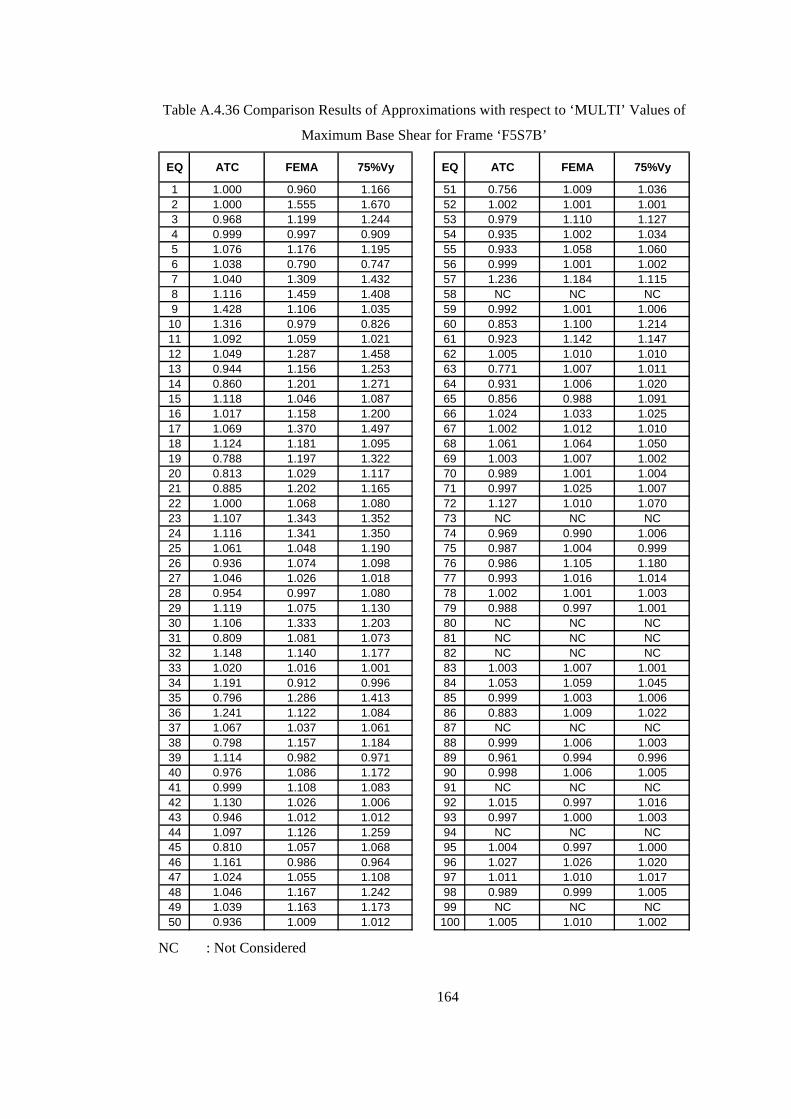
Table A.4.36 Comparison Results of Approximations with respect to ‘MULTI’ Values of
Maximum Base Shear for Frame ‘F5S7B’
EQ ATC FEMA 75%Vy EQ ATC FEMA 75%Vy
1 1.000 0.960 1.166 51 0.756 1.009 1.0362 1.000 1.555 1.670 52 1.002 1.001 1.0013 0.968 1.199 1.244 53 0.979 1.110 1.1274 0.999 0.997 0.909 54 0.935 1.002 1.0345 1.076 1.176 1.195 55 0.933 1.058 1.0606 1.038 0.790 0.747 56 0.999 1.001 1.0027 1.040 1.309 1.432 57 1.236 1.184 1.1158 1.116 1.459 1.408 58 NC NC NC9 1.428 1.106 1.035 59 0.992 1.001 1.00610 1.316 0.979 0.826 60 0.853 1.100 1.21411 1.092 1.059 1.021 61 0.923 1.142 1.14712 1.049 1.287 1.458 62 1.005 1.010 1.01013 0.944 1.156 1.253 63 0.771 1.007 1.01114 0.860 1.201 1.271 64 0.931 1.006 1.02015 1.118 1.046 1.087 65 0.856 0.988 1.09116 1.017 1.158 1.200 66 1.024 1.033 1.02517 1.069 1.370 1.497 67 1.002 1.012 1.01018 1.124 1.181 1.095 68 1.061 1.064 1.05019 0.788 1.197 1.322 69 1.003 1.007 1.00220 0.813 1.029 1.117 70 0.989 1.001 1.00421 0.885 1.202 1.165 71 0.997 1.025 1.00722 1.000 1.068 1.080 72 1.127 1.010 1.07023 1.107 1.343 1.352 73 NC NC NC24 1.116 1.341 1.350 74 0.969 0.990 1.00625 1.061 1.048 1.190 75 0.987 1.004 0.99926 0.936 1.074 1.098 76 0.986 1.105 1.18027 1.046 1.026 1.018 77 0.993 1.016 1.01428 0.954 0.997 1.080 78 1.002 1.001 1.00329 1.119 1.075 1.130 79 0.988 0.997 1.00130 1.106 1.333 1.203 80 NC NC NC31 0.809 1.081 1.073 81 NC NC NC32 1.148 1.140 1.177 82 NC NC NC33 1.020 1.016 1.001 83 1.003 1.007 1.00134 1.191 0.912 0.996 84 1.053 1.059 1.04535 0.796 1.286 1.413 85 0.999 1.003 1.00636 1.241 1.122 1.084 86 0.883 1.009 1.02237 1.067 1.037 1.061 87 NC NC NC38 0.798 1.157 1.184 88 0.999 1.006 1.00339 1.114 0.982 0.971 89 0.961 0.994 0.99640 0.976 1.086 1.172 90 0.998 1.006 1.00541 0.999 1.108 1.083 91 NC NC NC42 1.130 1.026 1.006 92 1.015 0.997 1.01643 0.946 1.012 1.012 93 0.997 1.000 1.00344 1.097 1.126 1.259 94 NC NC NC45 0.810 1.057 1.068 95 1.004 0.997 1.00046 1.161 0.986 0.964 96 1.027 1.026 1.02047 1.024 1.055 1.108 97 1.011 1.010 1.01748 1.046 1.167 1.242 98 0.989 0.999 1.00549 1.039 1.163 1.173 99 NC NC NC50 0.936 1.009 1.012 100 1.005 1.010 1.002
NC : Not Considered
164

Table A.4.37 Comparison Results of Approximations with respect to ‘EXACT’ Values of
Maximum Top Displacement for Frame ‘F8S3B’
EQ MULTI ATC FEMA 75%Vy EQ MULTI ATC FEMA 75%Vy
1 0.981 0.981 1.179 1.191 51 1.030 0.846 1.068 1.0852 0.996 0.996 1.332 1.352 52 0.817 0.607 0.841 0.8883 0.971 0.969 1.015 1.018 53 0.933 0.881 1.086 1.0934 0.992 0.992 1.034 1.027 54 1.022 0.865 0.934 0.9445 0.922 0.921 1.411 1.427 55 0.994 0.843 1.028 1.0716 0.781 0.788 1.100 1.150 56 0.875 0.769 1.002 1.0277 0.913 0.934 0.931 0.926 57 0.878 0.803 1.077 1.0908 0.808 0.947 1.005 0.973 58 0.986 0.713 0.977 1.0459 0.814 0.847 0.954 0.969 59 1.018 0.957 1.119 1.135
10 0.895 0.881 0.834 0.808 60 0.931 1.116 1.002 1.00111 0.962 0.904 1.100 1.117 61 0.980 1.084 0.992 0.97812 0.725 0.623 0.977 1.020 62 0.755 0.806 0.878 0.87513 0.985 1.329 0.976 0.948 63 0.916 1.212 1.069 1.04814 0.809 0.779 0.977 1.014 64 0.914 0.675 0.839 0.85715 0.734 0.940 1.239 1.294 65 0.986 0.926 1.129 1.13816 0.908 0.757 1.063 1.088 66 0.797 0.638 0.894 0.91617 0.816 0.773 1.021 1.028 67 0.926 0.977 1.066 1.05818 0.842 0.955 0.932 0.922 68 0.990 0.736 1.104 1.13319 0.813 0.874 0.806 0.841 69 0.961 0.963 1.016 1.03420 1.038 0.803 0.966 0.981 70 1.014 1.043 1.169 1.13921 0.827 0.973 0.929 0.920 71 0.782 0.912 0.919 0.94022 1.003 0.910 1.148 1.150 72 0.919 0.892 1.061 1.07523 0.913 0.892 1.127 1.136 73 0.958 0.776 1.033 1.05124 0.844 0.932 1.003 1.053 74 1.004 1.006 1.177 1.16225 0.877 0.743 0.964 0.980 75 1.198 1.247 1.636 1.55426 0.837 0.959 0.996 0.992 76 0.924 1.072 1.081 1.07227 0.892 0.869 1.001 1.010 77 NC NC NC NC28 0.976 0.889 1.073 1.080 78 0.892 0.838 1.026 1.05029 0.913 0.664 0.986 0.997 79 0.883 0.929 0.892 0.89730 0.971 0.971 0.821 0.822 80 0.969 1.137 1.037 1.04731 1.031 1.102 1.224 1.202 81 1.116 1.002 1.261 1.27932 0.935 0.715 1.065 1.045 82 NC NC NC NC33 0.969 0.956 0.921 0.946 83 0.872 0.915 0.888 0.88634 0.891 0.990 0.953 0.952 84 0.857 0.773 1.008 0.99435 0.812 0.583 0.983 1.009 85 1.056 1.122 1.194 1.16136 0.894 0.872 0.945 0.948 86 0.981 1.047 0.999 0.99637 0.816 0.705 0.918 0.944 87 1.030 0.975 1.015 1.01938 0.908 0.911 1.024 1.028 88 0.989 0.773 0.965 0.99439 0.972 1.050 1.084 1.072 89 1.181 0.967 1.195 1.21840 0.921 0.711 0.953 0.976 90 0.840 0.957 0.941 0.94341 0.935 0.795 1.050 1.040 91 0.888 0.990 0.871 0.86142 0.800 0.767 0.902 0.894 92 1.000 0.993 1.026 1.03243 0.906 0.709 0.911 0.929 93 1.023 1.215 1.047 1.06744 0.989 0.913 1.092 1.087 94 0.934 0.761 1.163 1.19945 0.988 0.874 1.075 1.106 95 1.205 1.381 1.236 1.20246 0.889 0.774 0.953 0.965 96 0.924 1.022 0.936 0.95947 0.849 0.709 0.992 1.011 97 0.635 0.794 0.744 0.74148 0.873 0.713 0.922 0.946 98 0.579 0.606 0.531 0.56049 0.938 0.823 0.928 0.938 99 0.999 1.010 0.992 0.99150 0.951 0.988 1.037 1.023 100 NC NC NC NC
NC : Not Considered
165
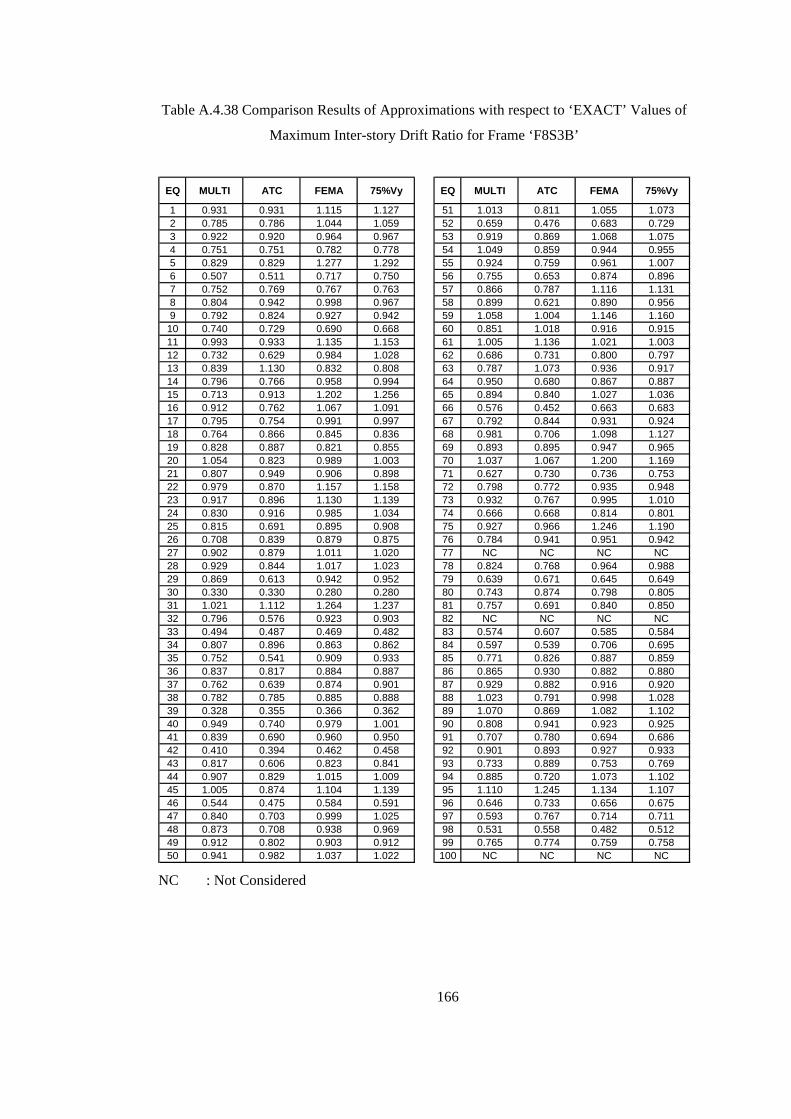
Table A.4.38 Comparison Results of Approximations with respect to ‘EXACT’ Values of
Maximum Inter-story Drift Ratio for Frame ‘F8S3B’
EQ MULTI ATC FEMA 75%Vy EQ MULTI ATC FEMA 75%Vy
1 0.931 0.931 1.115 1.127 51 1.013 0.811 1.055 1.0732 0.785 0.786 1.044 1.059 52 0.659 0.476 0.683 0.7293 0.922 0.920 0.964 0.967 53 0.919 0.869 1.068 1.0754 0.751 0.751 0.782 0.778 54 1.049 0.859 0.944 0.9555 0.829 0.829 1.277 1.292 55 0.924 0.759 0.961 1.0076 0.507 0.511 0.717 0.750 56 0.755 0.653 0.874 0.8967 0.752 0.769 0.767 0.763 57 0.866 0.787 1.116 1.1318 0.804 0.942 0.998 0.967 58 0.899 0.621 0.890 0.9569 0.792 0.824 0.927 0.942 59 1.058 1.004 1.146 1.160
10 0.740 0.729 0.690 0.668 60 0.851 1.018 0.916 0.91511 0.993 0.933 1.135 1.153 61 1.005 1.136 1.021 1.00312 0.732 0.629 0.984 1.028 62 0.686 0.731 0.800 0.79713 0.839 1.130 0.832 0.808 63 0.787 1.073 0.936 0.91714 0.796 0.766 0.958 0.994 64 0.950 0.680 0.867 0.88715 0.713 0.913 1.202 1.256 65 0.894 0.840 1.027 1.03616 0.912 0.762 1.067 1.091 66 0.576 0.452 0.663 0.68317 0.795 0.754 0.991 0.997 67 0.792 0.844 0.931 0.92418 0.764 0.866 0.845 0.836 68 0.981 0.706 1.098 1.12719 0.828 0.887 0.821 0.855 69 0.893 0.895 0.947 0.96520 1.054 0.823 0.989 1.003 70 1.037 1.067 1.200 1.16921 0.807 0.949 0.906 0.898 71 0.627 0.730 0.736 0.75322 0.979 0.870 1.157 1.158 72 0.798 0.772 0.935 0.94823 0.917 0.896 1.130 1.139 73 0.932 0.767 0.995 1.01024 0.830 0.916 0.985 1.034 74 0.666 0.668 0.814 0.80125 0.815 0.691 0.895 0.908 75 0.927 0.966 1.246 1.19026 0.708 0.839 0.879 0.875 76 0.784 0.941 0.951 0.94227 0.902 0.879 1.011 1.020 77 NC NC NC NC28 0.929 0.844 1.017 1.023 78 0.824 0.768 0.964 0.98829 0.869 0.613 0.942 0.952 79 0.639 0.671 0.645 0.64930 0.330 0.330 0.280 0.280 80 0.743 0.874 0.798 0.80531 1.021 1.112 1.264 1.237 81 0.757 0.691 0.840 0.85032 0.796 0.576 0.923 0.903 82 NC NC NC NC33 0.494 0.487 0.469 0.482 83 0.574 0.607 0.585 0.58434 0.807 0.896 0.863 0.862 84 0.597 0.539 0.706 0.69535 0.752 0.541 0.909 0.933 85 0.771 0.826 0.887 0.85936 0.837 0.817 0.884 0.887 86 0.865 0.930 0.882 0.88037 0.762 0.639 0.874 0.901 87 0.929 0.882 0.916 0.92038 0.782 0.785 0.885 0.888 88 1.023 0.791 0.998 1.02839 0.328 0.355 0.366 0.362 89 1.070 0.869 1.082 1.10240 0.949 0.740 0.979 1.001 90 0.808 0.941 0.923 0.92541 0.839 0.690 0.960 0.950 91 0.707 0.780 0.694 0.68642 0.410 0.394 0.462 0.458 92 0.901 0.893 0.927 0.93343 0.817 0.606 0.823 0.841 93 0.733 0.889 0.753 0.76944 0.907 0.829 1.015 1.009 94 0.885 0.720 1.073 1.10245 1.005 0.874 1.104 1.139 95 1.110 1.245 1.134 1.10746 0.544 0.475 0.584 0.591 96 0.646 0.733 0.656 0.67547 0.840 0.703 0.999 1.025 97 0.593 0.767 0.714 0.71148 0.873 0.708 0.938 0.969 98 0.531 0.558 0.482 0.51249 0.912 0.802 0.903 0.912 99 0.765 0.774 0.759 0.75850 0.941 0.982 1.037 1.022 100 NC NC NC NC
NC : Not Considered
166

Table A.4.39 Comparison Results of Approximations with respect to ‘EXACT’ Values of
Maximum Base Shear for Frame ‘F8S3B’
EQ MULTI ATC FEMA 75%Vy EQ MULTI ATC FEMA 75%Vy
1 0.976 0.976 1.178 1.191 51 0.782 0.746 0.789 0.7922 0.822 0.822 1.110 1.127 52 0.709 0.576 0.715 0.7273 1.124 1.123 1.169 1.172 53 0.759 0.720 0.873 0.8784 0.636 0.636 0.663 0.659 54 0.887 0.847 0.867 0.8695 0.896 0.896 1.327 1.341 55 0.931 0.890 0.938 0.9486 0.633 0.638 0.861 0.896 56 0.879 0.853 0.906 0.9107 0.897 0.915 0.913 0.909 57 0.836 0.786 0.894 0.8978 0.756 0.875 0.923 0.897 58 0.957 0.885 0.955 0.9699 0.786 0.816 0.911 0.925 59 0.899 0.895 0.906 0.907
10 1.083 1.067 1.016 0.988 60 0.975 1.154 1.044 1.04311 0.777 0.735 0.876 0.888 61 0.903 0.931 0.906 0.90212 0.701 0.609 0.925 0.964 62 0.736 0.780 0.830 0.82913 1.295 1.706 1.284 1.251 63 0.811 0.865 0.841 0.83714 0.724 0.698 0.860 0.886 64 0.834 0.778 0.819 0.82215 0.811 1.012 1.296 1.348 65 0.708 0.667 0.784 0.78816 0.694 0.587 0.803 0.820 66 0.792 0.681 0.820 0.82617 0.961 0.914 1.179 1.186 67 0.738 0.748 0.764 0.76218 0.754 0.844 0.825 0.817 68 0.802 0.749 0.820 0.82419 0.846 0.898 0.839 0.870 69 0.829 0.829 0.839 0.84220 0.888 0.852 0.880 0.882 70 0.832 0.837 0.856 0.85221 0.797 0.928 0.889 0.881 71 0.700 0.808 0.814 0.83122 0.826 0.785 0.861 0.861 72 0.945 0.938 0.977 0.97923 0.973 0.953 1.181 1.189 73 0.992 0.963 1.000 1.00224 0.764 0.835 0.892 0.933 74 0.897 0.897 0.947 0.94325 0.985 0.844 1.076 1.090 75 0.942 0.950 0.989 0.98326 0.887 0.927 0.937 0.936 76 0.923 0.988 0.991 0.98927 0.758 0.739 0.844 0.851 77 NC NC NC NC28 0.911 0.895 0.925 0.926 78 0.738 0.727 0.762 0.76629 0.941 0.875 0.955 0.957 79 0.997 1.039 1.005 1.01030 0.432 0.432 0.368 0.368 80 0.783 0.807 0.794 0.79531 0.845 0.867 0.895 0.890 81 0.827 0.821 0.834 0.83532 0.959 0.889 0.989 0.985 82 NC NC NC NC33 0.717 0.708 0.685 0.702 83 0.923 0.934 0.927 0.92634 0.908 1.001 0.966 0.966 84 0.787 0.715 0.890 0.88335 0.684 0.504 0.817 0.837 85 0.744 0.755 0.766 0.76136 0.838 0.819 0.883 0.885 86 1.067 1.083 1.071 1.07137 0.863 0.827 0.888 0.894 87 0.790 0.783 0.788 0.78938 0.886 0.889 0.971 0.973 88 0.819 0.778 0.815 0.82039 0.440 0.472 0.485 0.481 89 0.846 0.813 0.848 0.85140 0.874 0.837 0.878 0.880 90 0.742 0.767 0.764 0.76441 1.077 1.028 1.108 1.105 91 0.839 0.850 0.836 0.83442 0.466 0.449 0.520 0.515 92 0.784 0.782 0.789 0.78943 0.982 0.914 0.983 0.988 93 0.918 0.956 0.923 0.92744 0.881 0.864 0.901 0.900 94 0.735 0.708 0.753 0.75645 0.912 0.886 0.930 0.936 95 0.905 0.916 0.907 0.90546 0.710 0.627 0.756 0.765 96 0.820 0.854 0.826 0.83647 0.773 0.655 0.854 0.859 97 0.666 0.704 0.694 0.69348 0.713 0.609 0.727 0.733 98 0.680 0.687 0.666 0.67549 0.787 0.699 0.781 0.788 99 0.761 0.763 0.760 0.76050 0.955 0.964 0.975 0.972 100 NC NC NC NC
NC : Not Considered
167
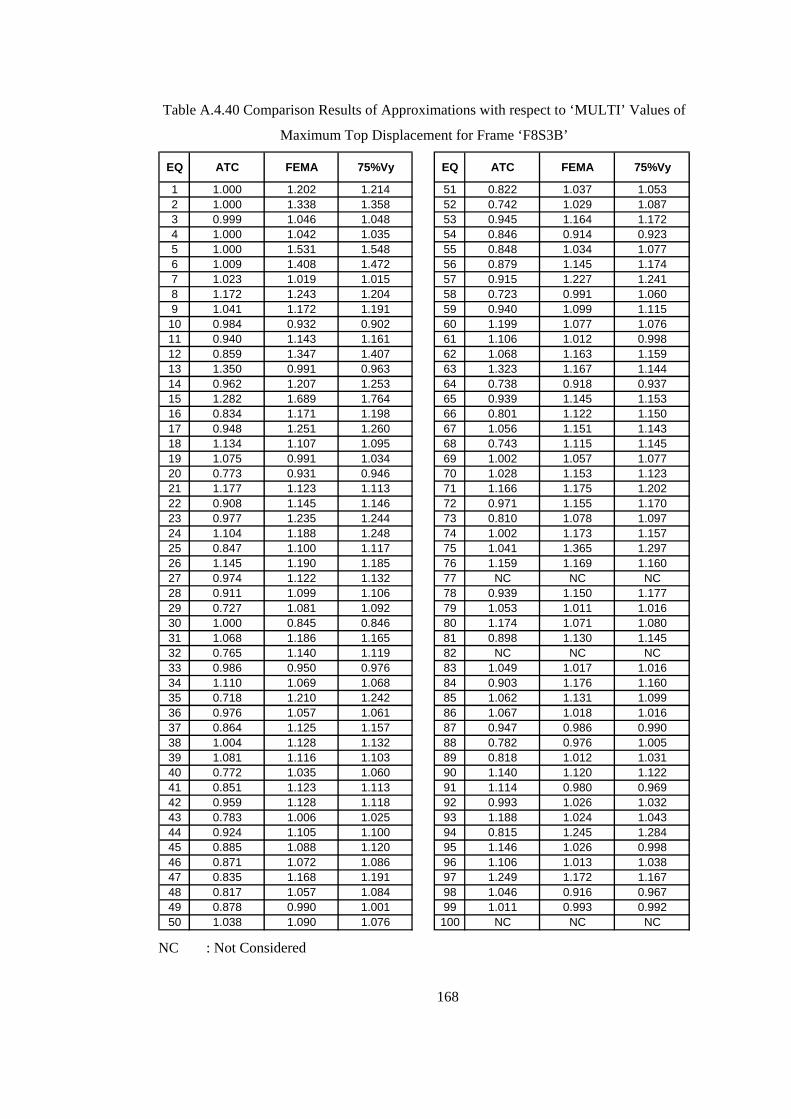
Table A.4.40 Comparison Results of Approximations with respect to ‘MULTI’ Values of
Maximum Top Displacement for Frame ‘F8S3B’
EQ ATC FEMA 75%Vy EQ ATC FEMA 75%Vy
1 1.000 1.202 1.214 51 0.822 1.037 1.0532 1.000 1.338 1.358 52 0.742 1.029 1.0873 0.999 1.046 1.048 53 0.945 1.164 1.1724 1.000 1.042 1.035 54 0.846 0.914 0.9235 1.000 1.531 1.548 55 0.848 1.034 1.0776 1.009 1.408 1.472 56 0.879 1.145 1.1747 1.023 1.019 1.015 57 0.915 1.227 1.2418 1.172 1.243 1.204 58 0.723 0.991 1.0609 1.041 1.172 1.191 59 0.940 1.099 1.11510 0.984 0.932 0.902 60 1.199 1.077 1.07611 0.940 1.143 1.161 61 1.106 1.012 0.99812 0.859 1.347 1.407 62 1.068 1.163 1.15913 1.350 0.991 0.963 63 1.323 1.167 1.14414 0.962 1.207 1.253 64 0.738 0.918 0.93715 1.282 1.689 1.764 65 0.939 1.145 1.15316 0.834 1.171 1.198 66 0.801 1.122 1.15017 0.948 1.251 1.260 67 1.056 1.151 1.14318 1.134 1.107 1.095 68 0.743 1.115 1.14519 1.075 0.991 1.034 69 1.002 1.057 1.07720 0.773 0.931 0.946 70 1.028 1.153 1.12321 1.177 1.123 1.113 71 1.166 1.175 1.20222 0.908 1.145 1.146 72 0.971 1.155 1.17023 0.977 1.235 1.244 73 0.810 1.078 1.09724 1.104 1.188 1.248 74 1.002 1.173 1.15725 0.847 1.100 1.117 75 1.041 1.365 1.29726 1.145 1.190 1.185 76 1.159 1.169 1.16027 0.974 1.122 1.132 77 NC NC NC28 0.911 1.099 1.106 78 0.939 1.150 1.17729 0.727 1.081 1.092 79 1.053 1.011 1.01630 1.000 0.845 0.846 80 1.174 1.071 1.08031 1.068 1.186 1.165 81 0.898 1.130 1.14532 0.765 1.140 1.119 82 NC NC NC33 0.986 0.950 0.976 83 1.049 1.017 1.01634 1.110 1.069 1.068 84 0.903 1.176 1.16035 0.718 1.210 1.242 85 1.062 1.131 1.09936 0.976 1.057 1.061 86 1.067 1.018 1.01637 0.864 1.125 1.157 87 0.947 0.986 0.99038 1.004 1.128 1.132 88 0.782 0.976 1.00539 1.081 1.116 1.103 89 0.818 1.012 1.03140 0.772 1.035 1.060 90 1.140 1.120 1.12241 0.851 1.123 1.113 91 1.114 0.980 0.96942 0.959 1.128 1.118 92 0.993 1.026 1.03243 0.783 1.006 1.025 93 1.188 1.024 1.04344 0.924 1.105 1.100 94 0.815 1.245 1.28445 0.885 1.088 1.120 95 1.146 1.026 0.99846 0.871 1.072 1.086 96 1.106 1.013 1.03847 0.835 1.168 1.191 97 1.249 1.172 1.16748 0.817 1.057 1.084 98 1.046 0.916 0.96749 0.878 0.990 1.001 99 1.011 0.993 0.99250 1.038 1.090 1.076 100 NC NC NC
NC : Not Considered
168

Table A.4.41 Comparison Results of Approximations with respect to ‘MULTI’ Values of
Maximum Inter-story Drift Ratio for Frame ‘F8S3B’
EQ ATC FEMA 75%Vy EQ ATC FEMA 75%Vy
1 1.000 1.198 1.210 51 0.801 1.042 1.0592 1.000 1.329 1.349 52 0.723 1.036 1.1073 0.999 1.046 1.049 53 0.945 1.162 1.1694 1.000 1.042 1.035 54 0.819 0.900 0.9105 1.000 1.540 1.558 55 0.821 1.039 1.0896 1.009 1.415 1.480 56 0.865 1.157 1.1877 1.023 1.019 1.015 57 0.909 1.289 1.3078 1.170 1.241 1.203 58 0.692 0.990 1.0649 1.041 1.171 1.190 59 0.949 1.083 1.09610 0.984 0.932 0.903 60 1.197 1.076 1.07611 0.940 1.143 1.161 61 1.130 1.015 0.99812 0.860 1.345 1.405 62 1.065 1.166 1.16113 1.347 0.991 0.963 63 1.364 1.190 1.16514 0.962 1.203 1.247 64 0.716 0.913 0.93315 1.282 1.687 1.762 65 0.939 1.149 1.15816 0.835 1.170 1.196 66 0.785 1.152 1.18617 0.948 1.246 1.254 67 1.065 1.176 1.16618 1.134 1.106 1.094 68 0.720 1.119 1.14919 1.071 0.991 1.032 69 1.002 1.061 1.08120 0.781 0.938 0.952 70 1.029 1.157 1.12721 1.176 1.122 1.112 71 1.165 1.174 1.20122 0.889 1.181 1.183 72 0.968 1.172 1.18923 0.977 1.233 1.243 73 0.823 1.068 1.08424 1.104 1.187 1.246 74 1.002 1.221 1.20225 0.848 1.099 1.115 75 1.042 1.345 1.28426 1.187 1.242 1.236 76 1.200 1.213 1.20127 0.974 1.121 1.131 77 NC NC NC28 0.908 1.095 1.101 78 0.931 1.169 1.19829 0.705 1.083 1.095 79 1.050 1.010 1.01530 1.000 0.847 0.849 80 1.176 1.073 1.08331 1.089 1.238 1.212 81 0.913 1.110 1.12332 0.723 1.159 1.135 82 NC NC NC33 0.986 0.950 0.976 83 1.058 1.021 1.01934 1.110 1.068 1.068 84 0.903 1.182 1.16435 0.719 1.209 1.241 85 1.071 1.149 1.11336 0.976 1.057 1.060 86 1.075 1.020 1.01837 0.838 1.147 1.183 87 0.949 0.986 0.99138 1.003 1.131 1.135 88 0.773 0.976 1.00539 1.081 1.116 1.104 89 0.813 1.011 1.03040 0.779 1.032 1.054 90 1.164 1.141 1.14441 0.823 1.144 1.132 91 1.102 0.981 0.97042 0.959 1.127 1.117 92 0.992 1.030 1.03643 0.742 1.007 1.030 93 1.214 1.027 1.04944 0.914 1.118 1.112 94 0.814 1.213 1.24545 0.870 1.099 1.133 95 1.122 1.022 0.99846 0.872 1.072 1.086 96 1.135 1.014 1.04547 0.836 1.189 1.220 97 1.295 1.204 1.19948 0.812 1.075 1.110 98 1.051 0.907 0.96449 0.880 0.991 1.001 99 1.013 0.992 0.99150 1.043 1.102 1.085 100 NC NC NC
NC : Not Considered
169

Table A.4.42 Comparison Results of Approximations with respect to ‘MULTI’ Values of
Maximum Base Shear for Frame ‘F8S3B’
EQ ATC FEMA 75%Vy EQ ATC FEMA 75%Vy
1 1.000 1.207 1.220 51 0.954 1.009 1.0122 1.000 1.350 1.371 52 0.813 1.009 1.0263 0.999 1.040 1.043 53 0.948 1.151 1.1584 1.000 1.042 1.035 54 0.955 0.978 0.9805 1.000 1.481 1.497 55 0.956 1.008 1.0186 1.008 1.361 1.416 56 0.970 1.030 1.0357 1.020 1.017 1.013 57 0.940 1.069 1.0728 1.156 1.220 1.186 58 0.925 0.998 1.0139 1.038 1.159 1.177 59 0.995 1.007 1.00810 0.986 0.939 0.912 60 1.183 1.071 1.07011 0.946 1.127 1.143 61 1.031 1.004 0.99912 0.869 1.320 1.375 62 1.059 1.128 1.12513 1.317 0.992 0.966 63 1.067 1.037 1.03314 0.964 1.187 1.223 64 0.933 0.982 0.98615 1.247 1.598 1.662 65 0.943 1.108 1.11316 0.846 1.158 1.182 66 0.860 1.036 1.04317 0.951 1.227 1.233 67 1.013 1.035 1.03318 1.120 1.095 1.085 68 0.934 1.022 1.02719 1.062 0.992 1.028 69 1.000 1.012 1.01620 0.959 0.991 0.993 70 1.006 1.029 1.02421 1.164 1.115 1.105 71 1.154 1.163 1.18722 0.951 1.042 1.043 72 0.993 1.034 1.03723 0.979 1.213 1.222 73 0.971 1.008 1.01024 1.094 1.169 1.222 74 1.001 1.056 1.05225 0.856 1.092 1.107 75 1.008 1.049 1.04326 1.046 1.057 1.056 76 1.071 1.074 1.07127 0.976 1.113 1.123 77 NC NC NC28 0.982 1.015 1.016 78 0.985 1.033 1.03829 0.930 1.016 1.018 79 1.043 1.009 1.01330 1.000 0.851 0.852 80 1.031 1.014 1.01631 1.025 1.058 1.053 81 0.992 1.009 1.01032 0.927 1.032 1.027 82 NC NC NC33 0.988 0.956 0.979 83 1.012 1.004 1.00434 1.102 1.063 1.063 84 0.909 1.131 1.12335 0.736 1.195 1.224 85 1.015 1.030 1.02336 0.977 1.054 1.057 86 1.015 1.004 1.00437 0.959 1.029 1.036 87 0.991 0.998 0.99838 1.003 1.096 1.099 88 0.951 0.996 1.00139 1.072 1.102 1.092 89 0.960 1.002 1.00540 0.958 1.004 1.007 90 1.033 1.028 1.02941 0.955 1.029 1.027 91 1.014 0.997 0.99542 0.963 1.116 1.106 92 0.998 1.006 1.00743 0.931 1.002 1.006 93 1.042 1.006 1.01044 0.981 1.024 1.023 94 0.963 1.025 1.02845 0.971 1.020 1.027 95 1.012 1.002 1.00046 0.883 1.065 1.078 96 1.043 1.008 1.02047 0.846 1.104 1.111 97 1.057 1.041 1.04048 0.855 1.020 1.029 98 1.010 0.980 0.99249 0.888 0.992 1.001 99 1.003 0.998 0.99850 1.009 1.021 1.017 100 NC NC NC
NC : Not Considered
170
A.5 COMPARISON OF APPROXIMATE RESULTS
(SCATTER GRAPHS)
171

0.00
0.15
0.30
0.45
0.60
0.00 0.15 0.30 0.45 0.60
Top Displacement (m) (EXACT)
Top
Dis
plac
emen
t (m
) (M
ULT
I) F2S2B
ρ = 0.924
0.00
0.15
0.30
0.45
0.60
0.00 0.15 0.30 0.45 0.60
Top Displacement (m) (EXACT)
Top
Dis
plac
emen
t (m
) (A
TC) F2S2B
ρ = 0.876
0.00
0.15
0.30
0.45
0.60
0.00 0.15 0.30 0.45 0.60
Top Displacement (m) (EXACT)
Top
Dis
plac
emen
t (m
) (FE
MA
) F2S2B
ρ = 0.895
0.00
0.15
0.30
0.45
0.60
0.00 0.15 0.30 0.45 0.60
Top Displacement (m) (EXACT)
Top
Dis
plac
emen
t (m
) (75
%Vy
) F2S2B
ρ = 0.919
0.00
0.15
0.30
0.45
0.60
0.00 0.15 0.30 0.45 0.60
Top Displacement (m) (MULTI)
Top
Dis
plac
emen
t (m
) (A
TC) F2S2B
ρ = 0.977
0.00
0.15
0.30
0.45
0.60
0.00 0.15 0.30 0.45 0.60
Top Displacement (m) (MULTI)
Top
Dis
plac
emen
t (m
) (FE
MA
) F2S2B
ρ = 0.985
0.00
0.15
0.30
0.45
0.60
0.00 0.15 0.30 0.45 0.60
Top Displacement (m) (MULTI)
Top
Dis
plac
emen
t (m
) (75
%Vy
) F2S2B
ρ = 0.975
Figure A.5.1 Comparison of Approximate Results with respect to ‘EXACT’ and ‘MULTI’
Values of Maximum Top Displacement for Frame ‘F2S2B’
172

0.00
0.05
0.10
0.15
0.20
0.00 0.05 0.10 0.15 0.20
Top Displacement (m) (EXACT)
Top
Dis
plac
emen
t (m
) (M
ULT
I) F2S2B2
ρ = 0.971
0.00
0.05
0.10
0.15
0.20
0.00 0.05 0.10 0.15 0.20
Top Displacement (m) (EXACT)
Top
Dis
plac
emen
t (m
) (A
TC) F2S2B2
ρ = 0.954
0.00
0.05
0.10
0.15
0.20
0.00 0.05 0.10 0.15 0.20
Top Displacement (m) (EXACT)
Top
Dis
plac
emen
t (m
) (FE
MA
) F2S2B2
ρ = 0.967
0.00
0.05
0.10
0.15
0.20
0.00 0.05 0.10 0.15 0.20
Top Displacement (m) (EXACT)
Top
Dis
plac
emen
t (m
) (75
%Vy
) F2S2B2
ρ = 0.971
0.00
0.05
0.10
0.15
0.20
0.00 0.05 0.10 0.15 0.20
Top Displacement (m) (MULTI)
Top
Dis
plac
emen
t (m
) (A
TC) F2S2B2
ρ = 0.992
0.00
0.05
0.10
0.15
0.20
0.00 0.05 0.10 0.15 0.20
Top Displacement (m) (MULTI)
Top
Dis
plac
emen
t (m
) (FE
MA
) F2S2B2
ρ = 0.994
0.00
0.05
0.10
0.15
0.20
0.00 0.05 0.10 0.15 0.20
Top Displacement (m) (MULTI)
Top
Dis
plac
emen
t (m
) (75
%Vy
) F2S2B2
ρ = 0.994
Figure A.5.2 Comparison of Approximate Results with respect to ‘EXACT’ and ‘MULTI’
Values of Maximum Top Displacement for Frame ‘F2S2B2’
173

0.00
0.10
0.20
0.30
0.40
0.00 0.10 0.20 0.30 0.40
Top Displacement (m) (EXACT)
Top
Dis
plac
emen
t (m
) (M
ULT
I) F3S2B
ρ = 0.978
0.00
0.10
0.20
0.30
0.40
0.00 0.10 0.20 0.30 0.40
Top Displacement (m) (EXACT)
Top
Dis
plac
emen
t (m
) (A
TC) F3S2B
ρ = 0.961
0.00
0.10
0.20
0.30
0.40
0.00 0.10 0.20 0.30 0.40
Top Displacement (m) (EXACT)
Top
Dis
plac
emen
t (m
) (FE
MA
) F3S2B
ρ = 0.961
0.00
0.10
0.20
0.30
0.40
0.00 0.10 0.20 0.30 0.40
Top Displacement (m) (EXACT)
Top
Dis
plac
emen
t (m
) (75
%Vy
) F3S2B
ρ = 0.961
0.00
0.10
0.20
0.30
0.40
0.00 0.10 0.20 0.30 0.40
Top Displacement (m) (MULTI)
Top
Dis
plac
emen
t (m
) (A
TC) F3S2B
ρ = 0.991
0.00
0.10
0.20
0.30
0.40
0.00 0.10 0.20 0.30 0.40
Top Displacement (m) (MULTI)
Top
Dis
plac
emen
t (m
) (FE
MA
) F3S2B
ρ = 0.992
0.00
0.10
0.20
0.30
0.40
0.00 0.10 0.20 0.30 0.40
Top Displacement (m) (MULTI)
Top
Dis
plac
emen
t (m
) (75
%Vy
) F3S2B
ρ = 0.991
Figure A.5.3 Comparison of Approximate Results with respect to ‘EXACT’ and ‘MULTI’
Values of Maximum Top Displacement for Frame ‘F3S2B’
174
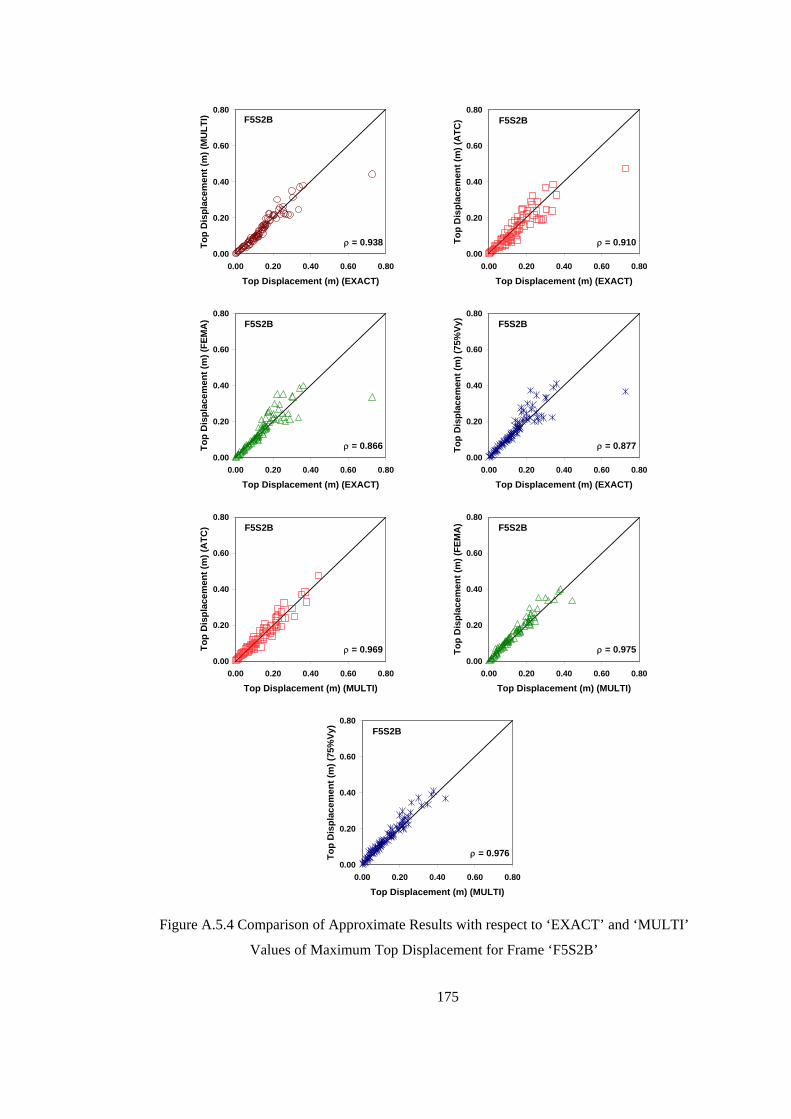
0.00
0.20
0.40
0.60
0.80
0.00 0.20 0.40 0.60 0.80
Top Displacement (m) (EXACT)
Top
Dis
plac
emen
t (m
) (M
ULT
I) F5S2B
ρ = 0.938
0.00
0.20
0.40
0.60
0.80
0.00 0.20 0.40 0.60 0.80
Top Displacement (m) (EXACT)
Top
Dis
plac
emen
t (m
) (A
TC) F5S2B
ρ = 0.910
0.00
0.20
0.40
0.60
0.80
0.00 0.20 0.40 0.60 0.80
Top Displacement (m) (EXACT)
Top
Dis
plac
emen
t (m
) (FE
MA
) F5S2B
ρ = 0.866
0.00
0.20
0.40
0.60
0.80
0.00 0.20 0.40 0.60 0.80
Top Displacement (m) (EXACT)
Top
Dis
plac
emen
t (m
) (75
%Vy
) F5S2B
ρ = 0.877
0.00
0.20
0.40
0.60
0.80
0.00 0.20 0.40 0.60 0.80
Top Displacement (m) (MULTI)
Top
Dis
plac
emen
t (m
) (A
TC) F5S2B
ρ = 0.969
0.00
0.20
0.40
0.60
0.80
0.00 0.20 0.40 0.60 0.80
Top Displacement (m) (MULTI)
Top
Dis
plac
emen
t (m
) (FE
MA
) F5S2B
ρ = 0.975
0.00
0.20
0.40
0.60
0.80
0.00 0.20 0.40 0.60 0.80
Top Displacement (m) (MULTI)
Top
Dis
plac
emen
t (m
) (75
%Vy
) F5S2B
ρ = 0.976
Figure A.5.4 Comparison of Approximate Results with respect to ‘EXACT’ and ‘MULTI’
Values of Maximum Top Displacement for Frame ‘F5S2B’
175

0.00
0.20
0.40
0.60
0.80
0.00 0.20 0.40 0.60 0.80
Top Displacement (m) (EXACT)
Top
Dis
plac
emen
t (m
) (M
ULT
I) F5S4B
ρ = 0.979
0.00
0.20
0.40
0.60
0.80
0.00 0.20 0.40 0.60 0.80
Top Displacement (m) (EXACT)
Top
Dis
plac
emen
t (m
) (A
TC) F5S4B
ρ = 0.942
0.00
0.20
0.40
0.60
0.80
0.00 0.20 0.40 0.60 0.80
Top Displacement (m) (EXACT)
Top
Dis
plac
emen
t (m
) (FE
MA
) F5S4B
ρ = 0.964
0.00
0.20
0.40
0.60
0.80
0.00 0.20 0.40 0.60 0.80
Top Displacement (m) (EXACT)
Top
Dis
plac
emen
t (m
) (75
%Vy
) F5S4B
ρ = 0.965
0.00
0.20
0.40
0.60
0.80
0.00 0.20 0.40 0.60 0.80
Top Displacement (m) (MULTI)
Top
Dis
plac
emen
t (m
) (A
TC) F5S4B
ρ = 0.971
0.00
0.20
0.40
0.60
0.80
0.00 0.20 0.40 0.60 0.80
Top Displacement (m) (MULTI)
Top
Dis
plac
emen
t (m
) (FE
MA
) F5S4B
ρ = 0.993
0.00
0.20
0.40
0.60
0.80
0.00 0.20 0.40 0.60 0.80
Top Displacement (m) (MULTI)
Top
Dis
plac
emen
t (m
) (75
%Vy
) F5S4B
ρ = 0.993
Figure A.5.5 Comparison of Approximate Results with respect to ‘EXACT’ and ‘MULTI’
Values of Maximum Top Displacement for Frame ‘F5S4B’
176

0.00
0.10
0.20
0.30
0.40
0.50
0.00 0.10 0.20 0.30 0.40 0.50
Top Displacement (m) (EXACT)
Top
Dis
plac
emen
t (m
) (M
ULT
I) F5S7B
ρ = 0.992
0.00
0.10
0.20
0.30
0.40
0.50
0.00 0.10 0.20 0.30 0.40 0.50
Top Displacement (m) (EXACT)
Top
Dis
plac
emen
t (m
) (A
TC) F5S7B
ρ = 0.890
0.00
0.10
0.20
0.30
0.40
0.50
0.00 0.10 0.20 0.30 0.40 0.50
Top Displacement (m) (EXACT)
Top
Dis
plac
emen
t (m
) (FE
MA
) F5S7B
ρ = 0.975
0.00
0.10
0.20
0.30
0.40
0.50
0.00 0.10 0.20 0.30 0.40 0.50
Top Displacement (m) (EXACT)
Top
Dis
plac
emen
t (m
) (75
%Vy
) F5S7B
ρ = 0.980
0.00
0.10
0.20
0.30
0.40
0.50
0.00 0.10 0.20 0.30 0.40 0.50
Top Displacement (m) (MULTI)
Top
Dis
plac
emen
t (m
) (A
TC) F5S7B
ρ = 0.905
0.00
0.10
0.20
0.30
0.40
0.50
0.00 0.10 0.20 0.30 0.40 0.50
Top Displacement (m) (MULTI)
Top
Dis
plac
emen
t (m
) (FE
MA
) F5S7B
ρ = 0.980
0.00
0.10
0.20
0.30
0.40
0.50
0.00 0.10 0.20 0.30 0.40 0.50
Top Displacement (m) (MULTI)
Top
Dis
plac
emen
t (m
) (75
%Vy
) F5S7B
ρ = 0.984
Figure A.5.6 Comparison of Approximate Results with respect to ‘EXACT’ and ‘MULTI’
Values of Maximum Top Displacement for Frame ‘F5S7B’
177

0.00
0.25
0.50
0.75
1.00
0.00 0.25 0.50 0.75 1.00
Top Displacement (m) (EXACT)
Top
Dis
plac
emen
t (m
) (M
ULT
I) F8S3B
ρ = 0.972
0.00
0.25
0.50
0.75
1.00
0.00 0.25 0.50 0.75 1.00
Top Displacement (m) (EXACT)
Top
Dis
plac
emen
t (m
) (A
TC) F8S3B
ρ = 0.939
0.00
0.25
0.50
0.75
1.00
0.00 0.25 0.50 0.75 1.00
Top Displacement (m) (EXACT)
Top
Dis
plac
emen
t (m
) (FE
MA
) F8S3B
ρ = 0.957
0.00
0.25
0.50
0.75
1.00
0.00 0.25 0.50 0.75 1.00
Top Displacement (m) (EXACT)
Top
Dis
plac
emen
t (m
) (75
%Vy
) F8S3B
ρ = 0.961
0.00
0.25
0.50
0.75
1.00
0.00 0.25 0.50 0.75 1.00
Top Displacement (m) (MULTI)
Top
Dis
plac
emen
t (m
) (A
TC) F8S3B
ρ = 0.965
0.00
0.25
0.50
0.75
1.00
0.00 0.25 0.50 0.75 1.00
Top Displacement (m) (MULTI)
Top
Dis
plac
emen
t (m
) (FE
MA
) F8S3B
ρ = 0.989
0.00
0.25
0.50
0.75
1.00
0.00 0.25 0.50 0.75 1.00
Top Displacement (m) (MULTI)
Top
Dis
plac
emen
t (m
) (75
%Vy
) F8S3B
ρ = 0.990
Figure A.5.7 Comparison of Approximate Results with respect to ‘EXACT’ and ‘MULTI’
Values of Maximum Top Displacement for Frame ‘F8S3B’
178

0
2
4
6
8
10
0 2 4 6 8 10
MIDR (%) (EXACT)
MID
R (%
) (M
ULT
I)
F2S2B
ρ = 0.861
0
2
4
6
8
10
0 2 4 6 8 10
MIDR (%) (EXACT)
MID
R (%
) (A
TC)
F2S2B
ρ = 0.811
0
2
4
6
8
10
0 2 4 6 8 10
MIDR (%) (EXACT)
MID
R (%
) (FE
MA
)
F2S2B
ρ = 0.830
0
2
4
6
8
10
0 2 4 6 8 10
MIDR (%) (EXACT)
MID
R (%
) (75
%Vy
)
F2S2B
ρ = 0.863
0
2
4
6
8
10
0 2 4 6 8 10
MIDR (%) (MULTI)
MID
R (%
) (A
TC)
F2S2B
ρ = 0.979
0
2
4
6
8
10
0 2 4 6 8 10
MIDR (%) (MULTI)
MID
R (%
) (FE
MA
)
F2S2B
ρ = 0.986
0
2
4
6
8
10
0 2 4 6 8 10
MIDR (%) (MULTI)
MID
R (%
) (75
%Vy
)
F2S2B
ρ = 0.976
Figure A.5.8 Comparison of Approximate Results with respect to ‘EXACT’ and ‘MULTI’
Values of Maximum Inter-Story Drift Ratio for Frame ‘F2S2B’
179
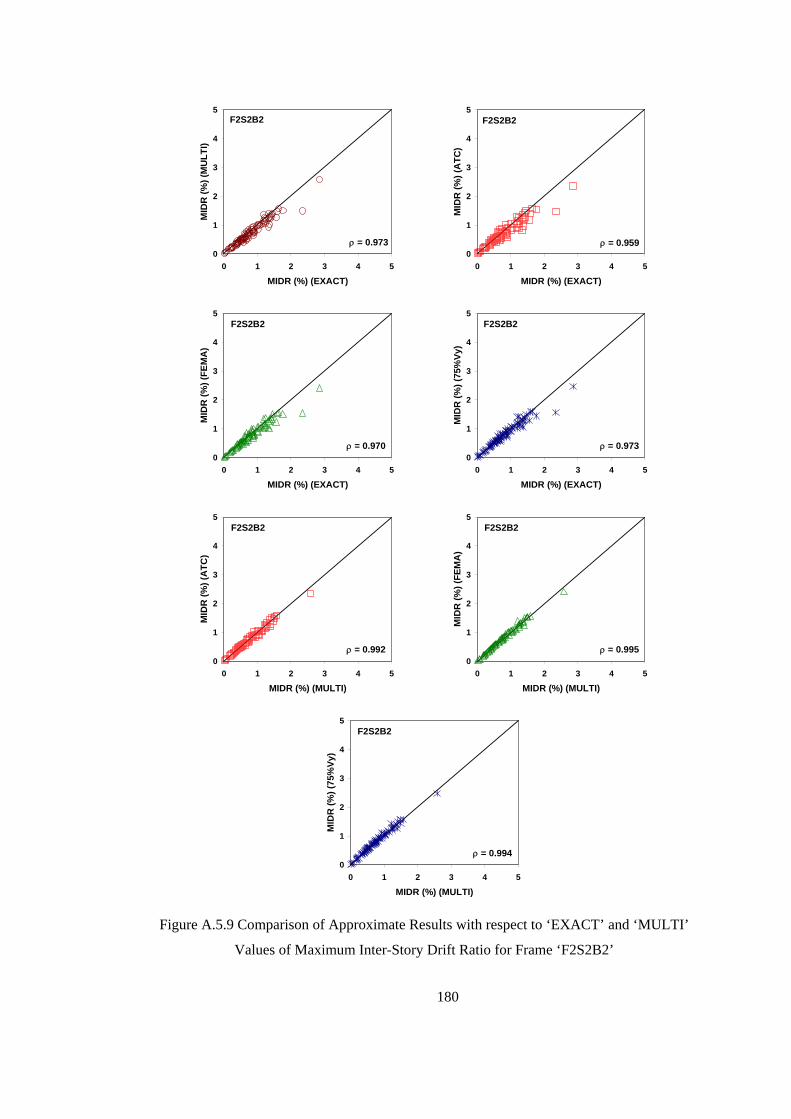
0
1
2
3
4
5
0 1 2 3 4 5
MIDR (%) (EXACT)
MID
R (%
) (M
ULT
I)
F2S2B2
ρ = 0.973
0
1
2
3
4
5
0 1 2 3 4 5
MIDR (%) (EXACT)
MID
R (%
) (A
TC)
F2S2B2
ρ = 0.959
0
1
2
3
4
5
0 1 2 3 4 5
MIDR (%) (EXACT)
MID
R (%
) (FE
MA
)
F2S2B2
ρ = 0.970
0
1
2
3
4
5
0 1 2 3 4 5
MIDR (%) (EXACT)
MID
R (%
) (75
%Vy
)
F2S2B2
ρ = 0.973
0
1
2
3
4
5
0 1 2 3 4 5
MIDR (%) (MULTI)
MID
R (%
) (A
TC)
F2S2B2
ρ = 0.992
0
1
2
3
4
5
0 1 2 3 4 5
MIDR (%) (MULTI)
MID
R (%
) (FE
MA
)
F2S2B2
ρ = 0.995
0
1
2
3
4
5
0 1 2 3 4 5
MIDR (%) (MULTI)
MID
R (%
) (75
%Vy
)
F2S2B2
ρ = 0.994
Figure A.5.9 Comparison of Approximate Results with respect to ‘EXACT’ and ‘MULTI’
Values of Maximum Inter-Story Drift Ratio for Frame ‘F2S2B2’
180
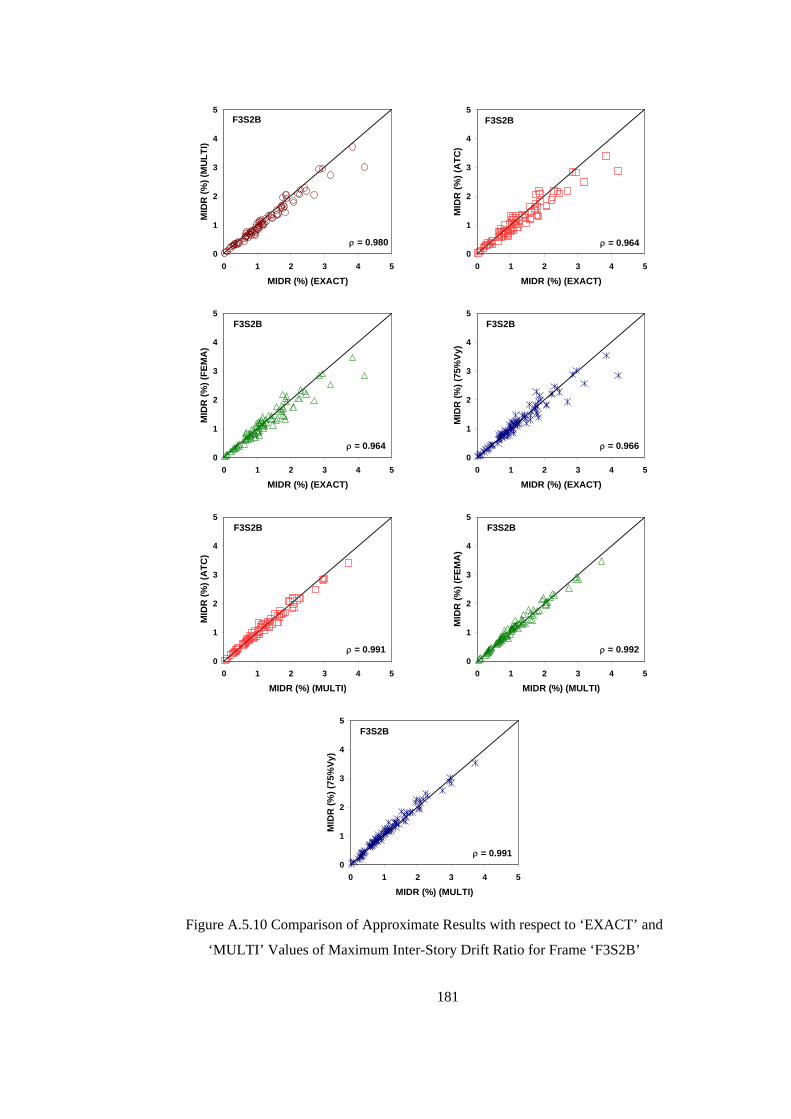
0
1
2
3
4
5
0 1 2 3 4 5
MIDR (%) (EXACT)
MID
R (%
) (M
ULT
I)
F3S2B
ρ = 0.980
0
1
2
3
4
5
0 1 2 3 4 5
MIDR (%) (EXACT)
MID
R (%
) (A
TC)
F3S2B
ρ = 0.964
0
1
2
3
4
5
0 1 2 3 4 5
MIDR (%) (EXACT)
MID
R (%
) (FE
MA
)
F3S2B
ρ = 0.964
0
1
2
3
4
5
0 1 2 3 4 5
MIDR (%) (EXACT)
MID
R (%
) (75
%Vy
)
F3S2B
ρ = 0.966
0
1
2
3
4
5
0 1 2 3 4 5
MIDR (%) (MULTI)
MID
R (%
) (A
TC)
F3S2B
ρ = 0.991
0
1
2
3
4
5
0 1 2 3 4 5
MIDR (%) (MULTI)
MID
R (%
) (FE
MA
)
F3S2B
ρ = 0.992
0
1
2
3
4
5
0 1 2 3 4 5
MIDR (%) (MULTI)
MID
R (%
) (75
%Vy
)
F3S2B
ρ = 0.991
Figure A.5.10 Comparison of Approximate Results with respect to ‘EXACT’ and
‘MULTI’ Values of Maximum Inter-Story Drift Ratio for Frame ‘F3S2B’
181

0
2
4
6
8
10
0 2 4 6 8 10
MIDR (%) (EXACT)
MID
R (%
) (M
ULT
I)
F5S2B
ρ = 0.883
0
2
4
6
8
10
0 2 4 6 8 10
MIDR (%) (EXACT)
MID
R (%
) (A
TC)
F5S2B
ρ = 0.840
0
2
4
6
8
10
0 2 4 6 8 10
MIDR (%) (EXACT)
MID
R (%
) (FE
MA
)
F5S2B
ρ = 0.811
0
2
4
6
8
10
0 2 4 6 8 10
MIDR (%) (EXACT)
MID
R (%
) (75
%Vy
)
F5S2B
ρ = 0.817
0
2
4
6
8
10
0 2 4 6 8 10
MIDR (%) (MULTI)
MID
R (%
) (A
TC)
F5S2B
ρ = 0.968
0
2
4
6
8
10
0 2 4 6 8 10
MIDR (%) (MULTI)
MID
R (%
) (FE
MA
)
F5S2B
ρ = 0.972
0
2
4
6
8
10
0 2 4 6 8 10
MIDR (%) (MULTI)
MID
R (%
) (75
%Vy
)
F5S2B
ρ = 0.974
Figure A.5.11 Comparison of Approximate Results with respect to ‘EXACT’ and
‘MULTI’ Values of Maximum Inter-Story Drift Ratio for Frame ‘F5S2B’
182

0
2
4
6
0 2 4 6
MIDR (%) (EXACT)
MID
R (%
) (M
ULT
I)
F5S4B
ρ = 0.981
0
2
4
6
0 2 4 6
MIDR (%) (EXACT)
MID
R (%
) (A
TC)
F5S4B
ρ = 0.946
0
2
4
6
0 2 4 6
MIDR (%) (EXACT)
MID
R (%
) (FE
MA
)
F5S4B
ρ = 0.970
0
2
4
6
0 2 4 6
MIDR (%) (EXACT)
MID
R (%
) (75
%Vy
)
F5S4B
ρ = 0.971
0
2
4
6
0 2 4 6
MIDR (%) (MULTI)
MID
R (%
) (A
TC)
F5S4B
ρ = 0.972
0
2
4
6
0 2 4 6
MIDR (%) (MULTI)
MID
R (%
) (FE
MA
)
F5S4B
ρ = 0.993
0
2
4
6
0 2 4 6
MIDR (%) (MULTI)
MID
R (%
) (75
%Vy
)
F5S4B
ρ = 0.993
Figure A.5.12 Comparison of Approximate Results with respect to ‘EXACT’ and
‘MULTI’ Values of Maximum Inter-Story Drift Ratio for Frame ‘F5S4B’
183
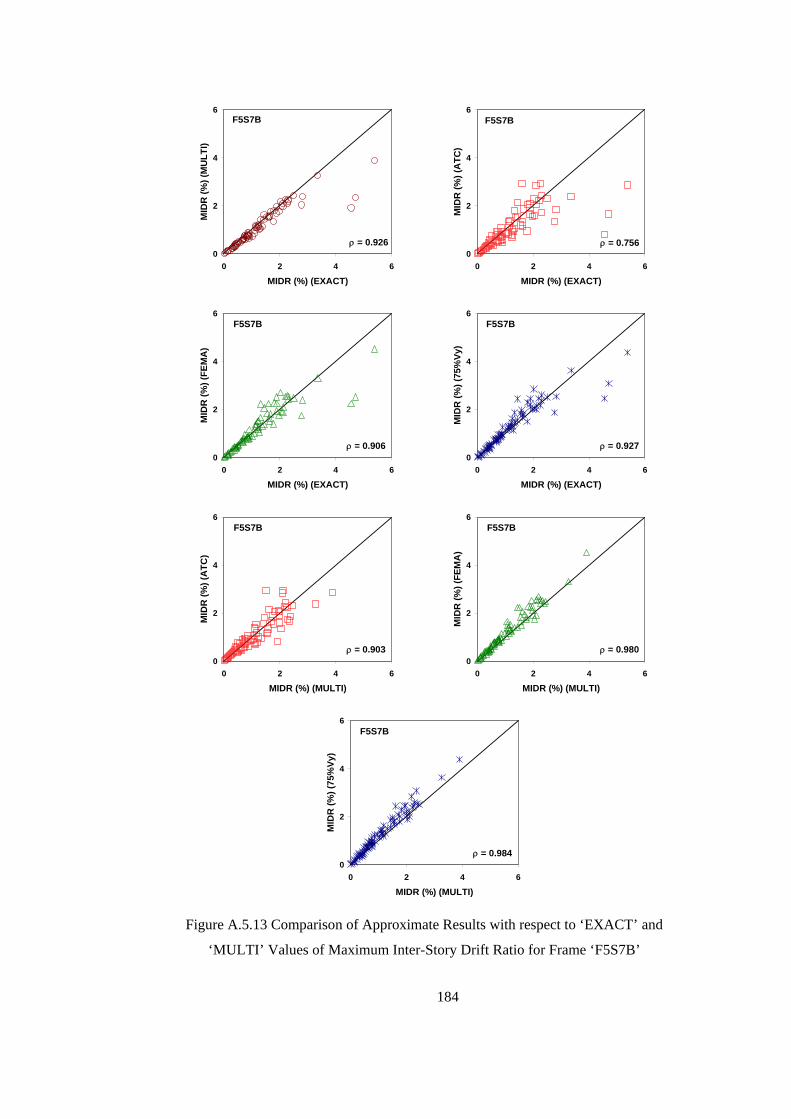
0
2
4
6
0 2 4 6
MIDR (%) (EXACT)
MID
R (%
) (M
ULT
I)
F5S7B
ρ = 0.926
0
2
4
6
0 2 4 6
MIDR (%) (EXACT)
MID
R (%
) (A
TC)
F5S7B
ρ = 0.756
0
2
4
6
0 2 4 6
MIDR (%) (EXACT)
MID
R (%
) (FE
MA
)
F5S7B
ρ = 0.906
0
2
4
6
0 2 4 6
MIDR (%) (EXACT)
MID
R (%
) (75
%Vy
)
F5S7B
ρ = 0.927
0
2
4
6
0 2 4 6
MIDR (%) (MULTI)
MID
R (%
) (A
TC)
F5S7B
ρ = 0.903
0
2
4
6
0 2 4 6
MIDR (%) (MULTI)
MID
R (%
) (FE
MA
)
F5S7B
ρ = 0.980
0
2
4
6
0 2 4 6
MIDR (%) (MULTI)
MID
R (%
) (75
%Vy
)
F5S7B
ρ = 0.984
Figure A.5.13 Comparison of Approximate Results with respect to ‘EXACT’ and
‘MULTI’ Values of Maximum Inter-Story Drift Ratio for Frame ‘F5S7B’
184

0
1
2
3
4
5
0 1 2 3 4 5
MIDR (%) (EXACT)
MID
R (%
) (M
ULT
I)
F8S3B
ρ = 0.951
0
1
2
3
4
5
0 1 2 3 4 5
MIDR (%) (EXACT)
MID
R (%
) (A
TC)
F8S3B
ρ = 0.938
0
1
2
3
4
5
0 1 2 3 4 5
MIDR (%) (EXACT)
MID
R (%
) (FE
MA
)
F8S3B
ρ = 0.943
0
1
2
3
4
5
0 1 2 3 4 5
MIDR (%) (EXACT)
MID
R (%
) (75
%Vy
)
F8S3B
ρ = 0.946
0
1
2
3
4
5
0 1 2 3 4 5
MIDR (%) (MULTI)
MID
R (%
) (A
TC)
F8S3B
ρ = 0.962
0
1
2
3
4
5
0 1 2 3 4 5
MIDR (%) (MULTI)
MID
R (%
) (FE
MA
)
F8S3B
ρ = 0.989
0
1
2
3
4
5
0 1 2 3 4 5
MIDR (%) (MULTI)
MID
R (%
) (75
%Vy
)
F8S3B
ρ = 0.990
Figure A.5.14 Comparison of Approximate Results with respect to ‘EXACT’ and
‘MULTI’ Values of Maximum Inter-Story Drift Ratio for Frame ‘F8S3B’
185
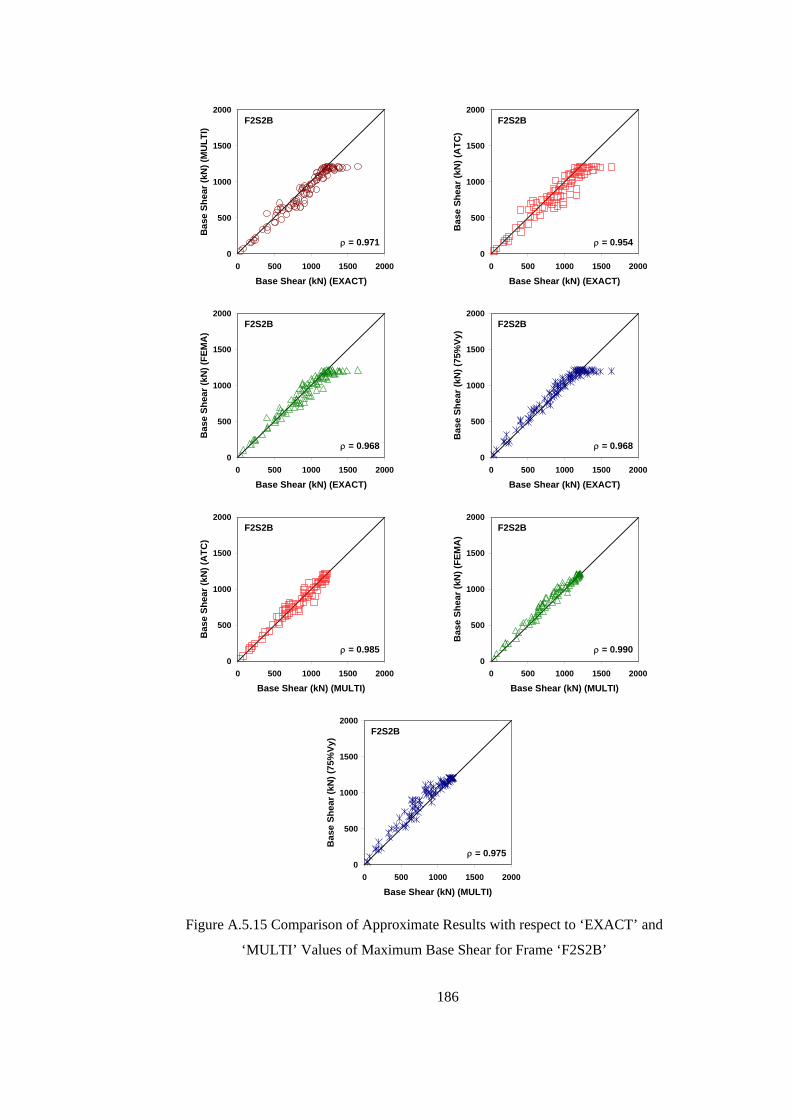
0
500
1000
1500
2000
0 500 1000 1500 2000
Base Shear (kN) (EXACT)
Bas
e Sh
ear (
kN) (
MU
LTI)
F2S2B
ρ = 0.971
0
500
1000
1500
2000
0 500 1000 1500 2000
Base Shear (kN) (EXACT)
Bas
e Sh
ear (
kN) (
ATC
)
F2S2B
ρ = 0.954
0
500
1000
1500
2000
0 500 1000 1500 2000
Base Shear (kN) (EXACT)
Bas
e Sh
ear (
kN) (
FEM
A)
F2S2B
ρ = 0.968
0
500
1000
1500
2000
0 500 1000 1500 2000
Base Shear (kN) (EXACT)
Bas
e Sh
ear (
kN) (
75%
Vy)
F2S2B
ρ = 0.968
0
500
1000
1500
2000
0 500 1000 1500 2000
Base Shear (kN) (MULTI)
Bas
e Sh
ear (
kN) (
ATC
)
F2S2B
ρ = 0.985
0
500
1000
1500
2000
0 500 1000 1500 2000
Base Shear (kN) (MULTI)
Bas
e Sh
ear (
kN) (
FEM
A)
F2S2B
ρ = 0.990
0
500
1000
1500
2000
0 500 1000 1500 2000
Base Shear (kN) (MULTI)
Bas
e Sh
ear (
kN) (
75%
Vy)
F2S2B
ρ = 0.975
Figure A.5.15 Comparison of Approximate Results with respect to ‘EXACT’ and
‘MULTI’ Values of Maximum Base Shear for Frame ‘F2S2B’
186
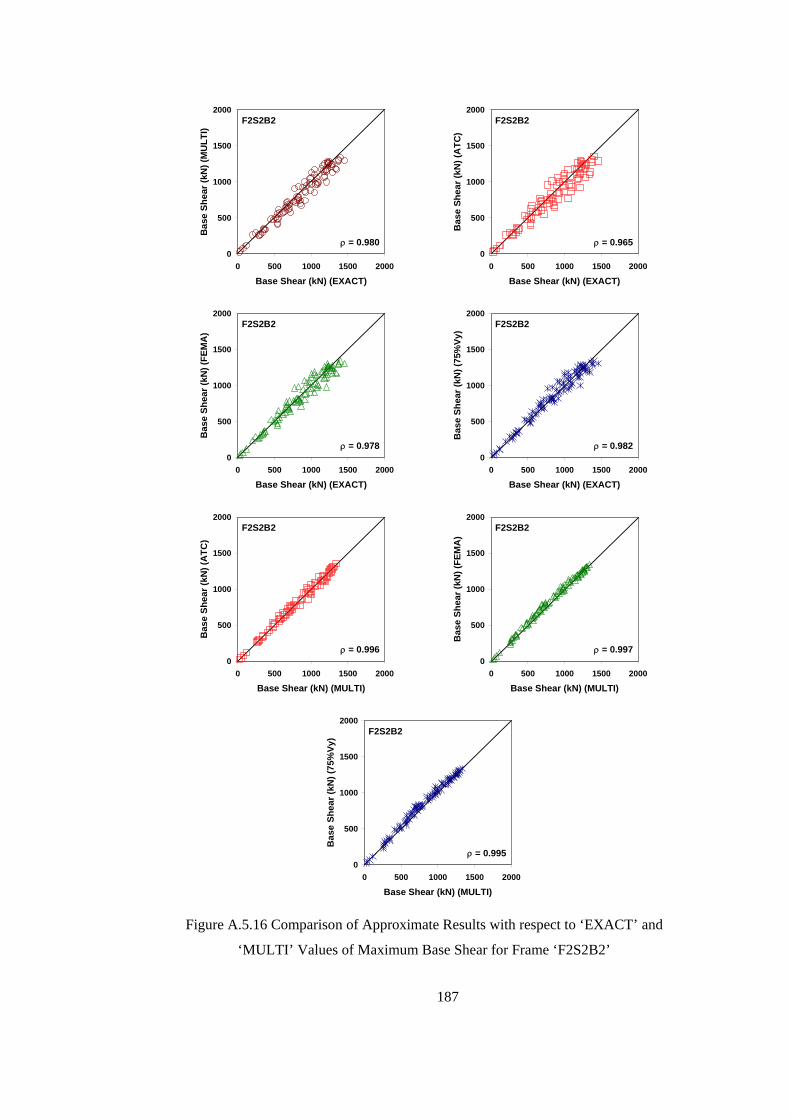
0
500
1000
1500
2000
0 500 1000 1500 2000
Base Shear (kN) (EXACT)
Bas
e Sh
ear (
kN) (
MU
LTI)
F2S2B2
ρ = 0.980
0
500
1000
1500
2000
0 500 1000 1500 2000
Base Shear (kN) (EXACT)
Bas
e Sh
ear (
kN) (
ATC
)
F2S2B2
ρ = 0.965
0
500
1000
1500
2000
0 500 1000 1500 2000
Base Shear (kN) (EXACT)
Bas
e Sh
ear (
kN) (
FEM
A)
F2S2B2
ρ = 0.978
0
500
1000
1500
2000
0 500 1000 1500 2000
Base Shear (kN) (EXACT)
Bas
e Sh
ear (
kN) (
75%
Vy)
F2S2B2
ρ = 0.982
0
500
1000
1500
2000
0 500 1000 1500 2000
Base Shear (kN) (MULTI)
Bas
e Sh
ear (
kN) (
ATC
)
F2S2B2
ρ = 0.996
0
500
1000
1500
2000
0 500 1000 1500 2000
Base Shear (kN) (MULTI)
Bas
e Sh
ear (
kN) (
FEM
A)
F2S2B2
ρ = 0.997
0
500
1000
1500
2000
0 500 1000 1500 2000
Base Shear (kN) (MULTI)
Bas
e Sh
ear (
kN) (
75%
Vy)
F2S2B2
ρ = 0.995
Figure A.5.16 Comparison of Approximate Results with respect to ‘EXACT’ and
‘MULTI’ Values of Maximum Base Shear for Frame ‘F2S2B2’
187

0
500
1000
1500
2000
0 500 1000 1500 2000
Base Shear (kN) (EXACT)
Bas
e Sh
ear (
kN) (
MU
LTI)
F3S2B
ρ = 0.976
0
500
1000
1500
2000
0 500 1000 1500 2000
Base Shear (kN) (EXACT)
Bas
e Sh
ear (
kN) (
ATC
)
F3S2B
ρ = 0.962
0
500
1000
1500
2000
0 500 1000 1500 2000
Base Shear (kN) (EXACT)
Bas
e Sh
ear (
kN) (
FEM
A)
F3S2B
ρ = 0.968
0
500
1000
1500
2000
0 500 1000 1500 2000
Base Shear (kN) (EXACT)
Bas
e Sh
ear (
kN) (
75%
Vy)
F3S2B
ρ = 0.973
0
500
1000
1500
2000
0 500 1000 1500 2000
Base Shear (kN) (MULTI)
Bas
e Sh
ear (
kN) (
ATC
)
F3S2B
ρ = 0.994
0
500
1000
1500
2000
0 500 1000 1500 2000
Base Shear (kN) (MULTI)
Bas
e Sh
ear (
kN) (
FEM
A)
F3S2B
ρ = 0.995
0
500
1000
1500
2000
0 500 1000 1500 2000
Base Shear (kN) (MULTI)
Bas
e Sh
ear (
kN) (
75%
Vy)
F3S2B
ρ = 0.993
Figure A.5.17 Comparison of Approximate Results with respect to ‘EXACT’ and
‘MULTI’ Values of Maximum Base Shear for Frame ‘F3S2B’
188

0
250
500
750
1000
0 250 500 750 1000
Base Shear (kN) (EXACT)
Bas
e Sh
ear (
kN) (
MU
LTI)
F5S2B
ρ = 0.977
0
250
500
750
1000
0 250 500 750 1000
Base Shear (kN) (EXACT)
Bas
e Sh
ear (
kN) (
ATC
)
F5S2B
ρ = 0.941
0
250
500
750
1000
0 250 500 750 1000
Base Shear (kN) (EXACT)
Bas
e Sh
ear (
kN) (
FEM
A)
F5S2B
ρ = 0.982
0
250
500
750
1000
0 250 500 750 1000
Base Shear (kN) (EXACT)
Bas
e Sh
ear (
kN) (
75%
Vy)
F5S2B
ρ = 0.980
0
250
500
750
1000
0 250 500 750 1000
Base Shear (kN) (MULTI)
Bas
e Sh
ear (
kN) (
ATC
)
F5S2B
ρ = 0.974
0
250
500
750
1000
0 250 500 750 1000
Base Shear (kN) (MULTI)
Bas
e Sh
ear (
kN) (
FEM
A)
F5S2B
ρ = 0.981
0
250
500
750
1000
0 250 500 750 1000
Base Shear (kN) (MULTI)
Bas
e Sh
ear (
kN) (
75%
Vy)
F5S2B
ρ = 0.973
Figure A.5.18 Comparison of Approximate Results with respect to ‘EXACT’ and
‘MULTI’ Values of Maximum Base Shear for Frame ‘F5S2B’
189

0
1000
2000
3000
4000
5000
0 1000 2000 3000 4000 5000
Base Shear (kN) (EXACT)
Bas
e Sh
ear (
kN) (
MU
LTI)
F5S4B
ρ = 0.970
0
1000
2000
3000
4000
5000
0 1000 2000 3000 4000 5000
Base Shear (kN) (EXACT)
Bas
e Sh
ear (
kN) (
ATC
)
F5S4B
ρ = 0.951
0
1000
2000
3000
4000
5000
0 1000 2000 3000 4000 5000
Base Shear (kN) (EXACT)
Bas
e Sh
ear (
kN) (
FEM
A)
F5S4B
ρ = 0.971
0
1000
2000
3000
4000
5000
0 1000 2000 3000 4000 5000
Base Shear (kN) (EXACT)
Bas
e Sh
ear (
kN) (
75%
Vy)
F5S4B
ρ = 0.972
0
1000
2000
3000
4000
5000
0 1000 2000 3000 4000 5000
Base Shear (kN) (MULTI)
Bas
e Sh
ear (
kN) (
ATC
)
F5S4B
ρ = 0.986
0
1000
2000
3000
4000
5000
0 1000 2000 3000 4000 5000
Base Shear (kN) (MULTI)
Bas
e Sh
ear (
kN) (
FEM
A)
F5S4B
ρ = 0.995
0
1000
2000
3000
4000
5000
0 1000 2000 3000 4000 5000
Base Shear (kN) (MULTI)
Bas
e Sh
ear (
kN) (
75%
Vy)
F5S4B
ρ = 0.994
Figure A.5.19 Comparison of Approximate Results with respect to ‘EXACT’ and
‘MULTI’ Values of Maximum Base Shear for Frame ‘F5S4B’
190

0
1000
2000
3000
4000
0 1000 2000 3000 4000
Base Shear (kN) (EXACT)
Bas
e Sh
ear (
kN) (
MU
LTI)
F5S7B
ρ = 0.979
0
1000
2000
3000
4000
0 1000 2000 3000 4000
Base Shear (kN) (EXACT)
Bas
e Sh
ear (
kN) (
ATC
)
F5S7B
ρ = 0.934
0
1000
2000
3000
4000
0 1000 2000 3000 4000
Base Shear (kN) (EXACT)
Bas
e Sh
ear (
kN) (
FEM
A)
F5S7B
ρ = 0.982
0
1000
2000
3000
4000
0 1000 2000 3000 4000
Base Shear (kN) (EXACT)
Bas
e Sh
ear (
kN) (
75%
Vy)
F5S7B
ρ = 0.982
0
1000
2000
3000
4000
0 1000 2000 3000 4000
Base Shear (kN) (MULTI)
Bas
e Sh
ear (
kN) (
ATC
)
F5S7B
ρ = 0.968
0
1000
2000
3000
4000
0 1000 2000 3000 4000
Base Shear (kN) (MULTI)
Bas
e Sh
ear (
kN) (
FEM
A)
F5S7B
ρ = 0.989
0
1000
2000
3000
4000
0 1000 2000 3000 4000
Base Shear (kN) (MULTI)
Bas
e Sh
ear (
kN) (
75%
Vy)
F5S7B
ρ = 0.980
Figure A.5.20 Comparison of Approximate Results with respect to ‘EXACT’ and
‘MULTI’ Values of Maximum Base Shear for Frame ‘F5S7B’
191
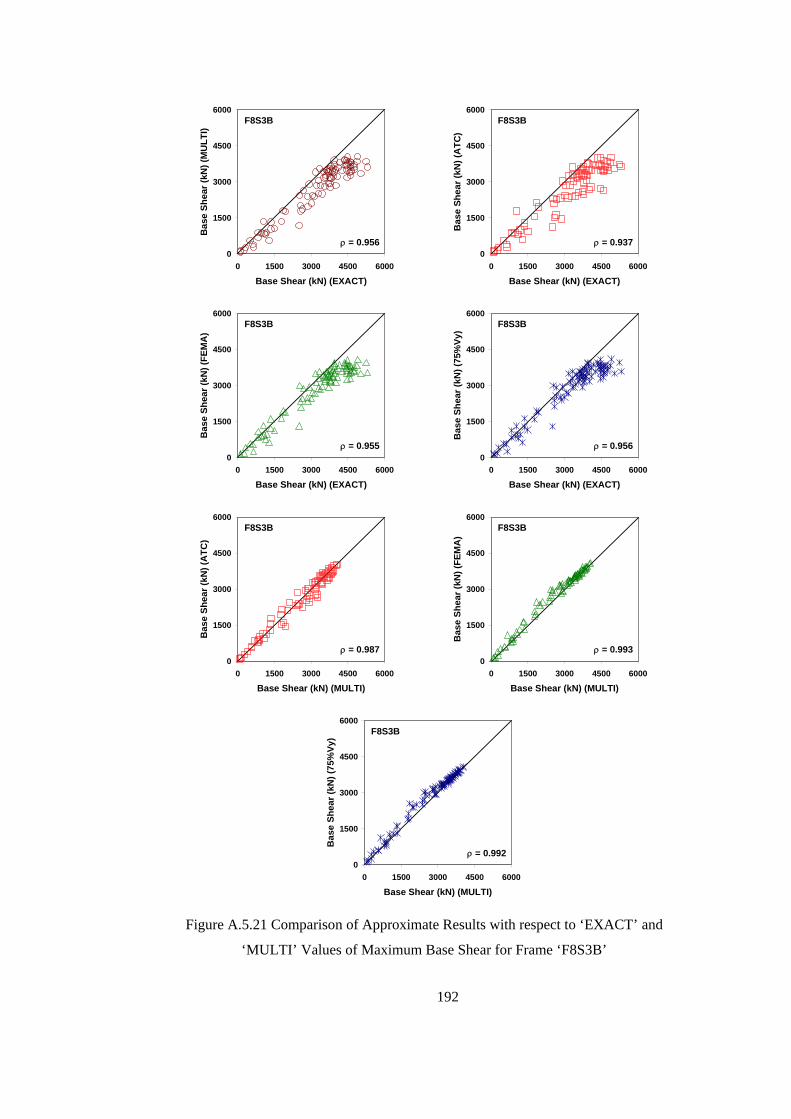
0
1500
3000
4500
6000
0 1500 3000 4500 6000
Base Shear (kN) (EXACT)
Bas
e Sh
ear (
kN) (
MU
LTI)
F8S3B
ρ = 0.956
0
1500
3000
4500
6000
0 1500 3000 4500 6000
Base Shear (kN) (EXACT)
Bas
e Sh
ear (
kN) (
ATC
)
F8S3B
ρ = 0.937
0
1500
3000
4500
6000
0 1500 3000 4500 6000
Base Shear (kN) (EXACT)
Bas
e Sh
ear (
kN) (
FEM
A)
F8S3B
ρ = 0.955
0
1500
3000
4500
6000
0 1500 3000 4500 6000
Base Shear (kN) (EXACT)
Bas
e Sh
ear (
kN) (
75%
Vy)
F8S3B
ρ = 0.956
0
1500
3000
4500
6000
0 1500 3000 4500 6000
Base Shear (kN) (MULTI)
Bas
e Sh
ear (
kN) (
ATC
)
F8S3B
ρ = 0.987
0
1500
3000
4500
6000
0 1500 3000 4500 6000
Base Shear (kN) (MULTI)
Bas
e Sh
ear (
kN) (
FEM
A)
F8S3B
ρ = 0.993
0
1500
3000
4500
6000
0 1500 3000 4500 6000
Base Shear (kN) (MULTI)
Bas
e Sh
ear (
kN) (
75%
Vy)
F8S3B
ρ = 0.992
Figure A.5.21 Comparison of Approximate Results with respect to ‘EXACT’ and
‘MULTI’ Values of Maximum Base Shear for Frame ‘F8S3B’
192
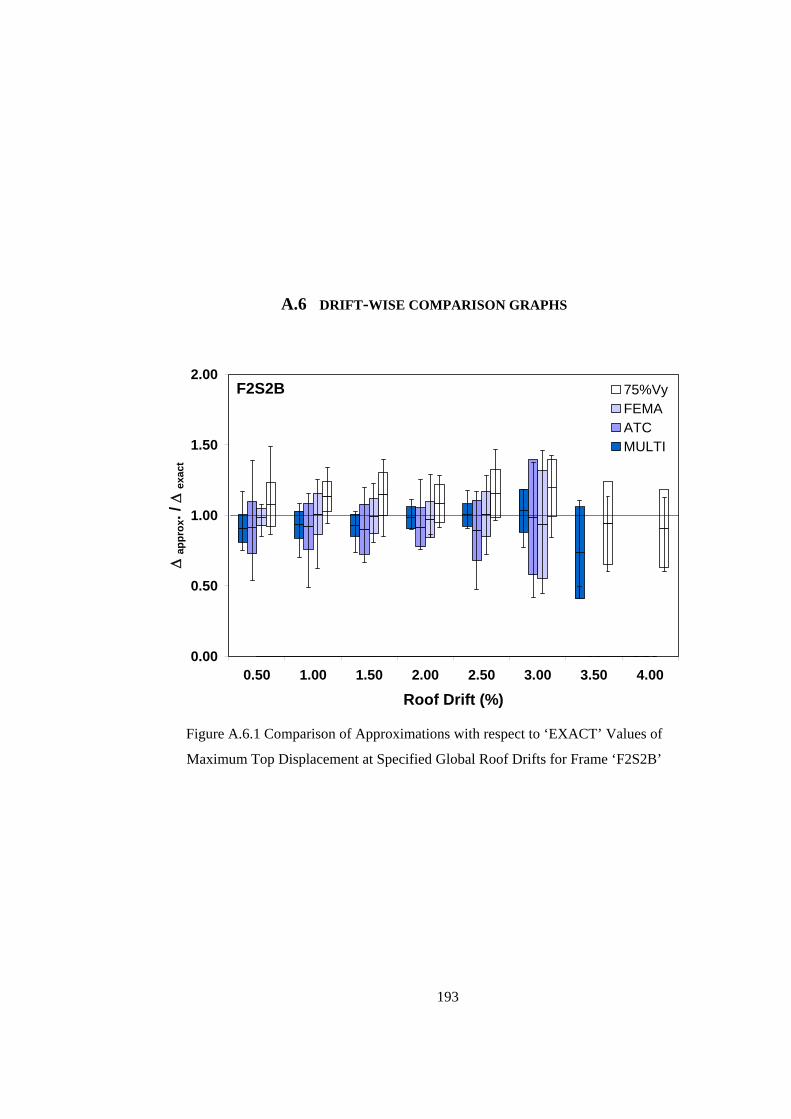
A.6 DRIFT-WISE COMPARISON GRAPHS
0.00
0.50
1.00
1.50
2.00
0.50 1.00 1.50 2.00 2.50 3.00 3.50 4.00
Roof Drift (%)
Δ ap
prox
. / Δ
exac
t
75%VyFEMAATCMULTI
F2S2B
Figure A.6.1 Comparison of Approximations with respect to ‘EXACT’ Values of
Maximum Top Displacement at Specified Global Roof Drifts for Frame ‘F2S2B’
193

0.00
0.50
1.00
1.50
2.00
0.50 1.00 1.50 2.00 2.50 3.00 3.50 4.00
Roof Drift (%)
Δ ap
prox
. / Δ
exac
t
75%VyFEMAATCMULTI
F2S2B2
Figure A.6.2 Comparison of Approximations with respect to ‘EXACT’ Values of
Maximum Top Displacement at Specified Global Roof Drifts for Frame ‘F2S2B2’
0.00
0.50
1.00
1.50
2.00
0.50 1.00 1.50 2.00 2.50 3.00 3.50 4.00
Roof Drift (%)
Δ ap
prox
. / Δ
exac
t
75%VyFEMAATCMULTI
F3S2B
Figure A.6.3 Comparison of Approximations with respect to ‘EXACT’ Values of
Maximum Top Displacement at Specified Global Roof Drifts for Frame ‘F3S2B’
194
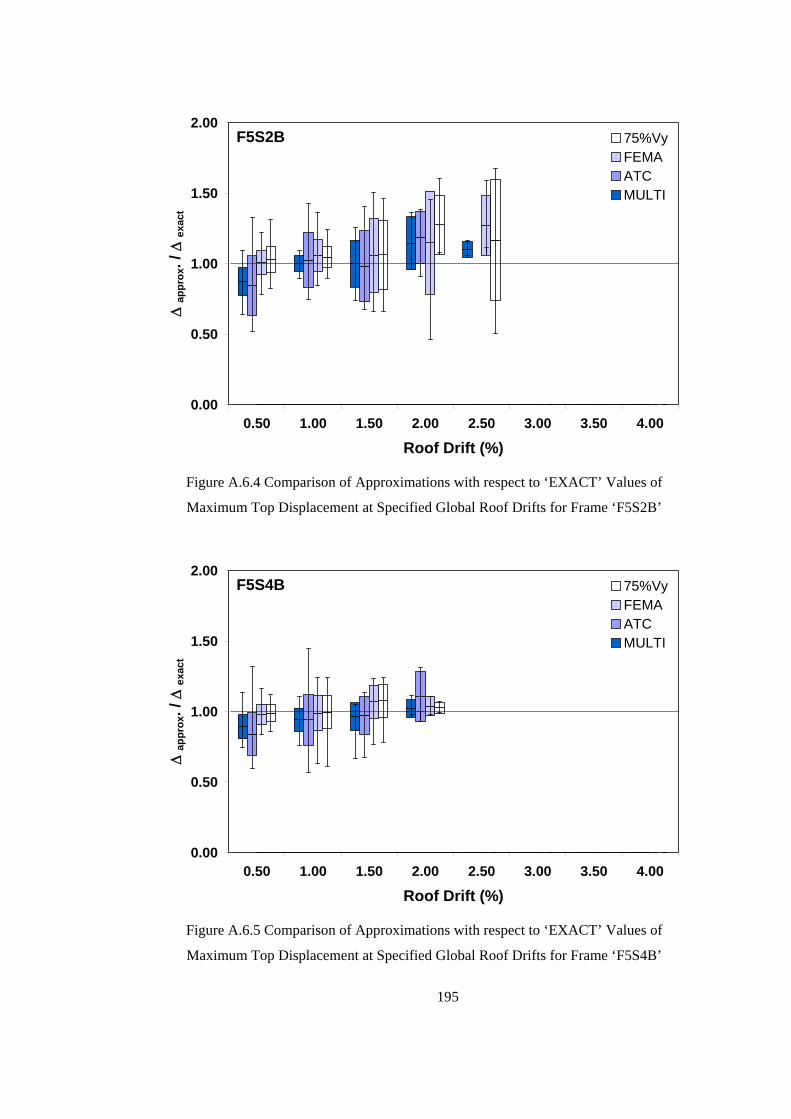
0.00
0.50
1.00
1.50
2.00
0.50 1.00 1.50 2.00 2.50 3.00 3.50 4.00
Roof Drift (%)
Δ ap
prox
. / Δ
exac
t
75%VyFEMAATCMULTI
F5S2B
Figure A.6.4 Comparison of Approximations with respect to ‘EXACT’ Values of
Maximum Top Displacement at Specified Global Roof Drifts for Frame ‘F5S2B’
0.00
0.50
1.00
1.50
2.00
0.50 1.00 1.50 2.00 2.50 3.00 3.50 4.00
Roof Drift (%)
Δ ap
prox
. / Δ
exac
t
75%VyFEMAATCMULTI
F5S4B
Figure A.6.5 Comparison of Approximations with respect to ‘EXACT’ Values of
Maximum Top Displacement at Specified Global Roof Drifts for Frame ‘F5S4B’
195

0.00
0.50
1.00
1.50
2.00
0.50 1.00 1.50 2.00 2.50 3.00 3.50 4.00
Roof Drift (%)
Δ ap
prox
. / Δ
exac
t
75%VyFEMAATCMULTI
F5S7B
Figure A.6.6 Comparison of Approximations with respect to ‘EXACT’ Values of
Maximum Top Displacement at Specified Global Roof Drifts for Frame ‘F5S7B’
0.00
0.50
1.00
1.50
2.00
0.50 1.00 1.50 2.00 2.50 3.00 3.50 4.00
Roof Drift (%)
Δ ap
prox
. / Δ
exac
t
75%VyFEMAATCMULTI
F8S3B
Figure A.6.7 Comparison of Approximations with respect to ‘EXACT’ Values of
Maximum Top Displacement at Specified Global Roof Drifts for Frame ‘F8S3B’
196

0.00
0.50
1.00
1.50
2.00
0.50 1.00 1.50 2.00 2.50 3.00 3.50 4.00
Roof Drift (%)
MID
R ap
prox
. / M
IDR
exac
t
75%VyFEMAATCMULTI
F2S2B
Figure A.6.8 Comparison of Approximations with respect to ‘EXACT’ Values of
Maximum Inter-Story Drift Ratio at Specified Global Roof Drifts for Frame ‘F2S2B’
0.00
0.50
1.00
1.50
2.00
0.50 1.00 1.50 2.00 2.50 3.00 3.50 4.00
Roof Drift (%)
MID
R ap
prox
. / M
IDR
exac
t
75%VyFEMAATCMULTI
F2S2B2
Figure A.6.9 Comparison of Approximations with respect to ‘EXACT’ Values of
Maximum Inter-Story Drift Ratio at Specified Global Roof Drifts for Frame ‘F2S2B2’
197

0.00
0.50
1.00
1.50
2.00
0.50 1.00 1.50 2.00 2.50 3.00 3.50 4.00
Roof Drift (%)
MID
R ap
prox
. / M
IDR
exac
t
75%VyFEMAATCMULTI
F3S2B
Figure A.6.10 Comparison of Approximations with respect to ‘EXACT’ Values of
Maximum Inter-Story Drift Ratio at Specified Global Roof Drifts for Frame ‘F3S2B’
0.00
0.50
1.00
1.50
2.00
0.50 1.00 1.50 2.00 2.50 3.00 3.50 4.00
Roof Drift (%)
MID
R ap
prox
. / M
IDR
exac
t
75%VyFEMAATCMULTI
F5S2B
Figure A.6.11 Comparison of Approximations with respect to ‘EXACT’ Values of
Maximum Inter-Story Drift Ratio at Specified Global Roof Drifts for Frame ‘F5S2B’
198
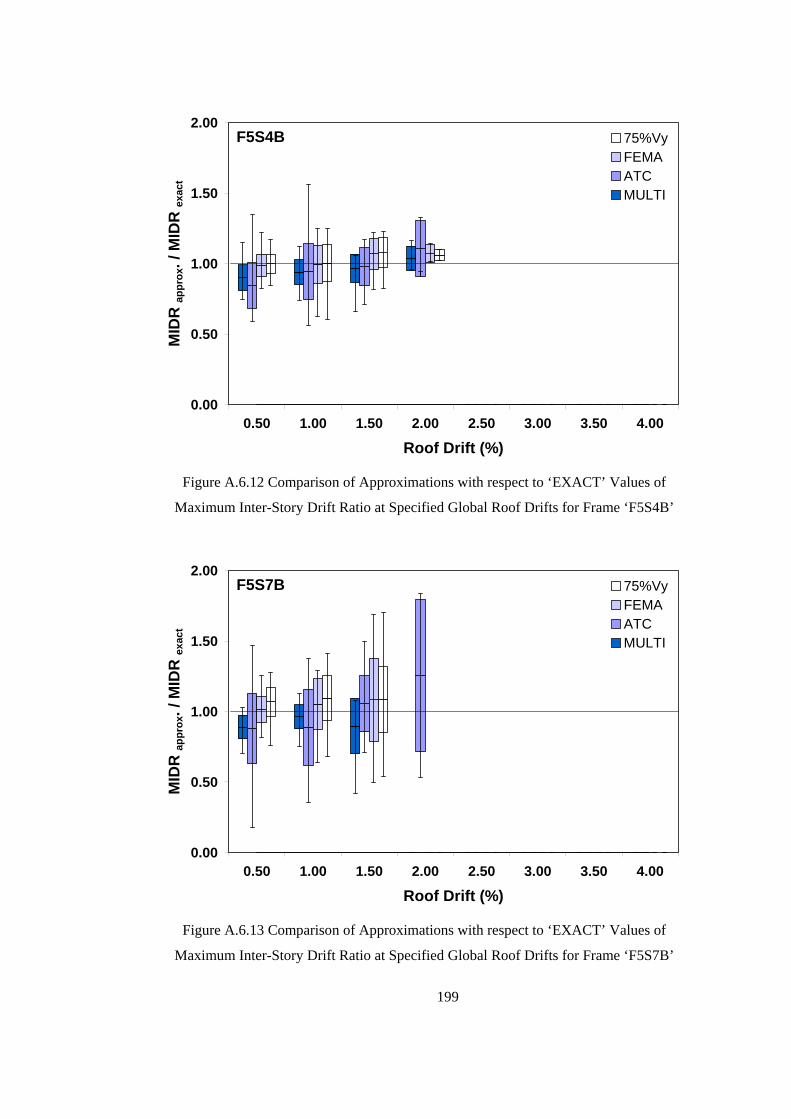
0.00
0.50
1.00
1.50
2.00
0.50 1.00 1.50 2.00 2.50 3.00 3.50 4.00
Roof Drift (%)
MID
R ap
prox
. / M
IDR
exac
t
75%VyFEMAATCMULTI
F5S4B
Figure A.6.12 Comparison of Approximations with respect to ‘EXACT’ Values of
Maximum Inter-Story Drift Ratio at Specified Global Roof Drifts for Frame ‘F5S4B’
0.00
0.50
1.00
1.50
2.00
0.50 1.00 1.50 2.00 2.50 3.00 3.50 4.00
Roof Drift (%)
MID
R ap
prox
. / M
IDR
exac
t
75%VyFEMAATCMULTI
F5S7B
Figure A.6.13 Comparison of Approximations with respect to ‘EXACT’ Values of
Maximum Inter-Story Drift Ratio at Specified Global Roof Drifts for Frame ‘F5S7B’
199
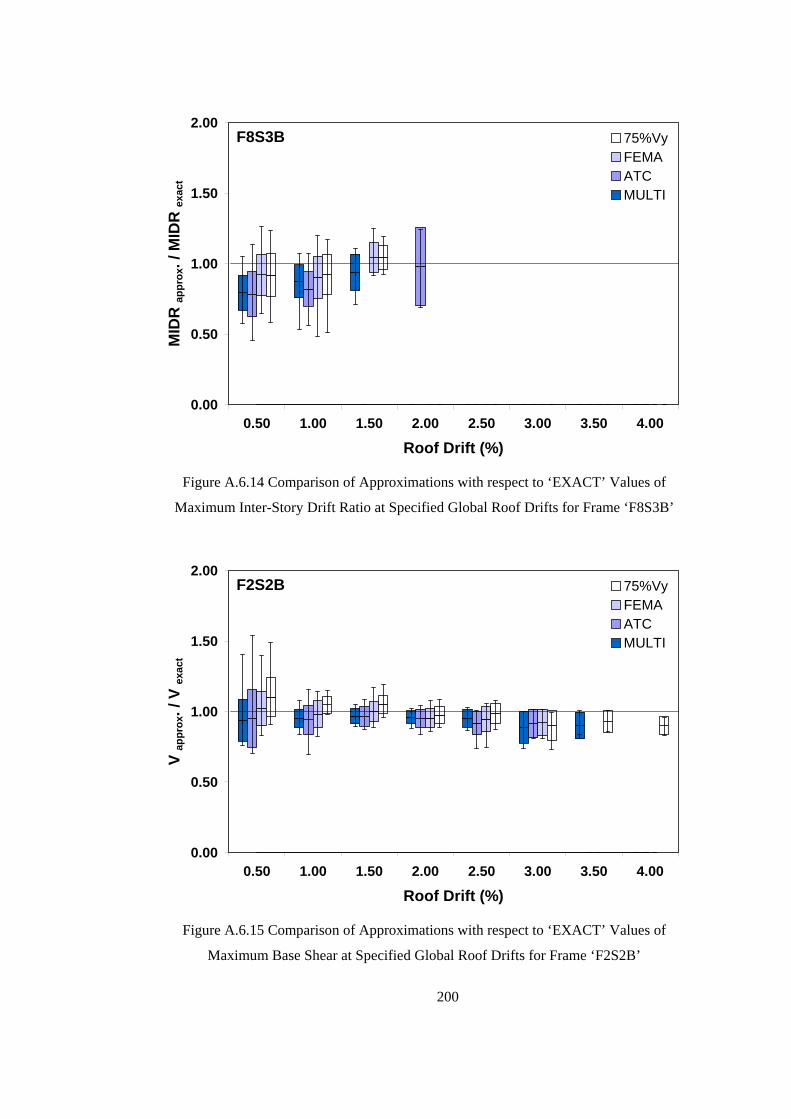
0.00
0.50
1.00
1.50
2.00
0.50 1.00 1.50 2.00 2.50 3.00 3.50 4.00
Roof Drift (%)
MID
R ap
prox
. / M
IDR
exac
t
75%VyFEMAATCMULTI
F8S3B
Figure A.6.14 Comparison of Approximations with respect to ‘EXACT’ Values of
Maximum Inter-Story Drift Ratio at Specified Global Roof Drifts for Frame ‘F8S3B’
0.00
0.50
1.00
1.50
2.00
0.50 1.00 1.50 2.00 2.50 3.00 3.50 4.00
Roof Drift (%)
V ap
prox
. / V
exac
t
75%VyFEMAATCMULTI
F2S2B
Figure A.6.15 Comparison of Approximations with respect to ‘EXACT’ Values of
Maximum Base Shear at Specified Global Roof Drifts for Frame ‘F2S2B’
200
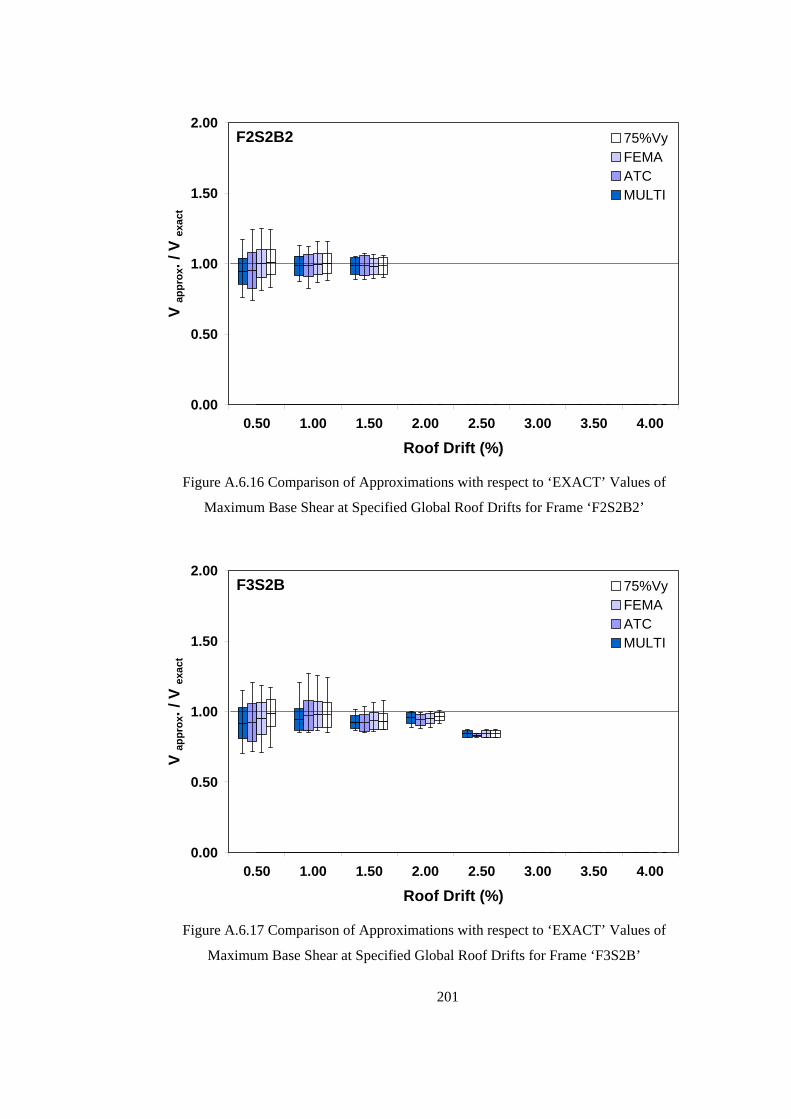
0.00
0.50
1.00
1.50
2.00
0.50 1.00 1.50 2.00 2.50 3.00 3.50 4.00
Roof Drift (%)
V ap
prox
. / V
exac
t
75%VyFEMAATCMULTI
F2S2B2
Figure A.6.16 Comparison of Approximations with respect to ‘EXACT’ Values of
Maximum Base Shear at Specified Global Roof Drifts for Frame ‘F2S2B2’
0.00
0.50
1.00
1.50
2.00
0.50 1.00 1.50 2.00 2.50 3.00 3.50 4.00
Roof Drift (%)
V ap
prox
. / V
exac
t
75%VyFEMAATCMULTI
F3S2B
Figure A.6.17 Comparison of Approximations with respect to ‘EXACT’ Values of
Maximum Base Shear at Specified Global Roof Drifts for Frame ‘F3S2B’
201

0.00
0.50
1.00
1.50
2.00
0.50 1.00 1.50 2.00 2.50 3.00 3.50 4.00
Roof Drift (%)
V ap
prox
. / V
exac
t
75%VyFEMAATCMULTI
F5S2B
Figure A.6.18 Comparison of Approximations with respect to ‘EXACT’ Values of
Maximum Base Shear at Specified Global Roof Drifts for Frame ‘F5S2B’
0.00
0.50
1.00
1.50
2.00
0.50 1.00 1.50 2.00 2.50 3.00 3.50 4.00
Roof Drift (%)
V ap
prox
. / V
exac
t
75%VyFEMAATCMULTI
F5S4B
Figure A.6.19 Comparison of Approximations with respect to ‘EXACT’ Values of
Maximum Base Shear at Specified Global Roof Drifts for Frame ‘F5S4B’
202
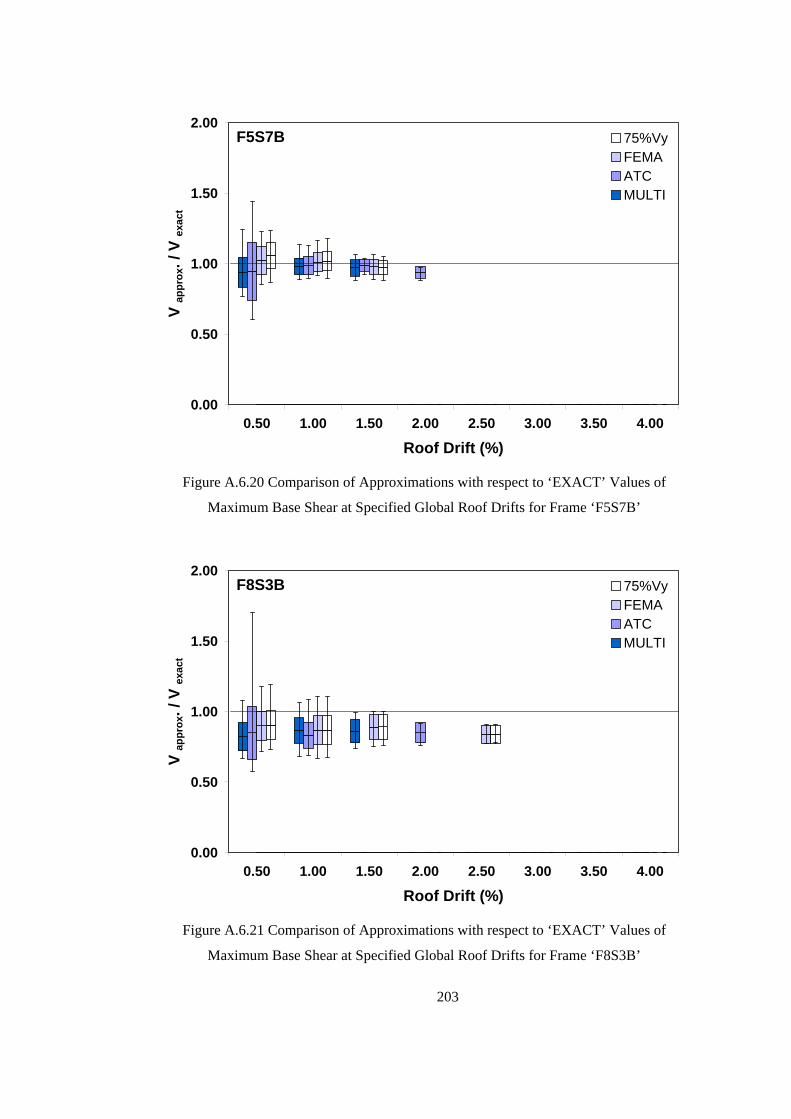
0.00
0.50
1.00
1.50
2.00
0.50 1.00 1.50 2.00 2.50 3.00 3.50 4.00
Roof Drift (%)
V ap
prox
. / V
exac
t
75%VyFEMAATCMULTI
F5S7B
Figure A.6.20 Comparison of Approximations with respect to ‘EXACT’ Values of
Maximum Base Shear at Specified Global Roof Drifts for Frame ‘F5S7B’
0.00
0.50
1.00
1.50
2.00
0.50 1.00 1.50 2.00 2.50 3.00 3.50 4.00
Roof Drift (%)
V ap
prox
. / V
exac
t
75%VyFEMAATCMULTI
F8S3B
Figure A.6.21 Comparison of Approximations with respect to ‘EXACT’ Values of
Maximum Base Shear at Specified Global Roof Drifts for Frame ‘F8S3B’
203

0.00
0.50
1.00
1.50
2.00
0.50 1.00 1.50 2.00 2.50 3.00 3.50 4.00
Roof Drift (%)
Δ ap
prox
. / Δ
mul
ti
75%VyFEMAATC
F2S2B
Figure A.6.22 Comparison of Approximations with respect to ‘MULTI’ Values of
Maximum Top Displacement at Specified Global Roof Drifts for Frame ‘F2S2B’
0.00
0.50
1.00
1.50
2.00
0.50 1.00 1.50 2.00 2.50 3.00 3.50 4.00
Roof Drift (%)
Δ ap
prox
. / Δ
mul
ti
75%VyFEMAATC
F2S2B2
Figure A.6.23 Comparison of Approximations with respect to ‘MULTI’ Values of
Maximum Top Displacement at Specified Global Roof Drifts for Frame ‘F2S2B2’
204

0.00
0.50
1.00
1.50
2.00
0.50 1.00 1.50 2.00 2.50 3.00 3.50 4.00
Roof Drift (%)
Δ ap
prox
. / Δ
mul
ti
75%VyFEMAATC
F3S2B
Figure A.6.24 Comparison of Approximations with respect to ‘MULTI’ Values of
Maximum Top Displacement at Specified Global Roof Drifts for Frame ‘F3S2B’
0.00
0.50
1.00
1.50
2.00
0.50 1.00 1.50 2.00 2.50 3.00 3.50 4.00
Roof Drift (%)
Δ ap
prox
. / Δ
mul
ti
75%VyFEMAATC
F5S2B
Figure A.6.25 Comparison of Approximations with respect to ‘MULTI’ Values of
Maximum Top Displacement at Specified Global Roof Drifts for Frame ‘F5S2B’
205

0.00
0.50
1.00
1.50
2.00
0.50 1.00 1.50 2.00 2.50 3.00 3.50 4.00
Roof Drift (%)
Δ ap
prox
. / Δ
mul
ti
75%VyFEMAATC
F5S4B
Figure A.6.26 Comparison of Approximations with respect to ‘MULTI’ Values of
Maximum Top Displacement at Specified Global Roof Drifts for Frame ‘F5S4B’
0.00
0.50
1.00
1.50
2.00
0.50 1.00 1.50 2.00 2.50 3.00 3.50 4.00
Roof Drift (%)
Δ ap
prox
. / Δ
mul
ti
75%VyFEMAATC
F5S7B
Figure A.6.27 Comparison of Approximations with respect to ‘MULTI’ Values of
Maximum Top Displacement at Specified Global Roof Drifts for Frame ‘F5S7B’
206

0.00
0.50
1.00
1.50
2.00
0.50 1.00 1.50 2.00 2.50 3.00 3.50 4.00
Roof Drift (%)
Δ ap
prox
. / Δ
mul
ti
75%VyFEMAATC
F8S3B
Figure A.6.28 Comparison of Approximations with respect to ‘MULTI’ Values of
Maximum Top Displacement at Specified Global Roof Drifts for Frame ‘F8S3B’
0.00
0.50
1.00
1.50
2.00
0.50 1.00 1.50 2.00 2.50 3.00 3.50 4.00
Roof Drift (%)
MID
R ap
prox
. / M
IDR
mul
ti
75%VyFEMAATC
F2S2B
Figure A.6.29 Comparison of Approximations with respect to ‘MULTI’ Values of
Maximum Inter-Story Drift Ratio at Specified Global Roof Drifts for Frame ‘F2S2B’
207
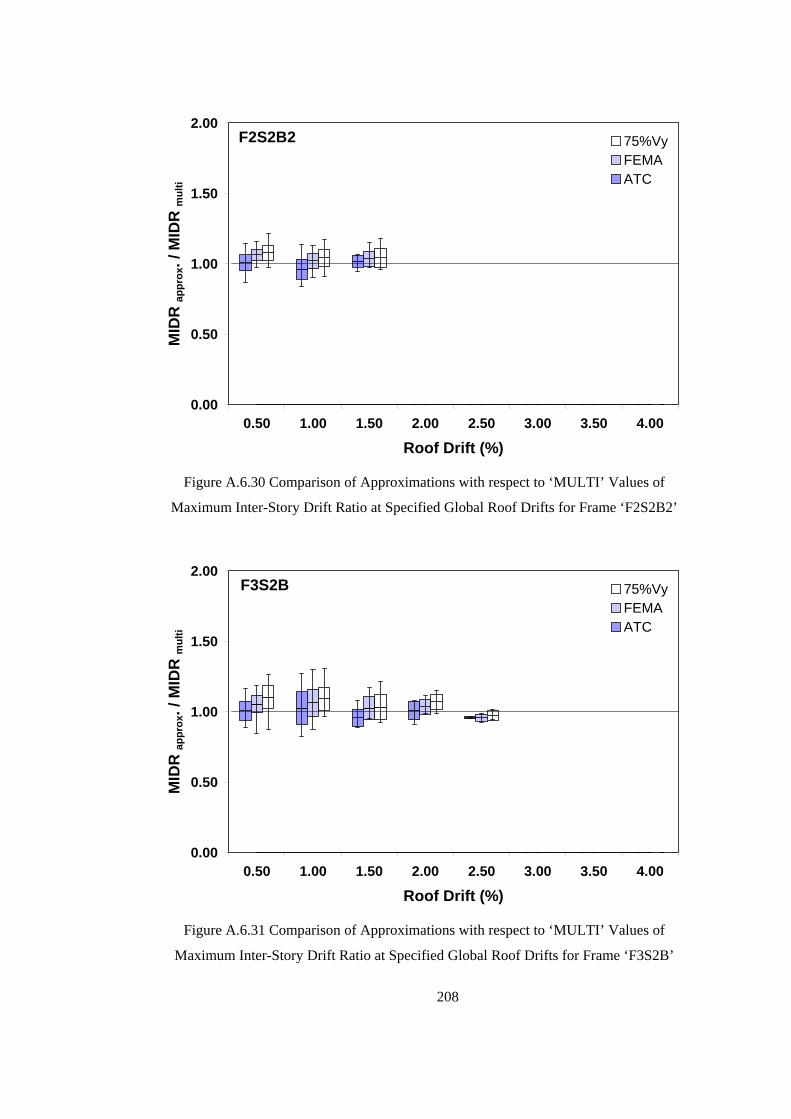
0.00
0.50
1.00
1.50
2.00
0.50 1.00 1.50 2.00 2.50 3.00 3.50 4.00
Roof Drift (%)
MID
R ap
prox
. / M
IDR
mul
ti
75%VyFEMAATC
F2S2B2
Figure A.6.30 Comparison of Approximations with respect to ‘MULTI’ Values of
Maximum Inter-Story Drift Ratio at Specified Global Roof Drifts for Frame ‘F2S2B2’
0.00
0.50
1.00
1.50
2.00
0.50 1.00 1.50 2.00 2.50 3.00 3.50 4.00
Roof Drift (%)
MID
R ap
prox
. / M
IDR
mul
ti
75%VyFEMAATC
F3S2B
Figure A.6.31 Comparison of Approximations with respect to ‘MULTI’ Values of
Maximum Inter-Story Drift Ratio at Specified Global Roof Drifts for Frame ‘F3S2B’
208
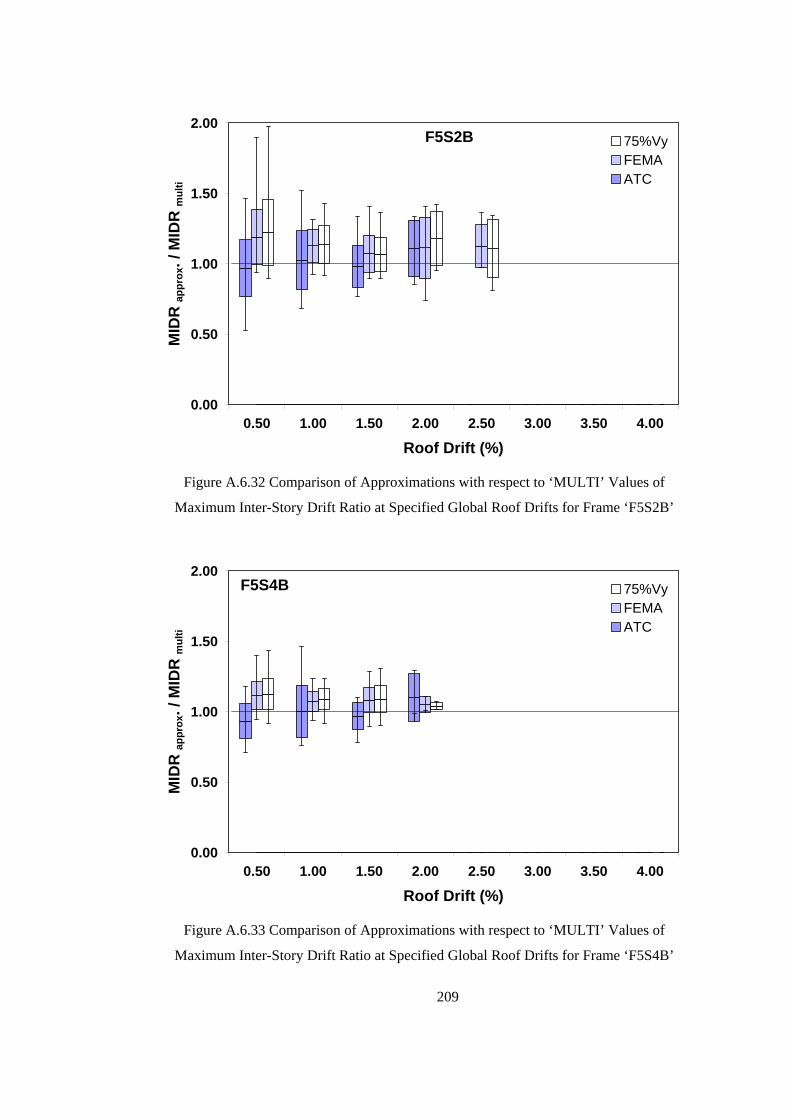
0.00
0.50
1.00
1.50
2.00
0.50 1.00 1.50 2.00 2.50 3.00 3.50 4.00
Roof Drift (%)
MID
R ap
prox
. / M
IDR
mul
ti
75%VyFEMAATC
F5S2B
Figure A.6.32 Comparison of Approximations with respect to ‘MULTI’ Values of
Maximum Inter-Story Drift Ratio at Specified Global Roof Drifts for Frame ‘F5S2B’
0.00
0.50
1.00
1.50
2.00
0.50 1.00 1.50 2.00 2.50 3.00 3.50 4.00
Roof Drift (%)
MID
R ap
prox
. / M
IDR
mul
ti
75%VyFEMAATC
F5S4B
Figure A.6.33 Comparison of Approximations with respect to ‘MULTI’ Values of
Maximum Inter-Story Drift Ratio at Specified Global Roof Drifts for Frame ‘F5S4B’
209
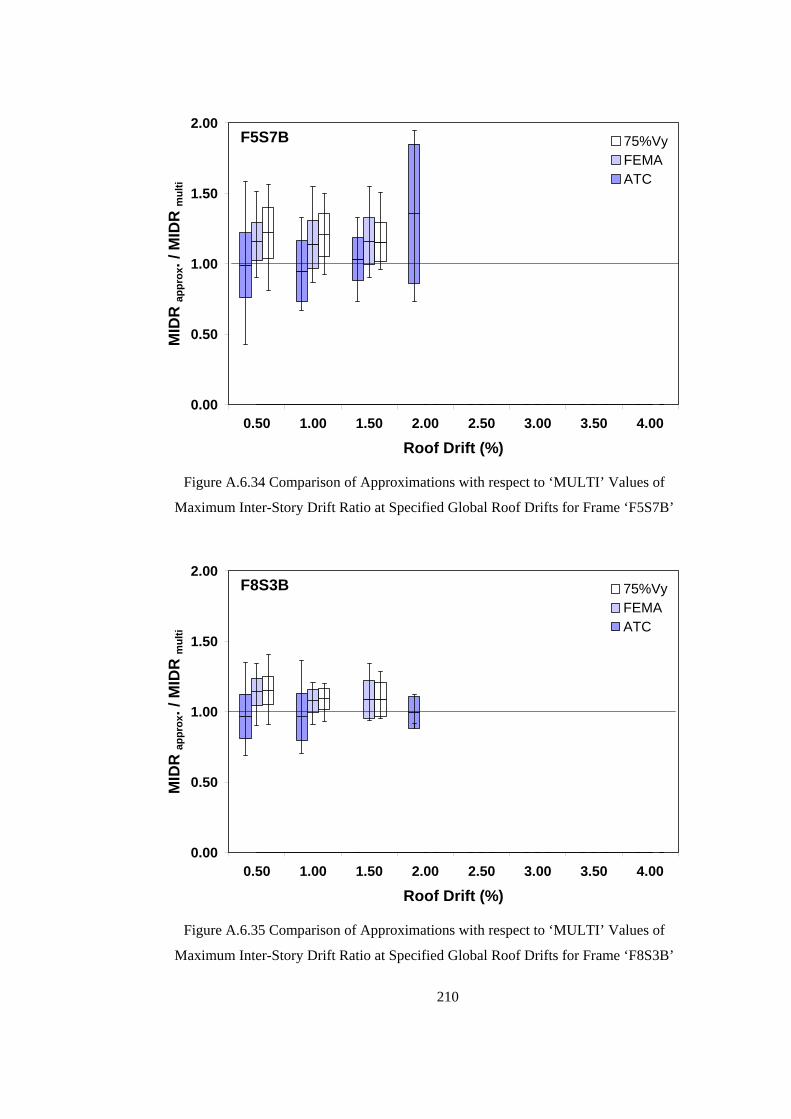
0.00
0.50
1.00
1.50
2.00
0.50 1.00 1.50 2.00 2.50 3.00 3.50 4.00
Roof Drift (%)
MID
R ap
prox
. / M
IDR
mul
ti
75%VyFEMAATC
F5S7B
Figure A.6.34 Comparison of Approximations with respect to ‘MULTI’ Values of
Maximum Inter-Story Drift Ratio at Specified Global Roof Drifts for Frame ‘F5S7B’
0.00
0.50
1.00
1.50
2.00
0.50 1.00 1.50 2.00 2.50 3.00 3.50 4.00
Roof Drift (%)
MID
R ap
prox
. / M
IDR
mul
ti
75%VyFEMAATC
F8S3B
Figure A.6.35 Comparison of Approximations with respect to ‘MULTI’ Values of
Maximum Inter-Story Drift Ratio at Specified Global Roof Drifts for Frame ‘F8S3B’
210

0.00
0.50
1.00
1.50
2.00
0.50 1.00 1.50 2.00 2.50 3.00 3.50 4.00
Roof Drift (%)
V ap
prox
. / V
mul
ti
75%VyFEMAATC
F2S2B
Figure A.6.36 Comparison of Approximations with respect to ‘MULTI’ Values of
Maximum Base Shear at Specified Global Roof Drifts for Frame ‘F2S2B’
0.00
0.50
1.00
1.50
2.00
0.50 1.00 1.50 2.00 2.50 3.00 3.50 4.00
Roof Drift (%)
V ap
prox
. / V
mul
ti
75%VyFEMAATC
F2S2B2
Figure A.6.37 Comparison of Approximations with respect to ‘MULTI’ Values of
Maximum Base Shear at Specified Global Roof Drifts for Frame ‘F2S2B2’
211

0.00
0.50
1.00
1.50
2.00
0.50 1.00 1.50 2.00 2.50 3.00 3.50 4.00
Roof Drift (%)
V ap
prox
. / V
mul
ti
75%VyFEMAATC
F3S2B
Figure A.6.38 Comparison of Approximations with respect to ‘MULTI’ Values of
Maximum Base Shear at Specified Global Roof Drifts for Frame ‘F3S2B’
0.00
0.50
1.00
1.50
2.00
0.50 1.00 1.50 2.00 2.50 3.00 3.50 4.00
Roof Drift (%)
V ap
prox
. / V
mul
ti
75%VyFEMAATC
F5S2B
Figure A.6.39 Comparison of Approximations with respect to ‘MULTI’ Values of
Maximum Base Shear at Specified Global Roof Drifts for Frame ‘F5S2B’
212

0.00
0.50
1.00
1.50
2.00
0.50 1.00 1.50 2.00 2.50 3.00 3.50 4.00
Roof Drift (%)
V ap
prox
. / V
mul
ti
75%VyFEMAATC
F5S4B
Figure A.6.40 Comparison of Approximations with respect to ‘MULTI’ Values of
Maximum Base Shear at Specified Global Roof Drifts for Frame ‘F5S4B’
0.00
0.50
1.00
1.50
2.00
0.50 1.00 1.50 2.00 2.50 3.00 3.50 4.00
Roof Drift (%)
V ap
prox
. / V
mul
ti
75%VyFEMAATC
F5S7B
Figure A.6.41 Comparison of Approximations with respect to ‘MULTI’ Values of
Maximum Base Shear at Specified Global Roof Drifts for Frame ‘F5S7B’
213

0.00
0.50
1.00
1.50
2.00
0.50 1.00 1.50 2.00 2.50 3.00 3.50 4.00
Roof Drift (%)
V ap
prox
. / V
mul
ti
75%VyFEMAATC
F8S3B
Figure A.6.42 Comparison of Approximations with respect to ‘MULTI’ Values of
Maximum Base Shear at Specified Global Roof Drifts for Frame ‘F8S3B’
214

A.7 DEPENDENCY GRAPHS
215

216
0.00
0.50
1.00
1.50
2.00
0.0
1.0
2.0
3.0
4.0
5.0
6.0
Duc
tility
(μ)
Δ approx. / Δ exact
F2S2
B -
MU
LTI
0.00
0.50
1.00
1.50
2.00
0.0
1.0
2.0
3.0
4.0
5.0
6.0
Duc
tility
(μ)
Δ approx. / Δ exact
F2S2
B -
ATC
0.00
0.50
1.00
1.50
2.00
0.0
1.0
2.0
3.0
4.0
5.0
6.0
Duc
tility
(μ)
Δapprox. / Δexact
F2S2
B -
FEM
A
0.00
0.50
1.00
1.50
2.00
0.0
1.0
2.0
3.0
4.0
5.0
6.0
Duc
tility
(μ)
Δ approx. / Δ exact
F2S2
B -
75%
Vy
Figu
re A
.7.1
Dep
ende
ncy
on D
uctil
ity (F
ram
e ‘F
2S2B
’ – M
axim
um T
op D
ispl
acem
ent)

217
0.00
0.50
1.00
1.50
2.00
0.0
1.0
2.0
3.0
4.0
5.0
6.0
R
Δapprox. / Δexact
F2S2
B -
MU
LTI
0.00
0.50
1.00
1.50
2.00
0.0
1.0
2.0
3.0
4.0
5.0
6.0
R
Δ approx. / Δ exact
F2S2
B -
ATC
0.00
0.50
1.00
1.50
2.00
0.0
1.0
2.0
3.0
4.0
5.0
6.0
R
Δapprox. / Δexact
F2S2
B -
FEM
A
0.00
0.50
1.00
1.50
2.00
0.0
1.0
2.0
3.0
4.0
5.0
6.0
RΔ approx. / Δ exact
F2S2
B -
75%
Vy
Figu
re A
.7.2
Dep
ende
ncy
on S
treng
th R
educ
tion
Fact
or (F
ram
e ‘F
2S2B
’ – M
axim
um T
op D
ispl
acem
ent)
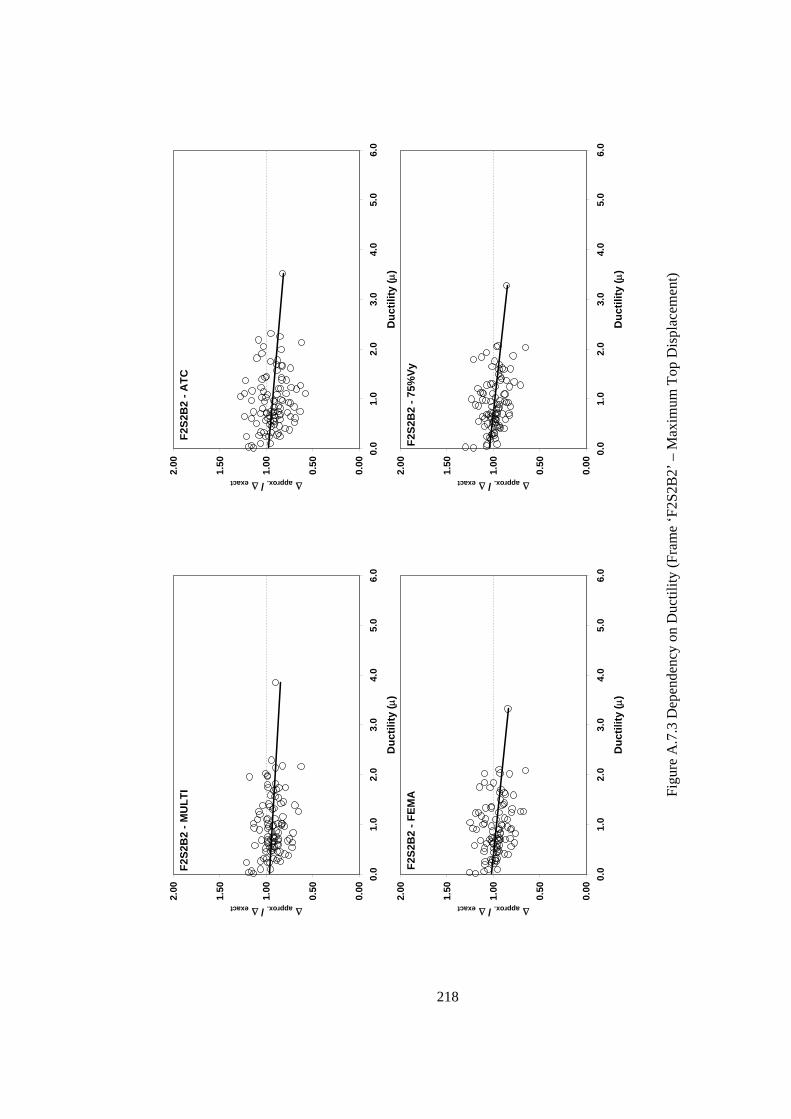
218
0.00
0.50
1.00
1.50
2.00
0.0
1.0
2.0
3.0
4.0
5.0
6.0
Duc
tility
(μ)
Δapprox. / Δexact
F2S2
B2
- MU
LTI
0.00
0.50
1.00
1.50
2.00
0.0
1.0
2.0
3.0
4.0
5.0
6.0
Duc
tility
(μ)
Δ approx. / Δ exact
F2S2
B2
- ATC
0.00
0.50
1.00
1.50
2.00
0.0
1.0
2.0
3.0
4.0
5.0
6.0
Duc
tility
(μ)
Δapprox. / Δexact
F2S2
B2
- FEM
A
0.00
0.50
1.00
1.50
2.00
0.0
1.0
2.0
3.0
4.0
5.0
6.0
Duc
tility
(μ)
Δ approx. / Δ exact
F2S2
B2
- 75%
Vy
Figu
re A
.7.3
Dep
ende
ncy
on D
uctil
ity (F
ram
e ‘F
2S2B
2’ –
Max
imum
Top
Dis
plac
emen
t)
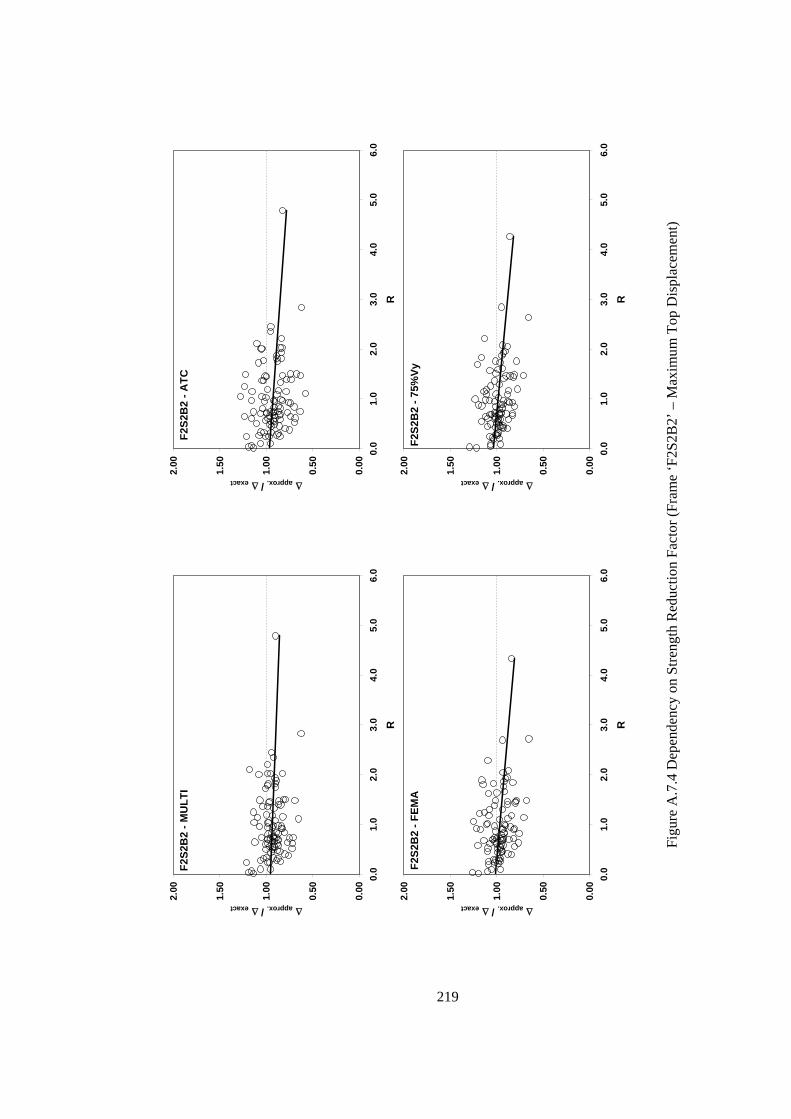
219
0.00
0.50
1.00
1.50
2.00
0.0
1.0
2.0
3.0
4.0
5.0
6.0
R
Δapprox. / Δexact
F2S2
B2
- MU
LTI
0.00
0.50
1.00
1.50
2.00
0.0
1.0
2.0
3.0
4.0
5.0
6.0
R
Δ approx. / Δ exact
F2S2
B2
- ATC
0.00
0.50
1.00
1.50
2.00
0.0
1.0
2.0
3.0
4.0
5.0
6.0
R
Δapprox. / Δexact
F2S2
B2
- FEM
A
0.00
0.50
1.00
1.50
2.00
0.0
1.0
2.0
3.0
4.0
5.0
6.0
RΔ approx. / Δ exact
F2S2
B2
- 75%
Vy
Figu
re A
.7.4
Dep
ende
ncy
on S
treng
th R
educ
tion
Fact
or (F
ram
e ‘F
2S2B
2’ –
Max
imum
Top
Dis
plac
emen
t)

220
0.00
0.50
1.00
1.50
2.00
0.0
1.0
2.0
3.0
4.0
5.0
6.0
Duc
tility
(μ)
Δapprox. / Δexact
F3S2
B -
MU
LTI
0.00
0.50
1.00
1.50
2.00
0.0
1.0
2.0
3.0
4.0
5.0
6.0
Duc
tility
(μ)
Δ approx. / Δ exact
F3S2
B -
ATC
0.00
0.50
1.00
1.50
2.00
0.0
1.0
2.0
3.0
4.0
5.0
6.0
Duc
tility
(μ)
Δapprox. / Δ exact
F3S2
B -
FEM
A
0.00
0.50
1.00
1.50
2.00
0.0
1.0
2.0
3.0
4.0
5.0
6.0
Duc
tility
(μ)
Δ approx. / Δ exact
F3S2
B -
75%
Vy
Figu
re A
.7.5
Dep
ende
ncy
on D
uctil
ity (F
ram
e ‘F
3S2B
’ – M
axim
um T
op D
ispl
acem
ent)

221
0.00
0.50
1.00
1.50
2.00
0.0
1.0
2.0
3.0
4.0
5.0
6.0
R
Δapprox. / Δexact
F3S2
B -
MU
LTI
0.00
0.50
1.00
1.50
2.00
0.0
1.0
2.0
3.0
4.0
5.0
6.0
R
Δ approx. / Δ exact
F3S2
B -
ATC
0.00
0.50
1.00
1.50
2.00
0.0
1.0
2.0
3.0
4.0
5.0
6.0
R
Δapprox. / Δexact
F3S2
B -
FEM
A
0.00
0.50
1.00
1.50
2.00
0.0
1.0
2.0
3.0
4.0
5.0
6.0
RΔ approx. / Δ exact
F3S2
B -
75%
Vy
Figu
re A
.7.6
Dep
ende
ncy
on S
treng
th R
educ
tion
Fact
or (F
ram
e ‘F
3S2B
’ – M
axim
um T
op D
ispl
acem
ent)
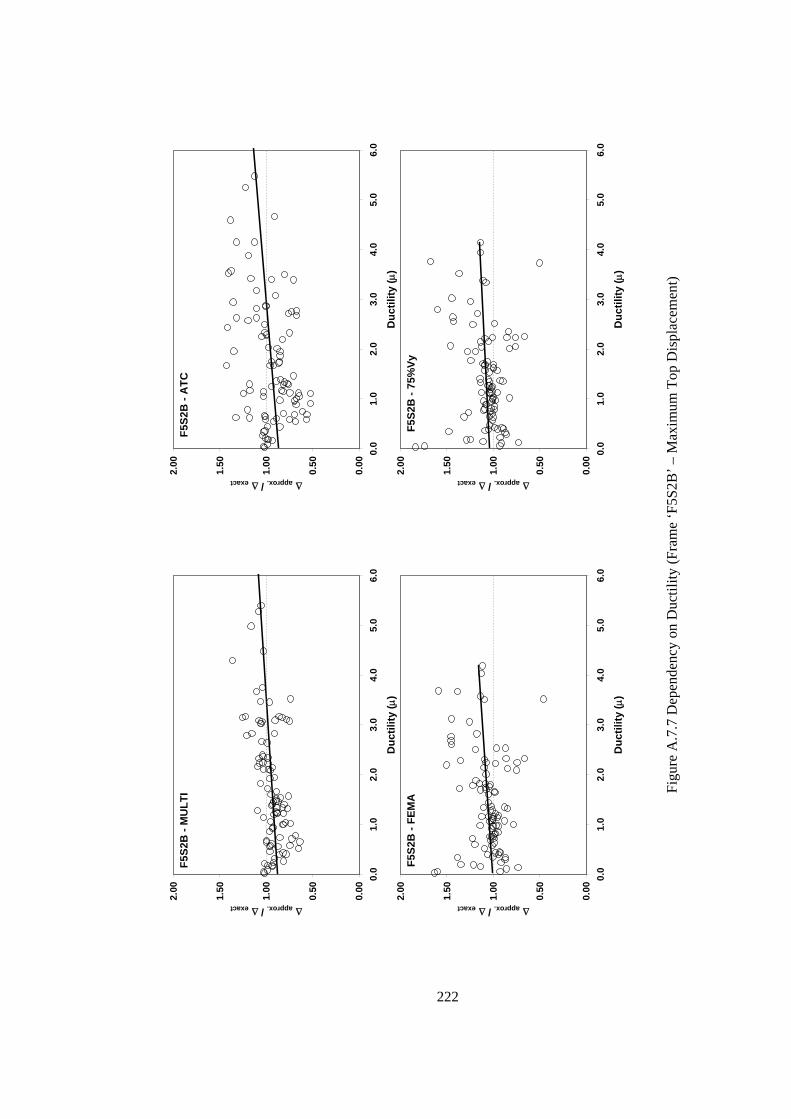
222
0.00
0.50
1.00
1.50
2.00
0.0
1.0
2.0
3.0
4.0
5.0
6.0
Duc
tility
(μ)
Δapprox. / Δexact
F5S2
B -
MU
LTI
0.00
0.50
1.00
1.50
2.00
0.0
1.0
2.0
3.0
4.0
5.0
6.0
Duc
tility
(μ)
Δ approx. / Δ exact
F5S2
B -
ATC
0.00
0.50
1.00
1.50
2.00
0.0
1.0
2.0
3.0
4.0
5.0
6.0
Duc
tility
(μ)
Δapprox. / Δexact
F5S2
B -
FEM
A
0.00
0.50
1.00
1.50
2.00
0.0
1.0
2.0
3.0
4.0
5.0
6.0
Duc
tility
(μ)
Δ approx. / Δ exact
F5S2
B -
75%
Vy
Figu
re A
.7.7
Dep
ende
ncy
on D
uctil
ity (F
ram
e ‘F
5S2B
’ – M
axim
um T
op D
ispl
acem
ent)

223
0.00
0.50
1.00
1.50
2.00
0.0
1.0
2.0
3.0
4.0
5.0
6.0
R
Δapprox. / Δexact
F5S2
B -
MU
LTI
0.00
0.50
1.00
1.50
2.00
0.0
1.0
2.0
3.0
4.0
5.0
6.0
R
Δ approx. / Δ exact
F5S2
B -
ATC
0.00
0.50
1.00
1.50
2.00
0.0
1.0
2.0
3.0
4.0
5.0
6.0
R
Δapprox. / Δ exact
F5S2
B -
FEM
A
0.00
0.50
1.00
1.50
2.00
0.0
1.0
2.0
3.0
4.0
5.0
6.0
RΔ approx. / Δ exact
F5S2
B -
75%
Vy
Figu
re A
.7.8
Dep
ende
ncy
on S
treng
th R
educ
tion
Fact
or (F
ram
e ‘F
5S2B
’ – M
axim
um T
op D
ispl
acem
ent)

224
0.00
0.50
1.00
1.50
2.00
0.0
1.0
2.0
3.0
4.0
5.0
6.0
Duc
tility
(μ)
Δapprox. / Δexact
F5S4
B -
MU
LTI
0.00
0.50
1.00
1.50
2.00
0.0
1.0
2.0
3.0
4.0
5.0
6.0
Duc
tility
(μ)
Δ approx. / Δ exact
F5S4
B -
ATC
0.00
0.50
1.00
1.50
2.00
0.0
1.0
2.0
3.0
4.0
5.0
6.0
Duc
tility
(μ)
Δapprox. / Δexact
F5S4
B -
FEM
A
0.00
0.50
1.00
1.50
2.00
0.0
1.0
2.0
3.0
4.0
5.0
6.0
Duc
tility
(μ)
Δ approx. / Δ exact
F5S4
B -
75%
Vy
Figu
re A
.7.9
Dep
ende
ncy
on D
uctil
ity (F
ram
e ‘F
5S4B
’ – M
axim
um T
op D
ispl
acem
ent)
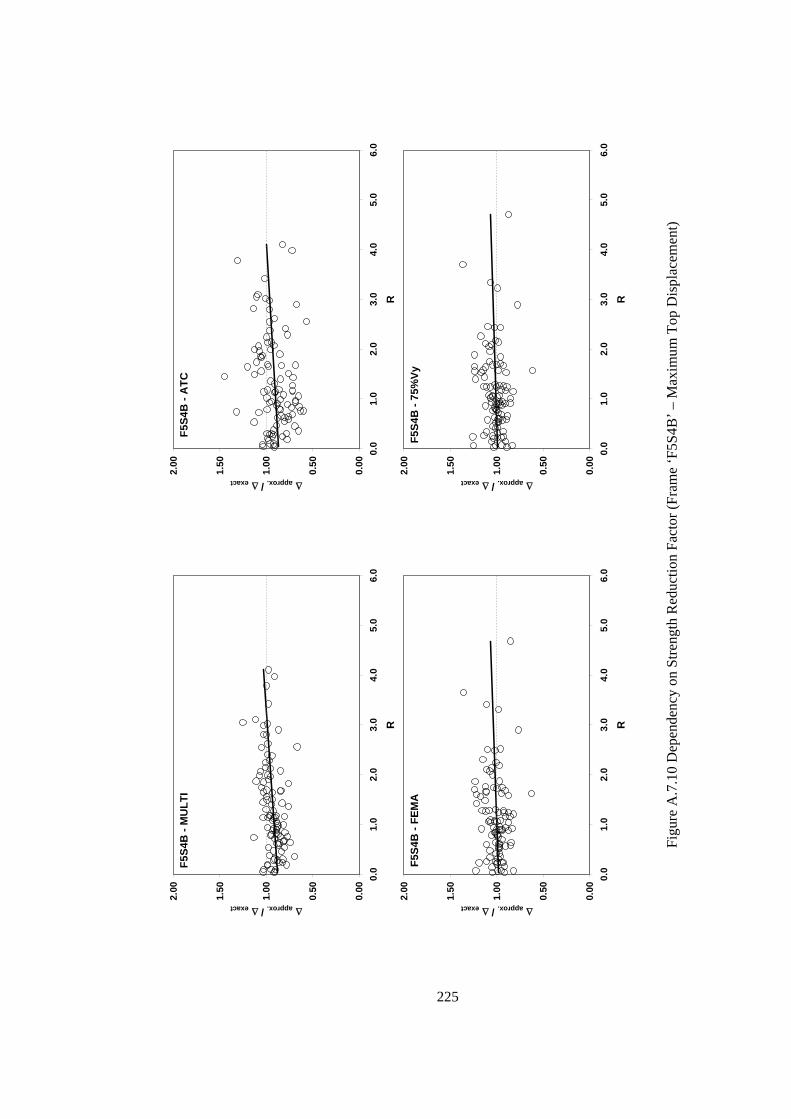
225
0.00
0.50
1.00
1.50
2.00
0.0
1.0
2.0
3.0
4.0
5.0
6.0
R
Δapprox. / Δexact
F5S4
B -
MU
LTI
0.00
0.50
1.00
1.50
2.00
0.0
1.0
2.0
3.0
4.0
5.0
6.0
R
Δ approx. / Δ exact
F5S4
B -
ATC
0.00
0.50
1.00
1.50
2.00
0.0
1.0
2.0
3.0
4.0
5.0
6.0
R
Δapprox. / Δexact
F5S4
B -
FEM
A
0.00
0.50
1.00
1.50
2.00
0.0
1.0
2.0
3.0
4.0
5.0
6.0
RΔ approx. / Δ exact
F5S4
B -
75%
Vy
Figu
re A
.7.1
0 D
epen
denc
y on
Stre
ngth
Red
uctio
n Fa
ctor
(Fra
me
‘F5S
4B’ –
Max
imum
Top
Dis
plac
emen
t)
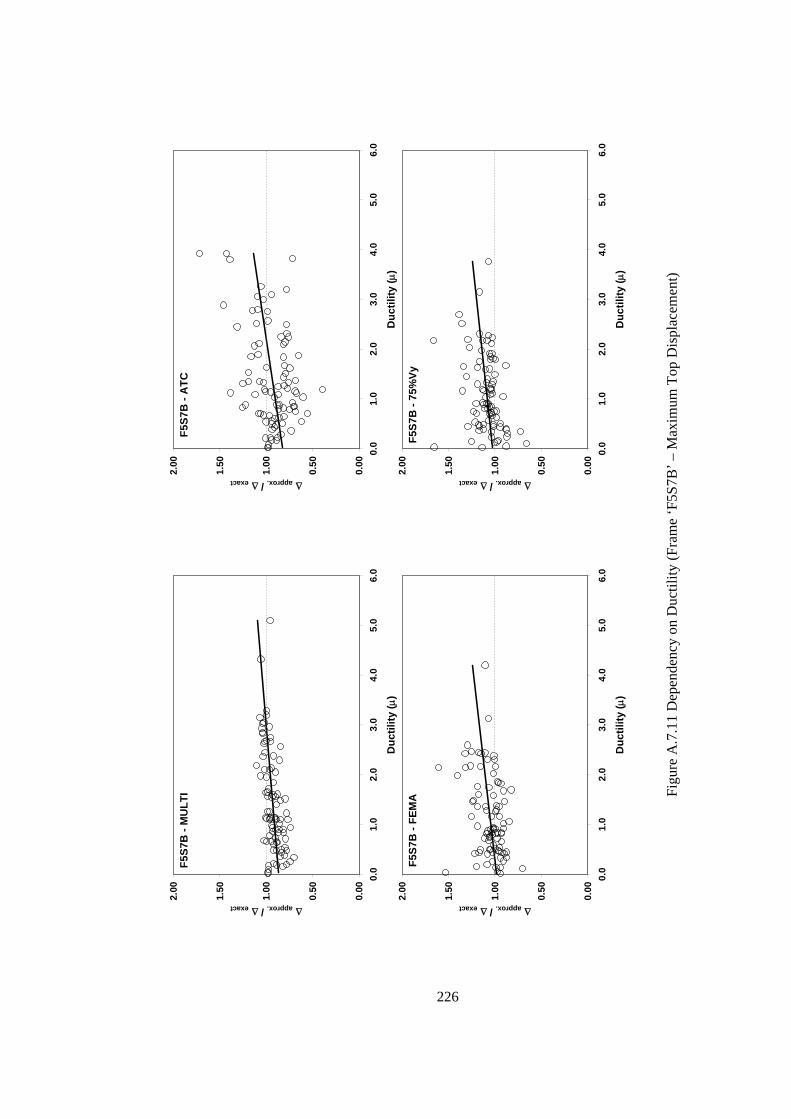
226
0.00
0.50
1.00
1.50
2.00
0.0
1.0
2.0
3.0
4.0
5.0
6.0
Duc
tility
(μ)
Δapprox. / Δexact
F5S7
B -
MU
LTI
0.00
0.50
1.00
1.50
2.00
0.0
1.0
2.0
3.0
4.0
5.0
6.0
Duc
tility
(μ)
Δ approx. / Δ exact
F5S7
B -
ATC
0.00
0.50
1.00
1.50
2.00
0.0
1.0
2.0
3.0
4.0
5.0
6.0
Duc
tility
(μ)
Δapprox. / Δ exact
F5S7
B -
FEM
A
0.00
0.50
1.00
1.50
2.00
0.0
1.0
2.0
3.0
4.0
5.0
6.0
Duc
tility
(μ)
Δ approx. / Δ exact
F5S7
B -
75%
Vy
Figu
re A
.7.1
1 D
epen
denc
y on
Duc
tility
(Fra
me
‘F5S
7B’ –
Max
imum
Top
Dis
plac
emen
t)
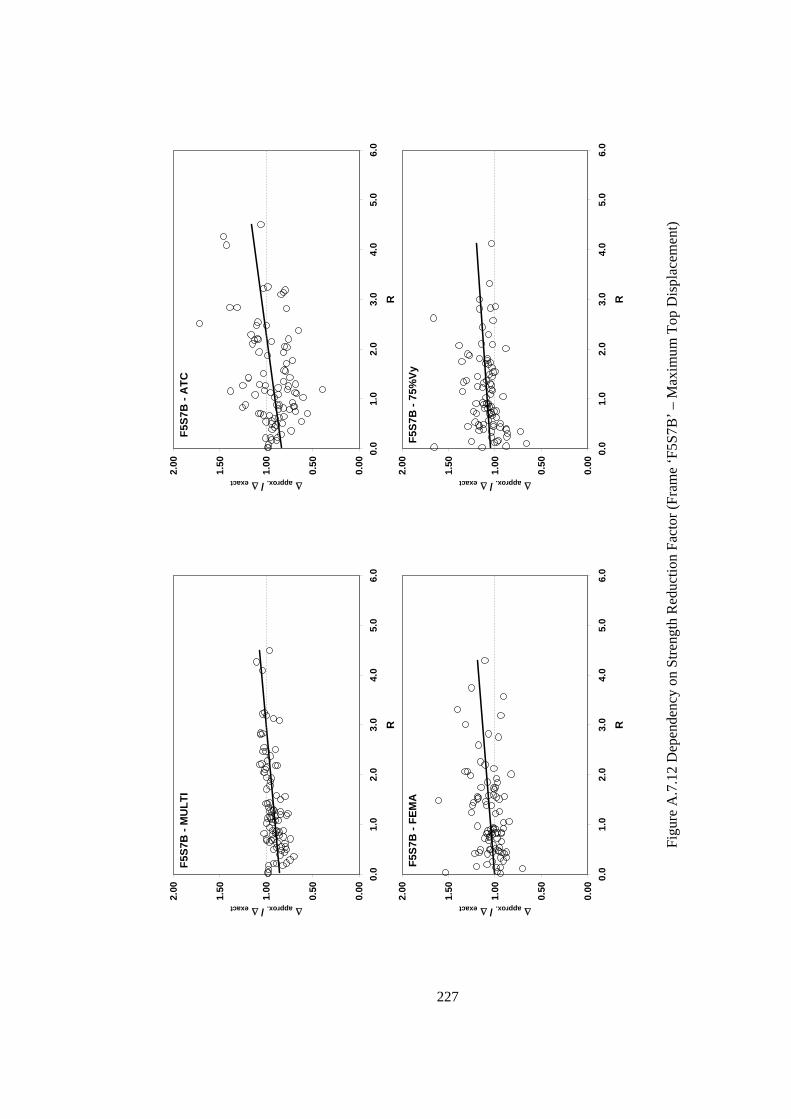
227
0.00
0.50
1.00
1.50
2.00
0.0
1.0
2.0
3.0
4.0
5.0
6.0
R
Δapprox. / Δexact
F5S7
B -
MU
LTI
0.00
0.50
1.00
1.50
2.00
0.0
1.0
2.0
3.0
4.0
5.0
6.0
R
Δ approx. / Δ exact
F5S7
B -
ATC
0.00
0.50
1.00
1.50
2.00
0.0
1.0
2.0
3.0
4.0
5.0
6.0
R
Δapprox. / Δ exact
F5S7
B -
FEM
A
0.00
0.50
1.00
1.50
2.00
0.0
1.0
2.0
3.0
4.0
5.0
6.0
RΔ approx. / Δ exact
F5S7
B -
75%
Vy
Figu
re A
.7.1
2 D
epen
denc
y on
Stre
ngth
Red
uctio
n Fa
ctor
(Fra
me
‘F5S
7B’ –
Max
imum
Top
Dis
plac
emen
t)

228
0.00
0.50
1.00
1.50
2.00
0.0
1.0
2.0
3.0
4.0
5.0
6.0
Duc
tility
(μ)
Δapprox. / Δexact
F8S3
B -
MU
LTI
0.00
0.50
1.00
1.50
2.00
0.0
1.0
2.0
3.0
4.0
5.0
6.0
Duc
tility
(μ)
Δ approx. / Δ exact
F8S3
B -
ATC
0.00
0.50
1.00
1.50
2.00
0.0
1.0
2.0
3.0
4.0
5.0
6.0
Duc
tility
(μ)
Δapprox. / Δexact
F8S3
B -
FEM
A
0.00
0.50
1.00
1.50
2.00
0.0
1.0
2.0
3.0
4.0
5.0
6.0
Duc
tility
(μ)
Δ approx. / Δ exact
F8S3
B -
75%
Vy
Figu
re A
.7.1
3 D
epen
denc
y on
Duc
tility
(Fra
me
‘F8S
3B’ –
Max
imum
Top
Dis
plac
emen
t)

229
0.00
0.50
1.00
1.50
2.00
0.0
1.0
2.0
3.0
4.0
5.0
6.0
R
Δapprox. / Δexact
F8S3
B -
MU
LTI
0.00
0.50
1.00
1.50
2.00
0.0
1.0
2.0
3.0
4.0
5.0
6.0
R
Δ approx. / Δ exact
F8S3
B -
ATC
0.00
0.50
1.00
1.50
2.00
0.0
1.0
2.0
3.0
4.0
5.0
6.0
R
Δapprox. / Δexact
F8S3
B -
FEM
A
0.00
0.50
1.00
1.50
2.00
0.0
1.0
2.0
3.0
4.0
5.0
6.0
RΔ approx. / Δ exact
F8S3
B -
75%
Vy
Figu
re A
.7.1
4 D
epen
denc
y on
Stre
ngth
Red
uctio
n Fa
ctor
(Fra
me
‘F8S
3B’ –
Max
imum
Top
Dis
plac
emen
t)
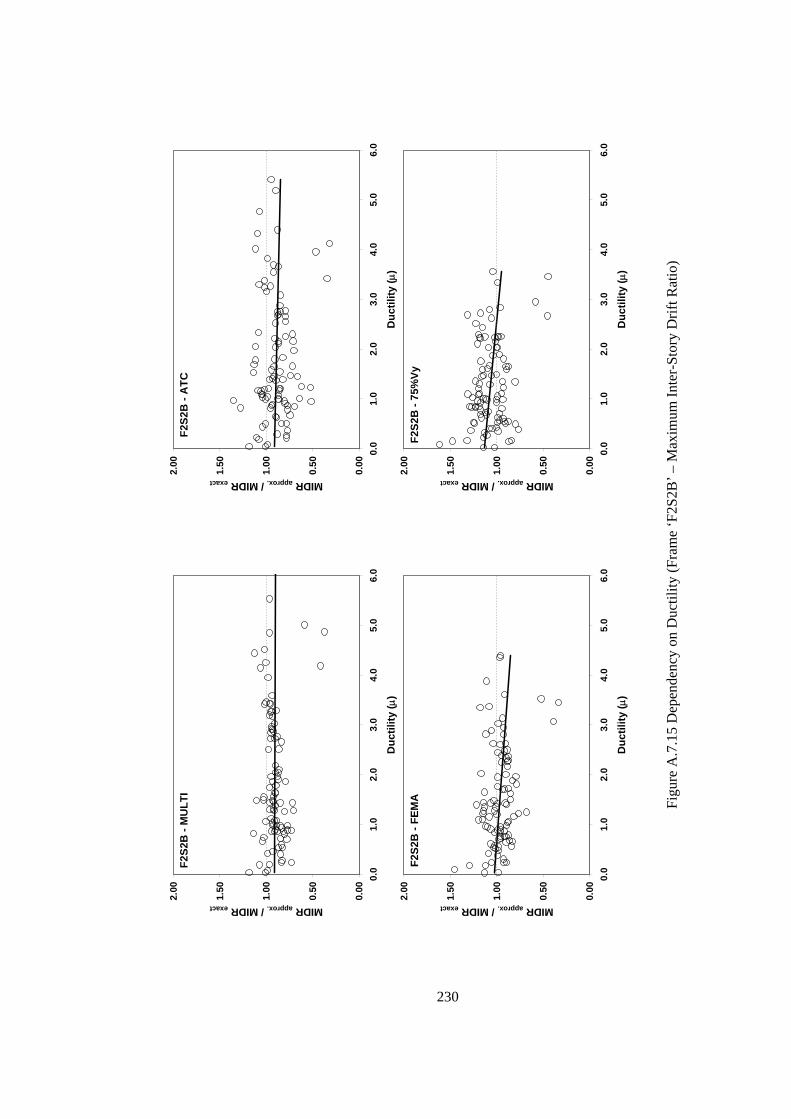
230
0.00
0.50
1.00
1.50
2.00
0.0
1.0
2.0
3.0
4.0
5.0
6.0
Duc
tility
(μ)
MIDR approx. / MIDR exact
F2S2
B -
MU
LTI
0.00
0.50
1.00
1.50
2.00
0.0
1.0
2.0
3.0
4.0
5.0
6.0
Duc
tility
(μ)
MIDR approx. / MIDR exact
F2S2
B -
ATC
0.00
0.50
1.00
1.50
2.00
0.0
1.0
2.0
3.0
4.0
5.0
6.0
Duc
tility
(μ)
MIDR approx. / MIDR exact
F2S2
B -
FEM
A
0.00
0.50
1.00
1.50
2.00
0.0
1.0
2.0
3.0
4.0
5.0
6.0
Duc
tility
(μ)
MIDR approx. / MIDR exact
F2S2
B -
75%
Vy
Figu
re A
.7.1
5 D
epen
denc
y on
Duc
tility
(Fra
me
‘F2S
2B’ –
Max
imum
Inte
r-St
ory
Drif
t Rat
io)
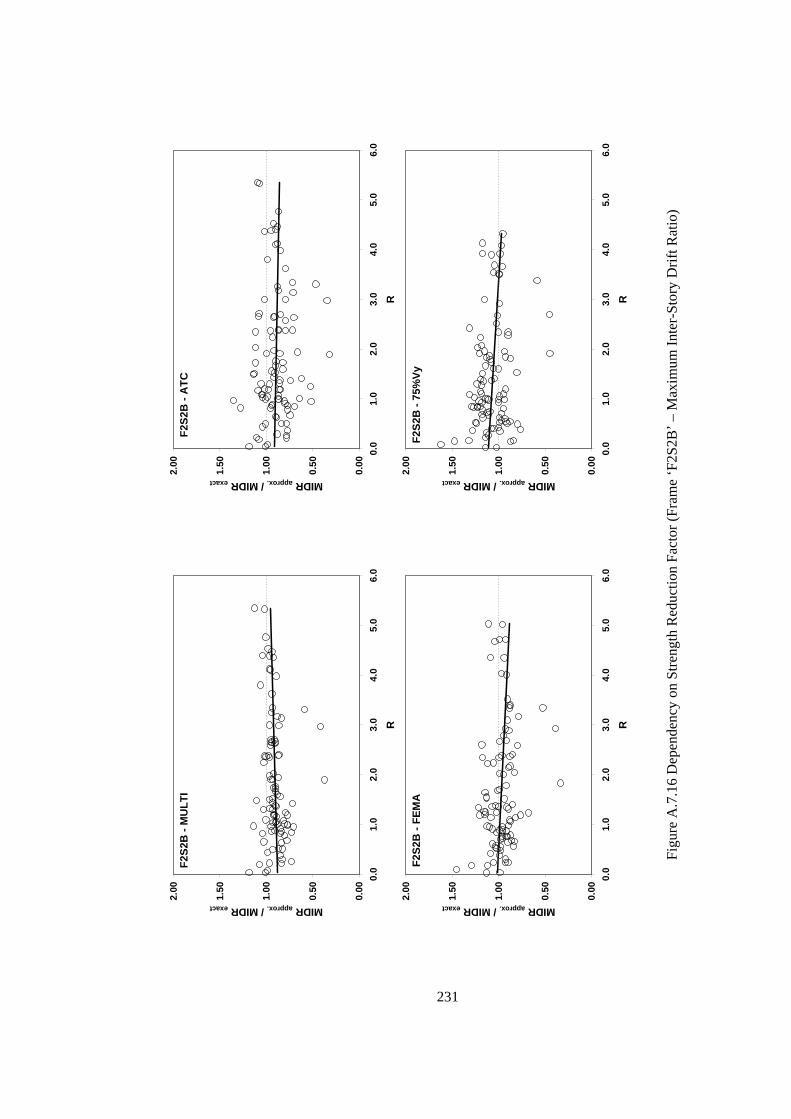
231
0.00
0.50
1.00
1.50
2.00
0.0
1.0
2.0
3.0
4.0
5.0
6.0
R
MIDR approx. / MIDR exact
F2S2
B -
MU
LTI
0.00
0.50
1.00
1.50
2.00
0.0
1.0
2.0
3.0
4.0
5.0
6.0
R
MIDR approx. / MIDR exact
F2S2
B -
ATC
0.00
0.50
1.00
1.50
2.00
0.0
1.0
2.0
3.0
4.0
5.0
6.0
R
MIDR approx. / MIDR exact
F2S2
B -
FEM
A
0.00
0.50
1.00
1.50
2.00
0.0
1.0
2.0
3.0
4.0
5.0
6.0
RMIDR approx. / MIDR exact
F2S2
B -
75%
Vy
Figu
re A
.7.1
6 D
epen
denc
y on
Stre
ngth
Red
uctio
n Fa
ctor
(Fra
me
‘F2S
2B’ –
Max
imum
Inte
r-St
ory
Drif
t Rat
io)

232
0.00
0.50
1.00
1.50
2.00
0.0
1.0
2.0
3.0
4.0
5.0
6.0
Duc
tility
(μ)
MIDR approx. / MIDR exact
F2S2
B2
- MU
LTI
0.00
0.50
1.00
1.50
2.00
0.0
1.0
2.0
3.0
4.0
5.0
6.0
Duc
tility
(μ)
MIDR approx. / MIDR exact
F2S2
B2
- ATC
0.00
0.50
1.00
1.50
2.00
0.0
1.0
2.0
3.0
4.0
5.0
6.0
Duc
tility
(μ)
MIDR approx. / MIDR exact
F2S2
B2
- FEM
A
0.00
0.50
1.00
1.50
2.00
0.0
1.0
2.0
3.0
4.0
5.0
6.0
Duc
tility
(μ)
MIDR approx. / MIDR exact
F2S2
B2
- 75%
Vy
Figu
re A
.7.1
7 D
epen
denc
y on
Duc
tility
(Fra
me
‘F2S
2B2’
– M
axim
um In
ter-
Stor
y D
rift R
atio
)

233
0.00
0.50
1.00
1.50
2.00
0.0
1.0
2.0
3.0
4.0
5.0
6.0
R
MIDR approx. / MIDR exact
F2S2
B2
- MU
LTI
0.00
0.50
1.00
1.50
2.00
0.0
1.0
2.0
3.0
4.0
5.0
6.0
R
MIDR approx. / MIDR exact
F2S2
B2
- ATC
0.00
0.50
1.00
1.50
2.00
0.0
1.0
2.0
3.0
4.0
5.0
6.0
R
MIDR approx. / MIDR exact
F2S2
B2
- FEM
A
0.00
0.50
1.00
1.50
2.00
0.0
1.0
2.0
3.0
4.0
5.0
6.0
RMIDR approx. / MIDR exact
F2S2
B2
- 75%
Vy
Figu
re A
.7.1
8 D
epen
denc
y on
Stre
ngth
Red
uctio
n Fa
ctor
(Fra
me
‘F2S
2B2’
– M
axim
um In
ter-
Stor
y D
rift R
atio
)

234
0.00
0.50
1.00
1.50
2.00
0.0
1.0
2.0
3.0
4.0
5.0
6.0
Duc
tility
(μ)
MIDR approx. / MIDR exact
F3S2
B -
MU
LTI
0.00
0.50
1.00
1.50
2.00
0.0
1.0
2.0
3.0
4.0
5.0
6.0
Duc
tility
(μ)
MIDR approx. / MIDR exact
F3S2
B -
ATC
0.00
0.50
1.00
1.50
2.00
0.0
1.0
2.0
3.0
4.0
5.0
6.0
Duc
tility
(μ)
MIDR approx. / MIDR exact
F3S2
B -
FEM
A
0.00
0.50
1.00
1.50
2.00
0.0
1.0
2.0
3.0
4.0
5.0
6.0
Duc
tility
(μ)
MIDR approx. / MIDR exact
F3S2
B -
75%
Vy
Figu
re A
.7.1
9 D
epen
denc
y on
Duc
tility
(Fra
me
‘F3S
2B’ –
Max
imum
Inte
r-St
ory
Drif
t Rat
io)
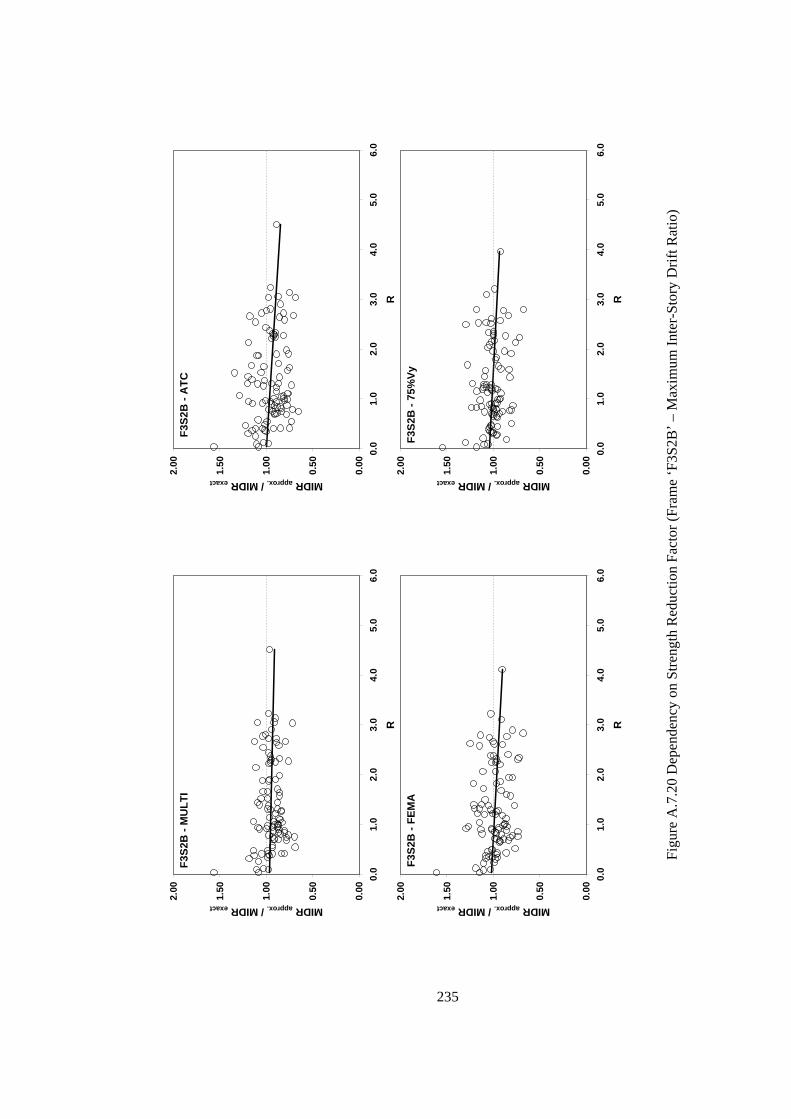
235
0.00
0.50
1.00
1.50
2.00
0.0
1.0
2.0
3.0
4.0
5.0
6.0
R
MIDR approx. / MIDR exact
F3S2
B -
MU
LTI
0.00
0.50
1.00
1.50
2.00
0.0
1.0
2.0
3.0
4.0
5.0
6.0
R
MIDR approx. / MIDR exact
F3S2
B -
ATC
0.00
0.50
1.00
1.50
2.00
0.0
1.0
2.0
3.0
4.0
5.0
6.0
R
MIDR approx. / MIDR exact
F3S2
B -
FEM
A
0.00
0.50
1.00
1.50
2.00
0.0
1.0
2.0
3.0
4.0
5.0
6.0
RMIDR approx. / MIDR exact
F3S2
B -
75%
Vy
Figu
re A
.7.2
0 D
epen
denc
y on
Stre
ngth
Red
uctio
n Fa
ctor
(Fra
me
‘F3S
2B’ –
Max
imum
Inte
r-St
ory
Drif
t Rat
io)
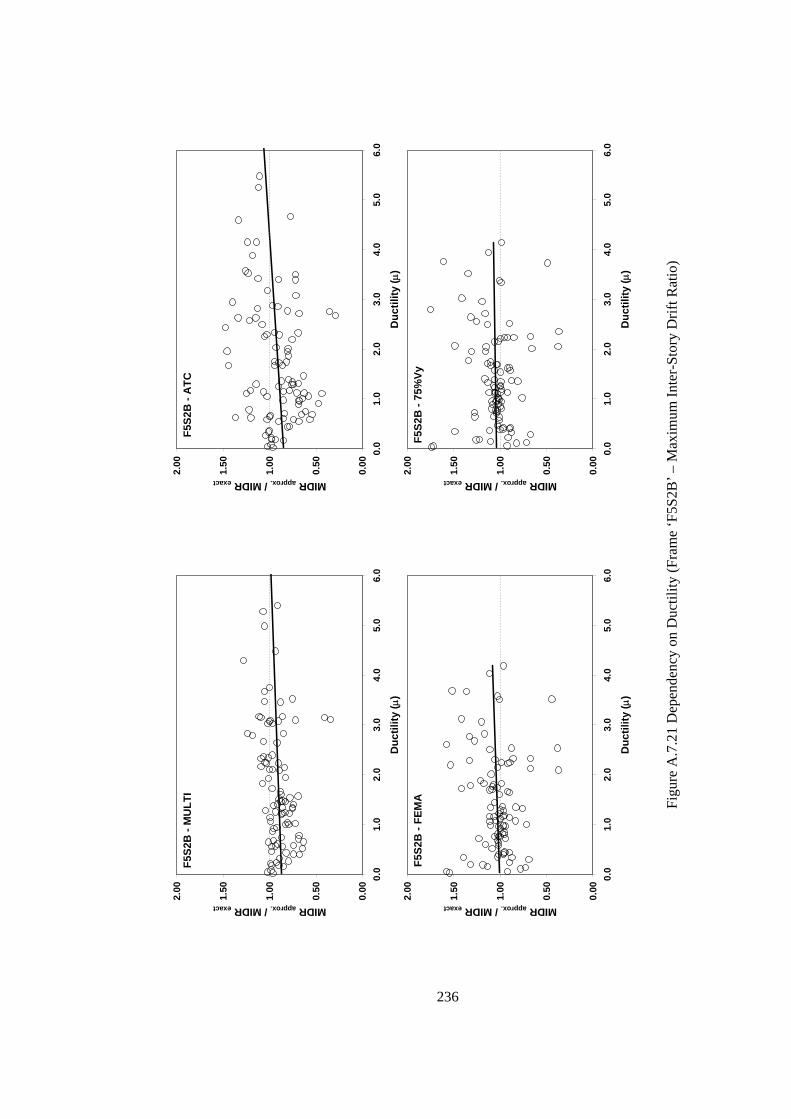
236
0.00
0.50
1.00
1.50
2.00
0.0
1.0
2.0
3.0
4.0
5.0
6.0
Duc
tility
(μ)
MIDR approx. / MIDR exact
F5S2
B -
MU
LTI
0.00
0.50
1.00
1.50
2.00
0.0
1.0
2.0
3.0
4.0
5.0
6.0
Duc
tility
(μ)
MIDR approx. / MIDR exact
F5S2
B -
ATC
0.00
0.50
1.00
1.50
2.00
0.0
1.0
2.0
3.0
4.0
5.0
6.0
Duc
tility
(μ)
MIDR approx. / MIDR exact
F5S2
B -
FEM
A
0.00
0.50
1.00
1.50
2.00
0.0
1.0
2.0
3.0
4.0
5.0
6.0
Duc
tility
(μ)
MIDR approx. / MIDR exact
F5S2
B -
75%
Vy
Figu
re A
.7.2
1 D
epen
denc
y on
Duc
tility
(Fra
me
‘F5S
2B’ –
Max
imum
Inte
r-St
ory
Drif
t Rat
io)

237
0.00
0.50
1.00
1.50
2.00
0.0
1.0
2.0
3.0
4.0
5.0
6.0
R
MIDR approx. / MIDR exact
F5S2
B -
MU
LTI
0.00
0.50
1.00
1.50
2.00
0.0
1.0
2.0
3.0
4.0
5.0
6.0
R
MIDR approx. / MIDR exact
F5S2
B -
ATC
0.00
0.50
1.00
1.50
2.00
0.0
1.0
2.0
3.0
4.0
5.0
6.0
R
MIDR approx. / MIDR exact
F5S2
B -
FEM
A
0.00
0.50
1.00
1.50
2.00
0.0
1.0
2.0
3.0
4.0
5.0
6.0
RMIDR approx. / MIDR exact
F5S2
B -
75%
Vy
Figu
re A
.7.2
2 D
epen
denc
y on
Stre
ngth
Red
uctio
n Fa
ctor
(Fra
me
‘F5S
2B’ –
Max
imum
Inte
r-St
ory
Drif
t Rat
io)
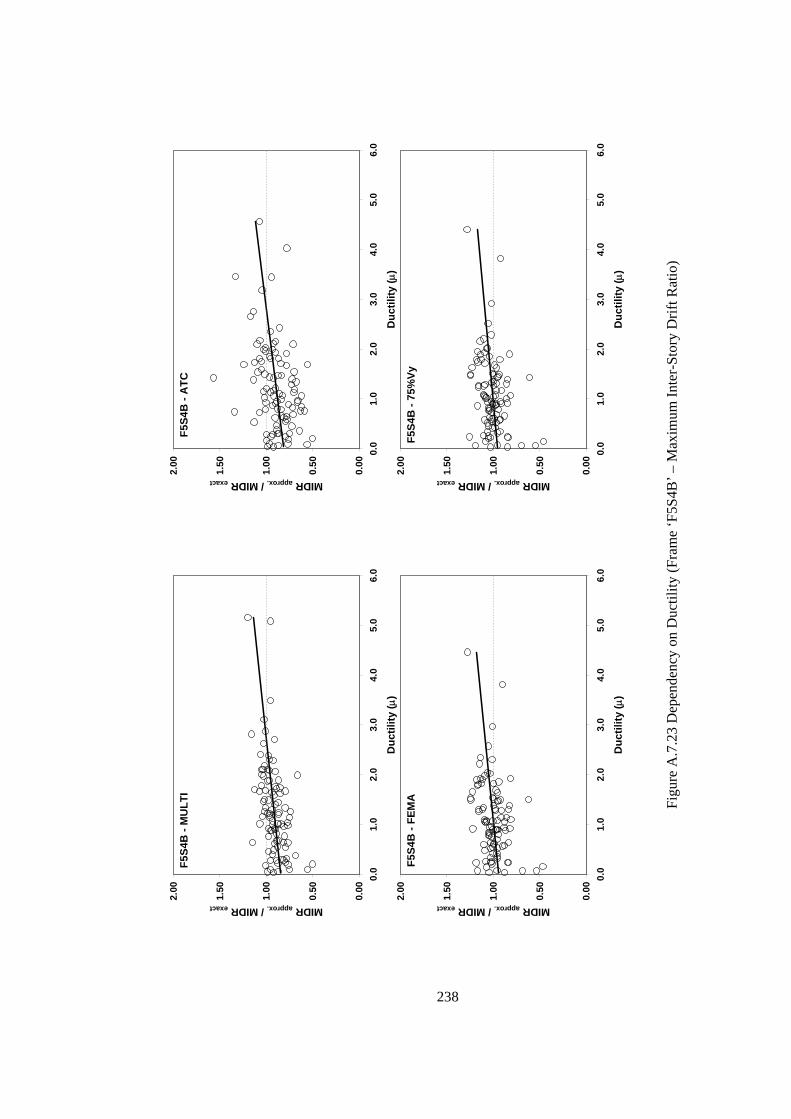
238
0.00
0.50
1.00
1.50
2.00
0.0
1.0
2.0
3.0
4.0
5.0
6.0
Duc
tility
(μ)
MIDR approx. / MIDR exact
F5S4
B -
MU
LTI
0.00
0.50
1.00
1.50
2.00
0.0
1.0
2.0
3.0
4.0
5.0
6.0
Duc
tility
(μ)
MIDR approx. / MIDR exact
F5S4
B -
ATC
0.00
0.50
1.00
1.50
2.00
0.0
1.0
2.0
3.0
4.0
5.0
6.0
Duc
tility
(μ)
MIDR approx. / MIDR exact
F5S4
B -
FEM
A
0.00
0.50
1.00
1.50
2.00
0.0
1.0
2.0
3.0
4.0
5.0
6.0
Duc
tility
(μ)
MIDR approx. / MIDR exact
F5S4
B -
75%
Vy
Figu
re A
.7.2
3 D
epen
denc
y on
Duc
tility
(Fra
me
‘F5S
4B’ –
Max
imum
Inte
r-St
ory
Drif
t Rat
io)

239
0.00
0.50
1.00
1.50
2.00
0.0
1.0
2.0
3.0
4.0
5.0
6.0
R
MIDR approx. / MIDR exact
F5S4
B -
MU
LTI
0.00
0.50
1.00
1.50
2.00
0.0
1.0
2.0
3.0
4.0
5.0
6.0
R
MIDR approx. / MIDR exact
F5S4
B -
ATC
0.00
0.50
1.00
1.50
2.00
0.0
1.0
2.0
3.0
4.0
5.0
6.0
R
MIDR approx. / MIDR exact
F5S4
B -
FEM
A
0.00
0.50
1.00
1.50
2.00
0.0
1.0
2.0
3.0
4.0
5.0
6.0
RMIDR approx. / MIDR exact
F5S4
B -
75%
Vy
Figu
re A
.7.2
4 D
epen
denc
y on
Stre
ngth
Red
uctio
n Fa
ctor
(Fra
me
‘F5S
4B’ –
Max
imum
Inte
r-St
ory
Drif
t Rat
io)
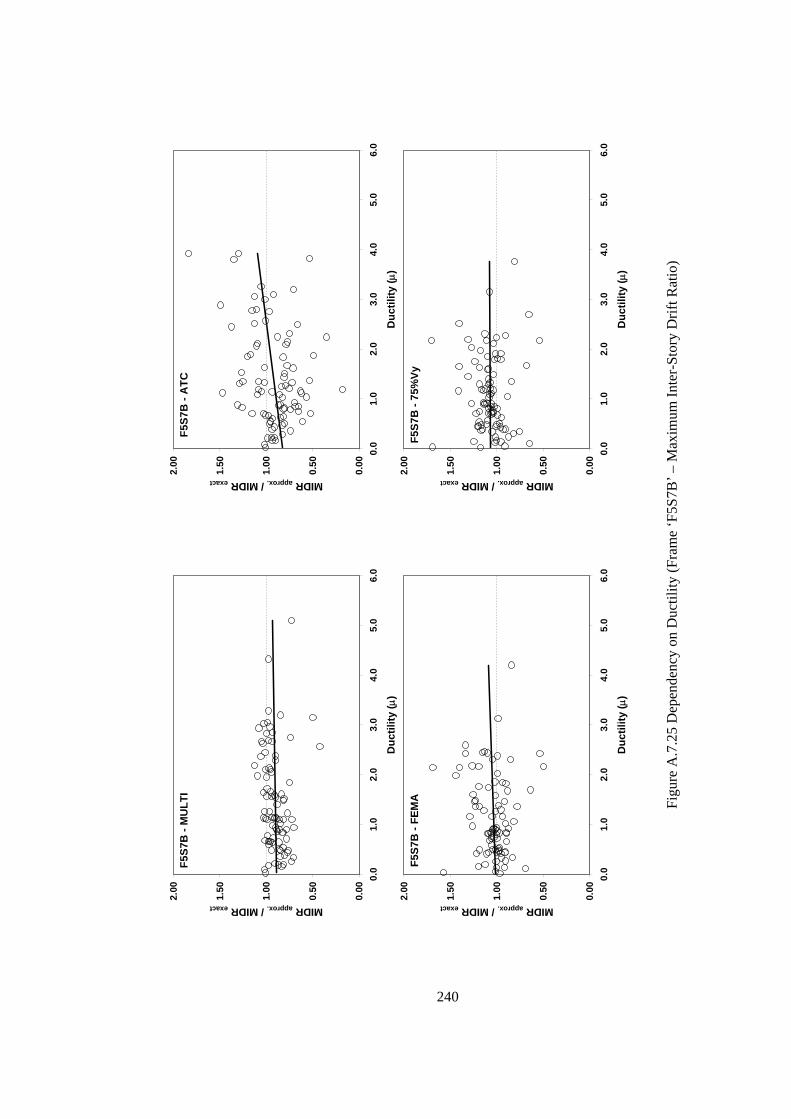
240
0.00
0.50
1.00
1.50
2.00
0.0
1.0
2.0
3.0
4.0
5.0
6.0
Duc
tility
(μ)
MIDR approx. / MIDR exact
F5S7
B -
MU
LTI
0.00
0.50
1.00
1.50
2.00
0.0
1.0
2.0
3.0
4.0
5.0
6.0
Duc
tility
(μ)
MIDR approx. / MIDR exact
F5S7
B -
ATC
0.00
0.50
1.00
1.50
2.00
0.0
1.0
2.0
3.0
4.0
5.0
6.0
Duc
tility
(μ)
MIDR approx. / MIDR exact
F5S7
B -
FEM
A
0.00
0.50
1.00
1.50
2.00
0.0
1.0
2.0
3.0
4.0
5.0
6.0
Duc
tility
(μ)
MIDR approx. / MIDR exact
F5S7
B -
75%
Vy
Figu
re A
.7.2
5 D
epen
denc
y on
Duc
tility
(Fra
me
‘F5S
7B’ –
Max
imum
Inte
r-St
ory
Drif
t Rat
io)

241
0.00
0.50
1.00
1.50
2.00
0.0
1.0
2.0
3.0
4.0
5.0
6.0
R
MIDR approx. / MIDR exact
F5S7
B -
MU
LTI
0.00
0.50
1.00
1.50
2.00
0.0
1.0
2.0
3.0
4.0
5.0
6.0
R
MIDR approx. / MIDR exact
F5S7
B -
ATC
0.00
0.50
1.00
1.50
2.00
0.0
1.0
2.0
3.0
4.0
5.0
6.0
R
MIDR approx. / MIDR exact
F5S7
B -
FEM
A
0.00
0.50
1.00
1.50
2.00
0.0
1.0
2.0
3.0
4.0
5.0
6.0
RMIDR approx. / MIDR exact
F5S7
B -
75%
Vy
Figu
re A
.7.2
6 D
epen
denc
y on
Stre
ngth
Red
uctio
n Fa
ctor
(Fra
me
‘F5S
7B’ –
Max
imum
Inte
r-St
ory
Drif
t Rat
io)
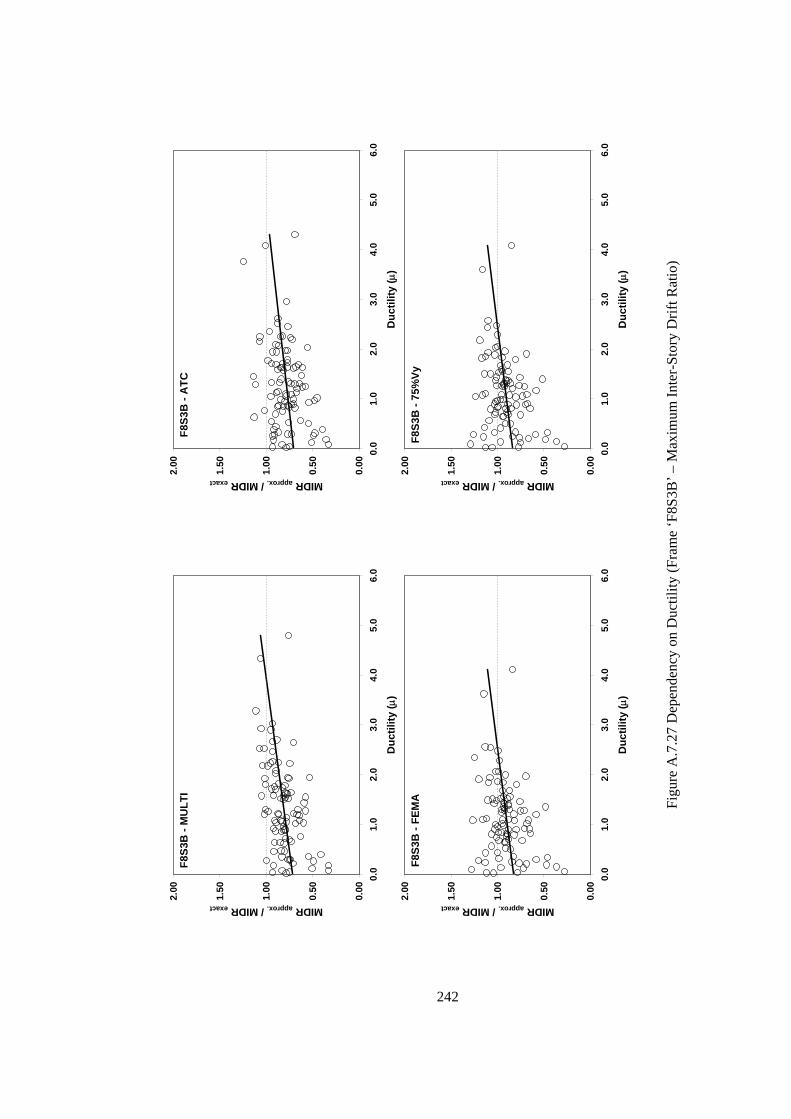
242
0.00
0.50
1.00
1.50
2.00
0.0
1.0
2.0
3.0
4.0
5.0
6.0
Duc
tility
(μ)
MIDR approx. / MIDR exact
F8S3
B -
MU
LTI
0.00
0.50
1.00
1.50
2.00
0.0
1.0
2.0
3.0
4.0
5.0
6.0
Duc
tility
(μ)
MIDR approx. / MIDR exact
F8S3
B -
ATC
0.00
0.50
1.00
1.50
2.00
0.0
1.0
2.0
3.0
4.0
5.0
6.0
Duc
tility
(μ)
MIDR approx. / MIDR exact
F8S3
B -
FEM
A
0.00
0.50
1.00
1.50
2.00
0.0
1.0
2.0
3.0
4.0
5.0
6.0
Duc
tility
(μ)
MIDR approx. / MIDR exact
F8S3
B -
75%
Vy
Figu
re A
.7.2
7 D
epen
denc
y on
Duc
tility
(Fra
me
‘F8S
3B’ –
Max
imum
Inte
r-St
ory
Drif
t Rat
io)

243
0.00
0.50
1.00
1.50
2.00
0.0
1.0
2.0
3.0
4.0
5.0
6.0
R
MIDR approx. / MIDR exact
F8S3
B -
MU
LTI
0.00
0.50
1.00
1.50
2.00
0.0
1.0
2.0
3.0
4.0
5.0
6.0
R
MIDR approx. / MIDR exact
F8S3
B -
ATC
0.00
0.50
1.00
1.50
2.00
0.0
1.0
2.0
3.0
4.0
5.0
6.0
R
MIDR approx. / MIDR exact
F8S3
B -
FEM
A
0.00
0.50
1.00
1.50
2.00
0.0
1.0
2.0
3.0
4.0
5.0
6.0
RMIDR approx. / MIDR exact
F8S3
B -
75%
Vy
Figu
re A
.7.2
8 D
epen
denc
y on
Stre
ngth
Red
uctio
n Fa
ctor
(Fra
me
‘F8S
3B’ –
Max
imum
Inte
r-St
ory
Drif
t Rat
io)

244
0.00
0.50
1.00
1.50
2.00
0.0
1.0
2.0
3.0
4.0
5.0
6.0
Duc
tility
(μ)
V approx. / Vexact
F2S2
B -
MU
LTI
0.00
0.50
1.00
1.50
2.00
0.0
1.0
2.0
3.0
4.0
5.0
6.0
Duc
tility
(μ)
V approx. / V exact
F2S2
B -
ATC
0.00
0.50
1.00
1.50
2.00
0.0
1.0
2.0
3.0
4.0
5.0
6.0
Duc
tility
(μ)
V approx. / V exact
F2S2
B -
FEM
A
0.00
0.50
1.00
1.50
2.00
0.0
1.0
2.0
3.0
4.0
5.0
6.0
Duc
tility
(μ)
V approx. / V exact
F2S2
B -
75%
Vy
Figu
re A
.7.2
9 D
epen
denc
y on
Duc
tility
(Fra
me
‘F2S
2B’ –
Max
imum
Bas
e Sh
ear)
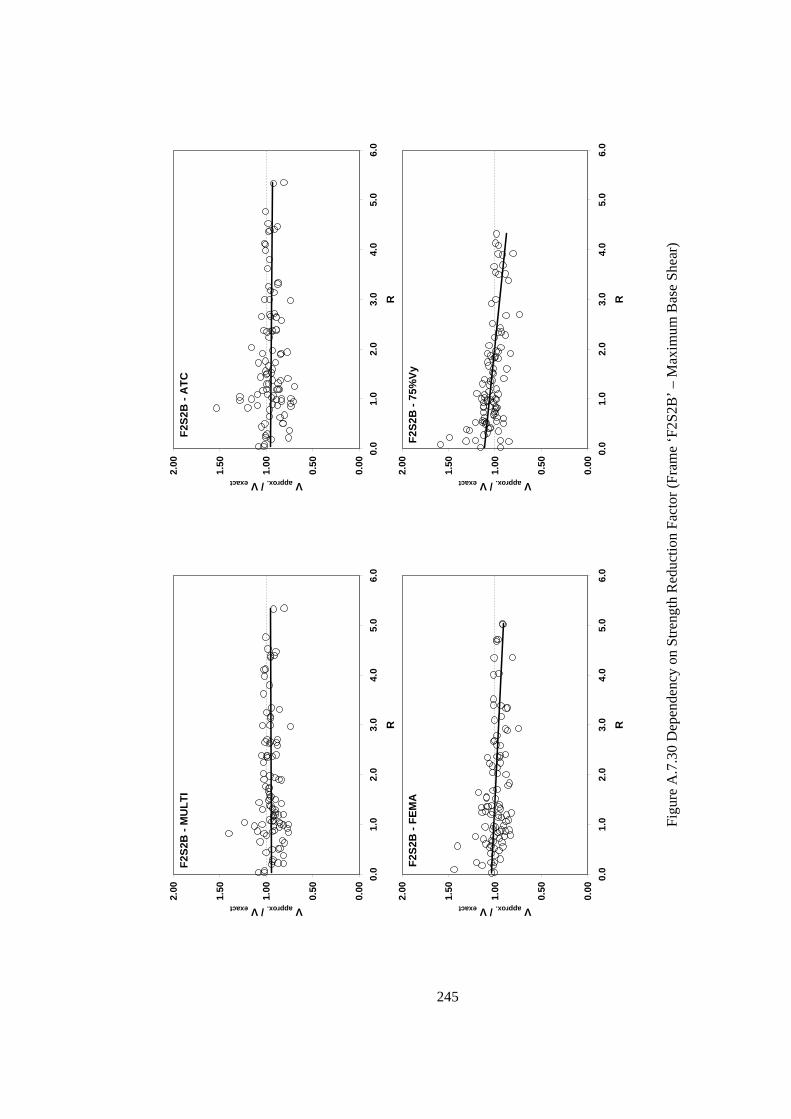
245
0.00
0.50
1.00
1.50
2.00
0.0
1.0
2.0
3.0
4.0
5.0
6.0
R
V approx. / Vexact
F2S2
B -
MU
LTI
0.00
0.50
1.00
1.50
2.00
0.0
1.0
2.0
3.0
4.0
5.0
6.0
R
V approx. / V exact
F2S2
B -
ATC
0.00
0.50
1.00
1.50
2.00
0.0
1.0
2.0
3.0
4.0
5.0
6.0
R
V approx. / Vexact
F2S2
B -
FEM
A
0.00
0.50
1.00
1.50
2.00
0.0
1.0
2.0
3.0
4.0
5.0
6.0
RV approx. / V exact
F2S2
B -
75%
Vy
Figu
re A
.7.3
0 D
epen
denc
y on
Stre
ngth
Red
uctio
n Fa
ctor
(Fra
me
‘F2S
2B’ –
Max
imum
Bas
e Sh
ear)

246
0.00
0.50
1.00
1.50
2.00
0.0
1.0
2.0
3.0
4.0
5.0
6.0
Duc
tility
(μ)
V approx. / Vexact
F2S2
B2
- MU
LTI
0.00
0.50
1.00
1.50
2.00
0.0
1.0
2.0
3.0
4.0
5.0
6.0
Duc
tility
(μ)
V approx. / V exact
F2S2
B2
- ATC
0.00
0.50
1.00
1.50
2.00
0.0
1.0
2.0
3.0
4.0
5.0
6.0
Duc
tility
(μ)
V approx. / V exact
F2S2
B2
- FEM
A
0.00
0.50
1.00
1.50
2.00
0.0
1.0
2.0
3.0
4.0
5.0
6.0
Duc
tility
(μ)
V approx. / V exact
F2S2
B2
- 75%
Vy
Figu
re A
.7.3
1 D
epen
denc
y on
Duc
tility
(Fra
me
‘F2S
2B2’
– M
axim
um B
ase
Shea
r)

247
0.00
0.50
1.00
1.50
2.00
0.0
1.0
2.0
3.0
4.0
5.0
6.0
R
V approx. / Vexact
F2S2
B2
- MU
LTI
0.00
0.50
1.00
1.50
2.00
0.0
1.0
2.0
3.0
4.0
5.0
6.0
R
V approx. / V exact
F2S2
B2
- ATC
0.00
0.50
1.00
1.50
2.00
0.0
1.0
2.0
3.0
4.0
5.0
6.0
R
V approx. / Vexact
F2S2
B2
- FEM
A
0.00
0.50
1.00
1.50
2.00
0.0
1.0
2.0
3.0
4.0
5.0
6.0
RV approx. / V exact
F2S2
B2
- 75%
Vy
Figu
re A
.7.3
2 D
epen
denc
y on
Stre
ngth
Red
uctio
n Fa
ctor
(Fra
me
‘F2S
2B2’
– M
axim
um B
ase
Shea
r)

248
0.00
0.50
1.00
1.50
2.00
0.0
1.0
2.0
3.0
4.0
5.0
6.0
Duc
tility
(μ)
V approx. / Vexact
F3S2
B -
MU
LTI
0.00
0.50
1.00
1.50
2.00
0.0
1.0
2.0
3.0
4.0
5.0
6.0
Duc
tility
(μ)
V approx. / V exact
F3S2
B -
ATC
0.00
0.50
1.00
1.50
2.00
0.0
1.0
2.0
3.0
4.0
5.0
6.0
Duc
tility
(μ)
V approx. / Vexact
F3S2
B -
FEM
A
0.00
0.50
1.00
1.50
2.00
0.0
1.0
2.0
3.0
4.0
5.0
6.0
Duc
tility
(μ)
V approx. / V exact
F3S2
B -
75%
Vy
Figu
re A
.7.3
3 D
epen
denc
y on
Duc
tility
(Fra
me
‘F3S
2B’ –
Max
imum
Bas
e Sh
ear)

249
0.00
0.50
1.00
1.50
2.00
0.0
1.0
2.0
3.0
4.0
5.0
6.0
R
V approx. / Vexact
F3S2
B -
MU
LTI
0.00
0.50
1.00
1.50
2.00
0.0
1.0
2.0
3.0
4.0
5.0
6.0
R
V approx. / V exact
F3S2
B -
ATC
0.00
0.50
1.00
1.50
2.00
0.0
1.0
2.0
3.0
4.0
5.0
6.0
R
V approx. / Vexact
F3S2
B -
FEM
A
0.00
0.50
1.00
1.50
2.00
0.0
1.0
2.0
3.0
4.0
5.0
6.0
RV approx. / V exact
F3S2
B -
75%
Vy
Figu
re A
.7.3
4 D
epen
denc
y on
Stre
ngth
Red
uctio
n Fa
ctor
(Fra
me
‘F3S
2B’ –
Max
imum
Bas
e Sh
ear)
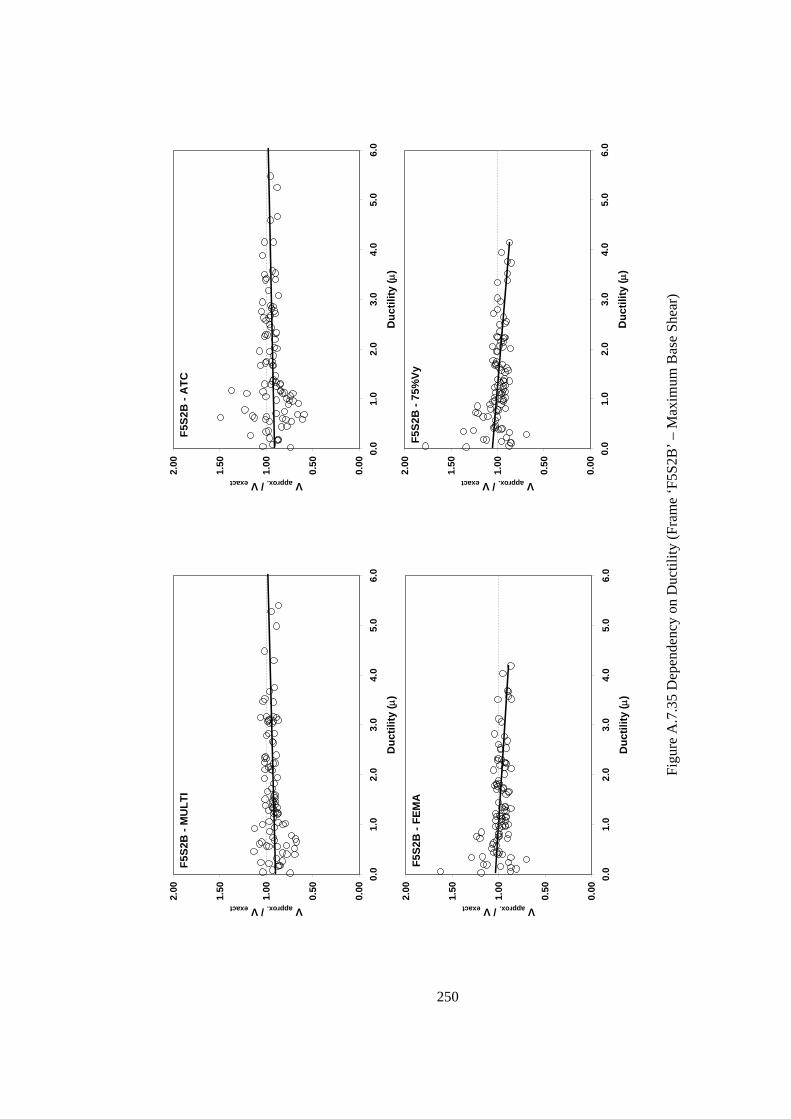
250
0.00
0.50
1.00
1.50
2.00
0.0
1.0
2.0
3.0
4.0
5.0
6.0
Duc
tility
(μ)
V approx. / Vexact
F5S2
B -
MU
LTI
0.00
0.50
1.00
1.50
2.00
0.0
1.0
2.0
3.0
4.0
5.0
6.0
Duc
tility
(μ)
V approx. / V exact
F5S2
B -
ATC
0.00
0.50
1.00
1.50
2.00
0.0
1.0
2.0
3.0
4.0
5.0
6.0
Duc
tility
(μ)
V approx. / V exact
F5S2
B -
FEM
A
0.00
0.50
1.00
1.50
2.00
0.0
1.0
2.0
3.0
4.0
5.0
6.0
Duc
tility
(μ)
V approx. / V exact
F5S2
B -
75%
Vy
Figu
re A
.7.3
5 D
epen
denc
y on
Duc
tility
(Fra
me
‘F5S
2B’ –
Max
imum
Bas
e Sh
ear)

251
0.00
0.50
1.00
1.50
2.00
0.0
1.0
2.0
3.0
4.0
5.0
6.0
R
V approx. / Vexact
F5S2
B -
MU
LTI
0.00
0.50
1.00
1.50
2.00
0.0
1.0
2.0
3.0
4.0
5.0
6.0
R
V approx. / V exact
F5S2
B -
ATC
0.00
0.50
1.00
1.50
2.00
0.0
1.0
2.0
3.0
4.0
5.0
6.0
R
V approx. / V exact
F5S2
B -
FEM
A
0.00
0.50
1.00
1.50
2.00
0.0
1.0
2.0
3.0
4.0
5.0
6.0
RV approx. / V exact
F5S2
B -
75%
Vy
Figu
re A
.7.3
6 D
epen
denc
y on
Stre
ngth
Red
uctio
n Fa
ctor
(Fra
me
‘F5S
2B’ –
Max
imum
Bas
e Sh
ear)

252
0.00
0.50
1.00
1.50
2.00
0.0
1.0
2.0
3.0
4.0
5.0
6.0
Duc
tility
(μ)
V approx. / Vexact
F5S4
B -
MU
LTI
0.00
0.50
1.00
1.50
2.00
0.0
1.0
2.0
3.0
4.0
5.0
6.0
Duc
tility
(μ)
V approx. / V exact
F5S4
B -
ATC
0.00
0.50
1.00
1.50
2.00
0.0
1.0
2.0
3.0
4.0
5.0
6.0
Duc
tility
(μ)
V approx. / Vexact
F5S4
B -
FEM
A
0.00
0.50
1.00
1.50
2.00
0.0
1.0
2.0
3.0
4.0
5.0
6.0
Duc
tility
(μ)
V approx. / V exact
F5S4
B -
75%
Vy
Figu
re A
.7.3
7 D
epen
denc
y on
Duc
tility
(Fra
me
‘F5S
4B’ –
Max
imum
Bas
e Sh
ear)

253
0.00
0.50
1.00
1.50
2.00
0.0
1.0
2.0
3.0
4.0
5.0
6.0
R
V approx. / Vexact
F5S4
B -
MU
LTI
0.00
0.50
1.00
1.50
2.00
0.0
1.0
2.0
3.0
4.0
5.0
6.0
R
V approx. / V exact
F5S4
B -
ATC
0.00
0.50
1.00
1.50
2.00
0.0
1.0
2.0
3.0
4.0
5.0
6.0
R
V approx. / V exact
F5S4
B -
FEM
A
0.00
0.50
1.00
1.50
2.00
0.0
1.0
2.0
3.0
4.0
5.0
6.0
RV approx. / V exact
F5S4
B -
75%
Vy
Figu
re A
.7.3
8 D
epen
denc
y on
Stre
ngth
Red
uctio
n Fa
ctor
(Fra
me
‘F5S
4B’ –
Max
imum
Bas
e Sh
ear)

254
0.00
0.50
1.00
1.50
2.00
0.0
1.0
2.0
3.0
4.0
5.0
6.0
Duc
tility
(μ)
V approx. / Vexact
F5S7
B -
MU
LTI
0.00
0.50
1.00
1.50
2.00
0.0
1.0
2.0
3.0
4.0
5.0
6.0
Duc
tility
(μ)
V approx. / V exact
F5S7
B -
ATC
0.00
0.50
1.00
1.50
2.00
0.0
1.0
2.0
3.0
4.0
5.0
6.0
Duc
tility
(μ)
V approx. / Vexact
F5S7
B -
FEM
A
0.00
0.50
1.00
1.50
2.00
0.0
1.0
2.0
3.0
4.0
5.0
6.0
Duc
tility
(μ)
V approx. / V exact
F5S7
B -
75%
Vy
Figu
re A
.7.3
9 D
epen
denc
y on
Duc
tility
(Fra
me
‘F5S
7B’ –
Max
imum
Bas
e Sh
ear)

255
0.00
0.50
1.00
1.50
2.00
0.0
1.0
2.0
3.0
4.0
5.0
6.0
R
V approx. / Vexact
F5S7
B -
MU
LTI
0.00
0.50
1.00
1.50
2.00
0.0
1.0
2.0
3.0
4.0
5.0
6.0
R
V approx. / V exact
F5S7
B -
ATC
0.00
0.50
1.00
1.50
2.00
0.0
1.0
2.0
3.0
4.0
5.0
6.0
R
V approx. / Vexact
F5S7
B -
FEM
A
0.00
0.50
1.00
1.50
2.00
0.0
1.0
2.0
3.0
4.0
5.0
6.0
RV approx. / V exact
F5S7
B -
75%
Vy
Figu
re A
.7.4
0 D
epen
denc
y on
Stre
ngth
Red
uctio
n Fa
ctor
(Fra
me
‘F5S
7B’ –
Max
imum
Bas
e Sh
ear)

256
0.00
0.50
1.00
1.50
2.00
0.0
1.0
2.0
3.0
4.0
5.0
6.0
Duc
tility
(μ)
V approx. / Vexact
F8S3
B -
MU
LTI
0.00
0.50
1.00
1.50
2.00
0.0
1.0
2.0
3.0
4.0
5.0
6.0
Duc
tility
(μ)
V approx. / V exact
F8S3
B -
ATC
0.00
0.50
1.00
1.50
2.00
0.0
1.0
2.0
3.0
4.0
5.0
6.0
Duc
tility
(μ)
V approx. / V exact
F8S3
B -
FEM
A
0.00
0.50
1.00
1.50
2.00
0.0
1.0
2.0
3.0
4.0
5.0
6.0
Duc
tility
(μ)
V approx. / V exact
F8S3
B -
75%
Vy
Figu
re A
.7.4
1 D
epen
denc
y on
Duc
tility
(Fra
me
‘F8S
3B’ –
Max
imum
Bas
e Sh
ear)
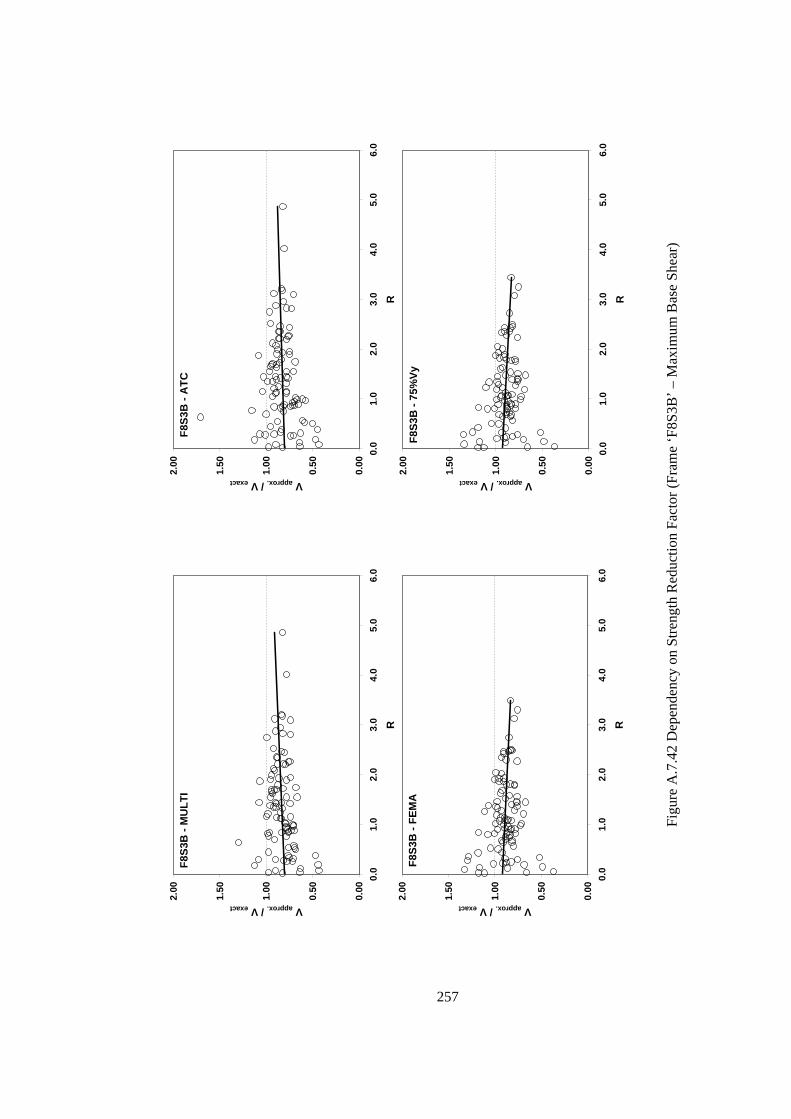
257
0.00
0.50
1.00
1.50
2.00
0.0
1.0
2.0
3.0
4.0
5.0
6.0
R
V approx. / Vexact
F8S3
B -
MU
LTI
0.00
0.50
1.00
1.50
2.00
0.0
1.0
2.0
3.0
4.0
5.0
6.0
R
V approx. / V exact
F8S3
B -
ATC
0.00
0.50
1.00
1.50
2.00
0.0
1.0
2.0
3.0
4.0
5.0
6.0
R
V approx. / Vexact
F8S3
B -
FEM
A
0.00
0.50
1.00
1.50
2.00
0.0
1.0
2.0
3.0
4.0
5.0
6.0
RV approx. / V exact
F8S3
B -
75%
Vy
Figu
re A
.7.4
2 D
epen
denc
y on
Stre
ngth
Red
uctio
n Fa
ctor
(Fra
me
‘F8S
3B’ –
Max
imum
Bas
e Sh
ear)

258
0.00
0.50
1.00
1.50
2.00
0.0
1.0
2.0
3.0
4.0
5.0
6.0
Duc
tility
(μ)
Δapprox. / Δmulti
F2S2
B -
ATC
0.00
0.50
1.00
1.50
2.00
0.0
1.0
2.0
3.0
4.0
5.0
6.0
Duc
tility
(μ)
Δ approx. / Δ multi
F2S2
B -
FEM
A
0.00
0.50
1.00
1.50
2.00
0.0
1.0
2.0
3.0
4.0
5.0
6.0
Duc
tility
(μ)
Δ approx. / Δ multiF2
S2B
- 75
%Vy
Figu
re A
.7.4
3 D
epen
denc
y on
Duc
tility
(Fra
me
‘F2S
2B’ –
Max
imum
Top
Dis
plac
emen
t)
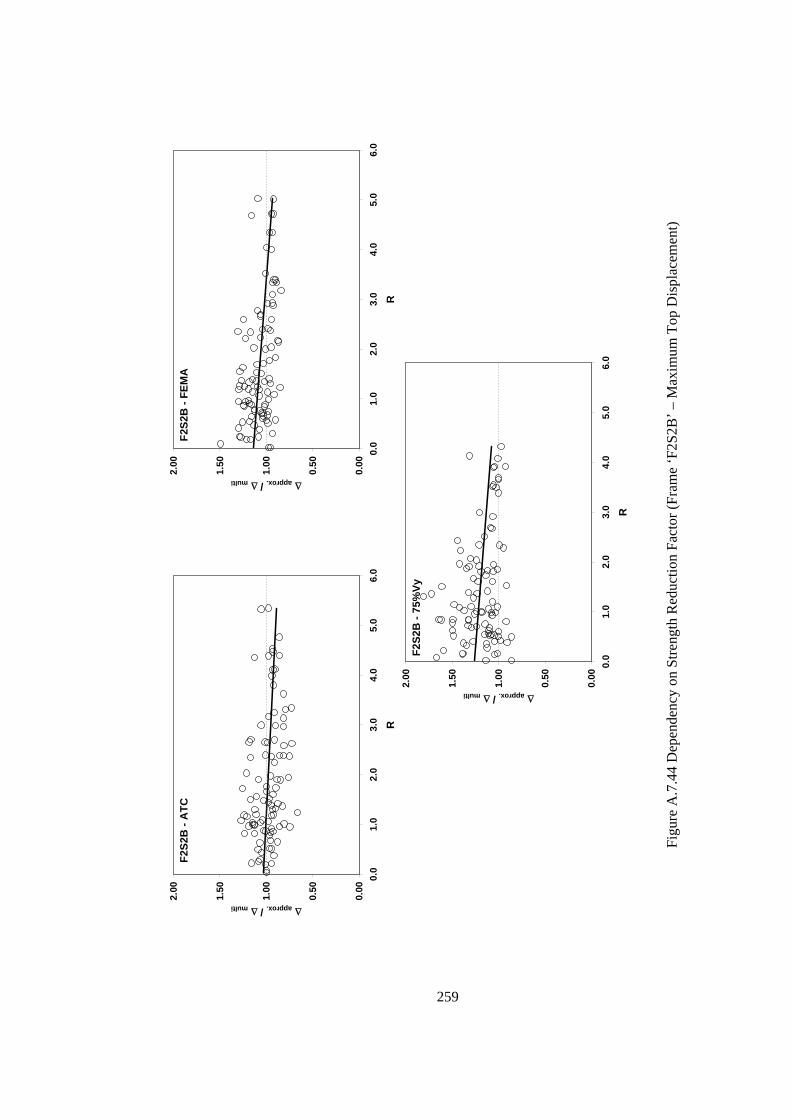
259
0.00
0.50
1.00
1.50
2.00
0.0
1.0
2.0
3.0
4.0
5.0
6.0
R
Δapprox. / Δmulti
F2S2
B -
ATC
0.00
0.50
1.00
1.50
2.00
0.0
1.0
2.0
3.0
4.0
5.0
6.0
R
Δ approx. / Δ multi
F2S2
B -
FEM
A
0.00
0.50
1.00
1.50
2.00
0.0
1.0
2.0
3.0
4.0
5.0
6.0
R
Δ approx. / Δ multiF2
S2B
- 75
%Vy
Figu
re A
.7.4
4 D
epen
denc
y on
Stre
ngth
Red
uctio
n Fa
ctor
(Fra
me
‘F2S
2B’ –
Max
imum
Top
Dis
plac
emen
t)

260
0.00
0.50
1.00
1.50
2.00
0.0
1.0
2.0
3.0
4.0
5.0
6.0
Duc
tility
(μ)
Δapprox. / Δmulti
F2S2
B2
- ATC
0.00
0.50
1.00
1.50
2.00
0.0
1.0
2.0
3.0
4.0
5.0
6.0
Duc
tility
(μ)
Δ approx. / Δ multi
F2S2
B2
- FEM
A
0.00
0.50
1.00
1.50
2.00
0.0
1.0
2.0
3.0
4.0
5.0
6.0
Duc
tility
(μ)
Δ approx. / Δ multiF2
S2B
2 - 7
5%Vy
Figu
re A
.7.4
5 D
epen
denc
y on
Duc
tility
(Fra
me
‘F2S
2B2’
– M
axim
um T
op D
ispl
acem
ent)

261
0.00
0.50
1.00
1.50
2.00
0.0
1.0
2.0
3.0
4.0
5.0
6.0
R
Δapprox. / Δmulti
F2S2
B2
- ATC
0.00
0.50
1.00
1.50
2.00
0.0
1.0
2.0
3.0
4.0
5.0
6.0
R
Δ approx. / Δ multi
F2S2
B2
- FEM
A
0.00
0.50
1.00
1.50
2.00
0.0
1.0
2.0
3.0
4.0
5.0
6.0
R
Δ approx. / Δ multiF2
S2B
2 - 7
5%Vy
Figu
re A
.7.4
6 D
epen
denc
y on
Stre
ngth
Red
uctio
n Fa
ctor
(Fra
me
‘F2S
2B2’
– M
axim
um T
op D
ispl
acem
ent)

262
0.00
0.50
1.00
1.50
2.00
0.0
1.0
2.0
3.0
4.0
5.0
6.0
Duc
tility
(μ)
Δapprox. / Δmulti
F3S2
B -
ATC
0.00
0.50
1.00
1.50
2.00
0.0
1.0
2.0
3.0
4.0
5.0
6.0
Duc
tility
(μ)
Δ approx. / Δ multi
F3S2
B -
FEM
A
0.00
0.50
1.00
1.50
2.00
0.0
1.0
2.0
3.0
4.0
5.0
6.0
Duc
tility
(μ)
Δ approx. / Δ multiF3
S2B
- 75
%Vy
Figu
re A
.7.4
7 D
epen
denc
y on
Duc
tility
(Fra
me
‘F3S
2B’ –
Max
imum
Top
Dis
plac
emen
t)

263
0.00
0.50
1.00
1.50
2.00
0.0
1.0
2.0
3.0
4.0
5.0
6.0
R
Δapprox. / Δmulti
F3S2
B -
ATC
0.00
0.50
1.00
1.50
2.00
0.0
1.0
2.0
3.0
4.0
5.0
6.0
R
Δ approx. / Δ multi
F3S2
B -
FEM
A
0.00
0.50
1.00
1.50
2.00
0.0
1.0
2.0
3.0
4.0
5.0
6.0
R
Δ approx. / Δ multiF3
S2B
- 75
%Vy
Figu
re A
.7.4
8 D
epen
denc
y on
Stre
ngth
Red
uctio
n Fa
ctor
(Fra
me
‘F3S
2B’ –
Max
imum
Top
Dis
plac
emen
t)

264
0.00
0.50
1.00
1.50
2.00
0.0
1.0
2.0
3.0
4.0
5.0
6.0
Duc
tility
(μ)
Δapprox. / Δmulti
F5S2
B -
ATC
0.00
0.50
1.00
1.50
2.00
0.0
1.0
2.0
3.0
4.0
5.0
6.0
Duc
tility
(μ)
Δ approx. / Δ multi
F5S2
B -
FEM
A
0.00
0.50
1.00
1.50
2.00
0.0
1.0
2.0
3.0
4.0
5.0
6.0
Duc
tility
(μ)
Δ approx. / Δ multiF5
S2B
- 75
%Vy
Figu
re A
.7.4
9 D
epen
denc
y on
Duc
tility
(Fra
me
‘F5S
2B’ –
Max
imum
Top
Dis
plac
emen
t)
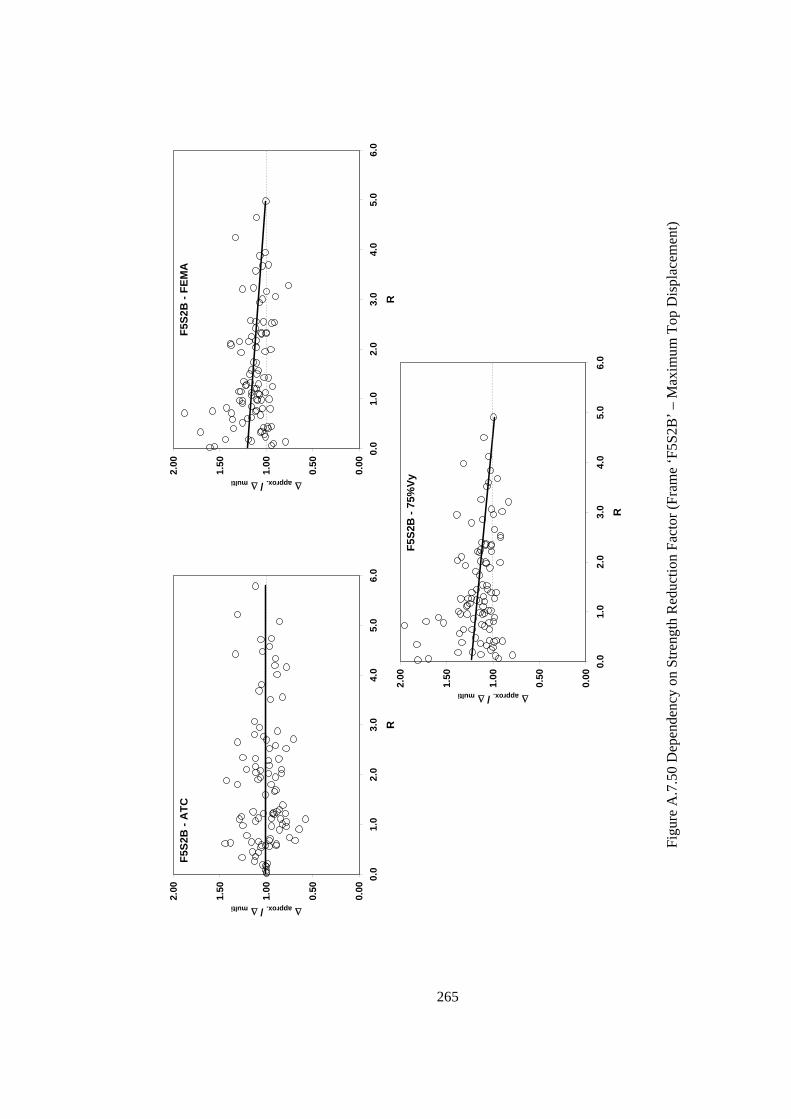
265
0.00
0.50
1.00
1.50
2.00
0.0
1.0
2.0
3.0
4.0
5.0
6.0
R
Δapprox. / Δmulti
F5S2
B -
ATC
0.00
0.50
1.00
1.50
2.00
0.0
1.0
2.0
3.0
4.0
5.0
6.0
R
Δ approx. / Δ multi
F5S2
B -
FEM
A
0.00
0.50
1.00
1.50
2.00
0.0
1.0
2.0
3.0
4.0
5.0
6.0
R
Δ approx. / Δ multiF5
S2B
- 75
%Vy
Figu
re A
.7.5
0 D
epen
denc
y on
Stre
ngth
Red
uctio
n Fa
ctor
(Fra
me
‘F5S
2B’ –
Max
imum
Top
Dis
plac
emen
t)

266
0.00
0.50
1.00
1.50
2.00
0.0
1.0
2.0
3.0
4.0
5.0
6.0
Duc
tility
(μ)
Δapprox. / Δmulti
F5S4
B -
ATC
0.00
0.50
1.00
1.50
2.00
0.0
1.0
2.0
3.0
4.0
5.0
6.0
Duc
tility
(μ)
Δ approx. / Δ multi
F5S4
B -
FEM
A
0.00
0.50
1.00
1.50
2.00
0.0
1.0
2.0
3.0
4.0
5.0
6.0
Duc
tility
(μ)
Δ approx. / Δ multiF5
S4B
- 75
%Vy
Figu
re A
.7.5
1 D
epen
denc
y on
Duc
tility
(Fra
me
‘F5S
4B’ –
Max
imum
Top
Dis
plac
emen
t)

267
0.00
0.50
1.00
1.50
2.00
0.0
1.0
2.0
3.0
4.0
5.0
6.0
R
Δapprox. / Δmulti
F5S4
B -
ATC
0.00
0.50
1.00
1.50
2.00
0.0
1.0
2.0
3.0
4.0
5.0
6.0
R
Δ approx. / Δ multi
F5S4
B -
FEM
A
0.00
0.50
1.00
1.50
2.00
0.0
1.0
2.0
3.0
4.0
5.0
6.0
R
Δ approx. / Δ multiF5
S4B
- 75
%Vy
Figu
re A
.7.5
2 D
epen
denc
y on
Stre
ngth
Red
uctio
n Fa
ctor
(Fra
me
‘F5S
4B’ –
Max
imum
Top
Dis
plac
emen
t)

268
0.00
0.50
1.00
1.50
2.00
0.0
1.0
2.0
3.0
4.0
5.0
6.0
Duc
tility
(μ)
Δapprox. / Δmulti
F5S7
B -
ATC
0.00
0.50
1.00
1.50
2.00
0.0
1.0
2.0
3.0
4.0
5.0
6.0
Duc
tility
(μ)
Δ approx. / Δ multi
F5S7
B -
FEM
A
0.00
0.50
1.00
1.50
2.00
0.0
1.0
2.0
3.0
4.0
5.0
6.0
Duc
tility
(μ)
Δ approx. / Δ multiF5
S7B
- 75
%Vy
Figu
re A
.7.5
3 D
epen
denc
y on
Duc
tility
(Fra
me
‘F5S
7B’ –
Max
imum
Top
Dis
plac
emen
t)

269
0.00
0.50
1.00
1.50
2.00
0.0
1.0
2.0
3.0
4.0
5.0
6.0
R
Δapprox. / Δmulti
F5S7
B -
ATC
0.00
0.50
1.00
1.50
2.00
0.0
1.0
2.0
3.0
4.0
5.0
6.0
R
Δ approx. / Δ multi
F5S7
B -
FEM
A
0.00
0.50
1.00
1.50
2.00
0.0
1.0
2.0
3.0
4.0
5.0
6.0
R
Δ approx. / Δ multiF5
S7B
- 75
%Vy
Figu
re A
.7.5
4 D
epen
denc
y on
Stre
ngth
Red
uctio
n Fa
ctor
(Fra
me
‘F5S
7B’ –
Max
imum
Top
Dis
plac
emen
t)
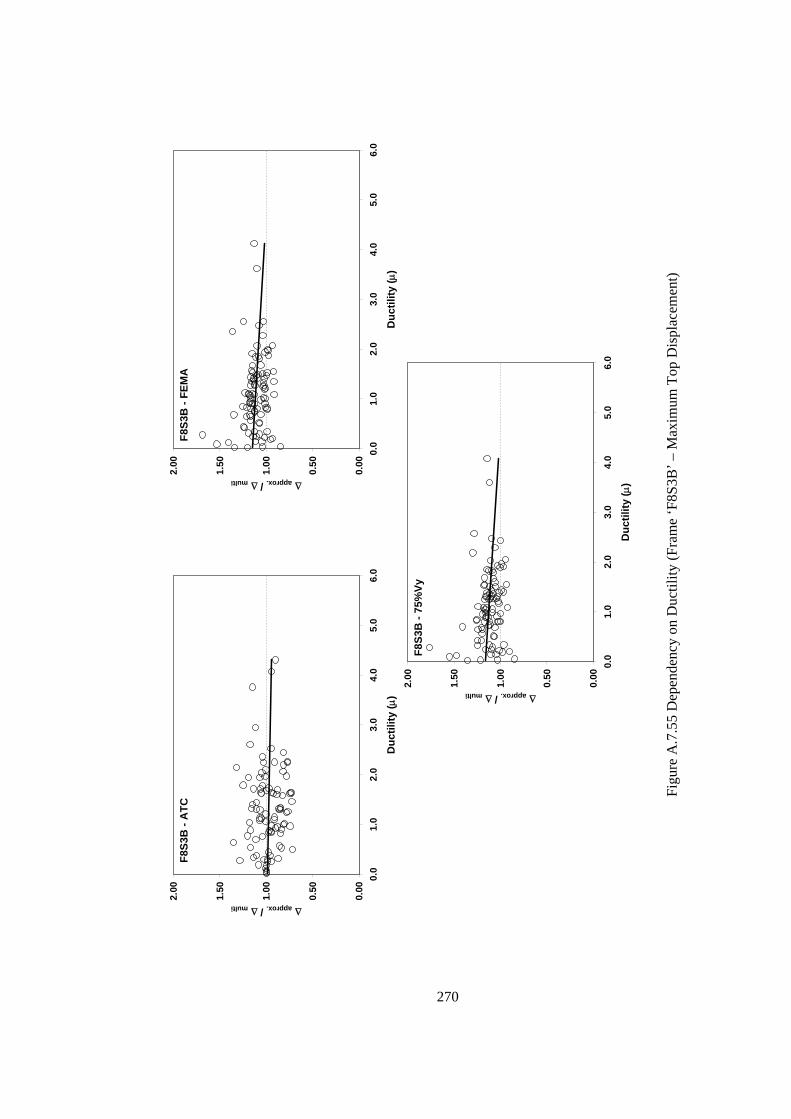
270
0.00
0.50
1.00
1.50
2.00
0.0
1.0
2.0
3.0
4.0
5.0
6.0
Duc
tility
(μ)
Δapprox. / Δmulti
F8S3
B -
ATC
0.00
0.50
1.00
1.50
2.00
0.0
1.0
2.0
3.0
4.0
5.0
6.0
Duc
tility
(μ)
Δ approx. / Δ multi
F8S3
B -
FEM
A
0.00
0.50
1.00
1.50
2.00
0.0
1.0
2.0
3.0
4.0
5.0
6.0
Duc
tility
(μ)
Δ approx. / Δ multiF8
S3B
- 75
%Vy
Figu
re A
.7.5
5 D
epen
denc
y on
Duc
tility
(Fra
me
‘F8S
3B’ –
Max
imum
Top
Dis
plac
emen
t)

271
0.00
0.50
1.00
1.50
2.00
0.0
1.0
2.0
3.0
4.0
5.0
6.0
R
Δapprox. / Δmulti
F8S3
B -
ATC
0.00
0.50
1.00
1.50
2.00
0.0
1.0
2.0
3.0
4.0
5.0
6.0
R
Δ approx. / Δ multi
F8S3
B -
FEM
A
0.00
0.50
1.00
1.50
2.00
0.0
1.0
2.0
3.0
4.0
5.0
6.0
R
Δ approx. / Δ multiF8
S3B
- 75
%Vy
Figu
re A
.7.5
6 D
epen
denc
y on
Stre
ngth
Red
uctio
n Fa
ctor
(Fra
me
‘F8S
3B’ –
Max
imum
Top
Dis
plac
emen
t)
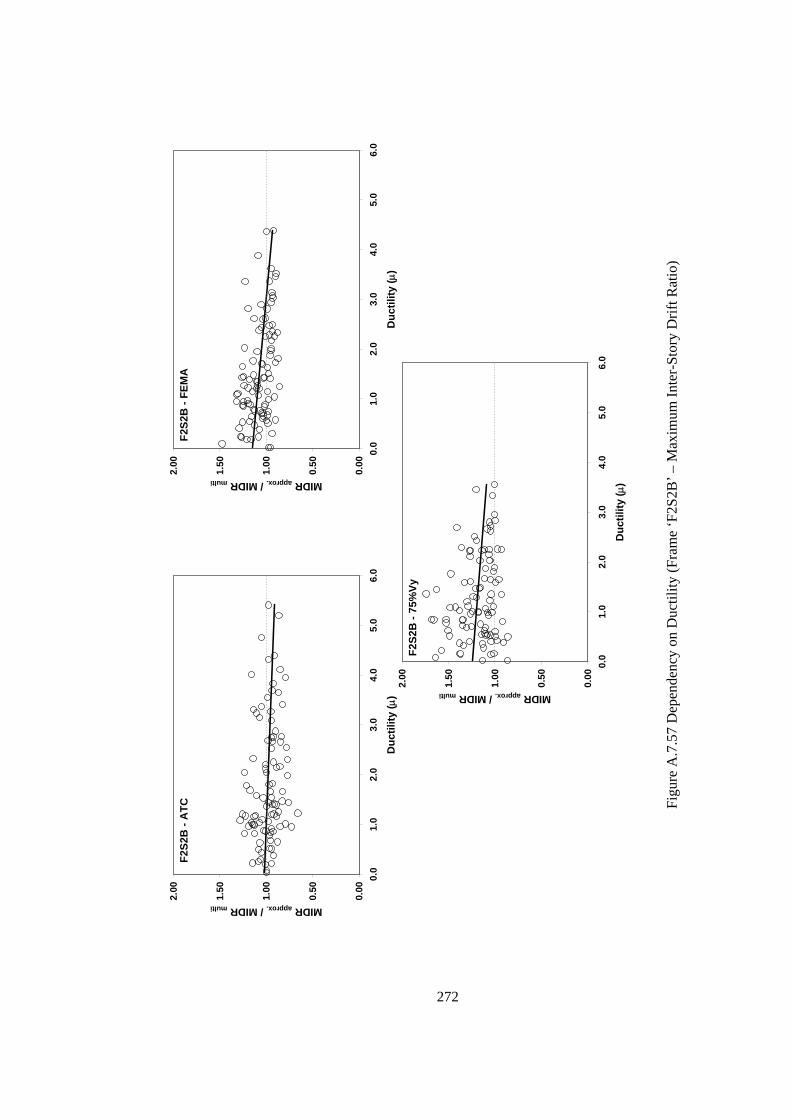
272
0.00
0.50
1.00
1.50
2.00
0.0
1.0
2.0
3.0
4.0
5.0
6.0
Duc
tility
(μ)
MIDR approx. / MIDR multi
F2S2
B -
ATC
0.00
0.50
1.00
1.50
2.00
0.0
1.0
2.0
3.0
4.0
5.0
6.0
Duc
tility
(μ)
MIDR approx. / MIDR multi
F2S2
B -
FEM
A
0.00
0.50
1.00
1.50
2.00
0.0
1.0
2.0
3.0
4.0
5.0
6.0
Duc
tility
(μ)
MIDR approx. / MIDR multiF2
S2B
- 75
%Vy
Figu
re A
.7.5
7 D
epen
denc
y on
Duc
tility
(Fra
me
‘F2S
2B’ –
Max
imum
Inte
r-St
ory
Drif
t Rat
io)
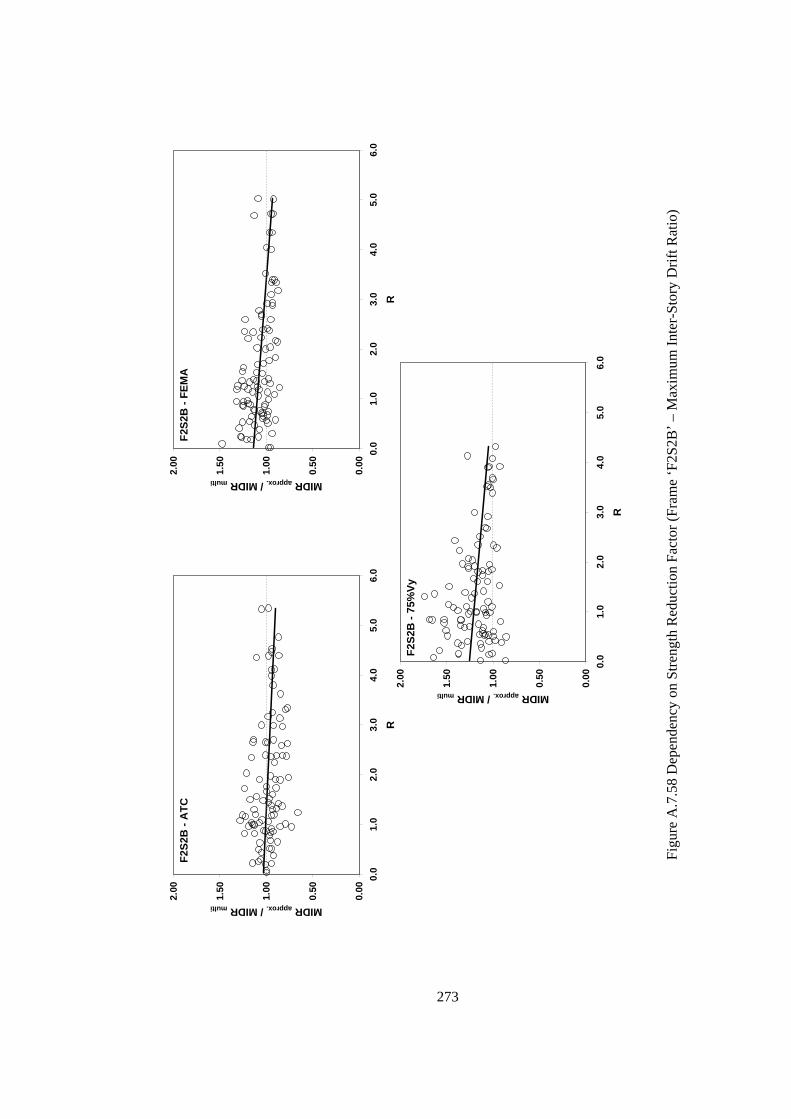
273
0.00
0.50
1.00
1.50
2.00
0.0
1.0
2.0
3.0
4.0
5.0
6.0
R
MIDR approx. / MIDR multi
F2S2
B -
ATC
0.00
0.50
1.00
1.50
2.00
0.0
1.0
2.0
3.0
4.0
5.0
6.0
R
MIDR approx. / MIDR multi
F2S2
B -
FEM
A
0.00
0.50
1.00
1.50
2.00
0.0
1.0
2.0
3.0
4.0
5.0
6.0
R
MIDR approx. / MIDR multiF2
S2B
- 75
%Vy
Figu
re A
.7.5
8 D
epen
denc
y on
Stre
ngth
Red
uctio
n Fa
ctor
(Fra
me
‘F2S
2B’ –
Max
imum
Inte
r-St
ory
Drif
t Rat
io)
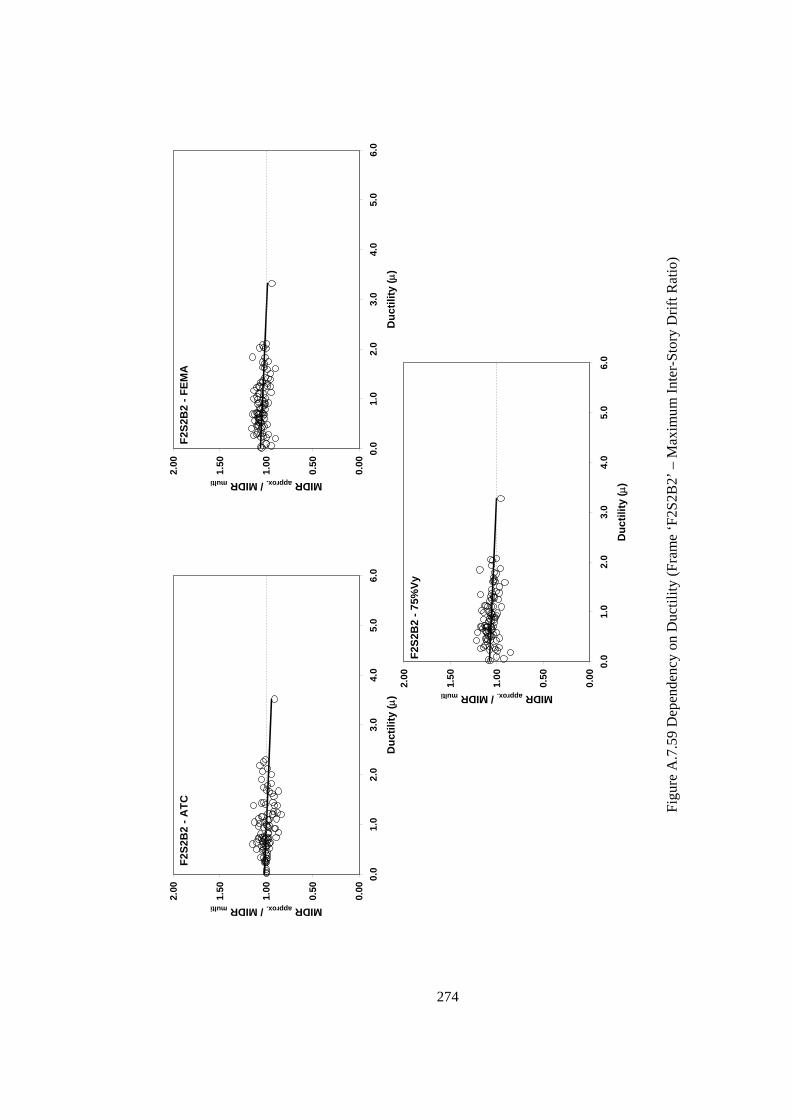
274
0.00
0.50
1.00
1.50
2.00
0.0
1.0
2.0
3.0
4.0
5.0
6.0
Duc
tility
(μ)
MIDR approx. / MIDR multi
F2S2
B2
- ATC
0.00
0.50
1.00
1.50
2.00
0.0
1.0
2.0
3.0
4.0
5.0
6.0
Duc
tility
(μ)
MIDR approx. / MIDR multi
F2S2
B2
- FEM
A
0.00
0.50
1.00
1.50
2.00
0.0
1.0
2.0
3.0
4.0
5.0
6.0
Duc
tility
(μ)
MIDR approx. / MIDR multiF2
S2B
2 - 7
5%Vy
Figu
re A
.7.5
9 D
epen
denc
y on
Duc
tility
(Fra
me
‘F2S
2B2’
– M
axim
um In
ter-
Stor
y D
rift R
atio
)

275
0.00
0.50
1.00
1.50
2.00
0.0
1.0
2.0
3.0
4.0
5.0
6.0
R
MIDR approx. / MIDR multi
F2S2
B2
- ATC
0.00
0.50
1.00
1.50
2.00
0.0
1.0
2.0
3.0
4.0
5.0
6.0
R
MIDR approx. / MIDR multi
F2S2
B2
- FEM
A
0.00
0.50
1.00
1.50
2.00
0.0
1.0
2.0
3.0
4.0
5.0
6.0
R
MIDR approx. / MIDR multiF2
S2B
2 - 7
5%Vy
Figu
re A
.7.6
0 D
epen
denc
y on
Stre
ngth
Red
uctio
n Fa
ctor
(Fra
me
‘F2S
2B2’
– M
axim
um In
ter-
Stor
y D
rift R
atio
)

276
0.00
0.50
1.00
1.50
2.00
0.0
1.0
2.0
3.0
4.0
5.0
6.0
Duc
tility
(μ)
MIDR approx. / MIDR multi
F3S2
B -
ATC
0.00
0.50
1.00
1.50
2.00
0.0
1.0
2.0
3.0
4.0
5.0
6.0
Duc
tility
(μ)
MIDR approx. / MIDR multi
F3S2
B -
FEM
A
0.00
0.50
1.00
1.50
2.00
0.0
1.0
2.0
3.0
4.0
5.0
6.0
Duc
tility
(μ)
MIDR approx. / MIDR multiF3
S2B
- 75
%Vy
Figu
re A
.7.6
1 D
epen
denc
y on
Duc
tility
(Fra
me
‘F3S
2B’ –
Max
imum
Inte
r-St
ory
Drif
t Rat
io)

277
0.00
0.50
1.00
1.50
2.00
0.0
1.0
2.0
3.0
4.0
5.0
6.0
R
MIDR approx. / MIDR multi
F3S2
B -
ATC
0.00
0.50
1.00
1.50
2.00
0.0
1.0
2.0
3.0
4.0
5.0
6.0
R
MIDR approx. / MIDR multi
F3S2
B -
FEM
A
0.00
0.50
1.00
1.50
2.00
0.0
1.0
2.0
3.0
4.0
5.0
6.0
R
MIDR approx. / MIDR multiF3
S2B
- 75
%Vy
Figu
re A
.7.6
2 D
epen
denc
y on
Stre
ngth
Red
uctio
n Fa
ctor
(Fra
me
‘F3S
2B’ –
Max
imum
Inte
r-St
ory
Drif
t Rat
io)
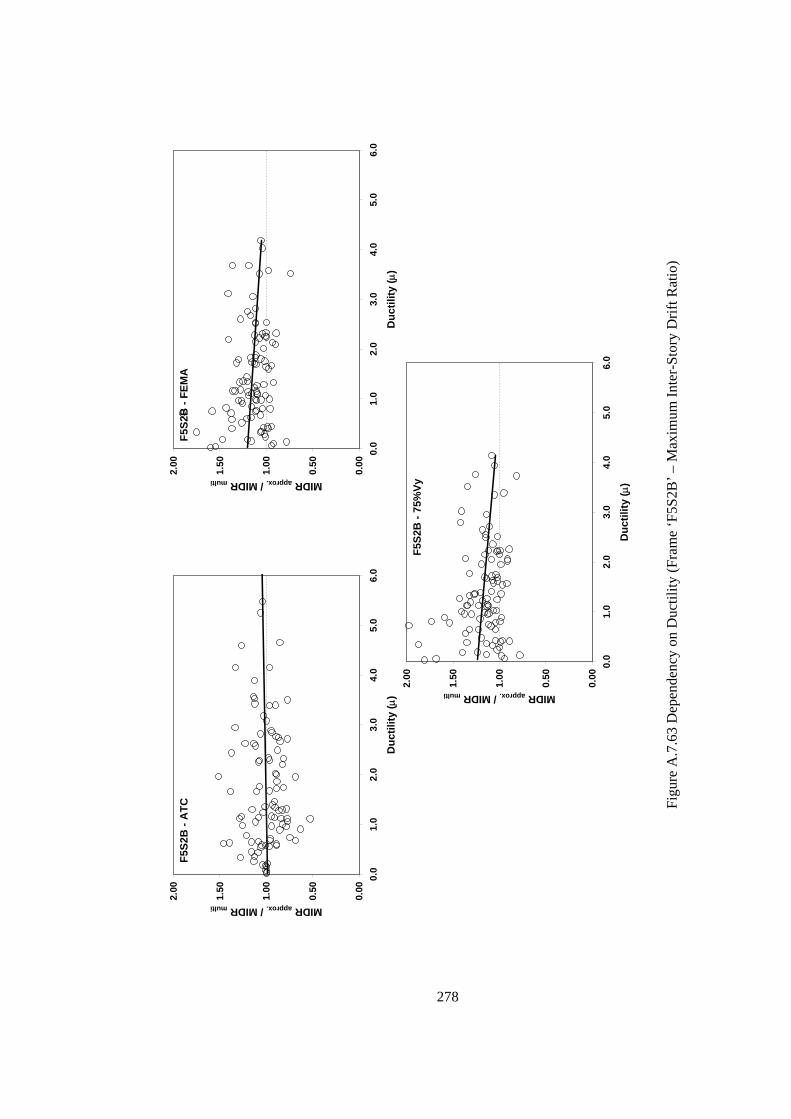
278
0.00
0.50
1.00
1.50
2.00
0.0
1.0
2.0
3.0
4.0
5.0
6.0
Duc
tility
(μ)
MIDR approx. / MIDR multi
F5S2
B -
ATC
0.00
0.50
1.00
1.50
2.00
0.0
1.0
2.0
3.0
4.0
5.0
6.0
Duc
tility
(μ)
MIDR approx. / MIDR multi
F5S2
B -
FEM
A
0.00
0.50
1.00
1.50
2.00
0.0
1.0
2.0
3.0
4.0
5.0
6.0
Duc
tility
(μ)
MIDR approx. / MIDR multiF5
S2B
- 75
%Vy
Figu
re A
.7.6
3 D
epen
denc
y on
Duc
tility
(Fra
me
‘F5S
2B’ –
Max
imum
Inte
r-St
ory
Drif
t Rat
io)
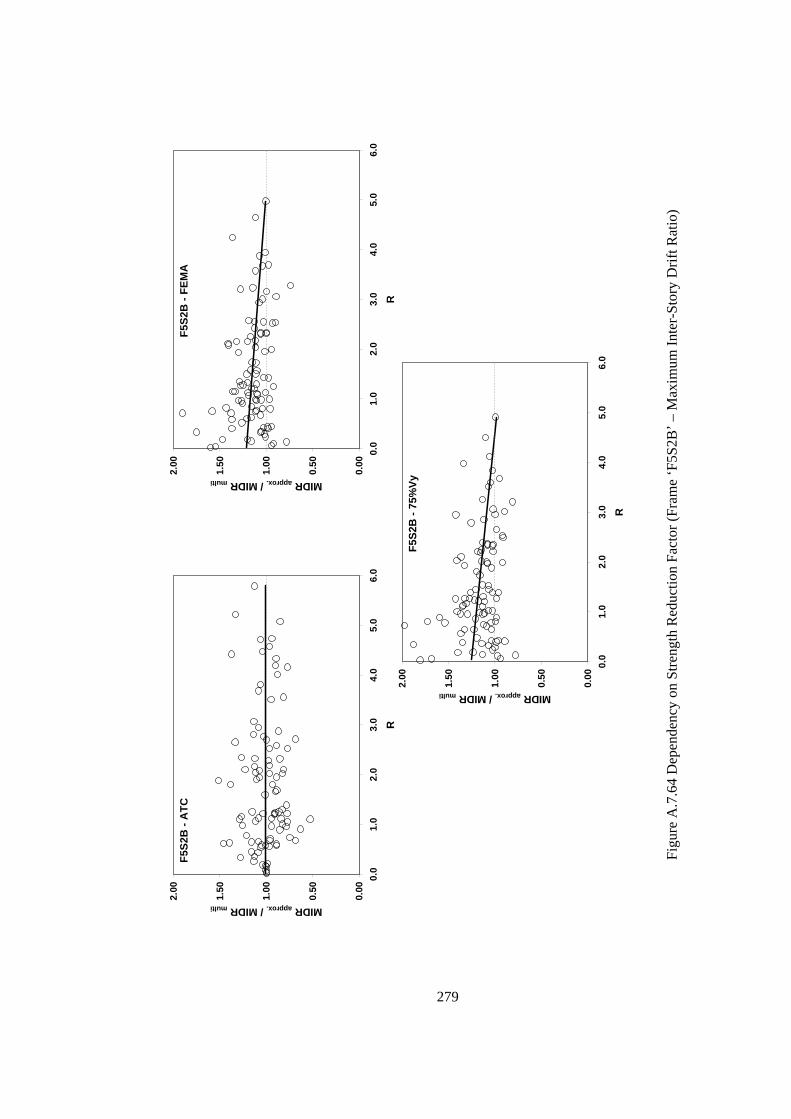
279
0.00
0.50
1.00
1.50
2.00
0.0
1.0
2.0
3.0
4.0
5.0
6.0
R
MIDR approx. / MIDR multi
F5S2
B -
ATC
0.00
0.50
1.00
1.50
2.00
0.0
1.0
2.0
3.0
4.0
5.0
6.0
R
MIDR approx. / MIDR multi
F5S2
B -
FEM
A
0.00
0.50
1.00
1.50
2.00
0.0
1.0
2.0
3.0
4.0
5.0
6.0
R
MIDR approx. / MIDR multiF5
S2B
- 75
%Vy
Figu
re A
.7.6
4 D
epen
denc
y on
Stre
ngth
Red
uctio
n Fa
ctor
(Fra
me
‘F5S
2B’ –
Max
imum
Inte
r-St
ory
Drif
t Rat
io)
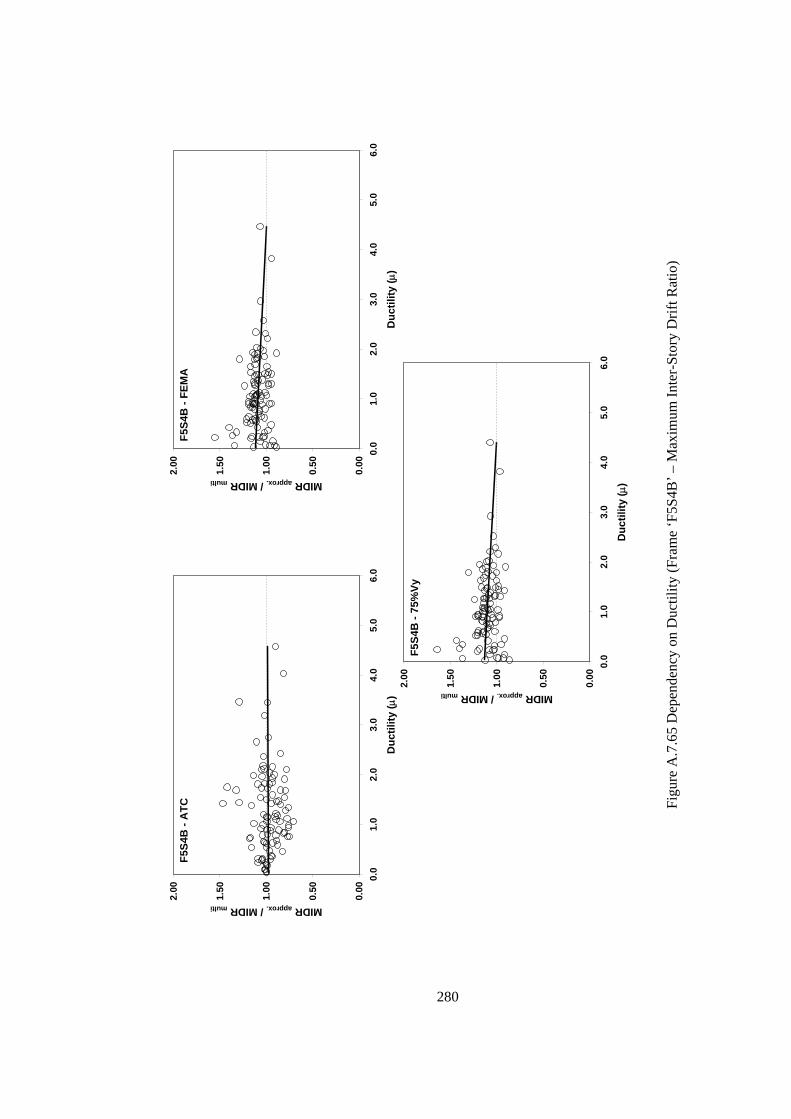
280
0.00
0.50
1.00
1.50
2.00
0.0
1.0
2.0
3.0
4.0
5.0
6.0
Duc
tility
(μ)
MIDR approx. / MIDR multi
F5S4
B -
ATC
0.00
0.50
1.00
1.50
2.00
0.0
1.0
2.0
3.0
4.0
5.0
6.0
Duc
tility
(μ)
MIDR approx. / MIDR multi
F5S4
B -
FEM
A
0.00
0.50
1.00
1.50
2.00
0.0
1.0
2.0
3.0
4.0
5.0
6.0
Duc
tility
(μ)
MIDR approx. / MIDR multiF5
S4B
- 75
%Vy
Figu
re A
.7.6
5 D
epen
denc
y on
Duc
tility
(Fra
me
‘F5S
4B’ –
Max
imum
Inte
r-St
ory
Drif
t Rat
io)
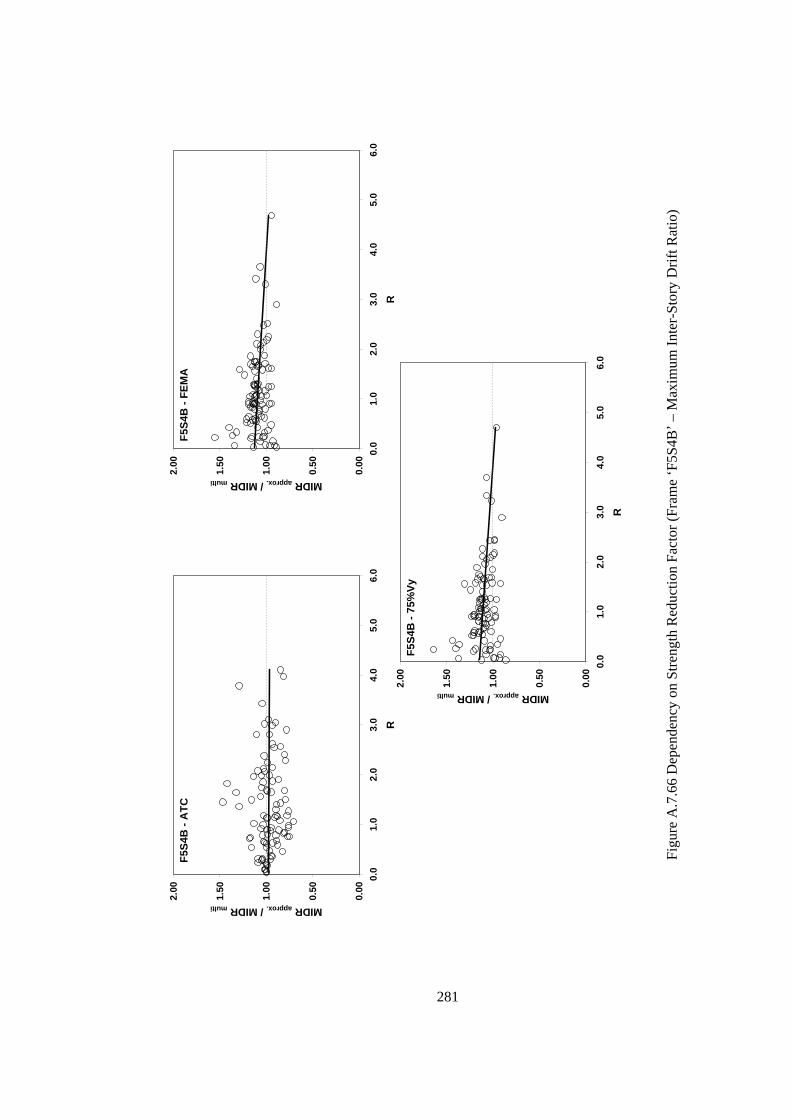
281
0.00
0.50
1.00
1.50
2.00
0.0
1.0
2.0
3.0
4.0
5.0
6.0
R
MIDR approx. / MIDR multi
F5S4
B -
ATC
0.00
0.50
1.00
1.50
2.00
0.0
1.0
2.0
3.0
4.0
5.0
6.0
R
MIDR approx. / MIDR multi
F5S4
B -
FEM
A
0.00
0.50
1.00
1.50
2.00
0.0
1.0
2.0
3.0
4.0
5.0
6.0
R
MIDR approx. / MIDR multiF5
S4B
- 75
%Vy
Figu
re A
.7.6
6 D
epen
denc
y on
Stre
ngth
Red
uctio
n Fa
ctor
(Fra
me
‘F5S
4B’ –
Max
imum
Inte
r-St
ory
Drif
t Rat
io)

282
0.00
0.50
1.00
1.50
2.00
0.0
1.0
2.0
3.0
4.0
5.0
6.0
Duc
tility
(μ)
MIDR approx. / MIDR multi
F5S7
B -
ATC
0.00
0.50
1.00
1.50
2.00
0.0
1.0
2.0
3.0
4.0
5.0
6.0
Duc
tility
(μ)
MIDR approx. / MIDR multi
F5S7
B -
FEM
A
0.00
0.50
1.00
1.50
2.00
0.0
1.0
2.0
3.0
4.0
5.0
6.0
Duc
tility
(μ)
MIDR approx. / MIDR multiF5
S7B
- 75
%Vy
Figu
re A
.7.6
7 D
epen
denc
y on
Duc
tility
(Fra
me
‘F5S
7B’ –
Max
imum
Inte
r-St
ory
Drif
t Rat
io)

283
0.00
0.50
1.00
1.50
2.00
0.0
1.0
2.0
3.0
4.0
5.0
6.0
R
MIDR approx. / MIDR multi
F5S7
B -
ATC
0.00
0.50
1.00
1.50
2.00
0.0
1.0
2.0
3.0
4.0
5.0
6.0
R
MIDR approx. / MIDR multi
F5S7
B -
FEM
A
0.00
0.50
1.00
1.50
2.00
0.0
1.0
2.0
3.0
4.0
5.0
6.0
R
MIDR approx. / MIDR multiF5
S7B
- 75
%Vy
Figu
re A
.7.6
8 D
epen
denc
y on
Stre
ngth
Red
uctio
n Fa
ctor
(Fra
me
‘F5S
7B’ –
Max
imum
Inte
r-St
ory
Drif
t Rat
io)

284
0.00
0.50
1.00
1.50
2.00
0.0
1.0
2.0
3.0
4.0
5.0
6.0
Duc
tility
(μ)
MIDR approx. / MIDR multi
F8S3
B -
ATC
0.00
0.50
1.00
1.50
2.00
0.0
1.0
2.0
3.0
4.0
5.0
6.0
Duc
tility
(μ)
MIDR approx. / MIDR multi
F8S3
B -
FEM
A
0.00
0.50
1.00
1.50
2.00
0.0
1.0
2.0
3.0
4.0
5.0
6.0
Duc
tility
(μ)
MIDR approx. / MIDR multiF8
S3B
- 75
%Vy
Figu
re A
.7.6
9 D
epen
denc
y on
Duc
tility
(Fra
me
‘F8S
3B’ –
Max
imum
Inte
r-St
ory
Drif
t Rat
io)

285
0.00
0.50
1.00
1.50
2.00
0.0
1.0
2.0
3.0
4.0
5.0
6.0
R
MIDR approx. / MIDR multi
F8S3
B -
ATC
0.00
0.50
1.00
1.50
2.00
0.0
1.0
2.0
3.0
4.0
5.0
6.0
R
MIDR approx. / MIDR multi
F8S3
B -
FEM
A
0.00
0.50
1.00
1.50
2.00
0.0
1.0
2.0
3.0
4.0
5.0
6.0
R
MIDR approx. / MIDR multiF8
S3B
- 75
%Vy
Figu
re A
.7.7
0 D
epen
denc
y on
Stre
ngth
Red
uctio
n Fa
ctor
(Fra
me
‘F8S
3B’ –
Max
imum
Inte
r-St
ory
Drif
t Rat
io)

286
0.00
0.50
1.00
1.50
2.00
0.0
1.0
2.0
3.0
4.0
5.0
6.0
Duc
tility
(μ)
V approx. / Vmulti
F2S2
B -
ATC
0.00
0.50
1.00
1.50
2.00
0.0
1.0
2.0
3.0
4.0
5.0
6.0
Duc
tility
(μ)
V approx. / V multi
F2S2
B -
FEM
A
0.00
0.50
1.00
1.50
2.00
0.0
1.0
2.0
3.0
4.0
5.0
6.0
Duc
tility
(μ)
V approx. / V multiF2
S2B
- 75
%Vy
Figu
re A
.7.7
1 D
epen
denc
y on
Duc
tility
(Fra
me
‘F2S
2B’ –
Max
imum
Bas
e Sh
ear)

287
0.00
0.50
1.00
1.50
2.00
0.0
1.0
2.0
3.0
4.0
5.0
6.0
R
V approx. / Vmulti
F2S2
B -
ATC
0.00
0.50
1.00
1.50
2.00
0.0
1.0
2.0
3.0
4.0
5.0
6.0
R
V approx. / V multi
F2S2
B -
FEM
A
0.00
0.50
1.00
1.50
2.00
0.0
1.0
2.0
3.0
4.0
5.0
6.0
R
V approx. / V multiF2
S2B
- 75
%Vy
Figu
re A
.7.7
2 D
epen
denc
y on
Stre
ngth
Red
uctio
n Fa
ctor
(Fra
me
‘F2S
2B’ –
Max
imum
Bas
e Sh
ear)

288
0.00
0.50
1.00
1.50
2.00
0.0
1.0
2.0
3.0
4.0
5.0
6.0
Duc
tility
(μ)
V approx. / Vmulti
F2S2
B2
- ATC
0.00
0.50
1.00
1.50
2.00
0.0
1.0
2.0
3.0
4.0
5.0
6.0
Duc
tility
(μ)
V approx. / V multi
F2S2
B2
- FEM
A
0.00
0.50
1.00
1.50
2.00
0.0
1.0
2.0
3.0
4.0
5.0
6.0
Duc
tility
(μ)
V approx. / V multiF2
S2B
2 - 7
5%Vy
Figu
re A
.7.7
3 D
epen
denc
y on
Duc
tility
(Fra
me
‘F2S
2B2’
– M
axim
um B
ase
Shea
r)

289
0.00
0.50
1.00
1.50
2.00
0.0
1.0
2.0
3.0
4.0
5.0
6.0
R
V approx. / Vmulti
F2S2
B2
- ATC
0.00
0.50
1.00
1.50
2.00
0.0
1.0
2.0
3.0
4.0
5.0
6.0
R
V approx. / V multi
F2S2
B2
- FEM
A
0.00
0.50
1.00
1.50
2.00
0.0
1.0
2.0
3.0
4.0
5.0
6.0
R
V approx. / V multiF2
S2B
2 - 7
5%Vy
Figu
re A
.7.7
4 D
epen
denc
y on
Stre
ngth
Red
uctio
n Fa
ctor
(Fra
me
‘F2S
2B2’
– M
axim
um B
ase
Shea
r)

290
0.00
0.50
1.00
1.50
2.00
0.0
1.0
2.0
3.0
4.0
5.0
6.0
Duc
tility
(μ)
V approx. / Vmulti
F3S2
B -
ATC
0.00
0.50
1.00
1.50
2.00
0.0
1.0
2.0
3.0
4.0
5.0
6.0
Duc
tility
(μ)
V approx. / V multi
F3S2
B -
FEM
A
0.00
0.50
1.00
1.50
2.00
0.0
1.0
2.0
3.0
4.0
5.0
6.0
Duc
tility
(μ)
V approx. / V multiF3
S2B
- 75
%Vy
Figu
re A
.7.7
5 D
epen
denc
y on
Duc
tility
(Fra
me
‘F3S
2B’ –
Max
imum
Bas
e Sh
ear)
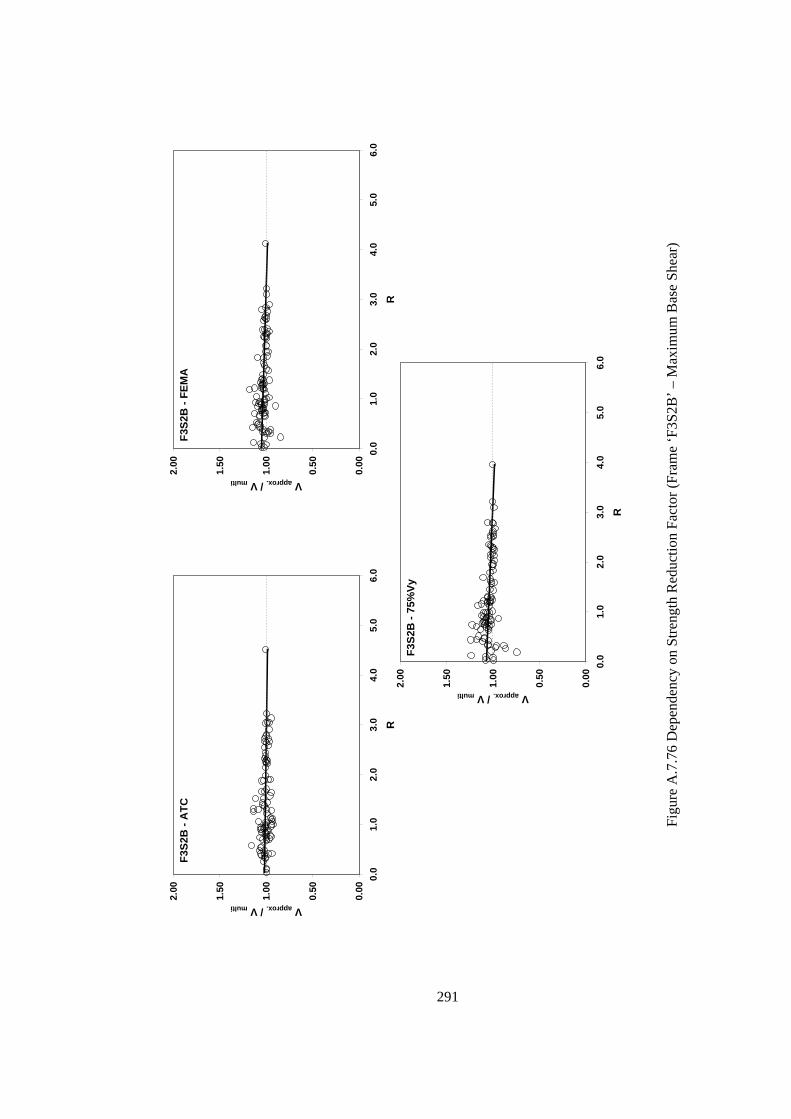
291
0.00
0.50
1.00
1.50
2.00
0.0
1.0
2.0
3.0
4.0
5.0
6.0
R
V approx. / Vmulti
F3S2
B -
ATC
0.00
0.50
1.00
1.50
2.00
0.0
1.0
2.0
3.0
4.0
5.0
6.0
R
V approx. / V multi
F3S2
B -
FEM
A
0.00
0.50
1.00
1.50
2.00
0.0
1.0
2.0
3.0
4.0
5.0
6.0
R
V approx. / V multiF3
S2B
- 75
%Vy
Figu
re A
.7.7
6 D
epen
denc
y on
Stre
ngth
Red
uctio
n Fa
ctor
(Fra
me
‘F3S
2B’ –
Max
imum
Bas
e Sh
ear)

292
0.00
0.50
1.00
1.50
2.00
0.0
1.0
2.0
3.0
4.0
5.0
6.0
Duc
tility
(μ)
V approx. / Vmulti
F5S2
B -
ATC
0.00
0.50
1.00
1.50
2.00
0.0
1.0
2.0
3.0
4.0
5.0
6.0
Duc
tility
(μ)
V approx. / V multi
F5S2
B -
FEM
A
0.00
0.50
1.00
1.50
2.00
0.0
1.0
2.0
3.0
4.0
5.0
6.0
Duc
tility
(μ)
V approx. / V multiF5
S2B
- 75
%Vy
Figu
re A
.7.7
7 D
epen
denc
y on
Duc
tility
(Fra
me
‘F5S
2B’ –
Max
imum
Bas
e Sh
ear)
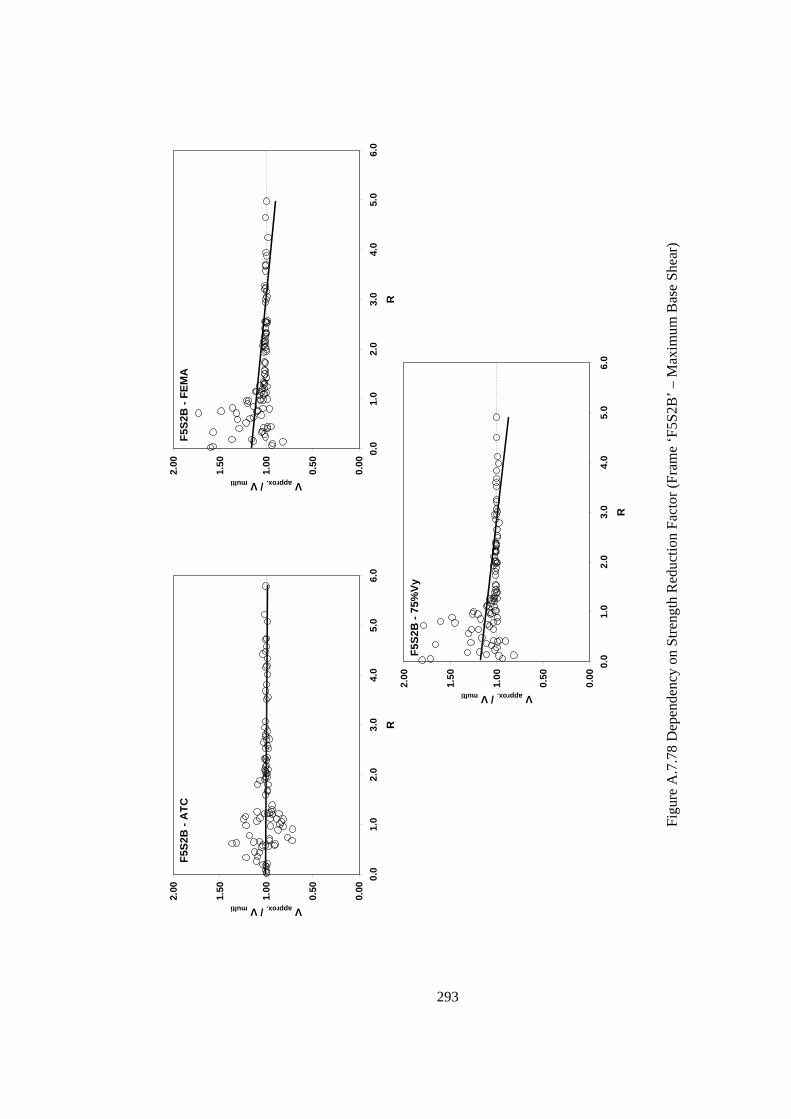
293
0.00
0.50
1.00
1.50
2.00
0.0
1.0
2.0
3.0
4.0
5.0
6.0
R
V approx. / Vmulti
F5S2
B -
ATC
0.00
0.50
1.00
1.50
2.00
0.0
1.0
2.0
3.0
4.0
5.0
6.0
R
V approx. / V multi
F5S2
B -
FEM
A
0.00
0.50
1.00
1.50
2.00
0.0
1.0
2.0
3.0
4.0
5.0
6.0
R
V approx. / V multiF5
S2B
- 75
%Vy
Figu
re A
.7.7
8 D
epen
denc
y on
Stre
ngth
Red
uctio
n Fa
ctor
(Fra
me
‘F5S
2B’ –
Max
imum
Bas
e Sh
ear)

294
0.00
0.50
1.00
1.50
2.00
0.0
1.0
2.0
3.0
4.0
5.0
6.0
Duc
tility
(μ)
V approx. / Vmulti
F5S4
B -
ATC
0.00
0.50
1.00
1.50
2.00
0.0
1.0
2.0
3.0
4.0
5.0
6.0
Duc
tility
(μ)
V approx. / V multi
F5S4
B -
FEM
A
0.00
0.50
1.00
1.50
2.00
0.0
1.0
2.0
3.0
4.0
5.0
6.0
Duc
tility
(μ)
V approx. / V multiF5
S4B
- 75
%Vy
Figu
re A
.7.7
9 D
epen
denc
y on
Duc
tility
(Fra
me
‘F5S
4B’ –
Max
imum
Bas
e Sh
ear)

295
0.00
0.50
1.00
1.50
2.00
0.0
1.0
2.0
3.0
4.0
5.0
6.0
R
V approx. / Vmulti
F5S4
B -
ATC
0.00
0.50
1.00
1.50
2.00
0.0
1.0
2.0
3.0
4.0
5.0
6.0
R
V approx. / V multi
F5S4
B -
FEM
A
0.00
0.50
1.00
1.50
2.00
0.0
1.0
2.0
3.0
4.0
5.0
6.0
R
V approx. / V multiF5
S4B
- 75
%Vy
Figu
re A
.7.8
0 D
epen
denc
y on
Stre
ngth
Red
uctio
n Fa
ctor
(Fra
me
‘F5S
4B’ –
Max
imum
Bas
e Sh
ear)

296
0.00
0.50
1.00
1.50
2.00
0.0
1.0
2.0
3.0
4.0
5.0
6.0
Duc
tility
(μ)
V approx. / Vmulti
F5S7
B -
ATC
0.00
0.50
1.00
1.50
2.00
0.0
1.0
2.0
3.0
4.0
5.0
6.0
Duc
tility
(μ)
V approx. / V multi
F5S7
B -
FEM
A
0.00
0.50
1.00
1.50
2.00
0.0
1.0
2.0
3.0
4.0
5.0
6.0
Duc
tility
(μ)
V approx. / V multiF5
S7B
- 75
%Vy
Figu
re A
.7.8
1 D
epen
denc
y on
Duc
tility
(Fra
me
‘F5S
7B’ –
Max
imum
Bas
e Sh
ear)

297
0.00
0.50
1.00
1.50
2.00
0.0
1.0
2.0
3.0
4.0
5.0
6.0
R
V approx. / Vmulti
F5S7
B -
ATC
0.00
0.50
1.00
1.50
2.00
0.0
1.0
2.0
3.0
4.0
5.0
6.0
R
V approx. / V multi
F5S7
B -
FEM
A
0.00
0.50
1.00
1.50
2.00
0.0
1.0
2.0
3.0
4.0
5.0
6.0
R
V approx. / V multiF5
S7B
- 75
%Vy
Figu
re A
.7.8
2 D
epen
denc
y on
Stre
ngth
Red
uctio
n Fa
ctor
(Fra
me
‘F5S
7B’ –
Max
imum
Bas
e Sh
ear)

298
0.00
0.50
1.00
1.50
2.00
0.0
1.0
2.0
3.0
4.0
5.0
6.0
Duc
tility
(μ)
V approx. / Vmulti
F8S3
B -
ATC
0.00
0.50
1.00
1.50
2.00
0.0
1.0
2.0
3.0
4.0
5.0
6.0
Duc
tility
(μ)
V approx. / V multi
F8S3
B -
FEM
A
0.00
0.50
1.00
1.50
2.00
0.0
1.0
2.0
3.0
4.0
5.0
6.0
Duc
tility
(μ)
V approx. / V multiF8
S3B
- 75
%Vy
Figu
re A
.7.8
3 D
epen
denc
y on
Duc
tility
(Fra
me
‘F8S
3B’ –
Max
imum
Bas
e Sh
ear)

299
0.00
0.50
1.00
1.50
2.00
0.0
1.0
2.0
3.0
4.0
5.0
6.0
R
V approx. / Vmulti
F8S3
B -
ATC
0.00
0.50
1.00
1.50
2.00
0.0
1.0
2.0
3.0
4.0
5.0
6.0
R
V approx. / V multi
F8S3
B -
FEM
A
0.00
0.50
1.00
1.50
2.00
0.0
1.0
2.0
3.0
4.0
5.0
6.0
R
V approx. / V multiF8
S3B
- 75
%Vy
Figu
re A
.7.8
4 D
epen
denc
y on
Stre
ngth
Red
uctio
n Fa
ctor
(Fra
me
‘F8S
3B’ –
Max
imum
Bas
e Sh
ear)

APPENDIX B
INTERPRETATION OF RESULTS WITH RESPECT TO
‘MULTI’ METHOD
B.1 INTRODUCTION
The interpretational steps presented in Chapter 4 were also repeated for the
comparison of ATC, FEMA and 75%Vy approximations with respect to MULTI results.
As previously indicated, this was done in order to investigate the performance of common
approximation methods at capturing the global behavior (nonlinear static response) that
was thought to be better presented by ‘MULTI’ approximation method which used the
multi-linear segmented idealization to fully describe the capacity curve. The overall
results are discussed in the next sections.
B.2 INTERPRETATIONS WITH RESPECT TO ‘MULTI’ RESULTS
B.2.1 Correlation Studies
Similar to the comparisons with ‘exact’ seismic responses, the demands obtained
from the approximate procedures, ATC, FEMA and 75%Vy were compared with the ones
obtained from MULTI method. ‘Coefficient of correlation’ for each comparison was also
computed using Eqn. 4.1.
As depicted in Figure B.1 and Figures A.5.2-A.5.7, the maximum displacement
demand comparisons indicated that all of the three methods gave identical results up to
yielding of structural systems. After yield points, ATC method showed much dispersion
with both under- and over-estimations. FEMA and 75%Vy methods, however, generally
gave conservative results with respect to MULTI method. The correlation coefficient
studies, as summarized in Table B.1, denoted that these two methods were strongly
300

correlated with MULTI method, whereas ATC method gave relatively lower coefficient
values indicating lower correlation.
0.00
0.15
0.30
0.45
0.60
0.00 0.15 0.30 0.45 0.60
Top Displacement (m) (MULTI)
Top
Dis
plac
emen
t (m
) (A
TC) F2S2B
ρ = 0.977
0.00
0.15
0.30
0.45
0.60
0.00 0.15 0.30 0.45 0.60
Top Displacement (m) (MULTI)
Top
Dis
plac
emen
t (m
) (FE
MA
) F2S2B
ρ = 0.985
0.00
0.15
0.30
0.45
0.60
0.00 0.15 0.30 0.45 0.60
Top Displacement (m) (MULTI)
Top
Dis
plac
emen
t (m
) (75
%Vy
) F2S2B
ρ = 0.975
Figure B.1 Comparison of Approximate Results with respect to ‘MULTI’ Values of
Maximum Top Displacement for Frame ‘F2S2B’
Table B.1 Coefficient of Correlation Values of Approximation Alternatives
at Predicting Maximum Top Displacement Demands
FRAME ATC FEMA 75%Vy
F2S2B 0.977 0.985 0.975F2S2B2 0.992 0.994 0.994F3S2B 0.991 0.992 0.991F5S2B 0.969 0.975 0.976F5S4B 0.971 0.993 0.993F5S7B 0.905 0.980 0.984F8S3B 0.965 0.989 0.990Overall Mean 0.967 0.987 0.986
301
0
2
4
6
8
10
0 2 4 6 8 10
MIDR (%) (MULTI)
MID
R (%
) (A
TC)
F2S2B
ρ = 0.979
0
2
4
6
8
10
0 2 4 6 8 10
MIDR (%) (MULTI)
MID
R (%
) (FE
MA
)
F2S2B
ρ = 0.986
0
2
4
6
8
10
0 2 4 6 8 10
MIDR (%) (MULTI)
MID
R (%
) (75
%Vy
)F2S2B
ρ = 0.976
Figure B.2 Comparison of Approximate Results with respect to ‘MULTI’ Values of
Maximum Inter-Story Drift Ratio for Frame ‘F2S2B’
Table B.2 Coefficient of Correlation Values of Approximation Alternatives
at Predicting Maximum Inter-Story Drift Ratio Demands
FRAME ATC FEMA 75%Vy
F2S2B 0.979 0.986 0.976F2S2B2 0.992 0.995 0.994F3S2B 0.991 0.992 0.991F5S2B 0.968 0.972 0.974F5S4B 0.972 0.993 0.993F5S7B 0.903 0.980 0.984F8S3B 0.962 0.989 0.990Overall Mean 0.967 0.987 0.986
Considering the maximum inter-story drift ratio demand comparisons, as
illustrated through Figure B.2 and Figures A.5.9-A.5.14, all of the methods matched very
well with MULTI method except for few cases. In those cases, ATC method yielded
302
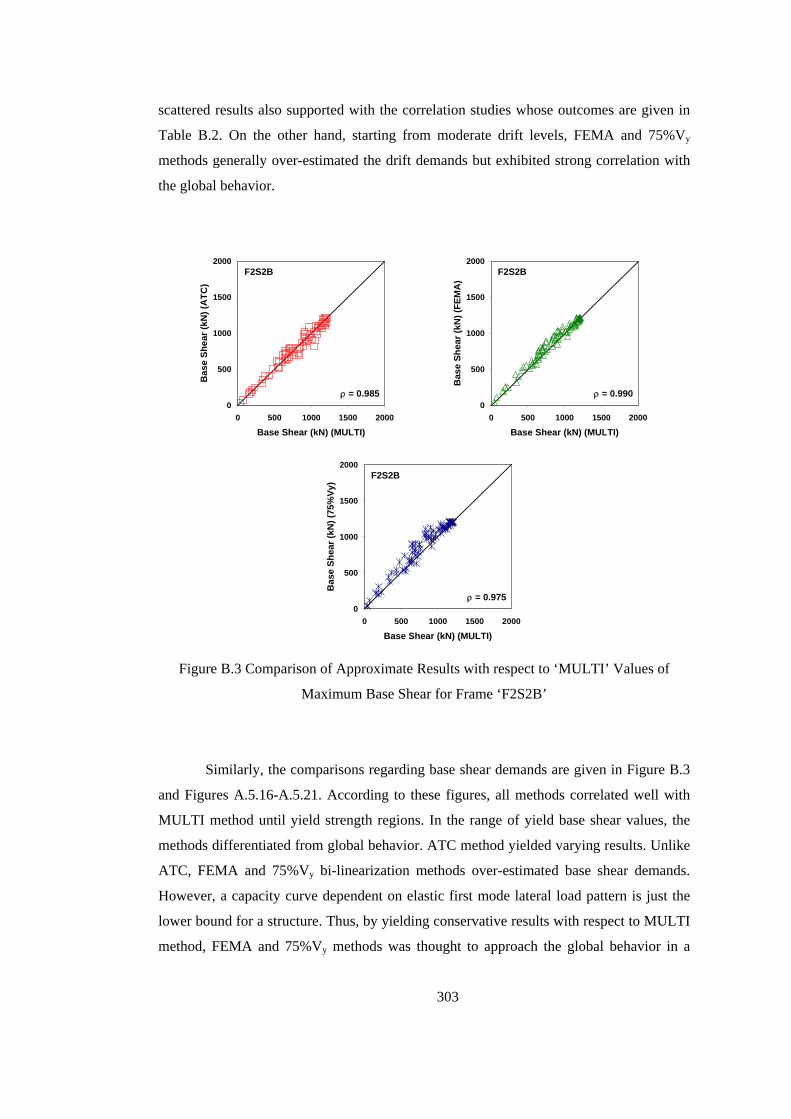
scattered results also supported with the correlation studies whose outcomes are given in
Table B.2. On the other hand, starting from moderate drift levels, FEMA and 75%Vy
methods generally over-estimated the drift demands but exhibited strong correlation with
the global behavior.
0
500
1000
1500
2000
0 500 1000 1500 2000
Base Shear (kN) (MULTI)
Bas
e Sh
ear (
kN) (
ATC
)
F2S2B
ρ = 0.985
0
500
1000
1500
2000
0 500 1000 1500 2000
Base Shear (kN) (MULTI)
Bas
e Sh
ear (
kN) (
FEM
A)
F2S2B
ρ = 0.990
0
500
1000
1500
2000
0 500 1000 1500 2000
Base Shear (kN) (MULTI)
Bas
e Sh
ear (
kN) (
75%
Vy)
F2S2B
ρ = 0.975
Figure B.3 Comparison of Approximate Results with respect to ‘MULTI’ Values of
Maximum Base Shear for Frame ‘F2S2B’
Similarly, the comparisons regarding base shear demands are given in Figure B.3
and Figures A.5.16-A.5.21. According to these figures, all methods correlated well with
MULTI method until yield strength regions. In the range of yield base shear values, the
methods differentiated from global behavior. ATC method yielded varying results. Unlike
ATC, FEMA and 75%Vy bi-linearization methods over-estimated base shear demands.
However, a capacity curve dependent on elastic first mode lateral load pattern is just the
lower bound for a structure. Thus, by yielding conservative results with respect to MULTI
method, FEMA and 75%Vy methods was thought to approach the global behavior in a
303
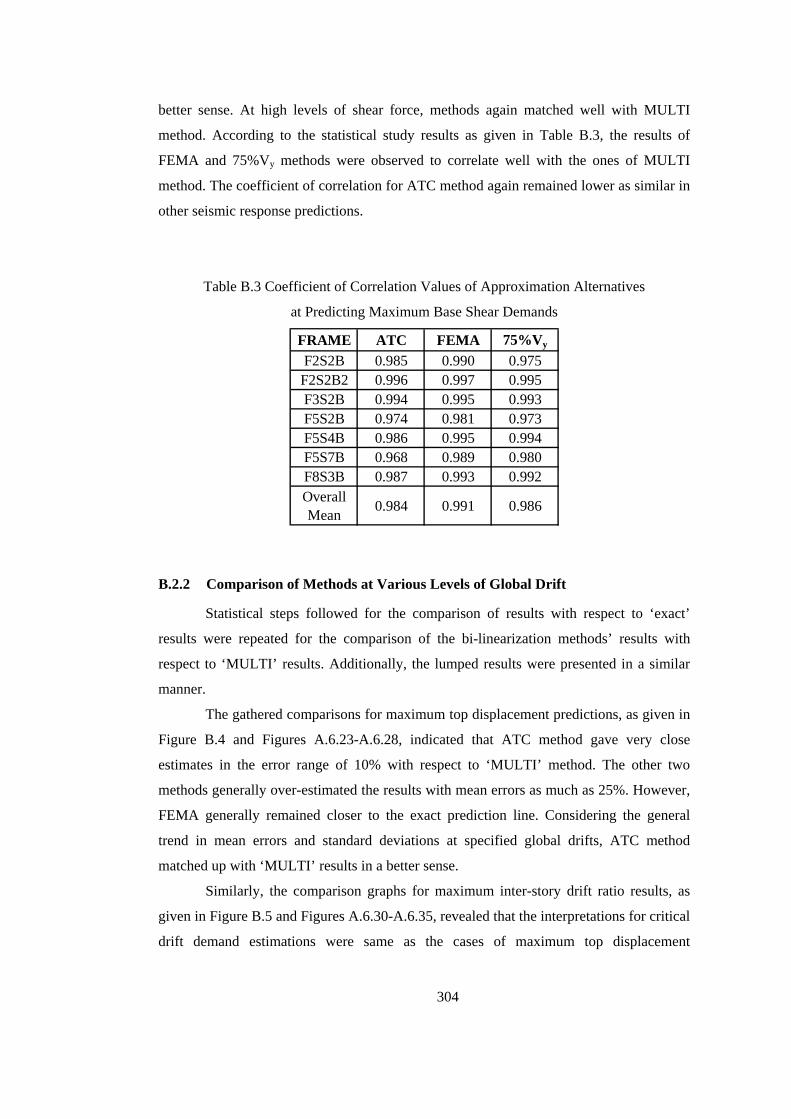
better sense. At high levels of shear force, methods again matched well with MULTI
method. According to the statistical study results as given in Table B.3, the results of
FEMA and 75%Vy methods were observed to correlate well with the ones of MULTI
method. The coefficient of correlation for ATC method again remained lower as similar in
other seismic response predictions.
Table B.3 Coefficient of Correlation Values of Approximation Alternatives
at Predicting Maximum Base Shear Demands
FRAME ATC FEMA 75%Vy
F2S2B 0.985 0.990 0.975F2S2B2 0.996 0.997 0.995F3S2B 0.994 0.995 0.993F5S2B 0.974 0.981 0.973F5S4B 0.986 0.995 0.994F5S7B 0.968 0.989 0.980F8S3B 0.987 0.993 0.992Overall Mean 0.984 0.991 0.986
B.2.2 Comparison of Methods at Various Levels of Global Drift
Statistical steps followed for the comparison of results with respect to ‘exact’
results were repeated for the comparison of the bi-linearization methods’ results with
respect to ‘MULTI’ results. Additionally, the lumped results were presented in a similar
manner.
The gathered comparisons for maximum top displacement predictions, as given in
Figure B.4 and Figures A.6.23-A.6.28, indicated that ATC method gave very close
estimates in the error range of 10% with respect to ‘MULTI’ method. The other two
methods generally over-estimated the results with mean errors as much as 25%. However,
FEMA generally remained closer to the exact prediction line. Considering the general
trend in mean errors and standard deviations at specified global drifts, ATC method
matched up with ‘MULTI’ results in a better sense.
Similarly, the comparison graphs for maximum inter-story drift ratio results, as
given in Figure B.5 and Figures A.6.30-A.6.35, revealed that the interpretations for critical
drift demand estimations were same as the cases of maximum top displacement
304
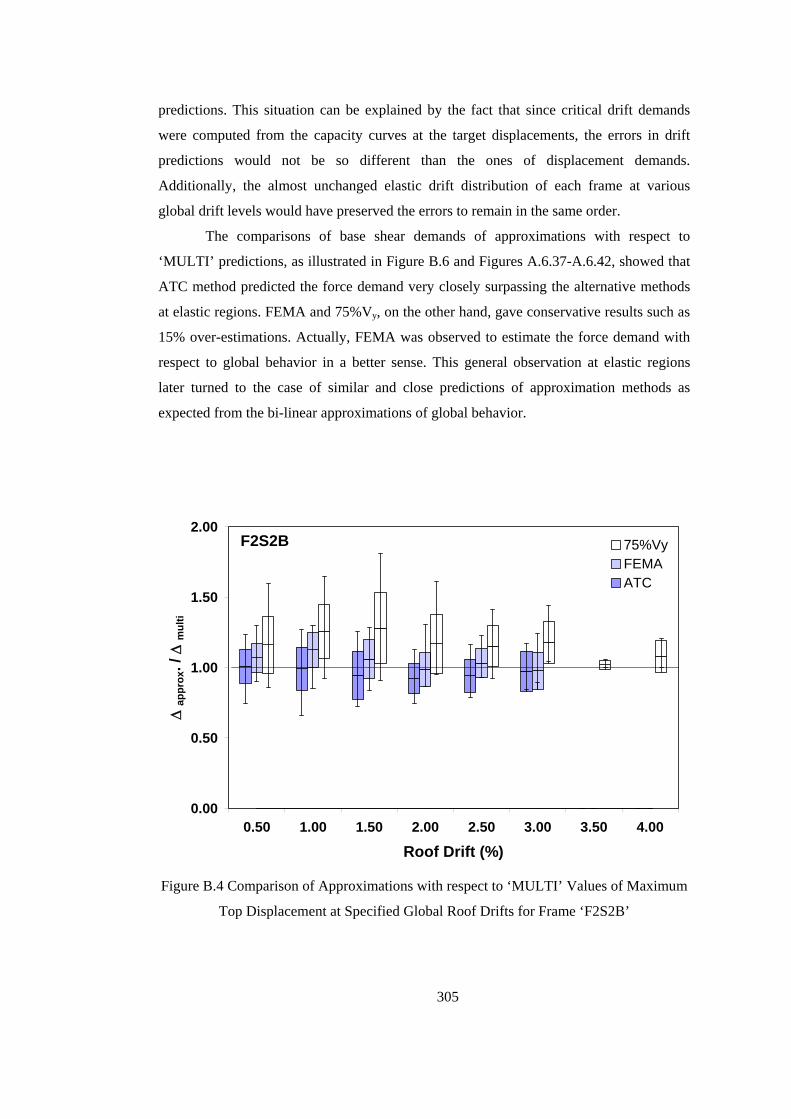
predictions. This situation can be explained by the fact that since critical drift demands
were computed from the capacity curves at the target displacements, the errors in drift
predictions would not be so different than the ones of displacement demands.
Additionally, the almost unchanged elastic drift distribution of each frame at various
global drift levels would have preserved the errors to remain in the same order.
The comparisons of base shear demands of approximations with respect to
‘MULTI’ predictions, as illustrated in Figure B.6 and Figures A.6.37-A.6.42, showed that
ATC method predicted the force demand very closely surpassing the alternative methods
at elastic regions. FEMA and 75%Vy, on the other hand, gave conservative results such as
15% over-estimations. Actually, FEMA was observed to estimate the force demand with
respect to global behavior in a better sense. This general observation at elastic regions
later turned to the case of similar and close predictions of approximation methods as
expected from the bi-linear approximations of global behavior.
0.00
0.50
1.00
1.50
2.00
0.50 1.00 1.50 2.00 2.50 3.00 3.50 4.00
Roof Drift (%)
Δ ap
prox
. / Δ
mul
ti
75%VyFEMAATC
F2S2B
Figure B.4 Comparison of Approximations with respect to ‘MULTI’ Values of Maximum
Top Displacement at Specified Global Roof Drifts for Frame ‘F2S2B’
305

0.00
0.50
1.00
1.50
2.00
0.50 1.00 1.50 2.00 2.50 3.00 3.50 4.00
Roof Drift (%)
MID
R ap
prox
. / M
IDR
mul
ti
75%VyFEMAATC
F2S2B
Figure B.5 Comparison of Approximations with respect to ‘MULTI’ Values of Maximum
Inter-Story Drift Ratio at Specified Global Roof Drifts for Frame ‘F2S2B’
0.00
0.50
1.00
1.50
2.00
0.50 1.00 1.50 2.00 2.50 3.00 3.50 4.00
Roof Drift (%)
V ap
prox
. / V
mul
ti
75%VyFEMAATC
F2S2B
Figure B.6 Comparison of Approximations with respect to ‘MULTI’ Values of Maximum
Base Shear at Specified Global Roof Drifts for Frame ‘F2S2B’
306
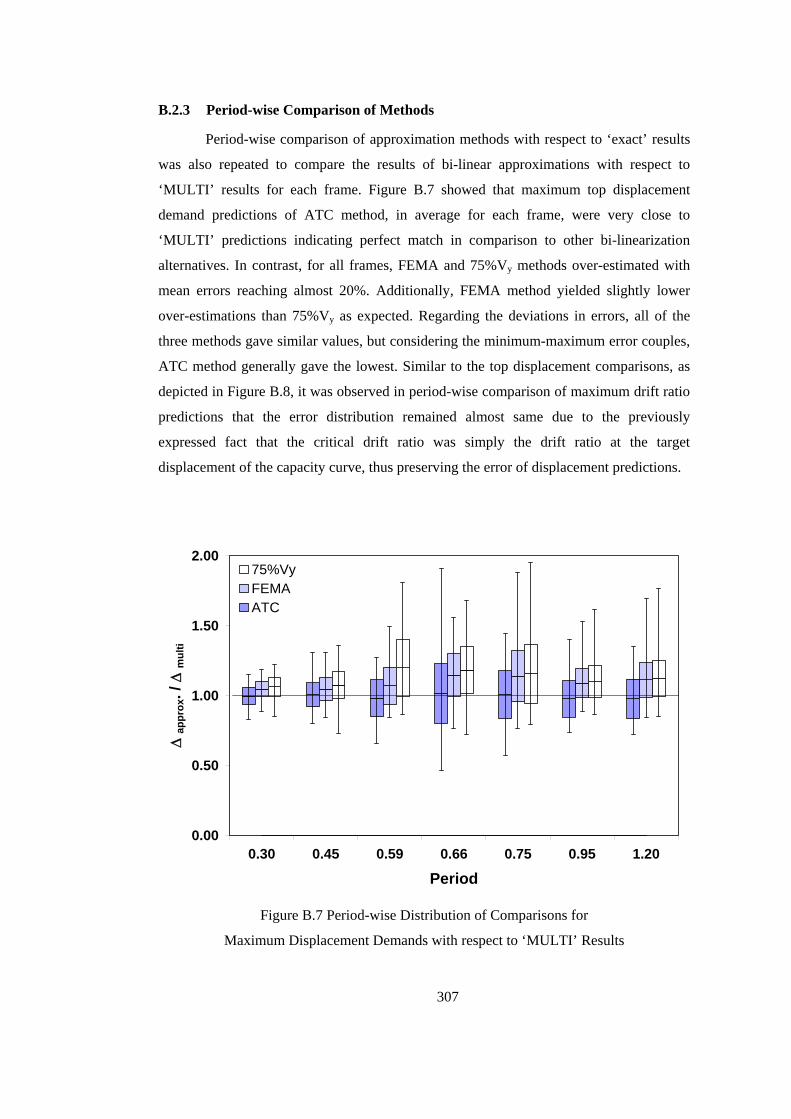
B.2.3 Period-wise Comparison of Methods
Period-wise comparison of approximation methods with respect to ‘exact’ results
was also repeated to compare the results of bi-linear approximations with respect to
‘MULTI’ results for each frame. Figure B.7 showed that maximum top displacement
demand predictions of ATC method, in average for each frame, were very close to
‘MULTI’ predictions indicating perfect match in comparison to other bi-linearization
alternatives. In contrast, for all frames, FEMA and 75%Vy methods over-estimated with
mean errors reaching almost 20%. Additionally, FEMA method yielded slightly lower
over-estimations than 75%Vy as expected. Regarding the deviations in errors, all of the
three methods gave similar values, but considering the minimum-maximum error couples,
ATC method generally gave the lowest. Similar to the top displacement comparisons, as
depicted in Figure B.8, it was observed in period-wise comparison of maximum drift ratio
predictions that the error distribution remained almost same due to the previously
expressed fact that the critical drift ratio was simply the drift ratio at the target
displacement of the capacity curve, thus preserving the error of displacement predictions.
0.00
0.50
1.00
1.50
2.00
0.30 0.45 0.59 0.66 0.75 0.95 1.20
Period
Δ ap
prox
. / Δ
mul
ti
75%VyFEMAATC
Figure B.7 Period-wise Distribution of Comparisons for
Maximum Displacement Demands with respect to ‘MULTI’ Results
307
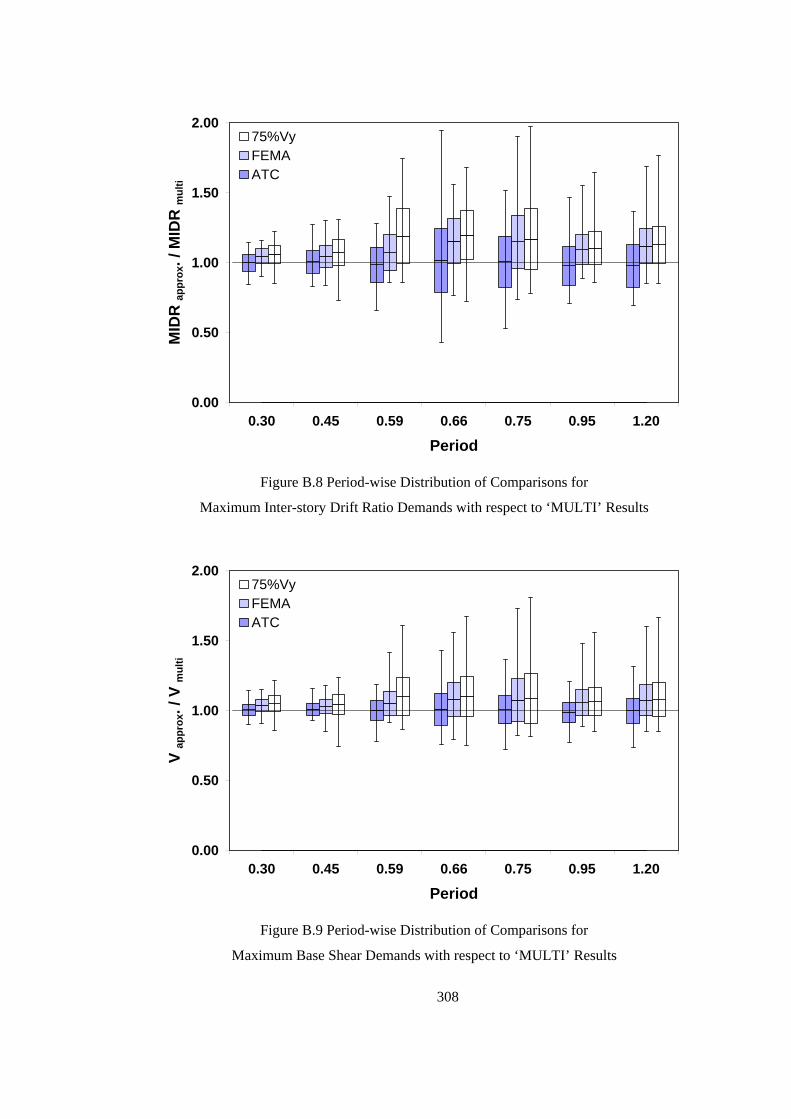
0.00
0.50
1.00
1.50
2.00
0.30 0.45 0.59 0.66 0.75 0.95 1.20
Period
MID
R ap
prox
. / M
IDR
mul
ti
75%VyFEMAATC
Figure B.8 Period-wise Distribution of Comparisons for
Maximum Inter-story Drift Ratio Demands with respect to ‘MULTI’ Results
0.00
0.50
1.00
1.50
2.00
0.30 0.45 0.59 0.66 0.75 0.95 1.20
Period
V ap
prox
. / V
mul
ti
75%VyFEMAATC
Figure B.9 Period-wise Distribution of Comparisons for
Maximum Base Shear Demands with respect to ‘MULTI’ Results
308

The comparisons concerning the mean errors for force demands with respect to
each frame revealed that ATC method again matched very well with the results of
‘MULTI’ (Figure B.9). In addition, the deviation of the results of ATC method remained
the lowest at all times. FEMA and 75%Vy, in contrast, gave conservative results with
respect to elastic first mode lateral load pattern dependent global behavior as much as
10%. Furthermore, the standard deviations for these methods were turned out to be
slightly larger than ATC.
The period-wise dependency graphs, as illustrated in Figures B.10-B.12, depicted
that there was no obvious trend in the mean errors with increasing period. However, they
reinforced the previous findings that ATC matched up with ‘MULTI’ results very well
and this situation did not change with period change. In addition, FEMA and 75%Vy
generally over-estimated the displacement and drift demands and this over-estimation
tended to increase slightly with increasing period. In contrast, for force demands, the over-
estimations were smaller and un-changed for all frame cases.
B.2.4 Trends and Dependencies on Ductility and Strength Reduction Factor
The steps in section 4.2.4 to investigate the dependencies with respect to ‘exact’
results were repeated for the investigation of the dependencies with respect to ‘MULTI’
values. Figures B-13-B.18 and Figures A.7.43-A.7.84 supported the earlier interpretations
that ATC gave very close estimates with respect to global behavior in terms of
displacement, drift and force demands. According to the dependency graphs for maximum
top displacement and maximum inter-story drift ratio demand predictions, FEMA and
75%Vy started with over-estimations and these over-estimations generally showed a
tendency to decrease with increasing ductility level and strength reduction factor.
In the case of maximum base shear force estimations; although the general trend
of FEMA and 75%Vy methods seemed to decrease with increasing levels of inelasticity,
this tendency was due to the low performance of the two methods at capturing global force
demands in the elastic range. As previously discussed, after the yield of the systems, the
approximation alternatives; ATC, FEMA and 75%Vy captured the global behavior very
well in terms of maximum base shear demands. Thus, discarding the low performance of
the methods in the elastic region, the tendency of error indicating ratios was not to change
with the change of ductility level and strength reduction factor.
309

0.00
0.50
1.00
1.50
2.00
0.00
0.20
0.40
0.60
0.80
1.00
1.20
1.40
Perio
d (s
)
Δ approx. / Δ multi
ATC
0.00
0.50
1.00
1.50
2.00
0.00
0.20
0.40
0.60 Pe
riod
(
Δ approx. / Δ multi
FEM
A
0.80
1.00
1.20
1.40
s)
Figu
re B
.10
Dep
ende
ncy
on P
erio
d (M
axim
um T
op D
ispl
acem
ent)
0.00
0.50
0.00
0.20
0.40
0.60
0.80
1.00
1.20
1.40
Perio
d (s
)
Δ approx
1.00
1.50
2.00
. / Δ multi
75%
V y
310
0.00
0.50
1.00
1.50
2.00
0.00
0.20
0.40
0.60
0.80
1.00
1.20
1.40
Perio
d (s
)
MIDR approx. / MIDR multi
ATC
0.00
0.50
1.00
1.50
2.00
0.00
0.20
0.40
0.60
0
Perio
d (
MIDR approx. / MIDR multi
FEM
A
.80
1.00
1.20
1.40
s)
Figu
re B
.11
Dep
ende
ncy
on P
erio
d (M
axim
um In
ter-
Stor
y D
rift R
atio
)
0.00
0.50
0.00
0.20
0.40
0.60
0.80
1.00
1.20
1.40
Perio
d (s
)
MIDR appr
1.00
1.50
2.00
ox. / MIDR multi75
%V y
311

0.00
0.50
1.00
1.50
2.00
0.00
0.20
0.40
0.60
0.80
1.00
1.20
1.40
Perio
d (s
)
V approx. / V multi
ATC
0.00
0.50
1.00
1.50
2.00
0.00
0.20
0.40
0.60 Pe
riod
(
V approx. / V multi
FEM
A
0.80
1.00
1.20
1.40
s)
Figu
re B
.12
Dep
ende
ncy
on P
erio
d (M
axim
um B
ase
Shea
r)
0.00
0.50
0.00
0.20
0.40
0.60
0.80
1.00
1.20
1.40
Perio
d (s
)
V appr
1.00
1.50
2.00
ox. / V multi75
%V y
312
0.00
0.50
1.00
1.50
2.00
0.0
1.0
2.0
3.0
4.0
5.0
6.0
Duc
tility
(μ)
Δ approx. / Δ multi
F2S2
B -
ATC
0.00
0.50
1.00
1.50
2.00
0.0
1.0
2.0
Duc
tility
Δ approx. / Δ multi
F2S2
B -
FEM
A
3.0
4.0
5.0
6.0
(μ)
Figu
re B
.13
Dep
ende
ncy
on D
uctil
ity (F
ram
e ‘F
2S2B
’ – M
axim
um T
op D
ispl
acem
ent)
0.00
0.50
0.0
1.0
2.0
3.0
4.0
5.0
6.0
Duc
tility
(μ)
Δ approx
1.00
1.50
2.00
. / Δ multiF2
S2B
- 75
%Vy
313

0.00
0.50
1.00
1.50
2.00
0.0
1.0
2.0
3.0
4.0
5.0
6.0
R
Δ approx. / Δ multi
F2S2
B -
ATC
0.00
0.50
1.00
1.50
2.00
0.0
1.0
2.0
3.0 R
Δ approx. / Δ multi
F2S2
B -
FEM
A
4.0
5.0
6.0
Figu
re B
.14
Dep
ende
ncy
on S
treng
th R
educ
tion
Fact
or (F
ram
e ‘F
2S2B
’ – M
axim
um T
op D
ispl
acem
ent)
0.00
0.50
0.0
1.0
2.0
3.0
4.0
5.0
6.0
R
Δ approx
1.00
1.50
2.00
. / Δ multiF2
S2B
- 75
%Vy
314
0.00
0.50
1.00
1.50
2.00
0.0
1.0
2.0
3.0
4.0
5.0
6.0
Duc
tility
(μ)
MIDR approx. / MIDR multi
F2S2
B -
ATC
0.00
0.50
1.00
1.50
2.00
0.0
1.0
2.0
3.0
Duc
tility
MIDR approx. / MIDR multi
F2S2
B -
FEM
A
4.0
5.0
6.0
(μ)
Figu
re B
.15
Dep
ende
ncy
on D
uctil
ity (F
ram
e ‘F
2S2B
’ – M
axim
um In
ter-
Stor
y D
rift R
atio
)
0.00
0.50
0.0
1.0
2.0
3.0
4.0
5.0
6.0
Duc
tility
(μ)
MIDR approx
1.00
1.50
2.00
. / MIDR multiF2
S2B
- 75
%Vy
315

0.00
0.50
1.00
1.50
2.00
0.0
1.0
2.0
3.0
4.0
5.0
6.0
R
MIDR approx. / MIDR multi
F2S2
B -
ATC
0.00
0.50
1.00
1.50
2.00
0.0
1.0
2.0
3.0 R
MIDR approx. / MIDR multi
F2S2
B -
FEM
A
4.0
5.0
6.0
Figu
re B
.16
Dep
ende
ncy
on S
treng
th R
educ
tion
Fact
or (F
ram
e ‘F
2S2B
’ – M
axim
um In
ter-
Stor
y D
rift R
atio
)
0.00
0.50
0.0
1.0
2.0
3.0
4.0
5.0
6.0
R
MIDR approx
1.00
1.50
2.00
. / MIDR multiF2
S2B
- 75
%Vy
316
0.00
0.50
1.00
1.50
2.00
0.0
1.0
2.0
3.0
4.0
5.0
6.0
Duc
tility
(μ)
V approx. / V multi
F2S2
B -
ATC
0.00
0.50
1.00
1.50
2.00
0.0
1.0
2.0
3.0
Duc
tility
V approx. / V multi
F2S2
B -
FEM
A
4.0
5.0
6.0
(μ)
Figu
re B
.17
Dep
ende
ncy
on D
uctil
ity (F
ram
e ‘F
2S2B
’ – M
axim
um B
ase
Shea
r)
0.00
0.50
0.0
1.0
2.0
3.0
4.0
5.0
6.0
Duc
tility
(μ)
V approx
1.00
1.50
2.00
. / V multiF2
S2B
- 75
%Vy
317
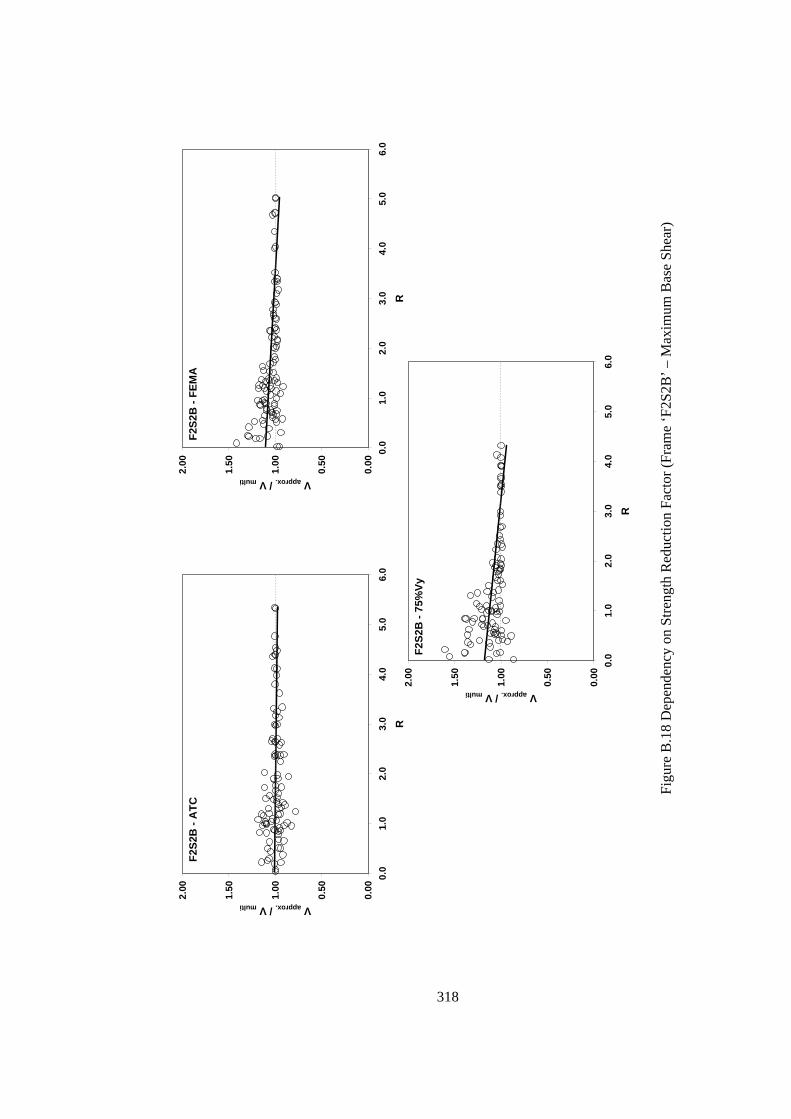
0.00
0.50
1.00
1.50
2.00
0.0
1.0
2.0
3.0
4.0
5.0
6.0
R
V approx. / V multi
F2S2
B -
ATC
0.00
0.50
1.00
1.50
2.00
0.0
1.0
2.0
3.0 R
V approx. / V multi
F2S2
B -
FEM
A
4.0
5.0
6.0
Figu
re B
.18
Dep
ende
ncy
on S
treng
th R
educ
tion
Fact
or (F
ram
e ‘F
2S2B
’ – M
axim
um B
ase
Shea
r)
0.00
0.50
0.0
1.0
2.0
3.0
4.0
5.0
6.0
R
V approx
1.00
1.50
2.00
. / V multiF2
S2B
- 75
%Vy
318

B.3 SUMMARY OF COMPARISONS
The comparison of the demand parameters computed from the approximations
ATC, FEMA and 75%Vy with the results of MULTI method were presented in previous
sections. The comparisons made at different drift, ductility and strength reduction values
showed that ATC method captured the global behavior that was represented by MULTI
method in a better sense with mean errors in the order of 10%. The predictions of ATC
method were even better at elastic range due to the fact that both MULTI and ATC
methods use same initial stiffness. Considering the summarized results given in Tables
B.4-B-6, FEMA and 75%Vy methods over-estimated the displacement and maximum drift
demands within 20 percent with the latter one being more conservative and the over-
estimations were observed to decrease with increasing degrees of inelasticity. The
uncertainty in the predictions was turned out to be in the same order.
Table B.4 Error Statistics for Maximum Top Displacement Estimations
Mean σ Mean σ Mean σF2S2B 0.979 0.132 1.069 0.133 1.196 0.204
F2S2B2 0.996 0.063 1.045 0.055 1.061 0.067F3S2B 1.004 0.086 1.045 0.084 1.074 0.098F5S2B 1.005 0.170 1.137 0.182 1.155 0.210F5S4B 0.975 0.130 1.087 0.104 1.097 0.114F5S7B 1.013 0.213 1.144 0.154 1.182 0.167F8S3B 0.976 0.142 1.111 0.125 1.121 0.130
FRAME ATC FEMA 75%Vy
Table B.5 Error Statistics for Maximum Inter-Story Drift Ratio Estimations
Mean σ Mean σ Mean σF2S2B 0.982 0.127 1.069 0.129 1.187 0.197
F2S2B2 0.996 0.059 1.044 0.053 1.059 0.064F3S2B 1.005 0.080 1.043 0.079 1.071 0.094F5S2B 1.005 0.183 1.147 0.190 1.167 0.218F5S4B 0.975 0.138 1.091 0.108 1.102 0.118F5S7B 1.014 0.228 1.154 0.161 1.195 0.176F8S3B 0.975 0.151 1.116 0.128 1.127 0.132
FRAME ATC FEMA 75%Vy
319

Table B.6 Error Statistics for Maximum Base Shear Estimations
Mean σ Mean σ Mean σF2S2B 1.001 0.072 1.051 0.087 1.098 0.138
F2S2B2 1.003 0.039 1.036 0.043 1.047 0.056F3S2B 1.008 0.044 1.028 0.048 1.042 0.070F5S2B 1.004 0.101 1.073 0.151 1.084 0.179F5S4B 0.985 0.074 1.055 0.091 1.061 0.101F5S7B 1.009 0.113 1.080 0.121 1.100 0.146F8S3B 0.996 0.090 1.071 0.111 1.076 0.120
FRAME ATC FEMA 75%Vy
For the base shear predictions, it was observed that ATC method yielded very
close results with respect to MULTI approach in the elastic range. Unlike ATC, FEMA
and 75%Vy over-estimated the force demand in this range in an error margin of 15%. As it
was expected, after the yield of the systems, all methods yielded similar close results in
terms of maximum base shear.
The overall evaluations with respect to MULTI approach showed that the order of
mean prediction errors remained lowest for ATC, but all methods generally provided
reasonable results in terms of displacement, drift and force demands. Therefore, bi-linear
models of pushover curves can likely be used for simplified analyses without the need for
introducing complex models of capacity curves.
320