influence of innovations on supply chain performance in ... · pdf fileinfluence of warehouse...
TRANSCRIPT
Page 341 www.ijiras.com | Email: [email protected]
International Journal of Innovative Research and Advanced Studies (IJIRAS)
Volume 4 Issue 4, April 2017
ISSN: 2394-4404
Influence Of Innovations On Supply Chain Performance In Retail
Sector: A Case Study Of Nakumatt Holdings Supermarket
Joyce Jeruto Kiprotich
Dr. Charles Nyiro (Supervisor)
Masters of Science in Procurement and Logistics
The Department of Procurement and Logistics,
School of Entrepreneurship, Procurement & Management,
Jomo Kenyatta University of Agriculture and Technology, Kenya
I. INTRODUCTION
A. BACKGROUND TO THE STUDY
The quest for competitive advantage has always
compelled firms to adopt innovation in supply chains
management. Supply chain operations have also been
hampered by an increasing number of natural and manmade
disruptions. Coupled with an increasing global reach and
product complexity, firms are finding it tough to provide
innovative products and services to their customers (Lee et al.,
2007). Innovation has redefined supply chain management in
many retail firms by adopting new ways to store, process,
distribute and exchange information both within companies
and with customers and suppliers in the supply chain.
Innovation technologies such as Vendor Managed Inventory
(VMI) and Collaborative Planning, Forecasting and
Replenishment (CPFR) are based on an increased level of
automation in both the flow of physical materials and goods
and the flow of information between companies to improve
Abstract: The adoption of innovation has been necessitated by the rapid change in technology. The quest for
competitive advantage has always compelled firms to adopt innovation in supply chain management. Supply chain
operations have also been hampered by an increasing number of natural and manmade disruptions. Coupled with an
increasing global reach and product complexity, firms are finding it tough to provide innovative products and services to
their customers. The general objective of the study was to determine the effects of innovations on the performance of
Supply Chain of Nakumatt Holdings supermarket, Kenya. The specific objectives of the study were to establish the
influence of warehouse management system on supply chain performance in Nakumatt Holdings supermarket, to
determine the effect of material resource planning on supply chain performance in Nakumatt Holdings supermarket, to
examine the influence of enterprise resource planning on supply chain performance in Nakumatt Holdings supermarket
and to find out the effect of Vendor managed inventory on supply chain performance in Nakumatt Holdings
supermarket.The research reviewed theories and empirical studies that explain the relationship between innovation
adoption and supply chain performance. This included Transaction Cost Economics (TCE) theory, Resource Based View
theory, and Theory of Technology Acceptance which are theories governing the adoption of innovation in organizations.
The Target population in this study was Nakumatt holdings Supermarket four branches in Nairobi County. Primary data
was collected using questionnaires. The data that was collected related to the level of innovation adapted, influence of
warehouse management system, material resource planning, enterprise resource planning, and vendor managed
inventory on supply chain performance in Nakumatt Holdings supermarket. Data analysis was done using Statistical
Package for Social Sciences (SPSS) version 24 where inferential statistics was applied and multiple regressions employed
to test the relationship between innovation and the supply chain performance of Nakumatt holding Supermarket.

Page 342 www.ijiras.com | Email: [email protected]
International Journal of Innovative Research and Advanced Studies (IJIRAS)
Volume 4 Issue 4, April 2017
ISSN: 2394-4404
the efficiency in the entire supply chain (Daugherty et al.,
2009).
As dynamic resources, supply chain innovations influence
the transformation of raw materials into finished goods,
reduces costs and lead-time, improved quality and on-time
delivery, and subsequently firm success (Prasad & Heales,
2010). Innovation also facilitates communication, real-time
information sharing, as well as reduced costs of inventory and
transaction (Prajogo & Olhager, 2012). The use of innovations
allows suppliers, manufacturers, distributors, retailers, and
customers to reduce lead time, paperwork, and other
unnecessary activities. It is also mentioned that managers will
experience considerable advantages with its use such as the
flow of information in a coordinated manner, access to
information and data interchange, improved customer and
supplier relationships, and inventory management not only at
the national level but also internationally (Handfield &
Nichols, 2014). Turner (2010) indicates that firms cannot
effectively manage cost, offer high customer service, and
become leaders in supply chain management without the
incorporation of top of-the-line innovations.
The changing business environment and technology
advancements increased the level of competition and also the
need for innovation for survival and growth. Innovation can be
focused on cost improvements, process improvements,
product or service line extensions, new uses/reuse, new
markets and customers or new technologies (Das and Nair,
2010).
Christmann (2000) suggested that the organizations
having capabilities for process innovation and implementation
will be leaders in sustainability. Storer and Hayland (2009)
proposed that like the firm, the supply chain also should use
innovation to provide unique value adding solutions for the
supply chain that provides a market competitive advantage.
Employing a supply chain‟s innovation capacity indicates the
willingness of groups of actors within the supply chain to take
steps, or perform activities that ultimately produce output that
improves or changes current activities to meet a market need
or new trajectory (Storer & Hyland, 2009). The introduction of
new products and services, or entry into new markets, is likely
to be more successful if accompanied by innovative supply
chain designs, innovative supply chain management practices,
and enabling technology (Stentoft et al., 2011).
Currently, retail is one of the biggest employers in the
world and a large portion of the world economy. The retail
industry is a sector of the economy that is comprised of
individuals and companies selling finished products to end
user consumers. The retail market in Africa is still in its
infancy in most states except in North and South Africa where
Egypt and South Africa are leading in terms of sales volumes
and branch networking. According to the bureau of market
research of South Africa the retail sector is sophisticated and
supplied by both local and imported products. The bureau puts
the total retail sales of 2010 at 41.12M Dollars of which 30%
represents food sales. In Kenya there are four major players in
the market namely: the Nakumatt holdings Limited, the
Tusker Mattresses Limited, Uchumi supermarkets limited and
Naivas Supermarket Limited. There‟re also over one hundred
small but upcoming supermarkets. The industry is fiercely
competitive.
a. INNOVATION
According to Rogers (1995) innovation is an idea,
practice, or object that is perceived as new by an individual or
other unit of adoption. Innovation is considered as an effective
way to improve firm‟s productivity due to the resource
constraint issue facing a firm (Capon, 1990). According to
Chaminade and Vang (2006), innovation involves the design,
the development and the implementation of innovative
instruments and processes, and the formulation of creative
solutions to problems in an organization. This definition was
adopted for the purpose of this study. Lehtimaki (1991)
believes that innovation is an essential element for economic
progress of a country and competitiveness of an industry.
Susman et al. (2006), argues that innovation is one of the most
important competitive weapons and generally seen as a firm‟s
core value capability.
Firms are constantly thriving to develop and test new
ideas, products and services. Mainly for service industries,
supply chain innovation is required for ensuring effective
service delivery (Chapman et al., 2003). According to Disney
and Towill (2008), global retail outlets such as Wallmatt,
Foodex and Safeways have integrated innovations such as
Vendor Inventory System systems in the supply chain
management. It is also able to reduce the time needed for
managing the inventory level, set up the minimum order to
optimize loading, improve plans to minimize costs or
disruptions in the whole supply chain, detect deficiencies or
surplus in the goal financial statements and give more trust in
the relationship of both sides (Choi, 2004).
b. SUPPLY CHAIN PERFORMANCE
According to Serem (2002), performance is the ability to
perform or capacity to achieve desired results. Supply chain
performance seeks to improve the productivity of the supply
chain though measuring of the whole supply chain instead of
focusing on the functional units. There is a developing
requirement to focus on the performance of the supply chain.
According to Sharma (2005) the commonly used measures of
supply chain performance are the balance score card and
SCOR model. An effective SCM Performance System should
be established and implemented in accordance with
departmental policies and procedures and applicable
legislative requirements (Maskin, 2004).
Organizations are adopting various strategies to enhance
supply chain performance. Automation, use of computer aided
systems and the use of the internet has become very popular.
In the attempt to link up with the suppliers and customers,
organizations resort to use of innovations that provide real
time link with the stakeholders. Some have resorted to e-
commerce and e-supply chain management (Billington, 2010).
The success of supply chain depends on the ease of
information flow between the organization and the
stakeholders (Suppliers and Customers). Information affects
all supply chain processes such as inventory forecasts,
inventory allocation, and production planning among other
operations (Giménez & Lourenço, 2014).
Page 343 www.ijiras.com | Email: [email protected]
International Journal of Innovative Research and Advanced Studies (IJIRAS)
Volume 4 Issue 4, April 2017
ISSN: 2394-4404
B. STATEMENT OF THE PROBLEM
Although studies have shown that innovation is critical to
the survival of most organizations, most supermarkets have
not adapted innovation in their operations. Consequently, their
performance is dwindling and this has been attributed to
competition. Nakumatt Holdings Supermarket in Kenya is one
such example (Buvik and John, 2000). There is therefore, need
to ensure supermarkets growth and continuity by
implementing innovation. This study therefore seeks to look at
certain innovative instruments, see how they have been
applied within Nakumatt Holdings Supermarket and how
effective they have been in improving operational efficiency.
In today‟s rapidly changing and highly competitive retail
industry, every forward looking retailer will endeavor to
ensure its products reach store‟s shelves ahead of the
competitors (Risch, 1991). Supermarkets play an important
role in Kenya‟s economy. They have created employment to
thousands of Kenyans. Supply chain technology and supply
chain management have attracted attention from many
researchers as two separate research areas, however few other
researchers have combined those (Shen et al., 2004).
According to Kenya Economic Survey (2015), wholesale and
retail trade sector which supermarkets are part of is among top
five sectors that have driven Kenya‟s growth in the last five
years. There is need to ensure supermarkets growth and
continuity by implementing innovation. In recent times, there
have been reports of supermarkets facing supply chain
management challenges resulting to low returns and closure.
Their performance is dwindling and this has been attributed to
competitive pressures. Nakumatt Holdings Supermarket in
Kenya is one such example (Buvik and John, 2000).
There is a significant amount of research demonstrating
the adoption of innovation in supermarkets. For example, Yu
& Ramanathan, (2008) studied ICT adoption in UK firms and
found out that out of 41 retail businesses that included
supermarkets, 20 had installed high technology in ICT and had
achieved significant operational efficiency. Otiso, Chelangat,
& Bonuke (2012) carried out a research that aimed at
establishing effectiveness of ICT in service quality delivery at
Kenya Power and Lighting Company. The study found out
that ICT boosted service quality and improved customer
satisfaction. Omwansa (2013) in his study on ICTs and
operational efficiency in supermarkets in Nairobi found out
that the supermarkets with largest extent of ICT application in
their premises had the highest operational efficiency. Majority
of the existing studies do not address the influence of
innovations adopted in supply chain performance of Nakumatt
Holdings supermarket, Nairobi. This study sought to identify
the influence of warehouse management system, material
resource planning, enterprise resource planning, and vendor
managed inventory on supply chain performance in Nakumatt
Holdings supermarket.
C. RESEARCH OBJECTIVES
a. GENERAL OBJECTIVE
The general objective of the study was to determine the
influence of innovations on the supply chain performance of
retail industry.
a. SPECIFIC OBJECTIVES
To establish the influence of warehouse management
system on supply chain performance in Nakumatt
Holdings supermarket.
To determine the effect of material resource planning on
supply chain performance in Nakumatt Holdings
supermarket.
To examine the influence of enterprise resource planning
on supply chain performance in Nakumatt Holdings
supermarket.
To find out the effect of vendor managed inventory on
supply chain performance in Nakumatt Holdings
supermarket.
II. LITERATURE REVIEW
A. THEORETICAL REVIEW
The theoretical framework is a summary of the theories
related to a particular problem that is developed through a
review of previously tested knowledge of the variables
involved (Breakwell, Hammon, Fife-Schaw & Smith, 2007). It
identifies a plan for investigation and interpretation of the
findings. The theoretical framework involves a well-supported
rationale and is organized in a manner that helps the reader
understand and assess your perspective (Creswell, 2005). The
Main purpose of theoretical review is to show what other
authors have done and relates to the researcher field. In this
study, theory of Technology Acceptance, Transaction Cost
Economics (TCE) and the Resource Based View (RBV)
theory.
B. EMPIRICAL REVIEW OF VARIABLES
a. WAREHOUSE MANAGEMENT AND SUPPLY
CHAIN PERFORMANCE
A Warehouse Management System (WMS) is an
innovation that is a key part of the supply chain and primarily
aims to control the movement and storage of materials within
a warehouse and process the associated transactions, including
shipping, receiving, put away and picking. Warehouse
management systems often utilize automatic identification and
data capture technology, such as barcode scanners, mobile
computers, wireless LANs and potentially radio-frequency
identification (RFID) to efficiently monitor the flow of
products (Das & Nair, 2014).
The key function of a warehouse control system is to
receive information from the upper level host system, most
often being the warehouse management system, and translate

Page 344 www.ijiras.com | Email: [email protected]
International Journal of Innovative Research and Advanced Studies (IJIRAS)
Volume 4 Issue 4, April 2017
ISSN: 2394-4404
it for the daily operations. A common goal is to ensure a
situation where warehouse employees never have to retype
information because it already lies in one system or is
collected automatically. Warehouse control system is usually
the interface that is used to manage processes, people and
equipment on the operational level.
Lee (2010) argued that implementation of Warehouse
Management System (WMS) provide an increase in accuracy,
reduction in labor costs if the labor employed to maintain the
system is less than the labor saved on the warehouse floor and
a greater ability to service the customer by reducing cycle
times. WMS not only lead in inventory reduction but also in
greater storage capacity. An increase in accuracy and
efficiency of the receiving process leads to reduction in level
of safety stock required. But the consequence of this reduction
will hardly be visible to the overall inventory levels. WMS
might just not affect the factors (lot sizing, lead times and
demand variability) controlling the inventory levels. However,
WMS is instrumental in more efficient and organized that
leads to increased storage capacity (Lee, 2010).
b. MATERIALS RESOURCE PLANNING AND
SUPPLY CHAIN PERFORMANCE
Materials Resources Planning is an innovation that assists
in the detailed planning of production and its characteristics
are that; it is geared specifically to assembly operations, it is a
dependent demand technique and it is a computer based
information system. The aim of MRP is to make available
either purchased or company manufacturing assemblies just
before they are required by the next stage of production or for
delivery. It enables orders to be tracked throughout the entire
manufacturing process and assist purchasing and control
departments to move the right supplies at the right time to
manufacturing or distribution points (Lysons & Farrington,
2006). Using barcode technology integrated with the MRP
system saves time, increases efficiency and, above all,
improves accuracy. It can help maximize productivity for
warehouses, distribution centers and manufacturers alike.
Businesses also have their pick of a wide variety of barcode
solutions, each offering different levels of automation,
allowing them to find the right fit (Stank, Dittmann, & Autry,
2011).
Distribution requirements planning (DRP) is scheduling
technique that controls inventory control and applies Materials
Resources Planning principles to distribution inventories. It
can also be considered as a method of handling replenishment
of the stock in an organization. DRP is useful for both
manufacturing organizations, such as car manufactures that
sell their car via several distribution points, such as regional
and local distributors, and purely merchandising
organizations, such as supermarkets (William, 2009).
c. ENTERPRISE RESOURCE PLANNING AND
SUPPLY CHAIN PERFORMANCE
Enterprise Resource Planning innovation is a process by
which a company manages and integrates the important parts
of its business. ERP is designed to replace paper-based
systems by analysing data from all areas of a company‟s
resources. ERP covers all functions of a business such as
purchasing, manufacturing, distribution, and inventory
management. ERP is designed around a number of modules
each of which can stand alone or combined with others that
include finance, logistics, manufacturing, supplier
management and human resources (Stevenson, 2007).
According to Shields (2001), firms expand the scope of
their implementations by web enabling their ERP systems to
facilitate self-service usage and link their supply chain
activities to obtain increased performance. This is as a result
among firms that fully integrated system deployment across
the supply chain and effective system usage would help garner
synergistic benefits. For an organization to provide effective
ERP integration to the SCM, it should encompass all the
functions responsible for development and execution of each
of the core activities: plan, source, make, deliver, and return
processes, as well as the supporting infrastructure (Cohen,
2006).
ERP systems are comprised of integrated modules that
support intra-firm and inter-firm business activities, and firms
implement those ERP system modules, which ensure the
availability of full system functionality for meeting all their
business needs (Appelrath & Ritter, 2000). Some of the ERP
systems that are commonly being implemented include:
procurement, sales and distribution, inventory and material
management, quality management, manufacturing, planning
and control, plant and machine maintenance, warehousing
systems and customer relationship systems. T.
d. VENDOR MANAGED INVENTORY AND SUPPLY
CHAIN PERFORMANCE
Vendor Managed Inventory (VMI) is one of the many
innovation that strive towards closer cooperation between the
members of supply chains in the area of inventory and demand
management (Daughtery et al., 2009). Vendor Managed
Inventory is an inventory management process that falls under
the „push‟ stock management processes. These are processes
that are triggered by interpretation of an expected demand in
inventory and supply is scheduled to meet this demand.
Vendor Managed Inventory/Consignment Stock is inventory
that is in the possession of the buyer (shop, warehouse or
store), but is still owned by the supplier. Payment of the
inventory is made once it is sold. Accordingly, the capital
investment on the stock comes from the supplier and the buyer
provides space for it (Kumar & Kumar, 2003).
The Vendor Managed Inventory initiative has the goal of
accomplishing deeper integration and collaboration between
the members of the supply chain in order to cope with the ever
decreasing time windows for product and service fulfilment,
and the requirements for the improvement of operational
efficiency. Benefits cited as a result of adoption of Vendor
Managed Inventory systems include lowered inventory levels,
faster inventory turns, reduced ordering and administrative
costs, better cash flow management, zero obsolescence,
increased sales, and reduced out-of-stock costs among others
(Angulo, Nachtmann, & Waller, 2004).
Lee (2010) found that Vendor Managed Inventory greatly
reduced inventory-carrying costs and stock-out problems
while, at the same time, it offered the ability to synchronize

Page 345 www.ijiras.com | Email: [email protected]
International Journal of Innovative Research and Advanced Studies (IJIRAS)
Volume 4 Issue 4, April 2017
ISSN: 2394-4404
both inventory and transportation decisions. Fox (2006) noted
that Vendor Managed Inventory‟s advantages included
improved customer service, reduced demand uncertainty,
reduced inventory requirements and reduced cost based on a
case study at Johnson and Johnson. In a Vendor Managed
Inventory‟s partnership, the supplier, usually the manufacturer
but sometimes a reseller or distributor, makes the main
inventory replenishment decisions for the consuming
organization. This means that the vendor monitors buyers
inventory levels (physically or via electronic messaging) and
makes periodic re-supply decisions regarding order quantities,
shipping and timing. Transactions that are customarily
initiated by the buyer, such as purchase orders, are initiated by
the supplier. Indeed the purchase order acknowledgement
from the vendor may be the first indication that a transaction is
taking place; an advance shipping notice informs the buyer of
materials in transit (Lee, 2010).
C. EMPIRICAL REVIEW
Ageron et al. (2013), argue that operational processes,
innovations, and managerial processes improve supply chain
management performance. Golgeci & Ponomarov (2013)
found a positive association between innovativeness and
innovation magnitude with Supply Chain resilience. Oke &
Prajogo (2013) found supply chain partner innovativeness to
influence product innovation strategy. They also show that the
impact of supply chain partner innovativeness on innovation
strategy is improved with stronger strategic relationship with
key partners. Chong, Chan, Ooi, & Sim (2011) found that
supply chain practices of Malaysian firms improve firms‟
innovation and organizational performance. Lee, Lee, &
Schniederjans (2011) found that supply chain innovation
reduces operational cost, lead time, create superior operational
strategies, enhance quality, and provide visibility and
flexibility for dealing with rapid changes in customer demand.
Locally, various studies on the topic of innovation have
been carried out by a number of researchers. Aswani (2010)
carried out a study on strategic innovations and performance
of public universities. The study concluded that there exist a
positive relationship between strategic innovation and
performance of public universities. Kemoli (2010) carried out
a study on strategic innovations and performance of
commercial banks listed in NSE. The study concluded that
listed Commercial banks had deviated from the existing
industry rules and engaged in creation of new and significant
customer value and that strategic innovation was embedded in
their corporate strategy. Karanja (2009) carried out a study on
innovation strategies adopted by insurance companies in
Kenya. The study concluded that companies with strong
technology-enabled innovation strategies are more likely to
secure competitive advantage and create superior shareholder
value. Lusweti (2009) reviewed innovation strategies adopted
by radio stations in Kenya. This study concluded that
innovation strategies are very essential in any business and
hence they should be put in place at any cost since it helps the
organization to realize their objectives.
III. RESEARCH METHODOLOGY
A. RESEARCH DESIGN
Research design is the plan, structure and strategy of
investigation conceived so as to obtain answers to research
questions and control variance. A descriptive study is
concerned with determining the frequency with which
something occurs or the relationship between variables
(Cooper & Schindler, 2003). This approach was suitable for
this study since the researcher intended to collect detailed
information through descriptions making it useful to identify
variables under the study.
B. POPULATION AND TARGET POPULATION
Population refers to the entire group of people, events, or
things of interest that the researcher wishes to investigate
(Cooper & Schindler, 2003). The Target population in this
study was Nakumatt holding Supermarket seventeen (17)
branches in Nairobi County that includes senior personnel in
the following departments; finance division, customer care,
supply and administration, sales and marketing department.
The study targeted the personnel in those departments as they
are better position to answer questions relating to innovations
adopted by the company. From the 17 branches the researcher
adopted random sampling to obtain four (4) branches (strata),
that includes; Nakumatt Cross-road, Nakumatt Galleria,
Nakumatt Prestige and Nakumatt Junction.
Population refers to an aggregate or totality of all the
objects, subjects or members that conform to a set of
specifications (Polit and Hungler, 1999). The four branches
had a population of four hundred and fifty three (453) staffs.
C. SAMPLE AND SAMPLING TECHNIQUE
To come up with an appropriate study sample, the study
utilized stratified sampling technique where the Nakumatt
Holding Supermarkets will be classified into different
branches. The rationale behind the selection of the stratified
sampling was because the Nakumatt branches are evenly
distributed across Nairobi County and this ensured collection
of unbiased data. The strata‟s was Nakumatt Cross-road,
Nakumatt Galleria, Nakumatt Prestige and Nakumatt Junction
Branches. Purposive sampling was then used to pick
employees to participate in the study. According to Mugenda
& Mugenda (2003) a sample size of 10% to 30 % is a good
representation of the target population and hence the 15% is
adequate for analysis. The sample size of this study was
therefore 68 employees of Nakumatt supermarket.
D. INSTRUMENT
According to Massey (2003), a data collection instrument
or tool is a device used to collect the data. The type of
instrument used by the researcher depends on the data
collection method selected. Massey (2003), further states that
the instrument must be reliable and valid. The study used
structured questionnaires to obtain data from respondents.
Questionnaire was calibrated using a five point Likert Scale,
Page 346 www.ijiras.com | Email: [email protected]
International Journal of Innovative Research and Advanced Studies (IJIRAS)
Volume 4 Issue 4, April 2017
ISSN: 2394-4404
ranging from „strongly agree‟ (SA) to „strongly disagree‟
(SD). The questionnaire consisted of both close and open
ended items. The questionnaires was structured as follows:
Section I: Background Information, Section II: The influence
of warehouse management system on supply chain
performance in Nakumatt Holdings supermarket, Section III:
The effect of material resource planning on supply chain
performance in Nakumatt Holdings supermarket, Section IV:
The influence of enterprise resource planning on supply chain
performance in Nakumatt Holdings supermarket , and Section
V: The effect of Vendor managed inventory on supply chain
performance in Nakumatt Holdings supermarket.
E. DATA COLLECTION PROCEDURE
Prior to administering study instruments, a brief
introduction was made to the respondents explaining the
nature and importance of the study to the respondents during
pilot and main study. Data collection was done by the drop
and pick method. The questionnaires were dropped at
Nakumatt Holding Supermarket branches in Nairobi and later
picked. According to Leedy and Ormrod (2001), respondents
are more truthful while responding to the questionnaires
regarding controversial issues in particular due to the fact that
their responses are anonymous.
F. PILOT TEST
The research instrument that was used to collect data is
questionnaires. Validity shows whether the items measure
what they are designed to measure (Borg and Gall, 1989).
Pre-testing was conducted to assist in determining accuracy,
clarity and suitability of the research instrument. Borg and
Gall (1996), notes that two to three cases are sufficient for
some pilot studies. For this study, pilot study was done on
Nakumatt supermarket lifestyle. Those who participated on
the pilot test did not participate on the actual study. Content
validity was examined to ensure the instruments would answer
all the research questions. Based on the analysis of the pre-test
results, the researcher made corrections, adjustments and
additions to some research instruments.
G. DATA PROCESSING AND ANALYSIS
The data collected was coded and entered into the
computer and analyzed using descriptive statistics with the
help of SPSS version 24. The researcher used percentages,
frequencies, and inferential analysis to establish the
relationship between innovation and supply chain performance
of Nakumatt holdings supermarket. Data collected was
presented using tables. The data was coded, assigned labels to
variables categories and entered into the computer. Pearson‟s
Correlation Coefficient and ANOVA was used to establish the
significance of the correlation between innovation and supply
chain performance at Nakumatt Holdings Supermarket.
IV. DATA ANALYSIS, RESULTS AND DISCUSSION
A. RESPONSE RATE
The respondents comprised of Nakumatt holding
supermarket employees in Nairobi County that includes senior
personnel in the following department; finance division,
customer care, supply and administration, sales and marketing
department. Out of the 68 issued questionnaires, 60
questionnaires representing 88% of the total questionnaires
distributed were returned fully completed, while 8
questionnaires were not returned representing 12% of the total
questions distributed to the respondents. The table 4.1 presents
that the response rate was 88% of the total sample size and the
non-response was 12%. The response of 88% facilitated
towards gathering sufficient data that was generalized to
reflect the opinions of respondents. This was in tandem with
Graham (2002) that a response rate above 30 to 50% of the
total sample size contributes towards gathering of sufficient
data that could be generalized to represent the opinions of
respondents in the target population on the sought study
problem.
B. PILOT TEST RESULTS
a. VALIDITY
To establish the validity of the data collection
instruments, the research instruments were given to
respondents at Nakumatt supermarket lifestyle branch. The
coefficient of the data gathered from the pilot study was
computed with assistance of Statistical Package for Social
Sciences (SPSS) Version 24. A context of validity coefficient
index of above 0.82 was obtained and this implied that the
questionnaires were valid research instrument for the study.
b. RELIABILITY ANALYSIS
The results in the table 4.2 show Cronbach‟s alpha of well
above 0.7 and most of it above 0.8 implying that the
instruments were sufficiently reliable for measurement. The
study accepted a Cronbach alpha of 0.7 and above. Since most
items total correlations were reasonably high, the construct
validity of the instrument was considered reasonable (Brown,
2006).
Constructs Cronbach's
Alpha Values
Comments
Warehouse management 0.738 Accepted
Material resource planning 0.812 Good
Enterprise resource
planning
0.864 Good
Vendor managed inventory 0.882 Good
Table 4.1: Reliability Results
C. DEMOGRAPHIC INFORMATION
The section contains information on the demographic
characteristics of the respondents such as gender, age, highest
level of education, department and years of experience and
level of management.

Page 347 www.ijiras.com | Email: [email protected]
International Journal of Innovative Research and Advanced Studies (IJIRAS)
Volume 4 Issue 4, April 2017
ISSN: 2394-4404
a. GENDER OF THE RESPONDENTS
The study sought to establish the gender of the
respondents in order to establish the level of gender
representation within the supermarket. Figure 4.1 below shows
the gender characteristics of the respondents.
Figure 4.1: Gender of Respondents
Based on the study results on figure 4.1 above majority
(75.0%) of the respondents indicated that they were males,
while the least (25.0%) were of female gender.
b. AGE BRACKET OF RESPONDENTS
Respondents were asked their age bracket and the
findings are as shown in Figure 4.2;
Figure 4.2: Age of Respondents
Figure 4.2 presents that majority (75.0%) of the
respondents who were in the age category of 26-35 years, 15.0
% were below years, 6.7% were in the category of 36-45 years
while only 3.3% were aged between 46-55. No respondent
were aged above 56 years. This suggests that most of the
respondents are considered to be the productive years.
c. HIGHEST EDUCATION LEVEL
The study sought to establish the education level held by
the employees in order to ascertain if they were equipped with
relevant knowledge and skills in their area of work. Table 4.3
below shows the highest level of education of the respondents.
Frequency Percent
Masters 4 6.7
Degree 13 21.7
Diploma 27 45.0
Certificate 12 20.0
Others 4 6.7
Total 60 100.0
Table 4.2: Highest level of education
The findings in Table 4.2 shows majority of the
respondents (45.0%) had attained a Diploma as their highest
level of education while 21.7% had a Bachelor‟s degree. The
study further established that 20.0% of the respondents had a
certificate, and 6.7% with masters. Moreover, 6.7% indicated
they had other qualifications and Table 4.3 shows what they
specified. This indicates that the respondents were in a
position to answer the questionnaire.
Count Column N %
If your highest
education level is
Other, please specify
CPA 3 75.0%
O Level 1 25.0%
Table 4.3: Other qualifications
Table 4.3 reveals that 4 respondents said they had other
qualifications where 3 respondents had CPA certification
(75.0%) and 1 attained O level (25.0%).
d. YEARS OF EXPERIENCE
The study on figure 4.3 below shows the number of years
the respondents have been working at Nakumatt Supermarket.
Figure 4.3: Years of experience
Results shown on Figure 4.3 above indicate that the study
majority (46.7%) of the respondents had served in the
supermarket for between 5-10 years. A further 43.3% had
served between 1-5 years, and 10.0% had served below 1 year.
The outcome reveals that the respondents were experienced in
their area of work implying that their responses portray the
true activities which are in place.
e. DEPARTMENT
The respondents were asked to indicate the department
where they work. The findings are shown in Table 4.5 below;
Frequency Percent
Accounts 9 15.0
Beverage 2 3.3
Clerk 3 5.0
Customer service 5 8.3

Page 348 www.ijiras.com | Email: [email protected]
International Journal of Innovative Research and Advanced Studies (IJIRAS)
Volume 4 Issue 4, April 2017
ISSN: 2394-4404
IT 9 15.0
Management 4 6.7
Marketing 8 13.3
Procurement 16 26.7
Sales 2 3.3
Soaps 2 3.3
Total 60 100.0
Table 4.4: Department
The findings indicated that majority of the respondents
(26.7%) were from the procurement department, Accounts and
Information technology each had 15.0 %. In addition,
Marketing had 13.3%, Customer service had 8.3%,
Management comprised of 6.7%, and clerks comprised of
5.0%. Beverage, sales, and soaps each had 3.3% of the
respondents. This shows that all the department were
represented in the study.
f. LEVEL OF MANAGEMENT
Respondents were asked to indicate the level of
management. The findings are shown in Table 4.5
Level of Management Frequency Percent
Senior 10 16.7
Middle Management 38 63.3
Operational Level 12 20.0
Total 60 100.0
Table 4.5: Level of Management
Majority of the respondents were on middle management
level (63.3%), 20.0% of the respondent were on operational
level while 16.7 % of the respondents were on senior level
management. This shows that the respondents were spread
across the three levels of management.
D. STUDY VARIABLES
a. WAREHOUSE MANAGEMENT SYSTEM
This section of the questionnaire sought to get from the
respondents on the influence of warehouse management
system on supply chain performance in Nakumatt Holdings
Supermarket. The range was „strongly agree (1) to „strongly
disagree‟ (5). The scores of agreeing have been taken to
represent a variable which had a mean score of 0 to 2.4 on the
continuous Likert scale; (0≤ Mean<2.4). The scores of
„Undecided have been taken to represent a variable with a
mean score of 2.5 to 3.4 on the continuous Likert scale:
(2.5≤Mean<3.4) and the score of both disagree and strongly
disagree have been taken to represent a variable which had a
mean score of 3.5 to 5.0 on a continuous Likert scale; (3.5≤
S.A. <5.0). A standard deviation of > 0.9 implies a significant
difference on the impact of the variable among respondents.
N Mean Std.
Deviation
Warehousing Management
System has enabled tracking
movement of stock units in
the warehouse/stores
60
2.40 1.138
Warehousing Management
System has made stock taking
in the warehouse easier
60
2.47 1.295
Warehousing Management
System has provided greater
data accuracy on inventories
60
2.48 1.157
Warehousing Management
System has enhanced the
receipt and dispersal of
inventory entering or leaving
warehouse
60
2.60 1.224
Warehousing Management
System has reduced
pilferages of inventory
60
2.40 1.182
Valid N (listwise) 60
Table 4.6: Warehouse management system
From the result in Table 4.6 above, warehousing
Management System has enabled tracking movement of stock
units in the warehouse/stores (mean = 2.40, SD =1.138),
warehousing Management System has reduced pilferages of
inventory (mean = 2.40, SD =1.182), warehousing
Management System has made stock taking in the warehouse
easier (mean = 2.47, SD =1.295), warehousing Management
System has provided greater data accuracy on inventories
(mean = 2.48, SD =1.157), and warehousing Management
System has enhanced the receipt and dispersal of inventory
entering or leaving warehouse (mean = 2.60, SD =1.224).
The mean ranged from 2.4 to 2.6. This meant that the
respondents agreed on some statements and were not sure
(undecided) on some other statements posed in the
questionnaire. Therefore the warehouse management system
put in place was not adequate to improve supply chain
performance.
The findings of the study agreed with Lee (2010) who
argued that implementation of Warehouse Management
System (WMS) provide an increase in accuracy, reduction in
labor costs if the labor employed to maintain the system is less
than the labor saved on the warehouse floor and a greater
ability to service the customer by reducing cycle times.
The respondents also cited that there was use of barcodes
in their warehouses and generally Warehouse Management
System integration which has led to reduced time taken on
stock taking, increased efficiency in the warehouse and that it
has improved accuracy especially the stock. This agreed with
Stank, Dittmann, &Autry (2011) which said that using
barcode technology integrated with the MRP system saves
time, increases efficiency and, above all, improves accuracy.
Barcodes can also help maximize productivity for warehouses,
distribution centers and manufacturers alike.
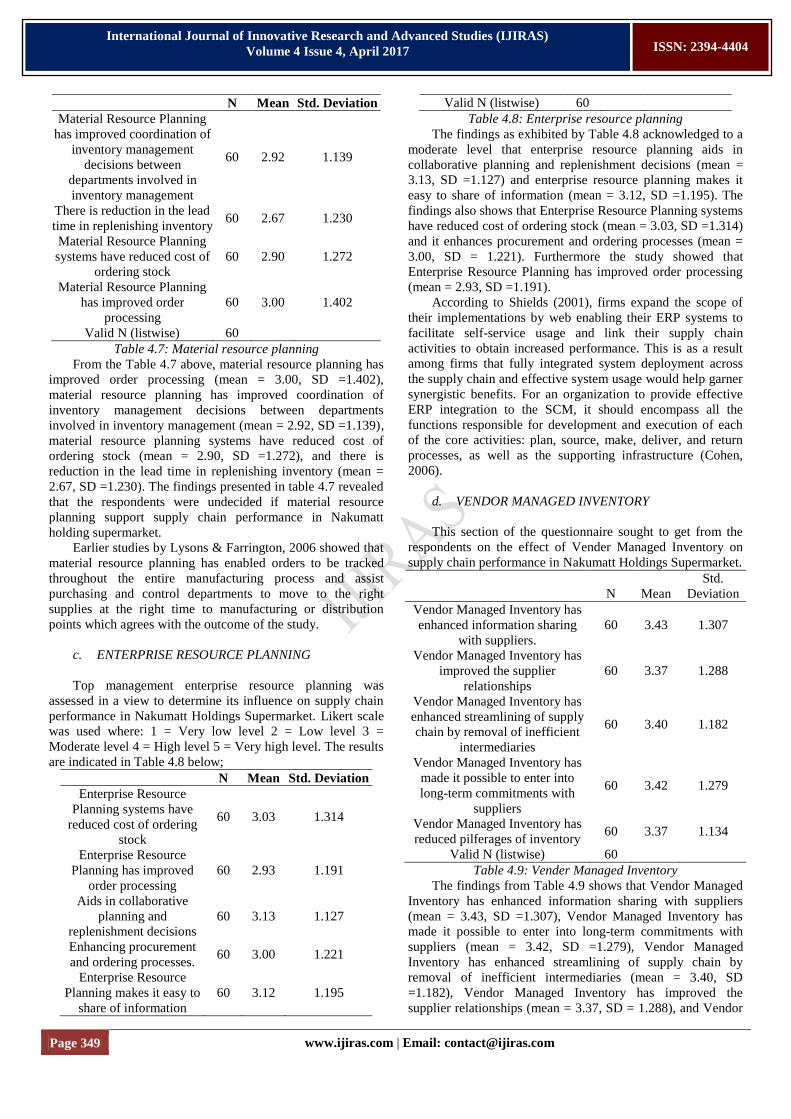
b. MATERIAL RESOURCE PLANNING
This section of the questionnaire sought to get from the
respondents on the effect of material resource planning on
supply chain management. Likert scale was used where mean
ranging from 0 to 2.5 (0≤ Mean<2.4) meant disagree, 2.5 to
3.4 (2.5≤Mean<3.4) meant undecided, and the score of both
agree and strongly agree have been taken to represent a
variable which had a mean score of 3.5 to 5.0 (3.5≤
Mean<5.0).
Page 349 www.ijiras.com | Email: [email protected]
International Journal of Innovative Research and Advanced Studies (IJIRAS)
Volume 4 Issue 4, April 2017
ISSN: 2394-4404
N Mean Std. Deviation
Material Resource Planning
has improved coordination of
inventory management
decisions between
departments involved in
inventory management
60 2.92 1.139
There is reduction in the lead
time in replenishing inventory 60 2.67 1.230
Material Resource Planning
systems have reduced cost of
ordering stock
60 2.90 1.272
Material Resource Planning
has improved order
processing
60 3.00 1.402
Valid N (listwise) 60
Table 4.7: Material resource planning
From the Table 4.7 above, material resource planning has
improved order processing (mean = 3.00, SD =1.402),
material resource planning has improved coordination of
inventory management decisions between departments
involved in inventory management (mean = 2.92, SD =1.139),
material resource planning systems have reduced cost of
ordering stock (mean = 2.90, SD =1.272), and there is
reduction in the lead time in replenishing inventory (mean =
2.67, SD =1.230). The findings presented in table 4.7 revealed
that the respondents were undecided if material resource
planning support supply chain performance in Nakumatt
holding supermarket.
Earlier studies by Lysons & Farrington, 2006 showed that
material resource planning has enabled orders to be tracked
throughout the entire manufacturing process and assist
purchasing and control departments to move to the right
supplies at the right time to manufacturing or distribution
points which agrees with the outcome of the study.
c. ENTERPRISE RESOURCE PLANNING
Top management enterprise resource planning was
assessed in a view to determine its influence on supply chain
performance in Nakumatt Holdings Supermarket. Likert scale
was used where: 1 = Very low level 2 = Low level 3 =
Moderate level 4 = High level 5 = Very high level. The results
are indicated in Table 4.8 below;
N Mean Std. Deviation
Enterprise Resource
Planning systems have
reduced cost of ordering
stock
60 3.03 1.314
Enterprise Resource
Planning has improved
order processing
60 2.93 1.191
Aids in collaborative
planning and
replenishment decisions
60 3.13 1.127
Enhancing procurement
and ordering processes. 60 3.00 1.221
Enterprise Resource
Planning makes it easy to
share of information
60 3.12 1.195
Valid N (listwise) 60
Table 4.8: Enterprise resource planning
The findings as exhibited by Table 4.8 acknowledged to a
moderate level that enterprise resource planning aids in
collaborative planning and replenishment decisions (mean =
3.13, SD =1.127) and enterprise resource planning makes it
easy to share of information (mean = 3.12, SD =1.195). The
findings also shows that Enterprise Resource Planning systems
have reduced cost of ordering stock (mean = 3.03, SD =1.314)
and it enhances procurement and ordering processes (mean =
3.00, SD = 1.221). Furthermore the study showed that
Enterprise Resource Planning has improved order processing
(mean = 2.93, SD =1.191).
According to Shields (2001), firms expand the scope of
their implementations by web enabling their ERP systems to
facilitate self-service usage and link their supply chain
activities to obtain increased performance. This is as a result
among firms that fully integrated system deployment across
the supply chain and effective system usage would help garner
synergistic benefits. For an organization to provide effective
ERP integration to the SCM, it should encompass all the
functions responsible for development and execution of each
of the core activities: plan, source, make, deliver, and return
processes, as well as the supporting infrastructure (Cohen,
2006).
d. VENDOR MANAGED INVENTORY
This section of the questionnaire sought to get from the
respondents on the effect of Vender Managed Inventory on
supply chain performance in Nakumatt Holdings Supermarket.
N Mean
Std.
Deviation
Vendor Managed Inventory has
enhanced information sharing
with suppliers.
60 3.43 1.307
Vendor Managed Inventory has
improved the supplier
relationships
60 3.37 1.288
Vendor Managed Inventory has
enhanced streamlining of supply
chain by removal of inefficient
intermediaries
60 3.40 1.182
Vendor Managed Inventory has
made it possible to enter into
long-term commitments with
suppliers
60 3.42 1.279
Vendor Managed Inventory has
reduced pilferages of inventory 60 3.37 1.134
Valid N (listwise) 60
Table 4.9: Vender Managed Inventory
The findings from Table 4.9 shows that Vendor Managed
Inventory has enhanced information sharing with suppliers
(mean = 3.43, SD =1.307), Vendor Managed Inventory has
made it possible to enter into long-term commitments with
suppliers (mean = 3.42, SD =1.279), Vendor Managed
Inventory has enhanced streamlining of supply chain by
removal of inefficient intermediaries (mean = 3.40, SD
=1.182), Vendor Managed Inventory has improved the
supplier relationships (mean = 3.37, SD = 1.288), and Vendor

Page 350 www.ijiras.com | Email: [email protected]
International Journal of Innovative Research and Advanced Studies (IJIRAS)
Volume 4 Issue 4, April 2017
ISSN: 2394-4404
Managed Inventory has reduced pilferages of inventory (mean
= 3.37, SD =1.134) according to respondents.
The results agreed with previous studies by Lee (2010)
found that Vendor Managed Inventory greatly reduced
inventory-carrying costs and stock-out problems while, at the
same time, it offered the ability to synchronize both inventory
and transportation decisions. In addition, Fox (2006) noted
that Vendor Managed Inventory‟s advantages included
improved customer service, reduced demand uncertainty,
reduced inventory requirements and reduced cost based on a
case study at Johnson and Johnson.
The findings also agreed with the previous findings by
Angulo, Nachtmann & Waller (2004) adoption of Vendor
Managed Inventory systems benefits include lowered
inventory levels, faster inventory turns, reduced ordering and
administrative costs, better cash flow management, zero
obsolescence, increased sales, and reduced out-of-stock costs
among others.
The respondents furthermore, indicated other ways
Vendor Managed inventory has improved supply chain
performance, in that it has led to reduced lead time of delivery
of products hence reducing the problem of understocking in
the warehouses of Nakumatt Holdings Supermarket thereby
fulfilling its customers‟ demands on time. This agreed to
previous studies by Daughtery et al., (2009) which stated that
Vendor Managed Inventory (VMI) is one of the many
innovation that strive towards closer cooperation between the
members of supply chains in the area of inventory and demand
management.
E. REGRESSION RESULTS
The linear regression model below;
Y = β0 + β1X1 + β2X2 + β3X3+ β4X4 +ε
Where Y is the knowledge on management system supply
chain performance, β0 is constant and ε is the error term of the
model.
X1 = Warehouse management system
X2 = Material resource planning
X3 = Enterprise resource planning
X4 = Vendor managed inventory
a. MODEL SUMMARY
Results from Table 4.10 indicates Coefficient of
determination R2 value of .874, This implies that Y; supply
chain efficiency influenced by X1; Warehouse management
system, X2; Material resource planning, X3; Enterprise
resource planning and X4; Vendor managed inventory at 87.4
%. At a 0.05 level of significance. This therefore means that
majority agree the independent variables are critical factors to
supply chain efficiency.
Table 4.10: Model Summary
b. ANALYSIS OF VARIANCE
Table 4.11 presents the results of ANOVA test which
reveal that all the independent variables notably; (X1)
Warehouse management system, (X2) Material resource
planning, (X3) Enterprise resource planning and (X4) Vendor
managed inventory have a significance influence on supply
chain performance. Since the P value is actual 0.02 which is
less than 0.05 level of significance. Table 4.11 also indicates
that the high value of F (79.086) with significant level of 0.00
is large enough to conclude that all the independent variables
significantly influence supply chain performance.
Table 4.11: Analysis of Variance
c. BETA COEFFICIENTS
Table 4.12 presents the results of the test of beta
coefficients which indicates that the significant relationship
between independent variables notably; (X1) Warehouse
management system, (X2) Material resource planning, (X3)
Enterprise resource planning and (X4) Vendor managed
inventory and dependent variable Y = supply chain
performance.
As presented in Table 4.12, (X1) Warehouse management
system coefficient of 0.865 was found to be positive at
significant level of 0.0012 and this indicates that warehouse
management system has a positive influence on supply chain
performance, (X2) Material resource planning coefficient of
0.868 was found to be positive at significant level of 0.0022
and this indicates that material resource planning has a
positive influence on supply chain performance, (X3)
Enterprise resource planning coefficient of 0.810 was found to
be positive at significant level of 0.0019 and this indicates that
enterprise resource planning has a positive influence on supply
chain performance. (X4) Vendor managed inventory
coefficient of 0.741 was found to be positive at significant
level of 0.001 and this indicates that Vendor managed
inventory has a positive influence on supply chain
performance. This clearly demonstrates that all the
independent variables significantly influenced supply chain
performance.
However, since the significance values were less than
0.005, all the coefficients were significant an thus the
regression model was fit;
Y= 0.243 + 0.741X1 + 0.865X2 + 0.810X3 + 0.868X4 + ɛ
From Table 4.12, the t values of 1.703, 1.060, 1.335 and
1.723 is statistically significant. Kothari (2008) notes that the
closer T is to 0, the more likely there isn't a significant
difference. Beta Coefficients
Model Unstandardized
Coefficients
Standardized
Coefficients
T Sig.
B Std. Error Beta
(Constant) .243 .233 1.546 .0001
Warehouse management system
.865 .508 .156 1.703 .0012
Model Summary
Model R R Square Adjusted R
Square
Std. Error of
the Estimate
1 .935a .874 .778 2.942
Model Sum of
Squares
Df Mean
Square
F Sig.
1
Regression 2280.980 17 78.654 79.086 .002b
Residual 328.961 64 8.657
Total 2609.941 81

Page 351 www.ijiras.com | Email: [email protected]
International Journal of Innovative Research and Advanced Studies (IJIRAS)
Volume 4 Issue 4, April 2017
ISSN: 2394-4404
Material resource
planning
.868 .819 .130 1.060 .0022
Enterprise resource
planning
.810 .607 .130 1.335 .0019
Vendor managed inventory
.741 .430 .140 1.723 .0009
Table 4.12: Beta Coefficients
V. SUMMARY, CONCLUSION AND
RECOMMENDATIONS
A. SUMMARY OF FINDINGS
a. WAREHOUSE MANAGEMENT SYSTEM
Respondents agreed that Warehouse Management System
has enabled tracking movement of stock units in the
warehouse/stores (mean = 2.40, SD =1.138), warehousing
Management System has reduced pilferages of inventory
(mean = 2.40, SD =1.182), warehousing Management System
has made stock taking in the warehouse easier (mean = 2.47,
SD =1.295) , warehousing Management System has provided
greater data accuracy on inventories (mean = 2.48, SD
=1.157), and warehousing Management System has enhanced
the receipt and dispersal of inventory entering or leaving
warehouse (mean = 2.60, SD =1.224). Therefore the
warehouse management system put in place was not adequate
to improve supply chain performance.
b. MATERIAL RESOURCE PLANNING
The findings revealed that the respondents were
undecided if material resource planning support supply chain
performance in Nakumatt holding supermarket. Material
resource planning has improved order processing (mean =
3.00, SD =1.402), material resource planning has improved
coordination of inventory management decisions between
departments involved in inventory management (mean = 2.92,
SD =1.139), material resource planning systems have reduced
cost of ordering stock (mean = 2.90, SD =1.272), and there is
reduction in the lead time in replenishing inventory (mean =
2.67, SD =1.230).
c. ENTERPRISE RESOURCE PLANNING
Respondents acknowledged to a moderate level that
enterprise resource planning aids in collaborative planning and
replenishment decisions (mean = 3.13, SD =1.127) and
enterprise resource planning makes it easy to share of
information (mean = 3.12, SD =1.195). The findings also
shows that Enterprise Resource Planning systems have
reduced cost of ordering stock (mean = 3.03, SD =1.314) and
it enhances procurement and ordering processes (mean = 3.00,
SD = 1.221). Furthermore the study revealed that Enterprise
Resource Planning has improved order processing (mean =
2.93, SD =1.191).
d. VENDOR MANAGED INVENTORY
The findings indicated that Vendor Managed Inventory
has enhanced information sharing with suppliers (mean =
3.43, SD =1.307), has made it possible to enter into long-term
commitments with suppliers (mean = 3.42, SD =1.279).
Further, the study showed that Vendor Managed Inventory has
enhanced streamlining of supply chain by removal of
inefficient intermediaries (mean = 3.40, SD =1.182), has
improved the supplier relationships (mean = 3.37, SD =
1.288), and has reduced pilferages of inventory (mean = 3.37,
SD =1.134) according to respondents.
The results of ANOVA test which reveal that all the
independent variables notably have a significance influence on
supply chain performance. Since the P value < 0.05 level of
significance, there is sufficient evidence to conclude that all
the independent variables significantly influence supply chain
performance.
Regression analysis reveals warehouse management
system coefficient of 0.865 was found to be positive at
significant level of 0.0012 and this indicates that warehouse
management system has a positive influence on supply chain
performance, Material resource planning coefficient of 0.868
was found to be positive at significant level of 0.0022 and this
indicates that material resource planning has a positive
influence on supply chain performance, Enterprise resource
planning coefficient of 0.810 was found to be positive at
significant level of 0.0019 and this indicates that enterprise
resource planning has a positive influence on supply chain
performance. Vendor managed inventory coefficient of 0.741
was found to be positive at significant level of 0.001 and this
indicates that Vendor managed inventory has a positive
influence on supply chain performance. This clearly
demonstrates that all the independent variables significantly
influenced supply chain performance.
B. CONCLUSION
The study concluded that Warehousing Management
System has a positive effect on supply chain performance. It
has enabled tracking movement of stock units in the
warehouse/stores, reduced pilferages of inventory, and made
stock taking in the warehouse easier. Warehousing
Management System provides greater data accuracy on
inventories, and enhances the receipt and dispersal of
inventory entering or leaving.
The study also concluded that Material Resource Planning
improves order processing and improves coordination of
inventory management decisions between departments
involved in inventory management. Further, the study
concluded that Material Resource Planning systems reduces
cost of ordering stock and lead time in replenishing inventory.
The study also concluded that Enterprise Resource
Planning aids in collaborative planning and replenishment
decisions and makes it easy to share of information. Enterprise
Resource Planning systems reduces cost of ordering stock and
it enhances procurement and ordering processes.
The study also concluded that Vendor Managed Inventory
enhances information sharing with suppliers and made it
possible to enter into long-term commitments with suppliers.
Page 352 www.ijiras.com | Email: [email protected]
International Journal of Innovative Research and Advanced Studies (IJIRAS)
Volume 4 Issue 4, April 2017
ISSN: 2394-4404
The study further concluded that Vendor Managed Inventory
enhances streamlining of supply chain by removal of
inefficient intermediaries, and improves the supplier
relationships.
C. RECOMMENDATIONS
The study makes the following recommendations based
on the findings and conclusions: first, the supermarkets
intending to partner in vendor managed inventory should
focus on developing strong ICT systems, strong warehousing
facilities (either by lease or build) and/or by engaging large
suppliers to lease from third parties. This would hasten the
implementation of vendor managed inventory in retail
supermarkets.
Also, the retail supermarkets should enter into vendor
managed agreements defining clearly the responsibilities and
obligations of the parties involved. This would ensure a
smooth flow of not only information sharing but also in the
execution the vendor managed responsibilities as defined in
the agreement to avoid mistrust and eventual fall out.
In addition, vendor managed inventory implementation
can be phased with few established suppliers and with few
non-shelf life goods. This would ensure reduced conflict with
partners, and also allow employees to adjust to the new level
of business. Lastly, the retail supermarket should first
implement an inventory policy that defines the optimal stock
levels which is based on demand forecasts and actual
usage/sales.
REFERENCES
[1] Barney, J.B. (1991). Firm resources and sustained
competitive advantage. Journal of Management 17 (1),
99–120.
[2] Buvik, A., & John, G. (2000). When does vertical
coordination improve industrial purchasing relationships?
Journal of Marketing, 64, (4), 52-64.
[3] Chapman, R., Soosay, C. and Kandampully, J. (2003).
“Innovation in logistic services and the new business
model: a conceptual framework”, International Journal of
Physical Distribution & Logistics Management, 33(7),
630-50.
[4] Choi, T.Y. (2004). “The TQM paradox: Relations among
TQM practices, plant performance, and customer
satisfaction”, Journalof Operations Management, 17 (1),
59–75
[5] Damanpour, F. (1991), “Organizational innovation: a
meta-analysis of effects of determinants and moderators”,
Academy of Management Journal, 34(3), 555-590.
[6] Das, A., and A. Nair. (2014). “The Use of Manufacturing
Technologies–an External Influence Perspective.”
International Journal of Production Research 48 (17),
4977–5006.
[7] Daugherty, P.J., Stank, T.P. and Rogers, D.S. (2009).
“Third-party logistics service providers: Purchasers‟
perceptions”, International Journal of & Logistics
Management Spring
[8] Kothari C.R. (2010). Research Methodology: Methods
and Techniques, Second Revised Edition, New Age
International (P) Ltd. Publishers, New Delhi
[9] Lee, S. M.; Lee, D.; Schniederjans, M. J. (2011). Supply
chain innovation and organizational performance in the
healthcare industry, International Journal of Operations &
Production Management 31(11), 1193–1214.
[10] Li, L.X. (2001). “An Analysis of Sources of
Competitiveness and Performance of Chinese
Manufacturers”, International Journal of Operations and
Production Management, 20(3), 299-315
[11] Lysons, K. and Farrington, B. (2006). Purchasing and
Supply Chain Management, Pearson Education Ltd,
England
[12] Peteraf, M., A. & Bergen, M., E. (1993). Scanning
dynamic competitive landscapes: A market based and
resource-based framework. Strategic Management
Journal, 24, 1027.
[13] Prajogo, Daniel, and Jan Olhager. 2012. “Supply Chain
Integration and Performance: The Effects of Long-
Term Relationships, Information Technology and
Sharing, and Logistics Integration.” Intern. Journal of
Production Economics 135(23), 514–22.
[14] Prasad, A., and J. Heales. (2010). “On IT and Business
Value in Developing Countries: A Complementarities-
Based Approach.” International Journal of Accounting
Information Systems 11 (4), 314–35.
[15] Rajaguru, R., and M.J. Matanda. (2013). “Effects of Inter-
Organizational Compatibility on Supply Chain
Capabilities: Exploring the Mediating Role of Inter-
Organizational Information Systems (IOIS)
Integration.” Industrial Marketing Management 42:
62032.
[16] Rogers, Everett M. (1995). Diffusion of Innovations, 4th
Ed. New York: Free Press.
[17] Singhry, Hassan Barau, Azmawani Abd Rahman, and Ng
S. I. (2014). “The Potential Moderating Role of Supply
Chain Capabilities on the Relationship between Supply
Chain Technology and Concurrent Engineering in Product
Design.” Int. J Sup. Chain. Mgt 3 (2), 132–39.
[18] Stank, T.P, P.J Daugherty, and C.W. Autry. (2011).
“Collaborative Planning: Supporting Automatic
Replenishment Programs.” Supply Chain Management:
An International Journal 4 (2), 75–85.
[19] Stevenson, M. & Spring, M. (2007). Flexibility from a
supply chain perspective: definition and review.
International Journal of Operations & Production
Management, 27, 685.
[20] Storer, M., and P. Hyland. (2009). “Dynamic Capabilities
and Innovation in Supply Chains.” CINet, 912–23.
[21] Teece, David J. (2010). “Alfred Chandler and
„Capabilities‟ Theories of Strategy and Management” 19
(2), 297–316
[22] Turner J. R. (2010). Integrated supply chain management:
What's wrong with this picture? Industrial Engineering
25:52.
[23] Williams, A. (2009). “Why e-procurement makes sense”,
Financial Executive, 18(7), 45
[24] Wu, Jie. (2014). “Cooperation with Competitors and
Product Innovation: Moderating Effects of Technological

Page 353 www.ijiras.com | Email: [email protected]
International Journal of Innovative Research and Advanced Studies (IJIRAS)
Volume 4 Issue 4, April 2017
ISSN: 2394-4404
Capability and Alliances with Universities.” Industrial
Marketing Management 43 (2), 199–209.
[25] Zhu, Q., Sarkis, J., & Lai, K. (2007). Green supply chain
management: pressures, practices and performance within
the Chinese automobile industry. Journal of Cleaner
Production, 15(11/12), 1041-1052.