influence of longitudinal reinforcement layouts on … · influence of longitudinal reinforcement...
TRANSCRIPT

1
INFLUENCE OF LONGITUDINAL REINFORCEMENT LAYOUTS ON
RC WALL PERFORMANCE
Angelica ROSSO1, João ALMEIDA
2, Raluca CONSTANTIN
3, Katrin BEYER
4, Sri
SRITHARAN5
ABSTRACT
Design recommendations for longitudinal reinforcement layouts of reinforced concrete (RC)
walls have been derived from plane section analyses. Such an analysis generally favours wall layouts
with boundary elements containing large amounts of vertical reinforcement, providing higher moment
resistance and larger ductility capacity than the same reinforcement distributed evenly along the wall
length. The main disadvantage of a design method based on a plane section analysis is that it
disregards the beneficial influence that the distribution of longitudinal reinforcement has on the
member shear performance and reduction of crack widths. In order to better understand the seismic
performance of RC walls with concentrated and distributed longitudinal reinforcement layouts, this
paper starts with a review of simple mechanical models and code prescriptions on stability of
rectangular walls, sliding shear resistance, and required confinement reinforcement. The relevant
expressions from this survey are then applied to a case study comprising two walls. In addition, the
latter are numerically simulated with an advanced nonlinear membrane model to avoid the limitations
of plane section hypothesis. Pushover analyses show that distributed reinforcement layouts can lead to
an improved wall behaviour in terms of crack widths and spacing along the wall height, as well as a
different failure mechanism due to crushing of the compressed zone instead of a premature sliding
shear failure at the base of the wall.
INTRODUCTION
Structural wall damages during the 2011 Christchurch earthquake showed that modern
reinforced concrete (RC) walls did not respond in a ductile manner as much as expected (Sritharan et
al., 2014). One observed failure mode of well-designed concrete walls with boundary elements is
1 PhD candidate, Earthquake Engineering and Structural Dynamics Laboratory (EESD), School
of Architectural, Civil and Environmental Engineering (ENAC), École Polytechnique Fédérale de
Lausanne (EPFL), [email protected] 2 Post-doctoral Researcher, Earthquake Engineering and Structural Dynamics Laboratory
(EESD), School of Architectural, Civil and Environmental Engineering (ENAC), École Polytechnique
Fédérale de Lausanne (EPFL), [email protected] 3 PhD candidate, Earthquake Engineering and Structural Dynamics Laboratory (EESD), School
of Architectural, Civil and Environmental Engineering (ENAC), École Polytechnique Fédérale de
Lausanne (EPFL), [email protected] 4 Assistant Professor, Earthquake Engineering and Structural Dynamics Laboratory (EESD),
School of Architectural, Civil and Environmental Engineering (ENAC), École Polytechnique Fédérale
de Lausanne (EPFL), [email protected] 5 Professor, Iowa State University, Ames, IA 50010, USA, [email protected]
2
seemingly linked to an initial crushing of the wall web region adjacent to the boundary elements. The
region is typically detailed with light longitudinal reinforcement and no confinement reinforcement.
Since the longitudinal reinforcement concentrates in heavily confined boundary elements, these
regions in the walls exhibited less damage than the web. The lack of confinement and the potential for
compression strain to exceed larger values outside the boundary elements make the webs to experience
crushing of both the cover and core concrete. Similar damage patterns for walls with such
concentrated reinforcement layouts were observed in laboratory tests (e.g., Beyer et al., 2008;
Brueggen 2009). As an alternative to concentrated reinforcement layouts, the longitudinal
reinforcement can be distributed evenly along the wall length, which has been shown to produce better
seismic performance (Priestley, 2003). Sections with distributed reinforcement have larger yield
curvatures and compression zone depths; hence, if concrete crushing becomes critical, the ultimate
curvature might be smaller than for layouts with strong boundary elements, which reduces the
curvature ductility capacity. These considerations suggest the need to investigate the best wall
longitudinal reinforcement layout for optimum seismic performance.
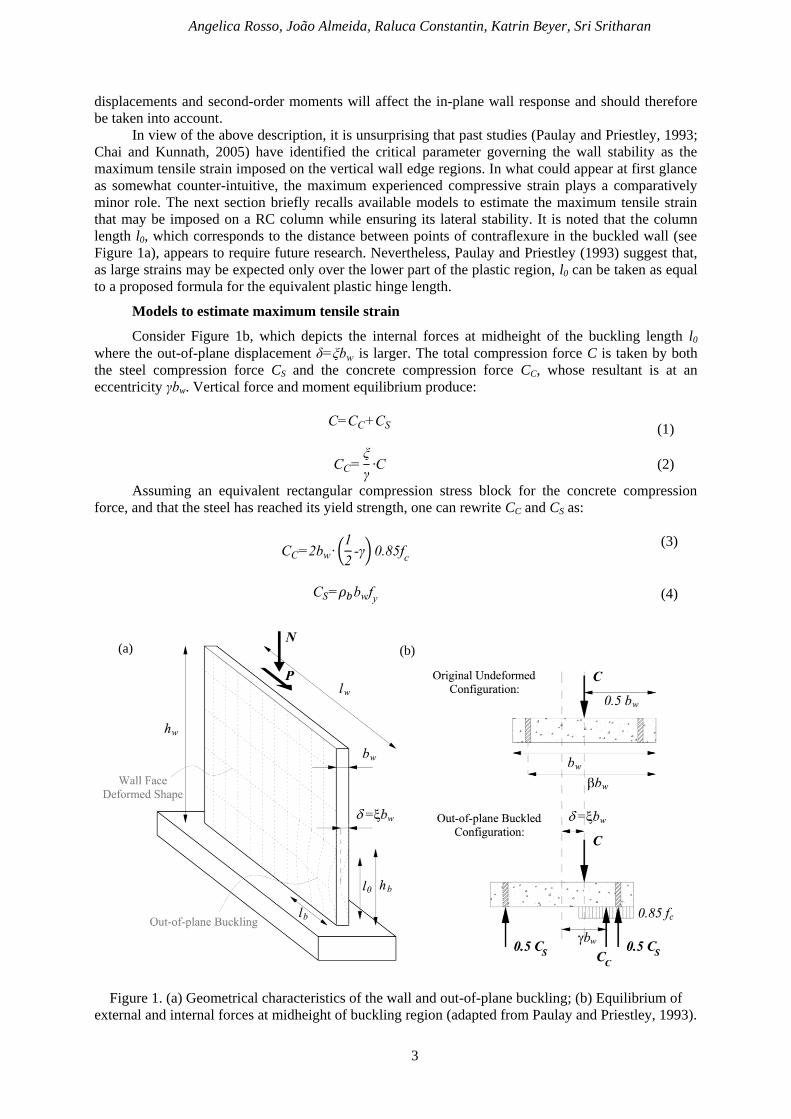
Focussing on RC cantilever walls (length lw, width bw, and height hw, see Figure 1a) with a
constant axial load, this paper investigates the effect of different longitudinal reinforcement layouts on
lateral load performance with respect to several issues. First, potential failures by out-of-plane
buckling and shear sliding are investigated, and then the required confining reinforcement and the
length of the confined regions are examined. Finally, two different longitudinal reinforcement
configurations are analysed by means of nonlinear shell element models using program VecTor2
(Wong and Vecchio, 2013) to see the impact of the reinforcement distribution on the wall response.
OUT-OF-PLANE BUCKLING
Mechanics of out-of-plane buckling of RC walls
The lateral stability of ductile RC walls subjected to in-plane seismic loading is usually
investigated by idealizing the plastic hinge regions in the wall edges as an axially loaded column under
large amplitude cyclic tension and compression. To date, there are few indications on how to estimate
or define the wall region that undergoes out-of-plane buckling—represented in Figure 1a by lb × hb —
and how the latter relates to the longitudinal reinforcement layout, in particular the presence of
confined boundary elements.
The mechanics of out-of-plane buckling can be summarised as follows, for a wall with double
layer reinforcement. At large in-plane curvature demands, the wall edge region develops large tensile
strains that cause wide near-horizontal cracks across the width of the section. That leads to
longitudinal reinforcement yielding in tension and eventual strain-hardening. Upon unloading, an
elastic strain recovery takes place, although the cracks remain wide due to the plastic tensile strains
previously accumulated in the rebars. During reloading in compression, and until crack closure, the
compression force must be resisted solely by the two layers of vertical reinforcement. This stage is
typically accompanied by an incipient out-of-plane displacement, which occurs due to an unavoidable
eccentricity of the axial force C acting in this region (see Figure 1b), and construction misalignments
in the position of the longitudinal reinforcements. While the rebars retain their significant axial
stiffness before yielding in compression, the out-of-plane displacement tends to remain small.
However, as compression increases the longitudinal rebar near the concave side will yield, originating
an abrupt reduction in stiffness and a consequent increase in the out-of-plane displacement. It is noted
that, at this point, the second layer of longitudinal reinforcement—which has not yet yielded in
compression—is the main source of out-of-plane stiffness. Depending on the magnitude of the tensile
strain previously attained (i.e., before unloading), different scenarios can then take place as
compression progresses. The cracks may close, re-establishing compressive concrete contact, or they
may remain open leading to compression yielding of the second layer of reinforcement. In the latter
case, out-of-plane displacements will abruptly increase, leading to wall buckling failure. Intermediate
conditions, wherein the second layer of reinforcement yields but cracks still close, at least partially, are
also possible. Independently of the scenario that effectively takes place, the occurrence of out-of-plane
Angelica Rosso, João Almeida, Raluca Constantin, Katrin Beyer, Sri Sritharan
3
displacements and second-order moments will affect the in-plane wall response and should therefore
be taken into account.
In view of the above description, it is unsurprising that past studies (Paulay and Priestley, 1993;
Chai and Kunnath, 2005) have identified the critical parameter governing the wall stability as the
maximum tensile strain imposed on the vertical wall edge regions. In what could appear at first glance
as somewhat counter-intuitive, the maximum experienced compressive strain plays a comparatively
minor role. The next section briefly recalls available models to estimate the maximum tensile strain
that may be imposed on a RC column while ensuring its lateral stability. It is noted that the column
length l0, which corresponds to the distance between points of contraflexure in the buckled wall (see
Figure 1a), appears to require future research. Nevertheless, Paulay and Priestley (1993) suggest that,
as large strains may be expected only over the lower part of the plastic region, l0 can be taken as equal
to a proposed formula for the equivalent plastic hinge length.
Models to estimate maximum tensile strain
Consider Figure 1b, which depicts the internal forces at midheight of the buckling length l0
where the out-of-plane displacement is larger. The total compression force C is taken by both
the steel compression force CS and the concrete compression force CC, whose resultant is at an
eccentricity γ w. Vertical force and moment equilibrium produce:
(1)
γ (2)
Assuming an equivalent rectangular compression stress block for the concrete compression
force, and that the steel has reached its yield strength, one can rewrite CC and CS as:
(
γ)
(3)
(4)
Figure 1. (a) Geometrical characteristics of the wall and out-of-plane buckling; (b) Equilibrium of
external and internal forces at midheight of buckling region (adapted from Paulay and Priestley, 1993).
(a) (b)
4
Substituting Eq. (3) and Eq. (4) into Eq. (1) and Eq. (2), one obtains:
γ
[( ) √( ) ] (5)
where is the mechanical reinforcement ratio of the wall strip. This equation has real
solutions only when the term inside the square root is non-negative:
( √ ) (6)
The previous equation represents the stability criterion of RC walls as derived by Paulay and
Priestley (1993). The upper limit c represents the critical normalized out-of-plane displacement that
marks the onset of wall instability.
The increase in arc length due to wall out-of-plane displacement results from the axial
elongation of the wall strip over the buckling length l0. Based on this assumption, Paulay and Priestley
(1993) and Chai and Elayer (1999) established the following two relationships between the maximum
average axial tensile strain over l0 and the normalized out-of-plane displacement c, respectively:
(
)
(7)
(
)
(8)
According to both studies, l0 may be taken as the equivalent plastic hinge length
. Paulay and Priestley (1993) derived Eq.(7) from geometrical considerations.
The parameter takes into account the position of the vertical reinforcement within the wall thickness,
as depicted in Figure 1b (for walls with a single layer of vertical reinforcement ). Eq.(8),
developed by Chai and Elayer (1999), is a phenomenological equation based on tests of axially loaded
concrete columns reinforced with two layers of vertical bars under large strains amplitudes. Therein, y
is the yield strain of the reinforcement. This approach ignores the reduced out-of-plane stability
expected for walls with a single layer reinforcement layout.
Eq. (7) and Eq. (8) can be rewritten as explicit functions of the reinforcement ratio:
(
)
[
√ (
)
(
)] (9)
(
)
[
√ (
)
(
)] (10)
The equations above should provide conservative predictions of a tensile strain below which
crack closure, and subsequent crushing limit state, can be reached. The application example in the last
section of the current paper will illustrate the use of these expressions and the conclusions that can be
obtained.
SLIDING SHEAR FAILURE
Several cyclic RC wall tests (e.g., Paulay et al., 1982; Salonikios et al., 2000) have shown that
after a few reversed cyclic loads that cause significant yielding in the flexural longitudinal
reinforcement, wall sliding can occur at flexural cracks that form along the entire wall length. These
cracks are approximately horizontal and develop through interconnection of several cracks. Such
Angelica Rosso, João Almeida, Raluca Constantin, Katrin Beyer, Sri Sritharan
5
sliding of walls causes a significant reduction in lateral stiffness, particularly at low load intensities, a
reduction in energy dissipation, and a premature sliding shear failure (Paulay et al., 1982). This failure
mode is more common in walls with a low reinforcement ratio and smaller diameter bars in the web
(Preti and Giuriani, 2011). In order to avoid sliding failure, the longitudinal reinforcement may be
distributed (Priestley, 2003).
To prevent shear sliding, in design VEd VRd,S is ensured at potential failure planes, where VEd is
the shear demand and VRd,S is the sliding shear resistance. In the following, the sliding shear resistance
according to three different design standards are reviewed and evaluated for both concentrated and
distributed longitudinal reinforcement layouts.
Sliding shear resistance according to Eurocode 8
According to Eurocode 8 (CEN, 2004), the shear resistance is defined as the sum of dowel
resistance of vertical bars Vdd, shear resistance of inclined bars Vid, and friction resistance Vfd:
V V V V (11)
with:
V { √
(12)
(13)
V
(14)
V { [( )
]
(15)
(16)
where f is the concrete-to-concrete friction coefficient, z is the internal lever arm of the tension
and compression force resultant in the wall which can be assumed equal to 0.8lw, xu is the neutral axis
depth, is the angle between shear-friction reinforcement and shear plane, sj is the sum of the area
of the vertical bars within the web, si is the sum of the area of all inclined bars within the web, and
- .
Sliding shear resistance according to ACI Code
ACI Code (ACI Committee 318, 2011) computes the sliding shear resistance based on a friction
mechanism, but without accounting for the dowel action of the longitudinal bars. The sliding shear
resistance of shear-friction reinforcement perpendicular or inclined to the shear plane respectively is
computed as:
V (17)
V ( ) (18)
where f is the coefficient of friction and Avf is the total area of shear-friction reinforcement, intended
as the sum of all bars crossing the section in which the sliding shear resistance is checked. Note that
ACI 318 does not explicitly account for the contribution of the axial force to the sliding shear
resistance. In fact, it is specified in the commentary section that the friction resistance due to a
compression force acting across a shear plane can be taken into account, provided that it is certain that
this compressive force is permanent.
Sliding shear resistance according to NZS 3101
According to the New Zealand Standard on Concrete Structures (New Zealand Standard, 2006),
the nominal shear strength results from a friction resistance, but, unlike ACI 318, it accounts for the
friction resistance resulting from the axial load NEd. The sliding shear resistance VRd,S is therefore
computed for shear-friction reinforcement perpendicular or inclined to the shear plane respectively as:
6
V ( ) (19)
V ( ) (20)
Influence of reinforcement layout on sliding shear failure
According to the equations presented above, ACI 318 and NZS 3101 establish a direct
proportional relation between the sliding shear strength and the reinforcement crossing the potential
sliding shear plane. Since for the same moment demand, the choice of a distributed reinforcement
layout leads to a slightly higher total longitudinal reinforcement ratio than a concentrated
reinforcement layout, the distributed reinforcement layout leads to a slightly higher sliding shear
resistance than the concentrated reinforcement layout.
In Eurocode 8, the proposed relation to compute the sliding shear strength is more complex.
Considering a simple reinforcement layout, without inclined bars or additional bars arranged
specifically for resisting sliding, the reinforcement content within the web influences the predicted
sliding shear resistance as follows:
The choice between distributed or concentrated layout strongly influences the reinforcement
content of the web and therefore the value of ∑ in Eq. (12) and Eq. (13). Since only the web
reinforcement is considered when computing the dowel resistance, distributed reinforcement
layouts lead to larger dowel resistance against sliding.
The increase of the reinforcement ratio in the web causes a larger neutral axis depth. The
contribution of friction resistance is directly proportional to the neutral axis depth as shown in
Eq.(15). Hence, Eq.(16), is higher for distributed reinforcement layouts than for concentrated
reinforcement layouts.
The case-study of the last section shows a comparison between the sliding resistance computed
for a specific wall according to the three codes.
DETAILING FOR LOCAL DUCTILITY
In RC walls, the concrete cover is usually allowed to exceed its ultimate strain capacity and
spall. The required curvature ductility capacity for the walls to sustain an earthquake load, therefore
depends on the strain capacity of the confined concrete. The length of the confined zone is a function
of the neutral axis depth xu. This length can be computed by fibre analysis or by simple equilibrium
considerations of the critical section. Since the confinement reinforcement is provided to avoid
crushing of extreme concrete fibres in the confined core until after both the longitudinal reinforcement
bars in tension and compression yielded, the latter results in the following approximation for xu
(Fardis, 2009):
(
)
(21)
where is the mechanical reinforcement ratio of the vertical bars in the unspalled
section, hc and bc are, respectively, the depth and width of the original unspalled concrete section, ho
and bo are the corresponding dimensions of the confined core, fc and
are the ultimate concrete
compression strength in the unspalled section and in the concrete core, respectively, and
are the
concrete strains at the peak stress in compression and the compressive strain at which spalling is
expected.
Eq. (21) shows that the variation of reinforcement layout affects the neutral axis depth and that
it increases with increasing web reinforcement ratio v. In the following section, different design
standards are examined with regard to the provisions for the minimum confinement length and its
dependence on the reinforcement layout.
Angelica Rosso, João Almeida, Raluca Constantin, Katrin Beyer, Sri Sritharan
7
Length of confined zones according to Eurocode 8
According to Eurocode 8 (CEN, 2004), the length of the confined zone may be limited to a
distance from the hoop centerline near the extreme compression fibre equal to:
(
) (22)
where cu2, the compressive strain at which spalling is expected, may be taken as being equal to 0.0035
and cu2,c, the ultimate strain of confined concrete, is estimated on the basis of EN 1992-1-1:2004 as
. In addition, the length of the confined zone should not be less than of 0.15lw
and 1.50bw.
Length of confined zones according to ACI 318
According to ACI 318 (ACI Committee 318, 2011), if the neutral axis depth xu exceeds the limit
value cc, the extreme fiber compression strain exceeds the limiting strain cu2=0.003. As a result,
special confined detailing is required.:
( ⁄ ) (23)
where the design drift, u/hw, shall not be taken less than 0.7%. The length of these zones shall extend
horizontally from the extreme compression fibre as follows:
( ) (24)
where -
is based on Eq.(23) assuming a design drift of 1.5%.
Length of confined zones according to New Zealand Standard
According to the New Zealand Standard on Concrete Structures NZS 3101 (New Zealand
Standard, 2006), when the neutral axis depth at the ultimate limit state exceeds the limit value cc,
special boundary elements should be designed. The value of cc is determined as follows:
(25)
where ow is the ratio of moment resistance at overstrength to the design moment resulting from
earthquake actions (both moments are obtained at the base section of a wall), and is assumed to be 1
for limited ductile regions and 2 for ductile plastic regions. The length of the confined region of the
compressed wall section is then determined using Eq. 26.
( ) (26)
Influence of reinforcement layout on the length of confined zones
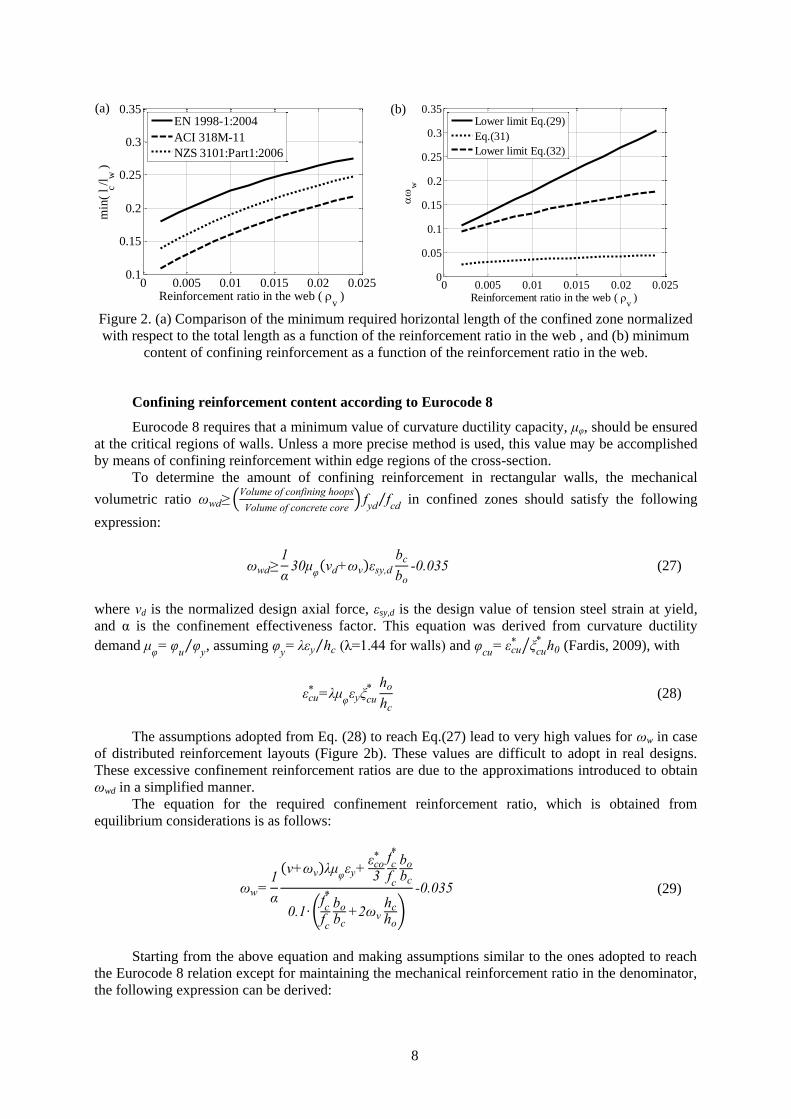
For all three design documents considered in this study, the minimum required confinement
length is longer in case of the distributed layout, given that the neutral axis depth is larger when the
web reinforcement ratio v increases, as seen in Eq. (21). When comparing the required length of
confined zones, Eurocode 8 produce the highest and ACI 318 demand the least values for lc.
8
Figure 2. (a) Comparison of the minimum required horizontal length of the confined zone normalized
with respect to the total length as a function of the reinforcement ratio in the web , and (b) minimum
content of confining reinforcement as a function of the reinforcement ratio in the web.
Confining reinforcement content according to Eurocode 8
Eurocode 8 requires that a minimum value of curvature ductility capacity, , should be ensured
at the critical regions of walls. Unless a more precise method is used, this value may be accomplished
by means of confining reinforcement within edge regions of the cross-section.
To determine the amount of confining reinforcement in rectangular walls, the mechanical
volumetric ratio (V
V )
⁄ in confined zones should satisfy the following
expression:
( )
(27)
where d is the normalized design axial force, sy,d is the design value of tension steel strain at yield,
and α is the confinement effectiveness factor. This equation was derived from curvature ductility
demand
⁄ , assuming ⁄ (λ=1.44 for walls) and
⁄ (Fardis, 2009), with
(28)
The assumptions adopted from Eq. (28) to reach Eq.(27) lead to very high values for w in case
of distributed reinforcement layouts (Figure 2b). These values are difficult to adopt in real designs.
These excessive confinement reinforcement ratios are due to the approximations introduced to obtain
wd in a simplified manner.
The equation for the required confinement reinforcement ratio, which is obtained from
equilibrium considerations is as follows:
( )
(
)
(29)
Starting from the above equation and making assumptions similar to the ones adopted to reach
the Eurocode 8 relation except for maintaining the mechanical reinforcement ratio in the denominator,
the following expression can be derived:
0 0.005 0.01 0.015 0.02 0.0250.1
0.15
0.2
0.25
0.3
0.35
Reinforcement ratio in the web ( v )
min
( l c
/lw
)
EN 1998-1:2004
ACI 318M-11
NZS 3101:Part1:2006
0 0.005 0.01 0.015 0.02 0.0250
0.05
0.1
0.15
0.2
0.25
0.3
0.35
Reinforcement ratio in the web ( v )
w
Lower limit Eq.(29)
Eq.(31)
Lower limit Eq.(32)
(a) (b)
Angelica Rosso, João Almeida, Raluca Constantin, Katrin Beyer, Sri Sritharan
9
[ ( )
] (30)
For a concentrated reinforcement layout the denominator tends to be 0.1 since v is
negligible when compared to 0.1, and therefore Eq. (30) leads to Eq. (27) which is reported in
Eurocode 8.
Figure 2b shows that the lower limit of Eq. (27), proposed in the Eurocode 8, leads to a
confining reinforcement content that is higher than the one needed to satisfy equilibrium (Eq. (29)).
The Eq. (30) proposed here, still providing precautionary values, follows better the trend of the curve
which represent real equilibrium and moreover for a concentrated layout (left side of the plot) provides
values of confining reinforcement content close to the ones computed using Eurocode 8, while for a
distributed layout (right side of the plot) provides more reasonable values that lead to feasible layouts
of confining reinforcement.
Confining reinforcement content according to ACI Code
According to ACI Code (ACI Committee 318, 2011) the total cross-sectional area of rectangular
hoop reinforcement should satisfy the following expression:
{
(
)
} (31)
where sh is horizontal spacing of hoops, Ag and Ac are, respectively, the areas of the total confined zone
and the concrete core. These two areas implicitly depend on the neutral axis depth, since are a function
of the latter the length of the confined zone, and thus of the concrete core (Eq. (24)).
Confining reinforcement content according to NZS 3101
According to NZS 3101(New Zealand Standard, 2006) the total cross-sectional area of
rectangular hoop reinforcement in the compression zone should satisfy the expression in Eq. 32:
(
) (32)
where is assumed to be 0.25 for limited ductile regions and 0.175 for ductile plastic regions as
defined by 2.6.1.3 in this Standard.
Influence of reinforcement layout on confining reinforcement content
The relations proposed to compute the confining reinforcement content in the end regions
noticeably differ between. Furthermore, as found for Eurocode 8, they may not be suitable for
distributed reinforcement layouts. Their close dependence on the neutral axis depth permits, however,
indicate a general trend.
In NZS 3101, the confining reinforcement content depends explicitly on the neutral axis depth,
and implicitly on areas Ag and Ac, as in ACI 318. In Eurocode 8, or in the modified equations
illustrated above, the reinforcement content is derived from the general neutral axis definition.
Therefore, since as seen in Eq.(21), the variation of reinforcement layout affects the neutral axis depth,
which increases with the increasing reinforcement ratio v,; in case of distributed layout a higher value
of confining reinforcement is always required.
RC WALL WITH CONCENTRATED AND DISTRIBUTED REINFORCEMENT
LAYOUTS
To illustrate some of the points discussed thus far, as well as further influence of reinforcement
distribution on wall response, a slender RC wall (hw=11.430 m, lw=4.570 m and bw=0.305 m) is
studied.
10
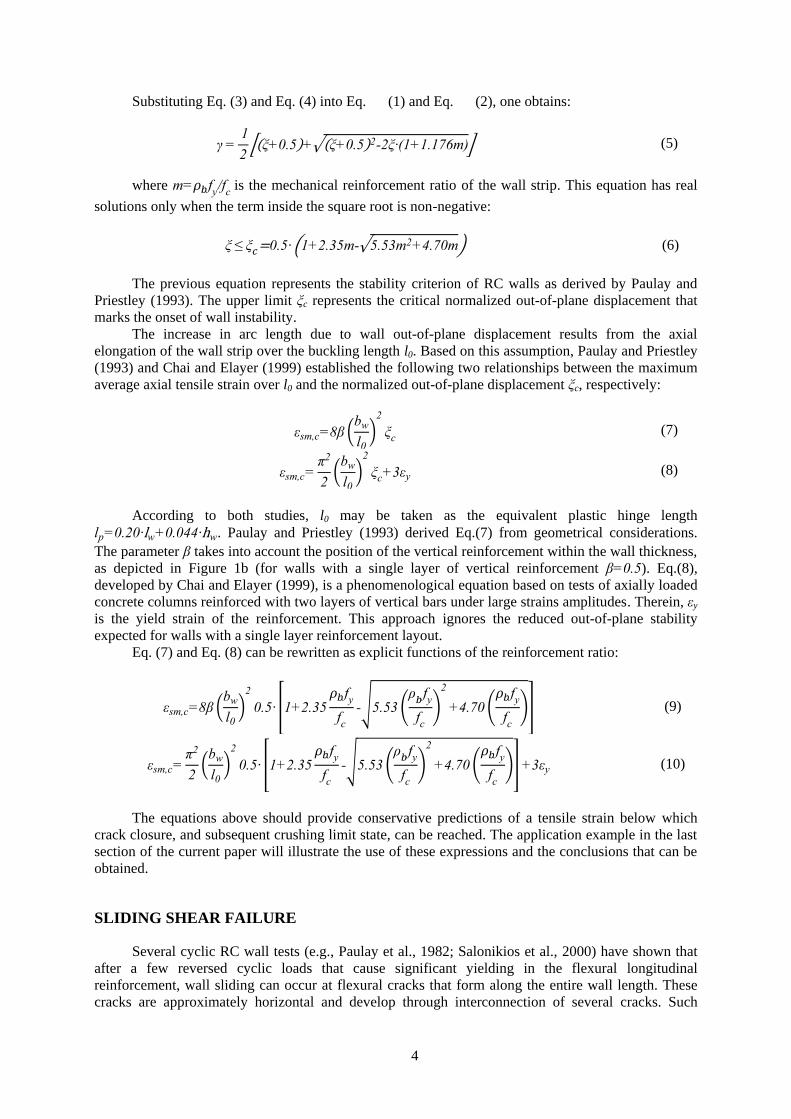
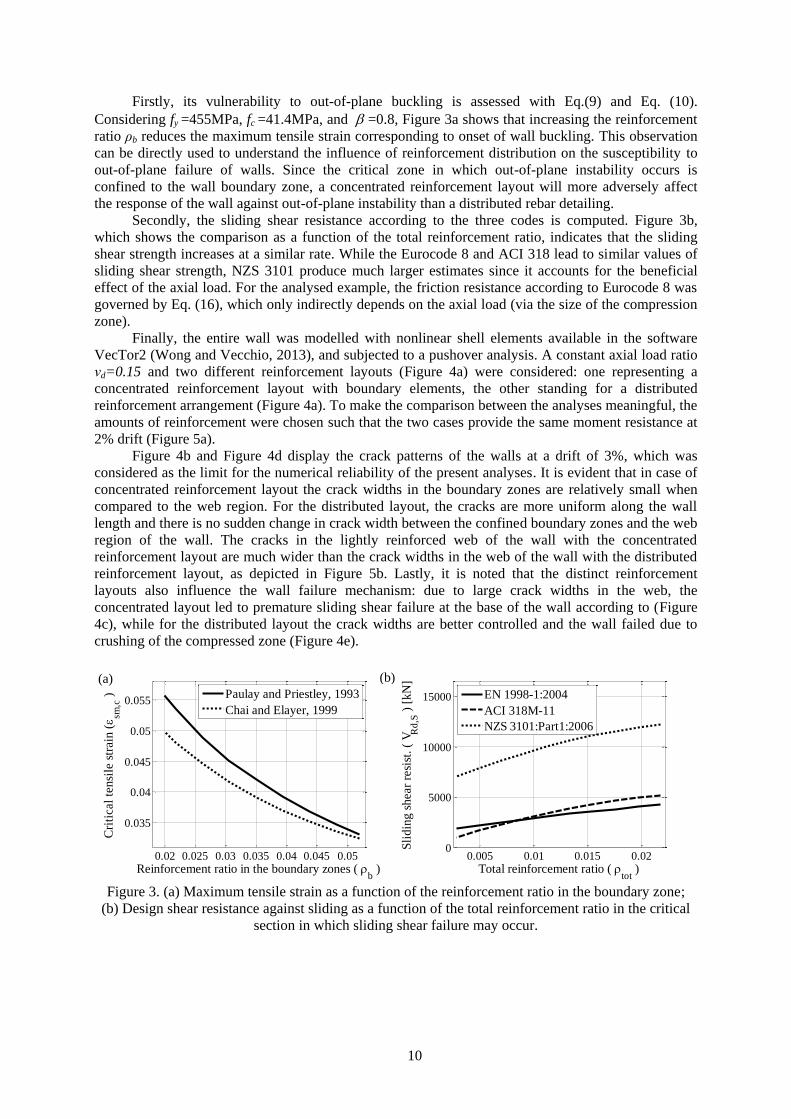
Firstly, its vulnerability to out-of-plane buckling is assessed with Eq.(9) and Eq. (10).
Considering fy =455MPa, fc =41.4MPa, and =0.8, Figure 3a shows that increasing the reinforcement
ratio b reduces the maximum tensile strain corresponding to onset of wall buckling. This observation
can be directly used to understand the influence of reinforcement distribution on the susceptibility to
out-of-plane failure of walls. Since the critical zone in which out-of-plane instability occurs is
confined to the wall boundary zone, a concentrated reinforcement layout will more adversely affect
the response of the wall against out-of-plane instability than a distributed rebar detailing.
Secondly, the sliding shear resistance according to the three codes is computed. Figure 3b,
which shows the comparison as a function of the total reinforcement ratio, indicates that the sliding
shear strength increases at a similar rate. While the Eurocode 8 and ACI 318 lead to similar values of
sliding shear strength, NZS 3101 produce much larger estimates since it accounts for the beneficial
effect of the axial load. For the analysed example, the friction resistance according to Eurocode 8 was
governed by Eq. (16), which only indirectly depends on the axial load (via the size of the compression
zone).
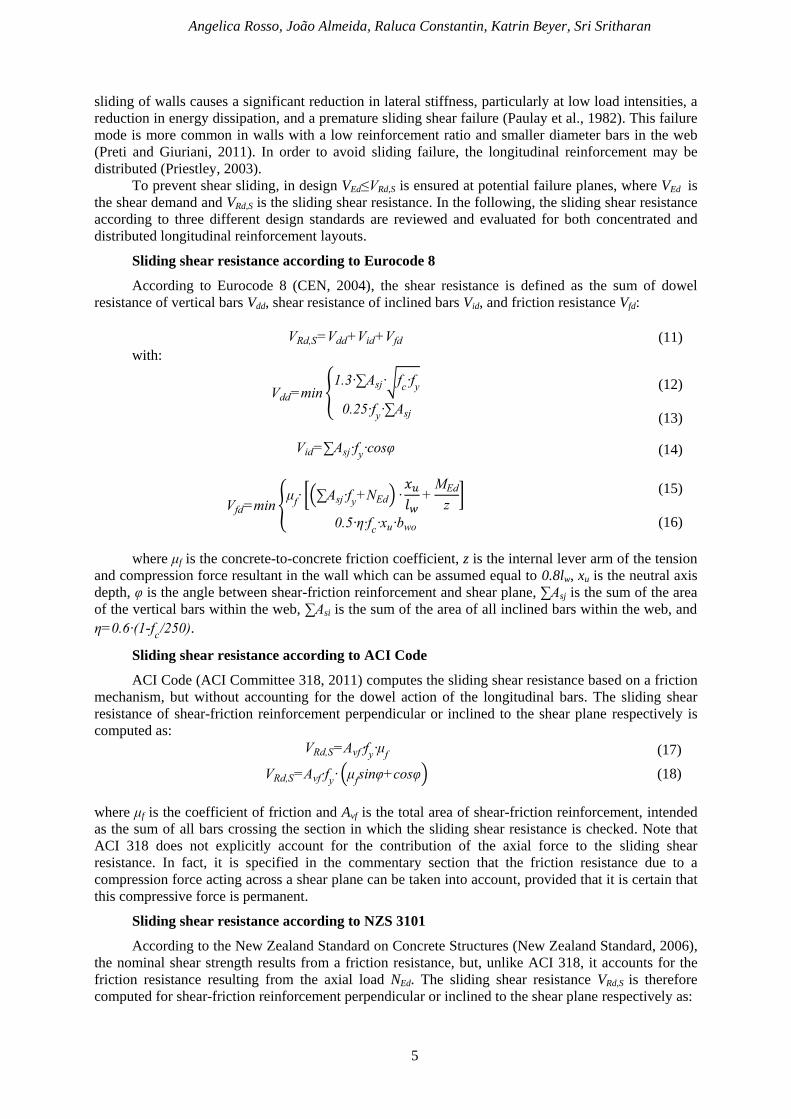
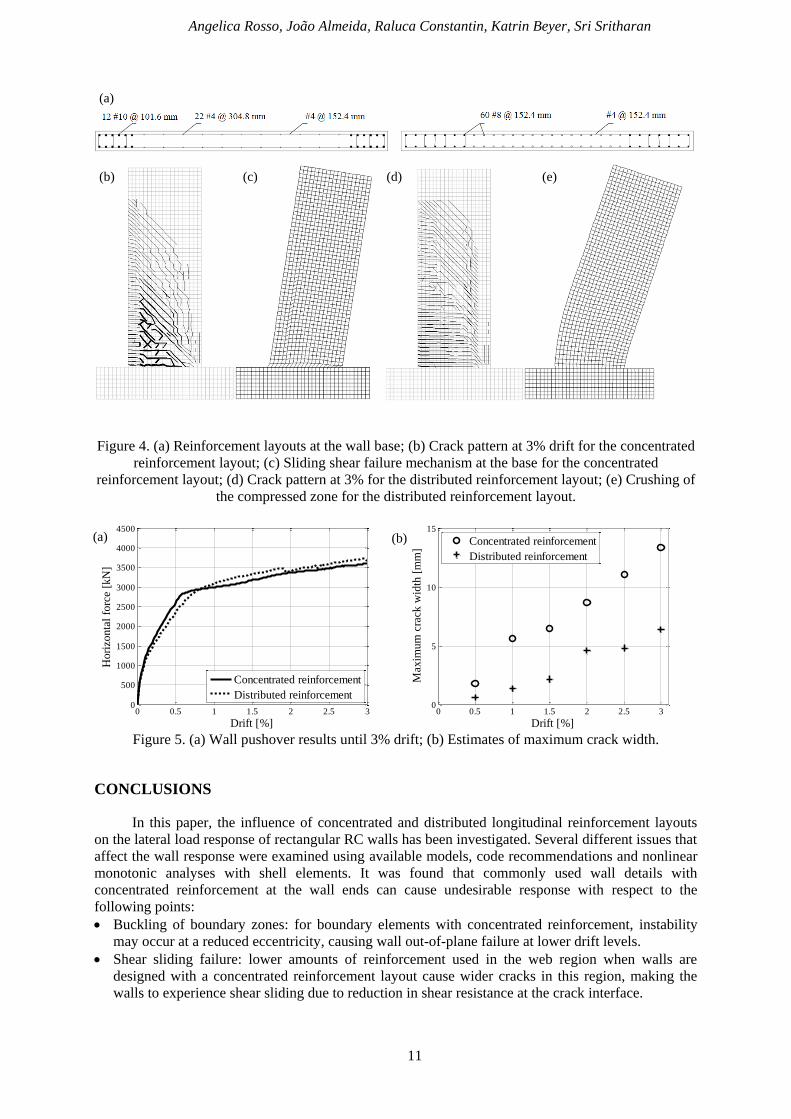
Finally, the entire wall was modelled with nonlinear shell elements available in the software
VecTor2 (Wong and Vecchio, 2013), and subjected to a pushover analysis. A constant axial load ratio
d=0.15 and two different reinforcement layouts (Figure 4a) were considered: one representing a
concentrated reinforcement layout with boundary elements, the other standing for a distributed
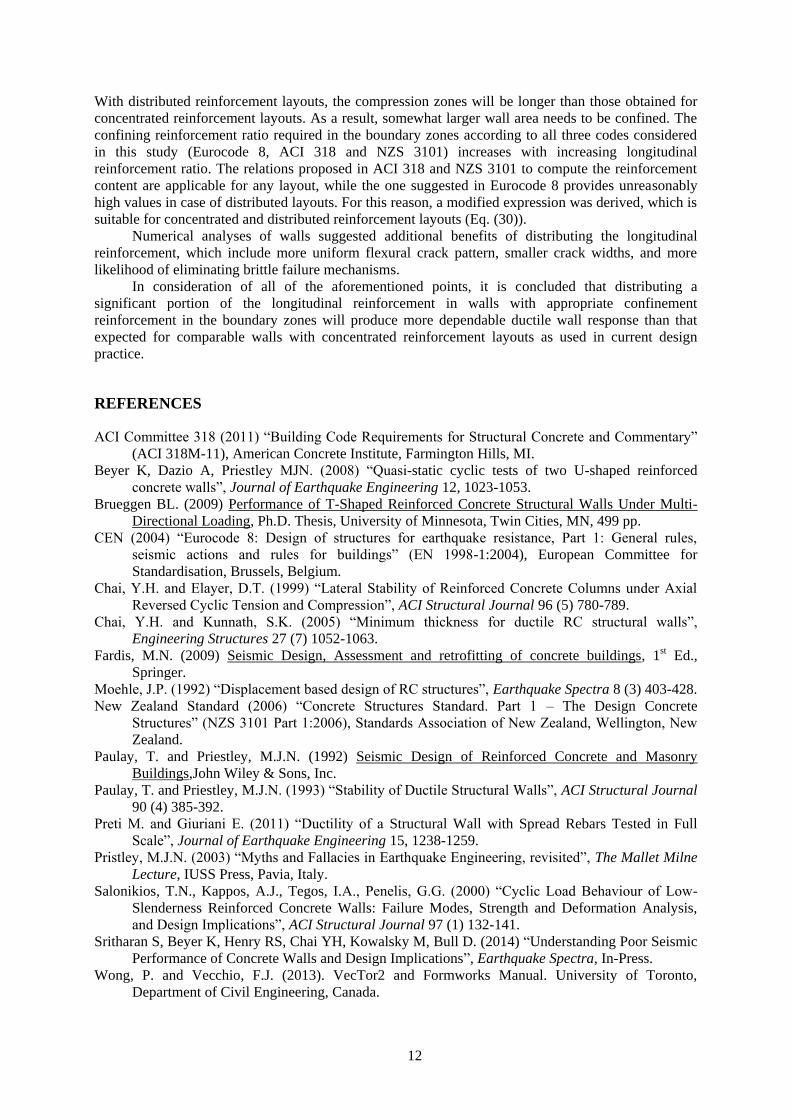
reinforcement arrangement (Figure 4a). To make the comparison between the analyses meaningful, the
amounts of reinforcement were chosen such that the two cases provide the same moment resistance at
2% drift (Figure 5a).
Figure 4b and Figure 4d display the crack patterns of the walls at a drift of 3%, which was
considered as the limit for the numerical reliability of the present analyses. It is evident that in case of
concentrated reinforcement layout the crack widths in the boundary zones are relatively small when
compared to the web region. For the distributed layout, the cracks are more uniform along the wall
length and there is no sudden change in crack width between the confined boundary zones and the web
region of the wall. The cracks in the lightly reinforced web of the wall with the concentrated
reinforcement layout are much wider than the crack widths in the web of the wall with the distributed
reinforcement layout, as depicted in Figure 5b. Lastly, it is noted that the distinct reinforcement
layouts also influence the wall failure mechanism: due to large crack widths in the web, the
concentrated layout led to premature sliding shear failure at the base of the wall according to (Figure
4c), while for the distributed layout the crack widths are better controlled and the wall failed due to
crushing of the compressed zone (Figure 4e).
Figure 3. (a) Maximum tensile strain as a function of the reinforcement ratio in the boundary zone;
(b) Design shear resistance against sliding as a function of the total reinforcement ratio in the critical
section in which sliding shear failure may occur.
0.02 0.025 0.03 0.035 0.04 0.045 0.05
0.035
0.04
0.045
0.05
0.055
Reinforcement ratio in the boundary zones ( b )
Cri
tical
ten
sile
str
ain
(
sm,c
)
Paulay and Priestley, 1993
Chai and Elayer, 1999
0.005 0.01 0.015 0.020
5000
10000
15000
Total reinforcement ratio ( tot
)
Sli
din
g s
hear
resi
st.
( V R
d,S
) [
kN
]
EN 1998-1:2004
ACI 318M-11
NZS 3101:Part1:2006
(a) (b)
Angelica Rosso, João Almeida, Raluca Constantin, Katrin Beyer, Sri Sritharan
11
Figure 4. (a) Reinforcement layouts at the wall base; (b) Crack pattern at 3% drift for the concentrated
reinforcement layout; (c) Sliding shear failure mechanism at the base for the concentrated
reinforcement layout; (d) Crack pattern at 3% for the distributed reinforcement layout; (e) Crushing of
the compressed zone for the distributed reinforcement layout.
Figure 5. (a) Wall pushover results until 3% drift; (b) Estimates of maximum crack width.
CONCLUSIONS
In this paper, the influence of concentrated and distributed longitudinal reinforcement layouts
on the lateral load response of rectangular RC walls has been investigated. Several different issues that
affect the wall response were examined using available models, code recommendations and nonlinear
monotonic analyses with shell elements. It was found that commonly used wall details with
concentrated reinforcement at the wall ends can cause undesirable response with respect to the
following points:
Buckling of boundary zones: for boundary elements with concentrated reinforcement, instability
may occur at a reduced eccentricity, causing wall out-of-plane failure at lower drift levels.
Shear sliding failure: lower amounts of reinforcement used in the web region when walls are
designed with a concentrated reinforcement layout cause wider cracks in this region, making the
walls to experience shear sliding due to reduction in shear resistance at the crack interface.
0 0.5 1 1.5 2 2.5 30
500
1000
1500
2000
2500
3000
3500
4000
4500
Drift [%]
Ho
rizo
nta
l fo
rce
[kN
]
Concentrated reinforcement
Distributed reinforcement
0 0.5 1 1.5 2 2.5 30
5
10
15
Drift [%]
Max
imu
m c
rack
wid
th [
mm
]
Concentrated reinforcement
Distributed reinforcement
(a) (b)
(a)
(b) (c) (d) (e)
12
With distributed reinforcement layouts, the compression zones will be longer than those obtained for
concentrated reinforcement layouts. As a result, somewhat larger wall area needs to be confined. The
confining reinforcement ratio required in the boundary zones according to all three codes considered
in this study (Eurocode 8, ACI 318 and NZS 3101) increases with increasing longitudinal
reinforcement ratio. The relations proposed in ACI 318 and NZS 3101 to compute the reinforcement
content are applicable for any layout, while the one suggested in Eurocode 8 provides unreasonably
high values in case of distributed layouts. For this reason, a modified expression was derived, which is
suitable for concentrated and distributed reinforcement layouts (Eq. (30)).
Numerical analyses of walls suggested additional benefits of distributing the longitudinal
reinforcement, which include more uniform flexural crack pattern, smaller crack widths, and more
likelihood of eliminating brittle failure mechanisms.
In consideration of all of the aforementioned points, it is concluded that distributing a
significant portion of the longitudinal reinforcement in walls with appropriate confinement
reinforcement in the boundary zones will produce more dependable ductile wall response than that
expected for comparable walls with concentrated reinforcement layouts as used in current design
practice.
REFERENCES
ACI Committee 318 (2011) “Building Code Requirements for Structural Concrete and Commentary”
(ACI 318M-11), American Concrete Institute, Farmington Hills, MI.
Beyer K, Dazio A, Priestley MJN. (2008) “Quasi-static cyclic tests of two U-shaped reinforced
concrete walls”, Journal of Earthquake Engineering 12, 1023-1053.
Brueggen BL. (2009) Performance of T-Shaped Reinforced Concrete Structural Walls Under Multi-
Directional Loading, Ph.D. Thesis, University of Minnesota, Twin Cities, MN, 499 pp.
CEN (2004) “Eurocode 8: Design of structures for earthquake resistance, Part 1: General rules,
seismic actions and rules for buildings” (EN 1998-1:2004), European Committee for
Standardisation, Brussels, Belgium.
Chai, Y.H. and Elayer, D.T. (1999) “Lateral Stability of Reinforced Concrete Columns under Axial
Reversed Cyclic Tension and Compression”, ACI Structural Journal 96 (5) 780-789.
Chai, Y.H. and Kunnath, S.K. (2005) “Minimum thickness for ductile RC structural walls”,
Engineering Structures 27 (7) 1052-1063.
Fardis, M.N. (2009) Seismic Design, Assessment and retrofitting of concrete buildings, 1st Ed.,
Springer.
Moehle, J.P. (1992) “Displacement based design of RC structures”, Earthquake Spectra 8 (3) 403-428.
New Zealand Standard (2006) “Concrete Structures Standard. Part 1 – The Design Concrete
Structures” (NZS 3101 Part 1:2006), Standards Association of New Zealand, Wellington, New
Zealand.
Paulay, T. and Priestley, M.J.N. (1992) Seismic Design of Reinforced Concrete and Masonry
Buildings,John Wiley & Sons, Inc.
Paulay, T. and Priestley, M.J.N. (1993) “Stability of Ductile Structural Walls”, ACI Structural Journal
90 (4) 385-392.
Preti M. and Giuriani E. (2011) “Ductility of a Structural Wall with Spread Rebars Tested in Full
Scale”, Journal of Earthquake Engineering 15, 1238-1259.
Pristley, M.J.N. (2003) “Myths and Fallacies in Earthquake Engineering, revisited”, The Mallet Milne
Lecture, IUSS Press, Pavia, Italy.
Salonikios, T.N., Kappos, A.J., Tegos, I.A., Penelis, G.G. (2000) “Cyclic Load Behaviour of Low-
Slenderness Reinforced Concrete Walls: Failure Modes, Strength and Deformation Analysis,
and Design Implications”, ACI Structural Journal 97 (1) 132-141.
Sritharan S, Beyer K, Henry RS, Chai YH, Kowalsky M, Bull D. (2014) “Understanding Poor Seismic
Performance of Concrete Walls and Design Implications”, Earthquake Spectra, In-Press.
Wong, P. and Vecchio, F.J. (2013). VecTor2 and Formworks Manual. University of Toronto,
Department of Civil Engineering, Canada.