influence of motivation on wayfinding - university of...
TRANSCRIPT
INFLUENCE OF MOTIVATION ON WAYFINDING
by
Samvith Srinivas
B. Tech., University of Madras, 2002
M.S.I.S., University of Pittsburgh, 2004
Submitted to the Graduate Faculty of
School of Information Sciences in partial fulfillment
of the requirements for the degree of
Doctor of Philosophy
University of Pittsburgh
2010
ii
UNIVERSITY OF PITTSBURGH
SCHOOL OF INFORMATION SCIENCES
This dissertation was presented
by
Samvith Srinivas
It was defended on
April 2nd
, 2010
and approved by
Peter Brusilovsky, Associate Professor, School of Information Sciences
Alexander Klippel, Assistant Professor, Department of Geography, Penn State University
C. Michael Lewis, Professor, School of Information Sciences
Christian Schunn, Associate Professor, Learning Research and Development Center
Dissertation Advisor: Stephen C. Hirtle, Professor, School of Information Sciences

iii
Copyright © by Samvith Srinivas
2010

iv
This research explores the role of affect in the domain of human wayfinding by asking if
increased motivation will alter the performance across various routes of increasing complexity.
Participants were asked to perform certain navigation tasks within an indoor Virtual Reality
(VR) environment under either motivated and not-motivated instructions. After being taught to
navigate along simple and complex routes, participants were tested on both the previously
learned routes and new routes that could be implicitly derived from the prior spatial knowledge.
Finally, participants were tested on their ability to follow schematized instructions to explore
familiar and unfamiliar areas in the VR environment. Performance of the various spatial tasks
across the motivated and control groups indicated that motivation improved performance in all
but the most complex conditions. Results of the empirical study were used to create a theoretical
model that accounts for the influence of affect on the access of route knowledge. Results of the
research suggest the importance of including past knowledge and affect of the traveler as
components of future wayfinding systems.
INFLUENCE OF MOTIVATION ON WAYFINDING
Samvith Srinivas, M.S.
University of Pittsburgh, 2010

v
TABLE OF CONTENTS
PREFACE .................................................................................................................................... XI
1.0 INTRODUCTION ........................................................................................................ 1
1.1 ISSUES .................................................................................................................. 1
1.1.1 Spatial Familiarity and Route Directions ...................................................... 1
1.1.2 Role of Affect in Wayfinding .......................................................................... 3
1.2 ORGANIZATION OF THE THESIS ................................................................ 4
2.0 BACKGROUND AND RELATED WORK .............................................................. 5
2.1 SPATIAL COGNITION ..................................................................................... 5
2.2 AFFECT AND COGNITION ............................................................................. 9
2.2.1 Affect and Spatial Cognition ........................................................................ 13
2.3 ADAPTIVE WAYFINDING SYSTEMS ......................................................... 14
2.4 KNOWLEDGE ROUTE THEORY ................................................................. 17
2.5 WAYFINDING STUDIES—VIRTUAL REALITY (VR) ENVIRONMENTS
20
3.0 RESEARCH DESIGN ............................................................................................... 23
3.1 PROBLEM ......................................................................................................... 23
3.1.1 Purpose ........................................................................................................... 23
3.1.2 Theory, Research Objectives and Scope...................................................... 24

vi
3.1.3 Research Questions........................................................................................ 25
3.1.3.1 Confirmatory Research Questions .................................................... 25
3.1.3.2 Exploratory Research Questions ....................................................... 26
3.2 METHOD ........................................................................................................... 26
3.2.1 Participant Recruitment ............................................................................... 26
3.2.2 Materials ......................................................................................................... 26
3.2.2.1 VR Environment ................................................................................. 27
3.2.3 Design .............................................................................................................. 30
3.2.4 Procedure ....................................................................................................... 30
3.2.4.1 Adaptation Phase ................................................................................ 30
3.2.4.2 Training Phase ..................................................................................... 31
3.2.4.3 Test Phase ............................................................................................ 32
3.2.4.4 Inducing Motivation ........................................................................... 34
4.0 RESULTS ................................................................................................................... 36
4.1 SPATIAL ABILITIES AND LEARNING ...................................................... 36
4.2 STAGE 1 ............................................................................................................. 37
4.2.1 Time ................................................................................................................ 39
4.2.2 Wrong Turns .................................................................................................. 41
4.3 STAGE 2 ............................................................................................................. 46
4.3.1 Time ................................................................................................................ 46
4.3.2 Wrong Turns .................................................................................................. 49
4.4 MOTIVATION .................................................................................................. 52
5.0 EXTENSIONS TO KNOWLEDGE ROUTE THEORY ....................................... 53

vii
5.1 OVERVIEW ....................................................................................................... 53
5.2 THEORETICAL EXTENSIONS ..................................................................... 54
5.3 EXPERIMENTAL RELEVANCE OF THEORETICAL CONCEPTS ...... 56
6.0 DISCUSSION ............................................................................................................. 61
APPENDIX A .............................................................................................................................. 66
APPENDIX B .............................................................................................................................. 67
APPENDIX C .............................................................................................................................. 70
BIBLIOGRAPHY ....................................................................................................................... 72
viii
LIST OF TABLES
Table 1. Details of K and deducedK routes .................................................................................. 30
Table 2. Details of KN and deducedKN routes ............................................................................ 34
Table 3. Mean travel times for SimpleK (SK), SimpleDeducedK (SDK), ComplexK (CK) and
ComplexDeducedK (CDK) routes ................................................................................................ 40
Table 4. Mean travel times for trained regions of Stage 1 and Stage 2 ........................................ 48
Table 5. Number of wrong turns per decision point ..................................................................... 51
ix
LIST OF FIGURES
Figure 1. Differential recall of paired associates as a function of arousal level (Based on
Kleinsmith & Kaplan, 1963) ......................................................................................................... 10
Figure 2. Typical relationship between memory performance and arousal .................................. 11
Figure 3. The most basic form of a k-route .................................................................................. 18
Figure 4. Layout of the training and test VR Environment for Stage 1. ....................................... 28
Figure 5. Snapshot of Location B - White Arrow ......................................................................... 29
Figure 6. Layout of the test VR environment for route 11(ABX) in Stage 2 ............................... 33
Figure 7. Scatter plots of spatial orientation ability, working memory capacity and time (Control
and Motivated groups) .................................................................................................................. 37
Figure 8. Scatter plots of spatial orientation ability, working memory capacity and wrong turns
(Control and Motivated groups) .................................................................................................... 38
Figure 9. Plot of mean travel times (seconds) of SimpleK (SK), SimpleDeducedK (SDK),
ComplexK (CK), and ComplexDeducedK (CDK) routes ............................................................ 40
Figure 10. Layout of invisible walls for a route in the test phase. ................................................ 41
Figure 11. Plot of average number of wrong turns for each of the four types of routes—SimpleK
(SK), SimpleDeducedK (SDK), ComplexK (CK) and ComplexDeducedK (CDK) .................... 42

x
Figure 12. Correlations between wrong turns and time for more complex (Complex K,
ComplexDeduced K) routes (Control condition) .......................................................................... 44
Figure 13. Correlations between wrong turns and time for more complex (Complex K,
ComplexDeduced K) routes (Motivated condition) ..................................................................... 45
Figure 14. Average number of repeated wrong turns per route .................................................... 46
Figure 15. Mean times for K and DeducedK Routes in Stage 1 and 2 (Control group) ............... 48
Figure 16. Mean Times for K and DeducedK Routes in Stage 1 and 2 (Motivated Group) ........ 49
Figure 17. Average number of wrong turns per route for Stage 1 and Stage 2 (Control group) .. 50
Figure 18. Average number of wrong turns per route for Stage 1 and Stage 2 (Motivated group)
....................................................................................................................................................... 51
Figure 19. Proposed effect of affect on access to k ...................................................................... 56
Figure 20. Proposed effect of attention on access to k ................................................................. 57
Figure 21. Proposed effect of time on the access to k .................................................................. 58

xi
PREFACE
I would like to thank each and every member of my thesis committee for all the help, guidance,
advice and scientific insights provided to me through the early and later stages of my work.
I would like to thank Dr. Michael Lewis, Dr. Peter Brusilovsky, Dr. Hassan Karimi and Dr.
Marek Druzdzel, for supporting me through various stages of my life at the School of
Information Sciences (SIS). A special thanks to Dr. Alexander Klippel for his continuous support
and encouragement that began during our very first interaction and continues to this day. A
special thanks also to the Spatial Cognition community for their support and recognition of my
work at various conferences across the globe. I thank all my friends and colleagues at the
University of Pittsburgh for their continuous encouragement, support and feedback. I would also
like to extend my gratitude to the entire SIS community for their constant support through the
years. Finally, I would like to thank my family and my advisor Prof. Stephen C. Hirtle, without
whom none of this would have been possible—I dedicate this work to them.

1
1.0 INTRODUCTION
Imagine a scenario where you are on a leisurely stroll through a familiar neighborhood park.
Imagine a second scenario, where you are trying to find your way through an unfamiliar airport,
and you are running late to catch your flight. The wayfinding tasks represented in these two
scenarios are performed under varying conditions. The parameters of these conditions include
motivation, time constraints, and familiarity. This research attempts to explore the performance
of wayfinding tasks of varying degrees of familiarity and route complexity, which are performed
under varying task conditions. Furthermore, this research explores the effectiveness of presenting
schematized route directions, which are based on the prior knowledge of a wayfinder, under
constrained and non-constrained conditions.
1.1 ISSUES
1.1.1 Spatial Familiarity and Route Directions
A common problem in spatial domains is that of giving and following route directions to get
from one place to another. Over the past several decades, there has been a considerable amount
of research conducted on the nature and quality of route directions. While there are many
instances where wayfinding tasks take place in a region that is completely familiar or unfamiliar,

2
Srinivas and Hirtle (2007) considered situations where wayfinding tasks take place in a partially
familiar environment that is composed of a familiar portion and an unfamiliar portion along a
single route. It is a common occurrence that wayfinder‘s sometimes travel from a region of
familiarity to a region of unfamiliarity, or vice versa, from an unfamiliar region to a familiar
region. An example would be a wayfinder‘s first time visit to a neighboring town (the unfamiliar
region) from her residential neighborhood (the familiar region), or returning home (the familiar
region) having been driven by colleagues to a restaurant in an unfamiliar neighborhood (the
unfamiliar region). In their work, Srinivas and Hirtle consider this case of a partially familiar
route. They introduced the concept of schematization of routes descriptions based on prior
knowledge of a wayfinder, and present a formalization that models routes of this nature with
empirical evidence to support participant‘s preferences for this knowledge based schematization.
The evidence they presented suggests that participants preferred route descriptions that were
schematized on the basis of the individual wayfinder‘s prior knowledge in that familiar regions
were only described briefly, while unfamiliar regions were described in detail.
This dissertation extends on the concept of a partially familiar route to include the
possible influence of affect on the differential access to route knowledge by means of an
empirical study. I use the term affect, in a broad sense, which describes internal states such as
moods, motivation, anxiety, emotion and related feeling states (Barrett & Russell, 1999; Russell,
1980; Smith & Kosslyn, 2007). Results of the empirical study are used to create a theoretical
model that accounts for the influence of affect on the access of route knowledge. Results of the
empirical study and the extensions to the theory of partially familiar routes have implications for
the design of future wayfinding systems.

3
1.1.2 Role of Affect in Wayfinding
Human wayfinding tasks involve complex information processing and decision making that
usually involves access to acquired or deduced spatial knowledge (Golledge, 1999; Medyckyj-
Scott & Blades, 1992). Human cognition, in general, and spatial knowledge, in particular, is an
important factor that may determine the design and presentation of cognitively adequate maps or
route directions. However, recent studies have also shown that affect influences human cognition
(Smith & Kosslyn, 2006).
Emotion, as a primary component of affect, has been shown to affect our rational
thinking, information processing, memory, reasoning, judgment and decision making (Damasio,
1995; Forgas, 2000; Smith & Kosslyn, 2006). Given that our cognitive abilities are influenced by
affect, it is interesting to investigate the possible influence that affect may have on wayfinding
tasks. Motivation was used as an example of an affective state (the notion of motivation as an
affective state is consistent with the circumplex model of affect as described by Barrett and
Russell (1999; Russell, 1980). In the empirical study, spatial tasks and experimental conditions
were designed to analyze interactions between motivated and not-motivated tasks—across routes
that were learned previously, and new or deduced routes.
Results from this experiment, and recent results from related studies (Brunyé, Mahoney,
Augustyn, & Taylor, 2009), justify an expansion on the theory of Knowledge Routes as
introduced by Srinivas and Hirtle (2007) to incorporate an affective component. The theory
introduced as part of this dissertation, considers spatial knowledge as a factor of an individual‘s
‗state of mind‘ i.e., affect, prior knowledge, time and attention; as opposed to the individual‘s
prior knowledge alone.

4
This work can serve as a basis for future design of GPS and navigation systems that take
affect and wayfinding into account. For instance, future GPS systems may direct users through
routes based on the user‘s prior spatial knowledge and current affective state. Such a
hypothetical system especially gains importance as recent work by artist and teacher Chiristian
Nold, on ‗Bio Mapping,‘ has shown that participants find certain areas of cities more stressful
than others (Staedter, 2006). Results of this work and related research indicate that under
motivated driving conditions or under high arousal states, longer less complex routes might be
optimal. Recent advancements in physiological sensing and estimation of drivers stress level are
important practical developments that will facilitate this process (Healey & Picard, 2005; Lin,
Leng, Yang, & Cai, 2007). The ―smart wheel‖ developed by Lin and colleagues enables the
sensing of physiological metrics that will allow vehicles to interpret drivers affective state. Given
these recent advances in detecting and inferring stress levels, this research will likely gain more
importance in the near future.
1.2 ORGANIZATION OF THE THESIS
The thesis is organized as follows. The background to the literature and details of related work is
provided in Section 2.0 The experiment design is presented in Section 3.0 The results are
presented in Section 4.0 an extension to a theory is presented in Section 5.0 and the discussion is
presented in Section 6.0
5
2.0 BACKGROUND AND RELATED WORK
This chapter begins with a summary of the interdisciplinary field of spatial cognition in Section
2.1. This is followed by a summary of the research carried out in the area of affect and cognition
in Section 2.2. A detailed review of the work in the field of affect and spatial cognition is given
in Section 2.2.1 Section 2.3 begins with a detailed review of adaptive wayfinding systems. The
knowledge route theory is reviewed in Section 2.4. Finally, Section 2.5 lists various related
wayfinding studies conducted in virtual environments.
2.1 SPATIAL COGNITION
Over the last few decades, there has been a considerable amount of work in the interdisciplinary
field of spatial cognition. Contributions to the field are made by psycholinguists (Klein, 1982,
1983; Talmy, 1975; Wunderlich & Reinelt), geographers, psychologists, and computer scientists
(Agrawala & Stolte, 2001; Allen, 1997; Daniel & Denis, 1998; Fontaine & Denis, 1999 ;
Golledge, 1999; Hirtle & Hudson, 1991; Klippel, 2003a; Mark, Freksa, Hirtle, Lloyd, &
Tversky, 1999; Raubal, Egenhofer, Pfoser, & Tryfona, 1997; Streeter, Vitello, & Wonsiewicz,
1985; Tom & Denis, 2003; Tversky & Lee, 1999). Spatial cognition is the field that is concerned
with how humans think about space. The scale of the space in question can range from a few
feet—a desktop space, to a few miles or more—a city or country. A great amount of work in

6
spatial cognition deals with the issue of wayfinding. Wayfinding studies typically occur in a
small scale space (e.g., inside of a building), medium scale space (e.g., college campus) or large
scale space (e.g., a neighborhood) (Freundschuh & Egenhofer, 1997). Wayfinding studies
analyze human‘s wayfinding behavior and ability. Wayfinding studies have shown that
wayfinding tasks involve complex cognitive processes that involve access to acquired or deduced
spatial knowledge (Golledge, Dougherty, & Bell, 1995; Golledge & Spector, 1978; Hirtle &
Hudson, 1991).
Given the complexities of wayfinding tasks, the nature of wayfinding studies is varied.
Wayfinding studies may look at the wayfinder‘s navigation behavior in familiar or unfamiliar
environments (Streeter et al., 1985), the study of route directions (Denis, Pazzaglia, Cornoldi, &
Bertolo, 1999; Fontaine & Denis, 1999 ), a wayfinder‘s acquisition of spatial knowledge
(Golledge, 1992), a wayfinder‘s conceptualization and internal representations of space (Mark et
al., 1999; Tversky, 1993), a wayfinder‘s interaction with navigation aids (Krüger et al., 2004;
Streeter et al., 1985) and the importance of landmarks (Raubal & Winter, 2002; Sorrows &
Hirtle, 1999; Tom & Denis, 2003).
A large amount of research in the field of spatial cognition deals with the study of
wayfinding through unfamiliar environments. Wayfinder‘s are usually provided with navigation
aids, or some information (or description) of the environment prior to travel. The wayfinder‘s
navigation behavior is recorded and analyzed. These empirical studies help us learn about a
wayfinder‘s navigation behavior in unfamiliar environments. For example, Streeter and
colleagues provided participants with three kinds of navigation aids and analyzed participants
wayfinding behavior through unfamiliar environments (Streeter et al., 1985). Results of their

7
work help us learn about wayfinding behavior in unfamiliar environments and also have
implications for the design of navigation aids.
Studies have also dealt with wayfinder‘s familiarity with an environment.
Here, a wayfinder is typically asked to describe a familiar space or describe travel through a
familiar space. The descriptions gathered through the studies are analyzed and provide important
information about human‘s conceptualization and cognition of space. The work on descriptions
and depictions by Tversky and Lee (1999) serve as an example of such a study.
Here, participants were asked to describe known routes using either verbal descriptions or
pictorial depictions. Analysis of participant‘s responses revealed a common underlying
semantics and structure for route maps and route directions.
A considerable amount of work of this nature is done in the study of route directions.
While some studies required participants to travel an unfamiliar environment with the use of
route directions prepared by the experimenter (Allen, 2000; Daniel & Denis, 1998; Denis et al.,
1999; Streeter et al., 1985), other studies required participants to prepare route directions to
describe travel through familiar environments (Fontaine & Denis, 1999 ; Mark & Gould, 1992;
Tversky & Lee, 1999). These directions were analyzed by the experimenters on various
measures. The kinds of environments for such studies also varied from familiar or unfamiliar
environments (Lovelace, Hegarty, & Montello, 1999), or environments that varied in their
physical characteristics, for example, underground subway versus city environments (Fontaine &
Denis, 1999 ).
Study of a wayfinder‘s internal representation or conceptualization of a space is not
limited to the study of route directions. Typically, various aspects of the wayfinder‘s internal
spatial representation are elicited and then analyzed. This process reveals how humans store or
8
represent spatial information in our cognitive system. Example of studies of this nature include
those mentioned above that analyzed route descriptions provided by participants (Daniel &
Denis, 1998) or studies that analyzed descriptions and depictions (Tversky & Lee, 1999).
A wayfinder‘s acquisition of spatial knowledge is also a significant area of interest in
spatial cognition. Studies of this kind include exploring the concept of spatial familiarity (Gale,
Golledge, Halperin, & Couclelis, 1990), exploring the concept of place recognition (Golledge,
1992), or exploring the effectiveness of various methods of spatial knowledge acquisition
(Golledge et al., 1995).
A design of a wayfinding system and a wayfinder‘s interaction with a wayfinding system
is in a large part dependent on the wayfinder‘s cognitive processes and abilities. Systems that are
designed to take these considerations into account tend to reduce errors and improve the usability
of the devices (Agrawala & Stolte, 2001; Klippel, Richter, Barkowsky, & Freksa, 2005). A large
amount of work is dedicated specifically to the study of a wayfinder‘s interaction with a
particular wayfinding system to analyze the effectiveness and efficiency of the system (Abowd,
Mynatt, & Rodden, 2002).
The notion of landmarks has also received comprehensive attention. Landmarks have
been found to play a key role in the wayfinding process (Presson & Montello, 1988; Raubal &
Winter, 2002; Sorrows & Hirtle, 1999; Tom & Denis, 2003, 2004). Landmarks are usually
locations of prominence which are popular among humans in a neighborhood or city. Landmarks
have also been found to play an important role in the description of routes. This notion of
landmarks has been extended further. Comprehensive surveys conducted as part of work in
spatial knowledge acquisition reveals that, often times, locations that are considered ―best
known‖ or ―landmarks‖, are locations that are tied to an individual‘s activity pattern—that is best

9
known locations could be buildings that the individual may frequent (Gale et al., 1990; Golledge
& Spector, 1978).
2.2 AFFECT AND COGNITION
Affect has historically been studied independently of cognition, but more recent studies have
begun to look more closely at the relationship between affect and cognition (Dolan, 2002; Smith
& Kosslyn, 2007). Researchers have approached this issue from a neurological perspective
(Damasio, 1995; Dolan, 2002), or from a cognitive perspective (Brunyé et al., 2009; Forgas,
2000). Two broad approaches are used to capture the range of affective states. One approach is to
define basic emotions, a primary component of affect (Ekman & Friesen, 1971). The basic
emotions as described by Ekman and Friesen include Anger, Disgust, Fear, Happiness, Sadness
and Surprise. The other approach is a dimensional approach that defines affective states on a
continuum (Barrett & Russell, 1999; Russell, 1980). This approach involves modeling of affect
on the dimensions of Valence (pleasant or unpleasant) and Arousal (activation or deactivation).
According to this approach, motivation (as induced as part of this study) may be classified as an
affective state with high arousal and positive valence. Each of the approaches just mentioned has
its relative advantages depending on the context it is used.
In the field of affect and cognition, the relationship between affect, specifically emotion,
and memory is of particular interest. Emotional arousal is known to enhance recollection
(Christianson, 1992). For example, Heuer and Reisberg (1992) show that participants were able
to remember emotional events better than neutral events. Kleinsmith and Kaplan (1963) show

10
that higher percent of digits that were paired with high arousal words were remembered over
time, while digits paired with low arousal words were forgotten over time, as shown in Figure 1.
Figure 1. Differential recall of paired associates as a function of
arousal level (Based on Kleinsmith & Kaplan, 1963)
The effect of affect, specifically stress, on memory storage tends to follow an inverted U-
shaped curve, where moderate arousal is likely to enhance memory performance, whereas
extreme or prolonged arousal response is likely to reduce memory performance, as shown in
Figure 2 (see, Smith & Kosslyn, 2007, ch. 9). This is often referred to as the Yerkes-Dodson law
named after their seminal work in the early part of the 20th
century (Yerkes & Dodson, 1908).
However, as Teigen (1994) points out in his extensive review of arousal—performance studies—
that the relationship between these factors can be complex. Teigen cautions that simplifying the

11
relationship between stress and memory to an inverted U-shaped curve may not be accurate in all
instances.
Figure 2. Typical relationship between memory performance and arousal
Closely related to stress is the effect of mood on memory. For example, Bower (1981)
demonstrated that participants exhibited mood-state-dependent memory in the recall of word lists
and experiences. Memory has also been shown to be influenced by highly emotional public
events. Some relatively recent research in this area include studies of participants memories of
events such as the 9/11 terrorist attacks (Talarico & Rubin, 2003), or the O. J. Simpson trials
(Schmolck & Buffalo, 2000). These results have shown that while memories of emotional public
events may not be entirely accurate, they are still more likely to be recollected to a higher degree
than non emotional events over passage of time.

12
Affect has also been shown to interact with attention. For example, Pratto and John
(1991) use a modified version of the Stroop test to demonstrate that undesirable words had a
greater effect in distracting participants from the color naming task. In a more recent study, Fox
and colleagues (2001) found that threatening stimuli tended to hold participants attention longer
than neutral or positive cues. Affect has been found to capture attention and impair performance
on a task. However, it has also been found to improve attentional processing. The ―Face in the
crowd‖ experiments have shown that threatening faces tended to stand out more than happy or
neutral faces in search tasks (Hansen & Hansen, 1988; Ohman, Lundqvist, & Esteves, 2001).
Closely related to attention is the effect of affect on well learned or proceduralized tasks.
Beilock and Carr (2001) found evidence that performance pressure (desire to perform well in a
given situation) can induce chocking in proceduralized tasks. In their exploration of a golf
putting task, the researchers first verify that golf putting by experts is indeed a proceduralized
task that involves less attention paid to step-by-step execution. The researchers then demonstrate
that performance pressure negatively effects performance of putting by golf experts—the
proceduralized task. This evidence lends support to the self focus or explicit monitoring theories
that explain chocking under pressure (Baumeister, 1984; Lewis & Linder, 1997). Explicit
monitoring theories propose that choking under pressure is caused due to increased attention paid
to well learned tasks that are usually conducted with little or no attentional resources. Explicit
monitoring theories are a contrast to the distraction theory (Wine, 1971). The distraction theory
proposes that performance pressure leads to a diversion of attentional resources away from the
task performed, which results in choking.

13
2.2.1 Affect and Spatial Cognition
Work in the interdisciplinary field of affect and spatial cognition is relatively less common.
While there is considerable literature in the field done on animals (Teigen, 1994), research done
on the effect of affect on human spatial cognition is relatively scarce. Some early work has
looked at human performance in stylus maze tasks as a function of anxiety (Farber & Spence,
1953; Matarazzo, Ulett, & Saslow, 1955) and punishment (Vaughn & Diserens, 1930).
Matarazzo and colleagues (1955) investigated the proposed curve or functional relationship
between anxiety and performance in a stylus maze experiment that served as a complex task.
Their results indicated a U shaped function with time as the learning criteria, where moderately
anxious participants performed better than participants with low or high anxiety levels. The
results also show a rectilinear function with ‗number of trials‘ as the learning criteria. Farber and
Spence (1953) investigated the influence of drive on the performance across a stylus maze task
with varying levels of complexity. They compared the performance of an anxious and non-
anxious group (with the assumption that anxiety reflects drive level), on a stylus maze task
consisting of varying levels of complexity or difficulty. They found that drive level improved
performance on simple tasks but reduced performance on complex tasks. These results were
similar to those found by Vaughn and Diserens (1930), who investigated the relationship
between efficiency and learning in a stylus maze task, as a function of punishment.
More recent work in the area of affect and wayfinding looks at detecting drivers stress
with driver safety as the principle goal (Healey & Picard, 2005; Lin et al., 2007). Healy and
Picard (2005) investigate the reliability of physiological measures in indicating a driver‘s stress
level. In their study, the investigators attached physiological sensors to measure driver‘s skin
conductivity and heart rate metrics. Participants performed real world driving tasks across varied

14
conditions of rest, city, or highway driving conditions. The results of their research suggest that
physiological sensing can be used to determine varying levels of drivers stress in a real world
driving task. The investigators suggest that detecting stress levels of a driver in driving
conditions might prove useful in customizing the driver‘s ‗in vehicle environment‘. A small but
important technical step in precisely this direction was taken by Lin and colleagues (2007) who
developed a ―smart wheel‖. The device was shown to satisfactorily measure a driver‘s pulse
wave, breathing wave, skin temperature and gripping force in real time. Lin and colleagues state
that such a system would prove useful in enhancing driver safety. The most recent research in the
field of affect and spatial cognition investigated the effects of affective state on memory for map-
based information (Brunyé et al., 2009). In their research, Brunyé and colleagues demonstrated
that arousal amplifies symbolic distance effects and leads to a globally-focused spatial mental
representation.
2.3 ADAPTIVE WAYFINDING SYSTEMS
A well established method of improving usability in information systems is to tailor the
presentation of the system output to a particular user‘s goals, need or preference. Such ―Adaptive
Systems‖ are well established in the field of education and online information systems
(Brusilovsky, 2001, 2007; Kaplan & Fenwick, 1993). More recently, the field of adaptive
systems has extended into the domain of mobile guides (Kray & Baus, 2003; Kruger, Baus,
Heckmann, & Kruppa, 2007). These mobile guides may range from travel guides (Cheverst,
Mitchell, & Davies, 2002; Simcock, Hillenbrand, & Thomas, 2003) to personalized navigation
systems (Baus, Krüger, & Wahlster, 2002). An important factor in adaptive systems is the

15
content that is adapted and the factors that determine the adaptation. For most adaptive mobile
guides, the content adapted is the presentation of output in the form of route directions or maps.
The main factors that determines adaptation, is the user‘s location and the available resources.
The GUIDE adaptive mobile system was designed to replace the generic tourist guide,
given that the generic tourist guide is designed for multiple users and may contain information
that may not be of interest to a particular individual (Cheverst et al., 2002). The system was
designed to provide visitors with up-to-date and context aware information while they visit the
city of Lancaster, England. The information presented to users was adapted based on the user‘s
location, personal interest and the visitor‘s personal profile (e.g., set of locations already visited).
The system could use this information to tailor its output to an individual‘s activity pattern. For
example, if the user returns to an attraction that was previously visited, the system could display
a message to welcome the user back to that attraction. User experience with the system was
found to be positive, suggesting that user‘s felt ―reassured‖ with information presented in this
manner. Simcock and colleagues (2003) develop another tourist guide that tailors information for
a particular user based on user‘s location, accounting for nearby attractions, buildings in view,
and public utilities. In their paper, Simcock and colleagues present some of the technical
challenges related to presenting context aware information given resource limitations (e.g., small
screen size, low bandwidth) of mobile systems.
Baus and colleagues (2002) present a system that takes into account the various
transportation means employed during navigation. In their work, they suggest that personal
wayfinding may often take place across various modalities (e.g., walking and driving). Hence,
they present an adaptive mobile wayfinding system that takes into account various factors that
might change across these modalities. Their hybrid system was developed to account for the
16
various positioning techniques used across these modalities, and work toward providing the user
with a seamless transformation between these modalities.
Work in the area of adaptive mobile systems has primarily involved the adaption of
output based on user‘s location and resources of the mobile device. More recent work in this area
has included the modeling of user‘s affective or belief states (Bianchi-Berthouze & Lisetti, 2002;
Hudlicka & McNeese, 2002). Hudlicka and McNeese (2002) present an adaptive interface
system named–Affect and Belief Adaptive Interface System (ABAIS). The ABAIS senses or
infers a user‘s affective state, and performance relevant beliefs. ABAIS identifies the potential
impact of the user‘s affective state on their performance. The system then selects a compensatory
strategy and implements this strategy in terms of specific GUI adaptations. The user‘s affective
profile is updated by various means, including but not limited to self-reports and physiological
sensing. The system‘s bias prediction is based on empirical findings in affect research combined
with knowledge of the context of the task. In closely related work, Bianchi-Berthouze and Lisetti
(2002) develop a modeling technique that is designed to sense a user‘s affective state and
adaptively build concepts of affective states based on user feedback.
Another important and closely related stream of work is the modeling of user‘s
knowledge with the goal of tailoring output of route directions or maps, to the user‘s mental
representations, or prior route or survey knowledge (Patel, Chen, Smith, & Landay, 2006;
Schmid, 2008; Schmid & Richter, 2006; Srinivas & Hirtle, 2007; Tomko & Winter, 2006).
Researchers have followed two broad approaches in an effort to tackle this issue. One approach
is to develop algorithms and systems that help generate system output that is tailored to an
individual‘s personal knowledge or mental representation (Patel et al., 2006; Schmid, 2008;
Schmid & Richter, 2006; Tomko & Winter, 2006). Another approach is to develop theoretical

17
models that represent routes of this nature (Srinivas & Hirtle, 2007). Work by Schmid and
Richter (2006) involved the extraction of ―places‖ from location data streams. These places are
extracted from a continuous input of data about the user. The algorithm developed by them uses
a clustering technique to cluster incoming data with previous records. The clustering algorithm
has a high data sampling rate and a low threshold for clustering. This allows for differentiating
between locations at a high level of granularity, e.g., a junction at a signal, or a corner of a street,
where a wayfinder may stop often. Schmid (2008) also implements a prototype solution for
presenting users with personalized knowledge based route information on maps for small
displays. In his work, Schmid also discusses some relevant prototypical spatial configurations
and assistance scenarios in detail. In another system driven approach to the problem, Patel and
colleagues (2006) present a routing technique that incorporates knowledge of known locations
and landmarks in presenting what they term ―personalized‖ routes to the wayfinder. These
personalized routes consist of simpler directions with less route direction elements, which in
turn, reduce the cognitive load of the wayfinder. While the system does not sense user
information, the researchers do address an important problem of automatically generating
personalized routes based on user familiarity.
2.4 KNOWLEDGE ROUTE THEORY
Srinivas and Hirtle (2007) present an alternative approach to the issue of personalized routes.
They present a theoretical model that helps represent known and unknown regions along the
same route. An example of such a route would be a wayfinder‘s travel from his home to a new

18
city. They refer to these routes as partially familiar routes or knowledge routes (k-routes)1. One
of the most basic forms of a knowledge route (<k-route>) is one which incorporates a familiar
route segment (<K>) within a known region and an unfamiliar route segment (<N>) within an
unknown region, along the same route, shown in Figure 3. This gives the most basic form of a
partially familiar route. The braces indicate that the order of <K> and <N> can be interchanged.
<k-route> ::= <O> {<K> <N>} <D>
Figure 3. The most basic form of a k-route
The knowledge route theory identifies points along the familiar portion of the route as
known locations (KLs). A KL can be one of three types of points: (1) a well-established
landmark within a neighborhood, (2) a familiar building that is often frequented, even if it does
not rise to ‗landmark‘ status, and (3) the intersection of two segments along a route that the user
is able to locate during navigation. Thus, a KL is defined as a point along a route that a person is
confident of being able to navigate to while in the K region of the route. They use the concept of
KLs in producing schematized route directions and list three broad categories of KLs. One is a
local landmark (e.g. ―The Capitol‖), the second is a building or address that an individual may
frequent (e.g. ―Hillman Library‖), and the third is a decision point (e.g. ―Bates Street entrance
ramp to I-376‖). While decision points and landmarks have been studied extensively (Daniel &
1 These have been called kroutes by Srinivas and Hirtle (2007), but I use the notation k-routes as it more accurately represents the
way it is pronounced.

19
Denis, 1998; Klippel, 2003b; Lovelace et al., 1999; Presson & Montello, 1988; Raubal & Winter,
2002; Sorrows & Hirtle, 1999; Tom & Denis, 2003), concepts relating to the second category of
KLs have been the focus of relatively fewer studies in the past (Gale et al., 1990; Golledge &
Spector, 1978; Tom & Denis, 2004).
The third concept they introduce is a special case of a KL which is the KL that is closest
to or at the intersection of a <K> and <N> segment of a route, called a known decision point and
denoted as <DPk>. DPk‘s are the transition points between a known region and an unknown
region. Thus <K> can be decomposed into (known) route segments <seg> and known decision
points <DPk>. An <N> can be decomposed into (unknown) route segments <seg>. Upon
inclusion of this concept, the basic form of a <k-route> is further represented as.
<k-routef:u> ::= <O> <K> <N> <D>
<K> ::= <seg> <DPk>
<N> ::= <seg>
Instructions to the wayfinder would consist of ―Travel to <DPk>‖ followed by detailed
instructions from that point on. Travel may also take place from unknown regions to known
regions—modeled as NK— wherein the N region immediately follows the origin O. Here, the
alternative case is represented.2
<k-routeu:f> ::= <O> <N> <K> <D>
<N> ::= <seg>
<K> ::= <DPk> <seg>
In this case, instructions to the wayfinder would consist of detailed instructions to <DPk> and
then the single instruction of head to <D> to complete the route.
2 The subscript is used to distinguish a knowledge route ordered fam:unf from a knowledge route ordered unf:fam. However, in
the future the subscripts will be left off as the ordering will be clear from the context.

20
Other models for coding familiarity include KNK, NKN which include routes with
exactly one K and two N regions or vice versa. Routes such as KKN or KNN need not be
considered, since they can both be represented as just KN by collapsing over similar regions. In
the interest of completeness, Srinivas and Hirtle present the KNKN+ and NKNK
+ models, the
components of these models can be formed by combining individual concepts from the KN, NK,
NKN and the KNK models.
Along with the concept of knowledge routes, Srinivas and Hirtle (2007) introduce the
concept of knowledge chunking of route direction elements. Knowledge chunking involves
grouping all the segments in the region of K into one ‗knowledge chunk.‘ These concepts for
coding familiarity, and knowledge chunking, serves as a basis to generate route directions that
are schematized based on a wayfinder‘s prior knowledge—a concept that the authors refer to as
―Knowledge-based schematization.‖ The knowledge route theory forms the theoretical basis for
the empirical study. Section 3.0 lists details of the theory as are relevant to the research design.
Extensions to the knowledge route theory are presented in Section 5.0
2.5 WAYFINDING STUDIES—VIRTUAL REALITY (VR) ENVIRONMENTS
Wayfinding studies have typically been conducted in real environments ( Allen, 2000; Schmitz,
1999; Streeter et al., 1985), and more recently, in virtual environments (Bakker, Werkhoven, &
Passenier, 1999; Cutmore, Hine, Maberly, Langford, & Hawgood, 2000; Gillner & Mallot, 1998;
Golledge et al., 1995; Jansen-Osmann, 2002; Richardson, Montello, & Hegarty, 1999; Riecke,
van Veen, & Bülthoff, 2002; Rossano & Reardon, 1999; Rossano, West, Robertson, Wayne, &
Chase, 1999; Ruddle, 2005; Ruddle, Payne, & Jones, 1998; Steck & Mallot, 2000). Allen (2000)
21
investigated principles and practices in the communication of route knowledge with a real test
environment that included a college campus, a residential area and a commercial area along the
same route. Allen found that route direction protocols that were consistent with principles-based
practices resulted in greater wayfinding success than the protocols that were inconsistent with
these practices. Some of these practices included, a) presenting directions in a correct and natural
temporal-spatial order, b) concentrating information about choice points and c) using spatial
designations that are common to most listeners—using mutual knowledge. Streeter and
colleagues (1985) investigated the effectiveness of navigations aids—driving directions versus
route maps, in a real world driving task. In their study, they used seven routes that were actual
routes driven by employees of a local firm to their homes. The routes ranged in a distance from
3-20 miles and were divided into three categories-limited access, moderately difficult local route,
and complicated local road categories. Their results suggest that taped (or voice) instructions,
was a more efficient tool for communicating route information than route maps.
The study of wayfinding behavior in real world environments—conditions and
circumstances permitting—are most ideal. Especially as subjects in most VR experiments remain
seated or stationary; where the lack of proprioceptive feedback gained through walking could
affect the spatial experience. Bakker and colleagues (1999), in their examination of this issue,
found that the lack or kinesthetic feedback, or the presentation of visual flow alone, lead to
inaccurate and unreliable orientation in participants. While there are currently efforts such as the
development of the omni-directional treadmill to account for this, these solutions remain costly
and hence cannot be easily employed (Bülthoff, Campos, & Meilinger, 2008). While VR is
currently not yet an ideal replacement to a real world environment, it is also well accepted that
controlling conditions in the real world is a significant hurdle that cannot always be overcome.

22
VR tools allow experimenters to control specific environmental conditions, manipulate variables
that might not be possible in the real world, and allows for a realistic experience (Bülthoff et al.,
2008). Given these advantages and recent advances in VR technology, recent studies in spatial
cognition have involved the use of VR environments. These studies vary significantly in the
kinds of research issues addressed. For example, in an effort to evaluate VR as a tool to study
spatial cognition, Jansen-Osmann (2002) conducted a study in VR that attempted to replicate a
desktop spatial cognition study conducted by Cohen and Schuepher (1980). The study
investigated the role of landmarks in navigation. The original finding by Cohen and Schuepher
was replicated in the study conducted in the VR environment providing a certain degree of
validity to VR as a tool for spatial cognition study (Jansen-Osmann, 2002). Golledge and
colleagues (1995) conducted a spatial cognition study to investigate the acquisition of route
versus survey knowledge in unfamiliar environments. Golledge and colleagues used a
walkthrough of a computer simulation as a test environment that resembled the interior of a
building. The environment consisted of 90 degree turns, carefully chosen colored symbols were
used as landmarks, and doors and windows were added arbitrarily to enhance realism. Rossano
and colleagues (1999) conducted a similar study to investigate the nature of acquisition of route
versus survey knowledge from computer models; when compared to the knowledge acquired
through maps or direct experience. The VR environment in this study was a college campus. In a
related study, Rossano and Reardon (1999) conducted a study to investigate the effect of goal
specificity on the acquisition of survey knowledge. Goal specificity was found to interfere in the
acquisition of survey knowledge of a virtual college campus.

23
3.0 RESEARCH DESIGN
3.1 PROBLEM
3.1.1 Purpose
The goal of the study was to explore the role of affect in the domain of human wayfinding.
While there are a wide range of affective states defined in the literature (see, Smith & Kosslyn,
2007 Ch. 9), this study focused on the effect of motivation on a human wayfinding task. A VR
Theatre was used to simulate the interior of a building. This was used as a test environment.
Participants were asked to perform certain navigation tasks under normal (control) or motivated
conditions. All participants learned to navigate along both simple and complex routes. They were
later tested on these previously learned routes, as well as new routes that could be derived from
the previously established spatial knowledge. Finally, participants were tested on their ability to
follow schematized instructions to explore unfamiliar areas in the VR environment. The
performance of the tasks across the two conditions was compared. Results of the empirical study
were used to create a theoretical model, presented in Section 5.0 which accounts for possible
influence of affect on the wayfinding task performance. Results of this research, including
implications for the design of future wayfinding systems, are discussed in Section 6.0

24
3.1.2 Theory, Research Objectives and Scope
The original knowledge route (k-route) model is extended to include the situation where one
learns certain routes in an area, but then needs to navigate by putting the known links in a new
order, possibly reversing some of the links. For example, you might learn the route ABC and the
route ECD, but now have to travel DCBA. From past knowledge, you can easily deduce the new
route, but it would not reach the same level of ease as the known route. To account for this
situation, the concept of deducedK is introduced as an extension of the knowledge route theory.
DeducedK is knowledge of a route segment that is not explicitly established but may be derived
from previously—explicitly established—spatial knowledge.
Stage 1 of the experiment was designed to investigate the influence of motivation on the
access to established spatial knowledge—the K region of a knowledge route (k-route). As
mentioned in Section 2.4, the most basic form of a k-route is a KN route. In Stage 1 of the
experiment, the K region of the k-route is considered in isolation. This is therefore simply
referred to as a K route (as compared to KN route). Stage 1 was also designed to investigate the
influence of motivation on the access to deduced spatial knowledge. This type of route
knowledge is referred to as deducedK. The routes in Stage 1 of the experiment that include
deducedK segments are called deducedK routes. These routes consist of routes to locations that
the participant has incidentally viewed as part of the training phase. Unlike the well established
knowledge of destinations in a K route, participants were not explicitly trained to locate the
destination of a deducedK route. Hence, traveling a deducedK route may involve the extra
cognitive load of deducing the shortest path to the destination. Each kind of route, K and
deducedK, had two levels of structural complexity—Simple and Complex. The final set of routes
25
is referred to as SimpleK (SK), ComplexK (CK), SimpleDeducedK (SDK) or
ComplexDeducedK (CDK) routes.
Finally, Stage 2 of the experiment was designed to investigate the effectiveness of
schematized directions on wayfinding in familiar and unfamiliar environments under motivated
and control conditions. The familiar and unfamiliar environments are part of the same route.
These routes represent of the most basic k-route—the KN route—as mentioned in Section 2.4.
The KN routes as part of Stage 2 of the experiment vary in the kind of knowledge, K or
deducedK. They also vary in their structural complexity, Simple or Complex. Hence Stage 2 of
the experiment is designed to investigate the effective of schematized directions when travelling
through four kinds of KN routes—SimpleKN, ComplexKN, SimpleDeducedKN and
ComplexDeducedKN routes.
3.1.3 Research Questions
Overall research question: How does motivation influence wayfinding task performance?
3.1.3.1 Confirmatory Research Questions
1. Does performance of a wayfinding task improve for the motivated group?
a) Do the motivated instructions reduce time taken to travel a route?
b) Do the motivated instructions result in fewer errors while travelling a route?
2. Is the effect of the motivated instructions greater for wayfinding tasks of higher
complexity?
a) Is the effect of the motivated task instructions greater for deduced routes?
26
b) Is the effect of the motivated task instructions greater for structurally complex
routes?
3.1.3.2 Exploratory Research Questions
1. Are schematized directions for KN routes effective across varied task conditions?
2. Are schematized directions for deducedKN routes effective across varied task conditions?
3.2 METHOD
3.2.1 Participant Recruitment
Forty two participants were recruited through flyers posted around the University of Pittsburgh
campus (Appendix A). Participants were paid $15 for their participation in the experiment that
lasted between one to one and a half hours. Their ages ranged from 18 to 36, with a mean of 23
years. One participant was omitted from the analysis because of a misunderstanding of the
instructions. Another participant was omitted from the analysis because of a lack of comfort with
navigating the VR environment during testing. The resulting sample consisted of twenty female
and twenty male participants.
3.2.2 Materials
The materials consisted of a standard test for working memory capacity (Smith & Kosslyn,
2007) and the Perspective Taking/Spatial Orientation Test (Hegarty & Waller, 2004). A
27
background questionnaire and post-test questionnaire to record participant‘s experiences were
administered (Appendix B and C). In addition, a separate questionnaire measuring the
participant‘s confidence in locating landmarks within the learned space was given. A single
projector (Epson Powerlite 730c) and a laptop (Lenovo T61) were used to present the VR
environment. A standard Logitech BT96a optical wired mouse and the laptop keyboard were
used for navigation control. The windows desktop screen capturing software Hypercam v.2 was
used to record participant‘s movement through the VR environment.
3.2.2.1 VR Environment
Four VR environments were constructed, each consisting of a single floor in a building. The first
environment was a practice environment with a simple H shape and landmarks in the opposite
corners of the space. The second and third environments were used for training and testing in
Stage 1. Both environments had a similar asymmetric layout, consisting of corridors and rooms
with ten unique locations as shown in Figure 4. Each location was made up of a unique shape
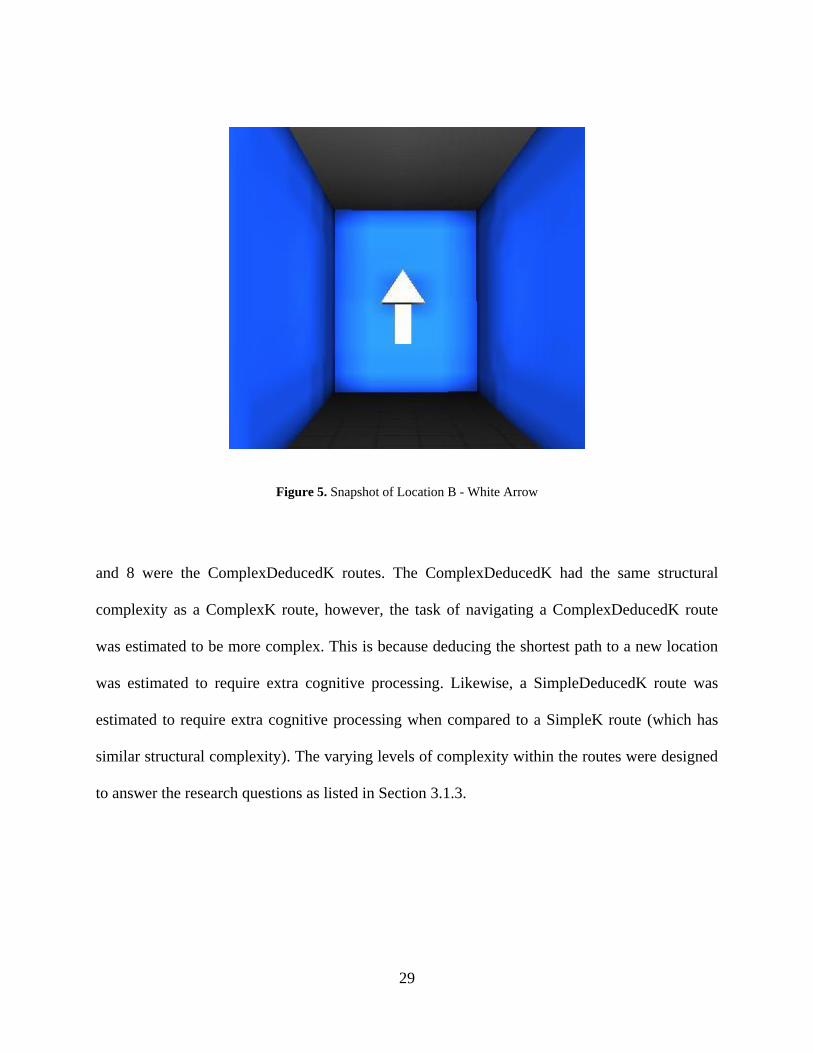
and color, and are referenced in Figure 4 using the upper case letters. Figure 5 shows one such
location; the white arrow in Figure 5 corresponds to location ‗B‘ in Figure 4. The training and
test environments were identical in layout and placement of labels. The only difference was the
placement of the invisible walls. In the training environment, the invisible walls were placed in a
manner that allowed the participant to take no more than one wrong turn away from the main
route at any intersection along the route. The placement of invisible walls is explained in more
detail in Section 4.2.2. In the test environment, the invisible walls were placed in a manner that
allowed the participant to take at most two wrong turns. Invisible walls in the test environment
restricted exploration in areas off the main route, while still allowing the traveler some degree of
independence. The fourth environment expanded the test environment to include unknown N

28
regions. The details about the additions to this test environment that are used for the second stage
of the experiment are given in Section 3.2.4.3.
In order to test performance across routes of varying complexity, the routes in the test
environment satisfied certain predetermined factors. The factors were 1) Number of turns 2)
Minimum number of forced views of each marked location (‗I,‘ ‗J,‘ ‗M,‘ and ‗L‘) during training
phase (i.e. traversal of routes 1 to 4 during training phase ensures that each marked location ‗I,‘
‗J,‘ ‗M,‘ and ‗L‘ is viewed at least twice), 3) Number of decision points, and 4) Minimum
number of alternative (longer) routes. The factors and related details are listed in Table 1. Routes
1 to 4 were used in the training phase and the test phase, and routes 5 to 8 were used only in the
test phase. Routes 1 and 2 were the SimpleK routes, while 3 and 4 were the ComplexK routes.
Likewise, in the test session only, routes 5 and 6 were the SimpleDeducedK routes and routes 7
Figure 4. Layout of the training and test VR Environment for Stage 1.
29
and 8 were the ComplexDeducedK routes. The ComplexDeducedK had the same structural
complexity as a ComplexK route, however, the task of navigating a ComplexDeducedK route
was estimated to be more complex. This is because deducing the shortest path to a new location
was estimated to require extra cognitive processing. Likewise, a SimpleDeducedK route was
estimated to require extra cognitive processing when compared to a SimpleK route (which has
similar structural complexity). The varying levels of complexity within the routes were designed
to answer the research questions as listed in Section 3.1.3.
Figure 5. Snapshot of Location B - White Arrow

30
3.2.3 Design
Participants were assigned to either the motivated (experimental) group or the not-motivated
(control) group. A randomized block design was used with gender as the blocking criteria. Each
group underwent an adaptation phase, a training phase and a test phase. The test phase consisted
of two stages (as mentioned earlier). The following subsections lists details of the various phases
of the experiment.
3.2.4 Procedure
3.2.4.1 Adaptation Phase
Prior to experimentation, all participants were allowed to get accustomed to the VR controls
using the practice environment. Participants were asked to navigate between the two landmarks
placed in this environment without walking into the walls of the corridors. Participants were
Table 1. Details of K and deducedK routes
Training and Testing
Phase Testing Phase
K deducedK
Route Complexity Simple Complex Simple Complex
Route Number 1 2 3 4 5 6 7 8
Route Definition A- J C- I A- B C- D B-M D- L B-E D- F
Number of Turns 1 1 5 5 1 1 5 5
Min. Number of Forced
views in Training Phase 2 2 2 2 2 2 2 2
Number of Decision points 2 1 7 8 1 2 6 9
Min. Number of Alternative
(longer) Routes 0 0 2 2 0 1 2 2

31
judged to be comfortable navigating within the practice environment if they made no errors (did
not touch the walls of the corridors) while navigating between the two landmarks.
3.2.4.2 Training Phase
Upon completion of the adaptation phase, participants in both groups underwent a training phase
where they were asked to navigate and learn routes within the training VR environment. An
overview of the environment (and the routes that were navigated) is shown in Figure 4. In this
phase, participants entered the test environment at, for example, location ‗A‘. They were given
instructions to find a location within the space, e.g., find the ―White Arrow‖ (shown in Figure 5
and corresponds to Location ‗B‘ in Figure 4). Participants were informed that the route with the
least turns is the shortest path. If the participant did stray from the shortest path, an invisible wall
blocked their progress in the wrong direction. Hence, the training environment—by design—
ensured that the participant followed the shortest path to an end location. The route taken by
participants was observed. The task was repeated until the participant had navigated between ‗A‘
and ‗B‘ without deviating from the shortest path. Once the shortest path had been navigated
without error, the participant was asked if they are confident in finding the destination, if the
participant replied in the affirmative, then the path (Route 3 in this example, Table 1) was
considered learned. The routes 1 through 4 (Table 1) were learned in this manner, with the order
of routes counterbalanced across participants. Through the training procedure, it was assumed
that knowledge of the four routes was established. These four routes served as the K region of
our k-routes–our established route knowledge. As mentioned earlier, these are referred to as
SimpleK or ComplexK routes. The terms Simple or Complex refer to the structural complexity
of the route.
32
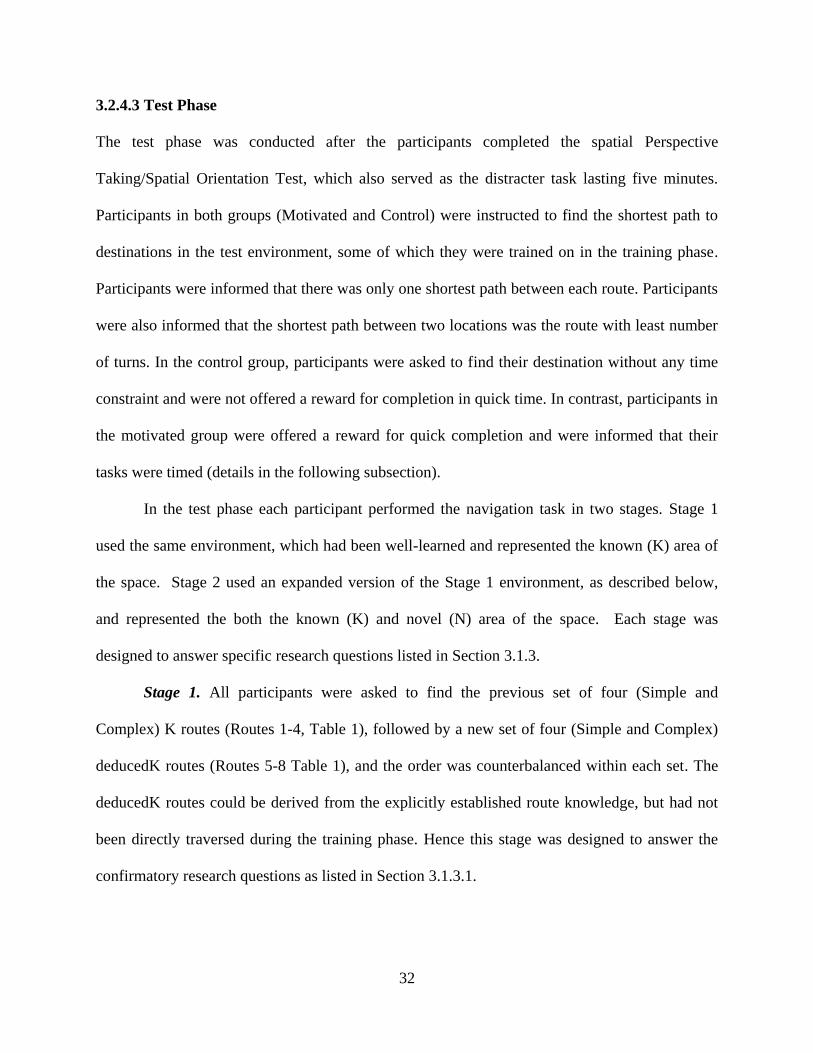
3.2.4.3 Test Phase
The test phase was conducted after the participants completed the spatial Perspective
Taking/Spatial Orientation Test, which also served as the distracter task lasting five minutes.
Participants in both groups (Motivated and Control) were instructed to find the shortest path to
destinations in the test environment, some of which they were trained on in the training phase.
Participants were informed that there was only one shortest path between each route. Participants
were also informed that the shortest path between two locations was the route with least number
of turns. In the control group, participants were asked to find their destination without any time
constraint and were not offered a reward for completion in quick time. In contrast, participants in
the motivated group were offered a reward for quick completion and were informed that their
tasks were timed (details in the following subsection).
In the test phase each participant performed the navigation task in two stages. Stage 1
used the same environment, which had been well-learned and represented the known (K) area of
the space. Stage 2 used an expanded version of the Stage 1 environment, as described below,
and represented the both the known (K) and novel (N) area of the space. Each stage was
designed to answer specific research questions listed in Section 3.1.3.
Stage 1. All participants were asked to find the previous set of four (Simple and
Complex) K routes (Routes 1-4, Table 1), followed by a new set of four (Simple and Complex)
deducedK routes (Routes 5-8 Table 1), and the order was counterbalanced within each set. The
deducedK routes could be derived from the explicitly established route knowledge, but had not
been directly traversed during the training phase. Hence this stage was designed to answer the
confirmatory research questions as listed in Section 3.1.3.1.
33
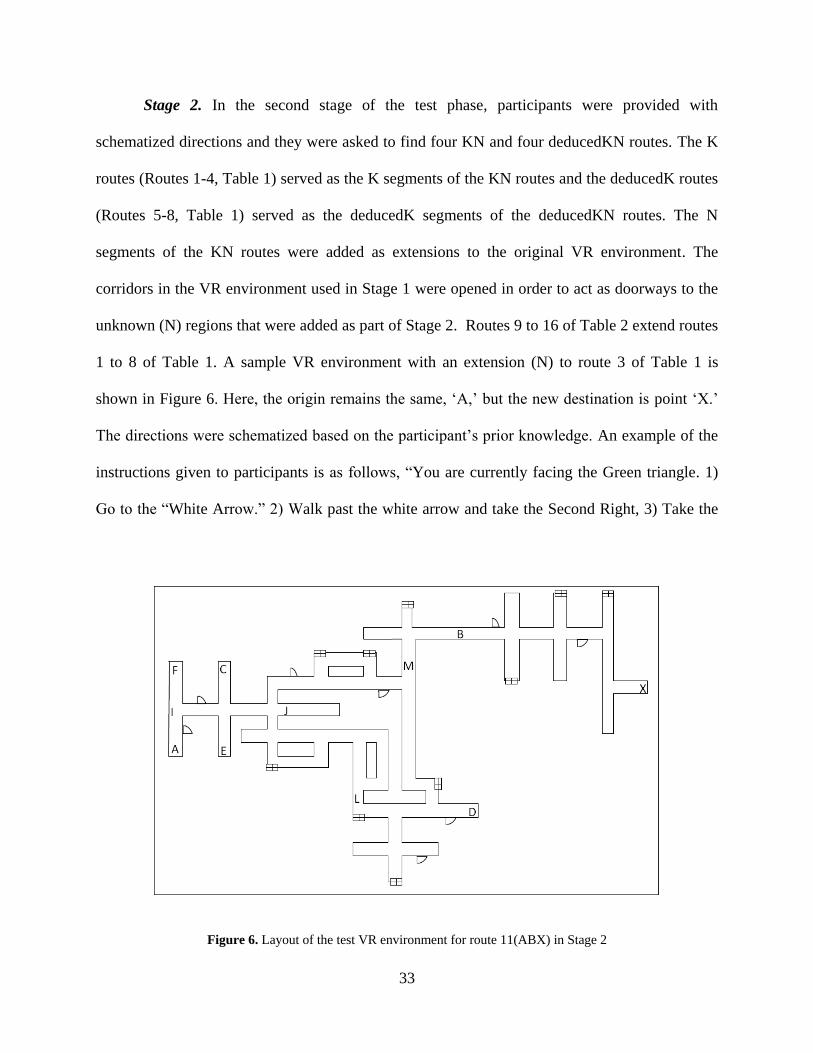
Stage 2. In the second stage of the test phase, participants were provided with
schematized directions and they were asked to find four KN and four deducedKN routes. The K
routes (Routes 1-4, Table 1) served as the K segments of the KN routes and the deducedK routes
(Routes 5-8, Table 1) served as the deducedK segments of the deducedKN routes. The N
segments of the KN routes were added as extensions to the original VR environment. The
corridors in the VR environment used in Stage 1 were opened in order to act as doorways to the
unknown (N) regions that were added as part of Stage 2. Routes 9 to 16 of Table 2 extend routes
1 to 8 of Table 1. A sample VR environment with an extension (N) to route 3 of Table 1 is
shown in Figure 6. Here, the origin remains the same, ‗A,‘ but the new destination is point ‗X.‘
The directions were schematized based on the participant‘s prior knowledge. An example of the
instructions given to participants is as follows, ―You are currently facing the Green triangle. 1)
Go to the ―White Arrow.‖ 2) Walk past the white arrow and take the Second Right, 3) Take the
Figure 6. Layout of the test VR environment for route 11(ABX) in Stage 2
34
First Left, 4) You will stop at the end location marked with a yellow check mark.‖ Details of the
four KN routes and four deducedKN routes are listed in Table 2.
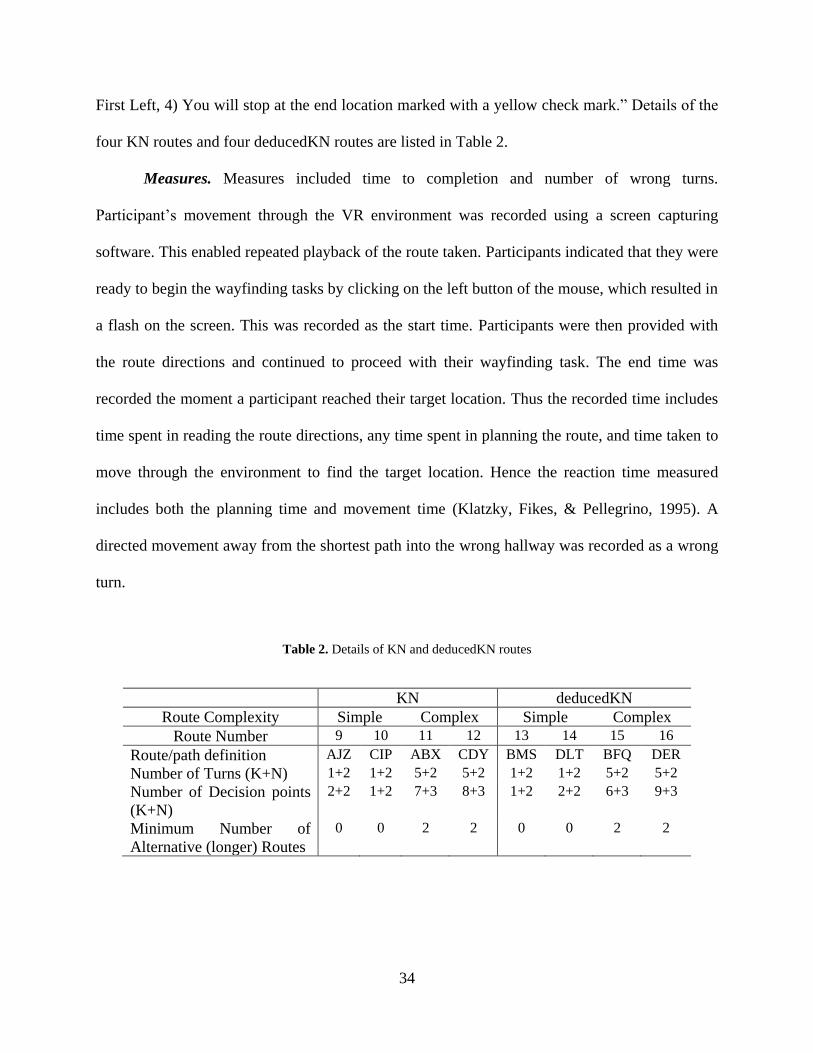
Measures. Measures included time to completion and number of wrong turns.
Participant‘s movement through the VR environment was recorded using a screen capturing
software. This enabled repeated playback of the route taken. Participants indicated that they were
ready to begin the wayfinding tasks by clicking on the left button of the mouse, which resulted in
a flash on the screen. This was recorded as the start time. Participants were then provided with
the route directions and continued to proceed with their wayfinding task. The end time was
recorded the moment a participant reached their target location. Thus the recorded time includes
time spent in reading the route directions, any time spent in planning the route, and time taken to
move through the environment to find the target location. Hence the reaction time measured
includes both the planning time and movement time (Klatzky, Fikes, & Pellegrino, 1995). A
directed movement away from the shortest path into the wrong hallway was recorded as a wrong
turn.
Table 2. Details of KN and deducedKN routes
KN deducedKN
Route Complexity Simple Complex Simple Complex
Route Number 9 10 11 12 13 14 15 16
Route/path definition AJZ CIP ABX CDY BMS DLT BFQ DER
Number of Turns (K+N) 1+2 1+2 5+2 5+2 1+2 1+2 5+2 5+2
Number of Decision points
(K+N)
2+2 1+2 7+3 8+3 1+2 2+2 6+3 9+3
Minimum Number of
Alternative (longer) Routes
0 0 2 2 0 0 2 2

35
3.2.4.4 Inducing Motivation
In the motivated group, participants were instructed to perform the task ―as fast as they can.‖
Participants were asked to imagine working under a time constraint and that time was critical.
The participants were also given an estimated average time for completing the task. It was
recommended to participants in this group that in order to be eligible for the reward they must, at
the very least, finish within that average time. This group was offered an additional reward of
$15 if their performance (time to completion) ranked among the top five best performances of all
participants.
At the end of the experiment, as part of a post-test questionnaire, all participants were
also asked to rate the extent they felt motivated, rushed, or excited during the test phase.

36
4.0 RESULTS
4.1 SPATIAL ABILITIES AND LEARNING
Two standard tests were administered in order to assess any potential differences in memory or
spatial skills. No differences were found. Participants‘ performance on the standard test for
working memory capacity and the Perspective Taking/Spatial Orientation Test did not differ
significantly across the motivated and control groups (alpha level .05; same in the analyses
below). In order to establish whether working memory capacity or spatial orientation ability had
an effect on performance, associative analyses were conducted between working memory
capacity and spatial orientation ability and wrong turn and time, for each of the four kinds of
routes. No significant correlations were found. Figure 7 shows the scatter plots of spatial
orientation ability, working memory capacity and time for participants in control and motivated
conditions. Figure 8 shows the scatter plots of spatial orientation ability, working memory
capacity and wrong turns for participants in control and motivated conditions. Upon completion
of training and prior to each stage of the test phase, participants were queried on their confidence
levels in locating landmarks. A seven point Likert item was used. There were no differences in
reported confidence levels across the two groups. This implies that landmark identification
across the two groups prior to each stage of the test phase was the same.

37
Figure 7. Scatter plots of spatial orientation ability, working memory capacity and time (Control and
Motivated groups)

38
Figure 8. Scatter plots of spatial orientation ability, working memory capacity and wrong turns
(Control and Motivated groups)

39
4.2 STAGE 1
4.2.1 Time
Time participants took to complete each route in Stage 1 was measured. A longer task
completion time indicates that participants either lost their way more often, took their time in
making decisions, or both. A 2 (Control, Motivated) x 4 (Complexity: SimpleK,
SimpleDeducedK, ComplexK, ComplexDeducedK) analysis of variance (ANOVA) revealed
main effects of experiment condition, F(1, 36) = 4.88, p < .05, indicating that the participants in
the control group took a significantly longer time (M = 30.74) than the motivated group (M =
36.24), and route complexity, F(3, 36) = 143.32, p < .01, indicating that the more complex the
route the longer the travel time. Additional t-tests to tease apart the source of the increased time
for control group suggested strong differences for the SimpleK t(37) = -3.11, p < .01,
SimpleDeducedK t(37) = -2.43, p < . 05 and ComplexK t(38) = -2.58, p <. 05, but not for the
ComplexDeducedK route, as noted in Table 3. Figure 9 displays the mean travel times of
SimpleK, SimpleDeducedK, ComplexK, and ComplexDeducedK routes for both groups.

40
Figure 9. Plot of mean travel times (seconds) of SimpleK (SK), SimpleDeducedK (SDK),
ComplexK (CK), and ComplexDeducedK (CDK) routes
Table 3. Mean travel times for SimpleK (SK), SimpleDeducedK (SDK), ComplexK (CK) and
ComplexDeducedK (CDK) routes
SK SDK CK CDK
Control Mean (sec) 16.07 20.08 44.75 69.78
(Std. Dev.) (4.66) (5.50) (12.56) (21.15)
Motivated Mean (sec) 12.95 16.13 35.00 58.88
(Std. Dev.) (2.75) (4.66) (11.53) (24.44)
% Decrease in Mean Times 28.3% 19.7% 21.8% 15.6%
Significance p < .01 p < .05 p < .05 n.s.

41
4.2.2 Wrong Turns
In the training phase, invisible walls were set up slightly away from each corner on the incorrect
paths, so that participants could turn down an incorrect path, but then realize the mistake. This
was akin to leading someone by hand where they are gently nudged back after taking a wrong
step. The use of invisible walls is based on the notion of virtual fixtures, introduced by
Rosenberg (1993). This study used forbidden-region virtual fixtures (Okamura, 2004) where
participants could see down all every hallway, but may be blocked from travel by an invisible
wall. In the test phase the invisible walls were moved beyond the second wrong corner as shown
in Figure 10. This means that participants at any intersection could make up to two wrong turns,
before having to retrace their steps back to the main path. Given the complexity of space, this
Figure 10. Layout of invisible walls for a route in the test phase.

42
insured that they did spend large amounts of time wandering in ‗back alleys,‘ but at the same
time, there would be a clear indication that participant did wander away from the appropriate
path.
In Stage 1 of the test phase, participants in all but the simplest condition (Simple K)
exhibited wrong turns when navigating the routes. There were no significant differences in the
number of wrong turns between the motivated and control groups, which was somewhat
surprising. However, an analysis into the data reveals some interesting insights. Figure 11 shows
the average number of wrong turns for each of the four types of routes across the two groups.
Strong positive correlations were found between wrong turns and time for motivated participants
Figure 11. Plot of average number of wrong turns for each of the four types of routes—
SimpleK (SK), SimpleDeducedK (SDK), ComplexK (CK) and ComplexDeducedK
(CDK)

43
travelling the more complex routes, the ComplexK r(20) = .89, p < .01, and ComplexDeducedK
r(20) = .85, p < .01 as shown in Figure 13. As shown in Figure 12, the same correlations for the
more complex routes, Complex K r(20) = .45, p < .05, and ComplexDeducedK r(20) = .51, p <
.05, were not as strong for participants who travelled in the control condition. This suggests that
participants in the motivated group spent less time making decisions, as that longer travel times
were the direct result of an increased number of wrong turns. In contrast, participants in the
control group spent more time making decisions and less time moving, so longer travel times
were often just the result of careful consideration of the next step and not necessarily indicative
of an travel error. This suggested that participants in the control group were thinking more. In
order to investigate this notion further, an analysis was conducted of the number of wrong turns
that were repeated (repeated wrong turns). Repeated wrong turns would suggest that participants
were exploring the same space multiple times as a result of less conscious decision making. As
shown in Figure 14, on average, participants in the motivated group had more repeated number
of wrong turns. It is also seen that participants explored certain spaces three or four times,
however, participants in the control group did not exhibit this kind of behavior.
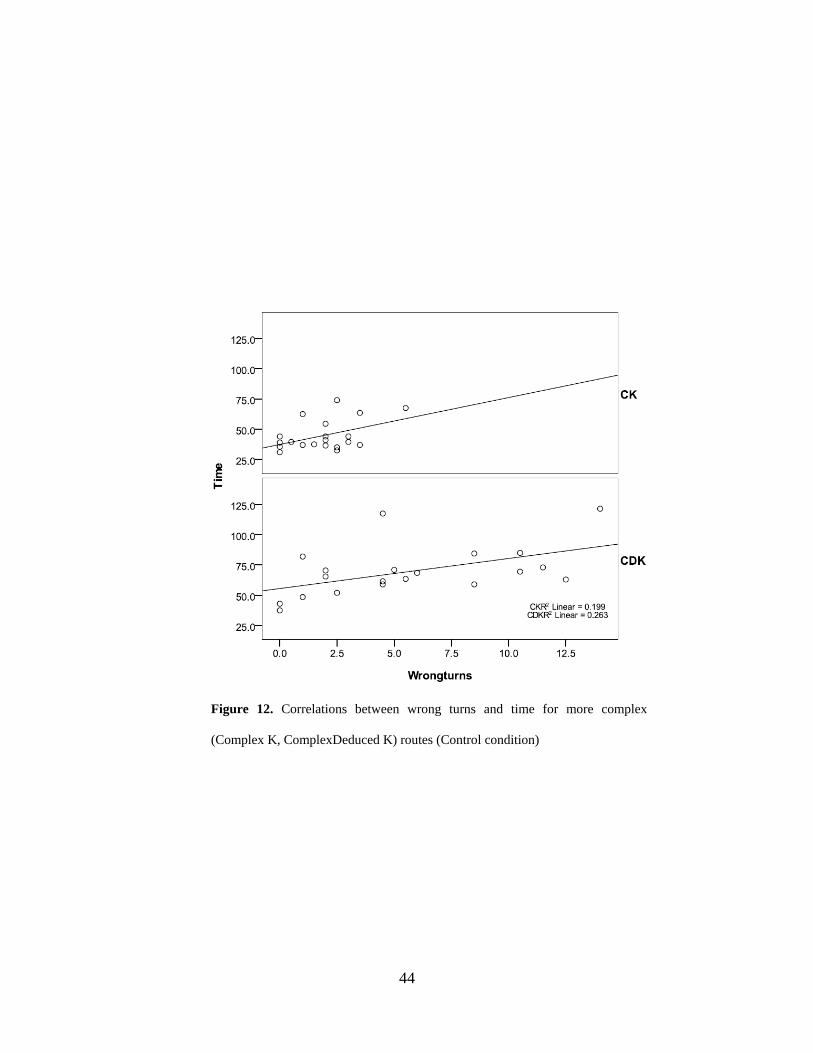
44
Figure 12. Correlations between wrong turns and time for more complex
(Complex K, ComplexDeduced K) routes (Control condition)

45
Figure 13. Correlations between wrong turns and time for more complex
(Complex K, ComplexDeduced K) routes (Motivated condition)

46
4.3 STAGE 2
4.3.1 Time
As part of the exploratory analysis in Stage 2, participants were asked to follow
instructions to find new targets outside the area of Stage 1. Each path had a known (K) part and
unknown (N) part. As the travel on each region could be measured independently, I first
measured the time participants took to complete the known regions of the route. This time was
compared to the time taken to travel the same routes in Stage 1. A 2 (Control, Motivated) x 4
Figure 14. Average number of repeated wrong turns per route

47
(Complexity: SimpleK, SimpleDeducedK, ComplexK, ComplexDeducedK) x 2 (Stage 1, Stage
2) analysis of variance (ANOVA) revealed main effects of experiment condition, F(1, 36) =
9.35, p < .01, indicating that the participants in the control group took a significantly longer time
(M = 35.10) than the motivated group (M = 29.03), route complexity, F(1, 36) = 171.02, p < .01,
indicating that the more complex the route the longer the travel time, and Stage, F(1, 36) = 5.34,
p < .05, indicating that travel time was significantly faster in Stage 2 as compared to Stage 1.
Additional t-tests to identify the source of the difference in travel times suggested that mean
travel times for the simple routes were slower in Stage 2 when compared to Stage 1 for both
motivated, t(19) = -2.45, p < .05, and control, t(18) = -4.56, p < .01, conditions, as noted in
Table 4. Mean travel times for the most complex (ComplexDeducedK) routes were faster in
Stage 2 than they were in Stage 1 for both motivated t(19) = 3.36, p < .01, and control t(19) =
4.87, p < .01, conditions. The faster times perhaps reflect the difficulty of the
ComplexDeducedK routes in Stage 1 of the experiment as compared to a similar task in Stage 2,
where a learning effect ensured that participants were more familiar with the routes. There were
no significant differences found in mean travel times of the remaining routes. The figures below
display the mean travel times in Stage 1 and 2 for each route, in both control (Figure 15) and
motivated (Figure 16) groups.

48
Table 4. Mean travel times for trained regions of Stage 1 and Stage 2
Figure 15. Mean times for K and DeducedK Routes in Stage 1 and 2 (Control group)
SK SDK CK CDK
Control
Stage 1 Mean (sec) 16.74 20.08 43.21 69.78
(Std. Dev.) (4.66) (5.49) (10.80
) (21.15)
Stage 2 Mean (sec) 23.42 18.55 48.76 50.17
(Std. Dev.) (8.16) (5.64) (15.13
)
(17.68)
% Difference in
Mean Times
23.5% 7.6% 11.4% 28.1%
Significance p < .01 n.s. n.s. p < .01
Motivated
Stage 1 Mean (sec) 12.95 16.12 35.00 58.88
(Std. Dev.) (2.75) (4.66) (11.53
) (24.44)
Stage 2 Mean (sec) 16.17 13.65 40.45 39.02
(Std. Dev.) (6.90) (6.86) (15.01
)
(12.43)
% Difference in
Mean Times
19.9% 15.3% 13.5% 33.7%
Significance p < .05 n.s. n.s. p < .01

49
Figure 16. Mean Times for K and DeducedK Routes in Stage 1 and 2 (Motivated Group)
4.3.2 Wrong Turns
As mentioned earlier, in Stage 2, participants were asked to follow instructions to find new
targets outside the area of Stage 1. Each path had a known (K) part and unknown (N) part. As
the travel on each region could be measured independently, I first measured the wrong turns
participants made while travel through the known regions of the route. For all the routes, the
number of wrong turns per route for the known regions of Stage 2 was on par, or in some cases
less than, the wrong turns taken for the same routes in Stage 1. The figures below display the
average number of wrong turns for all routes in Stage 1 and Stage 2, for the control (Figure 17)
and motivated (Figure 18) groups. The trend in wrong turns resembles the trend seen in the mean

50
travel times. The most apparent difference is visible for the most complex routes. This suggests
that the participants made fewer errors as they learned the space across the repeated trials.
Finally, the wrong turns made while travel through the unknown regions of each route was
measured. This measure was used to calculate an error rate. The error rate was calculated by
dividing the number of wrong turns in each route by the number of decision points present for
that route. The error rate was also calculated for travel through the known regions of the route for
Stage 1. Table 5 lists the error rates during travel across known and unknown regions. The error
rate was in the range of 0.001 to 0.467 across the known and unknown regions. The error rate for
unknown regions remained mostly unchanged across the routes. This of course, is most likely
due to the detailed instructions describing travel through these unknown sections. The error rate
Figure 17. Average number of wrong turns per route for Stage 1 and Stage 2
(Control group)
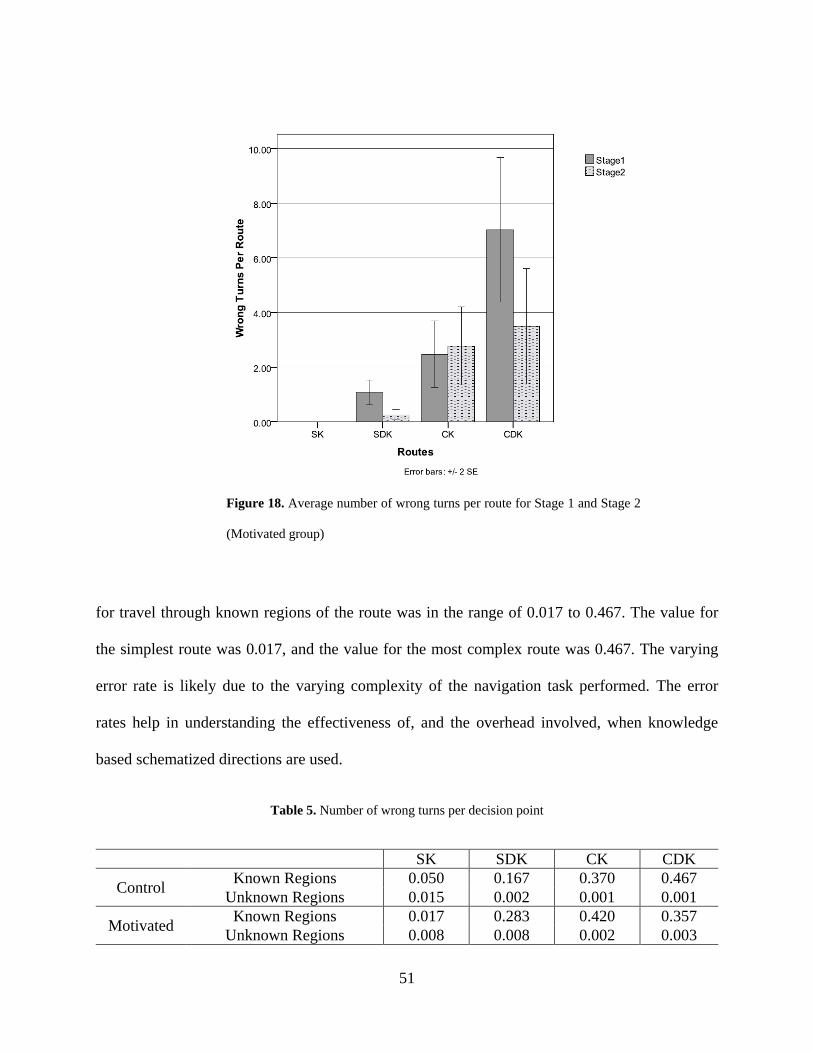
51
for travel through known regions of the route was in the range of 0.017 to 0.467. The value for
the simplest route was 0.017, and the value for the most complex route was 0.467. The varying
error rate is likely due to the varying complexity of the navigation task performed. The error
rates help in understanding the effectiveness of, and the overhead involved, when knowledge
based schematized directions are used.
Table 5. Number of wrong turns per decision point
SK SDK CK CDK
Control Known Regions 0.050 0.167 0.370 0.467
Unknown Regions 0.015 0.002 0.001 0.001
Motivated Known Regions 0.017 0.283 0.420 0.357
Unknown Regions 0.008 0.008 0.002 0.003
Figure 18. Average number of wrong turns per route for Stage 1 and Stage 2
(Motivated group)
52
4.4 MOTIVATION
Upon completion of the experiment, I queried participants in both groups on their level of
motivation, excitement, or the extent to which they felt rushed. No significant differences across
the two groups were found on the motivation and excitement measures. This lack of a difference
could be attributed to the participants‘ interpretation of the query. However, participants in the
motivated group reported that they felt more rushed while performing the experiment than
participants in the control group. Responses to a seven point Likert item indicate that more
participants in the motivated group reported feeling rushed—to extremely rushed (80%), than did
participants in the control group (35%), χ2 (6, N = 40) = 14.86, p = .02.
53
5.0 EXTENSIONS TO KNOWLEDGE ROUTE THEORY
5.1 OVERVIEW
The results of the experiment suggest that motivation effects performance during travel through
known segments of a route. These results are consistent with the results reported by Brunyé and
colleagues which indicate that basic affective states influenced the access to map-based
information (Brunyé et al., 2009). This suggests that access to route knowledge in the Known
(K) portions of a route may be influenced by motivation in particular, or Affect (E) in general.
Access to knowledge is also known to be influenced by Attentional resources (A) that may be a
allocated to the wayfinding task at hand (Smith & Kosslyn, 2007). Our recollection is also
known to change over time (T), where access to, or recollection of route knowledge in long-term
memory is likely to be depleted over time (Smith & Kosslyn, 2007). Finally, the differences
observed in performance across deducedK and K routes suggest that a binary representation of
knowledge—as originally proposed in the knowledge route theory introduced by Srinivas and
Hirtle (2007)—may not completely or accurately represent all the levels and complexity of
spatial knowledge. For instance, Schmid (2008) refers to three levels of knowledge—Familiar
Environments, Partially Familiar Environments and Unfamiliar environments—in his work that
involves the automated generation of knowledge-based wayfinding maps. Hence, as part of the
theoretical extensions presented, spatial knowledge is represented as a continuum.
54
5.2 THEORETICAL EXTENSIONS
As part of the original knowledge route theory mentioned in Section 2.4, the most basic form or
a partially familiar route, or (<k-route>), was represented as having a Known route segment
(<K>) and an Unknown route segment (<N>) along the same route. Individual route segments
were denoted as <seg>. As part of the extension presented here, in order to represent knowledge
as a continuum, an individual known route segment is denoted as k and an individual unknown
route segment is denoted as n. Hence, a known route K consisting of x individual known route
segments may be represented as K::= k1,k2,…,kx-1, kx. The concept of k (and n) differ from a
<seg>, as each individual route segment in k and n is represented by a unique value denoting the
level of route knowledge for that segment at the time of recall. This allows for the representation
of knowledge as a continuum.
Access to existing spatial knowledge, is dependent on the strength of encoded route
knowledge, or level of knowledge (L), it is also deemed to be affected by Affect (E), Attention
(A) and Time (T).
ki = f(Li, E, A, T), where:
-1 ≤ E ≤ 1
-1 ≤ A ≤ 1
-1 ≤ T ≤ 1
ε ≤ Li ≤ 1
Each of these factors, Knowledge Level (Li), Affect (E), Attention (A) and Time (T),
influences the access to spatial knowledge ki as follows:
The level of encoded route knowledge, or Li, may take on a value from {ε, 1}, where 1
represents complete or perfectly encoded route knowledge and ε represents faint or poorly
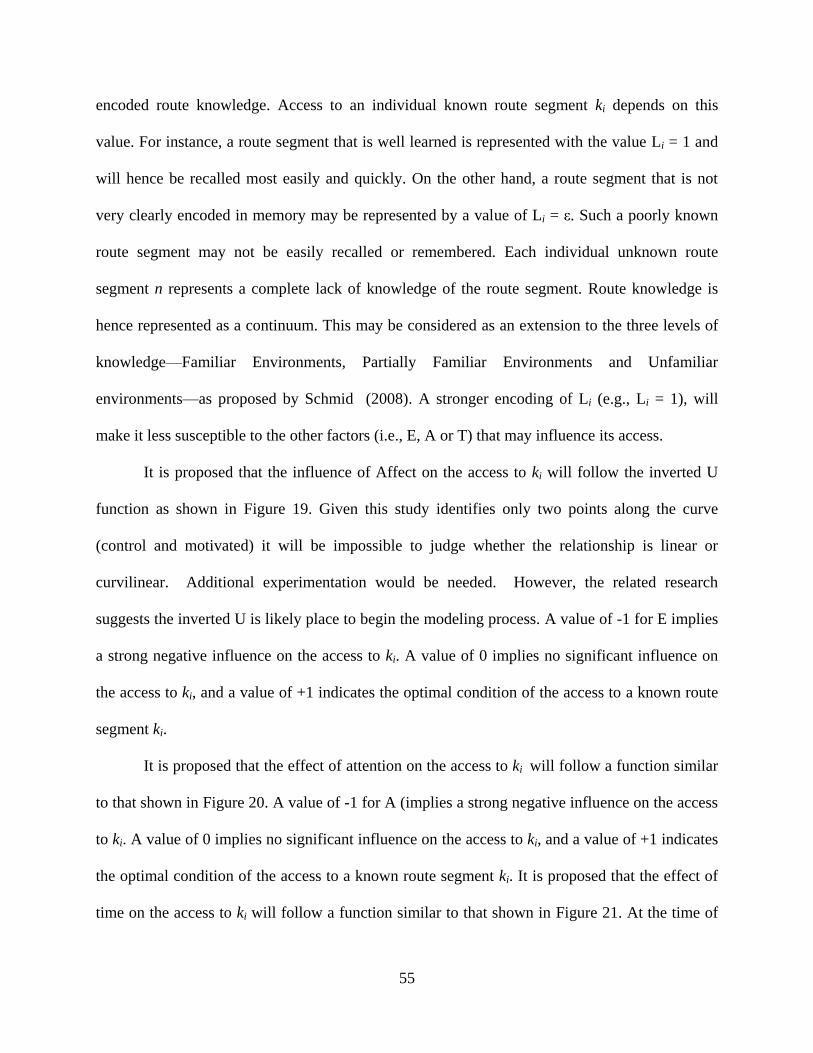
55
encoded route knowledge. Access to an individual known route segment ki depends on this
value. For instance, a route segment that is well learned is represented with the value Li = 1 and
will hence be recalled most easily and quickly. On the other hand, a route segment that is not
very clearly encoded in memory may be represented by a value of Li = ε. Such a poorly known
route segment may not be easily recalled or remembered. Each individual unknown route
segment n represents a complete lack of knowledge of the route segment. Route knowledge is
hence represented as a continuum. This may be considered as an extension to the three levels of
knowledge—Familiar Environments, Partially Familiar Environments and Unfamiliar
environments—as proposed by Schmid (2008). A stronger encoding of Li (e.g., Li = 1), will
make it less susceptible to the other factors (i.e., E, A or T) that may influence its access.
It is proposed that the influence of Affect on the access to ki will follow the inverted U
function as shown in Figure 19. Given this study identifies only two points along the curve
(control and motivated) it will be impossible to judge whether the relationship is linear or
curvilinear. Additional experimentation would be needed. However, the related research
suggests the inverted U is likely place to begin the modeling process. A value of -1 for E implies
a strong negative influence on the access to ki. A value of 0 implies no significant influence on
the access to ki, and a value of +1 indicates the optimal condition of the access to a known route
segment ki.
It is proposed that the effect of attention on the access to ki will follow a function similar
to that shown in Figure 20. A value of -1 for A (implies a strong negative influence on the access
to ki. A value of 0 implies no significant influence on the access to ki, and a value of +1 indicates
the optimal condition of the access to a known route segment ki. It is proposed that the effect of
time on the access to ki will follow a function similar to that shown in Figure 21. At the time of

56
encoding, time has a positive effect on the access to ki and assumes a value of +1. As time
passes, knowledge fades, and the access to ki is negatively affected by time, this is modeled as a
negative value (-1) for Time T.
5.3 EXPERIMENTAL RELEVANCE OF THEORETICAL CONCEPTS
Aspects of the experiment design as part of this research may be modeled by the theoretical
concepts presented. The various levels of task complexity are represented by the levels of route
knowledge, i.e., ε ≤ Li ≤ 1. The SimpleK routes as part of the experiment are routes that have
multiple known route segments ki. Given that SimpleK routes were well learned, each known
Figure 19. Proposed effect of affect on access to k

57
segment ki along a SimpleK route could be represented by knowledge level Li that may take on a
value of 1 (or nearly 1) depending on the level of encoding. The value of Li for DeducedK may
be assumed to be significantly less than 1. In general, assuming other factors (E, A, T) remain
optimal, poor performance—multiple errors and long time to completion—on a wayfinding tasks
may be modeled by a small value of Li resulting in a small value of k. The effect of motivated
instructions and time constraints may be modeled by E. An improvement in overall performance
when working under a time constraint may be modeled by a positive value of E. As part of the
experiment, the time between the training phase (encoding) and test phase (recall), was relatively
short. Hence, the value of T with respect to the experiment may be modeled as being nearly
equal to 1. This represents the recency effect related to recall.
Figure 20. Proposed effect of attention on access to k

58
Real world scenarios of travel may also be represented by the theoretical model
presented. Affect may have a differential effect on varying levels of route knowledge. As
mentioned earlier, a specific level of extreme stress that is modeled to have a negative effect
(E = -1) on the access to encoded route knowledge, may have little or no effect on a well learned
route, (Li = 1). For instance, consider that an emergency arises at your home and you need to
rush to the nearest hospital. The neighboring hospital is located only two blocks away from your
home (a well learned route). In this instance, the effect of stress may have very little effect on
your existing spatial knowledge. You may be able to locate the hospital with minimum number
of wrong turns. However, the same level of stress (E) may negatively affect a poorly encoded
route (Li = ε). For instance, consider that the same emergency arises at a restaurant in an
unfamiliar neighborhood. You need to rush to nearest hospital. However, in this instance, the
Figure 21. Proposed effect of time on the access to k

59
nearest hospital is one that you vaguely remember passing by on your way to the restaurant (a
poorly encoded route). In this instance, the added extreme stress of the situation may make it
harder for you to locate the hospital, than it would under optimal or less stressful affective states.
The fading of knowledge over time is another real world scenario that may be modeled
by the theoretical concepts presented is. For instance, consider a scenario where you have lived
in a neighborhood for many years. The route segments from your home to the neighborhood
grocery store may each be encoded with a strong level of knowledge (Li = 1) and Time (T = 1).
However, assume you now move to a new city and live there for a few years. Given that
significant time has passed, it may be estimated that knowledge of the old route (previous home
to neighboring grocery store) has faded. This may be modeled by changing the value of T—for
each route segment from your old home the old grocery story—from 1 to -1. The scenario of cell
phone use while driving (or wayfinding in general) may also be modeled by the theoretical
concepts presented. Attention demands due to cell phone use may be modeled by negative values
of A. As mentioned earlier, the effects of cell phone use on the recall of route knowledge may
vary depending on various factors such as Li, E and T.
Estimation of one‘s route knowledge (L) in an automated system is a challenging task
that is being currently explored (Schmid, 2008; Schmid & Richter, 2006). The effects of affect
and attention on the access to k are understandably harder to determine. However, the notion of
modeling affect and belief states and their effect on performance has been explored recently
(Bianchi-Berthouze & Lisetti, 2002; Hudlicka & McNeese, 2002). An individual‘s optimal level
of motivation is likely to be influenced by personality traits and individual differences. For
instance, participants who usually perform well under time constraints and motivated conditions
might be modeled with optimal values of +1 (or nearly +1) for Affect (E) and Attention (A).

60
However, participants who are easily stressed may be negatively influenced by motivation and
reward. This may be modeled by a negative value for E and A. The values for Li, E, A and T are
particularly challenging to model in real time and is an important area for future research.

61
6.0 DISCUSSION
This research was an attempt to explore the effect of affect on human wayfinding. Specifically,
Stage 1 of the study was designed to explore the effect of motivation on the time and wrong turn
related performance on variably complex routes in a partially known region of space. The results
indicate that route complexity does in fact interact with motivation. Motivation improved time
related performance of simple and moderately complex tasks. However, motivation failed to
improve time related performance on the most complex tasks. No significant difference was
found with respect to the number of wrong turns made between the two groups. Hence,
motivated participants performed their tasks in less time, but they did not make fewer errors.
Earlier studies have shown that affect can improve performance of simple tasks, whereas
they can hinder performance on more complex tasks (Farber & Spence, 1953; Vaughn &
Diserens, 1930). The results of our study follow a similar trend. While performance in the most
complex (ComplexDeducedK routes) tasks was not hindered by motivated instructions;
motivated participants failed to improve their performance on these tasks. It is interesting to note
that a ComplexDeducedK route, and a ComplexK route share a similar structural complexity, the
only difference between these routes being the extra cognitive processing to deduce the
destination in a ComplexDeducedK route. This suggests that with respect to motivated travel;
structural complexity of the route may be less of a factor if the route is well known.
62
The results of Stage 1 of our study gain relevance as they form the basis for future work
that would investigate possible performance degradation on very complex tasks, under highly
motivated or rushed conditions. The results may also be viewed in the context of the real world
scenarios of travel as mentioned in the introduction. The results suggest that rushed or highly
motivated travel through an unfamiliar airport will be less productive than rushed or highly
motivated travel through a familiar neighborhood park (assuming that both the environments
have similar structural complexity). This was seen as a 28.3% significant difference in
ComplexK routes and a 15.6% (n.s.) difference in ComplexDeducedK routes (as shown in Table
3).
It is also important compare the nature of this study, and the implications of the results,
with the choking under pressure studies mentioned earlier in Section 2.2 (Baumeister, 1984;
Beilock & Carr, 2001; Lewis & Linder, 1997; Wine, 1971). The nature of affect induced in the
motivated group varies, but only slightly, from the performance under pressure studies. In the
present research, participants in the motivated group were motivated by reward and rushed due
to an imposed time constraint. While this pressure is subtlety distinct from the performance
pressure induced as part of the chocking studies, the one common aspect of the two kinds of
manipulations is an affective state of high arousal, or pressure, that demands a higher than usual
task performance. The nature of the task performed also plays a vital role in the pressure related
performance degradation. Explicit monitoring theories usually explain degradation of
sensorimotor tasks such as golf putting (Beilock & Carr, 2001; Lewis & Linder, 1997) or the
―roll up‖ game (Baumeister, 1984), that are well learned. Distraction theory better explains
performance degradation in tasks that involve access to elements in working memory. The tasks
presented as part of this research primarily involved access to stored knowledge, but also
63
involved some amount of sensorimotor control (control of VR). Given that the major aspect of
the task performed by participants in this research involved the access to stored memory, the
wrong turn related performance degradation may be primarily explained by the distraction
theory. However, as Beilock and Carr (2001) mention, it is likely that the two theories may
complement rather than oppose each other. This is perhaps true for more complex tasks such as
human wayfinding, where both theories may be needed to completely and accurately explain
performance degradation.
Additionally, the effectiveness of schematized directions in various route conditions was
investigated as part of the exploratory work in Stage 2 of the study. In general, participants in
both conditions were able to use schematized directions and comfortably complete their
wayfinding tasks. Trends in the data indicate that the effectiveness of schematized directions
was found to be inversely proportional to the complexity of the task at hand. Schematized
directions were found to be most effective for the simplest wayfinding task—travel through the
known regions of the SimpleKN routes. This is of importance considering that travel through
unknown regions of the route was guided by detailed route directions, and travel through the
known regions had no detail. These directions were schematized based on the knowledge
chunking concepts mentioned earlier. This suggests that knowledge based schematized directions
may be presented if there is some knowledge of the environment and the task at hand is
relatively simple, or if knowledge is firmly established while performing complex wayfinding
tasks.
The effect of motivation on the performance of wayfinding tasks gains importance in
light of the recent research developments in automatic route guidance systems. Recent efforts in
this area involved modeling of user‘s knowledge with the goal of tailoring output of route

64
directions or maps, to the user‘s mental representations, or prior route or survey knowledge
(Patel et al., 2006; Schmid, 2008; Schmid & Richter, 2006; Srinivas & Hirtle, 2007; Tomko &
Winter, 2006). These personalized routes, while describing travel through a known region,
consist of simpler directions with less route direction elements. This in turn reduces the cognitive
load of the wayfinder. These research initiatives are an important step toward the automatic
generation of personalized routes based on user familiarity.
Indications from our study and earlier work in the area suggest that affect indeed
influences wayfinding. These findings are similar to those found most recently by Brunyé (2009)
These findings were used to extend the knowledge route theory introduced by Srinivas and Hirtle
(2007). The theory was expanded to include the influence of affect, as well as additional factors
such as attention and time, that influence the access to knowledge. The theory suggests that these
factors need to be taken into account while schematizing route directions (based on knowledge)
for travel in the real world.
These extensions to the theory are relevant for future automated route guidance systems
that may need to tailor their personalized route directions in accordance to not only a wayfinder‘s
prior knowledge, but also their affective state. This would require a future wayfinding system to
sense a wayfinder‘s affective state and route knowledge and present them with personalized
route guidance based on these factors. Recent research in this area suggests that detecting stress
levels of a driver in driving conditions might prove useful in customizing the driver‘s ‗in vehicle
environment‘. A small but important technical step in precisely this direction was taken by Lin
and colleagues who developed a ―smart wheel‖ (Lin et al., 2007). The device was shown to
satisfactorily measure a driver‘s pulse wave, breathing wave, skin temperature and gripping force
in real time. Lin and colleagues state that such a system would prove useful in enhancing driver
65
safety. While their study was intended to improve driver safety, it is easy to imagine that these
systems could also be used to improve usability. One could imagine future wayfinding systems
that would direct highly motivated or stressed users to longer but simple routes with less turns.
An interesting area for future study would also be the effect of motivation or stress on
route learning. This would imply that future route guidance systems might need to consider the
affective state of the driver while they attempt to automatically infer a driver‘s knowledge of a
route. Another interesting area for future investigation is the nature of navigation strategies
employed by wayfinders in different affective states. For example, do wayfinders resort to
landmark based ―homing in‖ strategies while under highly motivated or stressed conditions?
These findings may have further implications for future route guidance systems.

66
APPENDIX A
RECRUITMENT ADVERTISEMENT
Experiment Subjects Needed
Subjects are needed for the study involving navigational behavior. Any undergraduate or
graduate student, age 18 or older, at the University of Pittsburgh, is eligible. Participants will be
paid $15 per hour for their participation in a single session, that would last for not more than two
hours.
The Study is conducted by Samvith Srinivas, School of Information Sciences, 135 N. Bellefield
Ave, Pittsburgh, PA.
The Study will be conducted at: 2B04, School of Information Sciences, 135 N. Bellfield Ave,
University of Pittsburgh.
For more information contact:
Samvith Srinivas, [email protected] or call 412-860-9738

67
APPENDIX B
BACKGROUND QUESTIONNAIRE
Please fill in these background questions
1) Gender : M F
2) Age :
3) Student Status : Undergraduate Student Graduate Student
(if applicable)
4) How many years have you been studying at the University of Pittsburgh? 00
(if applicable)
5) Handedness : Right Left Ambidextrous
6) What is your Major or Field of Study ?

68
(if applicable)
7) How often do you use a computer?
8) How often do you use the World Wide Web?
9) How often do you play games with a first person view in a 3D environment (e.g.,
Unreal Tournament, Halo etc.)
10) Compared to others, rate the ease with which you navigate a Virtual Reality (or 3D)
computer environment.

69
11) Compared to other people you have seen, rate the ease with which you learn how to
find new locations:
12) Compared to other people you have seen, rate your ability to use a map:
13) How often do you use route finding systems such as MapQuest, Yahoo maps, or
Google maps?
70
APPENDIX C
Part 1:
Please rate your emotional state during the experiment:
1) Please rate the level of your stress (during the second half of the navigation task) on
the scale below:
1-I was extremely relaxed
2-
3-I felt Normal
4-
5-I was extremely stressed
2) Please rate the degree to which you felt rushed (during the second half of the
navigation task) on the scale below:
1-I absolutely did not feel rushed
2-
3-I felt normal
4-
5-I felt extremely rushed
3) Please rate the level of your excitement (during the second half of the navigation task)
on the scale below:
1-I was absolutely bored

71
2-
3-I felt normal
4-
5-I was highly excited
4) In general, please rate your attitude toward stressful situations:
1-I absolutely enjoy stressful situations
2-
3-I have no particular like or dislike of stressful situations
4-
5-I absolutely detest stressful situations
5) In general, please rate your performance under stressful situations as compared with
others:
1-I work very poorly under stressful situations
2-
3-I perform moderately under stressful situations
4-
5-I perform much better under stressful situations
6) In general, please rate your attitude toward timed tasks:
1-I detest working under time constraints
2-
3-Time constraints do not affect me in any way
4-
5-I enjoy working under time constraints
72
BIBLIOGRAPHY
Abowd, G. D., Mynatt, E. D., & Rodden, T. (2002). The human experience [of ubiquitous
computing]. Pervasive Computing, IEEE, 1(1), 48-57.
Agrawala, M., & Stolte, C. (2001). Rendering Effective Route Maps: Improving Usability
Through Generalization. Paper presented at the Conference on Computer Graphics and
Interactive Techniques.
Allen, G. L. (1997). From Knowledge to Words to Wayfinding: Issues in the Production and
Comprehension of Route Directions. Lecture Notes in Computer Science, 1329, 363-372.
Allen, G. L. (2000). Principles and Practices for Communicating Route Knowledge. Applied
Cognitive Psychology, 14, 333-359.
Bakker, N. H., Werkhoven, P. J., & Passenier, P. O. (1999). The Effects of Proprioceptive and
Visual Feedback on Geographical Orientation in Virtual Environments. Presence:
Teleoperators & Virtual Environments, 8(1), 36-53.
Barrett, L. F., & Russell, J. A. (1999). The Structure of Current Affect: Controversies and
Emerging Consensus. Current Directions in Psychological Science, 8(1), 10-14.
Baumeister, R. F. (1984). Choking under pressure: Self-consciousness and paradoxical effects of
incentives on skillful performance. Journal of Personality & Social Psychology, 46(3),
610-620.

73
Baus, J., Krüger, A., & Wahlster, W. (2002). A resource-adaptive mobile navigation system.
Paper presented at the 7th international conference on Intelligent user interfaces, San
Francisco, California, USA.
Beilock, S. L., & Carr, T. H. (2001). On the fragility of skilled performance: What governs
choking under pressure? Journal of Experimental Psychology: General, 130(4), 701-725.
Bianchi-Berthouze, N., & Lisetti, C. L. (2002). Modeling Multimodal Expression of User's
Affective Subjective Experience. User Modeling and User-Adapted Interaction, 12, 49-
84.
Bower, G. H. (1981). Mood and memory. American Psychologist, 36(2), 129-148.
Brunyé, T. T., Mahoney, C. R., Augustyn, J. S., & Taylor, H. A. (2009). Emotional state and
local versus global spatial memory. Acta Psychologica, 130(2), 138-146.
Brusilovsky, P. (2001). Adaptive hypermedia. User Modeling and User-Adapted Interaction,
11(1-2), 87-110.
Brusilovsky, P. (2007). Adaptive Navigation Support. In P. Brusilovsky, A. Kobsa & W. Nejdl
(Eds.), The Adaptive Web (Vol. 4321, pp. 263-290): Springer Berlin - Heidelberg.
Bülthoff, H. H., Campos, J. L., & Meilinger, T. (2008). Virtual Reality as A Valuable Research
Tool for Investigating Different Aspects of Spatial Cognition (Keynote-Abstract). Paper
presented at the International Conference Spatial Cognition, Freiburg, Germany.
Cheverst, K., Mitchell, K., & Davies, N. (2002). The Role of Adaptive Hypermedia in A
Context-Aware Tourist GUIDE. Communications of the Acm, 45(5), 47-51.
Christianson, S. A. (1992). The Handbook of emotion and memory : research and theory.
Hillsdale, N.J.: Erlbaum Associates.

74
Cohen, R., & Schuepfer, T. (1980). The Representation of Landmarks and Routes. Child
Development, 51(4), 1065-1071.
Cutmore, T. R. H., Hine, T. J., Maberly, K. J., Langford, N. M., & Hawgood, G. (2000).
Cognitive and gender factors influencing navigation in a virtual environment.
International Journal of Human-Computer Studies, 53(2), 223-249.
Damasio, A. R. (1995). Descartes' Error: Emotion, Reason, and the Human Brain: Harper
Perennial.
Daniel, M.-P., & Denis, M. (1998). Spatial Descriptions as Navigational Aids: A Cognitive
Analysis of Route Directions. Kognitionswissenschaft, 7(1), 45-52.
Denis, M., Pazzaglia, F., Cornoldi, C., & Bertolo, L. (1999). Spatial Discourse and Navigation:
An Analysis of Route Directions in the City of Venice Applied Cognitive Psychology,
13(2), 145-174.
Dolan, R. J. (2002). Emotion, Cognition, and Behavior. Science, 298, 1191-1194.
Ekman, P., & Friesen, W. V. (1971). Constants Across Cultures In The Face And Emotion.
Journal ol Personality and Social Psychology, 17(2), 124-129.
Farber, I. E., & Spence, K. W. (1953). Complex learning and conditioning as a function of
anxiety. Journal of Experimental Psychology: General, 45(2), 120-125.
Fontaine, S., & Denis, M. (1999 ). The Production of Route Instructions in Underground and
Urban Environments. Paper presented at the International Conference on Spatial
Information Theory: Cognitive and Computational Foundations of Geographic
Information Science.
Forgas, J. P. (Ed.). (2000). Feeling and Thinking: The Role of Affect in Social Cognition:
Cambridge Universtiy Press.
75
Fox, E., Russo, R., Bowles, R., & Dutton, K. (2001). Do Threatening Stimuli Draw or Hold
Visual Attention in Subclinical Anxiety? Journal of Experimental Psychology: General,
130(4), 681-700.
Freundschuh, S., & Egenhofer, M. (1997). Human Conceptions of Spaces: Implications for
Geographic Information Systems. Transactions in GIS, 2(4), 361-375.
Gale, N., Golledge, R. G., Halperin, W. C., & Couclelis, H. (1990). Exploring Spatial
Familiarity. The Professional Geographer, 42(3), 299-313.
Gillner, S., & Mallot, H. A. (1998). Navigation and acquisition of spatial knowledge in a.
Journal of Cognitive Neuroscience, 10(4), 445-463.
Golledge, R. G. (1992). Place Recognition and Wayfinding: Making Sense of Space. Geoforum,
23(2), 199-214.
Golledge, R. G. (1999). Wayfinding Behavior: Cognitive Mapping and Other Spatial Processes.
Baltimore and London: The Johns Hopkins University Press.
Golledge, R. G., Dougherty, V., & Bell, S. (1995). Acquiring Spatial Knowledge: Survey versus
Route-Based Knowledge in Unfamiliar Environments. Annals of the Association of
American Geographers, 85(1), 134-158.
Golledge, R. G., & Spector, A. (1978). Comprehending the Urban Environment. Geographical
Analysis, 10, 403-426.
Hansen, C. H., & Hansen, R. D. (1988). Finding the Face in the Crowd: An Anger Superiority
Effect. Journal of Personality & Social Psychology, 54(6), 917-924.
Healey, J. A., & Picard, R. W. (2005). Detecting stress during real-world driving tasks using
physiological sensors. IEEE Transactions on Intelligent Transportation Systems, 6(2),
156-166.

76
Hegarty, M., & Waller, D. (2004). A dissociation between mental rotation and perspective-taking
spatial abilities. Intelligence, 32, 175-191.
Heuer, F., & Reisberg, D. (1992). Emotion, arousal, and memory for detail. In S. Christianson
(Ed.), The handbook of emotion and memory. Hillsdale, N. J.: Lawernce Erlbaum
Associates.
Hirtle, S. C., & Hudson, J. (1991). Acquisition of Spatial Knowledge for Routes. Journal of
Environmental Psychology, 11(4), 335-345.
Hudlicka, E., & McNeese, M. D. (2002). Assessment of User Affective and Belief States for
Interface Adaptation: Application to an Air Force Pilot Task. User Modeling and User-
Adapted Interaction, 12, 1-47.
Jansen-Osmann, P. (2002). Using desktop virtual environments to investigate the role of
landmarks. Computers in Human Behavior, 18, 427-436.
Kaplan, C., & Fenwick, J. (1993). Adaptive Hypertext Navigation Based on User Goals and
Context. User Modeling and User-Adapted Interaction, 3, 193-220.
Klatzky, R. L., Fikes, T. G., & Pellegrino, J. W. (1995). Planning for hand shape and arm
transport when reaching for objects. Acta Psychologica, 88(3), 209-232.
Klein, W. (1982). Local deixis in route directions: New York: Wiley.
Klein, W. (1983). Deixis and spatial orientation in route directions: New York: Plenum Press.
Kleinsmith, L. J., & Kaplan, S. (1963). Paired-associate learning as a function of arousal and
interpolated interval. Journal of experimental psychology, 65(2), 190-193.
Klippel, A. (2003a). Wayfinding Choremes. Paper presented at the Spatial Information Theory:
Foundations of Geographic Information Science. Conference on Spatial Information
Theory (COSIT).
77
Klippel, A. (2003b). Wayfinding Choremes - Conceptualizing Wayfinding and Route Direction
Elements. Unpublished Doctoral Thesis, University of Bremen, Bremen, Germany.
Klippel, A., Richter, K.-F., Barkowsky, T., & Freksa, C. (2005). The Cognitive Reality of
Schematic Maps. In L. Meng, A. Zipf & T. Reichenbacher (Eds.), Map-based Mobile
Services - Theories, Methods and Implementations (pp. 57-74): Springer, Berlin.
Kray, C., & Baus, J. o. (2003). A Survey of Mobile Guides. Paper presented at the HCI in Mobile
Guides, Udine, Italy.
Kruger, A., Baus, J., Heckmann, D., & Kruppa, M. (2007). Web Based Mobile Guides. . In P.
Brusilovsky, A. Kobsa & W. Nejdl (Eds.), The Adaptive Web (Vol. 4321). Berlin -
Heidelberg: Springer.
Krüger, A., Butz, A., Stahl, C., Wasinger, R., Steinberg, K., & Dirschl, A. (2004). The
Connected User Interface: Realizing a Personal Situated Navigation System. Paper
presented at the IUI2004: International Conference on Intelligent User Interfaces.
Lewis, B. P., & Linder, D. E. (1997). Thinking about Choking? Attentional Processes and
Paradoxical Performance. Personality and Social Psychology Bulletin, 23, 937-944.
Lin, Y., Leng, H., Yang, G., & Cai, H. (2007). An Intelliget Noninvasive Sensor for Driver Pulse
Wave Measurement. IEEE Sensors Journal, 7(5), 790-799.
Lovelace, K. L., Hegarty, M., & Montello, D. R. (1999). Elements of good route directions in
familiar and unfamiliar environments. Spatial Information Theory, 1661, 65-82.
Mark, D., Freksa, C., Hirtle, S., Lloyd, R., & Tversky, B. (1999). Cognitive models of
geographical space. International Journal of Geographical Information Science, 13(8),
747-774.

78
Mark, D., & Gould, M. (1992). Wayfinding directions as discourse: A comparison of verbal
directions in English and Spanish. Multilingua, 11(3), 267-291.
Matarazzo, J. D., Ulett, G. A., & Saslow, G. (1955). Human Maze performance as a function of
increasing levels of anxiety. Journal of General Psychology, 53, 79-95.
Medyckyj-Scott, D., & Blades, M. (1992). Human Spatial Cognition: Its Relavance to the Design
and Use of Spatial Information Systems. Geoforum, 23(2), 215-226.
Ohman, A., Lundqvist, D., & Esteves, F. (2001). The Face in the Crowd Revisited: A Threat
Advantage With Schematic Stimuli. Journal of Personality & Social Psychology, 80(3),
381-396
Okamura, A. M. (2004). Methods for haptic feedback in teleoperated robot-assisted surgery.
Industrial Robot: An International Journal, 31(6), 499-508.
Patel, K., Chen, M. Y., Smith, I., & Landay, J. A. (2006). Personalizing routes. Paper presented
at the Proceedings of the 19th annual ACM symposium on User interface software and
technology.
Pratto, F., & John, O. (1991). Automatic Vigilance: The Attention-Grabbing Power of Negative
Social Information. Journal of personality and social psychology, 61(3), 380-391.
Presson, C. C., & Montello, D. R. (1988). Points of reference in spatial cognition: Stalking the
elusive landmark. British Journal of Developmental Psychology, 6, 378-381.
Raubal, M., Egenhofer, M. J., Pfoser, D., & Tryfona, N. (1997). Structuring space with image
schemata: Wayfinding in airports as a case study. Spatial Information Theory: A
Theoretical Basic for Gis, 1329, 85-102.
79
Raubal, M., & Winter, S. (2002, September 25-28). Enriching Wayfinding Instructions with
Local Landmarks. Paper presented at the Geographic Information Science: Second
International Conference, GIScience 2002, Boulder, CO, USA.
Richardson, A. E., Montello, D. R., & Hegarty, M. (1999). Spatial knowledge acquisition from
maps and from navigation in real and virtual environments. Memory & Cognition, 27(4),
741-750.
Riecke, B. E., van Veen, H. A. H. C., & Bülthoff, H. H. (2002). Visual Homing Is Possible
Without Landmarks: A Path Integration Study in Virtual Reality. Presence:
Teleoperators & Virtual Environments, 11(5), 443-473.
Rosenberg, L. B. (1993). Virtual fixtures as tools to enhance operator performance in
telepresence environments. Paper presented at the Telemanipulator Technology and
Space Telerobotics, Boston, MA, USA.
Rossano, M. J., & Reardon, W. P. (1999). Goal Specificity and the Acquisition of Survey
Knowledge. Environment and Behavior, 31(3), 395-412.
Rossano, M. J., West, S., O., Robertson, T. J., Wayne, M. C., & Chase, R. B. (1999). The
Acquisition of Route and Survey Knowledge from Computer Models. Journal of
Environmental Psychology 19, 101-115.
Ruddle, R. (2005, March 12-16). The effect of trails on first-time and subsequent navigation in a
virtual environment. Paper presented at the Virtual Reality, 2005. Proceedings. VR 2005.
IEEE, Bonn.
Ruddle, R., Payne, S., & Jones, D. (1998). Navigating large-scale `desk-top' virtual buildings:
Effects of orientation aids and familiarity. Presence: Teleoperators & Virtual
Environments, 7(2), 179-192.

80
Russell, J. A. (1980). A Circumplex Model of Affect. Journal of Personality and Social
Psychology, 39(6), 1161-1178.
Schmid, F. (2008). Knowledge-based Wayfinding Maps for Small Display Cartography. Journal
of Location Based Services, 2(1), 57-83.
Schmid, F., & Richter, K.-F. (2006). Extracting Places from Location Data Streams. Paper
presented at the UbiGIS 2006 - Second International Workshop on Ubiquitous
Geographical Information Services, Muenster, Germany.
Schmitz, S. (1999). Gender Differences in Acquisition of Environmental Knowledge Related
to Wayfinding Behavior, Spatial Anxiety and Self-Estimated Environmental
Competencies. Sex Roles: A Journal of Research, 41(1), 71-93.
Schmolck, H., & Buffalo, E. A. (2000). Memory distortions develop over time: Recollections of
the O.J. Simpson trial verdict after 15 and 32 months
Preview By: . Psychological Science, 11(1), 39-45.
Simcock, T., Hillenbrand, S. P., & Thomas, B. H. (2003). Developing a Location Based Tourist
Guide Application. Paper presented at the Research and Practice in Information
Technology-Workshop on Wearable, Invisible, Context Aware, Ambient, Pervasive and
Ubiquitious Computing, Adelaide, Australia.
Smith, E., & Kosslyn, S. (2006). Cognitive Psychology Mind and Brain: Pearson Prentice Hall.
Smith, E., & Kosslyn, S. (2007). Cognitive Psychology: mind and brain (1st Ed. ed.): Pearson
Prentice Hall.
Sorrows, M. E., & Hirtle, S. C. (1999). The nature of landmarks for real and electronic spaces.
Spatial Information Theory, 1661, 37-50.

81
Srinivas, S., & Hirtle, S. C. (2007). Knowledge Based Schematization of Route Directions. In T.
Barkowsky, M. Knauff, G. Ligozat & D. R. Montello (Eds.), Spatial Cognition V (Vol.
4387, pp. 346-364). Bremen, Germany: Springer.
Staedter, T. (2006). 'Biomaps' Track Urbanite Moods. Discovery News.
Steck, S. D., & Mallot, H. A. (2000). The Role of Global and Local Landmarks in Virtual
Environment Navigation. Presence: Teleoperators & Virtual Environments, 9(1), 69-83.
Streeter, L. A., Vitello, D., & Wonsiewicz, S. A. (1985). How to tell people where to go:
comparing navigational aids. International Journal of Man-Machine Studies, 22(5), 549-
562.
Talarico, J. M., & Rubin, D. C. (2003). Confidence, not consistency, characterizes flashbulb
memories. Psychological Science, 14(5), 455-461.
Talmy, L. (1975). Semantics and syntax of motion: New York: Academic Press.
Teigen, K. H. (1994). Yerkes-Dodson: A Law for All Seasons. Theory & Psychology, 4(4), 525-
547.
Tom, A., & Denis, M. (2003). Referring to landmark or street information in route directions:
What difference does it make? Spatial Information Theory, Proceedings, 2825, 362-374.
Tom, A., & Denis, M. (2004). Language and spatial cognition: Comparing the roles of landmarks
and street names in route instructions. Applied Cognitive Psychology, 18(9), 1213-1230.
Tomko, M., & Winter, S. (2006). Recursive Construction of Granular Route Directions. Journal
of Spatial Science, 51(1), 101-115.
Tversky, B. (1993). Cognitive Maps, Cognitive Collages, and Spatial Mental Models. Paper
presented at the Spatial Information Theory: A Theoretical Basis for GIS, Proceedings
COSIT.

82
Tversky, B., & Lee, P. U. (1999). Pictorial and Verbal Tools for Conveying Routes. Spatial
Information Theory, from <Go to ISI>://000086779100004
Vaughn, J., & Diserens, C. M. (1930). The Relative Effects of Various Intensities of Punishment
on Learning and Efficiency. Journal of Comparative Psychology, 10(1), 55-66.
Wine, J. (1971). Test anxiety and direction of attention. Psychological Bulletin, 76(2), 92-112.
Wunderlich, D., & Reinelt, R. How to get there from here: New York: Wiley.
Yerkes, R. M., & Dodson, J. D. (1908). The Relation of Strength of Stimulus to Rapidity of
Habit-formation. Journal of Comparative Neurology and Psychology, 18, 459-482.