influence of prisons on inmate misconduct influence of prisons on inmate misconduct: ... incorporate...
TRANSCRIPT

The Influence of Prisons on Inmate Misconduct:A Multilevel Investigation
Scott D. CampGerald G. GaesNeal P. Langan
William G. Saylor
Office of Research and EvaluationFederal Bureau of Prisons
Washington, DC
April 1, 2003
contact: [email protected]
The opinions expressed in this paper are those of the authors and do not represent the officialposition of the U.S. Department of Justice or the Federal Bureau of Prisons. We would like tothank Francisco “Chico” Barroso at the Federal Bureau of Prisons for designing a system toprovide the data analyzed here. We would also like to thank Victoria Joseph and Vicki Russellfor editorial assistance. We are also indebted to Donna Bishop and two anonymous reviewers forJustice Quarterly who provided suggestions that strengthened and improved the paper. Amodified version of this paper appears in Volume 20, Number 3 of Justice Quarterly.

The Influence of Prisons on Inmate Misconduct:A Multilevel Investigation
ABSTRACT
This paper presents results of multilevel analyses of prisoner misconduct for the population of
over 120,000 federal prisoners incarcerated during June 2001. Prior research has focused upon
individual-level explanations of inmate misconduct, but this study explicitly examined whether
prisons vary in their influence upon inmate misconduct. This paper demonstrated that model
specification makes a difference in our understanding of which variables are related to
misconduct. Second, the paper demonstrated that type of misconduct is important for
understanding the effects of covariates of misconduct. Finally, the paper demonstrated the ease
by which results of multilevel models can be used to compare the performance of prisons.
-1-
INTRODUCTION
This article focuses upon the effectiveness of prison operations, sometimes referred to as
the prison environment, and inmate misconduct. Little quantitative research has been conducted
in this area with the exception of the attention given to prison crowding. Prison crowding has
been the justification for state and federal court intervention into prison operations, and this
probably fueled the academic interest in prison crowding. Determining whether prisons differ in
their impact upon inmate misconduct is important because it potentially allows for designing
safer and more humane prisons and because the information can be used to address the relative
effectiveness of public and private prisons, as discussed later. This is not to say that there has
been no recognition given to the importance of prison management and prison operations.
Researchers have long pointed to the link between correctional philosophy, management
implementation, and prison operations (DiIulio, 1987, 1991; Jacobs, 1977; Wright, 1994).
Researchers have also pointed to the consequences of prison operations and management and
how this sets social conditions that can lead to either catastrophic outcomes, especially riots, or
prison reform (Colvin, 1992; Goldstone & Useem, 1999; Useem & Goldstone, 2002). These
studies, though, were based upon case studies to provide empirical content for systemic
investigations. While useful, case studies are limited in the sense that they are time consuming to
complete and not ideally suited to dealing with the individual details needed to compare the
more mundane daily operations of a large number of prisons. What is needed are proactive
criteria that flow from daily prison operations (and data collection) which can be used to produce
detailed evaluations of those prison operations. This research begins to address that need.

-2-
Many criminologists have theorized about the effect of prison conditions on behavior
within prison and after release. Some institutional characteristics are thought to affect the
frequency of misconduct by increasing or decreasing opportunity (e.g., security level and
effective operations) while others are thought to increase the skills and motivation for a crime-
free lifestyle (e.g., prevalence of rehabilitation programs) or, conversely, to have a criminogenic
effect (e.g., exposure to delinquent peers). Other researchers have examined the effectiveness of
prison programs on reducing in-prison misconduct, criminal activity upon release, and return to
drug use (see volume 3 of The Prison Journal in 1999 and Rhodes et al., 2001).
Bottoms (1999) has summarized a great deal of prior research on prison order and has
argued that the prison environment exerts an influence upon inmate misconduct, especially
interpersonal violence, above and beyond the influence of the characteristics of inmates. He
particularly focuses on the social organization of prisons characterized by six factors. He notes
that prisons are “total institutions” (Goffman, 1961, factor 1), organized around the
administration of punishment (factor 2). Prisons have an internal organization composed of
routine activities such as eating, work, and “locking up” that organize the time and space of an
institution. These patterns can vary tremendously and can produce different social climates
(factor 3). The daily routine of prison life of both prisoner and officer (factor 4) is instrumental
in understanding prison life. Understanding how these routines “...structure and sustain social
institutions over time...” and “... how individuals assimilate new routines...” (Bottoms, 1999:
209) is, according to Bottoms, a somewhat overlooked facet of prison social organization. There
is a complex interrelationship between the captors and captives (factor 5, Sykes, 1958). Because
the prison is a relatively self-contained environment and separated from many external
-3-
influences, the management approach within a particular establishment can have a dramatic
effect on institution culture (factor 6). In Great Britain, this latter point is often characterized as
a difference in the prison regimes. Some managers emphasize regimented and restrictive
environments. Others endorse a more relaxed and “democratic” approach. As Bottoms notes,
“...prison scholars have failed adequately to develop socially contextualized accounts of prison
violence that make real connections to the lived daily experience of prison administrators
(Bottoms, 1999: 212).
In this paper, we make an attempt to analyze environmental influences on inmate
misconduct. We agree with Bottoms that the organizational influences are relational and
dynamic and not easily captured with static structural variables. As a first step, we begin with
structural variables that proxy some of the dynamics of the social organization of prisons. The
empirical question is whether prison management, through the means at its disposal, creates an
environment within a prison that then exerts an influence upon inmate misconduct that is
independent of the individual or collective characteristics of the inmates and staff who live and
work at the prison. This is the primary question driving the present study. Whether we can
explain the dynamics of the different environments that have this impact upon misconduct may
be beyond the ability of the current data except as we incorporate this dynamic with the proxy
measures at our disposal.
Despite speculation about the effects of prison, most often expressed as the debate
between importation and deprivation (Paterline & Petersen, 1999), most empirical research on
inmate misconduct has focused upon individual-level factors (Harer & Langan, 2001; Harer &
Steffensmeier, 1996). To date, there has been only one empirical study that analyzed inmate

1It is worth noting that we follow convention and call the models analyzed here hierarchical linear models.Technically, the models are nonlinear. The outcome measures analyzed are binary, but the measures are analyzedwith a logistic transformation and that permits linear relationships to exist on the right-hand side of the equation.
-4-
misconduct with statistical techniques that allowed for adequate and simultaneous accounting of
both individual- and prison-level effects upon misconduct (Wooldredge, Griffin, & Pratt, 2001).
Wooldredge and his colleagues used the multilevel methods developed by Raudenbush and Bryk
in the U.S. (2002) and Goldstein in the U.K (1995). These models allow for the correlation of
observations within groups. For example, it would be naive to assume that inmate behavior is
independent of other behavior occurring in the same institution, although this assumption is
nearly universal. At the very least, the effective sample size is decreased as a function of the
degree of correlation of behaviors within the different institutions (Snijders & Bosker, 1999: 16-
35). Wooldredge and his colleagues demonstrated the potential of hierarchical linear models, but
they recognized limitations to the data they analyzed and that significant conceptual and
methodological problems remained.1 These include (1) model specification, (2) identification of
the appropriate type of misconduct to analyze, and (3) the use of HLM models to produce
performance measures of the prisons themselves. Using misconduct data to assess the relative
performance of individual prisons is particularly relevant in the current climate of privatizing
government functions.
THINKING ABOUT MISCONDUCT
Misconduct, defined as the failure to follow explicit rules, is a slippery concept as anyone
with children can testify. The concept becomes even more muddled when we examine it within
prison. Criminologists have long been skeptical of prison misconduct as an indicator of criminal
proclivity for at least two reasons. First, criminologists have been concerned with the amount of
-5-
discretion exercised by correctional staff in enforcing prison rules [Poole, 1980 #10; Light, 1990
#11], although an early examination of the disciplinary process in the prison system that is the
subject of this study suggested that it was not racially biased in an obvious way (Hewitt, Poole,
& Ragoli, 1984). Additionally, some forms of misconduct in prison, such as violence, are
probably less susceptible to manipulation, and they are examined separately here. Second, the
theoretical importance of prison misconduct is unclear because prison rule infraction and law
violation may not share the same etiology. Prison rules have been questioned as overly
restrictive and encompassing behaviors that are legal in other contexts. However, Langan and
Camp (2002) recently demonstrated similarities in the types of inmates who commit serious and
nuisance types of misconduct. As for the increased surveillance of inmates in prison that troubles
some criminologists, we view it as an advantage. While not every act of misconduct in prison is
captured, we expect prison misconduct data to more accurately reflect the universe of prison
behavior than arrest or conviction data do for street crimes. In other words, official prison
records contain less observational measurement error than official police records. Additionally,
prison populations are “relatively homogenous on many crime-causal variables” (Hirschi &
Gottfredson, 1983: 561).
In the Wooldredge et al. (2001) study, all forms of misconduct were collapsed into the
dependent variable. We think that it makes sense to both examine misconduct overall as well as
parsed into categories defined by substantive interest. Treating all misconduct as being equal
implies a theory of criminality whereby crime is but one representation of an underlying
propensity toward reckless and impulsive behavior (Gottfredson & Hirschi, 1990). We are not
necessarily opposed to such a position, but it is not yet known whether a single latent trait
2In a longer report, we examined misconduct categorized in two additional ways. In one classification, wegrouped misconduct in terms of whether it represented illegal activity in the free world or whether the behavior wasspecifically prohibited in prison. In a different scheme, we used offense severity inherent to the Bureau of Prison’ssystem of classifying misconduct. Those results are available from the authors. Essentially, the results mirror thosereported later in this paper where context does matter. We dropped sexual misconduct from the current analysis asthere was no significant variance for this type of misconduct at the institutional level.
-6-
underlies all crime and misconduct. Accordingly, we classified misconduct into the substantive
areas related to violence, drug use, prison accountability (escapes), property offenses, security-
related offenses (interfering with daily operations), and a residual category. This categorization
is consistent with traditional categories of inmate misconduct and was used recently by Gaes and
his colleagues in examining gang activity within the federal prison system (Gaes, Wallace,
Gilman, Klein-Saffran, & Suppa, 2002).2
Thinking About Aggregate Influences Upon Misconduct
This study examines whether prisons differ in ways that influence misconduct by
prisoners. Ideally, we would examine in complete detail the causes of these institutional
differences, but we do not have available indicators of the quality of staff-prisoner relationships
that Bottoms (1999) argues are crucial to understanding prison operations. Nonetheless, we do
incorporate analysis at the level of the prison and we do consider a variety of theoretically
meaningful factors at the institutional level. With the exception of crowding, institutional
properties of prisons have not often been employed in explaining inmate misconduct. We
wanted to address this oversight in greater detail than provided by Wooldredge et al. (2001).
Institutional characteristics are interesting both theoretically and practically. Practically, prison
administrators are interested in knowing, for example, what mixture of inmate demographic
characteristics produce the lowest levels of violence. In this research, we are interested in two

3In preliminary analyses, we looked at other institutional-level variables. For example, we looked atadmission rates, percentage of inmates who were Hispanic, staff to inmate ratios, custody staff to inmate ratios,percentage of custody staff who were female, median sentence length, and percentage of inmates incarcerated on adrug charge. None of these variables were included in final models as they proved not to be significant, and themodels analyzed here could not support additional variables at the institutional level.
-7-
types of influences upon inmate misconduct: the aggregate characteristics of the inmates and the
aggregate characteristics of staff. The residual variance at the aggregate level will be assumed to
be related to differences in prison performance across the different institutions. Hopefully, future
research will be able to identify those sources of prison performance, and that is where we
believe Bottom’s theoretical work on prisoner-staff relationships can be most useful. In the
present study we evaluated an ecological variable, composites of inmate demographics,
indicators of staff-inmate relations, and contextual variables representing the collective criminal
propensity of an institution.
Ecological Variables. We looked at one “ecological factor” thought to influence inmate
behavior, prison crowding. As already noted, prison crowding has generated the most interest
from researchers.3 Based in part upon findings from rat experiments, researchers hypothesized
that crowding would lead to increased violence among inmates. Of course, the theory is more
sophisticated than that of a simple stimulus producing a response, and researchers note that
crowding produces intermediate psychological states, such as depression, that then lead to
misconduct. The most recent empirical study in this tradition is provided by Wooldredge et al
(2001). Using multilevel methods, Wooldredge and his colleagues entered crowding as a
covariate describing prisons and found a positive effect that was contrary to findings in previous
crowding research (Gaes, 1985, 1994). Of course, having only one measure to describe the

-8-
complexity of prisons placed the study in grave peril of model misspecification, a fact
recognized by Wooldredge et al.
Inmate Demographics. Inmate demographic composition included a racial composition index
and average inmate age. We used the normalized integration index, most recently described by
Reardon (2000; 2002), as a measure of racial composition. The integration index measures the
concentration of any one racial group at a given prison. A score of zero means that one racial
group dominated the composition where a value of one means that the racial groups were evenly
represented. The three racial groups used to compute the normalized integration index in this
study were white, black, and other. Because of the small numbers of inmates who were Asian
and American Indian, the only two racial categorizations used by the Bureau of Prisons (BOP) to
supplement black and white, Asian and American Indian were combined together into the other
category.
Staff-Inmate Relations. Variables that reflect staff-inmate relationships included percentage of
female staff, percentage of white staff, and the proportion of staff who had one year or less of
tenure. Staff experience is probably an important aggregate indicator. Camp and Gaes (2002), for
example, noted an apparent relationship between staff stability and inmate misconduct in a
survey of private prisons. In this study, we controlled for the percentage of staff who were in
their first year on the job with the expectation that institutions with greater numbers of
inexperienced staff would be at greatest risk of misconduct. Given the mismatch that often exists
between race and sex of staff and inmates, these factors remain of concern to correctional
administrators. Concerns about normalizing the prison experience and complying with equal
opportunity legislation led current prison administrators to make greater use of minority and

-9-
female staff than was true historically. As such, it is useful to examine whether having different
mixes of staff produce differences in prison environments from a policy standpoint. We also
used an indicator variable to assess whether an institution was in its activation phase. This latter
variable is particularly important to prison administrators. New prisons hiring large numbers of
new staff have greater potential to change their racial or sex composition than prisons with staff
already in place. While this variable obviously captures more than just staff-inmate relations, it
does represent in a static way, the process of relationships and “institution culture” that evolve
over time. The dynamics of prison culture seem to depend, in large part, in the way a prison is
activated, creating a kind of socio-cultural momentum (Fleisher, 2000).
Collective Criminal Propensity. We introduced a variable that captured the collective propensity
to criminality of the inmate population by adding the average custody score for a particular
institution. In prior studies, the effect of propensity has been proxied by entering dummy
variables for the institutional security level of the prisons. We preferred the average custody
score because it discriminates among institutions that are assigned the traditional classifications
of minimum, medium, etc. Instead of treating all medium-security prisons, for example, as
having the exact same mix of inmates, the average custody score provides an indication of which
prisons are “softer” or “harder” places to do time. Currently, prison administrators house inmates
together based on their propensity for violence, misconduct, and escape. The idea behind this is
that grouping dangerous inmates together allows prison administrators to concentrate
surveillance resources on those most in need, and it reduces opportunities for predation on
weaker inmates. But there may be unintended and undesirable consequences associated with
“prisonization” that outweigh these benefits (Clemmer, 1940), and others have used a
4The custody classification score ranges from 0-27 points, where the larger the score the greater the risk ofviolent and other misconduct. The score is the sum of six items including: type and number of prior incarcerations(0-3), seriousness of current offense (0-7), recency and seriousness of history of violence (0-7), recency andseriousness of history of escape (0-3), having a pending charges or a subsequent sentence in another jurisdiction andthe seriousness of the charge (0-7), whether inmate was released without bond prior to conviction (up to 3 pointssubtracted).
-10-
discontinuity approach to examine the effect of individual-level custody scores across security
levels (Chen & Shapiro, 2002),.
All of the institutional variables used here are to some extent under the control of prison
administrators. Heeding Bottom’s admonishment, that it is time to move in the direction of
informing our understanding of prison administration and consider institutional variables that
compose the “social organization” and context of inmate-to-inmate and inmate-to-staff
interactions, we built models to investigate those relationships
Thinking about Individual-Level Influences Upon Misconduct
Most of the individual-level predictors of misconduct that we used are well-established in
the literature, although we add an important predictor variable seldom used in prior research.
Primarily, we used actuarial measures. We used the initial custody classification score computed
by the BOP upon the inmate’s entry into the system as a sentenced felon.4 Others have found that
this was a positive predictor of violent misconduct (Harer & Langan, 2001), and we included the
squared term to allow for the effect to dampen at higher scores. Higher custody scores indicate a
more serious history of criminality most of which occurs prior to prison admission. We also
incorporated the prior history of the misconduct under question, a measure of past propensity
toward crime that occurs within the prison setting. This measure has rarely been used to study
prison misconduct, although Gaes et al., (2002) used this measure of criminal propensity to study
gang-related behavior.
-11-
In addition to the actuarial measures of past propensity toward misconduct, we included
inmate demographic variables. Variables that controlled for race, sex, age, and citizenship were
employed. Race was categorized as black, white and other. White was the excluded category
when dummy variables were created for analysis. The BOP actually uses four categories for
race, but the two categories of Asian and American Indian contain small counts at any one given
institution. We did not have specific hypotheses in mind for the effect of race given our
extensive attempt to capture demonstrated propensity toward crime. If, for example, blacks are
more likely to engage in violence because of their greater exposure to a subculture of violence,
then race should be unrelated to future violence after controlling for individual differences in
past violent behavior as this is a more direct control for subculture of violence. Indicators for
race are nevertheless included because they may capture residual variance in individual criminal
propensity not fully captured by history of prior violence. Age was expected to show the almost
universally reported negative association with misconduct (Gendreau, Goggin, & Law, 1997).
Since the effect of age cannot extend indefinitely, the square of age was also included in models
to allow the linear effect of age to taper off at some point. For sex, we expected males to be more
involved in misconduct even after controlling for prior history of propensity. Citizenship was
classified into four groups: U.S. citizens, Mexican citizens, Cuban citizens, and other foreign
nationals. U.S. citizens comprised the comparison group when dummy variables were created for
citizenship. No real expectations existed for the effects of citizenship, except to note that non-
U.S. citizens tend to have less known about their previous criminal history than U.S. citizens.
This knowledge is critical to the ability to properly classify inmates during the initial custody
classification.
5We plan to expand the current study to include inmates incarcerated between January 2000 and December2001. In addition to the one month types of analyses conducted here, we will analyze the trends represented in themonthly prison performance measures generated from the misconduct data over the entire time period.
-12-
There was also a control for the amount of time that an inmate was at risk for the type of
misconduct being examined. The at risk variable captured either how long it had been since the
inmate had a prior instance of the misconduct under question or how much time had elapsed
from the current prison admission up to the month used to record misconduct. The latter
definition was used if the inmate had no prior history of misconduct. Regardless, the at risk
variable does not include time that the inmate spent outside of a main prison, either during
transport, time spent in jails awaiting trial, etc.
DATA AND METHODS
The data collected covered inmates who were incarcerated during June 2001 in the
Federal Bureau of Prisons.5 The BOP electronically records inmate information in areas such as
educational and psychological programming, medical care, disciplinary infractions, and inmate
movement. We were able to use archival information generated from the normal backup process
used for these databases, collectively known as SENTRY, to create the data sets for our analysis.
The individual-level demographic, criminal history, and misconduct data taken from SENTRY
were supplemented with data taken from a management information system used by BOP
managers that is known as Key Indicators/Strategic Support System (KI/SSS). The KI/SSS
system summarizes data from SENTRY and other data sources for managerial consumption.
Most of the information we captured from KI/SSS pertained to aggregate staff characteristics.
The need to include staff information in our analyses did generate problems. The staff
data summarized in KI/SSS were taken from the personnel data maintained for the BOP. Staff

-13-
are identified as working at a specific institution based on the budget codes for the respective
prisons. One problem is that workers at private prisons under contract with the BOP are not paid
by the BOP directly, so there is no corresponding information for private prison workers in the
personnel database or any other centralized database maintained by the BOP. In addition, there is
a problem with the availability of staff data for minimum security satellite camps. Many
institutions incarcerating more secure inmates, such as heavily staffed medium- and high-
security prisons, have lightly staffed camp facilities located in close proximity. The relationship
between the camp and main institution is reciprocal. The camp benefits by not having to run full
kitchen operations, medical operations, and other functions since these services are available
from the main facility. The main institution benefits by having a work cadre of minimum-
security inmates to perform tasks outside of the secure perimeter of the main prison. The
problem for our analysis is that workers split their time at both facilities, and it is impossible to
determine from the automated systems which staff are assigned to the camps. As such, in
analyses where we include staff data, we were also forced to drop inmates at satellite camps from
the analyses.
To deal with the problem of missing staff data, and because we were very interested in
examining the performance of the private prisons under contract to the BOP, we ran two sets of
models, with and without staff data. In the models without staff data, we were able to include all
facilities including the satellite camps and private prisons. In the results and discussion sections,
we discuss the ramifications of not including the staff data in the models of inmate misconduct.
In essence, we examine whether the other covariates in the models are sensitive to the exclusion
of the staff data, and we correlate the prison performance measures generated from the respective
6Ideally, the method would also account for the movement of inmates between institutions during the timeperiod being examined. Multiple membership models allow for this structure in the data (Browne & Goldstein, 2001;Hill & Goldstein, 1998). Unfortunately, the software we used (HLM) does not allow for multiple membershipmodels. This is not critical in our analysis as 94.7 percent of inmates are in only one institution during June 2001. In
-14-
models to assess whether it is possible to trust the performance measures from models that
exclude staff information.
Since the data are operational data, the problem of other types of missing data were
greatly minimized. The only variable (other than the variables generated with staff data) for
which there was significant amounts of missing data was for the variable measuring custody
classification at intake. For the analysis of all inmates, there were 127,894 inmates available for
analysis. However, 6,843 (or 5.3 percent) inmates were excluded from the analyses because they
were missing custody classification information. Primarily, the only individuals in the BOP
without an initial custody classification are pre-trial inmates or inmates in other special statuses
(such as individuals brought in by prosecutors for psychological evaluations). Because of the
small amount of missing data, cases with missing data for any of the models were deleted from
the model under consideration. Thus, the inferences we draw from these analyses pertain to
sentenced prisoners.
The general methodological plan was as follows. We compared the current BOP
technique for evaluating institution performance with respect to inmate misconduct (which are
monthly rates for the various types of misconduct) with a method that adjusts for the types of
individuals housed in the facilities (including their prior institution misconduct) and aggregate
characteristics of the prisons (e.g., crowding and the aggregate composition of inmates and
staff). To do this, we invoked a multilevel approach that accounts for the nesting of inmates
within different prisons.6 Such techniques are now common in the social sciences, and several
preliminary analyses not reported here, we compared models with inmates who were only at one institution tomodels with all inmates and found no substantive differences. We assigned those inmates who were at more than oneprison to the prison where they spent the most time. Only 0.6 percent of the inmates spent less than 50 percent oftheir time at their institution as determined by this method.
-15-
log( )
( )prob Y
prob YXij
ijj ij
=
− =
= + ∑
11 1 0β β
Level 1:
β γ γ0 00 0j jW u= + ∑ +Level 2:
applications in criminology and penology have been published in addition to the study by
Wooldredge et al. previously discussed (Camp, Saylor, & Harer, 1997; Horney, Osgood, &
Haen, 1995; Sampson & Raudenbush, 1999).
Since the counts of misconduct in any one month period are relatively low for inmates
engaged in misconduct, we dichotomized our outcome variables. The models were “intercepts as
outcomes” in HLM jargon, meaning that the intercepts were the only level-1 coefficients treated
as random and modeled at level-2. Schematically, the logistic models were as follow:
The $X represent the effects of the fixed, level-1 coefficients. Level-1 coefficients were entered
to control for age, race, Hispanic ethnicity, sex, time at risk of misconduct, citizenship, count of
prior instances of misconduct, and initial custody classification score. Continuous variables–age,
time at risk, count of prior misconduct, and the custody classification score–were centered
around the respective grand means. Centering produces meaningful values of the intercept (the
expected value when all independent variables take on a value of 0) and provides numerical
stability during estimation. Dummy variables were not centered as 0 is already a meaningful

7Satellite low facilities are a recent innovation in the BOP. Because foreign citizens who may be deported atthe completion of their sentence are prohibited by policy from serving time in prison camps, inmates who areotherwise of the lowest risk have traditionally served time in the more secure (and costly) low-security prisons.Satellite low facilities are a compromise. They are staffed more like prison camps and are associated with mainfacilities, but they have more perimeter security than the typical prison camp. There are other inmates who qualifyfor satellite lows than foreign citizens, but this is the largest group in the new type of facility.
-16-
value for these variables. An error term at level-1 was not included in the equation as the value
for the error term is fixed in logistic models to allow model identification.
The intercepts in the level-1 equations, the $0j, were modeled with the level-2 aggregate
measures, the (W, and the unique contribution of each facility, the u0j. The u0j form the
performance measures, or how much the level of misconduct is pushed up or down for the
typical inmate by serving time at the prison in question. The (W terms included crowding
(ecological), average inmate age (demographic), the normalized integration index for race
(demographic), the average custody classification score (collective criminality), and whether the
institution was in activation (aggregate staff-inmate relations). In some of the models without
staff characteristics, an aggregate dummy variable for the facility type of satellite low was
included.7 For some types of misconduct, this variable was dropped when the models failed to
converge. For the models using inmates who were not in private prisons or satellite camps, the
level-2 models of the intercepts also included additional staff-inmate relationship variables
including variables for the percentage of staff in their first year of employment, the percentage of
female staff, and the percentage of white staff.
To assess both the correspondence between models with staff variables and models
without, as well as the correspondence between measures of prison performance as traditionally
defined by the BOP (unadjusted rates) and as calculated here, correlations were computed
between the respective ratings. Spearman rho correlations were used in favor of the traditional

-17-
Pearson correlation coefficients. The rho statistic allows for comparing the rankings produced by
different models, which is our main interest. For one selected type of misconduct, graphs are
presented to further highlight the findings of the correlation analysis that demonstrates certain
models of misconduct are more appropriate for constructing comparisons than others. Finally, a
different type of graph is presented, called a “caterpillar” plot, to demonstrate how prisons can
be compared with the performance measures derived from the HLM models.
RESULTS
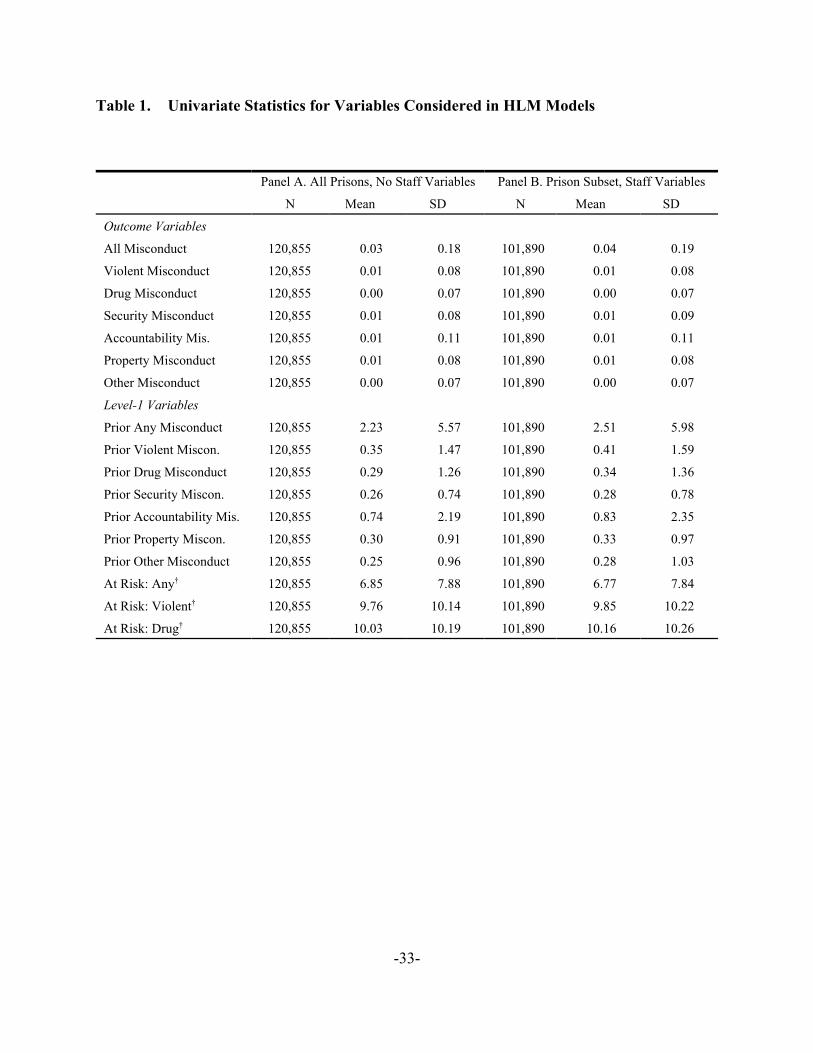
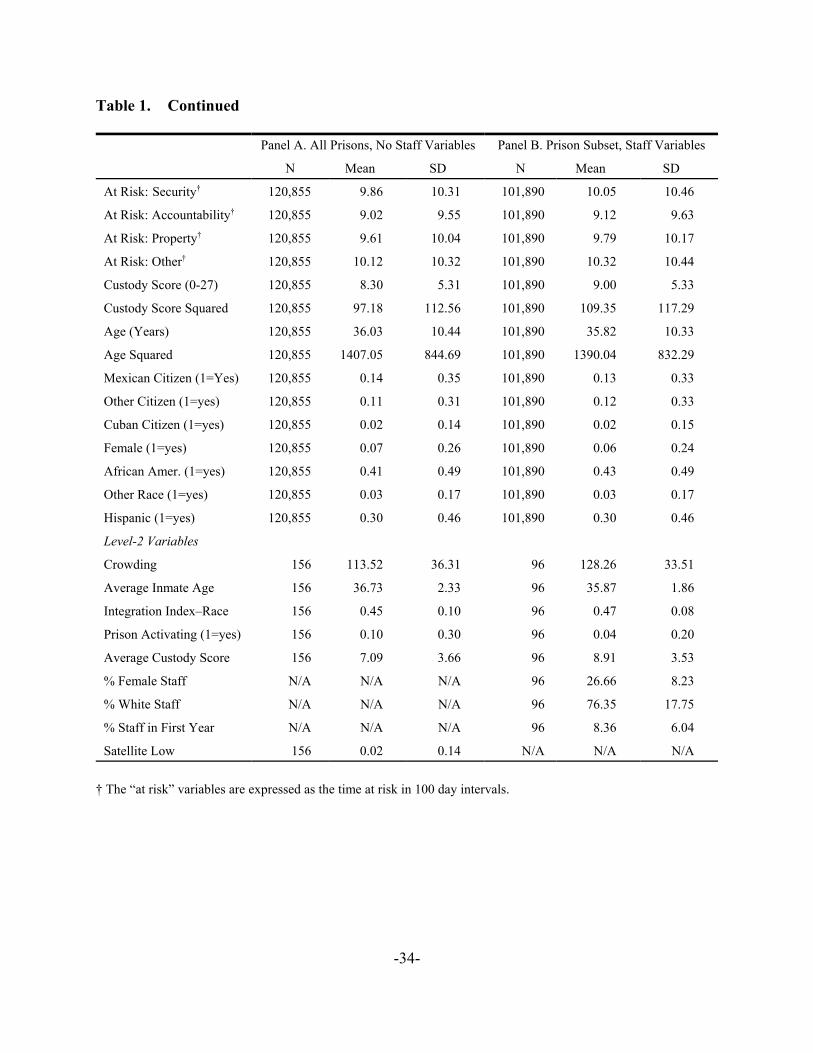
Descriptive statistics for the two data sets that were analyzed are presented in Table 1.
Panel A of Table 1 presents the results for all inmates under the supervision of the BOP whether
in a BOP-operated prison or a prison operated for the BOP by a private vendor. While the
models based on the data presented in Panel A are all-inclusive of the sentenced inmates at the
BOP, the database does not include information on the staff variables as this information was not
available for BOP satellite camp facilities and private prisons. Panel B of Table 1 presents the
information for the data analyzed on only BOP prisons, excluding private prisons and satellite
camps. For the remainder of this paper, for parsimony, we will sometimes refer to the data set
containing all of the sentenced inmates as the “inclusive” data set and the data set limited to
inmates in institutions excluding private prisons and satellite camps as the “limited” data set.
All of the outcome variables listed in Table 1 are dichotomies, where “1" indicates that
there was an instance of misconduct. As such, the means reported in Table 1 for the outcomes
represent the proportion of inmates with the misconduct in question. For example, the value of
0.03 for all misconduct means that in June of 2001 about 3 percent of BOP inmates were
involved in some type of misconduct. The other variables that received a dummy coding of 0 and
8Because of the large amount of information that could have been presented for the fourteen modelsexamined here, we had to make some decisions about condensing the information. To make the information mostcompact, we decided to simply present the odds ratios for the coefficients in the models with an indication ofwhether the variable attained significance at the p=.05 level for aggregate effects and p=.01 for individual-leveleffects.With over 100,000 observations at the individual level, a reviewer felt that we needed to increase the level ofcertainty for these coefficients. We do not show it in the tables, but the variance for the performance measures, theempirical Bayes estimates, taken from the HLM models are significant in all fourteen models.
9Because of space limitations, the t-values for the coefficients are not presented, but complete results areavailable from the authors upon request. Since the coefficients presented in the table are all odds ratios, a positivecoefficient is denoted by an odds ratio in excess of 1, and a negative coefficient for a variable produced an odds ratioless than one. For example, for a dummy variable, an odds ratio of .75 would mean that the variable produced a 25percent drop in the likelihood of the outcome. Conversely, an odds ratio for a dummy variable of 1.22 would mean
-18-
1 are interpretable in the same manner. For example, the value of 0.07 for female means that 7
percent of the BOP inmates held in June 2001 were women. The other statistics presented in
Table 1 are self-evident.
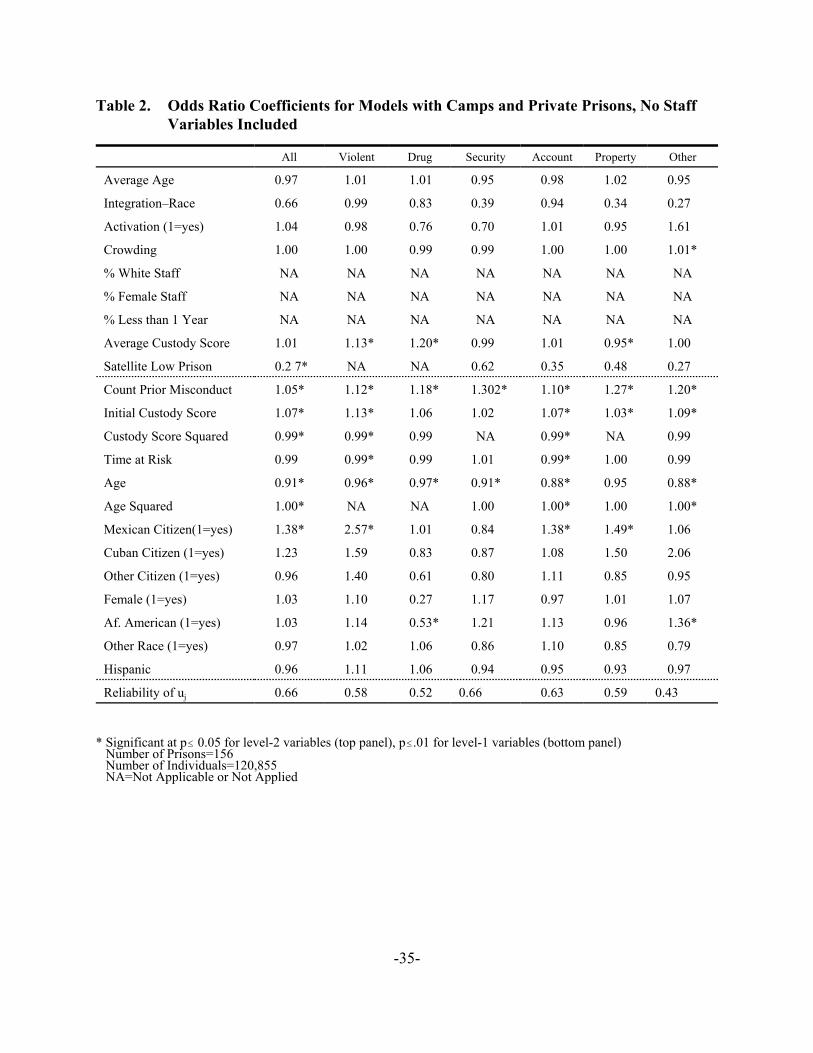
Since we examined all misconduct considered together as well as categorized, plus we
ran the models against all prisons where the level-2 staff variables were excluded (inclusive data
set) and a subset of prisons where the level-2 staff data were included (limited data set), we
generated fourteen separate models. This was a daunting amount of information to present and
discuss. We simplified the presentation by organizing the discussion around the impact of the
covariates at the different levels instead of stepping through the models one by one. At the end of
the results section, we also discuss the performance measures obtained from the empirical Bayes
residuals of the models.8
Effects of Individual-Level Characteristics upon Misconduct
At the individual level, there were two consistent findings across all models, regardless
of how misconduct was categorized. First, the count of previous instances of the type of
misconduct being modeled as an outcome was positive and significant, and the effect was the
strongest predictor during the month in question.9 The t-values for this variable are the largest in
that the dummy variable produced a 22 percent increase in the likelihood of the event.
-19-
any of the models examined here, both for the inclusive and limited data sets. Individuals with
higher counts of prior misconduct were more likely to be involved in a current instance of
misconduct. Another consistent finding was the effect of age. All other things being equal, older
inmates were less likely to be engaged in misconduct than younger inmates. Age was significant
across all categories of misconduct, and the finding held for both the inclusive and limited data
sets, with one exception. Age was not significant for property offenses when all prisons were
included in the model. The findings for age and count of prior misconduct were expected given
prior research.
The effect of age was curvilinear in many of the models, as noted by the positive and
significant coefficient for the squared term for age. However, the squared term for age when
entered into some models caused both the main effect of age as well as the squared term to
become nonsignificant. In these models, the squared term for age was removed, and the negative
and significant main effect for age was restored. The squared term for age was not entered into
models of either the inclusive or limited data sets for analyses of violent misconduct and drug
misconduct. In addition, the squared term for age was not entered into the model of property
misconduct for the analysis of the limited data set that included the additional staff variables.
In addition to the count of prior instances of misconduct, another actuarial type of
variable was significant in most of the models, the base custody score that the inmates had upon
admission to incarceration. Inmates with more serious histories of criminal behavior were at
greater likelihood of a current instance of misconduct. This result held in all models except for
the models of drug and security-related misconduct. Inmates with more serious histories of
10In models not reported here, being African American did increase the likelihood of having a history ofviolent misconduct. So, in our population of inmates, blacks were more likely than whites to have been convicted inthe past for a violent act, but they were at no greater risk in a given month once previous history was known.
-20-
criminal behavior were no more likely to be found guilty of a drug violation or a breach of
security than other inmates. A nonsignificant finding was also noted for property offenses, but
only when the data were restricted to the prisons for which staff data were available. As can be
seen in the results of the models, the effect of custody score was not always linear as the squared
custody score attained significance and was negative in many of the models. This simply means
that the rate at which misconduct increases was lower at higher levels of the custody score than it
was at the lower levels.
Other demographic variables examined presented some interesting results. For the sex
variable, females only differed significantly from males in the model of drug misconduct, and
that finding only held in the model run against the limited data set that excluded minimum
security prisons. In these prisons, females were less likely than males to be involved in drug
misconduct. But after controlling for the other variables in the model, both at the individual and
aggregate levels, females did not differ from males in their likelihood to be involved in the other
forms of misconduct. The race variables were also not usually significant in the models
examined. The coefficients for the other race variable never attained significance in the models,
indicating that other race individuals did not differ from whites in their likelihood of misconduct.
Being African American was only significant in raising the likelihood of misconduct for a few
categories. It is also notable that being African American did not raise the likelihood of being
involved in violent misconduct as reported by Harer and Steffensmeier (1996).10 Another
interesting finding for African Americans is that they were less likely to be found guilty for a

11In analyses not reported here, a model of security-related was run that did not include the staff variablesand only included the institutions for which staff data were available. The coefficients for African American werenot significant in these models suggesting that the nonsignificant results reported in Table 3 were a product of therestricted data and not the model specification.
-21-
drug misconduct. This finding replicates the finding reported by Harer and Steffensmeier and
holds in models with and without the staff variables.
Being African American consistently raise the likelihood of only one category of
misconduct, the other types of misconduct.11 Interestingly, Hispanics did not differ from non-
Hispanics in their likelihood of misconduct in any of the categorizations of misconduct.
Citizenship variables did make a difference in many of the models, but only Mexican
citizenship. We attribute this finding to the fact that prior record is often unknown or otherwise
underestimated for Mexican citizens – with the result that citizenship becomes an indicator of
criminal propensity. Of course, it would seem that the same logic should have been true for
Cubans and citizens in the other citizenship category, but it was not.
Finally, at the individual level, the effect of time at risk was consistently significant for
only one category of misconduct, although not for all misconduct considered together. Time at
risk was significant, lowering the odds of misconduct in both the inclusive and limited data sets
for accountability types of misconduct. Inmates who had longer periods without an instance of
misconduct were less likely to have any instance of that misconduct. This same effect was noted
for violence but only when the data covered all prisons and the models did not include staff
variables.
Effects of Aggregate-Level Characteristics upon Misconduct
The aggregate inmate variable that showed up consistently whether the models included
staff variables or not was the average security level of inmates at the prison, but it was not a
-22-
significant predictor in all models. The average security level of inmates was not important in
predicting all types of misconduct considered together, but it was significant in predicting some
types of misconduct that are of special concern to prison administrators, namely violent
misconduct and drug misconduct (refer to Tables 2 and 3). For both of these measures, the
effects of being in a prison with more inmates having a higher collective propensity to crime was
to increase the level of these forms of misconduct. Interestingly, the effect of the collective
propensity was reversed for property types of misconduct. The effect of being in a prison with
inmates having a higher collective criminal propensity was to reduce the odds of a property
offense, although the effect was only significant in the model using all prisons and no staff
variables.
For the other aggregate inmate variables, e.g., average age of inmates, the integration
index for race, and crowding, the effects were nonsignificant in most of the models, and where
the effects were significant, they attained significance in the models of the limited data set for
which staff data were available. The effect of crowding was significant in only two of the
fourteen models. Crowding increased the odds of other misconduct in both the inclusive and
limited data sets by a half percent in the month under study.
The integration index for race did not have a significant effect upon any of the
categorizations of misconduct when the data came from all of the prisons. It did have a
significant effect upon one model when the staff variables were included and the prisons were
limited to those with staff data. In the models of security-related misconduct, the effect of more
racially integrated prisons was to lower the likelihood that the typical inmate would be involved

-23-
in these types of misconduct. Generally speaking, the average age of inmates at the prisons did
not have a significant effect upon misconduct categorized in the different ways examined here.
The findings for the aggregate staff variables depended upon the category of misconduct.
For the model of all misconduct, both the percentage of staff who were female and the
percentage of staff who were white were linked with misconduct. At institutions with higher
percentages of white and female staff, the typical inmate was more likely to be involved in all
forms of misconduct considered together. The percentage of white staff was also positively
associated with misconduct in the models for accountability types of misconduct and property
misconduct. In short, the finding that prisons with greater numbers of white staff had more
misconduct of all types was “pushed” by more innocuous forms of misbehavior. Percentage of
white staff was not significant in models of violence and drug use.
A similar pattern is noted for the finding for percentage of female staff for all types of
misconduct considered together. The percentage of female staff is positively associated with
misconduct in models of drug use and accountability. Drug use is a particular concern to prison
administrators, but there was no significant finding for violent misconduct.
The finding for the last staff aggregate variable, the percentage of staff working in their
first year, was not significant for the majority of the models. Only the models for security-related
misconduct showed a significant effect for inexperienced staff. For these models, having higher
numbers of staff in their first year on the job increased the likelihood that the typical inmate
would be convicted of this type of misconduct.
Measures of Institution Impact Upon Misconduct
-24-
The consequences of the different choices for measures of institutional performance can
be understood from Table 4. In the column labeled, “Correlation with Models Containing Staff
Information,” the ranks of institutions based upon the HLM models of the inclusive data sets
were compared to the ranks of institutions based upon HLM analyses of the limited data sets.
The latter contained level-2 aggregate staffing data. The correlations indicate that for most
categories of misconduct, the rankings of institutions based upon results from models with level-
2 staffing covariates produce different results than models without these variables. For some
categories of misconduct (notably for violent misconduct), the correlations between the results
produced by the different models were quite high, in excess of 0.95. However, for the model of
drug misconduct (see Table 3 above), the correlation between the respective models was only
0.872. While this may seem to be a large correlation by the usual standards of the social
sciences, the correlation masks the fact that the rankings produced by the different measures can
be quite discrepant.
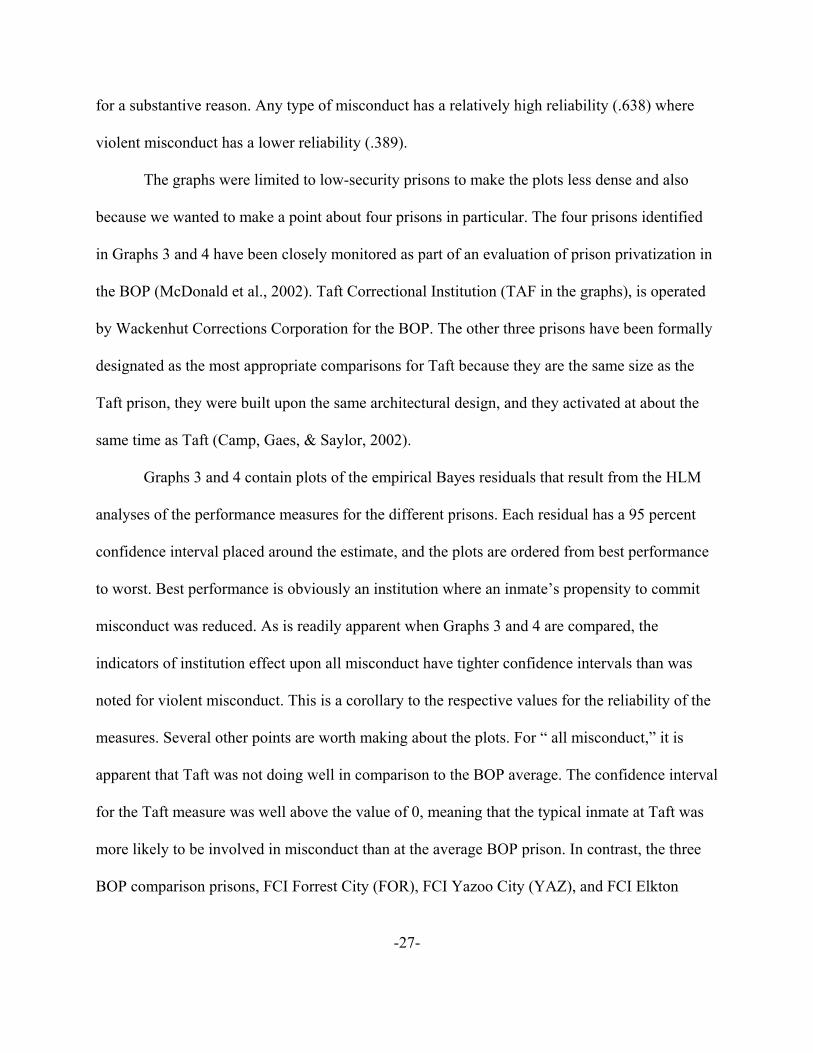
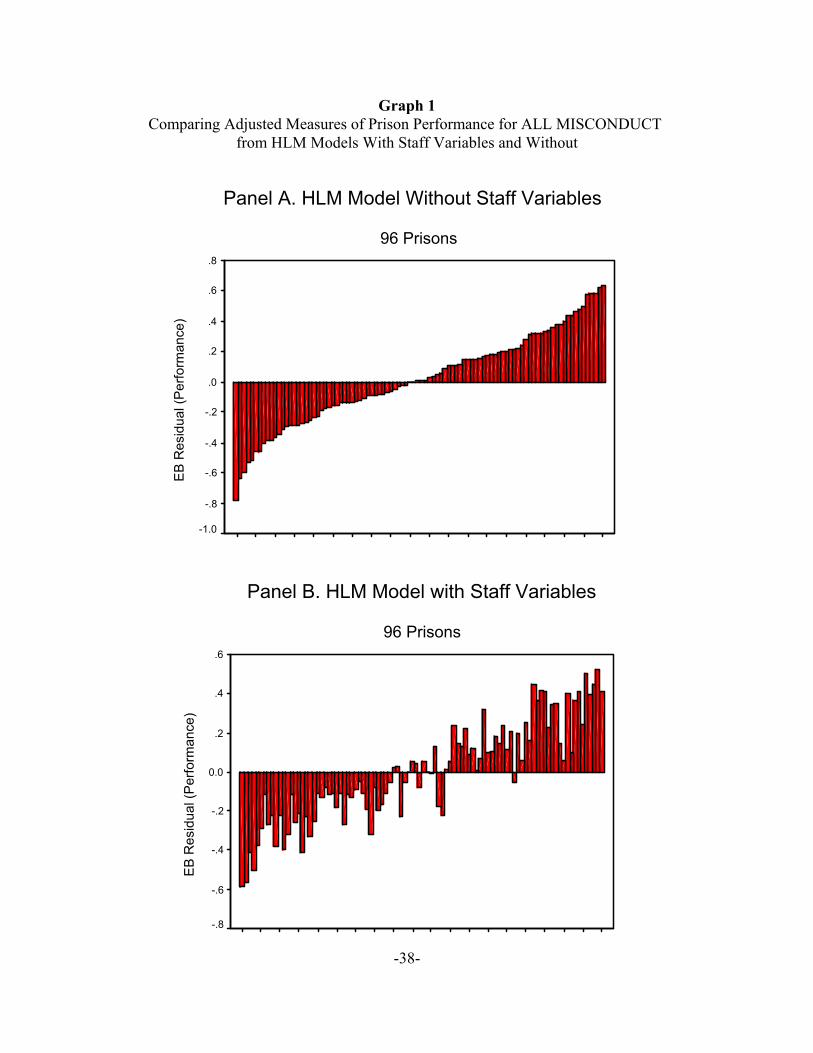
For example, Graph 1 presents the results for the different HLM measures of all
misconduct for the 96 prisons for which there was staff information available. The two HLM-
produced measures of performance correlated at 0.917 as shown in Table 4. In the top panel of
the graph, the institutions are presented in the order in which they ranked on the outcome
measure as defined by the model for all prisons where level-2 staff variables were not included.
In the bottom panel of the graph, the same ordering of institutions is used, but now the
performance measure is based upon the model that included level-2 information representing
contextual information about staff. As can be seen in the graph, there are some institutions for
which the inclusion of the aggregate staff characteristics produced large differences. There are
-25-
three institutions, in particular, that ranked fairly high on estimated inmate misconduct when the
measure was determined by the model excluding level-2 staff variables. Ranking high on these
graphs is not good because that means the institution is above the BOP average. When level-2
staff covariates were added, these institutions were still above their respective expected values,
but they were only marginally higher.
Table 4 also shows that the unadjusted measures of prison performance (the raw rate of
prison misconduct without any modeling) were simply not adequate. This can be seen in the last
four columns of the table. In the column labeled “Correlation with Unadjusted Rates,” the
correlations of the HLM models for all institutions were compared to unadjusted rates. As can be
seen there, the correlations were more modest than the correlations between the performance
measures generated from the two HLM models. The lowest value was for violent misconduct
where the correlation was only .497. The highest correlation between the HLM results and the
unadjusted results was for security-related misconduct, where the correlation was 0.828. Even
for this measure, the correlation is less than one presented above for the two HLM-produced
measures of performance for all misconduct. And in that example, we saw significant differences
in the rankings of institutions. In the last three columns of Table 4, an alternative measure is
presented to represent the relationship between the unadjusted and the HLM-produced measures.
The displacement of rankings was calculated as the difference between the ranking score
(from 1 to 156) produced by using unadjusted rates and the HLM-produced performance scores.
The absolute value of the difference was then taken to compute the median difference. As can be
seen in Table 4, the median differences were quite striking. Take all misconduct, for example.
For all misconduct, the typical institution moved 28 places (either up or down) as the result of
-26-
basing the measure of performance on HLM-produced results instead of unadjusted measures.
The range is also presented in Table 4. For all misconduct, the range of change varied between 0
and 138. At least one institution moved 138 places depending upon which model of prison
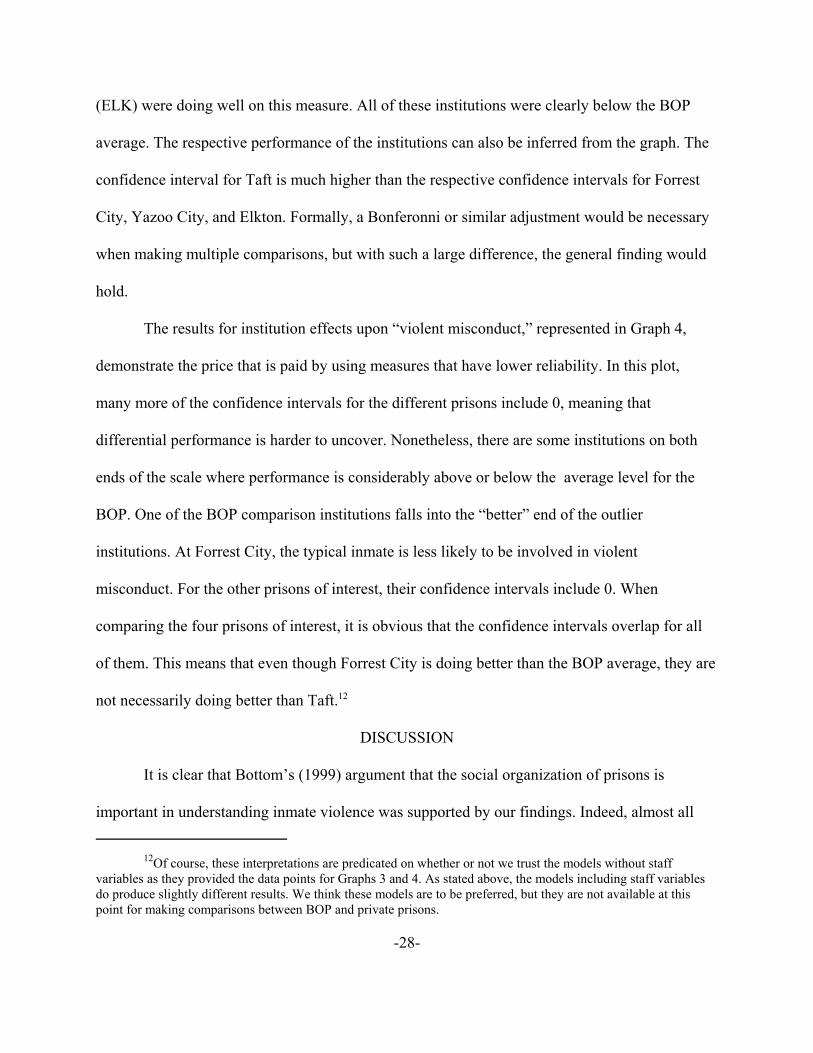
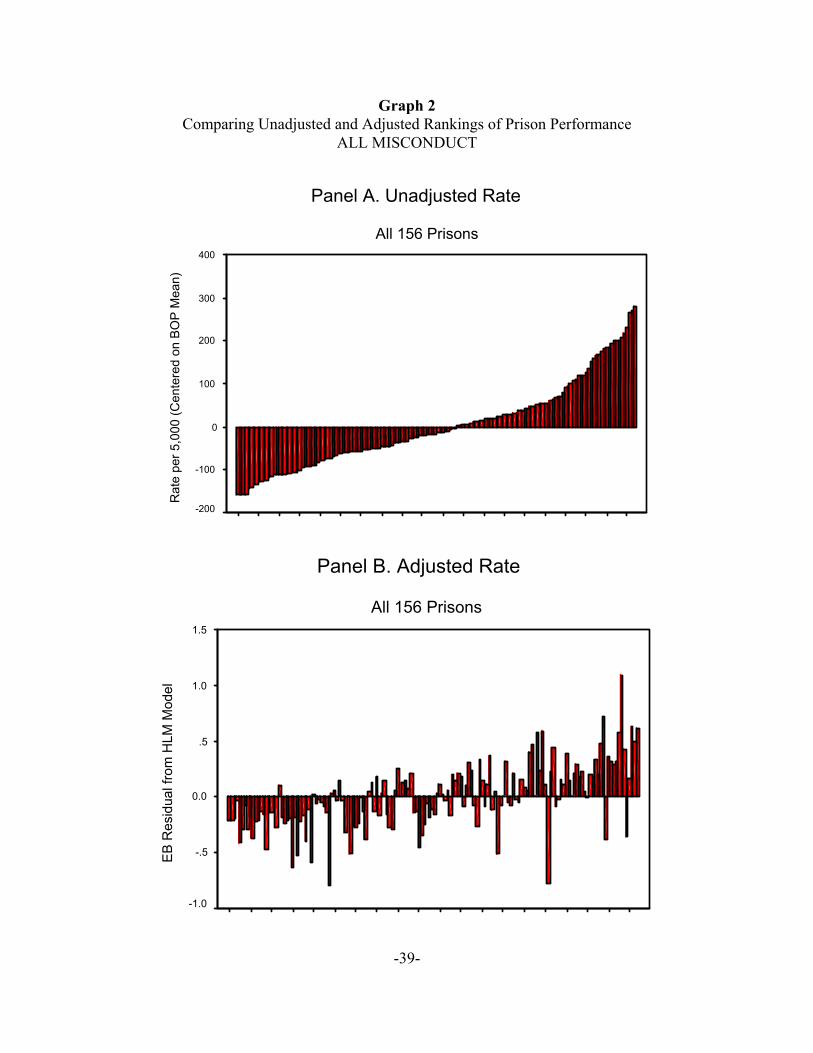
performance was used. The results are similar for the other measures. Another way to make this
comparison is with a graph similar to that used to compare the two HLM-produced measures of
prison performance. In Graph 2, all 156 institutions are ranked on the unadjusted measure of all
misconduct in the top panel of the graph. In the bottom panel, the same ranking of institutions is
used, but the measure of prison performance is based upon the results of the HLM analyses. As
can be seen in Graph 2, the differences were quite noticeable. In particular, two institutions who
were on the far right side of the graph, indicating poor performance were actually doing quite
well when the factors known to influence misconduct were entered into the HLM model, and
thus controlled. These institutions actually had lower levels of misconduct than expected.
Although it is not the intention of this paper to compare the performance of all of the
BOP and private prisons for all of the measures of misconduct presented here, it is our intention
to demonstrate how readily the information from HLM models can be presented graphically to
illustrate the relative performance of different prisons. While the actual values of the measures
are not readily understood, the comparative performance of different prisons as well as whether a
specific prison is significantly above or below the BOP average performance is easily
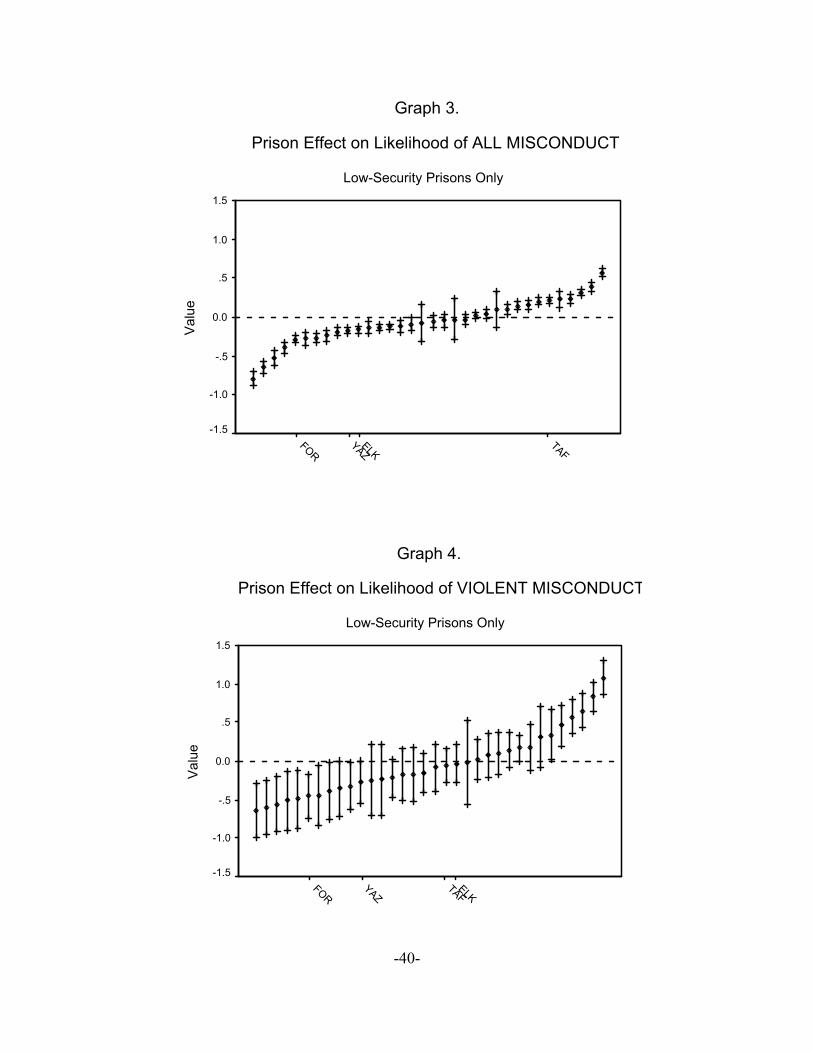
determined. Caterpillar graphs for all types of misconduct and violent misconduct are presented,
respectively, in Graphs 3 and 4. The models were based upon all prisons, even though we
recognize that the models that included staff variables were superior. The two measures were
deliberately chosen because of their methodological properties, and we wanted to use all prisons
-27-
for a substantive reason. Any type of misconduct has a relatively high reliability (.638) where
violent misconduct has a lower reliability (.389).
The graphs were limited to low-security prisons to make the plots less dense and also
because we wanted to make a point about four prisons in particular. The four prisons identified
in Graphs 3 and 4 have been closely monitored as part of an evaluation of prison privatization in
the BOP (McDonald et al., 2002). Taft Correctional Institution (TAF in the graphs), is operated
by Wackenhut Corrections Corporation for the BOP. The other three prisons have been formally
designated as the most appropriate comparisons for Taft because they are the same size as the
Taft prison, they were built upon the same architectural design, and they activated at about the
same time as Taft (Camp, Gaes, & Saylor, 2002).
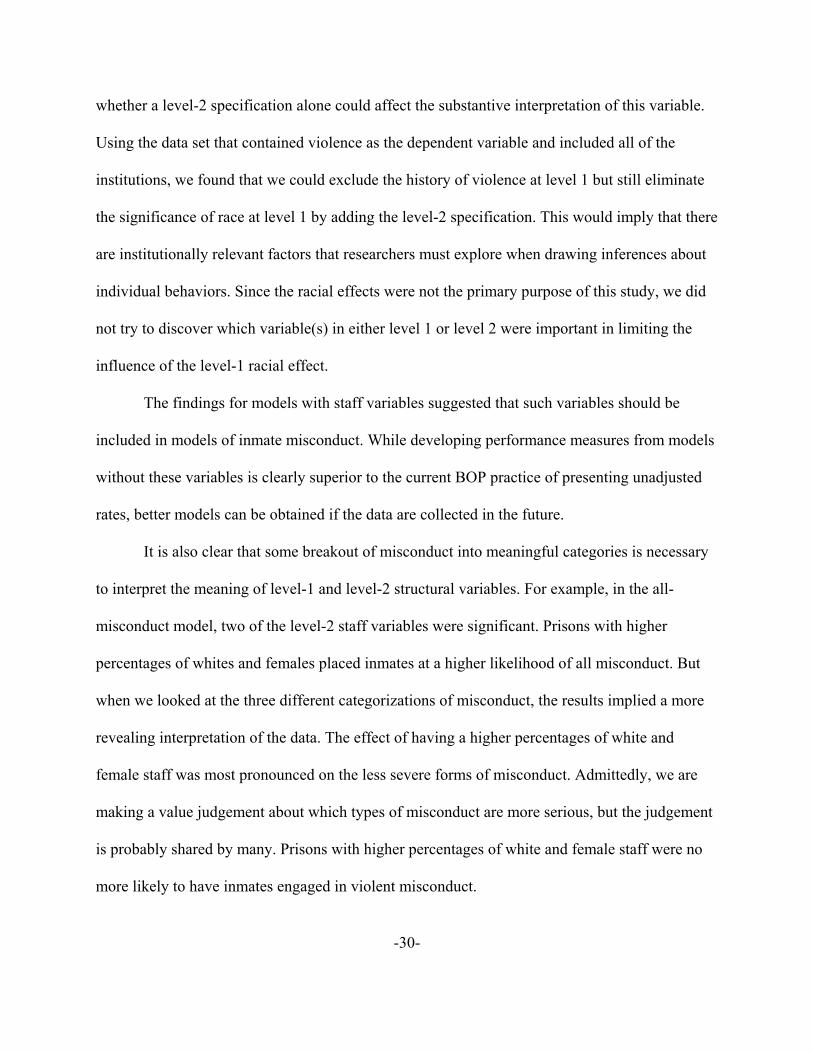
Graphs 3 and 4 contain plots of the empirical Bayes residuals that result from the HLM
analyses of the performance measures for the different prisons. Each residual has a 95 percent
confidence interval placed around the estimate, and the plots are ordered from best performance
to worst. Best performance is obviously an institution where an inmate’s propensity to commit
misconduct was reduced. As is readily apparent when Graphs 3 and 4 are compared, the
indicators of institution effect upon all misconduct have tighter confidence intervals than was
noted for violent misconduct. This is a corollary to the respective values for the reliability of the
measures. Several other points are worth making about the plots. For “ all misconduct,” it is
apparent that Taft was not doing well in comparison to the BOP average. The confidence interval
for the Taft measure was well above the value of 0, meaning that the typical inmate at Taft was
more likely to be involved in misconduct than at the average BOP prison. In contrast, the three
BOP comparison prisons, FCI Forrest City (FOR), FCI Yazoo City (YAZ), and FCI Elkton
12Of course, these interpretations are predicated on whether or not we trust the models without staffvariables as they provided the data points for Graphs 3 and 4. As stated above, the models including staff variablesdo produce slightly different results. We think these models are to be preferred, but they are not available at thispoint for making comparisons between BOP and private prisons.
-28-
(ELK) were doing well on this measure. All of these institutions were clearly below the BOP
average. The respective performance of the institutions can also be inferred from the graph. The
confidence interval for Taft is much higher than the respective confidence intervals for Forrest
City, Yazoo City, and Elkton. Formally, a Bonferonni or similar adjustment would be necessary
when making multiple comparisons, but with such a large difference, the general finding would
hold.
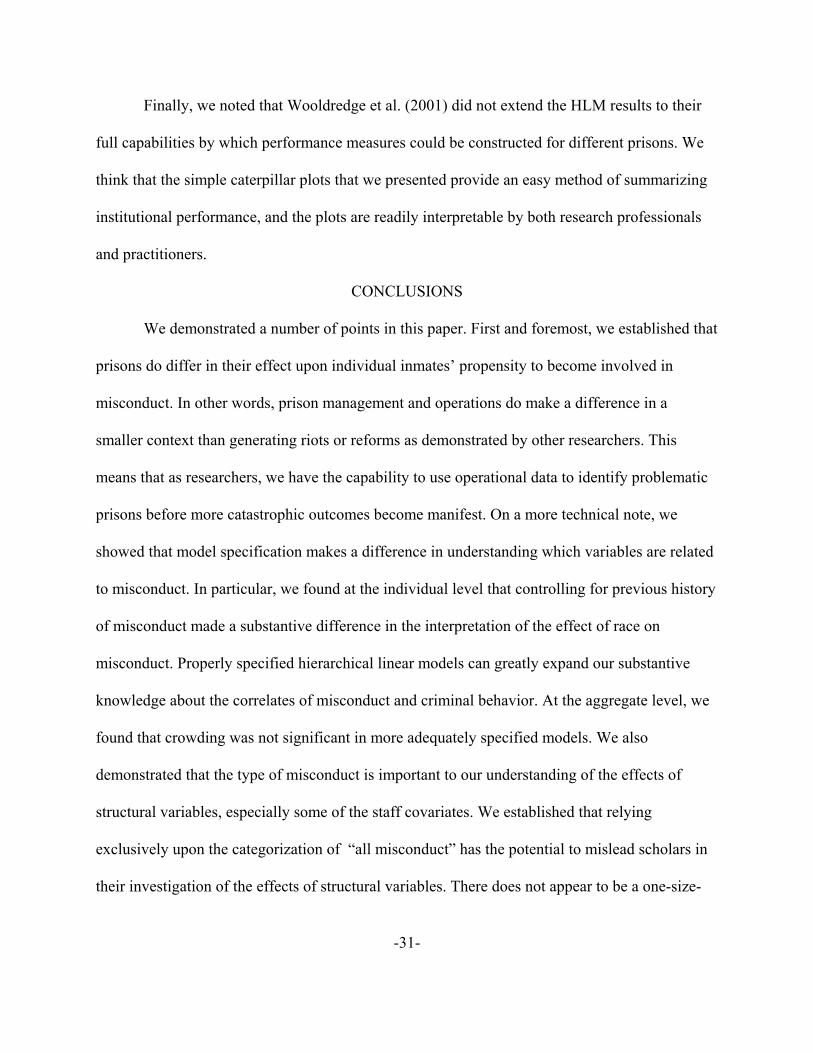
The results for institution effects upon “violent misconduct,” represented in Graph 4,
demonstrate the price that is paid by using measures that have lower reliability. In this plot,
many more of the confidence intervals for the different prisons include 0, meaning that
differential performance is harder to uncover. Nonetheless, there are some institutions on both
ends of the scale where performance is considerably above or below the average level for the
BOP. One of the BOP comparison institutions falls into the “better” end of the outlier
institutions. At Forrest City, the typical inmate is less likely to be involved in violent
misconduct. For the other prisons of interest, their confidence intervals include 0. When
comparing the four prisons of interest, it is obvious that the confidence intervals overlap for all
of them. This means that even though Forrest City is doing better than the BOP average, they are
not necessarily doing better than Taft.12
DISCUSSION
It is clear that Bottom’s (1999) argument that the social organization of prisons is
important in understanding inmate violence was supported by our findings. Indeed, almost all

-29-
inmate misconduct is affected by institution context. While we were not able to explicitly
operationalize all of Bottom’s theoretical components, we feel that we clearly demonstrated that
compositional and contextual effects of staff, inmate, and ecological variables impact the
probability of many forms of misconduct in addition to, and separate from, individual-level
characteristics of inmates. Future research must uncover the most relevant aspects of the prison
organization following theoretical proposals by Bottoms and others.
At the outset of the paper, we noted that Wooldredge et al. had provided a promising
start in demonstrating the effectiveness of using hierarchical linear models to examine prison
misconduct. We also noted that significant methodological work remained, to tease out the
consequences of model specification, to specify the appropriate types of misconduct to analyze,
and to demonstrate how HLM models can be used to generate performance measures for prisons.
The results from the various models we have presented shows the importance of model
specification. For example, where Woodredge et al. found a significant and positive effect for
inmate crowding, we rarely found such an impact when we entered other variables at level-2 of
the models. In analyses not reported here, we did reproduce the positive and significant effect for
crowding when it was the only level-2 variable, similar to the specification used by Woodredge
et al. That specification was not adequate on theoretical or methodological grounds. Also, we
saw that proper model specification made a difference for individual-level variables. For most
forms of misconduct, we did not replicate the positive association between misconduct and being
African American that others have reported. As we noted, this was due to our level-1
specification. Adding the relevant history of misconduct to the level-1 specification vitiated the
effect. Because race is such an important and politically sensitive variable, we also tested
-30-
whether a level-2 specification alone could affect the substantive interpretation of this variable.
Using the data set that contained violence as the dependent variable and included all of the
institutions, we found that we could exclude the history of violence at level 1 but still eliminate
the significance of race at level 1 by adding the level-2 specification. This would imply that there
are institutionally relevant factors that researchers must explore when drawing inferences about
individual behaviors. Since the racial effects were not the primary purpose of this study, we did
not try to discover which variable(s) in either level 1 or level 2 were important in limiting the
influence of the level-1 racial effect.
The findings for models with staff variables suggested that such variables should be
included in models of inmate misconduct. While developing performance measures from models
without these variables is clearly superior to the current BOP practice of presenting unadjusted
rates, better models can be obtained if the data are collected in the future.
It is also clear that some breakout of misconduct into meaningful categories is necessary
to interpret the meaning of level-1 and level-2 structural variables. For example, in the all-
misconduct model, two of the level-2 staff variables were significant. Prisons with higher
percentages of whites and females placed inmates at a higher likelihood of all misconduct. But
when we looked at the three different categorizations of misconduct, the results implied a more
revealing interpretation of the data. The effect of having a higher percentages of white and
female staff was most pronounced on the less severe forms of misconduct. Admittedly, we are
making a value judgement about which types of misconduct are more serious, but the judgement
is probably shared by many. Prisons with higher percentages of white and female staff were no
more likely to have inmates engaged in violent misconduct.
-31-
Finally, we noted that Wooldredge et al. (2001) did not extend the HLM results to their
full capabilities by which performance measures could be constructed for different prisons. We
think that the simple caterpillar plots that we presented provide an easy method of summarizing
institutional performance, and the plots are readily interpretable by both research professionals
and practitioners.
CONCLUSIONS
We demonstrated a number of points in this paper. First and foremost, we established that
prisons do differ in their effect upon individual inmates’ propensity to become involved in
misconduct. In other words, prison management and operations do make a difference in a
smaller context than generating riots or reforms as demonstrated by other researchers. This
means that as researchers, we have the capability to use operational data to identify problematic
prisons before more catastrophic outcomes become manifest. On a more technical note, we
showed that model specification makes a difference in understanding which variables are related
to misconduct. In particular, we found at the individual level that controlling for previous history
of misconduct made a substantive difference in the interpretation of the effect of race on
misconduct. Properly specified hierarchical linear models can greatly expand our substantive
knowledge about the correlates of misconduct and criminal behavior. At the aggregate level, we
found that crowding was not significant in more adequately specified models. We also
demonstrated that the type of misconduct is important to our understanding of the effects of
structural variables, especially some of the staff covariates. We established that relying
exclusively upon the categorization of “all misconduct” has the potential to mislead scholars in
their investigation of the effects of structural variables. There does not appear to be a one-size-
-32-
fits-all answer. Finally, we demonstrated how easily the results of HLM models can be used to
generate meaningful comparisons of prison performance, whether our interest in performance is
relevant to the debate about prison privatization or simply motivated by our interest in well-
managed prisons This is consistent with Bottom’s conclusion that the management and social
organization of prisons are equally important as individual-level variables in understanding
prison order.
We maintain that penologists and criminologists must begin to investigate individual-
and aggregate-level influences simultaneously in their models. We are certainly not the first
researchers to sing that tune (see Wooldredge et al., 2001). However, we think that the research
presented here throws down the challenge to researchers who approach prison misconduct in
other ways. Future research must provide a more thorough test of inmate-staff relationships at
the institutional level. Likewise, it would be desirable to have dynamic risk factors at the
individual level in the models, factors that capture such things as motivation to change or
assessments of cognitive deficiencies. Much work remains to be done, but the possibilities are
exciting.
-33-
Table 1. Univariate Statistics for Variables Considered in HLM Models
Panel A. All Prisons, No Staff Variables Panel B. Prison Subset, Staff Variables
N Mean SD N Mean SD
Outcome Variables
All Misconduct 120,855 0.03 0.18 101,890 0.04 0.19
Violent Misconduct 120,855 0.01 0.08 101,890 0.01 0.08
Drug Misconduct 120,855 0.00 0.07 101,890 0.00 0.07
Security Misconduct 120,855 0.01 0.08 101,890 0.01 0.09
Accountability Mis. 120,855 0.01 0.11 101,890 0.01 0.11
Property Misconduct 120,855 0.01 0.08 101,890 0.01 0.08
Other Misconduct 120,855 0.00 0.07 101,890 0.00 0.07
Level-1 Variables
Prior Any Misconduct 120,855 2.23 5.57 101,890 2.51 5.98
Prior Violent Miscon. 120,855 0.35 1.47 101,890 0.41 1.59
Prior Drug Misconduct 120,855 0.29 1.26 101,890 0.34 1.36
Prior Security Miscon. 120,855 0.26 0.74 101,890 0.28 0.78
Prior Accountability Mis. 120,855 0.74 2.19 101,890 0.83 2.35
Prior Property Miscon. 120,855 0.30 0.91 101,890 0.33 0.97
Prior Other Misconduct 120,855 0.25 0.96 101,890 0.28 1.03
At Risk: Any† 120,855 6.85 7.88 101,890 6.77 7.84
At Risk: Violent† 120,855 9.76 10.14 101,890 9.85 10.22
At Risk: Drug† 120,855 10.03 10.19 101,890 10.16 10.26
-34-
Table 1. Continued
Panel A. All Prisons, No Staff Variables Panel B. Prison Subset, Staff Variables
N Mean SD N Mean SD
At Risk: Security† 120,855 9.86 10.31 101,890 10.05 10.46
At Risk: Accountability† 120,855 9.02 9.55 101,890 9.12 9.63
At Risk: Property† 120,855 9.61 10.04 101,890 9.79 10.17
At Risk: Other† 120,855 10.12 10.32 101,890 10.32 10.44
Custody Score (0-27) 120,855 8.30 5.31 101,890 9.00 5.33
Custody Score Squared 120,855 97.18 112.56 101,890 109.35 117.29
Age (Years) 120,855 36.03 10.44 101,890 35.82 10.33
Age Squared 120,855 1407.05 844.69 101,890 1390.04 832.29
Mexican Citizen (1=Yes) 120,855 0.14 0.35 101,890 0.13 0.33
Other Citizen (1=yes) 120,855 0.11 0.31 101,890 0.12 0.33
Cuban Citizen (1=yes) 120,855 0.02 0.14 101,890 0.02 0.15
Female (1=yes) 120,855 0.07 0.26 101,890 0.06 0.24
African Amer. (1=yes) 120,855 0.41 0.49 101,890 0.43 0.49
Other Race (1=yes) 120,855 0.03 0.17 101,890 0.03 0.17
Hispanic (1=yes) 120,855 0.30 0.46 101,890 0.30 0.46
Level-2 Variables
Crowding 156 113.52 36.31 96 128.26 33.51
Average Inmate Age 156 36.73 2.33 96 35.87 1.86
Integration Index–Race 156 0.45 0.10 96 0.47 0.08
Prison Activating (1=yes) 156 0.10 0.30 96 0.04 0.20
Average Custody Score 156 7.09 3.66 96 8.91 3.53
% Female Staff N/A N/A N/A 96 26.66 8.23
% White Staff N/A N/A N/A 96 76.35 17.75
% Staff in First Year N/A N/A N/A 96 8.36 6.04
Satellite Low 156 0.02 0.14 N/A N/A N/A
† The “at risk” variables are expressed as the time at risk in 100 day intervals.
-35-
Table 2. Odds Ratio Coefficients for Models with Camps and Private Prisons, No StaffVariables Included
All Violent Drug Security Account Property Other
Average Age 0.97 1.01 1.01 0.95 0.98 1.02 0.95
Integration–Race 0.66 0.99 0.83 0.39 0.94 0.34 0.27
Activation (1=yes) 1.04 0.98 0.76 0.70 1.01 0.95 1.61
Crowding 1.00 1.00 0.99 0.99 1.00 1.00 1.01*
% White Staff NA NA NA NA NA NA NA
% Female Staff NA NA NA NA NA NA NA
% Less than 1 Year NA NA NA NA NA NA NA
Average Custody Score 1.01 1.13* 1.20* 0.99 1.01 0.95* 1.00
Satellite Low Prison 0.2 7* NA NA 0.62 0.35 0.48 0.27
Count Prior Misconduct 1.05* 1.12* 1.18* 1.302* 1.10* 1.27* 1.20*
Initial Custody Score 1.07* 1.13* 1.06 1.02 1.07* 1.03* 1.09*
Custody Score Squared 0.99* 0.99* 0.99 NA 0.99* NA 0.99
Time at Risk 0.99 0.99* 0.99 1.01 0.99* 1.00 0.99
Age 0.91* 0.96* 0.97* 0.91* 0.88* 0.95 0.88*
Age Squared 1.00* NA NA 1.00 1.00* 1.00 1.00*
Mexican Citizen(1=yes) 1.38* 2.57* 1.01 0.84 1.38* 1.49* 1.06
Cuban Citizen (1=yes) 1.23 1.59 0.83 0.87 1.08 1.50 2.06
Other Citizen (1=yes) 0.96 1.40 0.61 0.80 1.11 0.85 0.95
Female (1=yes) 1.03 1.10 0.27 1.17 0.97 1.01 1.07
Af. American (1=yes) 1.03 1.14 0.53* 1.21 1.13 0.96 1.36*
Other Race (1=yes) 0.97 1.02 1.06 0.86 1.10 0.85 0.79
Hispanic 0.96 1.11 1.06 0.94 0.95 0.93 0.97
Reliability of uj 0.66 0.58 0.52 0.66 0.63 0.59 0.43
* Significant at p# 0.05 for level-2 variables (top panel), p#.01 for level-1 variables (bottom panel) Number of Prisons=156 Number of Individuals=120,855 NA=Not Applicable or Not Applied

-36-
Table 3. Odds Ratio Coefficients for Models without Camps and Private Prisons,Staff Variables Included
All Violent Drug Security Account Property Other
Average Age .96 0.99 0.95 0.96 0.95 1.01 0.95
Integration–Race .38 1.30 0.10 0.11* 0.49 0.39 0.34
Activation (1=yes) 1.02 0.92 0.9 6 0.91 0.80 1.36 1.48
Crowding 1.00 1.00 1.00 1.00 1.00 1.00 1.01*
% White Staff 1.01 * 0.99 0.99 1.00 1.01* 1.01* 1.01
% Female Staff 1.02* 1.02 1.05* 1.00 1.04* 1.01 0.99
% Less than 1 Year 1.01 1.02 1.02 1.03* 1.00 0.99 1.01
Average Custody Score 1.03 1.14* 1.30* 0.98 1.03 0.94 1.01
Satellite Low Prison NA NA NA NA NA NA NA
Count Prior Misconduct 1.05* 1.12* 1.18* 1.31* 1.10* 1.26* 1.20*
Initial Custody Score 1.08* 1.13* 1.03 1.06 1.07* 1.07 1.09*
Custody Score Squared 0.99 * 0.99* 0.99 1.00 0.99* 0.99 0.99
At Risk (per 100 Days) 0.99 0.99 0.99 1.00 0.98* 1.00 0.99
Age 0.91 * 0.96* 0.97* 0.91* 0.88* 0.96* 0.89*
Age Squared 1.00* NA NA 0.98 1.03* 0.94 1.00*
Mexican Cit. (1=yes) 1.41 * 2.65* 0.99 0.89 1.38* 1.52* 1.1 7
Cuban Citizen (1=yes) 1.26 1.59 0.81 0.90 1.12 1.61 2.17
Other Citizen (1=yes) 0.96 1.41 0.63 0.83 1.11 0.91 0.93
Female (1=yes) 0.92 0.74 0.10* 1.32 0.69 1.07 0.99
Af. American (1=yes) 0.92 1.13 0.54* 1.11 1.14 0.93 1.36*
Other Race (1=yes) 0.93 1.01 1.05 0.88 1.04 0.84 0.78
Hispanic 0.95 1.12 1.10 0.89 0.93 0.89 0.97
Reliability of uj 0.74 0.58 0.52 0.66 0.63 0.59 0.43
* Significant at p# 0.05 for level-2 variables (top panel), p#.01 for level-1 variables (bottom panel) Number of Prisons =96 Number of Individuals=101,890 NA=Not Applicable or Not Applied

-37-
Table 4. Comparability of Performance Measures Derived From HLM Models with AllInstitutions (No Staff Variables) with Alternative Definitions
Outcome Variable Correlation withModels ContainingStaff Information
Correlation withUnadjusted Rates
MedianDisplace-
ment*
Min. Dis-placement
Max. Dis-placement
All Misconduct 0.92 0.65 28.0 0 138
Classification 1
Violent Misconduct 0.97 0.50 34.0 1 133
Drug Misconduct 0.87 0.58 25.0 0 129
Security Misconduct 0.9 5 0.83 16.0 0 92
Accountability Miscon. 0.90 0.78 22.0 0 93
Property Misconduct 0.94 0.86 11.8 0 97
Other Misconduct 0.94 0.57 29.5 0 134
* Median Displacement as defined here is the median of the absolute values of the differences in the rankingsproduced with unadjusted rates and the rankings produced with the HLM models for all institutions (withoutstaff variables). The measure is dependent upon the number of items being ranked. In all cases, 156 separateprisons were ranked with the respective measures, so the magnitude of the displacement values for the differenttypes of misconduct can be compared.
-38-
Panel A. HLM Model Without Staff Variables
96 Prisons
EB R
esid
ual (
Perfo
rman
ce)
.8
.6
.4
.2
.0
-.2
-.4
-.6
-.8
-1.0
Panel B. HLM Model with Staff Variables
96 Prisons
EB R
esid
ual (
Perfo
rman
ce)
.6
.4
.2
0.0
-.2
-.4
-.6
-.8
Graph 1Comparing Adjusted Measures of Prison Performance for ALL MISCONDUCT
from HLM Models With Staff Variables and Without
-39-
Panel A. Unadjusted Rate
All 156 Prisons
Rat
e pe
r 5,0
00 (C
ente
red
on B
OP
Mea
n)
400
300
200
100
0
-100
-200
Panel B. Adjusted Rate
All 156 Prisons
EB R
esid
ual f
rom
HLM
Mod
el
1.5
1.0
.5
0.0
-.5
-1.0
Graph 2Comparing Unadjusted and Adjusted Rankings of Prison Performance
ALL MISCONDUCT
-40-
Graph 3.
Prison Effect on Likelihood of ALL MISCONDUCT
Low-Security Prisons Only
TAFELK
YAZFOR
Valu
e1.5
1.0
.5
0.0
-.5
-1.0
-1.5
Graph 4.
Prison Effect on Likelihood of VIOLENT MISCONDUCT
Low-Security Prisons Only
ELKTAF
YAZFOR
Valu
e
1.5
1.0
.5
0.0
-.5
-1.0
-1.5

-41-
REFERENCES
Bottoms, A. (1999). Interpersonal Violence and Social Order in Prisons. In M. Tonry & J.
Petersilia (Eds.), Crime and Justice: A Review of Research (Vol. 26, pp. 205-281).
Chicago: University of Chicago Press.
Browne, W., & Goldstein, H. (2001). Multiple Membership Multiple Classification (MMMC)
Models. Statistical Modelling, 1, 103-124.
Camp, S. D., & Gaes, G. G. (2002). Growth and Quality of U.S. Private Prisons: Evidence from
a National Survey. Criminology and Public Policy, 1(3), 427-449.
Camp, S. D., Gaes, G. G., & Saylor, W. G. (2002). Quality of Prison Operations in the Federal
Sector: A Comparison with a Private Prison. Punishment & Society, 4(1), 27-53.
Camp, S. D., Saylor, W. G., & Harer, M. D. (1997). Aggregating Individual-Level Evaluations
of the Organizational Social Climate: A Multilevel Investigation of the Work
Environment at the Federal Bureau of Prisons. Justice Quarterly, 14(4), 739-761.
Chen, M. K., & Shapiro, J. M. (2002). Does Prison Harden Inmates? A Discontinuity-based
Approach.Unpublished manuscript, Cambridge, MA.
Clemmer, D. (1940). The Prison Community. Boston: Christopher Publishing House.
Colvin, M. (1992). The Penitentiary in Crisis: From Accommodation to Riot in New Mexico.
Albany: State University of New York Press.
DiIulio, J. J. (1987). Governing Prisons. New York: Free Press.
DiIulio, J. J. (1991). No Escape: The Future of American Corrections. New York: Basic Books.
Fleisher, M. S. (2000). Creating Organizational Climate in a New Federal Prison. Corrections
Compendium, 25(1), 1-2, 4, 6-7, 10, 18-19.
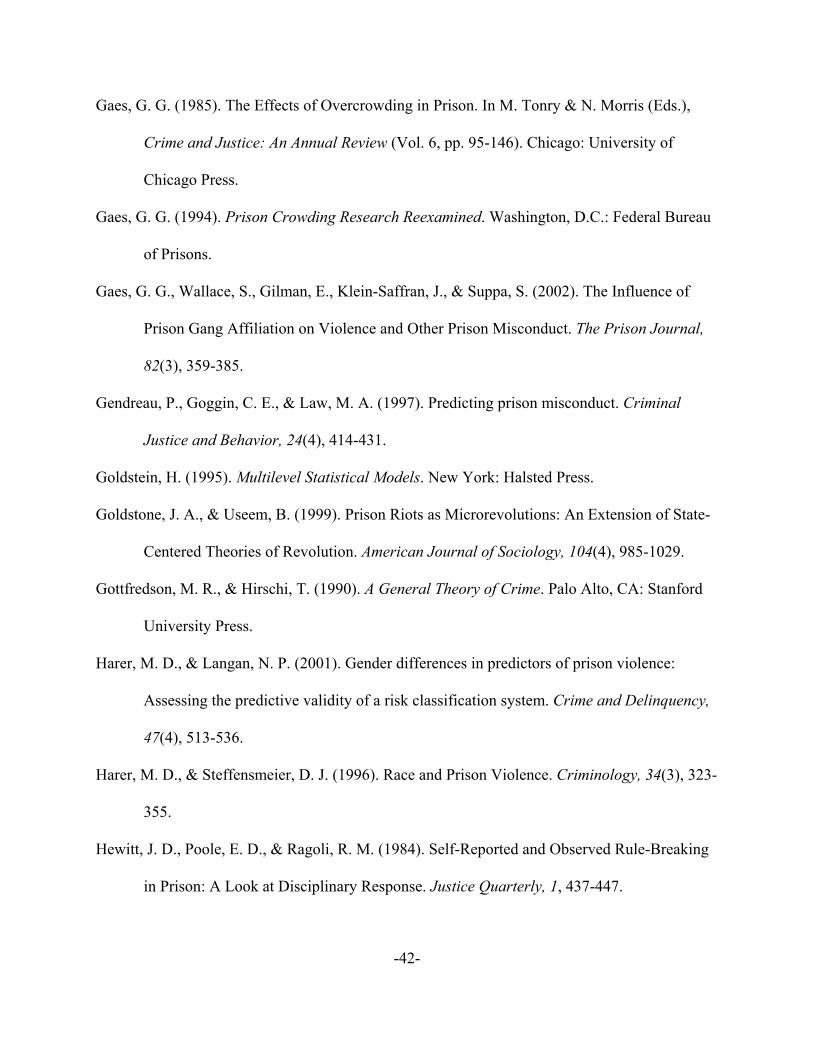
-42-
Gaes, G. G. (1985). The Effects of Overcrowding in Prison. In M. Tonry & N. Morris (Eds.),
Crime and Justice: An Annual Review (Vol. 6, pp. 95-146). Chicago: University of
Chicago Press.
Gaes, G. G. (1994). Prison Crowding Research Reexamined. Washington, D.C.: Federal Bureau
of Prisons.
Gaes, G. G., Wallace, S., Gilman, E., Klein-Saffran, J., & Suppa, S. (2002). The Influence of
Prison Gang Affiliation on Violence and Other Prison Misconduct. The Prison Journal,
82(3), 359-385.
Gendreau, P., Goggin, C. E., & Law, M. A. (1997). Predicting prison misconduct. Criminal
Justice and Behavior, 24(4), 414-431.
Goldstein, H. (1995). Multilevel Statistical Models. New York: Halsted Press.
Goldstone, J. A., & Useem, B. (1999). Prison Riots as Microrevolutions: An Extension of State-
Centered Theories of Revolution. American Journal of Sociology, 104(4), 985-1029.
Gottfredson, M. R., & Hirschi, T. (1990). A General Theory of Crime. Palo Alto, CA: Stanford
University Press.
Harer, M. D., & Langan, N. P. (2001). Gender differences in predictors of prison violence:
Assessing the predictive validity of a risk classification system. Crime and Delinquency,
47(4), 513-536.
Harer, M. D., & Steffensmeier, D. J. (1996). Race and Prison Violence. Criminology, 34(3), 323-
355.
Hewitt, J. D., Poole, E. D., & Ragoli, R. M. (1984). Self-Reported and Observed Rule-Breaking
in Prison: A Look at Disciplinary Response. Justice Quarterly, 1, 437-447.
-43-
Hill, P. W., & Goldstein, H. (1998). Multilevel Modelling of Educational Data with Cross
Classification and Missing Identification of Units. Journal of Educational and
Behavioural Statistics, 23, 117-128.
Hirschi, T., & Gottfredson, M. (1983). Age and the Explanation of Crime. American Journal of
Sociology, 89(3), 552-584.
Horney, J., Osgood, D. W., & Haen, M. (1995). Criminal Careers in the Short-Term: Intra-
Individual Variability in Crime and Its Relation to Local Life Circumstances. American
Sociological Review, 60(5), 655-673.
Jacobs, J. (1977). Stateville: The Penitentiary in Mass Society. Chicago: University of Chicago
Press.
Langan, N. P., & Camp, S. D. (2002). Prisoner Misconduct is not Maladjustment. Washington,
D.C.: Federal Bureau of Prisons.
Light, S. C. (1990). Measurement error in official statistics: Prison rule infraction data. Federal
Probation, December, 63-68.
McDonald, D., Patten, C., Jr., Heliotis, J., Zeytoonjian, L., Kling, R., & Carlson, K. (2002). A
Study to Compare Costs and Performance at Taft Correctional Institution and
Government-Operated Federal Prisons: A Status Report. Cambridge, MA: Abt
Associates Inc.
Paterline, B. A., & Petersen, D. M. (1999). Structural and Social Psychological Determinants of
Prisonization. Journal of Criminal Justice, 27(5), 427-441.
Poole, E. D., & Regoli, R. M. (1980). Race, insitutional rule breaking, and disciplinary response:
A study in discretionary decision making in prison. Law and Society Review, 14(4), 931-
946.
-44-
Raudenbush, S. W., & Bryk, A. S. (2002). Hierarchical Linear Models: Applications and Data
Analysis Methods (Second ed.). Thousand Oaks, CA: Sage.
Reardon, S., & Eitle, T. M. (2000). The Changing Structure of School Segregation:
Measurement and Evidence of Multiracial-Metropolitan-Area School Segregation, 1989--
1995. Demography, 37(3), 351-364.
Reardon, S. F., & Firebaugh, G. (2002). Measures of Multigroup Segregation. In R. M.
Stolzenberg (Ed.), Sociological Methodology 2002 (pp. 33-67). Washington, D.C.:
Blackwell Publishing.
Rhodes, W., Pelissier, B., Gaes, G. G., Saylor, W. G., Camp, S. D., & Wallace, S. (2001).
Alternative Solutions to the Problem of Selection Bias in an Analysis of Federal
Residential Drug Treatment Programs. Evaluation Review, 25(3), 331-369.
Sampson, R. J., & Raudenbush, S. W. (1999). Systematic Social Observation of Public Spaces:
A New Look at Disorder in Urban Neighborhoods. American Journal of Sociology,
105(3), 603-651.
Snijders, T., & Bosker, R. (1999). Multilevel Analysis: An Introduction to Basic and Advanced
Multilevel Modeling. Thousand Oaks, CA: Sage.
Sykes, G. M. (1958). The Society of Captives. Princeton, N.J.: Princeton University Press.
Useem, B., & Goldstone, J. A. (2002). Forging Social Order and Its Breakdown: Riot and
Reform in U.S. Prisons. American Sociological Review, 67(4), 499-525.
Wooldredge, J., Griffin, T., & Pratt, T. (2001). Considering Hierarchical Models for Research on
Inmate Behavior: Predicting Misconduct with Multilevel Data. Justice Quarterly, 18(1),
203-231.
Wright, K. N. (1994). Effective Prison Leadership. Binghamton, NY: William Neil.
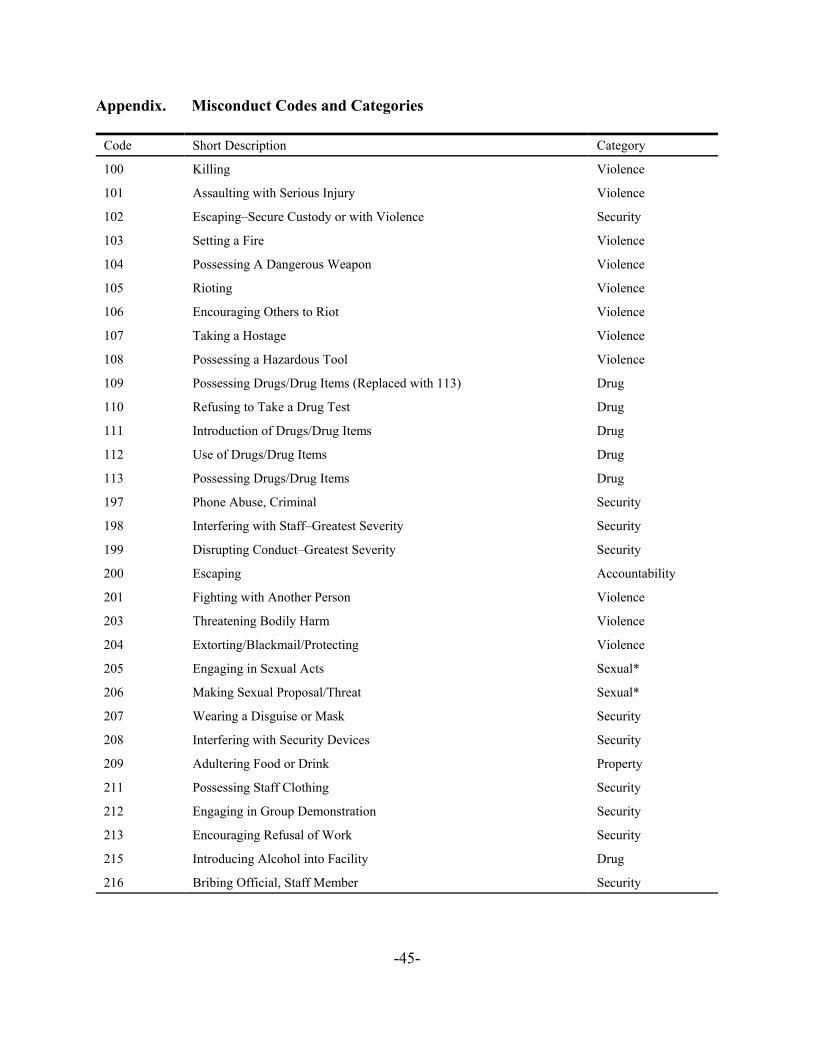
-45-
Appendix. Misconduct Codes and Categories
Code Short Description Category
100 Killing Violence
101 Assaulting with Serious Injury Violence
102 Escaping–Secure Custody or with Violence Security
103 Setting a Fire Violence
104 Possessing A Dangerous Weapon Violence
105 Rioting Violence
106 Encouraging Others to Riot Violence
107 Taking a Hostage Violence
108 Possessing a Hazardous Tool Violence
109 Possessing Drugs/Drug Items (Replaced with 113) Drug
110 Refusing to Take a Drug Test Drug
111 Introduction of Drugs/Drug Items Drug
112 Use of Drugs/Drug Items Drug
113 Possessing Drugs/Drug Items Drug
197 Phone Abuse, Criminal Security
198 Interfering with Staff–Greatest Severity Security
199 Disrupting Conduct–Greatest Severity Security
200 Escaping Accountability
201 Fighting with Another Person Violence
203 Threatening Bodily Harm Violence
204 Extorting/Blackmail/Protecting Violence
205 Engaging in Sexual Acts Sexual*
206 Making Sexual Proposal/Threat Sexual*
207 Wearing a Disguise or Mask Security
208 Interfering with Security Devices Security
209 Adultering Food or Drink Property
211 Possessing Staff Clothing Security
212 Engaging in Group Demonstration Security
213 Encouraging Refusal of Work Security
215 Introducing Alcohol into Facility Drug
216 Bribing Official, Staff Member Security

-46-
Appendix. Continued
Code Short Description Cat. 1
217 Exchanging Money for Contraband Security
218 Destroying Property over $100 Property
219 Stealing Property
220 Using Martial Arts/Boxing Violence
221 Being in Unauthorized Area with Opposite Sex Accountability
222 Possessing Intoxicants Drug
223 Refusing to Take Alcohol Test Drug
224 Assaulting without Serious Injury Violence
297 Phone Abuse, Non-Criminal Security
298 Interfering with Staff–High Severity Security
299 Disruptive Conduct–High Severity Security
300 Indecent Exposure Sexual*
302 Misusing Medication Drug
303 Possessing Unauthorized Money Property
304 Lending for Profit Property
305 Possessing Unauthorized Item Property
306 Refusing Work/Program Assignment Accountability
307 Refusing to Obey an Order Accountability
308 Violating a Condition of Furlough Other
309 Violating a Condition of a Community Program Other
310 Being Absent from Assignment Accountability
311 Failing to Work as Instructed Accountability
312 Being Insolent to Staff Member Other
313 Lying or Falsifying Statement Other
314 Counterfeiting or Forging Document Property
315 Participating in Unauthorized Meeing Security
316 Being in Unauthorized Area Accountability
317 Failing to Follow Safety Regulations Accountability
318 Using Unauthorized Equipment/Machinery Security
319 Using Equipment Contrary to Instructions Security
320 Failing to Stand Count Accountability
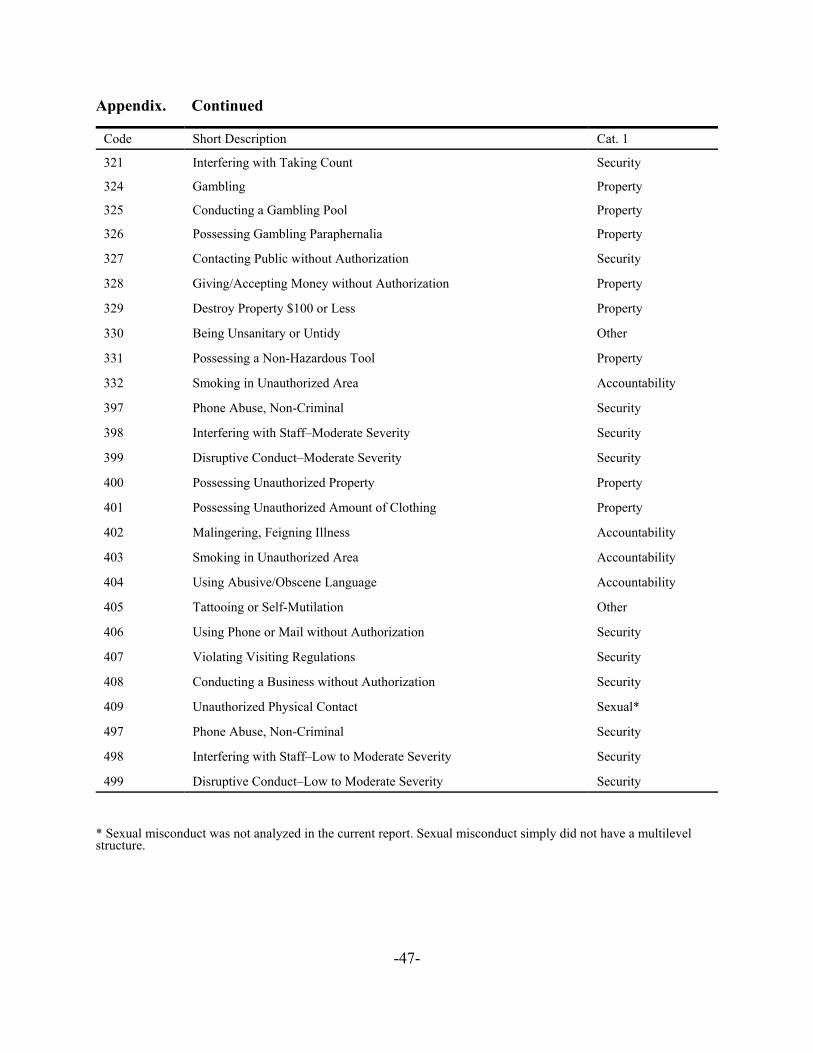
-47-
Appendix. Continued
Code Short Description Cat. 1
321 Interfering with Taking Count Security
324 Gambling Property
325 Conducting a Gambling Pool Property
326 Possessing Gambling Paraphernalia Property
327 Contacting Public without Authorization Security
328 Giving/Accepting Money without Authorization Property
329 Destroy Property $100 or Less Property
330 Being Unsanitary or Untidy Other
331 Possessing a Non-Hazardous Tool Property
332 Smoking in Unauthorized Area Accountability
397 Phone Abuse, Non-Criminal Security
398 Interfering with Staff–Moderate Severity Security
399 Disruptive Conduct–Moderate Severity Security
400 Possessing Unauthorized Property Property
401 Possessing Unauthorized Amount of Clothing Property
402 Malingering, Feigning Illness Accountability
403 Smoking in Unauthorized Area Accountability
404 Using Abusive/Obscene Language Accountability
405 Tattooing or Self-Mutilation Other
406 Using Phone or Mail without Authorization Security
407 Violating Visiting Regulations Security
408 Conducting a Business without Authorization Security
409 Unauthorized Physical Contact Sexual*
497 Phone Abuse, Non-Criminal Security
498 Interfering with Staff–Low to Moderate Severity Security
499 Disruptive Conduct–Low to Moderate Severity Security
* Sexual misconduct was not analyzed in the current report. Sexual misconduct simply did not have a multilevel structure.