influence of socioeconomic characteristics on financial...
TRANSCRIPT

IJEMR – September 2015 - Vol 5 Issue 9 - Online - ISSN 2249–2585 Print - ISSN 2249-8672
Page 1 of 33 www.aeph.in
Influence of Socioeconomic Characteristics on Financial Behavior of Individuals
* Dr. N. Srinivas Kumar
* Professor, SRTIST, Nalgonda Abstract Plenty of studies have been conducted with reference to investors’ characteristic and investment behavior in West and Eastern countries. Recently, many of Indian researchers have indulged themselves into the investigation of investors risk tolerance and investment choice behavior studying investors’ demographics. However, sufficient studies have not been carried out in this respect. India is an emerging economy and people have become more aware about the stock markets, commodity markets and other investment options available to them. Therefore, this study aims to examine the investors’ investment behavior with respect to investors’ socioeconomic characteristics such as gender, income, age, and occupation. This study is typically descriptive. Chi-square analysis was performed on data collected from a market survey. Few socioeconomic characteristics found statistically significant namely, gender, age but occupation and income level differences are not strictly significant.
Keywords: Risk, Investment, socioeconomic characteristics, financial behavior
Introduction
The principles on which the behavioral finance is based are derived from the economic theory. Adam Smith, who is considered the father of the modern economics states that there is insight to the human psychology, which is further developed today into behavioral finance. Behavioral finance and behavioral economics are closely related fields, which apply scientific research on human behavior, and social cognitive and emotional biases to better understand economic decisions and how they affect market prices and returns, and the allocation of resources. The fields are primarily concerned with the rationality or lack of economic agents. Behavioral models typically integrate insights from psychology with neo-classical economic theory. There is now a day’s an increasing debate in theoretical finance between the efficient market hypothesis and the growing field of the behavioral finance. The efficient market hypothesis has been, since its development, the most important theory on understanding the behavior of the various asset markets, but at the end of the 1970s and the start of the 1980s a growing number of studies showed anomalies comparing with this theory. From the 1990s a lot of the focus of the academic discussion shifted away from the analysis of these anomalies comparing the efficient market hypothesis towards a in-depth study of human psychology as related to financial markets leading to the growth of the behavioral finance, a new branch of finance that applies principles of psychology, sociology and other social sciences to the finance.
Review of Literature
Parkash, P. Et al (2014) in their research report concludes that investors belonging to different communities shows similar risk taking behaviors. The study rejects the proposition that the perception that few communities take higher risk than other can be rejected in this study. They also find that it may be due to certain political and economic conditions. Investors are uncertain about the future market condition hence feels reluctant to take risk and invest in less risky assets. Similarly, gender of the investor has no association with level
IJEMR – September 2015 - Vol 5 Issue 9 - Online - ISSN 2249–2585 Print - ISSN 2249-8672
Page 2 of 33 www.aeph.in
of risk taken by the investor. However, other socio-economic characteristics have significance association with risk taking behavior. Married people are unlikely to take risk as compared to unmarried investors. Similarly, it is also shown that young investors are risk taker and aged investors show risk averse behavior. Results, in their research, revealed that investors with high income prefer more risk than investors with less income.
Sireesha, P. B., Laxmi, Ch. S., (2013) shows that maximum respondents show a medium level of risk bearing attitude. Maximum respondents save about 30 percentage of their income focusing on security of and return from their funds for an average period of 5 to 10 years of investment. Friends play a vital role in the investment decisions of the respondents. Occupation and period of investment show the most negative correlation. Income and amount saved has an impact on the purpose of investment by respondents. Most of the investors invested their money for the safety of money. This shows that people in Hyderabad and Secunderabad are conservative in nature and want their money to be safe and they are not concerned for the growth of money or liquidity. At the end, they conclude that their analysis of how an investment choice gets affected by the demographic variables could help the financial advisers in building a successful relationship with their clients.
Dr. Mohammad Shafi, (2014) in his paper concluded that there are numerous determinants that influence the individual investor’s behavior in stock market. Some factors influence majorly while other have slight role in influencing the behavior of an individual investor. The factors can be grouped into demographic, economic, social, and psychological in nature. The most common determinants that have a significant impact on the investors’ behavior are herding, over-reaction, cognitive bias, irrational thinking, confidence (over or under), gender, age, income, education, risk factor, dividends, influence of people’s opinion (friends or family), past performance of the company, accounting information, ownership structure, bonus payments, expected corporate earnings, get rich quick. On the other hand, there are several determinants, which were found uncommon in various studies conducted across different countries. They are Stock marketability, expected losses in international financial markets, perceived ethics of the firm, diversification purpose, tax consequences of an investment, inflation, trading opportunity, publicity, composition of the board of directors of companies, brand perception, social responsibility, economic expectation and control orientation.
Mohd Abass Bhat, M. A., and Dar, F. A., (n.d.) shows that individuals who cannot master their emotions are ill suited to profit from the investment process. The study also reveals that most investors are emotional and maximize money flows at the wrong times – a sure-fire way to reduce potential returns. Strategies that eliminate the emotional response to investing should produce returns that are significantly greater than those indicated by the typical
investor responding to the market rather than proactively investing in the market. During extreme periods for the market, investors often make decisions that can undermine their ability to build long-term wealth. They also asserts that it is important to understand that periods of market uncertainty that can create wealth-building opportunities for the patient, diligent, long term investor.
Kumar, K. C. J. S., Vikkraman, P., (2011) observes that more number of investors are interested to enter in to the stock market due to fear and risk aversion they are not ready to enter in to the capital market. They find that the government and regional stock exchanges has to motivate the small and medium investors to invest so that the underutilized money will come to the market that consequently develop the economy of the nation.

IJEMR – September 2015 - Vol 5 Issue 9 - Online - ISSN 2249–2585 Print - ISSN 2249-8672
Page 3 of 33 www.aeph.in
Khoa Cuong Phan, Jian Zhou, (2014) analyzes determinants of stock investors’ behavior and they states critical topics. They states that their research mainly aims to identify the relevant factors exerting influences on behavioral intention of individual investors. They used TPB as conceptual lens to examine investing motivations and its manifesting levels among individuals on the Vietnamese stock market. Identified specific antecedents guiding individual investment behavior based on systematized related literature and theories and from careful examination of Vietnamese individual investors, from which they suggested a research framework and corresponding hypotheses. They also applied Structural Equation Modeling (SEM) with assistance from AMOS 20.0 as a tool to analyse data. The research succeeds in determining the factors influencing behavioral intention of individual investors, which complies with TPB. Research findings support the hypotheses that investment intention among individuals is considerably driven by attitude toward investment, subjective norm and perceived behavioural control. According to that, attitude toward investment has the strongest impact, followed by perceived behavioural control and lastly by subjective norm.
Barber and Odean (2001), Wu, Johnson et al. (2008). Mentions that the psychological elements may exist inherently within each investor without their awareness, even though the factors considerably influence their behavioral intention. Revelation regarding these impacts, therefore, would help individual investors from falling into the “psychological trap” during their participation in the market. As a conclusion, behavioral finance in general and TPB would equip researchers and individual investors with new conceptual lens to better understand and hence behave accordingly to avoid the “psychological trap” due to human perception and emotions.
Sandip Chattopadhyay, Ranjan Dasgupta, (2015) study shows that the respondent Indian investors have a lower risk tolerance level which makes them highly risk averse. However, this result contradicts with the investment patterns results of them. In line with the Hypotheses drawn, this study proves that aged investors are more risk averse than their younger inexperienced counterparts with a positive and somewhat significant impact of age on their risk tolerance levels. Married investors with children and other dependents are more risk averse than their unmarried and without much dependents counterparts as they have lower risk tolerance levels. Higher number of dependents (including dependent wife, children, parents, unmarried sister, etc.) also reduce the risk tolerance levels and thereby increase risk aversion, higher education brings higher risk tolerance and thereby makes investors risk-prone; higher income, savings, investments amount, returns from investments and FMP all of them also decrease risk aversion attitude of the respondent Indian investors as their risk tolerance level increases. Indian women investors have higher risk prone attitude than their
male counterparts. The study results also show that both the salaried investors and the self-employed/business persons are highly risk averse in nature. But, we observe that the self-employed investors have below average risk tolerance level just like their Govt. In addition, private salaried counterparts. This is also in contradiction with the previous results.
Nour-Mohammad Yaghoubi (2010) conducted a study to identify determinants of user adoption of online banking services among citizens of Isfahan province (Iran). The causal relationships among the variables that determine internet banking services adoption were examined. The results show that the proposed model has good explanatory power and confirms its robustness in predicting customers’ intentions to use such services and demonstrated that online banking services adoption can be explained in terms of perceived behavioral control, perceived usefulness, perceived ease of use, subjective norm and attitude. The underlying framework used in this study is the integrated model of Technology Acceptance Model and Theory of Planned Behavior.

IJEMR – September 2015 - Vol 5 Issue 9 - Online - ISSN 2249–2585 Print - ISSN 2249-8672
Page 4 of 33 www.aeph.in
The findings generally supported the hypotheses derived from the model as well as earlier empirical studies.
Bhushan, P., Medury, Y., (2013) from their analysis concludes that overall financial literacy level of 58.30% among all respondents is not encouraging. This shows that in our country people are still not much aware about their finance related issues. The results suggest that level of financial literacy varies significantly among respondents based on various demographic and socio- economic factors. It can be concluded that financial literacy level gets affected by gender, education, income, nature of employment and place of work whereas it does not get affected by age and geographic region. Overall, they conclude that financial literacy level is low in our country and necessary measures should be taken by government to increase awareness about financial related matters.
Grable1, J. E., and So-hyun, J. (1999) sets the groundwork for future research efforts through their study. Only by understanding the factors, which influence help-seeking behavior within the domain of personal finance, can the profession grow to assist more individuals and families. Researchers, educators, and practitioners are encouraged to test the framework presented in this paper, broaden the questions to be answered, and expand the multidisciplinary approach used in the profession to understand help-seeking behaviors.
Objectives
The purpose of this study is to find individual perceptions and willingness towards risk taking attitude. From the literature review, it is clear that risk-taking attitude in Indian investors is not so promising. It is also observed that the impact of socioeconomic characteristics on their risk perception and willingness is invincible. There are startling findings from the review (literature) that serves as beacon for this study. The following are the objectives for this study.
1. To find and assess impact of socioeconomic characteristics on individuals risk taking attitude
2. To find and assess the individuals perception towards risky investments
3. To find individual willingness towards different types of investment opportunities and their differences with respect to socioeconomic characteristics
4. To find and measure level of risk taking
IJEMR – September 2015 - Vol 5 Issue 9 - Online - ISSN 2249–2585 Print - ISSN 2249-8672
Page 5 of 33 www.aeph.in
Research Methodology
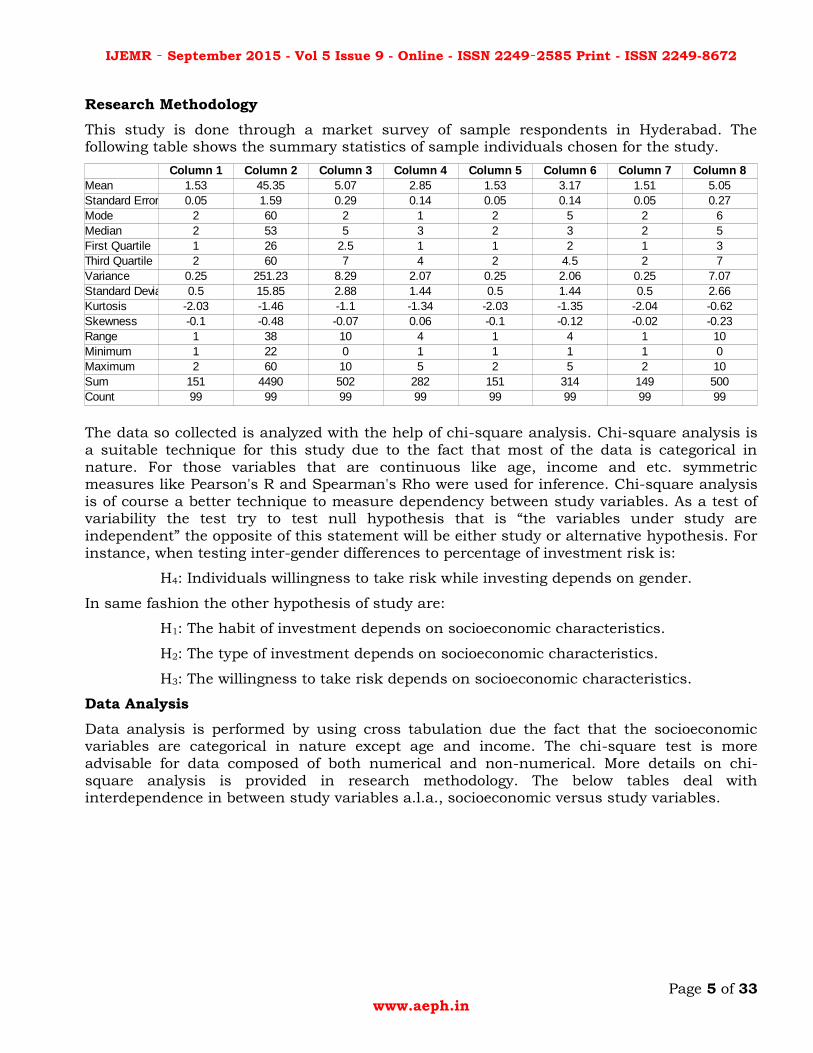
This study is done through a market survey of sample respondents in Hyderabad. The following table shows the summary statistics of sample individuals chosen for the study.
The data so collected is analyzed with the help of chi-square analysis. Chi-square analysis is a suitable technique for this study due to the fact that most of the data is categorical in nature. For those variables that are continuous like age, income and etc. symmetric measures like Pearson's R and Spearman's Rho were used for inference. Chi-square analysis is of course a better technique to measure dependency between study variables. As a test of variability the test try to test null hypothesis that is “the variables under study are independent” the opposite of this statement will be either study or alternative hypothesis. For instance, when testing inter-gender differences to percentage of investment risk is:
H4: Individuals willingness to take risk while investing depends on gender.
In same fashion the other hypothesis of study are:
H1: The habit of investment depends on socioeconomic characteristics.
H2: The type of investment depends on socioeconomic characteristics.
H3: The willingness to take risk depends on socioeconomic characteristics.
Data Analysis
Data analysis is performed by using cross tabulation due the fact that the socioeconomic variables are categorical in nature except age and income. The chi-square test is more advisable for data composed of both numerical and non-numerical. More details on chi-square analysis is provided in research methodology. The below tables deal with interdependence in between study variables a.l.a., socioeconomic versus study variables.
Mean 1.53 45.35 5.07 2.85 1.53 3.17 1.51 5.05
Standard Error 0.05 1.59 0.29 0.14 0.05 0.14 0.05 0.27
Mode 2 60 2 1 2 5 2 6
Median 2 53 5 3 2 3 2 5
First Quartile 1 26 2.5 1 1 2 1 3
Third Quartile 2 60 7 4 2 4.5 2 7
Variance 0.25 251.23 8.29 2.07 0.25 2.06 0.25 7.07
Standard Devia 0.5 15.85 2.88 1.44 0.5 1.44 0.5 2.66
Kurtosis -2.03 -1.46 -1.1 -1.34 -2.03 -1.35 -2.04 -0.62
Skewness -0.1 -0.48 -0.07 0.06 -0.1 -0.12 -0.02 -0.23
Range 1 38 10 4 1 4 1 10
Minimum 1 22 0 1 1 1 1 0
Maximum 2 60 10 5 2 5 2 10
Sum 151 4490 502 282 151 314 149 500
Count 99 99 99 99 99 99 99 99
Column 1 Column 2 Column 3 Column 4 Column 5 Column 6 Column 7 Column 8

IJEMR – September 2015 - Vol 5 Issue 9 - Online - ISSN 2249–2585 Print - ISSN 2249-8672
Page 6 of 33 www.aeph.in
Table 1: Do you invest money Vs. Gender.
Gender
Do you invest money?
Male Female Total
Yes 30.00 17.00 47.00
63.83% 36.17% 100.00%
54.55% 38.64% 47.47%
30.30% 17.17% 47.47%
No 25.00 27.00 52.00
48.08% 51.92% 100.00%
45.45% 61.36% 52.53%
25.25% 27.27% 52.53%
Total 55.00 44.00 99.00
55.56% 44.44% 100.00%
100.00% 100.00% 100.00%
55.56% 44.44% 100.00%
From the table it is clear that out of 100 sample respondents, 55 are male and 44 are female. 68 % of respondents who invest money are male and only 36 % of inverters are female. 48 % of individuals who do not invest are male and 51 of female sample respondents do not invest money. Overall, only 47 % of sample individuals invest money and approximately 52 % of sample individuals do not invest money. The following table describes the significance of the difference.
Chi-Square Tests
Statistic Value df Asymp. Sig.
(2-tailed) Exact Sig. (2-
tailed) Exact Sig. (1-
tailed)
Pearson Chi-Square 2.48 1 .115
Likelihood Ratio 2.50 1 .114
Fisher's Exact Test .156 .085
Continuity
Correction 1.88 1 .170
Linear-by-Linear Association
2.46 1 .117
N of Valid Cases 99
The chi-square statistic is 0.157 and p-value is 0.08 > 0.05 so the null hypothesis is accepted which means the difference is not statistically significant. Therefore, investment as a habit doesn’t depend on gender. In other words, they way individuals indulge in investing money doesn’t depend on gender. The following table gives the information regarding correlation between sample distributions i.e., investment attitude and gender.

IJEMR – September 2015 - Vol 5 Issue 9 - Online - ISSN 2249–2585 Print - ISSN 2249-8672
Page 7 of 33 www.aeph.in
Symmetric Measures
Category Statistic Value Asymp. Std.
Error Approx. T Approx. Sig.
Ordinal by Ordinal
Spearman Correlation
.16 .10 1.58 0.06
Interval by Interval
Pearson's R .16 .10 1.58 0.06
N of Valid Cases
99
Since, the data is nominal spearman correlation is applicable, so from the table it is clear that the spearman’s rho is 0.1 and p-value is 0.06. So, it is clear that the relationship is not statistically significant. This supports or complements chi-square test.
Findings:
Table 2: Do you invest money? Vs. Age
Age
Do you invest money?
< 30 30 to 40 30 to 40 40 to 50 Total
Yes 13.00 5.00 4.00 25.00 47.00
27.66% 10.64% 8.51% 53.19% 100.00%
50.00% 55.56% 28.57% 50.00% 47.47%
13.13% 5.05% 4.04% 25.25% 47.47%
No 13.00 4.00 10.00 25.00 52.00
25.00% 7.69% 19.23% 48.08% 100.00%
50.00% 44.44% 71.43% 50.00% 52.53%
13.13% 4.04% 10.10% 25.25% 52.53%
Total 26.00 9.00 14.00 50.00 99.00
26.26% 9.09% 14.14% 50.51% 100.00%
100.00% 100.00% 100.00% 100.00% 100.00%
26.26% 9.09% 14.14% 50.51% 100.00%
From the above table it is clear that approximately 50 % of individuals belong to the age group of 40 to 50 and 53 % from this group invest money. 26 % of individuals belong to the age group of “< 30” and 27 % of individuals invest from this group. 14 % of individuals belongs to the age groups of 30 to 40 and most (19 %) do not invest money. The below table gives the details of difference.

IJEMR – September 2015 - Vol 5 Issue 9 - Online - ISSN 2249–2585 Print - ISSN 2249-8672
Page 8 of 33 www.aeph.in
Chi-Square Tests
Statistic Value df Asymp. Sig. (2-tailed)
Pearson Chi-Square 2.44 3 .487
Likelihood Ratio 2.52 3 .473
Linear-by-Linear Association
.01 1 .903
N of Valid Cases 99
From the above table it is clear that the chi-square statistic is 2.44 and the p- value is 0.487 so there is no evidence in the sample data that the investment as a habit does depend on age group of the sample individuals. Age is not particularly important towards investments, which seems to be quite unusual. Therefore, it requires further research.
Symmetric Measures
Category Statistic Value Asymp. Std.
Error Approx. T
Approx. Sig.
Ordinal by Ordinal
Spearman Correlation
2.01 .10 -.10 0.06
Interval by Interval
Pearson's R 2.36 .10 .12 0.01
N of Valid Cases 99
Since the data is continuous Karl Pearson's R is most appropriate for inference. R value is 0.01 and the p-value is 0.01. So, the relationship is statistically significant. Investment behavior may be related to age of the individuals. Age might determine the investment habits of the sample individuals.

IJEMR – September 2015 - Vol 5 Issue 9 - Online - ISSN 2249–2585 Print - ISSN 2249-8672
Page 9 of 33 www.aeph.in
Table 3: Do you invest money? Vs Income
Income
Do you invest money?
< 2 lacs 2 to 4 lacs 4 to 6 lacs 6 to 8 lacs 5 Total
Yes 11.00 7.00 8.00 13.00 8.00 47.00
23.40% 14.89% 17.02% 27.66% 17.02% 100.00%
44.00% 36.84% 44.44% 50.00% 72.73% 47.47%
11.11% 7.07% 8.08% 13.13% 8.08% 47.47%
No 14.00 12.00 10.00 13.00 3.00 52.00
26.92% 23.08% 19.23% 25.00% 5.77% 100.00%
56.00% 63.16% 55.56% 50.00% 27.27% 52.53%
14.14% 12.12% 10.10% 13.13% 3.03% 52.53%
Total 25.00 19.00 18.00 26.00 11.00 99.00
25.25% 19.19% 18.18% 26.26% 11.11% 100.00%
100.00% 100.00% 100.00% 100.00% 100.00% 100.00%
25.25% 19.19% 18.18% 26.26% 11.11% 100.00%
Maximum of (26%) of individuals belongs to 6 to 8 lacs income group and most of them (27%) invest money in different schemes. The other important group (25 %) is “< 2 lacs” most of these individuals (26 %) do not invest money.
Chi-Square Tests
Statistic Value df Asymp. Sig. (2-tailed)
Pearson Chi-Square 3.93 4 .0416
Likelihood Ratio 4.02 4 .0403
Linear-by-Linear Association
2.14 1 .0144
N of Valid Cases 99
The chi-square statistic is 3.96 and p-value 0.416, the difference is statistically significant. So, investment habits depends on income. From the below table (symmetry measures) it is clear that the relationship is significant.

IJEMR – September 2015 - Vol 5 Issue 9 - Online - ISSN 2249–2585 Print - ISSN 2249-8672
Page 10 of 33 www.aeph.in
Symmetric Measures
Category Statistic Value Asymp.
Std. Error Approx. T
Approx. Sig.
Ordinal by Ordinal Spearman
Correlation 0.41 .10 -1.44 0.016
Interval by Interval Pearson's R 0.65 .10 -1.47 0.021
N of Valid Cases 99
Table 4: Do you invest money? Vs. Occupation
Occupation
Do You Invest
Money? Student Business
Govt. Employee
Private Employee
Freelance Total
Yes 12.00 9.00 9.00 7.00 10.00 47.00
25.53% 19.15% 19.15% 14.89% 21.28% 100.00%
46.15% 56.25% 45.00% 33.33% 62.50% 47.47%
12.12% 9.09% 9.09% 7.07% 10.10% 47.47%
No 14.00 7.00 11.00 14.00 6.00 52.00
26.92% 13.46% 21.15% 26.92% 11.54% 100.00%
53.85% 43.75% 55.00% 66.67% 37.50% 52.53%
14.14% 7.07% 11.11% 14.14% 6.06% 52.53%
Total 26.00 16.00 20.00 21.00 16.00 99.00
26.26% 16.16% 20.20% 21.21% 16.16% 100.00%
100.00% 100.00% 100.00% 100.00% 100.00% 100.00%
26.26% 16.16% 20.20% 21.21% 16.16% 100.00%
The above table deals with investment behavior versus occupation. Most (26 %) of individuals are students and they do not appears to be involving in any investments. The second largest group (21 %) and these are private employees most of these individuals appear to have investment behavior. However, business people (19 %) and freelance people (21 %) invest money, whereas most of the Govt. employees and private employees (26%) do not invest money. The findings are interesting.
Finding: Although most of the students invest money but the difference is very less compared to, those do not invest. Business and freelance people invest money. Govt. employees and private employees do not invest money.

IJEMR – September 2015 - Vol 5 Issue 9 - Online - ISSN 2249–2585 Print - ISSN 2249-8672
Page 11 of 33 www.aeph.in
Chi-Square Tests
Statistic Value df Asymp. Sig. (2-tailed)
Pearson Chi-Square 3.69 4 .049
Likelihood Ratio 3.74 4 .042
Linear-by-Linear Association
.02 1 .875
N of Valid Cases 99
The results are statistically significant. Chi-square value is 3.69 p-value is 0.04 < 0.05. There is evidence in support of alternative hypothesis. Therefore, the difference is statistically significant. The way sample respondents invest money depends on occupation.
Symmetric Measures
Category Statistic Value Asymp. Std.
Error Approx. T Approx. Sig.
Ordinal by Ordinal
Spearman Correlation
0.602 .10 0.15 0.028
Interval by Interval
Pearson's R 0.7 .10 0.16 0.025
N of Valid Cases
99
The data is nominal so Spearman correlation is appropriate and Spearman Rho is 0.10 with p-value 0.028 individual investment behavior can be correlated with occupation levels.
IJEMR – September 2015 - Vol 5 Issue 9 - Online - ISSN 2249–2585 Print - ISSN 2249-8672
Page 12 of 33 www.aeph.in
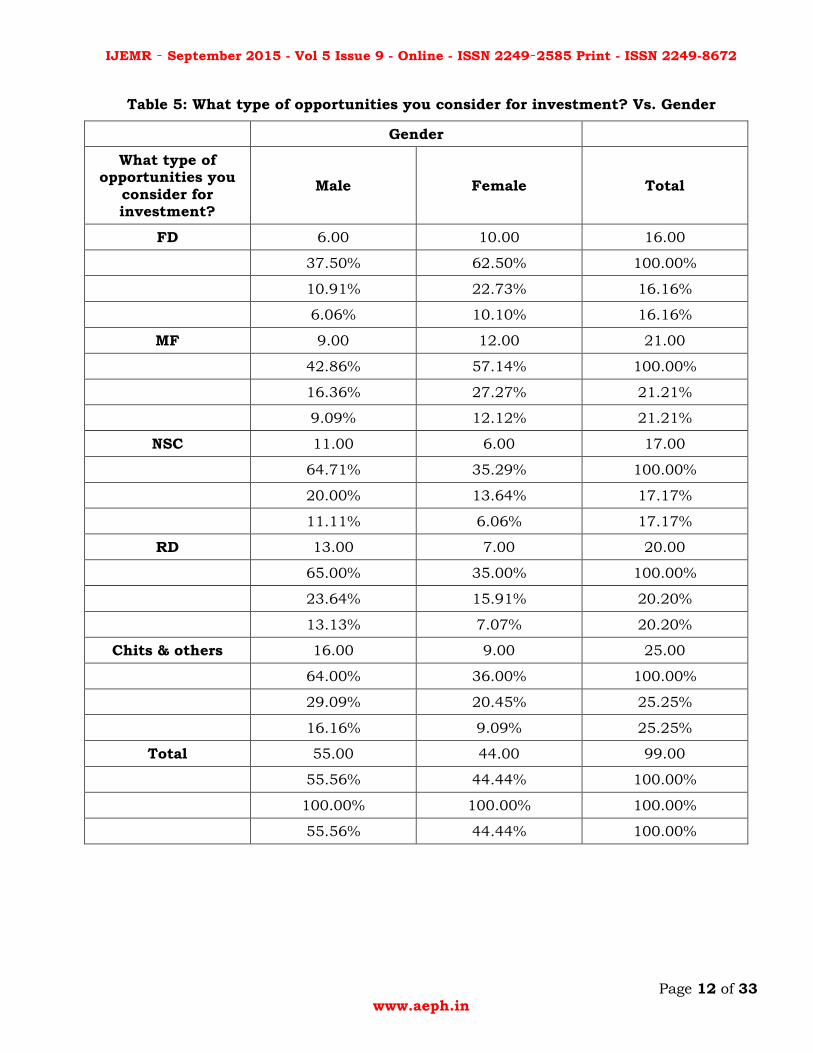
Table 5: What type of opportunities you consider for investment? Vs. Gender
Gender
What type of opportunities you
consider for investment?
Male Female Total
FD 6.00 10.00 16.00
37.50% 62.50% 100.00%
10.91% 22.73% 16.16%
6.06% 10.10% 16.16%
MF 9.00 12.00 21.00
42.86% 57.14% 100.00%
16.36% 27.27% 21.21%
9.09% 12.12% 21.21%
NSC 11.00 6.00 17.00
64.71% 35.29% 100.00%
20.00% 13.64% 17.17%
11.11% 6.06% 17.17%
RD 13.00 7.00 20.00
65.00% 35.00% 100.00%
23.64% 15.91% 20.20%
13.13% 7.07% 20.20%
Chits & others 16.00 9.00 25.00
64.00% 36.00% 100.00%
29.09% 20.45% 25.25%
16.16% 9.09% 25.25%
Total 55.00 44.00 99.00
55.56% 44.44% 100.00%
100.00% 100.00% 100.00%
55.56% 44.44% 100.00%

IJEMR – September 2015 - Vol 5 Issue 9 - Online - ISSN 2249–2585 Print - ISSN 2249-8672
Page 13 of 33 www.aeph.in
As it is found earlier 55 % of the sample respondents are male. Most of the (65 %) invest in RD. 64 % invest in Chits & other closely to this figure is NSC. 42 % of respondents invest in MF, only 37 % of the respondents invest in FD. As far as female respondents are concerned it is reverse in case. Most (62 % ) invest in FD, 57 % invests in MF, each of 35 % in NSC and RD, 36 % invests in chits & others.
Chi-Square Tests
Statistic Value df Asymp. Sig. (2-tailed)
Pearson Chi-Square 5.50 4 .239
Likelihood Ratio 5.52 4 .238
Linear-by-Linear Association
4.20 1 .040
N of Valid Cases 99
The chi-square value is 5.5 p-value is 0.239 > 0.05. Therefore, types of investments does not depend on gender. The way individuals invest in these variety of opportunities is more or less same.
Symmetric Measures
Category Statistic Value Asymp. Std.
Error Approx. T Approx. Sig.
Ordinal by Ordinal
Spearman Correlation
-.20 .10 -2.05
Interval by Interval
Pearson's R -.21 .10 -2.08
N of Valid Cases
99
From the symmetry measure it is clear that the way money invested is inversely related since the Spearman's Rho is -0.20 however this is not so strong.

IJEMR – September 2015 - Vol 5 Issue 9 - Online - ISSN 2249–2585 Print - ISSN 2249-8672
Page 14 of 33 www.aeph.in
Table 6: What type of opportunities you consider for investment? Vs. Age
Age
What type of opportunities you consider
for investment?
< 30 30 to 40 30 to 40 40 to 50 Total
FD 5.00 3.00 1.00 7.00 16.00
31.25% 18.75% 6.25% 43.75% 100.00%
19.23% 33.33% 7.14% 14.00% 16.16%
5.05% 3.03% 1.01% 7.07% 16.16%
MF 5.00 2.00 3.00 11.00 21.00
23.81% 9.52% 14.29% 52.38% 100.00%
19.23% 22.22% 21.43% 22.00% 21.21%
5.05% 2.02% 3.03% 11.11% 21.21%
NSC 3.00 1.00 2.00 11.00 17.00
17.65% 5.88% 11.76% 64.71% 100.00%
11.54% 11.11% 14.29% 22.00% 17.17%
3.03% 1.01% 2.02% 11.11% 17.17%
RD 8.00 2.00 3.00 7.00 20.00
40.00% 10.00% 15.00% 35.00% 100.00%
30.77% 22.22% 21.43% 14.00% 20.20%
8.08% 2.02% 3.03% 7.07% 20.20%
Chits & others
5.00 1.00 5.00 14.00 25.00
20.00% 4.00% 20.00% 56.00% 100.00%
19.23% 11.11% 35.71% 28.00% 25.25%
5.05% 1.01% 5.05% 14.14% 25.25%
Total 26.00 9.00 14.00 50.00 99.00
26.26% 9.09% 14.14% 50.51% 100.00%
100.00% 100.00% 100.00% 100.00% 100.00%
26.26% 9.09% 14.14% 50.51% 100.00%
Most (50 %) of the inviduals belongs to 40 to 50 age group and these inviduals prefers to invest in NSC bonds. 26 % of individuals belongs to age group of “< 30” and these individuals invests in RD which is followed by FD.

IJEMR – September 2015 - Vol 5 Issue 9 - Online - ISSN 2249–2585 Print - ISSN 2249-8672
Page 15 of 33 www.aeph.in
Chi-Square Tests
Statistic Value df Asymp. Sig. (2-
tailed)
Pearson Chi-Square 8.39 12 .024
Likelihood Ratio 8.29 12 .0762
Linear-by-Linear Association
.29 1 .0588
N of Valid Cases 99
Chi-square statistic is 8.39 p-value is 0.024 < 0.05. So type of investment depends on age group. Individual who belongs to different age groups have different preference to type of investments.
Symmetric Measures
Category Statistic Value Asymp. Std.
Error Approx. T Approx. Sig.
Ordinal by Ordinal
Spearman Correlation
.41 .10 .44 0.19
Interval by Interval
Pearson's R .50 .10 .54 0.02
N of Valid Cases
99
Pearson’s R is 0.50 p-value is 0.02. So the relationship is statistically significant. There is evidence in the data that type of investments (preferences) can be related to age group.

IJEMR – September 2015 - Vol 5 Issue 9 - Online - ISSN 2249–2585 Print - ISSN 2249-8672
Page 16 of 33 www.aeph.in
Table 7. What type of opportunities you consider for investment? Vs. Income
Income
What type of opportunities you consider
for investment?
< 2 lacs 2 to 4 lacs 4 to 6 lacs 6 to 8 lacs 8 to 10 lacs Total
FD 3.00 2.00 4.00 5.00 2.00 16.00
18.75% 12.50% 25.00% 31.25% 12.50% 100.00%
12.00% 10.53% 22.22% 19.23% 18.18% 16.16%
3.03% 2.02% 4.04% 5.05% 2.02% 16.16%
MF 5.00 4.00 2.00 8.00 2.00 21.00
23.81% 19.05% 9.52% 38.10% 9.52% 100.00%
20.00% 21.05% 11.11% 30.77% 18.18% 21.21%
5.05% 4.04% 2.02% 8.08% 2.02% 21.21%
NSC 4.00 4.00 4.00 4.00 1.00 17.00
23.53% 23.53% 23.53% 23.53% 5.88% 100.00%
16.00% 21.05% 22.22% 15.38% 9.09% 17.17%
4.04% 4.04% 4.04% 4.04% 1.01% 17.17%
RD 8.00 4.00 1.00 5.00 2.00 20.00
40.00% 20.00% 5.00% 25.00% 10.00% 100.00%
32.00% 21.05% 5.56% 19.23% 18.18% 20.20%
8.08% 4.04% 1.01% 5.05% 2.02% 20.20%
Chits & others
5.00 5.00 7.00 4.00 4.00 25.00
20.00% 20.00% 28.00% 16.00% 16.00% 100.00%
20.00% 26.32% 38.89% 15.38% 36.36% 25.25%
5.05% 5.05% 7.07% 4.04% 4.04% 25.25%
Total 25.00 19.00 18.00 26.00 11.00 99.00
25.25% 19.19% 18.18% 26.26% 11.11% 100.00%
100.00% 100.00% 100.00% 100.00% 100.00% 100.00%
25.25% 19.19% 18.18% 26.26% 11.11% 100.00%
Most (26 %) of the individuals belongs to the income group of 6 to 8 lacs and 38 % invests in MF, 31 % invests in FD but only each of 15 % invests in NSC and RD respectively. The next important group is “<2 “lacs and 40 % invests in RD, each of 23 % invests in NSC and MF, only 18 % invests in FD.

IJEMR – September 2015 - Vol 5 Issue 9 - Online - ISSN 2249–2585 Print - ISSN 2249-8672
Page 17 of 33 www.aeph.in
Chi-Square Tests
Statistic Value df Asymp. Sig. (2-tailed)
Pearson Chi-Square 11.02 16 .0308
Likelihood Ratio 11.60 16 .0471
Linear-by-Linear Association
.47 1 .0492
N of Valid Cases 99
Pearson's Chi-square is 11.02 p-value is 0.03. So, the difference is statistically significant. Individual preference to different types of investments depends on income level.
Symmetric Measures
Category Statistic Value Asymp. Std.
Error Approx. T Approx. Sig.
Ordinal by Ordinal
Spearman Correlation
0.71 .10 -.66 0.011
Interval by Interval
Pearson’s R 0.72 .10 -.68 0.001
N of Valid Cases
99
The Karl Pearson's R is 0.72 and p-value is 0.001. The relationship is statistically significant. Hence, there is enough evidence in the study that the type of investment depends on individual’s income levels.
IJEMR – September 2015 - Vol 5 Issue 9 - Online - ISSN 2249–2585 Print - ISSN 2249-8672
Page 18 of 33 www.aeph.in
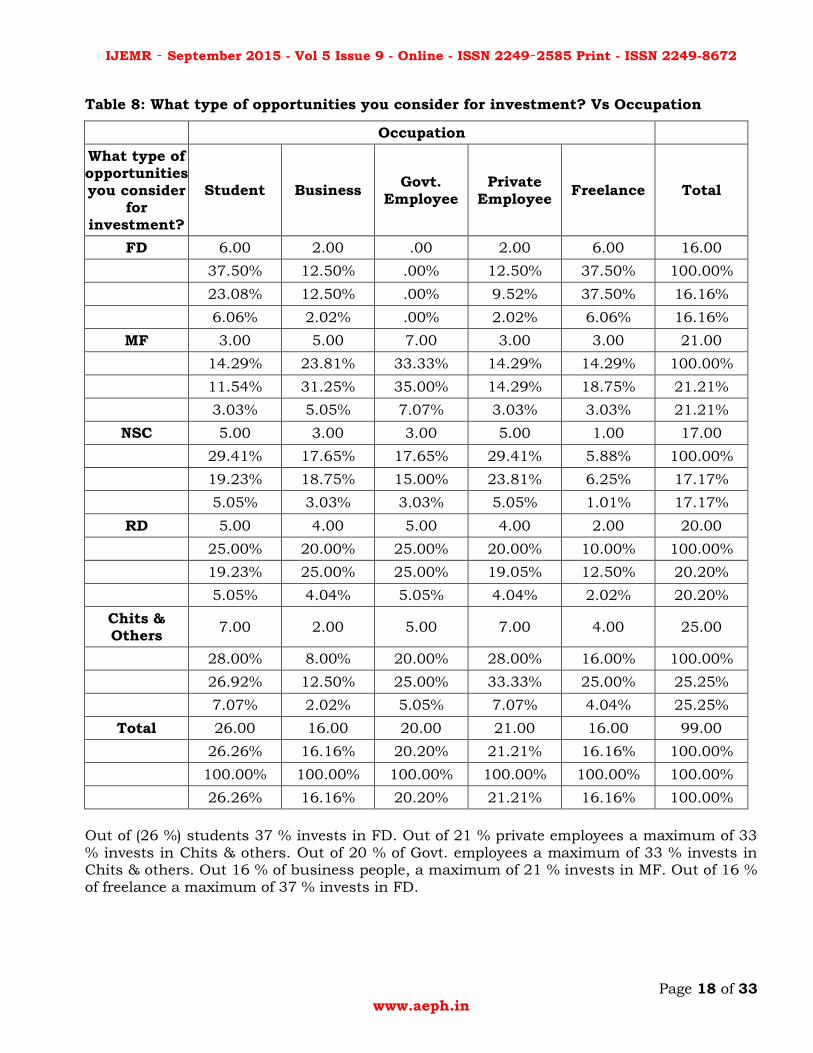
Table 8: What type of opportunities you consider for investment? Vs Occupation
Occupation
What type of opportunities you consider
for investment?
Student Business Govt.
Employee Private
Employee Freelance Total
FD 6.00 2.00 .00 2.00 6.00 16.00
37.50% 12.50% .00% 12.50% 37.50% 100.00%
23.08% 12.50% .00% 9.52% 37.50% 16.16%
6.06% 2.02% .00% 2.02% 6.06% 16.16%
MF 3.00 5.00 7.00 3.00 3.00 21.00
14.29% 23.81% 33.33% 14.29% 14.29% 100.00%
11.54% 31.25% 35.00% 14.29% 18.75% 21.21%
3.03% 5.05% 7.07% 3.03% 3.03% 21.21%
NSC 5.00 3.00 3.00 5.00 1.00 17.00
29.41% 17.65% 17.65% 29.41% 5.88% 100.00%
19.23% 18.75% 15.00% 23.81% 6.25% 17.17%
5.05% 3.03% 3.03% 5.05% 1.01% 17.17%
RD 5.00 4.00 5.00 4.00 2.00 20.00
25.00% 20.00% 25.00% 20.00% 10.00% 100.00%
19.23% 25.00% 25.00% 19.05% 12.50% 20.20%
5.05% 4.04% 5.05% 4.04% 2.02% 20.20%
Chits & Others
7.00 2.00 5.00 7.00 4.00 25.00
28.00% 8.00% 20.00% 28.00% 16.00% 100.00%
26.92% 12.50% 25.00% 33.33% 25.00% 25.25%
7.07% 2.02% 5.05% 7.07% 4.04% 25.25%
Total 26.00 16.00 20.00 21.00 16.00 99.00
26.26% 16.16% 20.20% 21.21% 16.16% 100.00%
100.00% 100.00% 100.00% 100.00% 100.00% 100.00%
26.26% 16.16% 20.20% 21.21% 16.16% 100.00%
Out of (26 %) students 37 % invests in FD. Out of 21 % private employees a maximum of 33 % invests in Chits & others. Out of 20 % of Govt. employees a maximum of 33 % invests in Chits & others. Out 16 % of business people, a maximum of 21 % invests in MF. Out of 16 % of freelance a maximum of 37 % invests in FD.

IJEMR – September 2015 - Vol 5 Issue 9 - Online - ISSN 2249–2585 Print - ISSN 2249-8672
Page 19 of 33 www.aeph.in
Chi-Square Tests
Statistic Value df Asymp. Sig. (2-tailed)
Pearson Chi-Square 17.74 16 .340
Likelihood Ratio 20.19 16 .212
Linear-by-Linear Association
.03 1 .867
N of Valid Cases 99
Chi-square statistic is 17.74 and p-value is 0.340. So, there no evidence from the study that the type of investment opportunities depends on occupation
Symmetric Measures
Category Statistic Value Asymp. Std.
Error Approx. T Approx. Sig.
Ordinal by Ordinal
Spearman Correlation
-.01 .11 -.13 0.45
Interval by Interval
Pearson's R -.02 .11 -.17 0.43
N of Valid Cases
99
The relationship between type of investments and occupation levels are negatively correlated however, the strength of relationship is not so strong. The relationship is not statistically significant. There is no evidence for study hypothesis that the occupation levels could influence type of investment.
Table 9: Do you think investing in risky opportunities is advisable? Vs. Gender
Gender
Do you think investing in risky opportunities is advisable?
Male Female Total
Yes 28.00 21.00 49.00
57.14% 42.86% 100.00%
50.91% 47.73% 49.49%
28.28% 21.21% 49.49%
No 27.00 23.00 50.00
54.00% 46.00% 100.00%
49.09% 52.27% 50.51%
27.27% 23.23% 50.51%
Total 55.00 44.00 99.00
55.56% 44.44% 100.00%
100.00% 100.00% 100.00%
55.56% 44.44% 100.00%

IJEMR – September 2015 - Vol 5 Issue 9 - Online - ISSN 2249–2585 Print - ISSN 2249-8672
Page 20 of 33 www.aeph.in
Out of 55 % of male respondents, 57 % advise risky investments 54 % do not. Regarding female respondents, 46 % do not advise risky investments 44 % advise. This is clear that male investment behavior is different compared to that of female.
Chi-Square Tests
Statistic Value df Asymp. Sig.
(2-tailed)
Exact Sig.
(2-tailed)
Exact Sig.
(1-tailed)
Pearson Chi-Square
.10 1 .753 0.23
Likelihood
Ratio .10 1 .753 0.23
Fisher's Exact Test
.840 .455
Continuity Correction
.01 1 .911
Linear-by-Linear Association
.10 1 .754
N of Valid Cases
99
Pearson’s chi-square statistics is 0.10 and p-value is 0.23. So, individual perception to investment that involves risk does not depend on gender.
Symmetric Measures
Category Statistic Value Asymp. Std.
Error Approx. T Approx. Sig.
Ordinal by Ordinal
Spearman Correlation
.03 .10 .31 0.38
Interval by Interval
Pearson's R .03 .10 .31 0.38
N of Valid Cases
99
Both Spearmen Rho and Karl Pearson's R is 0.03 which is positive but not strong. The p-value is 0.38 we accept null hypothesis that the relationship observed is not statistically significant. However, the relationship is positive. We may infer that there is relationship between investment risk attitude and gender.
IJEMR – September 2015 - Vol 5 Issue 9 - Online - ISSN 2249–2585 Print - ISSN 2249-8672
Page 21 of 33 www.aeph.in
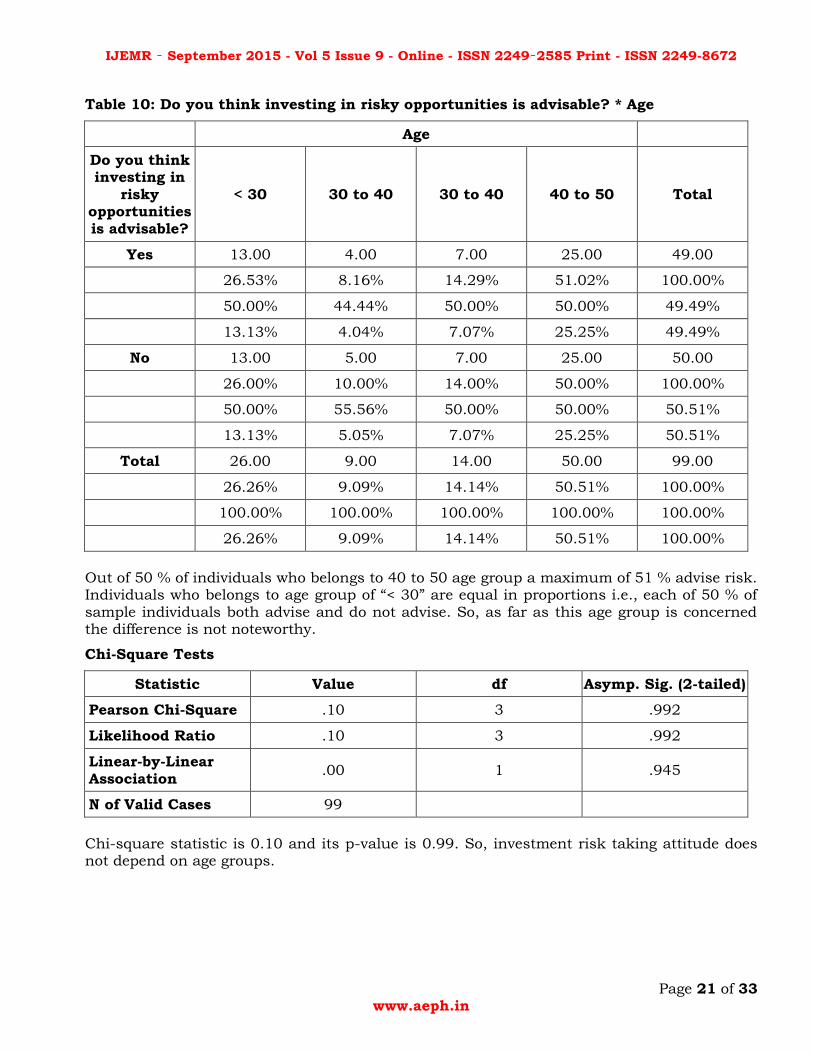
Table 10: Do you think investing in risky opportunities is advisable? * Age
Age
Do you think investing in
risky opportunities is advisable?
< 30 30 to 40 30 to 40 40 to 50 Total
Yes 13.00 4.00 7.00 25.00 49.00
26.53% 8.16% 14.29% 51.02% 100.00%
50.00% 44.44% 50.00% 50.00% 49.49%
13.13% 4.04% 7.07% 25.25% 49.49%
No 13.00 5.00 7.00 25.00 50.00
26.00% 10.00% 14.00% 50.00% 100.00%
50.00% 55.56% 50.00% 50.00% 50.51%
13.13% 5.05% 7.07% 25.25% 50.51%
Total 26.00 9.00 14.00 50.00 99.00
26.26% 9.09% 14.14% 50.51% 100.00%
100.00% 100.00% 100.00% 100.00% 100.00%
26.26% 9.09% 14.14% 50.51% 100.00%
Out of 50 % of individuals who belongs to 40 to 50 age group a maximum of 51 % advise risk. Individuals who belongs to age group of “< 30” are equal in proportions i.e., each of 50 % of sample individuals both advise and do not advise. So, as far as this age group is concerned the difference is not noteworthy.
Chi-Square Tests
Statistic Value df Asymp. Sig. (2-tailed)
Pearson Chi-Square .10 3 .992
Likelihood Ratio .10 3 .992
Linear-by-Linear Association
.00 1 .945
N of Valid Cases 99
Chi-square statistic is 0.10 and its p-value is 0.99. So, investment risk taking attitude does not depend on age groups.

IJEMR – September 2015 - Vol 5 Issue 9 - Online - ISSN 2249–2585 Print - ISSN 2249-8672
Page 22 of 33 www.aeph.in
Symmetric Measures
Category Statistic Value Asymp. Std.
Error Approx. T Approx. Sig.
Ordinal by Ordinal
Spearman Correlation
-.01 .10 -.07
Interval by Interval
Pearson's R -.01 .10 -.07
N of Valid Cases
99
The relationship observed between investment risk taking attitude and age groups are negatively correlated. So, investment risk attitude of individuals who belongs to lesser age group is opposite of those belongs to 40 to 50 age group.
Table 11: Do you think investing in risky opportunities is advisable? Vs Income.
Income
Do you think investing in
risky opportunities is advisable?
< 2 lacs 2 to 4 lacs 4 to 6 lacs 6 to 8 lacs 5 Total
Yes 12.00 9.00 9.00 11.00 8.00 49.00
24.49% 18.37% 18.37% 22.45% 16.33% 100.00%
48.00% 47.37% 50.00% 42.31% 72.73% 49.49%
12.12% 9.09% 9.09% 11.11% 8.08% 49.49%
No 13.00 10.00 9.00 15.00 3.00 50.00
26.00% 20.00% 18.00% 30.00% 6.00% 100.00%
52.00% 52.63% 50.00% 57.69% 27.27% 50.51%
13.13% 10.10% 9.09% 15.15% 3.03% 50.51%
Total 25.00 19.00 18.00 26.00 11.00 99.00
25.25% 19.19% 18.18% 26.26% 11.11% 100.00%
100.00% 100.00% 100.00% 100.00% 100.00% 100.00%
25.25% 19.19% 18.18% 26.26% 11.11% 100.00%
Out of 26% of individuals who belongs to the income groups of 6 to 8 lacs a maximum of 30% do not advise investments that involve risk. Out of 25% of individuals a maximum of 26% do not advise investments that involve risk. The same observation can be done to rest of the groups.

IJEMR – September 2015 - Vol 5 Issue 9 - Online - ISSN 2249–2585 Print - ISSN 2249-8672
Page 23 of 33 www.aeph.in
Chi-Square Tests
Statistic Value df Asymp. Sig. (2-tailed)
Pearson Chi-Square 2.97 4 .563
Likelihood Ratio 3.06 4 .548
Linear-by-Linear Association
.41 1 .520
N of Valid Cases 99
Pearson's chi-square is 2.97 and p-value is 0.563 > 0.05. So, null hypothesis is accepted. Advisability of risky investments does not depend on income.
Symmetric Measures
Category Statistic Value Asymp. Std.
Error Approx. T Approx. Sig.
Ordinal by Ordinal
Spearman Correlation
-.06 .10 -.61 0.27
Interval by Interval
Pearson's R -.07 .10 -.64 0.26
N of Valid Cases
99
Pearson's R is -0.07 and p-value is 0.26. Therefore, the relationship is not statistically significant. Moreover, the relationship is negative but weak. Therefore, we can infer that individuals with more income does not advise investments that involve risk.

IJEMR – September 2015 - Vol 5 Issue 9 - Online - ISSN 2249–2585 Print - ISSN 2249-8672
Page 24 of 33 www.aeph.in
Table 12: Do you think investing in risky opportunities is advisable? * Occupation
Occupation
Do you think investing in
risky opportunities is advisable?
Student Business Govt.
Employee Private
Employee Freelance Total
Yes 10.00 5.00 9.00 16.00 9.00 49.00
20.41% 10.20% 18.37% 32.65% 18.37% 100.00%
38.46% 31.25% 45.00% 76.19% 56.25% 49.49%
10.10% 5.05% 9.09% 16.16% 9.09% 49.49%
No 16.00 11.00 11.00 5.00 7.00 50.00
32.00% 22.00% 22.00% 10.00% 14.00% 100.00%
61.54% 68.75% 55.00% 23.81% 43.75% 50.51%
16.16% 11.11% 11.11% 5.05% 7.07% 50.51%
Total 26.00 16.00 20.00 21.00 16.00 99.00
26.26% 16.16% 20.20% 21.21% 16.16% 100.00%
100.00% 100.00% 100.00% 100.00% 100.00% 100.00%
26.26% 16.16% 20.20% 21.21% 16.16% 100.00%
Most of the individuals (26 %) are students and a maximum (38 %) of students do not advise risky investments. Out of 21 % of private employees a maximum of 32 % do not advise. Both business people and freelance individuals also do not appears to advise risky investments.
Chi-Square Tests
Statistic Value df Asymp. Sig. (2-tailed)
Pearson Chi-Square 9.84 4 .043
Likelihood Ratio 10.20 4 .037
Linear-by-Linear Association
5.27 1 .022
N of Valid Cases 99
Chi-square statistic is 9.84 and p-value is 0.43. Therefore, advisability of investments that involves risk might depend on occupation levels.

IJEMR – September 2015 - Vol 5 Issue 9 - Online - ISSN 2249–2585 Print - ISSN 2249-8672
Page 25 of 33 www.aeph.in
Symmetric Measures
Category Statistic Value Asymp. Std.
Error Approx. T Approx. Sig.
Ordinal by Ordinal
Spearman Correlation
-.23 .10 -2.35 0.01
Interval by Interval
Pearson's R -.23 .10 -2.35 0.01
N of Valid Cases
99
The relationship is negative and weak. However, P-value is 0.01 so relationships are statistically significant. Advisability of investments that involves risk is negatively correlated but relationship is significant.
Table 13: How much risk is advisable? Vs. Gender
Gender
How much risk is advisable?
male female Total
0 to 2 10.00 10.00 20.00
50.00% 50.00% 100.00%
18.18% 22.73% 20.20%
10.10% 10.10% 20.20%
2 to 4 8.00 7.00 15.00
53.33% 46.67% 100.00%
14.55% 15.91% 15.15%
8.08% 7.07% 15.15%
4 to 6 23.00 14.00 37.00
62.16% 37.84% 100.00%
41.82% 31.82% 37.37%
23.23% 14.14% 37.37%
6 to 8 10.00 6.00 16.00
62.50% 37.50% 100.00%
18.18% 13.64% 16.16%
10.10% 6.06% 16.16%
8 to 10 4.00 7.00 11.00
36.36% 63.64% 100.00%
7.27% 15.91% 11.11%

IJEMR – September 2015 - Vol 5 Issue 9 - Online - ISSN 2249–2585 Print - ISSN 2249-8672
Page 26 of 33 www.aeph.in
Gender
How much risk is advisable?
male female Total
4.04% 7.07% 11.11%
Total 55.00 44.00 99.00
55.56% 44.44% 100.00%
100.00% 100.00% 100.00%
55.56% 44.44% 100.00%
Out of 55 % of male respondents a maximum of each of 62 % of individuals prefer rick between 4 to 6 %. out of 44 % of female individuals a maximum of 60 % prefer to take risk between 8 to 10 % which is so interesting finding.
Chi-Square Tests
Statistic Value df Asymp. Sig. (2-tailed)
Pearson Chi-Square 2.89 4 .577
Likelihood Ratio 2.89 4 .576
Linear-by-Linear Association
.01 1 .928
N of Valid Cases 99
Chi-square statistic is 2.89 and p-value is 0.577 > 0.05. So, null hypothesis is accepted. Percentage of risk does not depend on gender.
Symmetric Measures
Category Statistic Value Asymp. Std.
Error Approx. T Approx. Sig.
Ordinal by Ordinal
Spearman Correlation
.00 .10 -.01 0.5
Interval by Interval
Pearson's R .01 .10 .09 0.46
N of Valid Cases
99
Pearson's R is 0.01, which is positive but poor. P-value is 0.46 so the relationship is not statistically significant. Percentage of risk cannot be related with gender

IJEMR – September 2015 - Vol 5 Issue 9 - Online - ISSN 2249–2585 Print - ISSN 2249-8672
Page 27 of 33 www.aeph.in
Table 14: How much risk is advisable? Vs. Age
Age
How much risk is
advisable? < 30 30 to 40 30 to 40 40 to 50 Total
0 to 2 3.00 1.00 5.00 11.00 20.00
15.00% 5.00% 25.00% 55.00% 100.00%
11.54% 11.11% 35.71% 22.00% 20.20%
3.03% 1.01% 5.05% 11.11% 20.20%
2 to 4 5.00 3.00 1.00 6.00 15.00
33.33% 20.00% 6.67% 40.00% 100.00%
19.23% 33.33% 7.14% 12.00% 15.15%
5.05% 3.03% 1.01% 6.06% 15.15%
4 to 6 10.00 1.00 4.00 22.00 37.00
27.03% 2.70% 10.81% 59.46% 100.00%
38.46% 11.11% 28.57% 44.00% 37.37%
10.10% 1.01% 4.04% 22.22% 37.37%
6 to 8 7.00 1.00 3.00 5.00 16.00
43.75% 6.25% 18.75% 31.25% 100.00%
26.92% 11.11% 21.43% 10.00% 16.16%
7.07% 1.01% 3.03% 5.05% 16.16%
8 to 10 1.00 3.00 1.00 6.00 11.00
9.09% 27.27% 9.09% 54.55% 100.00%
3.85% 33.33% 7.14% 12.00% 11.11%
1.01% 3.03% 1.01% 6.06% 11.11%
Total 26.00 9.00 14.00 50.00 99.00
26.26% 9.09% 14.14% 50.51% 100.00%
100.00% 100.00% 100.00% 100.00% 100.00%
26.26% 9.09% 14.14% 50.51% 100.00%
Out of 50% of individuals that belongs to age group 40 to 50, a maximum of 59% of individuals prefer to take risk between 4 to 6%. out of 26% of individuals who belongs to age group of “< 30” a maximum of 43% prefer to take risk between 6 to 8%.

IJEMR – September 2015 - Vol 5 Issue 9 - Online - ISSN 2249–2585 Print - ISSN 2249-8672
Page 28 of 33 www.aeph.in
Chi-Square Tests
Statistic Value df Asymp. Sig. (2-tailed)
Pearson Chi-Square 17.69 12 .126
Likelihood Ratio 16.81 12 .157
Linear-by-Linear Association
.47 1 .492
N of Valid Cases 99
Chi-square statistic is 17.69 and p-value is 0.123. so null hypothesis is accepted. Percentage of risk does not depend on age.
Symmetric Measures
Category Statistic Value Asymp. Std.
Error Approx. T Approx. Sig.
Ordinal by Ordinal
Spearman Correlation
-.07 .10 -.64
Interval by Interval
Pearson's R -.07 .09 -.69
N of Valid Cases
99
Individual preference to take risk negatively related to age groups. Individuals belong to lesser age groups take more risk and individuals belong to higher age groups take less risk.

IJEMR – September 2015 - Vol 5 Issue 9 - Online - ISSN 2249–2585 Print - ISSN 2249-8672
Page 29 of 33 www.aeph.in
Table 15: How much risk is advisable? Vs. Income
Income
How much risk is
advisable?
< 2 lacs 2 to 4 lacs 4 to 6 lacs 6 to 8 lacs 8 to 10 lacs Total
0 to 2 2.00 4.00 5.00 6.00 3.00 20.00
10.00% 20.00% 25.00% 30.00% 15.00% 100.00%
8.00% 21.05% 27.78% 23.08% 27.27% 20.20%
2.02% 4.04% 5.05% 6.06% 3.03% 20.20%
2 to 4 5.00 1.00 6.00 3.00 .00 15.00
33.33% 6.67% 40.00% 20.00% .00% 100.00%
20.00% 5.26% 33.33% 11.54% .00% 15.15%
5.05% 1.01% 6.06% 3.03% .00% 15.15%
4 to 6 10.00 7.00 4.00 12.00 4.00 37.00
27.03% 18.92% 10.81% 32.43% 10.81% 100.00%
40.00% 36.84% 22.22% 46.15% 36.36% 37.37%
10.10% 7.07% 4.04% 12.12% 4.04% 37.37%
6 to 8 3.00 4.00 3.00 2.00 4.00 16.00
18.75% 25.00% 18.75% 12.50% 25.00% 100.00%
12.00% 21.05% 16.67% 7.69% 36.36% 16.16%
3.03% 4.04% 3.03% 2.02% 4.04% 16.16%
8 to 10 5.00 3.00 .00 3.00 .00 11.00
45.45% 27.27% .00% 27.27% .00% 100.00%
20.00% 15.79% .00% 11.54% .00% 11.11%
5.05% 3.03% .00% 3.03% .00% 11.11%
Total 25.00 19.00 18.00 26.00 11.00 99.00
25.25% 19.19% 18.18% 26.26% 11.11% 100.00%
100.00% 100.00% 100.00% 100.00% 100.00% 100.00%
25.25% 19.19% 18.18% 26.26% 11.11% 100.00%
Out of 26% of individuals, whose income is between 6 to 8 lacs a maximum of 10% is willing to take risk between 6 to 8%. A maximum of 40% individuals who belongs to the income groups “< 2 lacs” is willing to take 4 to 6 percent of risk. However, a careful observation might clear that individual who belongs to income group 8 to 10 lacs do not willing to take risk due to the fact that the frequencies and respective percentages are almost zero.
IJEMR – September 2015 - Vol 5 Issue 9 - Online - ISSN 2249–2585 Print - ISSN 2249-8672
Page 30 of 33 www.aeph.in
Chi-Square Tests
Statistic Value df Asymp. Sig. (2-tailed)
Pearson Chi-Square 21.73 16 .152
Likelihood Ratio 25.78 16 .057
Linear-by-Linear Association
1.95 1 .163
N of Valid Cases 99
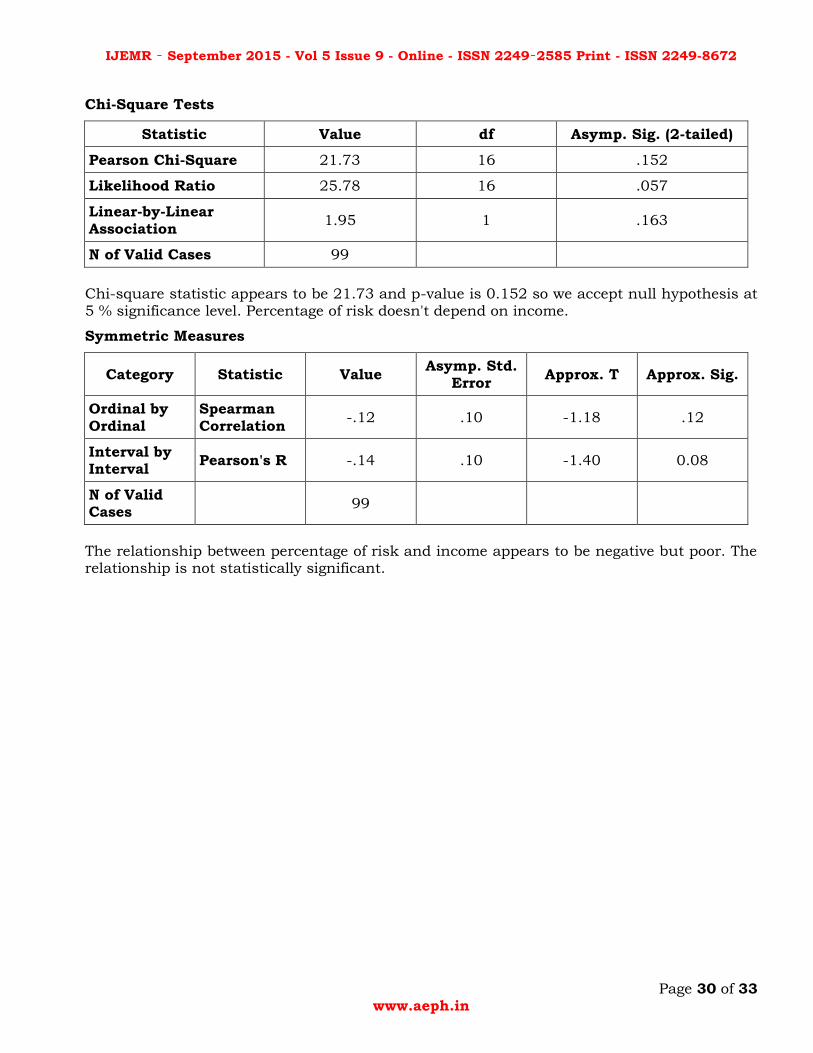
Chi-square statistic appears to be 21.73 and p-value is 0.152 so we accept null hypothesis at 5 % significance level. Percentage of risk doesn't depend on income.
Symmetric Measures
Category Statistic Value Asymp. Std.
Error Approx. T Approx. Sig.
Ordinal by Ordinal
Spearman Correlation
-.12 .10 -1.18 .12
Interval by Interval
Pearson's R -.14 .10 -1.40 0.08
N of Valid Cases
99
The relationship between percentage of risk and income appears to be negative but poor. The relationship is not statistically significant.

IJEMR – September 2015 - Vol 5 Issue 9 - Online - ISSN 2249–2585 Print - ISSN 2249-8672
Page 31 of 33 www.aeph.in
Table 14 How much risk is advisable? Vs Occupation
Occupation
How much risk is
advisable?
Student Business Govt.
employee Private
employee Freelance Total
0 to 2 6.00 3.00 3.00 5.00 3.00 20.00
30.00% 15.00% 15.00% 25.00% 15.00% 100.00%
23.08% 18.75% 15.00% 23.81% 18.75% 20.20%
6.06% 3.03% 3.03% 5.05% 3.03% 20.20%
2 to 4 5.00 2.00 1.00 3.00 4.00 15.00
33.33% 13.33% 6.67% 20.00% 26.67% 100.00%
19.23% 12.50% 5.00% 14.29% 25.00% 15.15%
5.05% 2.02% 1.01% 3.03% 4.04% 15.15%
4 to 6 7.00 6.00 9.00 8.00 7.00 37.00
18.92% 16.22% 24.32% 21.62% 18.92% 100.00%
26.92% 37.50% 45.00% 38.10% 43.75% 37.37%
7.07% 6.06% 9.09% 8.08% 7.07% 37.37%
6 to 8 5.00 3.00 4.00 4.00 .00 16.00
31.25% 18.75% 25.00% 25.00% .00% 100.00%
19.23% 18.75% 20.00% 19.05% .00% 16.16%
5.05% 3.03% 4.04% 4.04% .00% 16.16%
8 to 10 3.00 2.00 3.00 1.00 2.00 11.00
27.27% 18.18% 27.27% 9.09% 18.18% 100.00%
11.54% 12.50% 15.00% 4.76% 12.50% 11.11%
3.03% 2.02% 3.03% 1.01% 2.02% 11.11%
Total 26.00 16.00 20.00 21.00 16.00 99.00
26.26% 16.16% 20.20% 21.21% 16.16% 100.00%
100.00% 100.00% 100.00% 100.00% 100.00% 100.00%
26.26% 16.16% 20.20% 21.21% 16.16% 100.00%
Out of 26 % of students a maximum of 33 % willing to take 2 to 4 % of risk in investments. Out of 21 % private employees a maximum of 21 % are willing to take 6 to 8 % of risk.
IJEMR – September 2015 - Vol 5 Issue 9 - Online - ISSN 2249–2585 Print - ISSN 2249-8672
Page 32 of 33 www.aeph.in
Chi-Square Tests
Statistic Value df Asymp. Sig. (2-tailed)
Pearson Chi-Square 8.73 16 .924
Likelihood Ratio 11.84 16 .755
Linear-by-Linear Association
.23 1 .629
N of Valid Cases 99
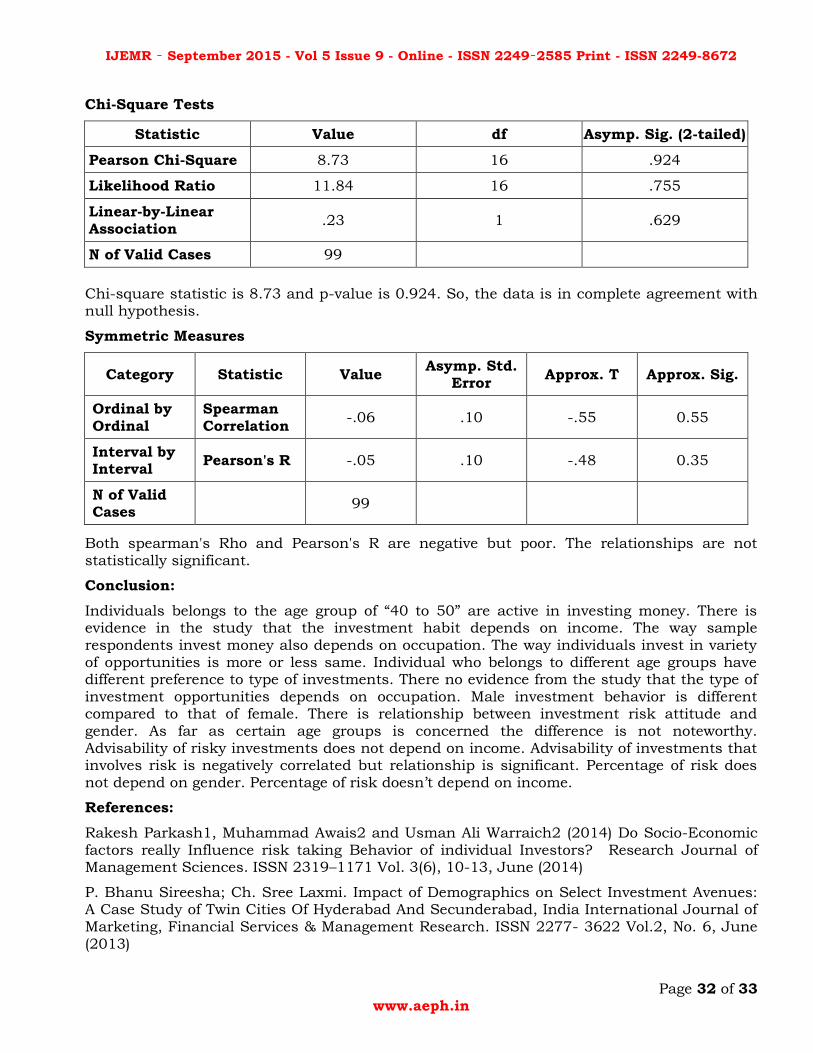
Chi-square statistic is 8.73 and p-value is 0.924. So, the data is in complete agreement with null hypothesis.
Symmetric Measures
Category Statistic Value Asymp. Std.
Error Approx. T Approx. Sig.
Ordinal by Ordinal
Spearman Correlation
-.06 .10 -.55 0.55
Interval by Interval
Pearson's R -.05 .10 -.48 0.35
N of Valid Cases
99
Both spearman's Rho and Pearson's R are negative but poor. The relationships are not statistically significant.
Conclusion:
Individuals belongs to the age group of “40 to 50” are active in investing money. There is evidence in the study that the investment habit depends on income. The way sample respondents invest money also depends on occupation. The way individuals invest in variety of opportunities is more or less same. Individual who belongs to different age groups have different preference to type of investments. There no evidence from the study that the type of investment opportunities depends on occupation. Male investment behavior is different compared to that of female. There is relationship between investment risk attitude and gender. As far as certain age groups is concerned the difference is not noteworthy. Advisability of risky investments does not depend on income. Advisability of investments that involves risk is negatively correlated but relationship is significant. Percentage of risk does not depend on gender. Percentage of risk doesn’t depend on income.
References:
Rakesh Parkash1, Muhammad Awais2 and Usman Ali Warraich2 (2014) Do Socio-Economic factors really Influence risk taking Behavior of individual Investors? Research Journal of Management Sciences. ISSN 2319–1171 Vol. 3(6), 10-13, June (2014)
P. Bhanu Sireesha; Ch. Sree Laxmi. Impact of Demographics on Select Investment Avenues: A Case Study of Twin Cities Of Hyderabad And Secunderabad, India International Journal of Marketing, Financial Services & Management Research. ISSN 2277- 3622 Vol.2, No. 6, June (2013)

IJEMR – September 2015 - Vol 5 Issue 9 - Online - ISSN 2249–2585 Print - ISSN 2249-8672
Page 33 of 33 www.aeph.in
Dr. Mohammad Shafi (2014) Determinants Influencing Individual Investor Behavior In Stock Market: A Cross Country Research Survey. Arabian Journal of Business and Management Review (Nigerian Chapter) Vol. 2, No. 1, 2014
Mohd Abass Bhat1 And Fayaz Ahmad Dar A Conceptual Framework On Emotions And Investment Decisions National Monthly Refereed Journal Of Reasearch In Commerce & Management Volume No.1, Issue No.12 ISSN 2277-1166
Roza Hazli Zakaria, Noor Ismawati Mohd Jaafar and Sabitha Marican Financial Behavior and Financial Position: A Structural Equation Modelling Approach Middle-East Journal of Scientific Research 12 (10): 1396-1402, 2012 ISSN 1990-9233
K.C.John Sasi Kumar*; Dr.P.Vikkraman** A Study on Socio-Economic Characteristics Of Indian Share Market Investors [WITH Special Reference To Coimbatore] International Journal
Of Multidisciplinary Research Vol.1 Issue 5, September 2011, ISSN 2231 5780
Khoa Cuong Phan, Jian Zhou Factors Influencing Individual Investor Behavior: An Empirical Study of the Vietnamese Stock Market American Journal of Business and Management Vol. 3, No. 2, 2014, 77-94 DOI: 10.11634/216796061403527
Sandip Chattopadhyay, Ranjan Dasgupta, Demographic and Socioeconomic Impact on Risk Attitudes of the Indian Investors – An Empirical Study Asian Economic and Financial Review, 2015, 5(4):601-623
Dr. Taqadus Bashir Ms. Scholar Nazish Azam Ms. Scholar Arslan Ali Butt Ms. Scholar
Aaqiba Javed Ms. Scholar Ayesha Tanvir Are Behavioral Biases Influenced By Demographic Characteristics & Personality Traits? Evidence From Pakistan European Scientific Journal October 2013 Edition Vol.9, No.29 Issn: 1857 – 7881 (Print) E - ISSN 1857- 7431
Nour-Mohammad Yaghoubi (Ph.D) Factors Affecting the Adoption of Online Banking An Integration of Technology Acceptance Model and Theory of Planned Behavior International Journal of Business and Management Vol. 5, No. 9; September 2010
Sumit Agarwal* Gene Amromin Itzhak Ben-David Souphala Chomsisengphet Douglas D. Evanoff Financial Literacy and Financial Planning: Evidence from India Retrieved from
Sumit Agarwal* Gene Amromin Itzhak Ben-David Souphala Chomsisengphet Douglas D. Evanoff, Poverty, social stress & mental health Indian J Med Res 126, October 2007, pp 273-278
Puneet Bhushan, Yajulu Medury. Financial Literacy and its Determinants International Journal of Engineering, Business And Enterprise Applications (IJEBEA) Ijebea 13-145; © 2013, IJEBEA
Ahmad Kainuwa*, Najeemah Binti Mohammad Yusuf. Influence of Socio-Economic and Educational Background of Parents on their Children’s Education in Nigeria International Journal of Scientific and Research Publications, Volume 3, Issue 10, October 2013 1 ISSN 2250-3153
John E. Grable1 and So-hyun Joo Financial Help-Seeking Behavior: Theory and Implications Financial Counseling and Planning, Volume 10 (1), 1999