influence of timeline and named-entity components on user engagement
TRANSCRIPT
Influence of Timeline and Named-entity Components on User Engagement
Yashar Moshfeghi1, Michael Matthews2, Roi Blanco2, Joemon M. Jose1
1 School of Computing Science, University of Glasgow, Glasgow, UK
2 Yahoo! Labs, Barcelona, Spain
ECIR 2013, Moscow, Russia

Outline
• User Engagement
• Prediction of User-centred metrics
• Evaluation Methodology
• Results
• Conclusions
the positive aspects of a users’ interaction experience
users’ captivation by a technology

not only be efficient, effective, or satisfying
but alsoengaging

Time Named-Entity
a Cranfield-style paradigm
user engagement

Research Question
• We aim to answer the following research question:
– “can timeline and named-entity components improve user engagement in the context of a news retrieval system?”
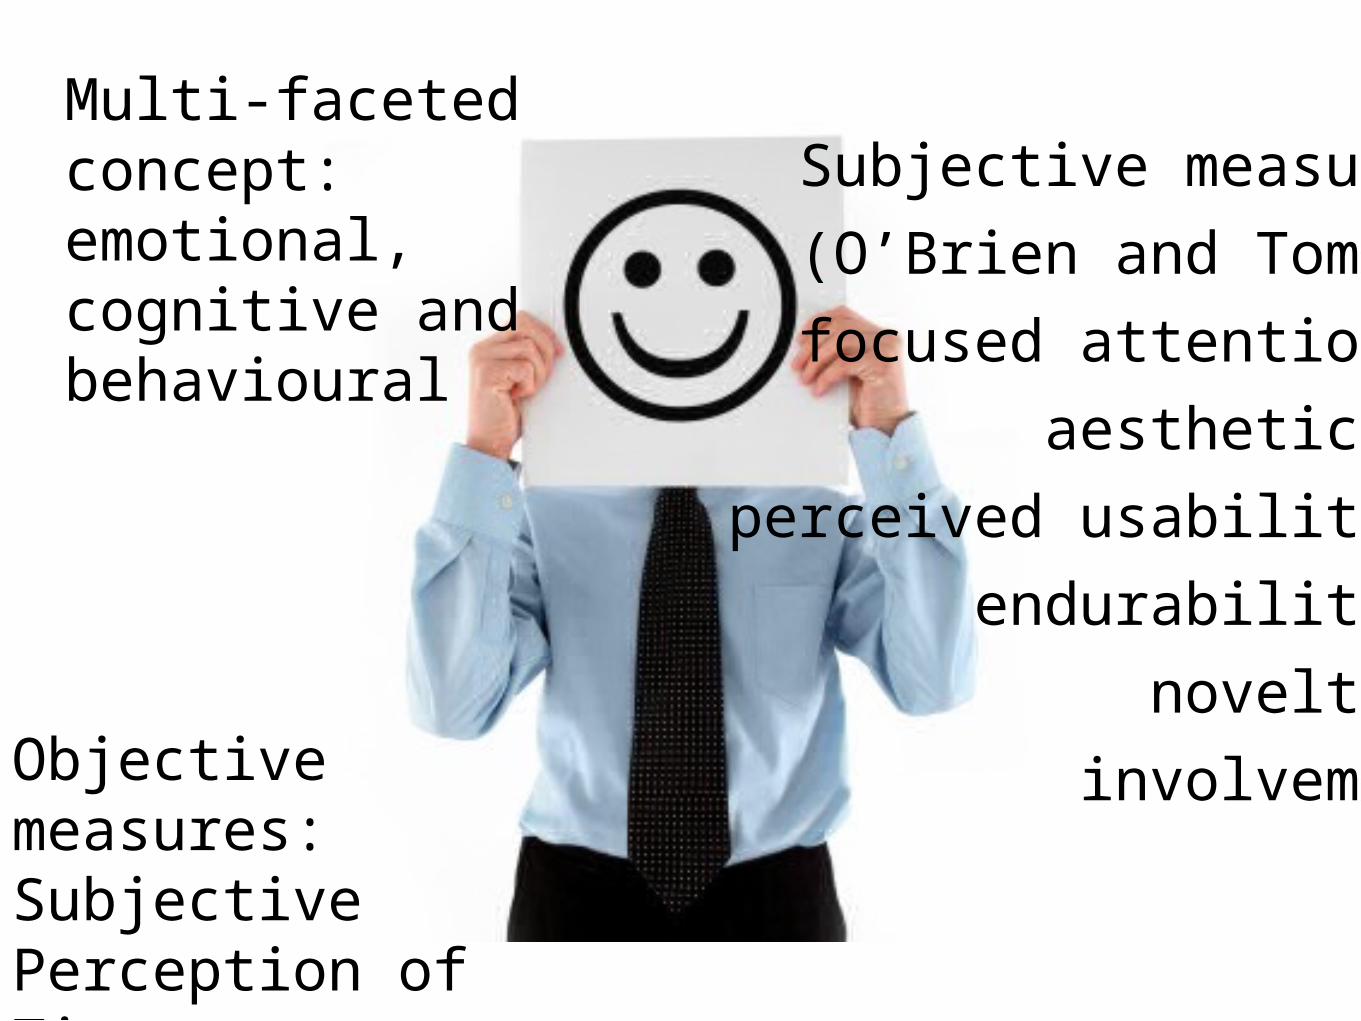
Multi-faceted concept:emotional, cognitive and behavioural
Subjective measures
(O’Brien and Toms):
focused attention,
aesthetics,
perceived usability,
endurability,
novelty,
involvementObjective measures: Subjective Perception of Time

An increase of information-rich user experiences in the search realm (logged interaction data)
Prediction of user preferences for web search results
Prediction of user-centred metrics of an IIR system
Build search applications in which the layout and elements displayed adapt to the needs of the user or context
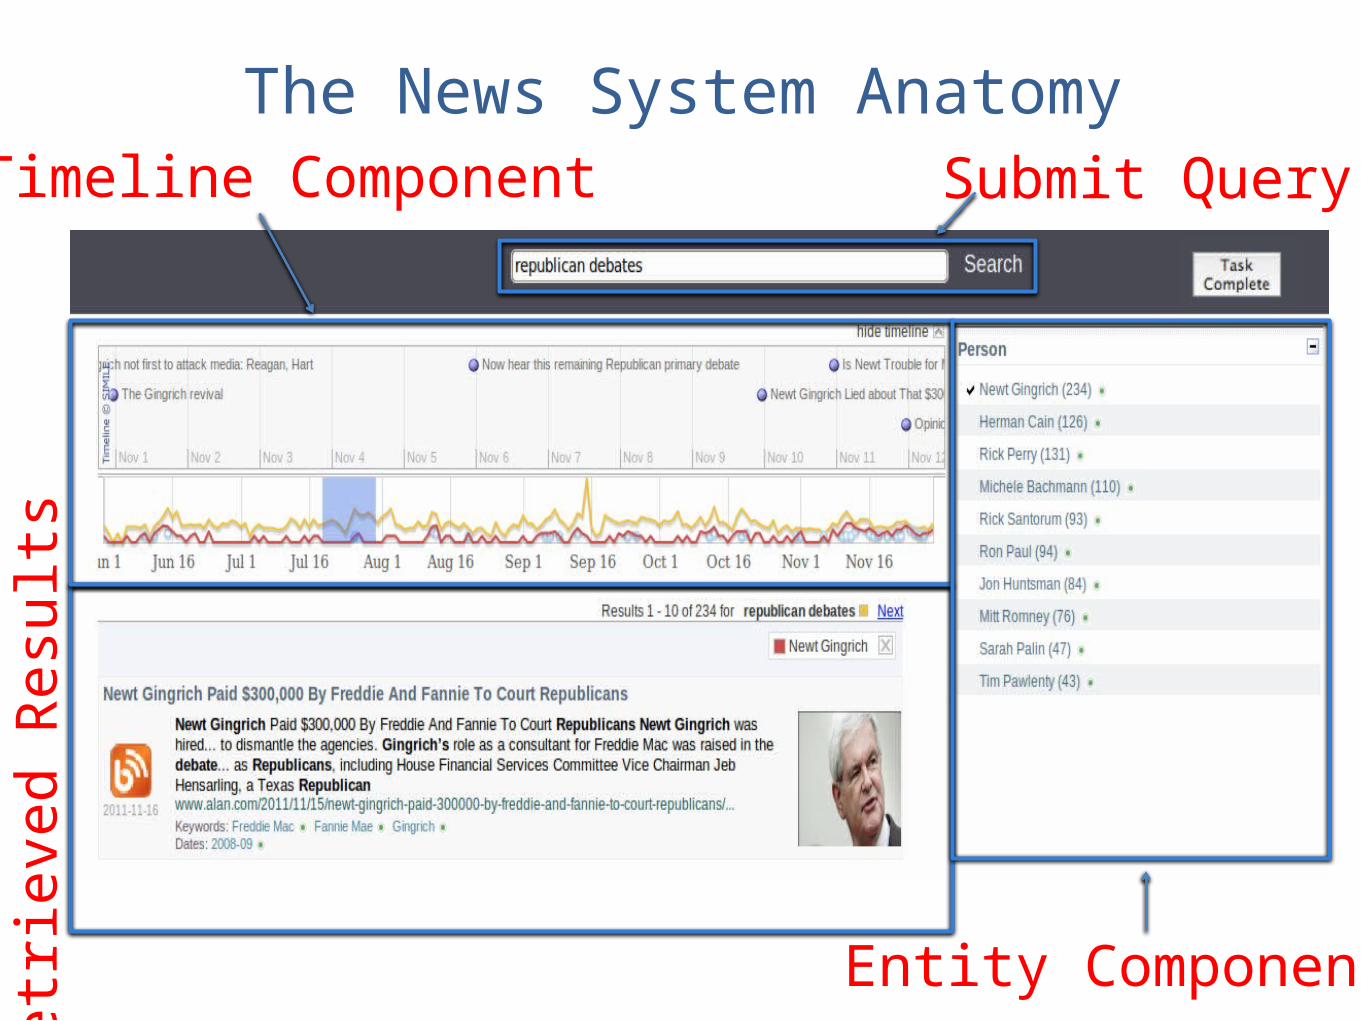
Submit Query
Retr
ieved R
esu
lts
The News System AnatomyTimeline Component
Entity Component

Experimental Methodology
• Design – A ‘within-subjects’ design was used in this study.
• The independent variable – the system (with two levels: baseline, enriched), – controlled by the viewing timeline and named-entity components
(enriched) or hiding them (baseline).
• The dependent variables were: – (i) user engagement
• (involvement, novelty, endurability, usability, aesthetics, attention)
– (ii) system preference

Experimental Methodology - Task
• We used a simulated information need situation.
• The simulated task was defined as follow: – “Imagine you are reading today’s news events and
one of them is very important or interesting to you, and you want to learn more. Find as much relevant news information as possible so that you can construct an overall (big) picture of the event and also cover the important parts of it.”

Experimental Methodology - Task
• The search task was presented twice to each participant with different search topics.

• Advantages:• Reduced monetary cost • Ease of engaging a large number of users in the study.
• Disadvantages• Low quality data and in turn, the challenge is to improve
and assure data quality.
• Need for techniques to minimise • spammers, • multiple account workers• Lazy worker

• Multiple response technique for our questionnaire• known to be very effective and cost efficient to improve
the data quality
• Browser cookies were used to guard against multiple account workers
• To avoid spammers (as recommended in the literature), • Population screening based on location (United States) • HIT approval rate greater than 95%
• To reduce attrition, demographic questions were put at the beginning of the experimental procedure.

Experimental Methodology - Procedure• Participants were instructed that the experiment
would take approximately 60 minutes to complete
• They were informed that they could only participate in this study once
• Payment for study completion was $5 (The total cost of the evaluation was $510 )
• Each participant had to complete two search tasks, one for each level of independent variable (i.e. baseline and enriched system)
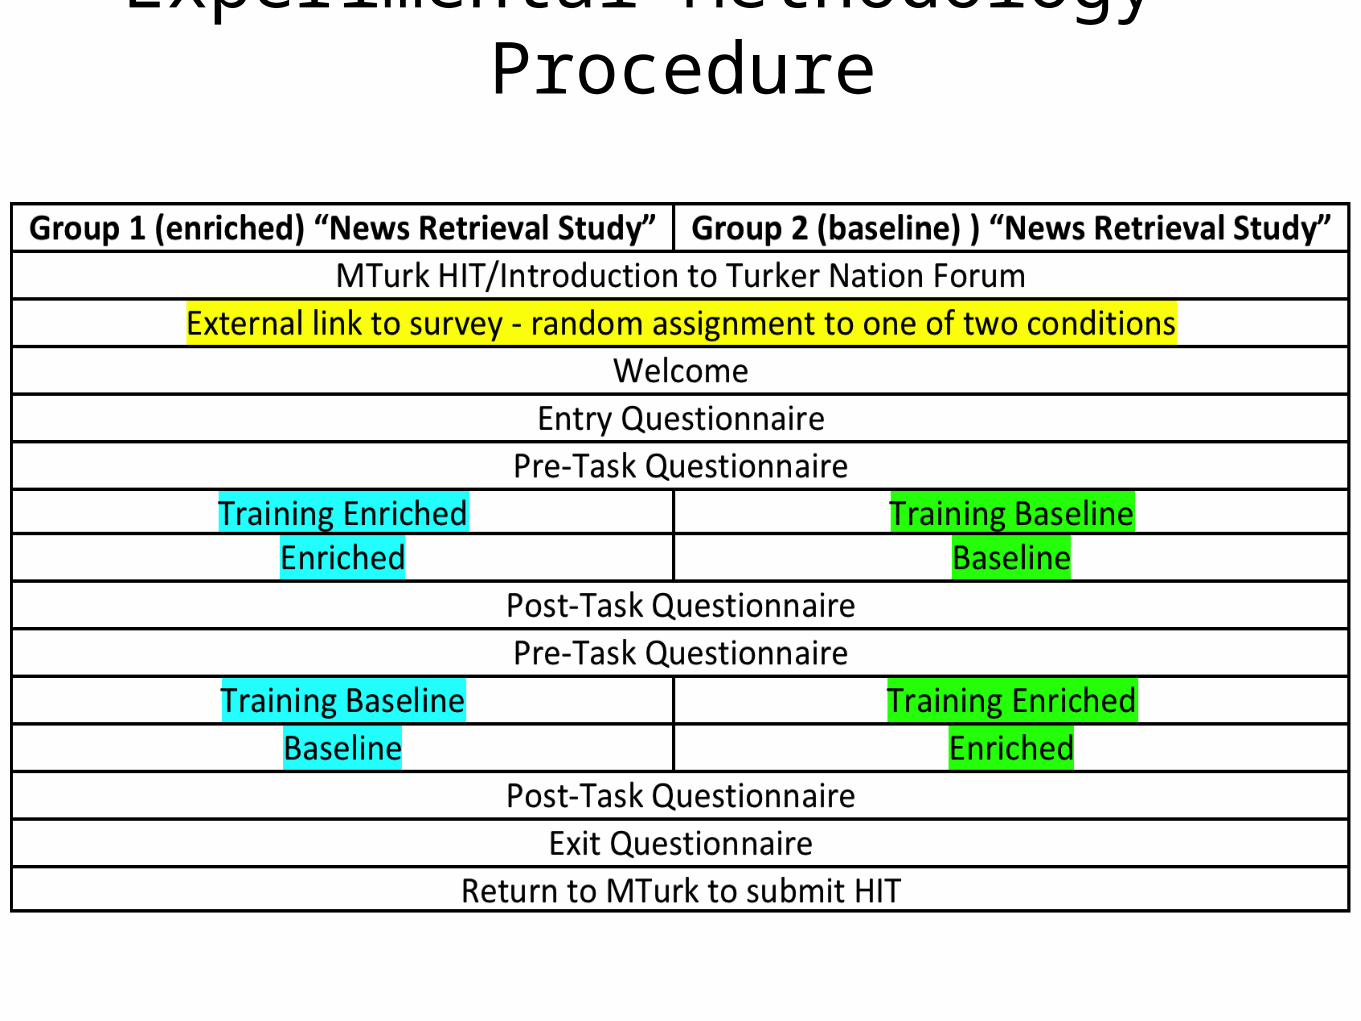
Experimental Methodology - Procedure
Experimental Methodology • We considered six dimensions introduced by O’Brien et al.:
– focused attention, aesthetics, perceived usability, endurability, novelty, and involvement
• The different dimensions were measured through a number of forced-choice type questions.
• A 5-point scale respond (strong disagree to strong agree)– “Based on this news retrieval experience, please indicate whether you
agree or disagree with each statement”.
• In total, in each post-search questionnaire we have asked 31 questions related to user engagement – adapted from O’Brien et al.– randomised its assignment to participants

Experimental Methodology • Pilot Studies: – We run three pilot studies using 10 participants.
– Other changes consisted of • modifications to the questionnaires to clarify questions, • modifications to the system to improve logging capabilities• improvements to the training video.
– After the final pilot, it was determined that • the participants were able to complete the user study without
problems • the system was correctly logging the interaction data.
Results Analysis – Data Preprocessing• To ensure the availability of relevant documents– two evaluators manually calculated
• the Precision@1, 5, and 10 • for all the topics • a set of queries issued by the participants.
– Precision@1, 5 and 10 were 0.85, 0.84, and 0.86 respectively,
– Judges had a very high inter-annotator agreement with Kappa > 0.9.
– This indicates that the queries the users issued into the system had good coverage and the ranking was accurate enough.
Results Analysis – Data Preprocessing• 63 out of 92 users successfully completed the study.
• A relatively even split by condition, with 47% in the scenario where group 1, and 53% conversely.
• We removed the – incomplete surveys – participants who repeated the study
– participants who completed the survey incorrectly (based on task conditions)• they had to visit at least three relevant documents for a given topic, and • the issued queries should be related to the selected topic
– identifying suspect attempts by checking • the extremely short task durations• comments that are repeated verbatim across multiple open-ended questions

Results Analysis – Demographic Info.• 126 search sessions that were successfully carried out by 63 participants.
• The 63 participants– female=46%, male=54%, prefer not to say=0%– were mainly under the age of 41 (84%)
• with the largest group between the ages of 24-29 (33.3%).
• Participants had – a high school diploma or equivalent (11.11%), – associates degree (15.87%), – graduate degree (11.11%), – bachelor (31.7%) or – some college degree (30.15%).
• They were – primarily employed for a company or organisation (39.68%), – though there were a number of self-employed (22.22%), – students (11.11%), and – not employed (26.98%).

Results Analysis

Results Analysis
• We did not find any statistically significant difference between the two systems for Subjective Perception of Time metric – with mean and standard deviation of 10.03, ±
5.22, and 10.12, ±4.95, for the baseline and enriched system respectively
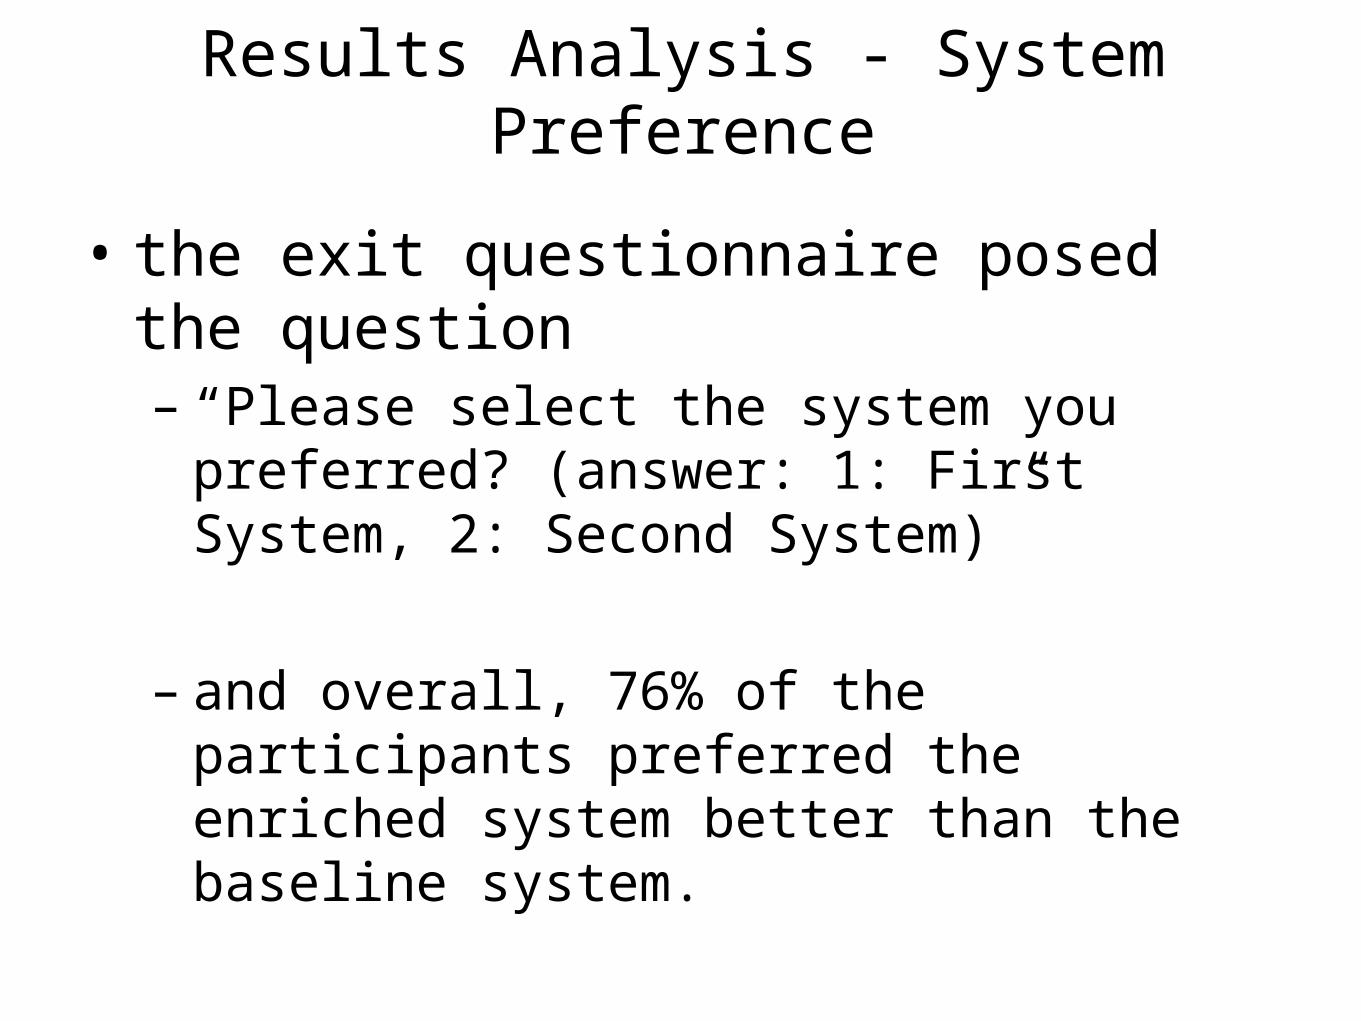
Results Analysis - System Preference
• the exit questionnaire posed the question – “Please select the system you preferred? (answer:
1: First System, 2: Second System)”
– and overall, 76% of the participants preferred the enriched system better than the baseline system.
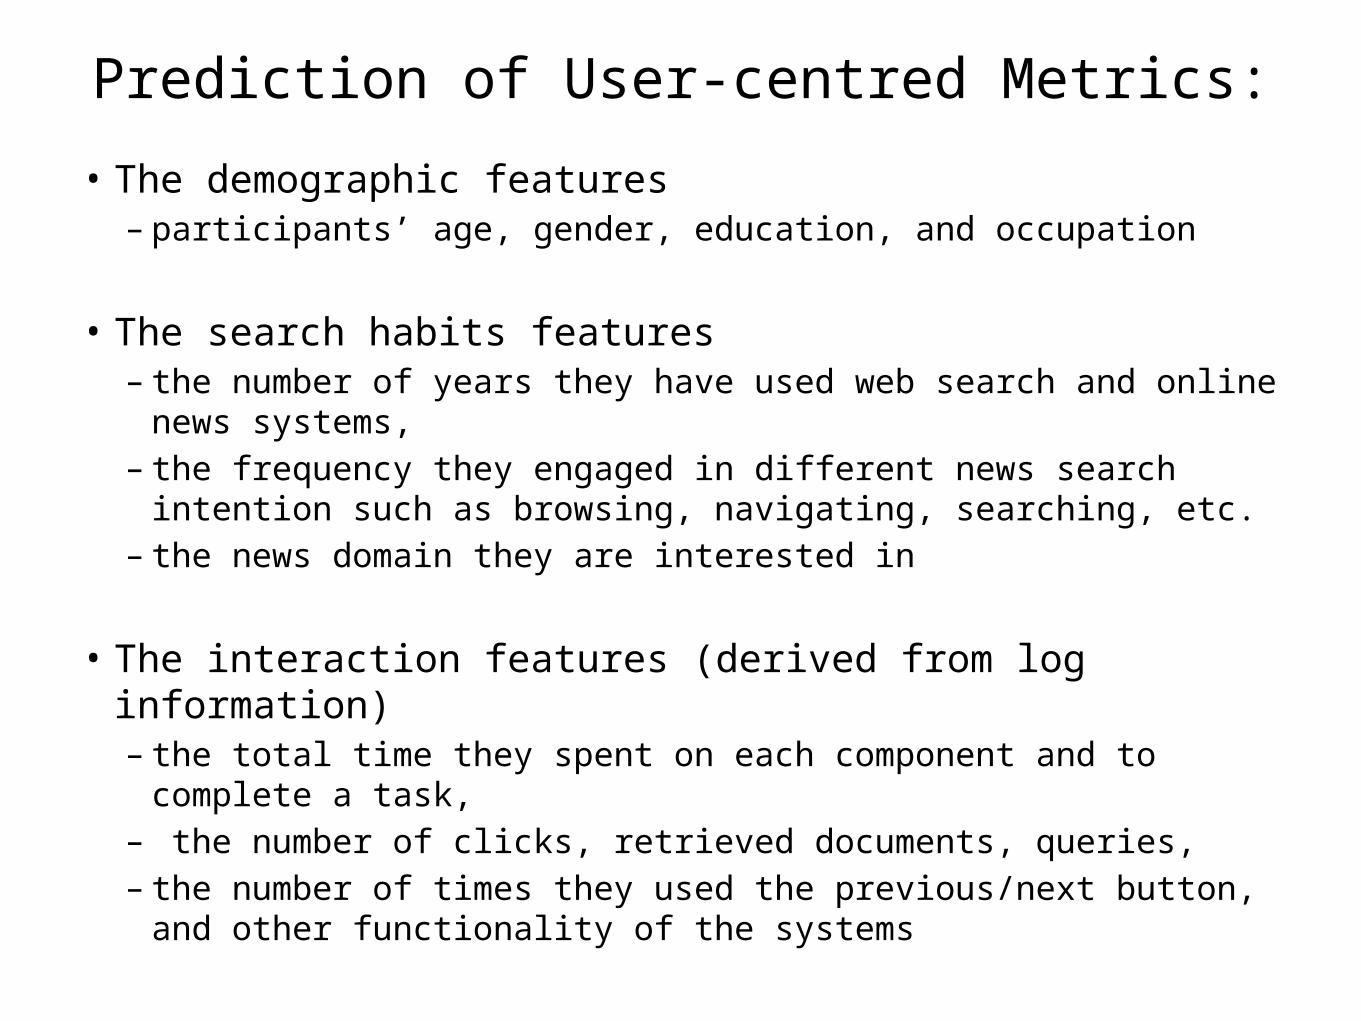
Prediction of User-centred Metrics: • The demographic features
– participants’ age, gender, education, and occupation
• The search habits features– the number of years they have used web search and online news
systems, – the frequency they engaged in different news search intention such
as browsing, navigating, searching, etc. – the news domain they are interested in
• The interaction features (derived from log information)– the total time they spent on each component and to complete a task,– the number of clicks, retrieved documents, queries, – the number of times they used the previous/next button, and other
functionality of the systems

Prediction of User-centred Metrics:
• We chose – the System Preference question – all the user engagement dimensions.
• For System Preference question, – we have a binary class of “−1” indicating the participant did not
prefer the enriched system and “+1” otherwise.
• For the user engagement dimensions, – we used the final value calculated by aggregating all the
questions related to each dimension – We transformed the values for each dimension to binary by
mapping 4-5 to “+1” and otherwise to “−1”
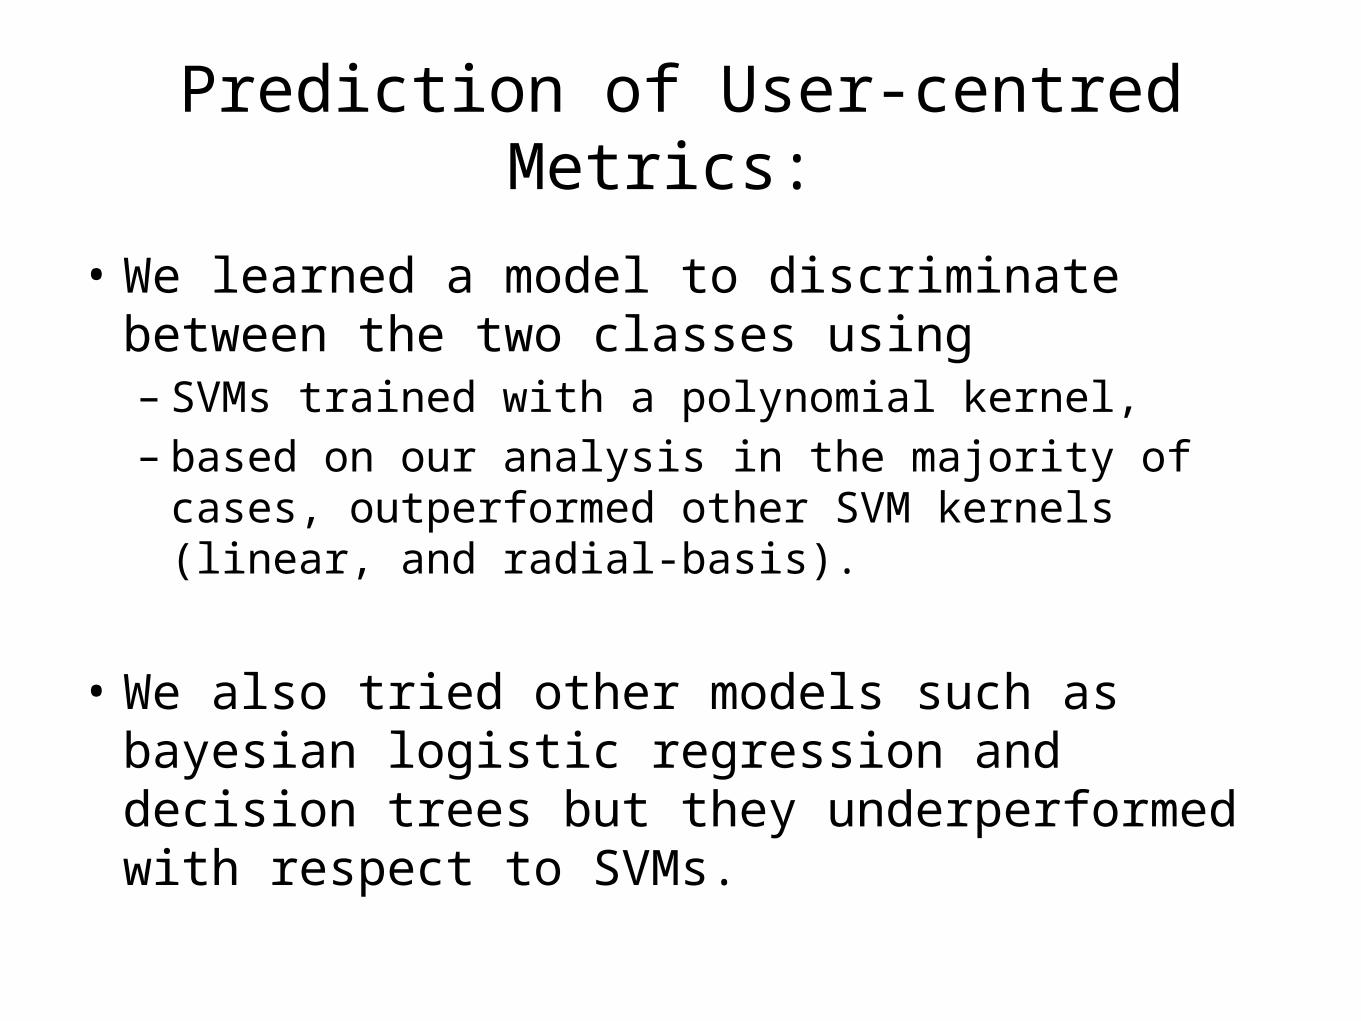
Prediction of User-centred Metrics:
• We learned a model to discriminate between the two classes using – SVMs trained with a polynomial kernel, – based on our analysis in the majority of cases,
outperformed other SVM kernels (linear, and radial-basis).
• We also tried other models such as bayesian logistic regression and decision trees but they underperformed with respect to SVMs.

Prediction of User-centred Metrics:
• classification performance – averaged over the 63 participants of the study– using 10-fold cross validation
Results indicate that ◦ for all the user engagement dimensions (excluding focused attention),
the combination of all features leads to the best prediction accuracy
◦ Regarding the system preference question, user-system interaction features determine with high accuracy the participants’ preference of a system (over 87%).
Summary• Given the competitiveness of the market on the web, applications
nowadays are designed to be both efficient and engaging.
• Thus, a new line of research is to identify system features that steer user engagement.
• This work studies the interplay between user engagement and retrieval of named-entities and time, in an interactive search scenario.
• We devised an experimental setup that exposed our participants on two news systems, one with a timeline and named-entity components and one without.
• Two search tasks were performed by the participants and through questionnaires, user engagement was analysed.
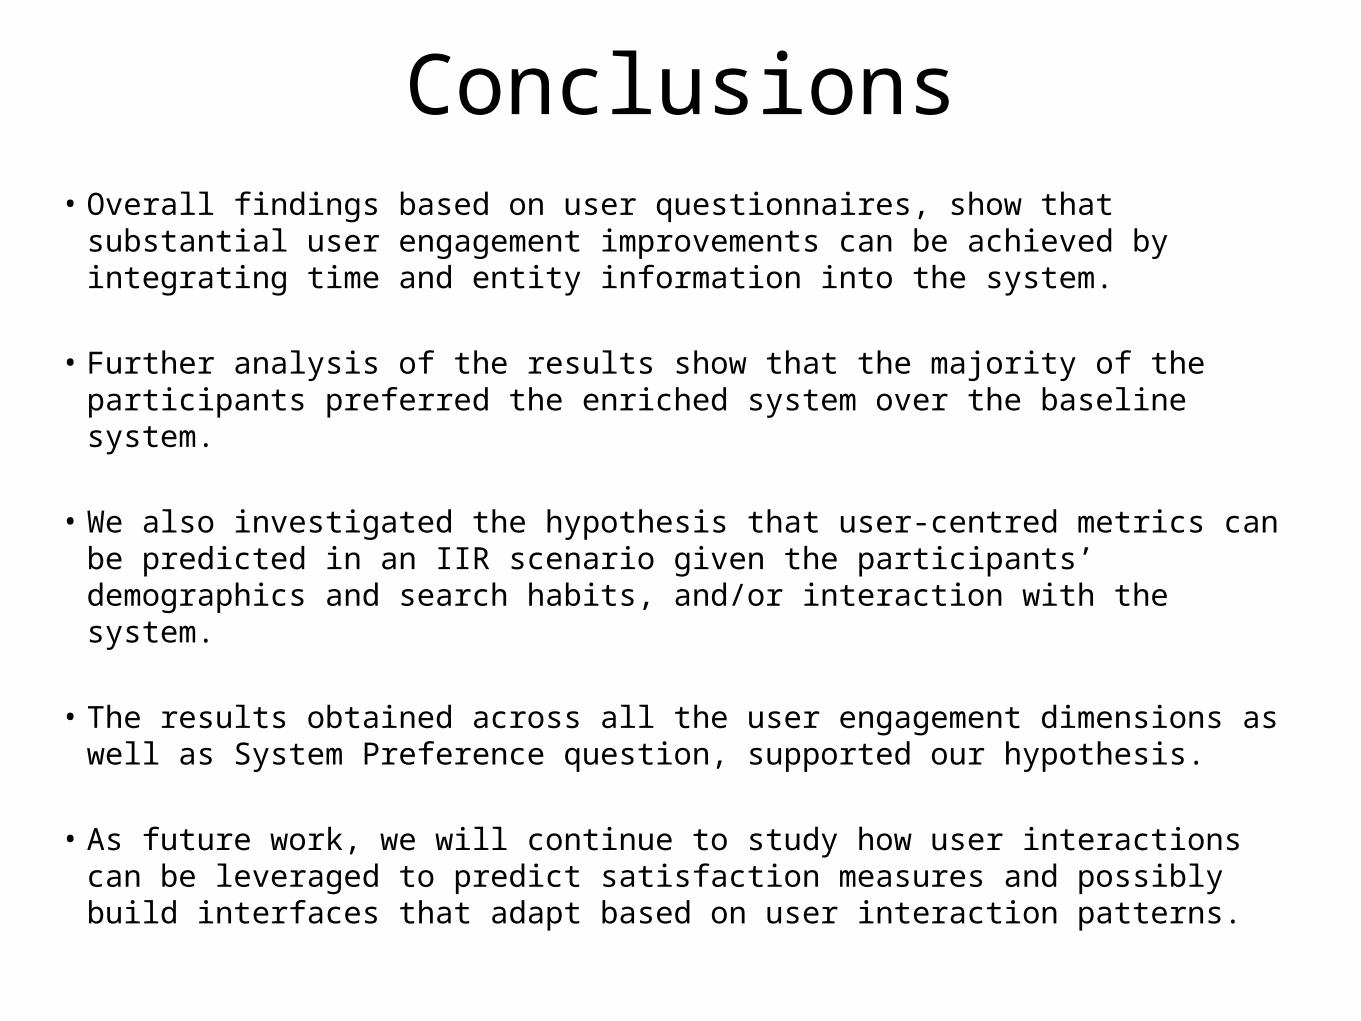
Conclusions• Overall findings based on user questionnaires, show that substantial user
engagement improvements can be achieved by integrating time and entity information into the system.
• Further analysis of the results show that the majority of the participants preferred the enriched system over the baseline system.
• We also investigated the hypothesis that user-centred metrics can be predicted in an IIR scenario given the participants’ demographics and search habits, and/or interaction with the system.
• The results obtained across all the user engagement dimensions as well as System Preference question, supported our hypothesis.
• As future work, we will continue to study how user interactions can be
leveraged to predict satisfaction measures and possibly build interfaces that adapt based on user interaction patterns.
Acknowledgement: This work was partially supported by the EU FP7 LiMoSINe project (288024).
This work was performed while intern at Yahoo! Research lab in Barcelona.