influence of venturi tube geometry and particle … influence of venturi tube geometry and particle...
TRANSCRIPT
i
Influence of Venturi Tube Geometry and Particle Properties on the
Hydrodynamic Cavitation for Fine Particle Flotation
by
Mingda Li
A thesis submitted in partial fulfillment of the requirements for the degree of
Master of Science
in
Chemical Engineering
Department of Chemical and Materials Engineering
University of Alberta
© Mingda Li, 2017
ii
ABSTRACT
In this study, the influences of both Venturi tube geometry and particle properties on the
hydrodynamic cavitation are investigated. In the geometry study, we investigated numerically
and experimentally the influence of several geometrical parameters on the cavitation inception
and bubble generation. Using a dimensionless number analysis, an inverse relation is found
between the cavitation inception and the single-phase flow resistance set by the geometry. In
the cavitation regime, the flow resistance induced by cavitation follows a single trend regardless
of the studied geometries. The small outlet angle associated with low inception velocity was
found to be favorable for cavitation activities. Moreover, the amount of bubbles generated was
found to be correlated to extra flow resistance induced by the cavitation process and the
dissolved gas concentration. The insights gained in this study provided a guideline to design
efficient Venturi tube in regard to the cavitation process for fine particle flotation. In industrial
applications in mineral processing, fluid under hydrodynamic cavitation has large amount of
particle content with different properties. In this work, the changes in cavitation behavior were
examined with the particles of different surface properties. The results were quantified by
dimensionless number method developed in the geometry study. In comparison with water, the
hydrophobic particles were found to be favorable for cavitation. Finally, the significant drop in
cavitation inception velocity with bubble injection was observed by using the existing
equipment and experimental methods.
iii
ACKNOWLEDGEMENT
I would like to express my sincere gratitude to my supervisor, Prof. Qingxia (Chad) Liu for his
support and enthusiastic encouragement during my graduate studies. The knowledge and skills
I have gained over this time will undoubtedly serve me well as I move forward on to the next
stage of my life.
I would like to express great appreciation to my advisor, Dr. Adrien Bussonnière who has
pushed me to look at things under a different perspective. His support has been invaluable.
I would like to thank Mr. Carl Corbett for his knowledge and assistance in the equipment design
and setup that was used for this project.
I would also like to thank the co-op and summer students Matt Bronson, Brian Leung, Angela
Xue, Owais Khalid and Vitalii Dodonov for their help re-running these tests to gather the data.
I would like to thank Prof. Zhenghe Xu for allowing me to borrow and use different lab
equipment. Without his generous contribution, I would not have been able to finish this thesis.
I would like to express my appreciation to all the colleagues from the research group for all
their support and assistance.
I would like to acknowledge the financial support from Natural Science and Engineering
Research Council of Canada (NSERC), the Canadian Centre for Clean Coal/Carbon and
Mineral Processing Technologies (C5MPT) and Canadian Mining Industry Resource
Organization (CAMIRO).
iv
Table of Contents
Chapter 1 Introduction............................................................................................. 1
1.1 Background............................................................................................…... 1
1.2 Thesis objectives........................................................................................... 5
1.3 Organization of the thesis............................................................................. 5
Chapter 2 Literature Review.................................................................................... 7
2.1 Disadvantages and advantages of Cavitation............................................. 7
2.2 Applications of caivitaion........................................................................... 8
2.2.1 Water treatment……………………………………………………..... 9
2.2.2 Chemical reaction enhancing.............................................................. 10
2.2.3 Food Processing…............................................................................ 12
2.3 Effect of device geometry on cavitation....................................................... 13
2.4 Gas nucleation by cavitaion........................................................................... 16
Chapter 3 Material and Methods…......................................................................... 21
3.1 CFD simulation.............................................................................................. 21
3.2 3D printing..................................................................................................... 23
3.3 Experimental petup….................................................................................... 25
3.3.1 General material and equipment in Venturi tube geometry study..….. 25
3.3.2 Cavitation inception measurement ....................................................... 27
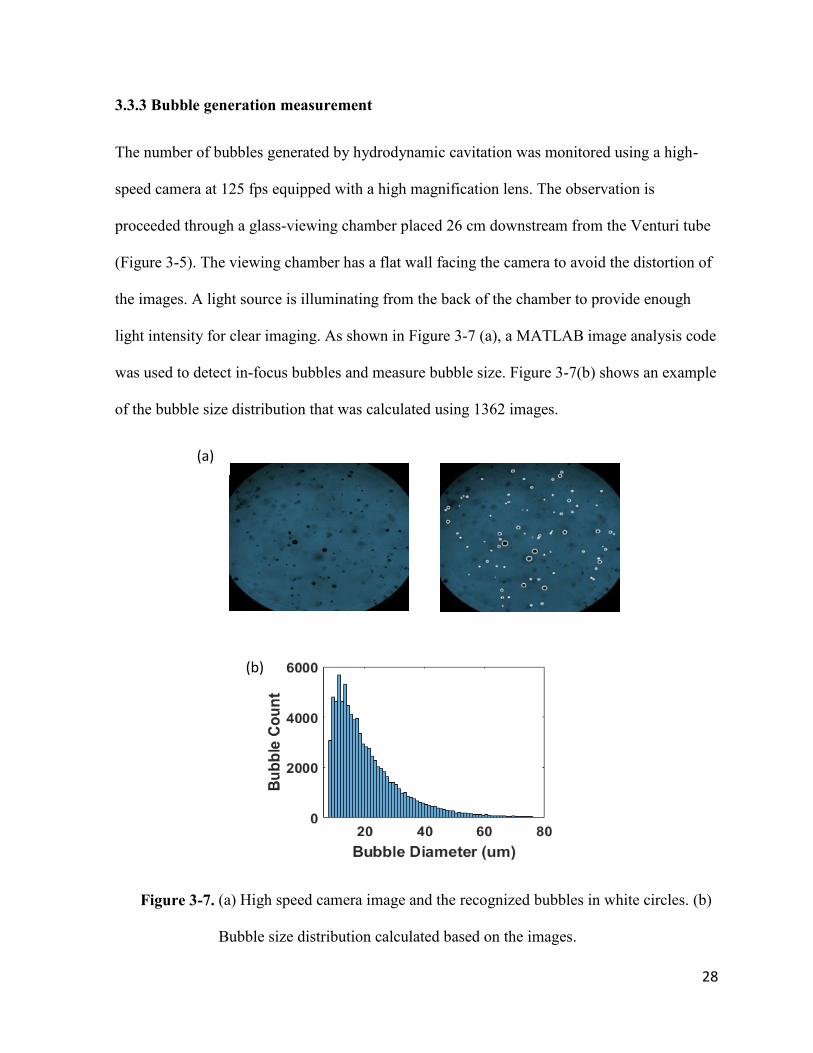
3.3.3 Bubble generation measurement .......................................................... 28
3.3.4 Flow damper and dissolved gas ........................................................... 29
3.3.5 Setup adjustment for particle addition and gas injection study……… 29
3.4 Parameters and equations…………………………...………….………….. 31
v
3.5 Particle preparation and characterization methods........................................ 35
3.5.1 Mastersizer measurement...................................................................
3.5.2 SEM imaging…………………..........................................................
3.5.3 Contact angle measurement and hydrophobic bath……....................
3.5.4 Film flotation………………………………………………………..
35
37
39
40
Chapter 4 Results and Discussion of Venturi Geometry Study ........................... 43
4.1 CFD simulation of Venturi tube pressure profile.......................................... 43
4.2 Effect of Venturi geometry on cavitation inception…………...…………... 46
4.3 Cavitation behavior expressed by loss coefficient ........................................ 49
4.4 Effect of Venturi geometry on bubble generation…… ................................ 51
4.5 Effect of dissolved air on bubble generation................................................. 53
Chapter 5 Results and Discussion of Particle Property Study ............................. 55
5.1 Particle characterization…………………………………………………… 56
5.2 Effect of particle concentration on cavitation behaviors............................... 58
5.3 Effect of particle hydrophobicity on cavitation behaviors............................ 62
5.4 Effect of other particle addition on cavitation behaviors……...................... 67
5.5 Effects of gas injection on cavitation behaviors………………………........ 69
Chapter 6 Conclusions and Contribution to Original Knowledge……………... 72
6.1 Conclution……………………………...….…............................................. 72
6.2 Contribution to original knowledge…………………………...…………... 74
Chapter 7 Future Work…………………………………………….……………... 75
References………..………………………………………………….……………... 77
vi
List of Figures
Figure 1-1 Schematic diagram of three micro-processes in flotation. This figure is re-
plotted according to Tao (2005)…………………………………………….
2
Figure 2-1 Multiple hole orifice plates having different combination of number and
diameter of holes (Sivakumar, 2002)……………………………………….
15
Figure 2-2 Bubble nucleation energy as a function of seed bubble radius for ΔP = 1
MPa. ΔE∗and 𝑟𝑏∗ are the nucleation energy barrier and critical bubble
radius respectively…………………………………………………………..
17
Figure 2-3 Three models of heterogeneous nucleation. (a) Flat hydrophobic surface
(θ > π/2). (b) Flat hydrophilic surface (θ < π/2). (c) Conical cavity. This
figure is replotted according to Christopher et al. (1995) and Jones (1999).
19
Figure 3-1 Three steps of single-phase simulation study: (a) construction of tube
geometry, (b) simulation performance, (c) extraction of pressure profile….
22
Figure 3-2 Schematic diagram of a Venturi tube and its associated parameter symbols. 22
Figure 3-3 3D models of Venturi tubes used for geometry investigation……………… 24
Figure 3-4 Tube product printed by using the direct ink writing (left) and SLA (right). 25
Figure 3-5 Schematic of the experimental setup using in Venturi tube geometry
study………………………………………………………………………...
26
Figure 3-6 Acoustic power spectrum before and after cavitation inception…………… 27
vii
Figure 3-7 (a) High speed camera image and the recognized bubbles in white circles.
(b) Bubble size distribution calculated based on the images………………..
28
Figure 3-8 Schematic of the experimental setup used in the particle and bubble
addition study……………………………………………………………….
30
Figure 3-9 Picture of the Venturi tube holder with gas injection……………………… 31
Figure 3-10 The hydrodynamic condition presented in (a) inlet pressure vs. throat
velocity, and (b) loss coefficient vs. downstream cavitation number………
33
Figure 3-11 Example of cavitation probability in terms of downstream cavitation
number with the indication of inception (µ)………………………………..
34
Figure 3-12 The angle of scattered light after light beam passes through particle with
different sizes………………...……………………………………………..
36
Figure 3-13 SEM images of particles at 400x and 600x: (a) graphite after 3 minutes of
grinding, (b) silica after 5 minutes of grinding, (c) glass beads…………….
38
Figure 3-14 Schematic depiction of forming a hydrophobic coating with DMDCS on
silica surface………………………………..……………………………….
40
Figure 3-15 Schematic representation of the four states involves in film flotation. This
figure is re-plotted according to Diao and Fuerstenau (1991)………………
41
Figure 3-16 Cumulative percentage of particles not imbibed by the liquid and the
indications of wetting surface tensions……………………………………..
42
viii
Figure 4-1 Pressure profile along the Venturi tubes at 20 m/s throat velocity with
different geometrical parameters: (a) inlet angle, (b) throat length, (c)
outlet angle, (d) diameter ratio……………………………………………...
44
Figure 4-2 The CFD single-phase simulation generated streamlines for two tubes with
outlet angle of 19o and 5o…………………………………………………...
45
Figure 4-3 (a) Throat velocity and (b) power at cavitation inception for different
outlet angles…….…………………………………………………………..
47
Figure 4-4 (a) Throat velocity and (b) power at cavitation inception for different
diameter ratios................................................................................................
48
Figure 4-5 Loss coefficient in terms of downstream cavitation number for different
Venturi tube geometries…………………………………………………….
50
Figure 4-6 Total bubble volume as the function of cavitation loss for different tube
designs………………………………………………………………………
52
Figure 4-7 (a) Total bubble volume and (b) normalized bubble volume in terms of the
cavitation loss with and without water-air insulation for a diameter ratio of
4.5 and outlet angle of 5°………….………………………………………..
54
Figure 5-1 Lyophobic fraction of treated and untreated silica, graphite particles and
glass beads in water-methanol solutions…………………………...……….
57
Figure 5-2 (a) Loss coefficient and (b) cavitation probability in terms of downstream
cavitation number with bare silica slurries at different concentrations…….
59
ix
Figure 5-3 Cavitation probability for forward and backward water tests……………… 61
Figure 5-4 (a) Loss coefficient and (b) cavitation probability in terms of downstream
cavitation number with hydrophobic treated silica slurries at different
concentrations………………………………………………………………
63
Figure 5-5 Throat velocity at inception in terms of particle concentration for silica
particles with and without hydrophobic coating……………………………
64
Figure 5-6 Cavitation Scale in terms of downstream cavitation number with 20 g/L
treated silica slurry after different cavitating time..…………………...……
66
Figure 5-7 Film flotation of fresh treated silica particles and those after 1 hour of
cavitation……………………………………………………………………
66
Figure 5-8 (a) Loss coefficient and (b) cavitation scale in terms of downstream
cavitation number with particles at 5 g/L.…………………………………..
68
Figure 5-9 Cavitation probability vs. throat velocity with and without bubble
injection.……. ……………………………………………………………...
70
Figure 5-10 Loss coefficient in terms of downstream cavitation number with gas
injection at different rates…………………………………………………..
71
x
List of Tables
Table 3-1 Specifications of Venturi tubes tested in single-phase numerical
simulation…………………………………………………………………
23
Table 3-2 Particle sizes with different grinding time measured using Mastersizer
3000……………………………………………………………………….
36
Table 4-1 The average single-phase loss coefficient Lc0 for the different
geometries………………………………………………………………….
50
Table 5-1 Properties of tested particles……………………………………………… 56
xi
NOMENCLATURE
A Reference area
cd Drag coefficient
cw Concentration of solids by weight
d Venturi tube throat diameter
D Venturi tube inlet and outlet diameter
Db Bubble diameter
Dp Particle diameter
Eb Energy barrier for a bubble to form
Fd Drag force
f Cumulative distribution fraction
L Venturi tube throat length
Lc Loss coefficient
Lc0 Mean system loss
P Power consumption
Pin Power consumption at inception
Pt Total collection probability
Pa Attachment probability
Pc Collision probability
Pd Detachment probability
pd Pressure at downstream of the Venturi tube
pg Gas partial pressure
pu Pressure at upstream of the Venturi tube
xii
pv Vapor pressure
Q Flow rate
rb Bubble radius
s Standard deviation
ub Bubble rising velocity
v Flow velocity
vth Flow velocity at the Venturi tube throat
Re Reynolds number
ΔP Pressure difference between vapor and liquid pressure
α Venturi tube convergent or inlet angle
β Venturi tube divergent or outlet angle
𝛾c Critical wetting surface tension
𝛾LV Liquid-gas surface tension
µ Mean of the cumulative distribution
µl Liquid density
θ Contact angle
ρ Mass density of the mixture
ρs Mass density of the solid
ρl Mass density of the liquid
σ Cavitation number
σd Downstream cavitation number
σdin Downstream cavitation number at inception
σu Upstream cavitation number
xiii
ABBREVIATIONS
BS Bare Silica
BSE Back-scattered electrons
CFD Computational fluid dynamics
DMDCS Dimethyldichlorosilane
GB Glass bead
HC Hydrodynamic cavitation
LBM Lattice Boltzmann Method
SE Secondary electrons
SEM Scanning electron microscope
SLA Stereolithography
TS Treated silica
1
Chapter 1 Introduction
1.1 Background
Froth flotation is a commonly used mineral extraction process utilizing the air bubbles to attach
onto target minerals for separation from other solid particles with different surface wettabilities
(Yoon and Luttrell 1986, 1997). In the flotation process, rising bubbles injected from the
column bottom collide with, and attach to the hydrophobic particles. If the bubble-particle
agglomerate has an overall density less than the liquid phase, the targeted mineral is brought to
the top froth layer, leaving the rest of particles discharged from the column bottom. In the
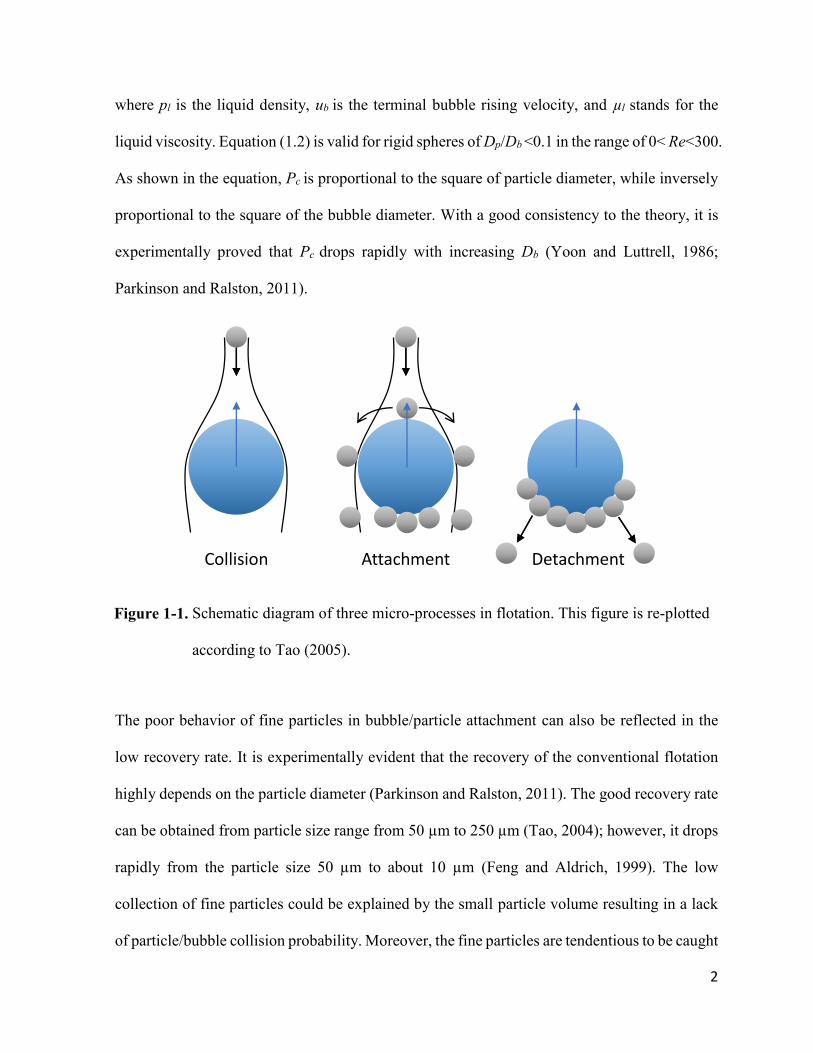
flotation process, the probability of particle collection, Pt, is determined by three micro-scale
processes factors (Figure 1-1) (Yoon and Luttrell, 1986; Tao 2005) defined as:
𝑃𝑡 = 𝑃𝑐𝑃𝑎(1 − 𝑃𝑑)
where Pc is the bubble/particle collision probability, Pa is the bubble/particle attachment
probability, and Pd is the bubble/particle detachment probability. The collision probability Pc
can be quantified as the fraction of particles that collide with a rising bubble (Weber and
Paddock, 1983; Yoon and Luttrell, 1986) defined as:
𝑃𝑐 =3
2(
𝐷𝑝
𝐷𝑏)2[1 +
3
16𝑅𝑒𝑏
1+0.249𝑅𝑒0.56]
where Dp and Db are the particle and bubble diameter respectively. Reb is the bubble Reynolds
number defined as:
𝑅𝑒 =ρ𝑙u𝑏𝐷𝑏
µ𝑙
(1.1)
(1.2)
(1.3)
2
where pl is the liquid density, ub is the terminal bubble rising velocity, and µl stands for the
liquid viscosity. Equation (1.2) is valid for rigid spheres of Dp/Db <0.1 in the range of 0< Re<300.
As shown in the equation, Pc is proportional to the square of particle diameter, while inversely
proportional to the square of the bubble diameter. With a good consistency to the theory, it is
experimentally proved that Pc drops rapidly with increasing Db (Yoon and Luttrell, 1986;
Parkinson and Ralston, 2011).
Figure 1-1. Schematic diagram of three micro-processes in flotation. This figure is re-plotted
according to Tao (2005).
The poor behavior of fine particles in bubble/particle attachment can also be reflected in the
low recovery rate. It is experimentally evident that the recovery of the conventional flotation
highly depends on the particle diameter (Parkinson and Ralston, 2011). The good recovery rate
can be obtained from particle size range from 50 µm to 250 µm (Tao, 2004); however, it drops
rapidly from the particle size 50 µm to about 10 µm (Feng and Aldrich, 1999). The low
collection of fine particles could be explained by the small particle volume resulting in a lack
of particle/bubble collision probability. Moreover, the fine particles are tendentious to be caught
Collision Attachment Detachment
3
in streamlines created by rising bubble, rather than to rupture the liquid film between bubble
and particle (low Pc). (Zhou et al., 1997; Parkinson and Ralston, 2011).
As many minerals are finely disseminated throughout the ores, it has always been challenges to
improve the recovery of fine particles. To increase bubble/particle collision probability,
researchers have reported techniques such as oil-assisted flotation, carrier flotation, shear
flocculation and selective polymer flocculation (Forbes, 2011; Warren, 1975; Trahar and
Warren, 1976; Subrahmanyam and Frossberg, 1990; Gregory and Barany, 2011; Forbes et al.,
2011) aiming to improve the effective size of fine particles through aggregation. The purpose
of oil and carrier flotation is to aggregate fine particles with larger ones such as oil droplets or
other hydrophobic materials. To overcome the repulsive energy barrier for particle/oil or
particle/carrier attachment, strict physical and chemical condition requirements including high
shear forces and proper pH range must be met. Also, the separation of oil/particle aggregation
from water is a challenging task especially when oil emulsions are formed. On the other hand,
the shear flocculation helps to achieve aggregation through applying a shear field with the aid
of a collector, but it has the problem of high-energy consumption to produce adequate
hydrodynamic conditions. Polymer flocculation is an efficient method to form aggregations by
attaching particles onto the long chains, but the flocculants adsorption faces a challenge of low
selectivity. Considering the disadvantages of the above techniques, the use of hydrodynamic
cavitation in fine particle flotation is the focus of this thesis.
Hydrodynamic cavitation is a bubble generation method with good control of bubble size
through adjusting the pressure, flow velocity and cavitation device geometry (Moholkar and
Pandit, 1997; Gogate and Pandit, 2005). It shows a great potential to complement in the flotation
process to increase the bubble-particle collision probability. Although the buoyant force
4
provided by the micro bubbles is not enough to float the particles, the presence of micro bubbles
on the particles acts as bridges and greatly enhances the particle/flotation-sized-bubbles
attachment probability (Rahman et al., 2014; Li et al., 2015). Besides the increase in the
attachment probability, hydrodynamic cavitation also benefits the flotation process by forming
the aggregation of fine particles, which increases the collision probability to the flotation size
bubbles (Tao et al., 2008; Zhou et al., 1997).
Although the hydrodynamic cavitation has been experimentally proven to be effective in
improving the fine particle recovery rate (Sobhy et al., 2013; Zhou et al., 2009), the mechanism
of this process is still under study and requires further investigation. Venturi tube, as the most
commonly used hydrodynamic cavitation device for mineral flotation applications, has shown
its ability at affecting the local pressure and cavitation time scale through tuning the tube
geometry (Arrojo and Benito, 2008). Hence the investigation on the Venturi tube geometry
becomes promising for achieving higher bubble generation efficiency. On the other hand,
particles with different wettability are often presented in the fluid under hydrodynamic
cavitation especially in mineral flotation processes. The researches on the effect of particle
properties on hydrodynamic cavitation behaviors would be a necessary step toward the
fundamental understanding of underpinming science. Besides the particle properties, the
dissolved gas and pre-existing bubbles in the system is also important for hydrodynamic
cavitation. Their effects on hydrodynamic cavitation behaviors also need to be investigated.
5
1.2 Thesis objectives
In the Venturi tube geometry study, using both simulation and theory, I investigated the synergy
between cavitation and Venturi tube geometry. Preliminary simulations allow us to narrow the
key parameters regarding cavitation and power consumption. Systematic measurement of the
pressure, velocity, cavitation inception and bubble generation were conducted for various
Venturi designs. The loss due to the flow resistance (single-phase) was distinguished from the
loss induced by the cavitation. The results reveal the key role played by the single-phase flow
resistance (loss coefficient) on the cavitation inception and activity. Additionally, the bubble
generation was correlated to the cavitation loss and the dissolved gas concentration. In the
particle influence study, cavitation was performed with slurries containing particles with
different properties at different concentrations. The effects of particle addition on cavitation
were revealed by the change in the cavitation inception. The particle’s critical property for
affecting cavitation behavior was identified. Furthermore, the study on the effect of bubble
injection on hydrodynamic cavitation were also performed.
1.3 Organization of the thesis
In Chapter 1, the use of hydrodynamic cavitation in mineral flotation and the tasks for this study
is introduced. In Chapter 2, the advantages and disadvantages of cavitation, the geometry study
of Venturi tube, mechanism of gas nucleation, and applications of hydrodynamic cavitation in
water treatment, chemical reaction enhancing and food processing are reviewed. In Chapter 3,
the simulation methods for the numerical study, and the material & methods for experimental
study are specified for the investigation of Venturi tube geometry’s influence on hydrodynamic
6
cavitation. The apparatus change and particle preparation for the particle and bubble addition
study are also described in this Chapter. In Chapter 4 and 5, the numerical and experimental
results for the Venturi tube geometry study and particle & bubble function study are presented
and discussed. In Chapter 6, the results obtained in the last two Chapters are summarized, and
their contributions to original knowledge are stated. In Chapter 7, future works regarding the
hydrodynamic cavitation for fine particle flotation are proposed.
7
Chapter 2 Literature Review
2.1 Cavitation advantages of and disadvantages
The cavitation processes that have been utilized in various applications can be generally
classified into two types: acoustic cavitation and hydrodynamic cavitation. If the process is
triggered by the passage of high-frequency sound waves, it is called acoustic cavitation.
Hydrodynamic cavitation is due to the pressure variation in the flowing liquid by the change in
the geometry of the flowing system (Jyoti and Pandit, 2000). Despite the difference in starting
mechanisms, both cavitation processes include the states of formation, growth, and collapse of
microbubbles. The bursting of bubbles is accompanied by intense pressure waves, vigorous
shearing forces, and localized heating. Without the proper control of the location and intensity,
cavitation can behave as a destructive process to local materials. In the long history of cavitation
study, it is at first regarded as a harmful subject to the hydraulic equipment (Karimi and Avellan,
1986; Singh et al., 2012; Hart and Whale, 2007; Shimizu and Yamaguchi, 1989). During the
investigation of the equipment’s erosion issue, the pump, compressor, and turbine that operate
underwater are found to induce uncontrollably cavitation which causes a reduction of thrust and
damage on components such as the impeller, turbine blade and equipment wall. The generation
of hydrodynamic cavitation in these cases is due to the high rotating speed of the impeller,
causing a rapid drop in the local pressure according to the Bernoulli’s principle. Associated
with high local pressure and temperature at the instant of collapse, the generated cavities
eventually lead to the removal of elements of the material from the surface. In the operating
conditions of the hydraulic machinery, cavities are repetitively formed, and the collapse of
cavities generates shock waves that subject the material fatigue stresses (Hart and Whale, 2007).
8
Such damage has caused immeasurable loss to the offshore and hydropower industries, but also
driven scientists to deeply investigate the mechanism behind this phenomenon.
As the investigations on its behavior were further carried out, cavitation due to its ability at
bubble generation and violent energy releasing are gradually recognized as a helpful process in
various applications. For example, cavitation has been intentionally generated for testing the
intensity of erosion on various materials (A. Karimi and Avellan, 1986; Shimizu and
Yamaguchi, 1989). The acoustic cavitation also shows its ability in cleaning the containments
on material surfaces (Krefting et al., 200). As the potential of interaction between bubble and
ultrasonic force field is gradually realized, more and more researches have been carried out to
implement cavitation in more advanced applications. For instance, the ultrasonic-generated
acoustic cavitation can be used to contribute to the modern healthcare. As it is difficult to control
the therapeutics to several portals of the human body, acoustic cavitation provides a feasible
solution as the lipid tissue is permeable to acoustic waves, and the cavitation activity can be
remotely incited in the diseased tissue for applications such as drug delivery. (Paliwal and
Mitragotri, 2006; Crake et al., 2016).
2.2 Applications of cavitation
Besides the use of cavitation in mineral processing and bio-medical field, due to its energy
efficiency and simplicity (Gogate, 2009), it recently raised interest in various industry-scale
applications. By understanding the use of cavitation in those areas, the utilization of acoustic or
hydrodynamic cavitation can be adjusted accordingly to optimize the benefit for each processes.
9
2.2.1 Water treatment
Cavitation has been utilized in the water treatment industry for its ability to efficiently generate
bubbles. The bubbles at the instant of burst release high magnitude energy, which can physically
and chemically destroy microorganisms and disinfect wastewater. (Arrojjo et al., 2008; Dular
et al., 2016; Jyoti and Pandit, 2000). Comparing to the traditional water disinfection with
chemical additives, cavitation does not result in the formation of any toxic byproducts. It is also
economical and efficient in terms of large-scale water treatment scheme. To have the
hydrodynamic cavitation as the pretreatment, the consumption of chemical additives for killing
microbes can be substantially lowered (Jyoti and Pandit, 2000).
Like the acoustic cavitation which is triggered by the oscillating ultrasonic field, hydrodynamic
cavitation is driven by the sudden drop and recover in pressure due to change in flow velocity
(Dular et al., 2016). The rapid change in the surrounding environment results in the generation
of oscillating bubbles. By adjusting the ultrasonic field or pressure recovering time (different
frequencies), cavitation can manifest itself in different properties and mechanisms for
implementing into different scenarios. High frequencies generate a higher number of collapse
and promote the diffusion OH- radicals, which can be used as a biocide in water treatment, but
the generated bubbles are less energetic. On the other hand, low frequencies tend to generate
more violent collapse and strong shock waves but at the expense of less collapse per unit time
and less diffusion of OH- radicals (Arrojjo et al., 2008).
Comparing to the acoustic cavitation, which disinfects water mostly by chemical processes with
generation of OH- radicals, mechanical disruption of bacteria plays a major role in
hydrodynamic cavitation. The bacteria tends to form clusters and the external microorganisms
can act as protection against biocides. The shear force produced by cavitation can break the
10
agglomerates and isolate the individual bacteria, which increases the efficiency of biocides
(Joyce et al., 2003). Therefore, the disinfection rates are maximized by those configurations
that promote large bubbles and higher cavitation activities (Arrojjo and Benito, 2008).
The efficiency of using orifice plates in rhodamine B degradation is also compared with the
results of using acoustic cavitation. The hydrodynamic cavitation using orifice plates were
proved to produce higher disinfection rate, with a higher energy efficiency than the acoustic
cavitation. Moreover, the scale up of the hydrodynamic cavitation reactors is easier as having a
constriction in the flow system is readily available. (Parag R. 2010, Manickam 2001). Overall,
hydrodynamic cavitation is a relatively simple and energy efficient technology that is promising
to be implemented on an industrial scale of water treatment.
2.2.2 Chemical reaction enhancing
In the conventional chemical processes such as chemical synthesis with oxidation reaction, the
utilization of acoustic cavitation has been extensively studied (Pinjari and Pandit, 2011; Jitendra,
2016). However, due to poor transmission of acoustic energy in the large volume of water and
low energy efficiency, the implement of acoustic cavitation in industrial scale processes has
been a challenging task (Gogate and Pandit 2004). The researchers recently highlighted the use
of hydrodynamic cavitation in the chemical processes. Despite the disadvantages of less intense
collapse compared to the acoustic cavitation, hydrodynamic cavitation has the advantages of
easy scaling up and high energy efficiency.
For a better description of cavitation’s effect in chemical processes, the collapse of cavities can
be classified into two types: symmetric and asymmetric (Mahulkar and Pandit, 2010). The
symmetric collapse happens when the cavity remains spherical until burst that forms reactive
free radicals favoring thermal pyrolysis of organic molecules. For the asymmetric collapse, the
11
collapsing cavity is not spherical because of the presence of wall or particle at the point of
collapse. It produces high-velocity liquid jets and intense local turbulence, which is favorable
for physical transmission. In the symmetrical collapse condition, when the water is under
cavitating conditions, the highly reactive hydroxyl radicals (OH-) are formed from the
dissociation of water molecules. The symmetrical collapse is beneficial especially for the
oxidation reactions that are primarily induced by the formation of reactive free radicals. The
oxidation processes caused by cavitation happens in two ways: First, the molecules trapped
inside of the cavity undergo thermal decomposition during the collapse. Second, the formed
radicals attach the targeted molecules at the cavity liquid interface and in the bulk liquid thereby
oxidizing the molecules (Saharan et al., 2013; Jitendra, 2016). During the cavitation, each cavity
behaves as a micro-reactor, which releases a large amount of energy and create a local condition
of high pressure and temperature (Yusuf and Adewuyi, 2001).
Pandit and Joshi first tested the use of hydrodynamic cavitation in the hydrolysis of oils in 1993.
The experiment showed an improved hydrolysis yield with the use of HC. The traditional
hydrolysis methods require high temperature and pressure, as well as the high interfacial area
between the catalyst and the oil. With hydrodynamic cavitation, spots with adequate
temperature and pressure can be created at many locations inside the reactor. Also, the size of
the catalyst emulsion is mechanically reduced, which facilitates better interaction between the
oil and catalyst (Jitendra, 2016). In the same manner, hydrodynamic cavitation was shown to
be helpful in the crude oil upgradations, for its ability at producing high temperature, pressure,
and catalyst-reagent contact area to break large molecular petroleum fraction into the smaller
fractions (Ansari et al., 2015; Jitendra, 2016).
12
2.2.3 Food Processing
The traditional heat-treat process for food sterilization involves several problems including low
efficiency at killing heat-resistant microorganisms, high energy consumption and risks in
destroys heat labile nutrients and flavor components. Inspired by the contribution in water
treatment industry, cavitation is regarded as an alternative method for commercial sterilization
of food by the processors (Milly et al., 2007; Gogate, 2011; Bhaskaracharya et al., 2009). By
using the hydrodynamic cavitation without any further processes, the induced destructive forces
can effectively inactive cells of bacteria, yeast, and heat-resistant bacterial spores, and the
microbial lethality induced by hydrodynamic cavitation is reported to be greater than that
accounted by thermal effects. To combine the hydrodynamic cavitation with traditional heat
treat process, the lethality of common spoilage microorganisms can be achieved at reduced
temperature due to the synergistic effect of cavitation and temperature. This way, the heat labile
components can be retained, and foods such as fruit juice, salad dressing, and milk can be safely
processed.
Besides of food sterilization, cavitation can be beneficial for many other applications in the
food processing industry. The ultrasonic induced acoustic cavitation has been developed to
accelerate processes such as freezing, thawing, crystallization of lactose, and to improve
processes such as cutting, extraction, emulsification, and aging of wines (Mawson and Knoerzer,
2007; Bhaskaracharya et al., 2009). Considering the energy efficiency in food processing which
involves large volumes, hydrodynamic cavitation is suggested to be the alternative to acoustic
cavitation. It has shown promising potential at solving many problems faced by the food
industry such as the replenishment of moist lost during the storage and primary processing
(Ashokkumar et al. 2011). In the hydration process, hydrodynamic cavitation can assistant
13
chemically pure protein to bind theoretically up to 40% water by weight. The formed hydration
shells of protein increase their affinity for water during the precipitation. In addition, the
formation of dense and strong hydration shells raises the thermal resistances of the dissolved
valuable nutrients and vitamins, preventing them from thermal denaturation at the subsequent
heat treatment.
2.3 Cavitation device geometry effect
Hydrodynamic cavitation can be generated by the passage of liquid through devices with
constricted area. The orifice plate and Venturi tubes, as two most common hydrodynamic
cavitation devices, have similar, yet different geometric structures. To study the influence of
geometry on hydrodynamic cavitation, the two devices have drawn researchers’ interests and
their potential in various applications were compared (Arrojo, 2008; Gogate, 2005; Saharan,
2013). As discussed in the water treatment study, cavitation destroys microorganism through
both chemical (generation of OH- radicals) and mechanical (shear forces and de-clumping effect)
processes. Venturi tubes surpass orifice plates in disinfection rate with an outstanding
mechanical effect since it shows a better performance in de-clumping bacteria agglomerates
and tends to give denser cavitation cloud and a larger number of cavitation events. Also, the
flow rate in the Venturi tubes is higher than that of orifice plates at a given power input, leading
to a higher treatment capacity and better energy efficiency. On the other hand, the orifice plates
have a larger localized pressure intensity immediately after the device, and the disinfection
effect from orifice plates is partially related to the OH- generation, while the chemical effect is
almost negligible with Venturi tube (Arrojo, 2008). The same comparison was also performed
on the degradation of dye as a model pollute (Saharan, 2013). In the study, Venturi tubes again
14
outperformed the orifice plate owing to the higher degradation efficiency and energy efficiency.
Saharan et al. suggest that the effect of HC on degradation depends on the number and
maximum sizes of cavities. In the case of Venturi tubes, the pressure recovers smoothly due to
the divergent angle, leaving the cavities enough time to grow to maximum size, whereas the
pressure recovers immediately after the orifice plates and the cavities collapse before reaching
maximum size, thereby reducing the collapse intensity and cavitation yield. In conclusion, the
orifice plates are favorable for intense chemical reactions and milder processes. While the use
of Venturi tubes are more energy efficient, and suitable for the producing physical effects
(Gogate, 2005; 2009).
In the case of orifice configuration study, the cavitation intensity can be controlled by changing
the orifice to pipe diameter (free area) ratio, as well as the number and diameter of the orifice
holes (Gogate, 2000). The cavity collapse pressure was found to decrease with the increase of
free area ratio because larger flow area leads to a lower orifice velocity, resulting in a slower
cavitation inception and fewer activities. If the free area and inlet pressure are kept constant,
the cavity collapse pressure increases with the increase in hole diameters. The cavitation
inception also happens faster with bigger hole diameter, which results in a greater extent of
cavitation for the same orifice velocity (Yan and Thorpe, 1990; Gogate, 2000). The effect of
orifice plates’ geometry on cavitation properties has been experimentally investigated in water
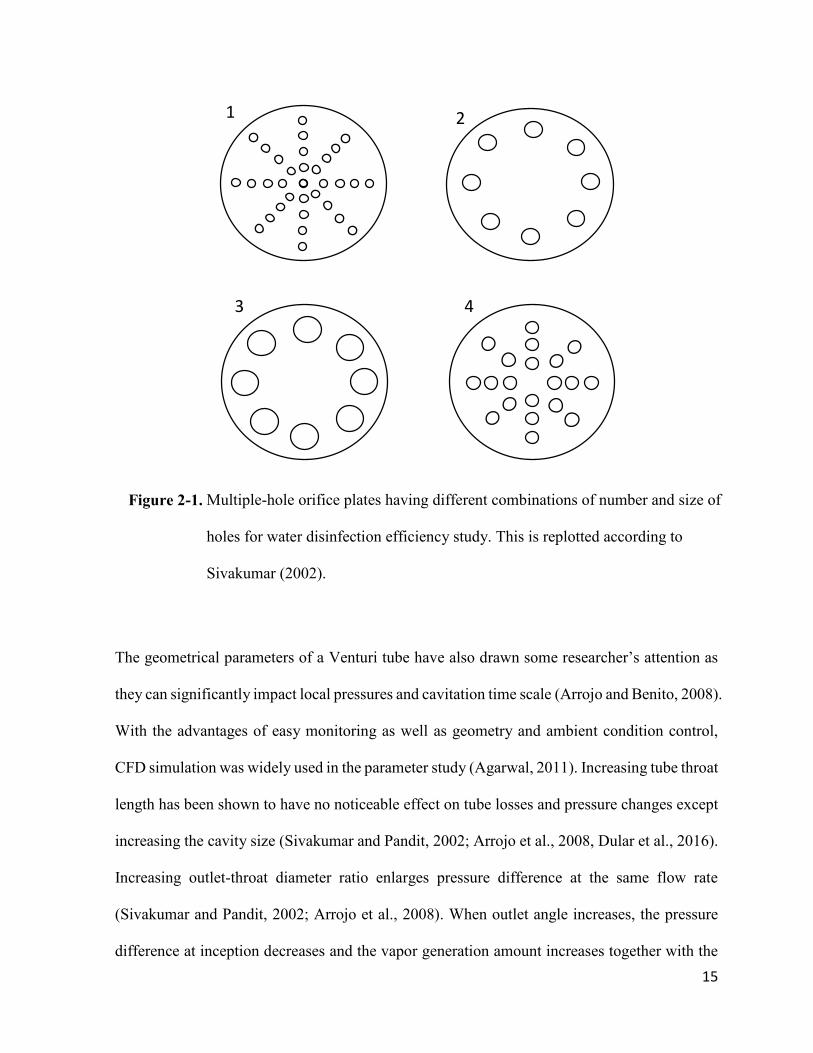
treatment process (Gogate, 2010). As shown in Figure 2-1, among the tested plates, plate 1
exhibits more cavitation yield and higher degradation rate of rhodamine B with less energy
supplied. For the plates having the same flow area, smaller hole sizes result in a higher pressure
fluctuation frequency and larger area of shear layer (Manickam 2001).
15
The geometrical parameters of a Venturi tube have also drawn some researcher’s attention as
they can significantly impact local pressures and cavitation time scale (Arrojo and Benito, 2008).
With the advantages of easy monitoring as well as geometry and ambient condition control,
CFD simulation was widely used in the parameter study (Agarwal, 2011). Increasing tube throat
length has been shown to have no noticeable effect on tube losses and pressure changes except
increasing the cavity size (Sivakumar and Pandit, 2002; Arrojo et al., 2008, Dular et al., 2016).
Increasing outlet-throat diameter ratio enlarges pressure difference at the same flow rate
(Sivakumar and Pandit, 2002; Arrojo et al., 2008). When outlet angle increases, the pressure
difference at inception decreases and the vapor generation amount increases together with the
Figure 2-1. Multiple-hole orifice plates having different combinations of number and size of
holes for water disinfection efficiency study. This is replotted according to
Sivakumar (2002).
1 2
3 4
16
intensity of collapse, causing unsteady flow rate (Dular et al., 2016; Ashokkumar et al., 2011;
Gogate, 2011). To complete the Venturi parameter research, the cavitation behaviors need to
be examined. Dimensionless numbers such as cavitation number and loss coefficient are
efficient tools to globally describe the flow behavior as well as indicating the cavitation
inception (Milly et al., 2007).
2.4 Gas nucleation by cavitation
The gas nucleation in water can be achieved by roughly two processes. One is to raise the
temperature above the saturated vapor/liquid temperature, such as boiling. The other is to drop
the pressure below the vapor pressure, usually caused by hydrodynamic cavitation (Christopher
et al., 1995). According to Henry’s law, the amount of dissolved gas in solution is proportional
to the gas pressure at a constant temperature. In the case of hydrodynamic cavitation, liquid
pressure is experiencing a sudden drop at the constriction area causing a corresponding increase
in the gas saturation concentration. Once the pressure drops below the vapor pressure, gas
molecules tend to be released from the liquid phase. The driving force can be quantified by the
pressure difference, ΔP, between vapor pressure and liquid pressure. In some literatures, it also
represents a level of super-saturation or tensile strength (Jones, 1999; Sukep and Or, 2005). To
generate a gas bubble of a certain size, energy has to be consumed to create the bubble and
overcome the negative pressure over the bubble area. Consequently, for a given liquid-gas
surface tension (𝛾LV) and ΔP, a critical bubble radius must be reached to overcome the energy
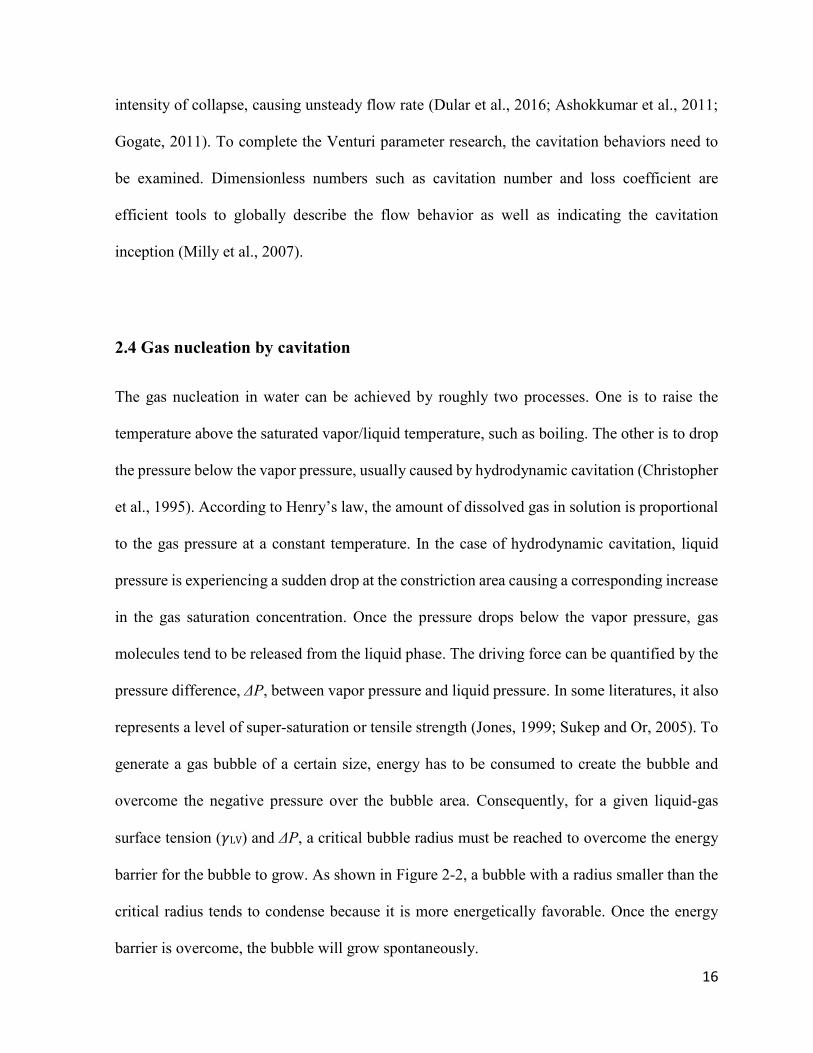
barrier for the bubble to grow. As shown in Figure 2-2, a bubble with a radius smaller than the
critical radius tends to condense because it is more energetically favorable. Once the energy
barrier is overcome, the bubble will grow spontaneously.
17
Figure 2-2. Bubble nucleation energy as a function of seed bubble radius for ΔP = 1 MPa.
ΔE∗and 𝑟𝑏∗ are the nucleation energy barrier and critical bubble radius
respectively.
Based on the differences in nucleation sites, the conventional nucleation can be classified into
two categories: homogenous nucleation and heterogeneous nucleation. Homogeneous
nucleation is the formation of gas nuclei in the bulk of the pure liquid and requires a high level
of super-saturation. The water-air surface tension 𝛾𝐿𝑉 is about 73 mN/m in 20 oC. To generate
a bubble with radius 𝑟𝑏 = 2𝛾𝐿𝑉/𝛥𝑃, the required energy consists two parts: the bubble surface
energy, 4π𝑟𝑏2𝛾𝐿𝑉, and the work to displace liquid,
4
3𝜋𝑟𝑏
3𝛥𝑃 . By combining the two energy
expression with the Laplace equation, the energy barrier to generate a bubble is obtained
(Caupin and Herbert, 2006; Christopher et al., 1995), and defined as:
𝑟𝑏∗
ΔE∗
Seed Bubble Radius (m)
△E
(J)
18
𝐸𝑏 =16𝜋
3
𝛾𝐿𝑉3
∆𝑃2
In practical engineering circumstances, achieving homogenous cavitation is difficult. Cavities
tend to be formed on the nucleation sites such as the wall of the liquid container, or the surface
of suspending particles. This is termed heterogeneous cavitation. The formation of a bubble on
a smooth solid surface with the same radius in homogeneous nucleation requires lower energy
because of wetting (Caupin and Herbert, 2006; Zang 2015). The energy barrier is defined as:
𝐸𝑏 =16𝜋
3
𝛾𝐿𝑉3
∆𝑃2
(2 − 𝑐𝑜𝑠𝜃)(1 + 𝑐𝑜𝑠𝜃)2
4
Where θ is the contact angle of liquid on the solid surface. In theory, the bubble formation on
an extremely hydrophilic solid with θ = 0o requires as much energy as that for the homogeneous
nucleation. On the other hand, the presence of a hydrophobic surface would strongly reduce the
energy barrier because the increase in θ reduces Eb, and no energy would be required if θ
approaches π. Based on the above examination, heterogeneous nucleation becomes more
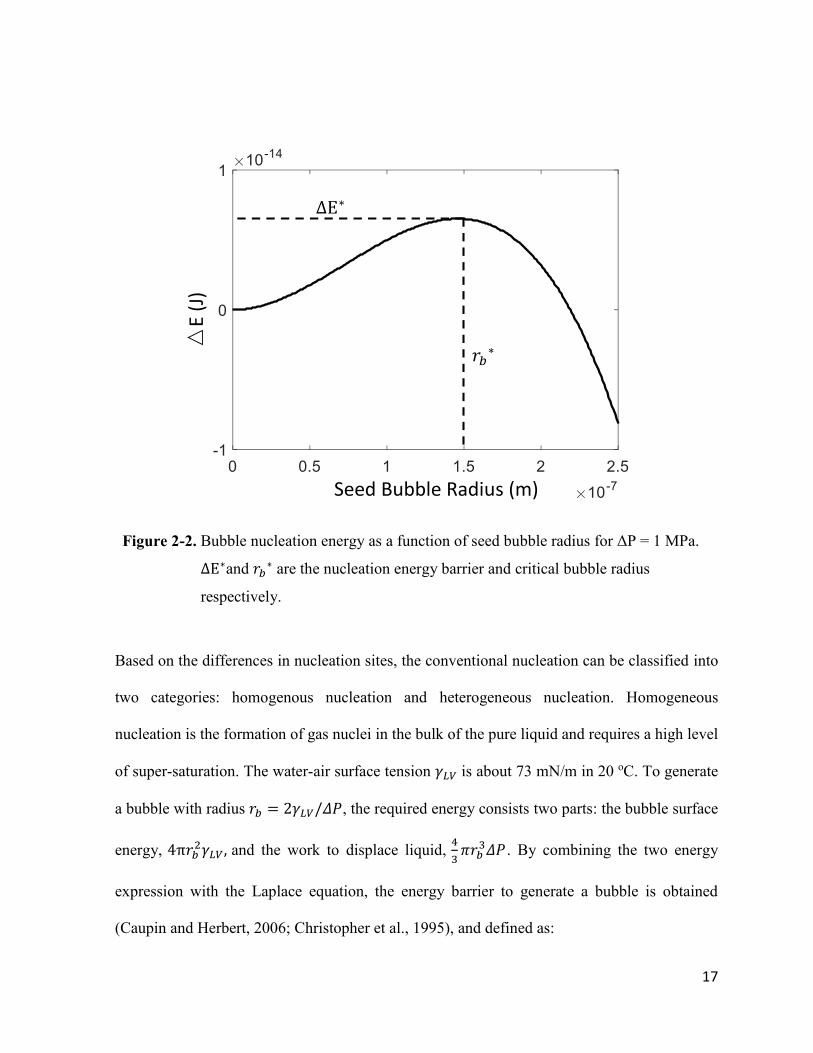
favorable with the increase in the solid hydrophobicity. This theory can be visually illustrated
by Figure 2-3 case (a) and (b). As the bubble tends to be stretched flat on the hydrophobic
surface, the formation of a bubble with same volume is associated with higher radius on a
hydrophobic surface, thus it is easier to reach the critical bubble radius compared to the case on
the hydrophilic surface. At the microscopic scale, crevices are distributed on the solid surfaces,
and the effects of surface geometries need to be considered. A conical crevice geometry as
shown in Figure 2-3 case (c) is commonly used to study the effect of surface geometry
(Christopher et al., 1995; Apfel, 1970; Jones, 1999). The volume of the cavity in the meniscus,
depending on only θ and the groove angle, 2α, is smaller comparing to that with a same radius
on a flat surface, thereby requiring less energy to form. However, as the bubble emerges at the
(2.1)
(2.2)
19
cavity mouth, the radius of the cavity decreases, e.g. from R1 to R2, before increasing again.
Without the support from local fluctuation, the further emerge of cavity becomes difficult
because the required tensile strength increases. If the cavity successfully emerges from the
crevice, the radius would increase again. This process is easier with a hydrophobic surface.
The homogeneous and heterogeneous nucleation discussed above are categorized as the
conventional types of nucleation. In practical circumstances, nucleation rates are mostly higher
than the theoretical value. This is due to the presence of dissolved gas and pre-existing bubble
nuclei (Brennen, 1995; Jones, 1999; Caupin and Herbert, 2006). If a nucleation bubble contains
gas content, the gas partial pressure pg would contribute to the pressure in the bubble, and the
Figure 2-3. Three models of heterogeneous nucleation. (a) Flat hydrophobic surface (θ >
π/2). (b) Flat hydrophilic surface (θ < π/2). (c) Conical cavity. This figure is
replotted according to Christopher et al. (1995) and Jones (1999).
R
Bubble θ
Case (a)
R
Bubble θ
Case (b)
Case (c)
α
θ
R0
20
critical tensile strength would become 2 𝛾LV/rb- pg. As the concentration of dissolved gas
increases, the tensile strength decreases to zero or even negative value, resulting in the
spontaneous growth of bubble at the liquid pressure greater than the vapor pressure. The pre-
existing bubble nuclei, on the other hand, reduce the nucleation energy required to overcome
the barrier for bubble growth. Experiments have been performed to demonstrate the effect of
bubble nuclei on bubble generation (Bremond et al., 2006). Acoustic energy was applied to a
hydrophobic plate under water. With the micro-cavities etched on the solid surface, cavitation
was found to be promoted at higher pressure.
21
Chapter 3 Experimental Setup and Procedures
3.1 CFD Simulation
The preliminary single phase simulations were performed to model the hydrodynamic condition
inside the Venturi tubes. Although the preliminary simulation results cannot predict the
condition of hydrodynamic cavitation, the results can help narrow down the critical parameters
for experimental investigation by indicating those having large impact on tube pressure profile.
A computational fluid dynamic (CFD) commercial software (COMSOL Multiphysics Version
5.1) was used to carry out the liquid phase simulation. The liquid flow was simulated using a
stationary condition and k-ω turbulence model because it is more accurate in simulating the
internal turbulent flow comparing to the k- ε model (Eiamsa et al., 2009). The default values of
k-ω turbulence model parameters provided in COMSOL were used to perform the simulation.
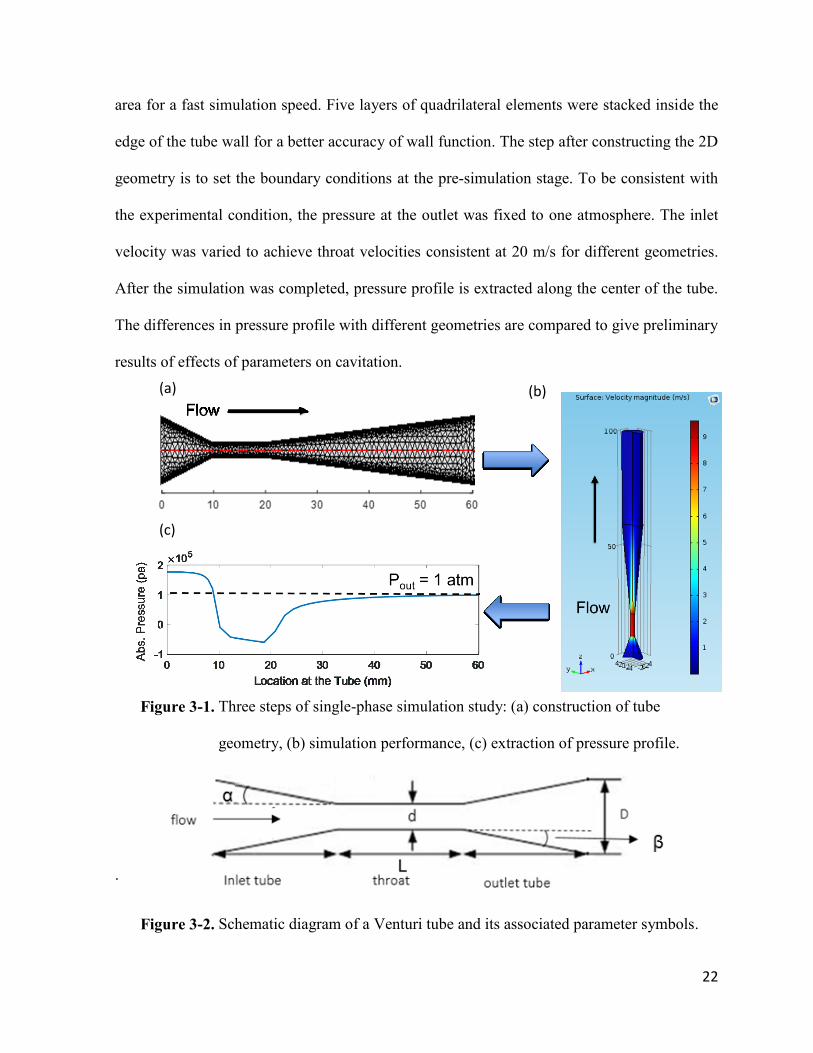
Figure 3-1 shows the steps of the single-phase geometry simulation study. First, the geometry
models with parameters listed in Table 3-1 are constructed in a 2-D axisymmetric domain,
aiming to investigate the tube inner pressure change affected by the four main parameters as
shown in Figure 3-2: the convergent or inlet angle (), the throat length (L), the divergent or
outlet angle () and the diameter ratio (D/d). For all the geometries, the inlet and outlet
diameters were kept constant at 9 mm to match the hose size in the experimental study.
Sensitivity tests were performed for different mesh sizes and the velocity and pressure results
were found to converge at the level of “finer mesh” with a minimum number of 100,000
elements. This level of mesh fineness was used so that simulation errors introduced by mesh
size can be minimized. The majority of the elements are triangular and located in the tube center
22
area for a fast simulation speed. Five layers of quadrilateral elements were stacked inside the
edge of the tube wall for a better accuracy of wall function. The step after constructing the 2D
geometry is to set the boundary conditions at the pre-simulation stage. To be consistent with
the experimental condition, the pressure at the outlet was fixed to one atmosphere. The inlet
velocity was varied to achieve throat velocities consistent at 20 m/s for different geometries.
After the simulation was completed, pressure profile is extracted along the center of the tube.
The differences in pressure profile with different geometries are compared to give preliminary
results of effects of parameters on cavitation.
.
Figure 3-1. Three steps of single-phase simulation study: (a) construction of tube
geometry, (b) simulation performance, (c) extraction of pressure profile.
Figure 3-2. Schematic diagram of a Venturi tube and its associated parameter symbols.
(a) (b)
(c)
23
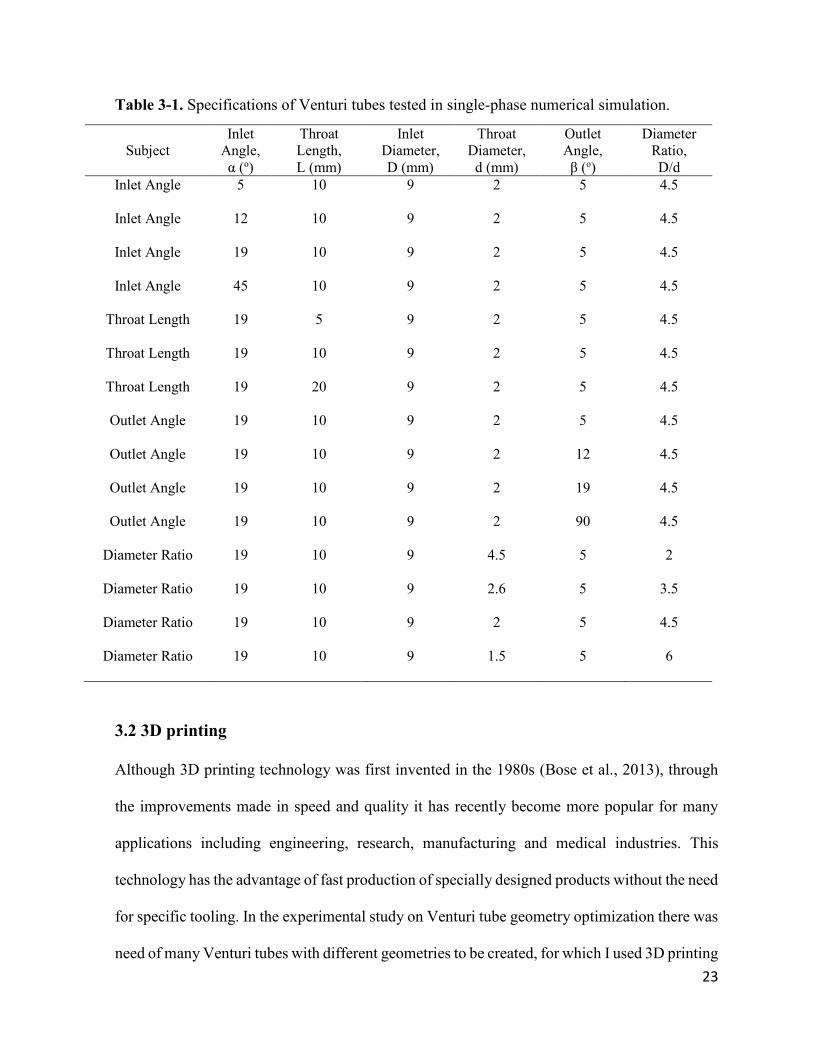
Table 3-1. Specifications of Venturi tubes tested in single-phase numerical simulation.
Subject
Inlet
Angle,
α (o)
Throat
Length,
L (mm)
Inlet
Diameter,
D (mm)
Throat
Diameter,
d (mm)
Outlet
Angle,
β (o)
Diameter
Ratio,
D/d
Inlet Angle 5 10 9 2 5 4.5
Inlet Angle 12 10 9 2 5 4.5
Inlet Angle 19 10 9 2 5 4.5
Inlet Angle 45 10 9 2 5 4.5
Throat Length 19 5 9 2 5 4.5
Throat Length 19 10 9 2 5 4.5
Throat Length 19 20 9 2 5 4.5
Outlet Angle 19 10 9 2 5 4.5
Outlet Angle 19 10 9 2 12 4.5
Outlet Angle 19 10 9 2 19 4.5
Outlet Angle 19 10 9 2 90 4.5
Diameter Ratio 19 10 9 4.5 5 2
Diameter Ratio 19 10 9 2.6 5 3.5
Diameter Ratio 19 10 9 2 5 4.5
Diameter Ratio 19 10 9 1.5 5 6
3.2 3D printing
Although 3D printing technology was first invented in the 1980s (Bose et al., 2013), through
the improvements made in speed and quality it has recently become more popular for many
applications including engineering, research, manufacturing and medical industries. This
technology has the advantage of fast production of specially designed products without the need
for specific tooling. In the experimental study on Venturi tube geometry optimization there was
need of many Venturi tubes with different geometries to be created, for which I used 3D printing
24
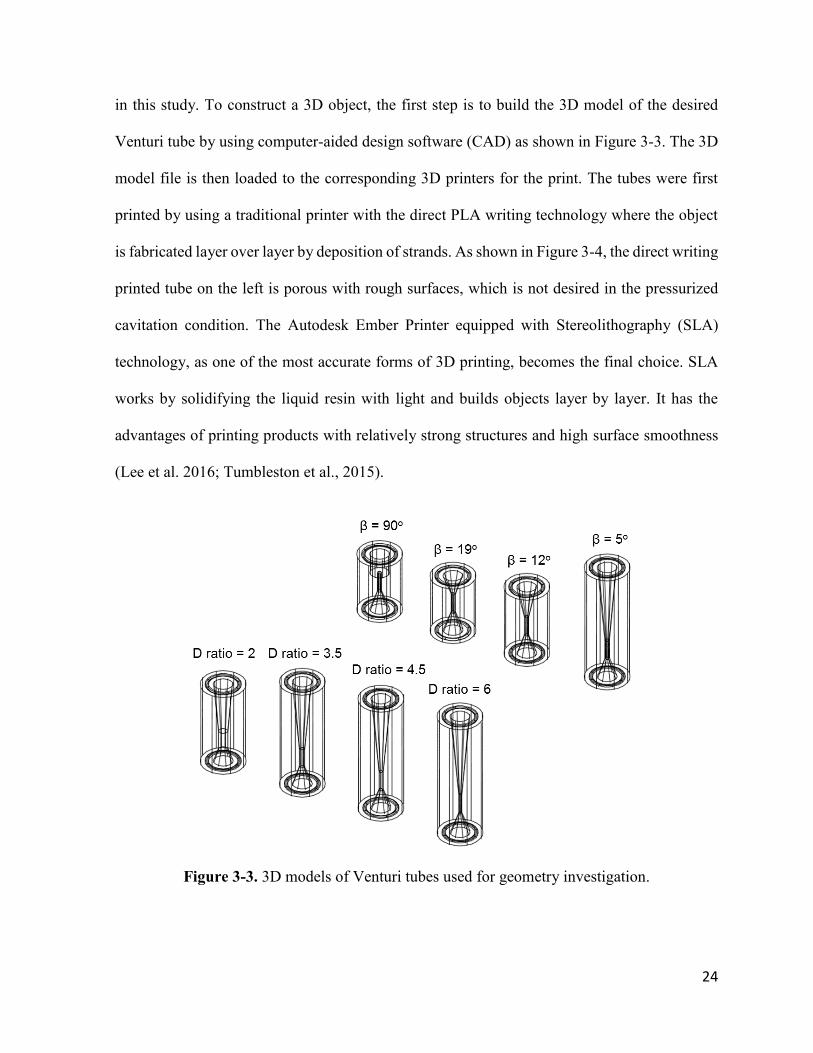
in this study. To construct a 3D object, the first step is to build the 3D model of the desired
Venturi tube by using computer-aided design software (CAD) as shown in Figure 3-3. The 3D
model file is then loaded to the corresponding 3D printers for the print. The tubes were first
printed by using a traditional printer with the direct PLA writing technology where the object
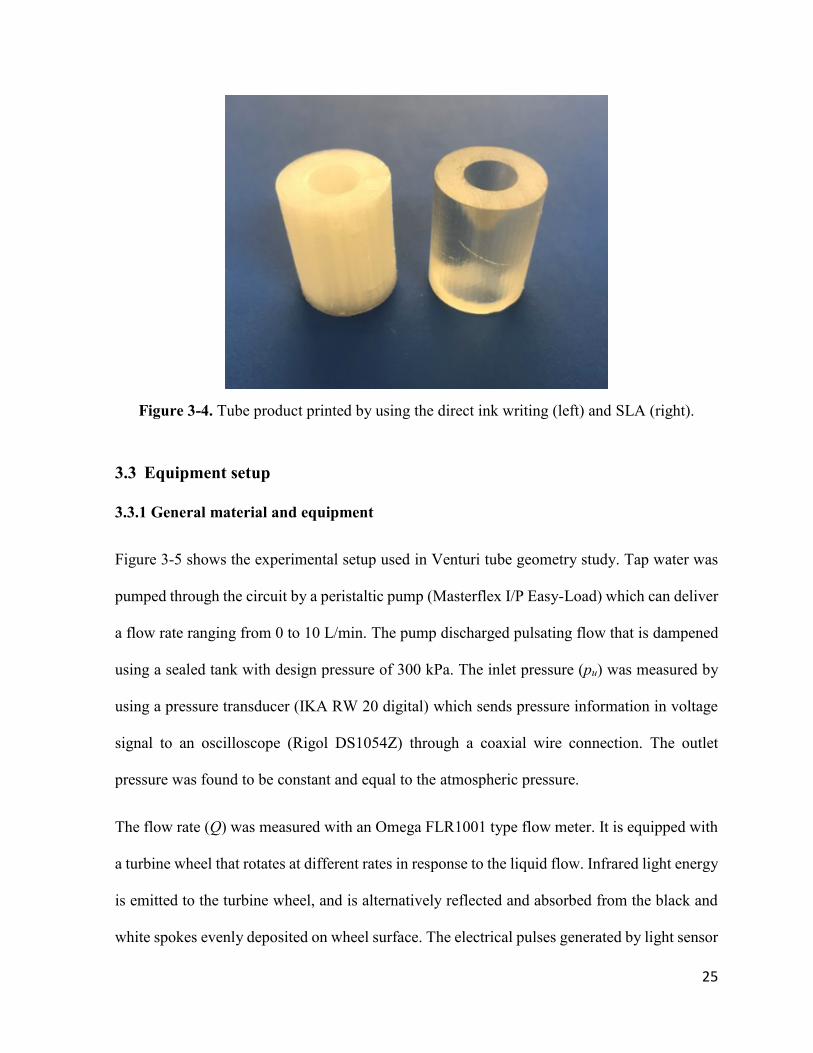
is fabricated layer over layer by deposition of strands. As shown in Figure 3-4, the direct writing
printed tube on the left is porous with rough surfaces, which is not desired in the pressurized
cavitation condition. The Autodesk Ember Printer equipped with Stereolithography (SLA)
technology, as one of the most accurate forms of 3D printing, becomes the final choice. SLA
works by solidifying the liquid resin with light and builds objects layer by layer. It has the
advantages of printing products with relatively strong structures and high surface smoothness
(Lee et al. 2016; Tumbleston et al., 2015).
Figure 3-3. 3D models of Venturi tubes used for geometry investigation.
25
Figure 3-4. Tube product printed by using the direct ink writing (left) and SLA (right).
3.3 Equipment setup
3.3.1 General material and equipment
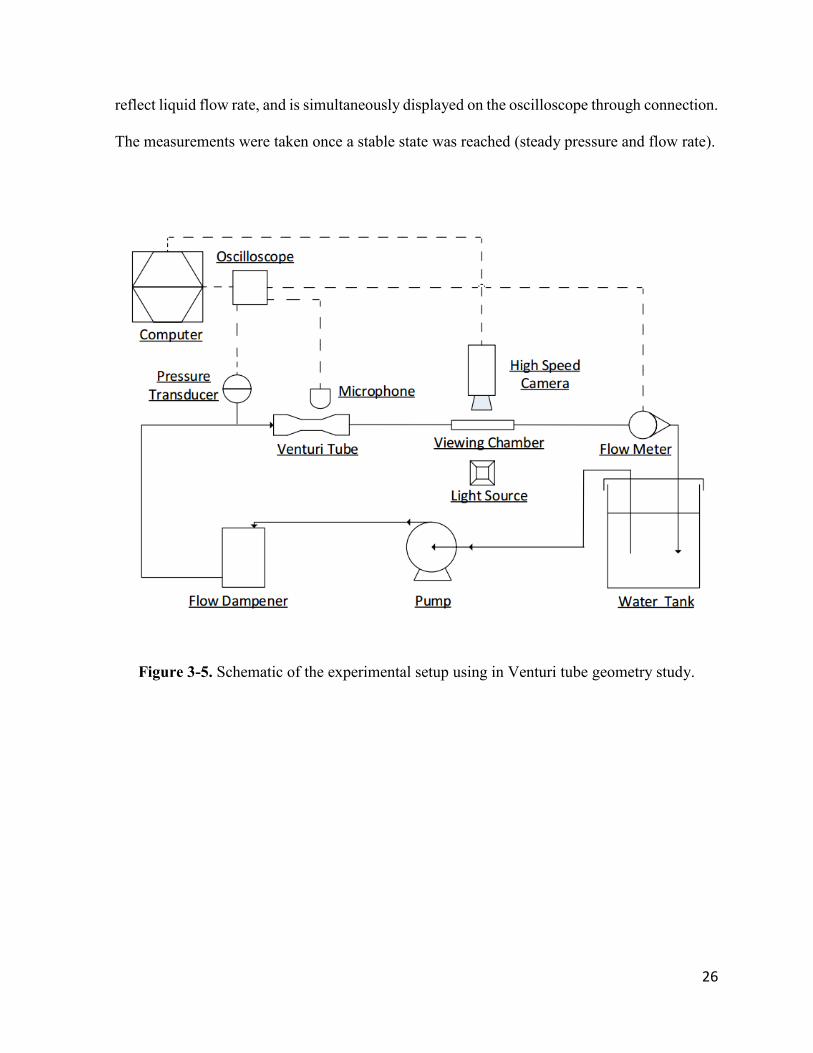
Figure 3-5 shows the experimental setup used in Venturi tube geometry study. Tap water was
pumped through the circuit by a peristaltic pump (Masterflex I/P Easy-Load) which can deliver
a flow rate ranging from 0 to 10 L/min. The pump discharged pulsating flow that is dampened
using a sealed tank with design pressure of 300 kPa. The inlet pressure (pu) was measured by
using a pressure transducer (IKA RW 20 digital) which sends pressure information in voltage
signal to an oscilloscope (Rigol DS1054Z) through a coaxial wire connection. The outlet
pressure was found to be constant and equal to the atmospheric pressure.
The flow rate (Q) was measured with an Omega FLR1001 type flow meter. It is equipped with
a turbine wheel that rotates at different rates in response to the liquid flow. Infrared light energy
is emitted to the turbine wheel, and is alternatively reflected and absorbed from the black and
white spokes evenly deposited on wheel surface. The electrical pulses generated by light sensor
26
reflect liquid flow rate, and is simultaneously displayed on the oscilloscope through connection.
The measurements were taken once a stable state was reached (steady pressure and flow rate).
Figure 3-5. Schematic of the experimental setup using in Venturi tube geometry study.
27
3.3.2 Cavitation inception measurement
A high-performance microphone (Florida Research Instrument 100-1) was used to measure the
cavitation inception. The microphone was connected to the oscilloscope and placed 1cm above
the end of the Venturi tube constriction (Figure 3-5). When cavitation occurs, bubbles collapse
and radiates high frequency energy waves which are detected by the microphone. To measure
the cavitation inception the flow rate was gradually increased while the oscilloscope is
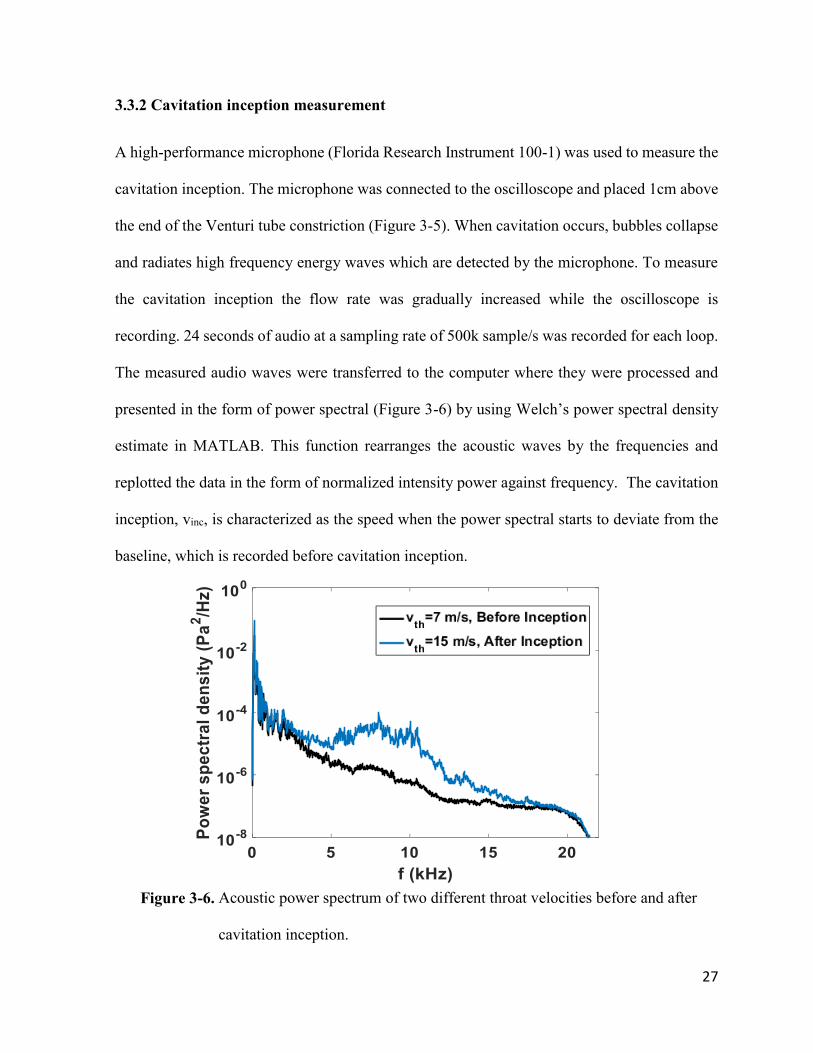
recording. 24 seconds of audio at a sampling rate of 500k sample/s was recorded for each loop.
The measured audio waves were transferred to the computer where they were processed and
presented in the form of power spectral (Figure 3-6) by using Welch’s power spectral density
estimate in MATLAB. This function rearranges the acoustic waves by the frequencies and
replotted the data in the form of normalized intensity power against frequency. The cavitation
inception, vinc, is characterized as the speed when the power spectral starts to deviate from the
baseline, which is recorded before cavitation inception.
Figure 3-6. Acoustic power spectrum of two different throat velocities before and after
cavitation inception.
28
3.3.3 Bubble generation measurement
The number of bubbles generated by hydrodynamic cavitation was monitored using a high-
speed camera at 125 fps equipped with a high magnification lens. The observation is
proceeded through a glass-viewing chamber placed 26 cm downstream from the Venturi tube
(Figure 3-5). The viewing chamber has a flat wall facing the camera to avoid the distortion of
the images. A light source is illuminating from the back of the chamber to provide enough
light intensity for clear imaging. As shown in Figure 3-7 (a), a MATLAB image analysis code
was used to detect in-focus bubbles and measure bubble size. Figure 3-7(b) shows an example
of the bubble size distribution that was calculated using 1362 images.
Figure 3-7. (a) High speed camera image and the recognized bubbles in white circles. (b)
Bubble size distribution calculated based on the images.
(a)
(b)
29
3.3.4 Flow damper and dissolved gas
A sealed tank filled with water and air was used to dampen the pump pulsations (Figure 3-5).
As the pulsating flow enter the dampener from the top, the air, being a compressible fluid,
smoothed the fluctuations. The pressure inside the dampener is built up with higher flow rate.
According to Henry’s law, more air tends to be dissolved in the water with higher pressure. In
the geometry study, the amount of dissolved gas was kept constant by insulating the air inside
balloons (no air-water interface). The influence of dissolved gas was studied by removing the
balloons, which allowed the air to dissolve in water as the inlet pressure increased.
3.3.5 Setup adjustment for particle addition and gas injection
The experimental set up was partially adjusted for the study of particle addition on cavitation
behavior as shown in Figure 3-8. The water tank was replaced with a mixing tank for a better
particle-water mixing. An impeller driven by an adjustable agitator is used to provide mixing
forces to the slurry. The rotating speed of the impeller was set at 500 rpm for mixing hydrophilic
particles. A higher stirring rate of 900 rpm was set to mix the hydrophobic-treated particles
because extra shear force was required to break the aggregations that they naturally formed
inside water. A visual inspection was performed through the translucent tank wall before each
run to ensure the good mixing of particles. A smaller size flow dampener filled with water and
an air balloon was used so that the water and particle usage amount could be reduced, and the
gas-dissolving problem at pressurized tank was further minimized. The flow meter was
relocated to the upstream of the pressure transducer to avoid the pressure increase induced by
the resistance from the flow meter. Calibration on flow meter was performed before each
particle run in order to minimize the effect of particle blockage on infrared light transmission.
30
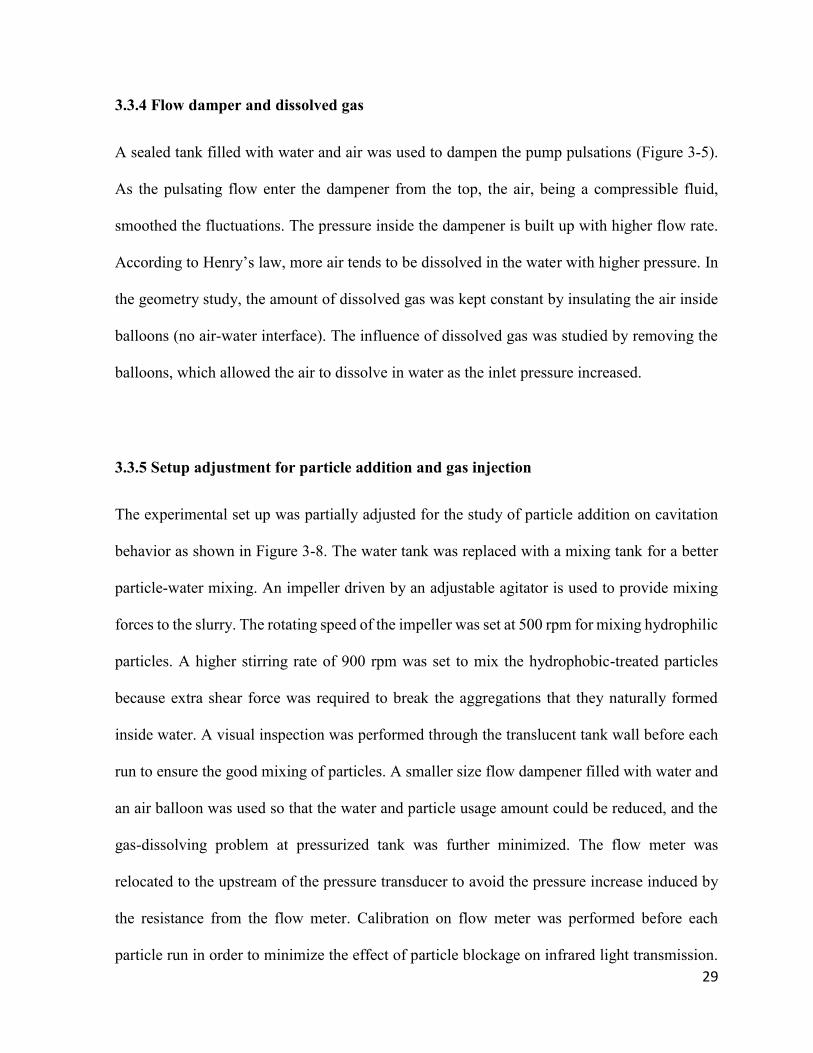
Due to the mechanism of the flow meter, it is not able to deliver accurate flow rate in the
conditions with dark particles such as graphite and molybdenite, or high concentrations of
translucent particles such as silica and glass beads.
Figure 3-8. Schematic of the experimental setup used in the particle and bubble addition
study.
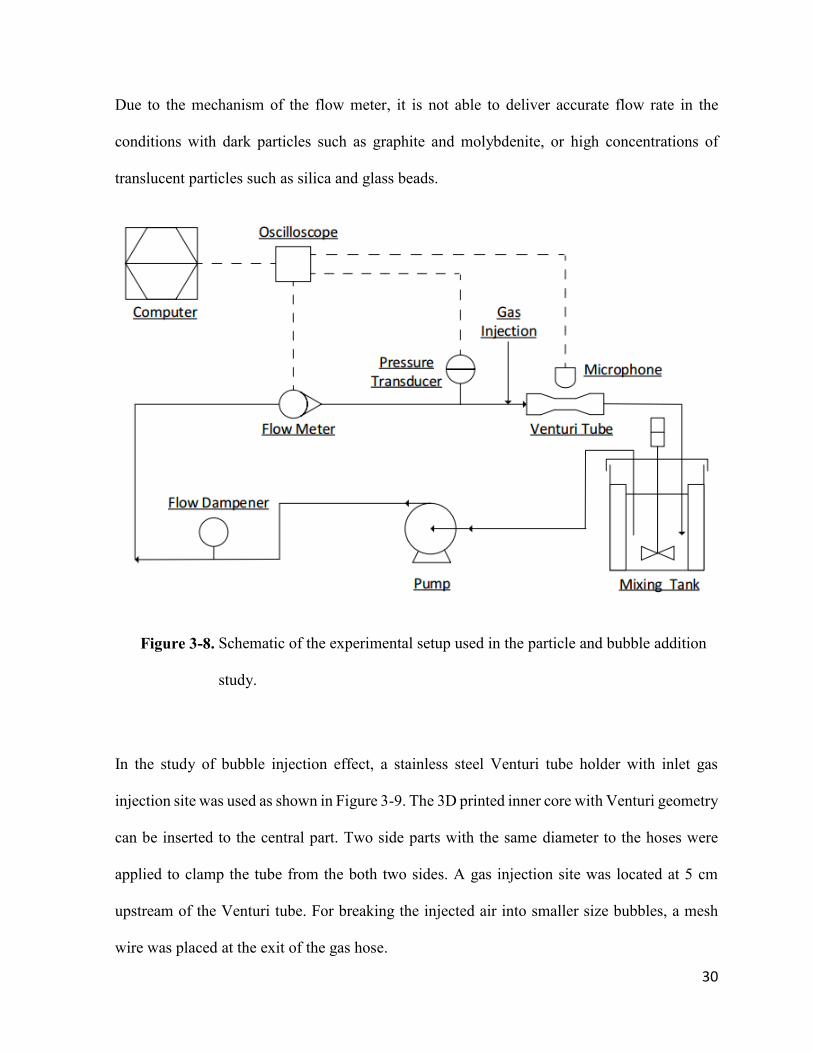
In the study of bubble injection effect, a stainless steel Venturi tube holder with inlet gas
injection site was used as shown in Figure 3-9. The 3D printed inner core with Venturi geometry
can be inserted to the central part. Two side parts with the same diameter to the hoses were
applied to clamp the tube from the both two sides. A gas injection site was located at 5 cm
upstream of the Venturi tube. For breaking the injected air into smaller size bubbles, a mesh
wire was placed at the exit of the gas hose.
31
Figure 3-9. Picture of the Venturi tube holder with gas injection at tube inlet.
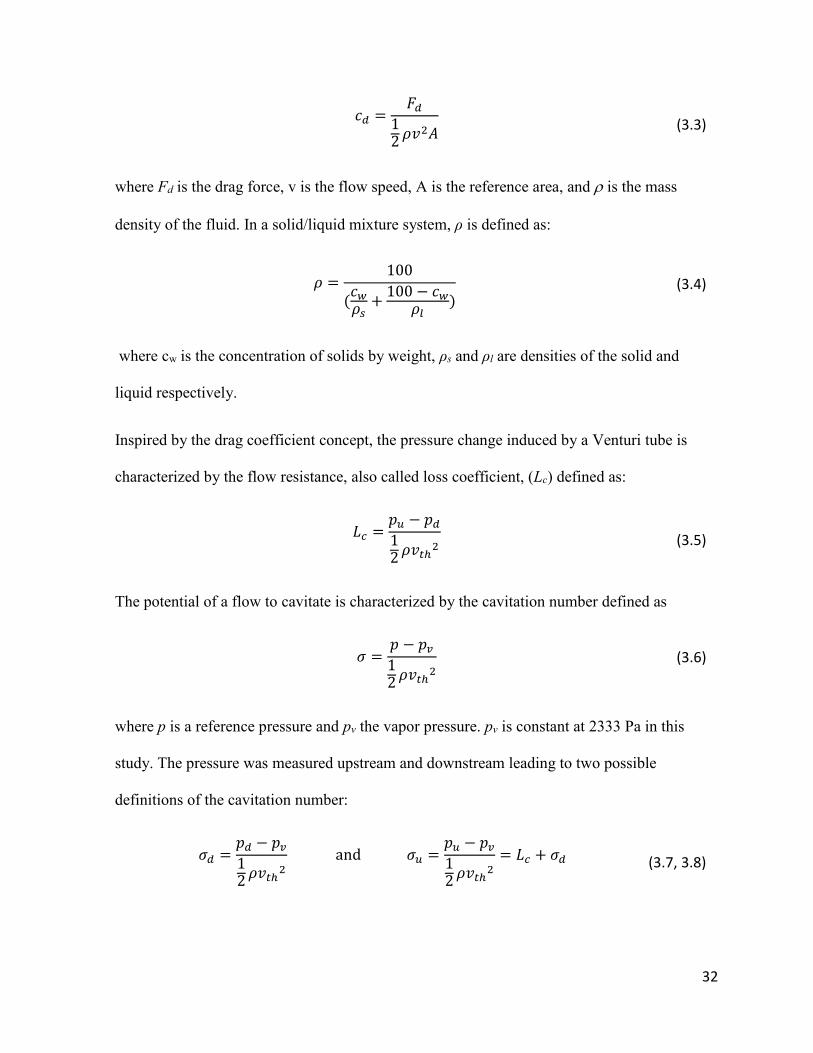
3.4 Parameters and equations
The power consumption P, to drive the flow across the Venturi tube, was calculated using:
𝑃 = 𝑄 × (𝑝𝑢 − 𝑝𝑑)
where pd is the downstream or outlet pressure, and pu is the upstream or inlet pressure.
The conventional method to describe the hydrodynamic conditions is to plot the tube upstream
pressure (pu) against throat velocity (vth) as shown in Figure 3-10 (a). The throat velocity derived
from flow rate is defined as:
𝑣𝑡ℎ =4𝑄
𝜋𝑑2
As the cavitation generated bubble causes blockage effect to the liquid flow, the cavitation
inception can be identified at the point where pu starts to increase at a higher rate as vth increases.
A more generic way to present the data is to use dimensionless number. In fluid dynamics, the
resistance in a fluid environment is quantified by using the drag coefficient (cd) defined as:
(3.1)
(3.2)
Microphone
Gas Injection
Site
32
𝑐𝑑 =𝐹𝑑
12 𝜌𝑣2𝐴
where Fd is the drag force, v is the flow speed, A is the reference area, and is the mass
density of the fluid. In a solid/liquid mixture system, ρ is defined as:
𝜌 =100
(𝑐𝑤
𝜌𝑠+
100 − 𝑐𝑤
𝜌𝑙)
where cw is the concentration of solids by weight, ρs and ρl are densities of the solid and
liquid respectively.
Inspired by the drag coefficient concept, the pressure change induced by a Venturi tube is
characterized by the flow resistance, also called loss coefficient, (Lc) defined as:
𝐿𝑐 =𝑝𝑢 − 𝑝𝑑
12 𝜌𝑣𝑡ℎ
2
The potential of a flow to cavitate is characterized by the cavitation number defined as
𝜎 =𝑝 − 𝑝𝑣
12
𝜌𝑣𝑡ℎ2
where p is a reference pressure and pv the vapor pressure. pv is constant at 2333 Pa in this
study. The pressure was measured upstream and downstream leading to two possible
definitions of the cavitation number:
𝜎𝑑 =𝑝𝑑 − 𝑝𝑣
12 𝜌𝑣𝑡ℎ
2 and 𝜎𝑢 =
𝑝𝑢 − 𝑝𝑣
12 𝜌𝑣𝑡ℎ
2= 𝐿𝑐 + 𝜎𝑑
(3.6)
(3.3)
(3.5)
(3.7, 3.8)
(3.4)
33
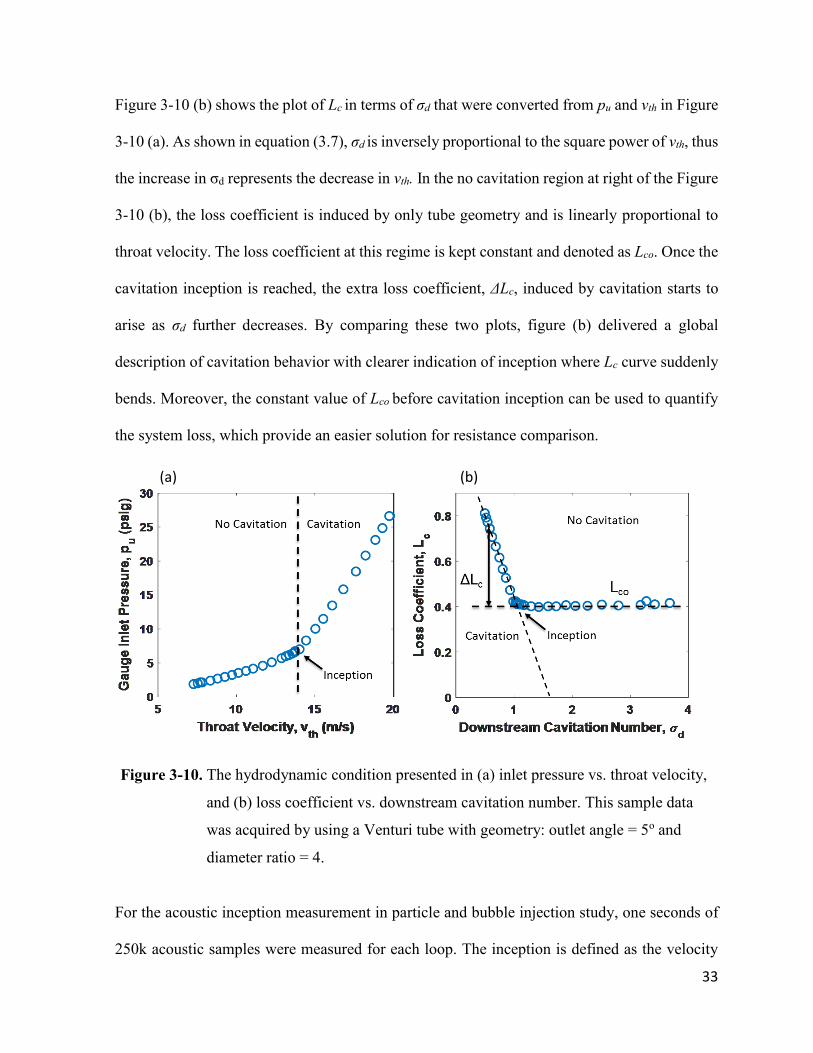
Figure 3-10 (b) shows the plot of Lc in terms of σd that were converted from pu and vth in Figure
3-10 (a). As shown in equation (3.7), σd is inversely proportional to the square power of vth, thus
the increase in σd represents the decrease in vth. In the no cavitation region at right of the Figure
3-10 (b), the loss coefficient is induced by only tube geometry and is linearly proportional to
throat velocity. The loss coefficient at this regime is kept constant and denoted as Lco. Once the
cavitation inception is reached, the extra loss coefficient, ΔLc, induced by cavitation starts to
arise as σd further decreases. By comparing these two plots, figure (b) delivered a global
description of cavitation behavior with clearer indication of inception where Lc curve suddenly
bends. Moreover, the constant value of Lco before cavitation inception can be used to quantify
the system loss, which provide an easier solution for resistance comparison.
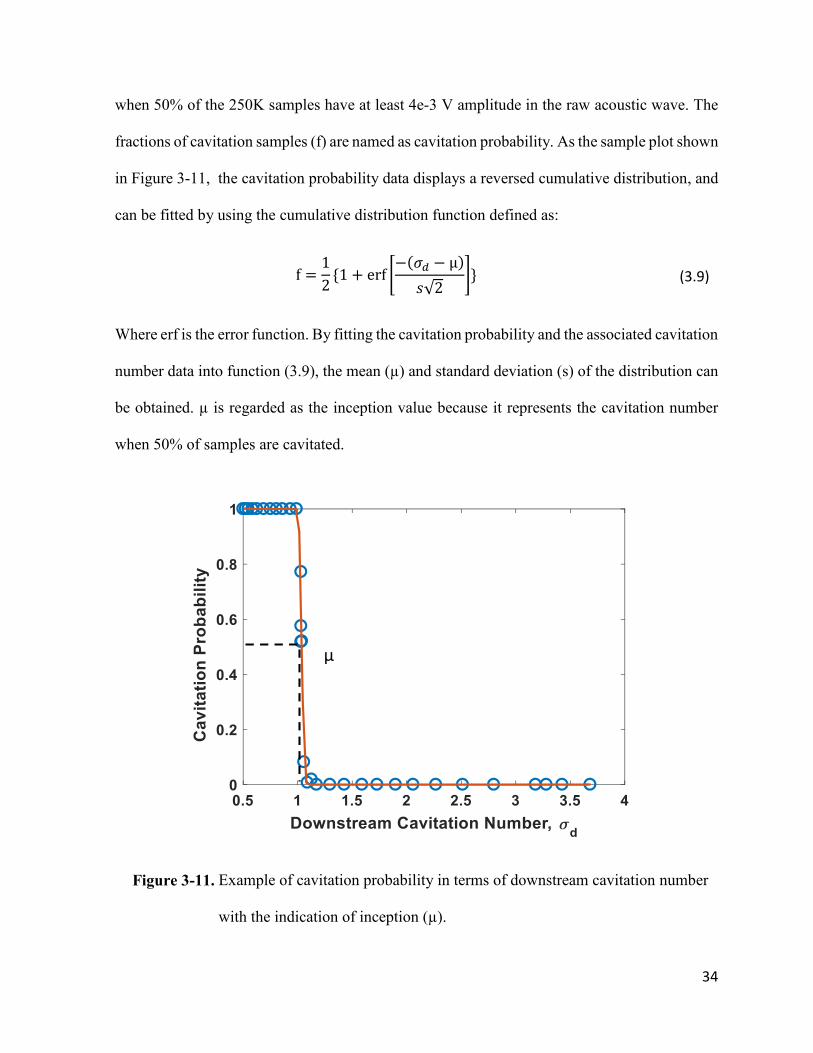
For the acoustic inception measurement in particle and bubble injection study, one seconds of
250k acoustic samples were measured for each loop. The inception is defined as the velocity
Figure 3-10. The hydrodynamic condition presented in (a) inlet pressure vs. throat velocity,
and (b) loss coefficient vs. downstream cavitation number. This sample data
was acquired by using a Venturi tube with geometry: outlet angle = 5o and
diameter ratio = 4.
(a) (b)
34
when 50% of the 250K samples have at least 4e-3 V amplitude in the raw acoustic wave. The
fractions of cavitation samples (f) are named as cavitation probability. As the sample plot shown
in Figure 3-11, the cavitation probability data displays a reversed cumulative distribution, and
can be fitted by using the cumulative distribution function defined as:
f =1
2{1 + erf [
−(𝜎𝑑 − µ)
𝑠√2]}
Where erf is the error function. By fitting the cavitation probability and the associated cavitation
number data into function (3.9), the mean (µ) and standard deviation (s) of the distribution can
be obtained. µ is regarded as the inception value because it represents the cavitation number
when 50% of samples are cavitated.
Figure 3-11. Example of cavitation probability in terms of downstream cavitation number
with the indication of inception (µ).
µ
(3.9)
35
3.5 Particle preparation and characterization methods
To prepare the fine particles for the 3-phase cavitation study, the crystalline bulk silica and
graphite flakes were ground using the shatter box. As the grinding time increases from 1 min
to 9 min, the particle sizes decreases, with a less and less rapid rate (Sanchez-Soto et al 1997).
Spherical glass beads purchased from Kisker Biotech GmbH & Co. KG and graphite particles
purchased from Sigma-Aldrich were also tested in the particle property study.
3.5.1 Mastersizer measurement
The Mastersizer 3000 laser diffraction particle size analyzer was used to determine the size and
counts number of micron size particles. With the technology of laser diffraction, Mastersizer
3000 can deliver quick and accurate particle size distributions with a wide particle size range
(Malvern 2013).
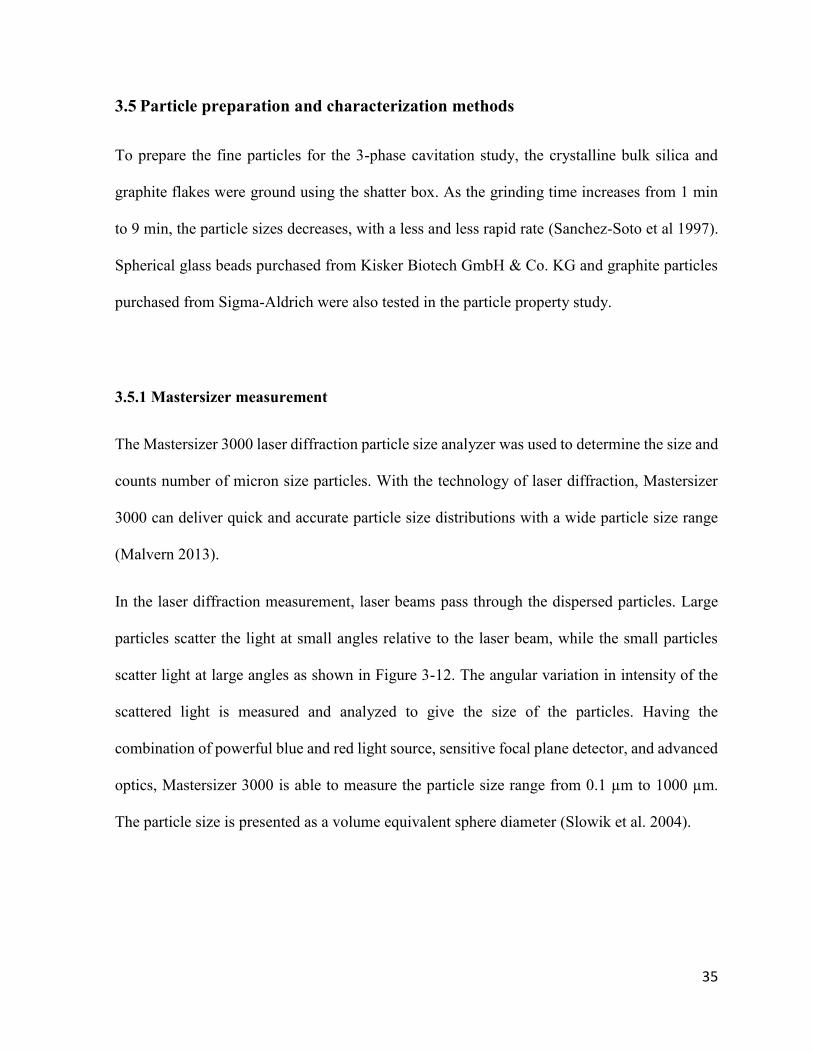
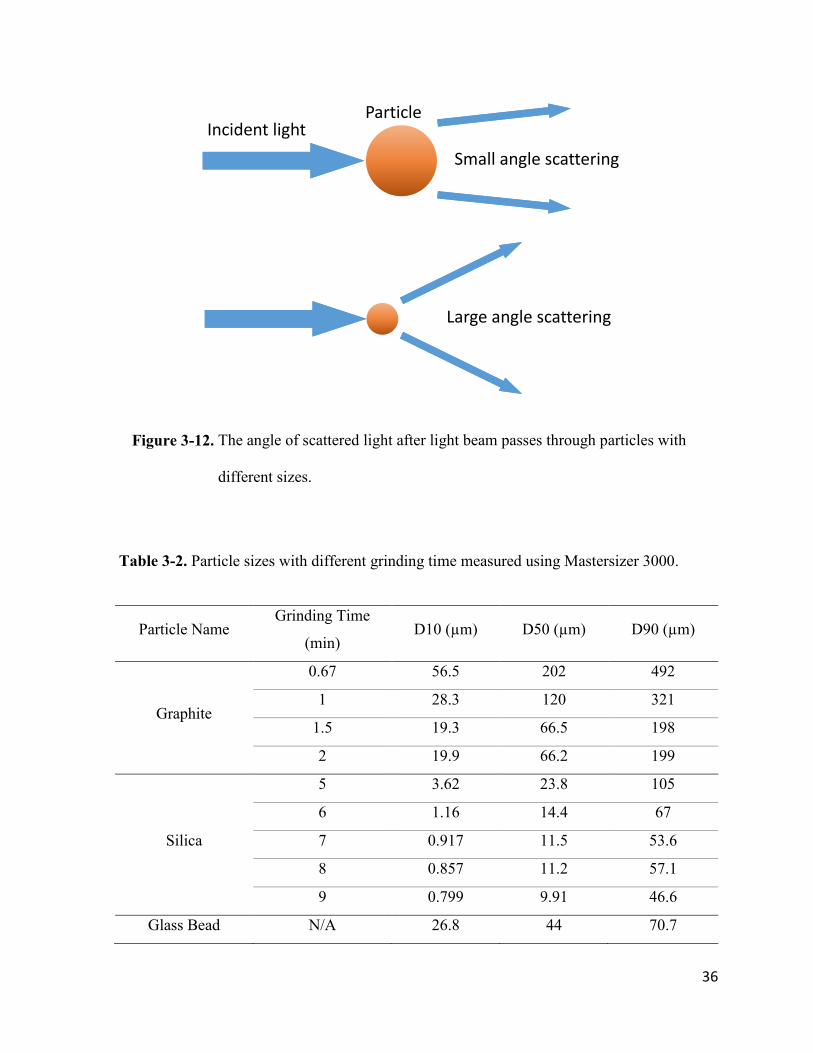
In the laser diffraction measurement, laser beams pass through the dispersed particles. Large
particles scatter the light at small angles relative to the laser beam, while the small particles
scatter light at large angles as shown in Figure 3-12. The angular variation in intensity of the
scattered light is measured and analyzed to give the size of the particles. Having the
combination of powerful blue and red light source, sensitive focal plane detector, and advanced
optics, Mastersizer 3000 is able to measure the particle size range from 0.1 µm to 1000 µm.
The particle size is presented as a volume equivalent sphere diameter (Slowik et al. 2004).
36
Figure 3-12. The angle of scattered light after light beam passes through particles with
different sizes.
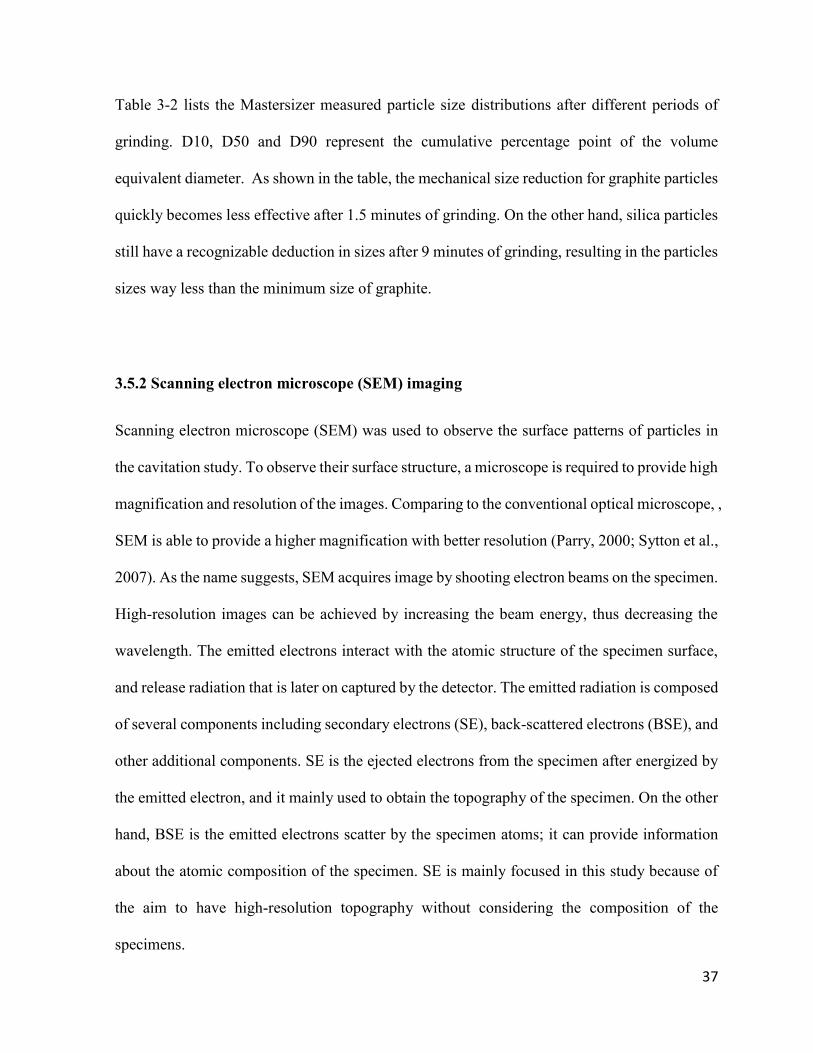
Table 3-2. Particle sizes with different grinding time measured using Mastersizer 3000.
Particle Name Grinding Time
(min) D10 (µm) D50 (µm) D90 (µm)
Graphite
0.67 56.5 202 492
1 28.3 120 321
1.5 19.3 66.5 198
2 19.9 66.2 199
Silica
5 3.62 23.8 105
6 1.16 14.4 67
7 0.917 11.5 53.6
8 0.857 11.2 57.1
9 0.799 9.91 46.6
Glass Bead N/A 26.8 44 70.7
Incident light
Small angle scattering
Large angle scattering
Particle
37
Table 3-2 lists the Mastersizer measured particle size distributions after different periods of
grinding. D10, D50 and D90 represent the cumulative percentage point of the volume
equivalent diameter. As shown in the table, the mechanical size reduction for graphite particles
quickly becomes less effective after 1.5 minutes of grinding. On the other hand, silica particles
still have a recognizable deduction in sizes after 9 minutes of grinding, resulting in the particles
sizes way less than the minimum size of graphite.
3.5.2 Scanning electron microscope (SEM) imaging
Scanning electron microscope (SEM) was used to observe the surface patterns of particles in
the cavitation study. To observe their surface structure, a microscope is required to provide high
magnification and resolution of the images. Comparing to the conventional optical microscope, ,
SEM is able to provide a higher magnification with better resolution (Parry, 2000; Sytton et al.,
2007). As the name suggests, SEM acquires image by shooting electron beams on the specimen.
High-resolution images can be achieved by increasing the beam energy, thus decreasing the
wavelength. The emitted electrons interact with the atomic structure of the specimen surface,
and release radiation that is later on captured by the detector. The emitted radiation is composed
of several components including secondary electrons (SE), back-scattered electrons (BSE), and
other additional components. SE is the ejected electrons from the specimen after energized by
the emitted electron, and it mainly used to obtain the topography of the specimen. On the other
hand, BSE is the emitted electrons scatter by the specimen atoms; it can provide information
about the atomic composition of the specimen. SE is mainly focused in this study because of
the aim to have high-resolution topography without considering the composition of the
specimens.
38
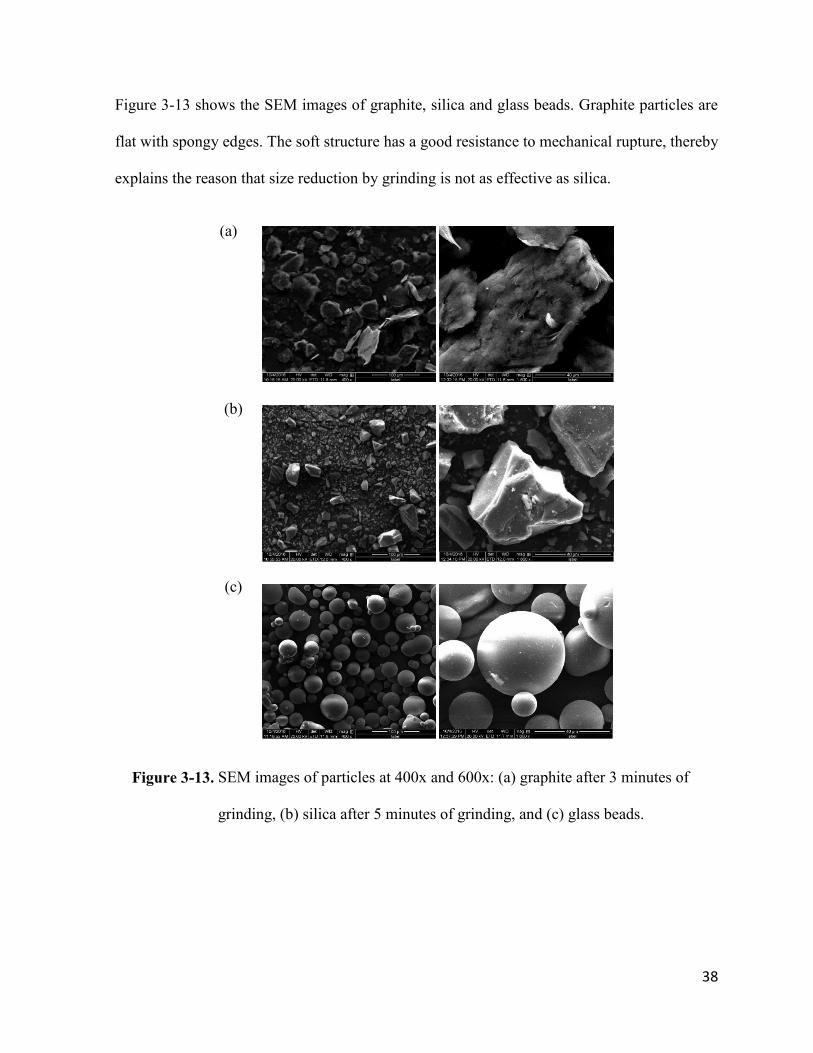
Figure 3-13 shows the SEM images of graphite, silica and glass beads. Graphite particles are
flat with spongy edges. The soft structure has a good resistance to mechanical rupture, thereby
explains the reason that size reduction by grinding is not as effective as silica.
Figure 3-13. SEM images of particles at 400x and 600x: (a) graphite after 3 minutes of
grinding, (b) silica after 5 minutes of grinding, and (c) glass beads.
(a)
(b)
(c)
39
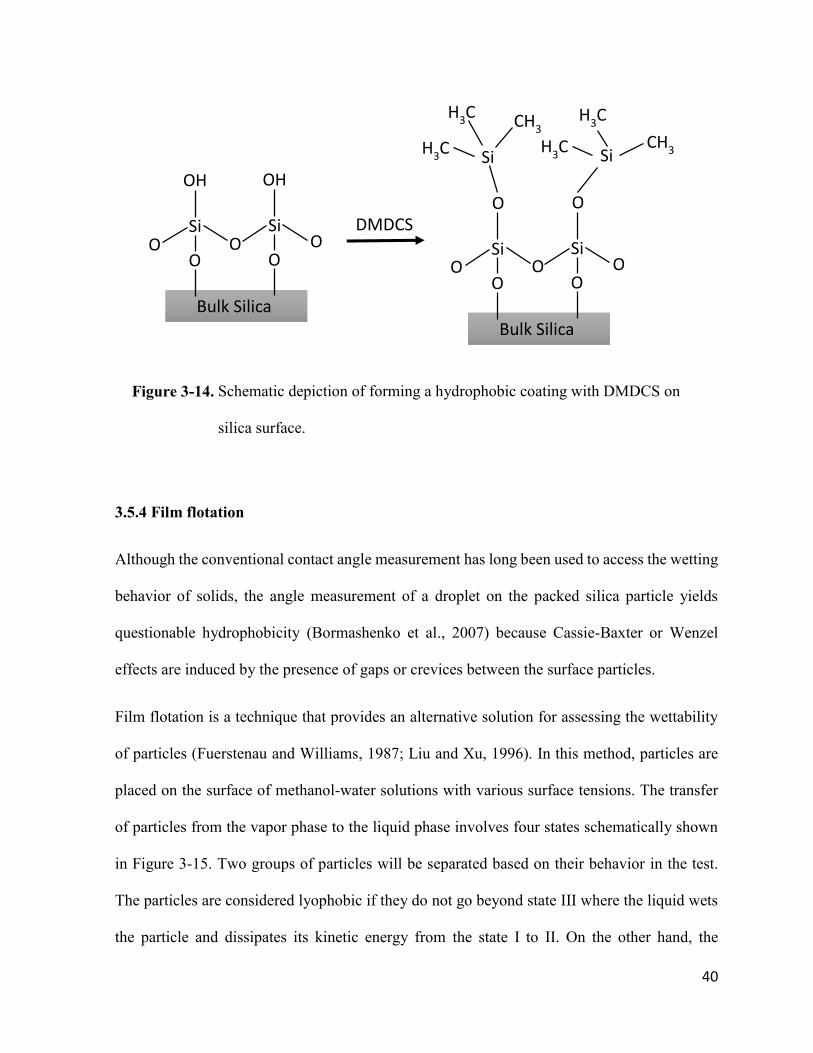
3.5.3 Contact angle measurement and hydrophobic bath
The wettability of the particles is an important parameter especially in the study of effect of
particle properties on cavitation. The contact angle that is formed by a liquid at the three-phase
boundary has been used to quantitatively describe the wettability. In this study, the material
contact angle was measured by using KRUSS optical Tensiometer (Biolin Scientific). To avoid
the error induced by Wenzel or Cassie-Baxter effect, this measurement requires a flat material
surface to be tested on. For the contact angle measurement of bare silica, A silica wafer with a
flat surface was prepared by polishing the bulk material. The contact angle of the bare silica is
around 8o, indicating the bare silica hydrophilic surface property.
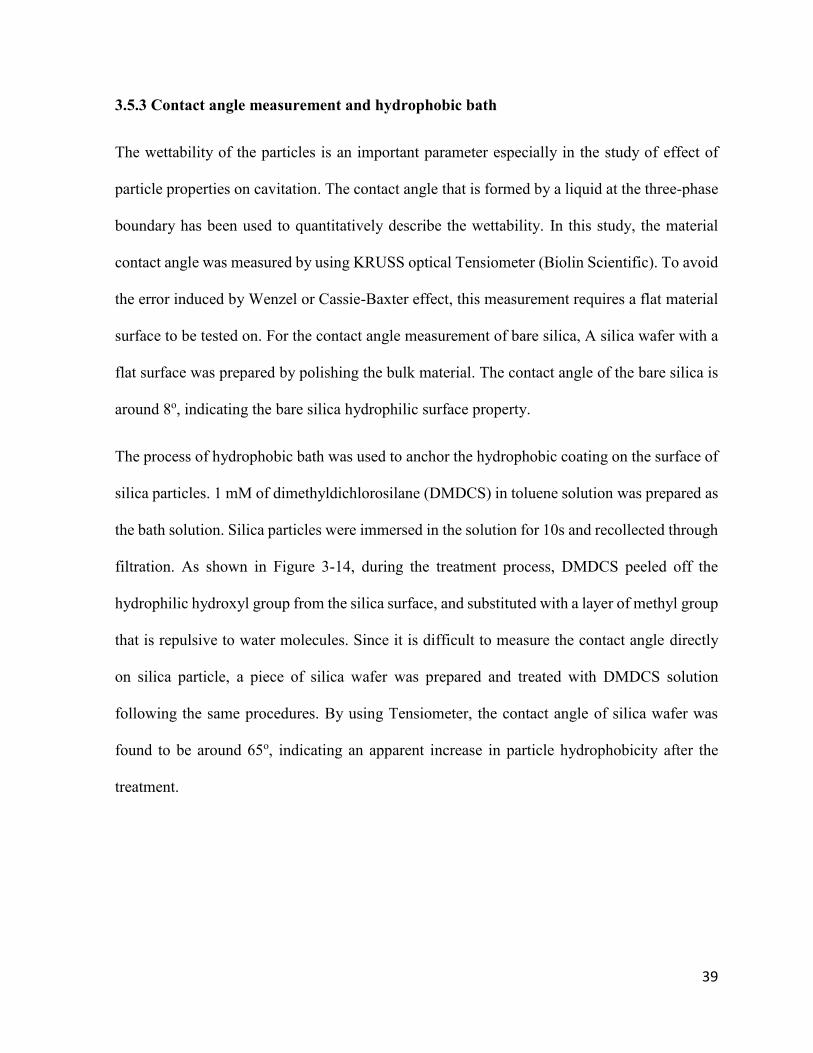
The process of hydrophobic bath was used to anchor the hydrophobic coating on the surface of
silica particles. 1 mM of dimethyldichlorosilane (DMDCS) in toluene solution was prepared as
the bath solution. Silica particles were immersed in the solution for 10s and recollected through
filtration. As shown in Figure 3-14, during the treatment process, DMDCS peeled off the
hydrophilic hydroxyl group from the silica surface, and substituted with a layer of methyl group
that is repulsive to water molecules. Since it is difficult to measure the contact angle directly
on silica particle, a piece of silica wafer was prepared and treated with DMDCS solution
following the same procedures. By using Tensiometer, the contact angle of silica wafer was
found to be around 65o, indicating an apparent increase in particle hydrophobicity after the
treatment.
40
Figure 3-14. Schematic depiction of forming a hydrophobic coating with DMDCS on
silica surface.
3.5.4 Film flotation
Although the conventional contact angle measurement has long been used to access the wetting
behavior of solids, the angle measurement of a droplet on the packed silica particle yields
questionable hydrophobicity (Bormashenko et al., 2007) because Cassie-Baxter or Wenzel
effects are induced by the presence of gaps or crevices between the surface particles.
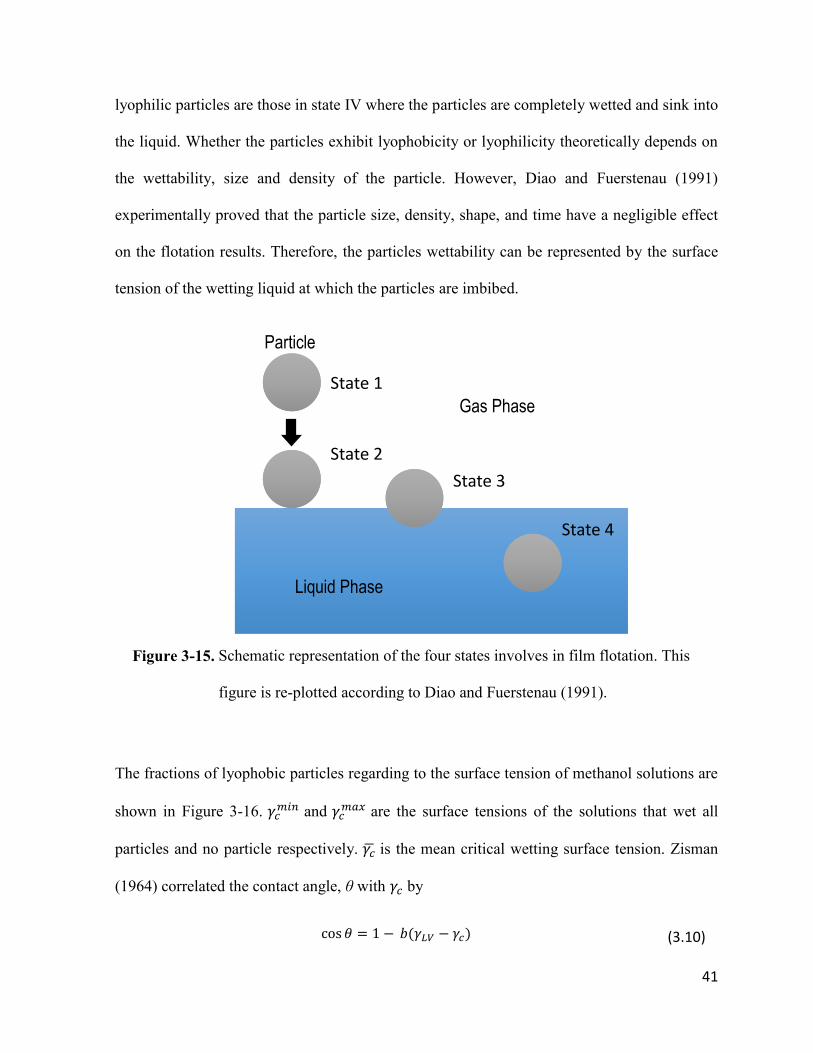
Film flotation is a technique that provides an alternative solution for assessing the wettability
of particles (Fuerstenau and Williams, 1987; Liu and Xu, 1996). In this method, particles are
placed on the surface of methanol-water solutions with various surface tensions. The transfer
of particles from the vapor phase to the liquid phase involves four states schematically shown
in Figure 3-15. Two groups of particles will be separated based on their behavior in the test.
The particles are considered lyophobic if they do not go beyond state III where the liquid wets
the particle and dissipates its kinetic energy from the state I to II. On the other hand, the
O
Bulk Silica
Si O
OH
O O
Si
OH
O DMDCS
O
Bulk Silica
Si O
O
O O
Si
O
O
Si
CH3
H3C
H3C Si
CH3
H3C
H3C
41
lyophilic particles are those in state IV where the particles are completely wetted and sink into
the liquid. Whether the particles exhibit lyophobicity or lyophilicity theoretically depends on
the wettability, size and density of the particle. However, Diao and Fuerstenau (1991)
experimentally proved that the particle size, density, shape, and time have a negligible effect
on the flotation results. Therefore, the particles wettability can be represented by the surface
tension of the wetting liquid at which the particles are imbibed.
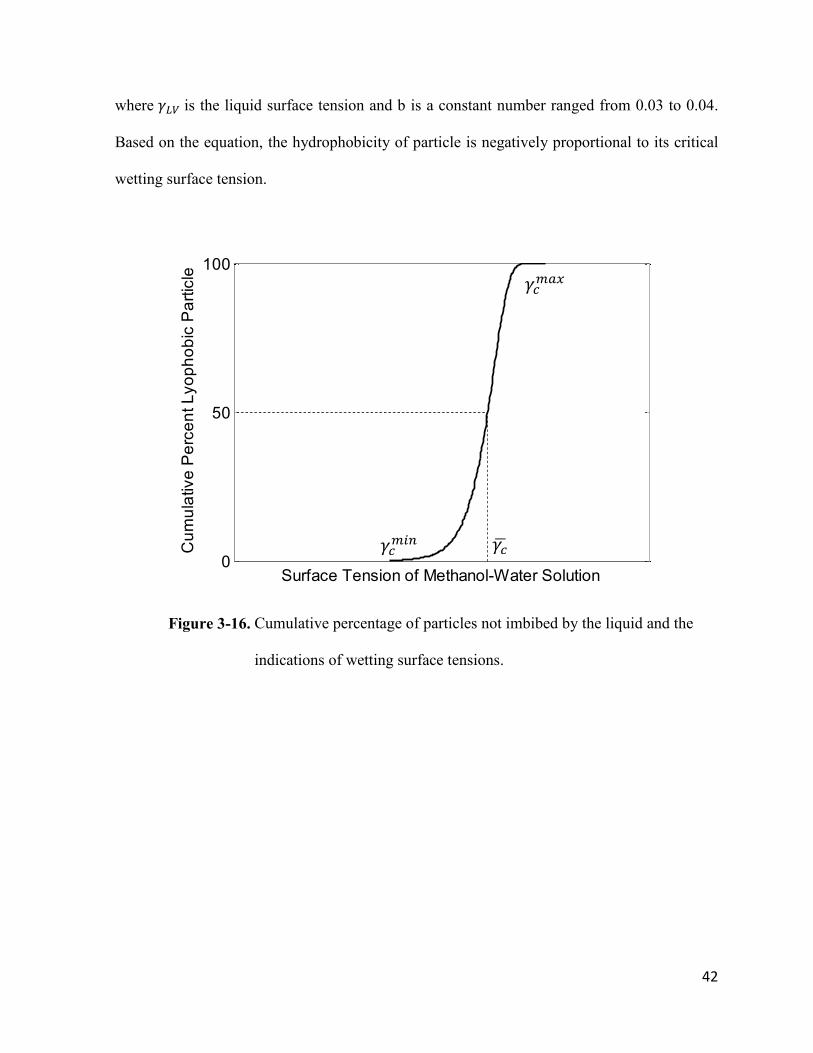
The fractions of lyophobic particles regarding to the surface tension of methanol solutions are
shown in Figure 3-16. 𝛾𝑐𝑚𝑖𝑛 and 𝛾𝑐
𝑚𝑎𝑥 are the surface tensions of the solutions that wet all
particles and no particle respectively. 𝛾�� is the mean critical wetting surface tension. Zisman
(1964) correlated the contact angle, θ with 𝛾𝑐 by
cos 𝜃 = 1 − 𝑏(𝛾𝐿𝑉 − 𝛾𝑐)
Figure 3-15. Schematic representation of the four states involves in film flotation. This
figure is re-plotted according to Diao and Fuerstenau (1991).
State 1
State 2
State 3
State 4
Liquid Phase
Gas Phase
Particle
(3.10)
42
where 𝛾𝐿𝑉 is the liquid surface tension and b is a constant number ranged from 0.03 to 0.04.
Based on the equation, the hydrophobicity of particle is negatively proportional to its critical
wetting surface tension.
Figure 3-16. Cumulative percentage of particles not imbibed by the liquid and the
indications of wetting surface tensions.
0
50
100
Surface Tension of Methanol-Water Solution
Cu
mu
lative
Pe
rce
nt L
yo
ph
ob
ic P
art
icle
𝛾�� 𝛾𝑐𝑚𝑖𝑛
𝛾𝑐𝑚𝑎𝑥
43
Chapter 4 Results and Discussion of Venturi Geometry Study
In the Venturi tube geometry study, I focused on four geometrical parameters: inlet angle, throat
length, outlet angle, and diameter ratio. For a preliminary understanding of the effect of
geometry, single-phase numerical simulations were performed in advance to help indicate the
critical parameters that require further experimental investigation.
4.1 CFD simulation of Venturi tube pressure profile
The numerical simulation provides the pressure profile along different tube models at the same
throat velocity of 20 m/s (Figure 4-1). Pressure evolution follows the same trend regardless the
geometry: the pressure starting higher at the inlet decreases at the throat since the liquid is
accelerating according to Bernoulli’s principle. It then increases in the outlet to recover to the
atmospheric pressure. The inlet pressure differs from the outlet pressure due to viscous loss,
which depends on the tube geometry. To identify the critical geometric parameters on cavitation
behavior, I focused the analysis on the inlet and throat pressures. The throat pressure is a good
indicator of the cavitation as lower pressure represents higher tensile strength. Bubble
nucleation is expected when the tensile strength reaches a critical value. In addition, the inlet
pressure characterizes the loss and thus the power consumption of a tube. Although single-
phase simulations cannot accurately predict inlet and throat pressures, it allows us to identify a
global trend and determines the critical geometrical parameters.
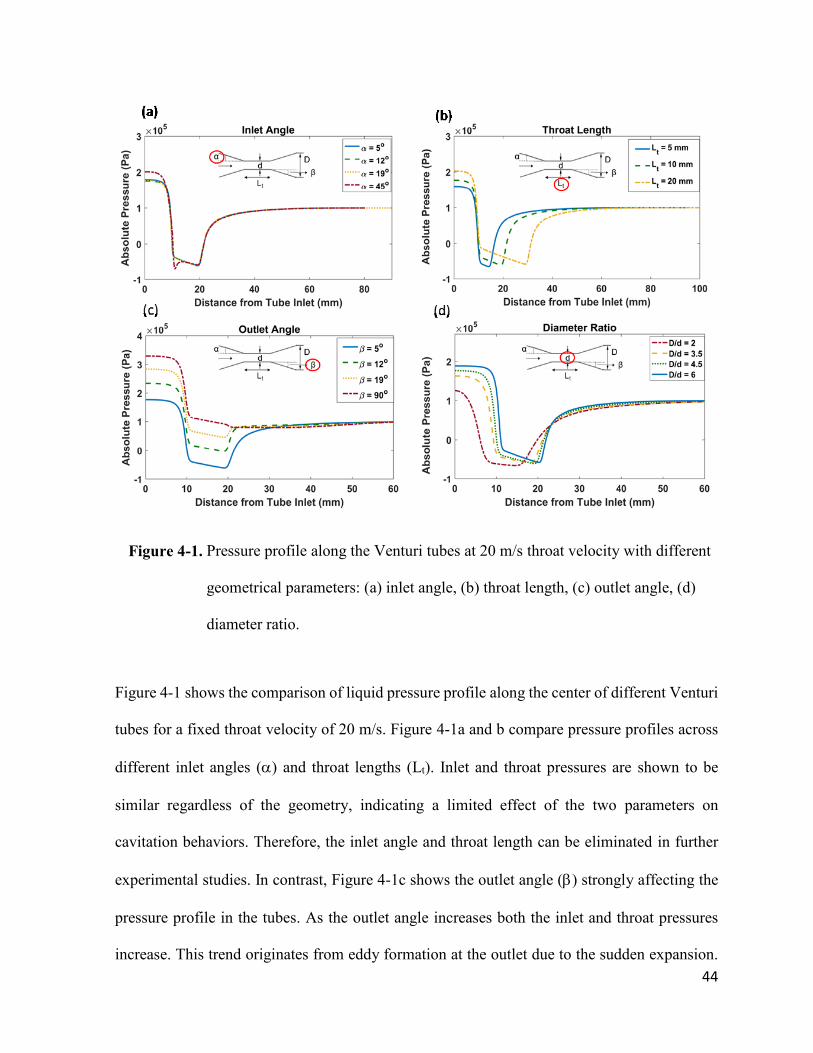
44
Figure 4-1. Pressure profile along the Venturi tubes at 20 m/s throat velocity with different
geometrical parameters: (a) inlet angle, (b) throat length, (c) outlet angle, (d)
diameter ratio.
Figure 4-1 shows the comparison of liquid pressure profile along the center of different Venturi
tubes for a fixed throat velocity of 20 m/s. Figure 4-1a and b compare pressure profiles across
different inlet angles () and throat lengths (Lt). Inlet and throat pressures are shown to be
similar regardless of the geometry, indicating a limited effect of the two parameters on
cavitation behaviors. Therefore, the inlet angle and throat length can be eliminated in further
experimental studies. In contrast, Figure 4-1c shows the outlet angle () strongly affecting the
pressure profile in the tubes. As the outlet angle increases both the inlet and throat pressures
increase. This trend originates from eddy formation at the outlet due to the sudden expansion.
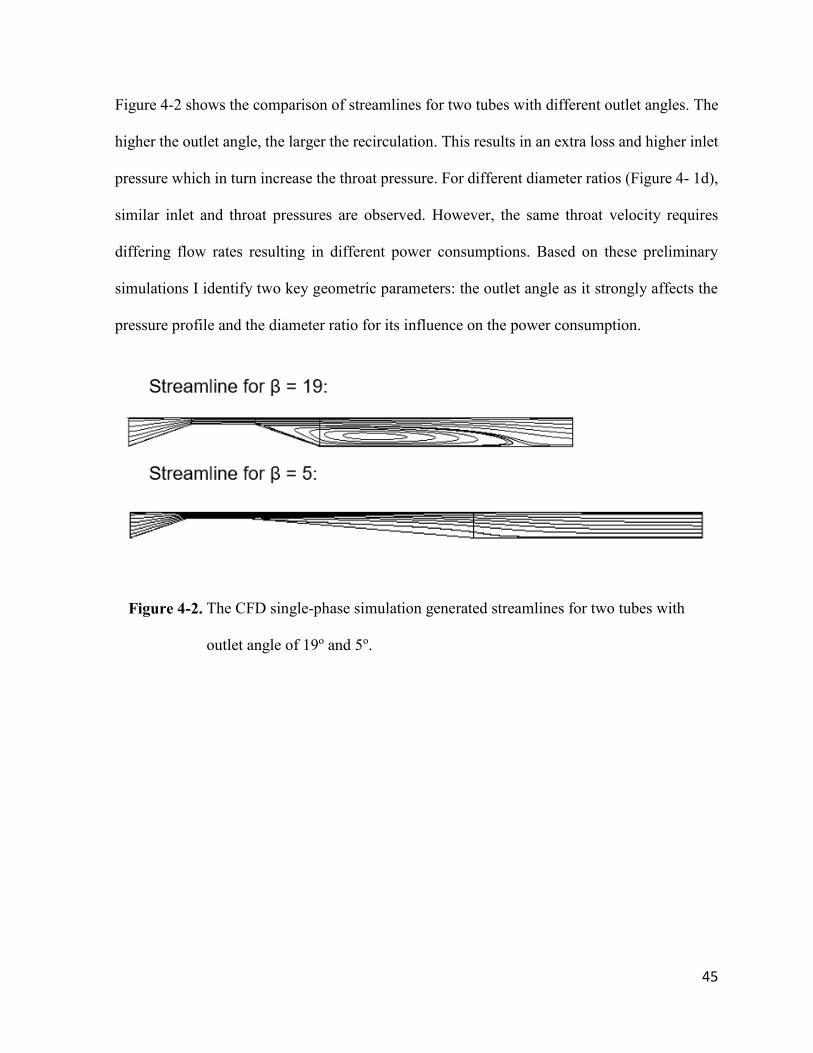
45
Figure 4-2 shows the comparison of streamlines for two tubes with different outlet angles. The
higher the outlet angle, the larger the recirculation. This results in an extra loss and higher inlet
pressure which in turn increase the throat pressure. For different diameter ratios (Figure 4- 1d),
similar inlet and throat pressures are observed. However, the same throat velocity requires
differing flow rates resulting in different power consumptions. Based on these preliminary
simulations I identify two key geometric parameters: the outlet angle as it strongly affects the
pressure profile and the diameter ratio for its influence on the power consumption.
Figure 4-2. The CFD single-phase simulation generated streamlines for two tubes with
outlet angle of 19o and 5o.
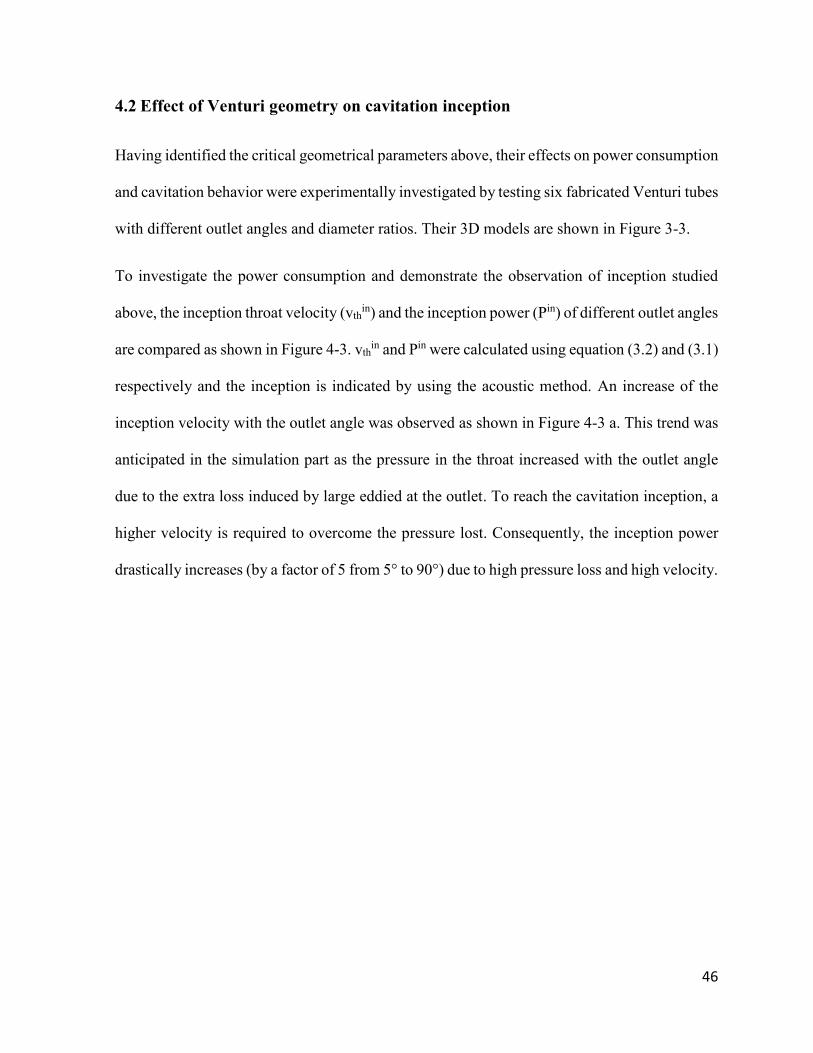
46
4.2 Effect of Venturi geometry on cavitation inception
Having identified the critical geometrical parameters above, their effects on power consumption
and cavitation behavior were experimentally investigated by testing six fabricated Venturi tubes
with different outlet angles and diameter ratios. Their 3D models are shown in Figure 3-3.
To investigate the power consumption and demonstrate the observation of inception studied
above, the inception throat velocity (vthin) and the inception power (Pin) of different outlet angles
are compared as shown in Figure 4-3. vthin and Pin were calculated using equation (3.2) and (3.1)
respectively and the inception is indicated by using the acoustic method. An increase of the
inception velocity with the outlet angle was observed as shown in Figure 4-3 a. This trend was
anticipated in the simulation part as the pressure in the throat increased with the outlet angle
due to the extra loss induced by large eddied at the outlet. To reach the cavitation inception, a
higher velocity is required to overcome the pressure lost. Consequently, the inception power
drastically increases (by a factor of 5 from 5° to 90°) due to high pressure loss and high velocity.
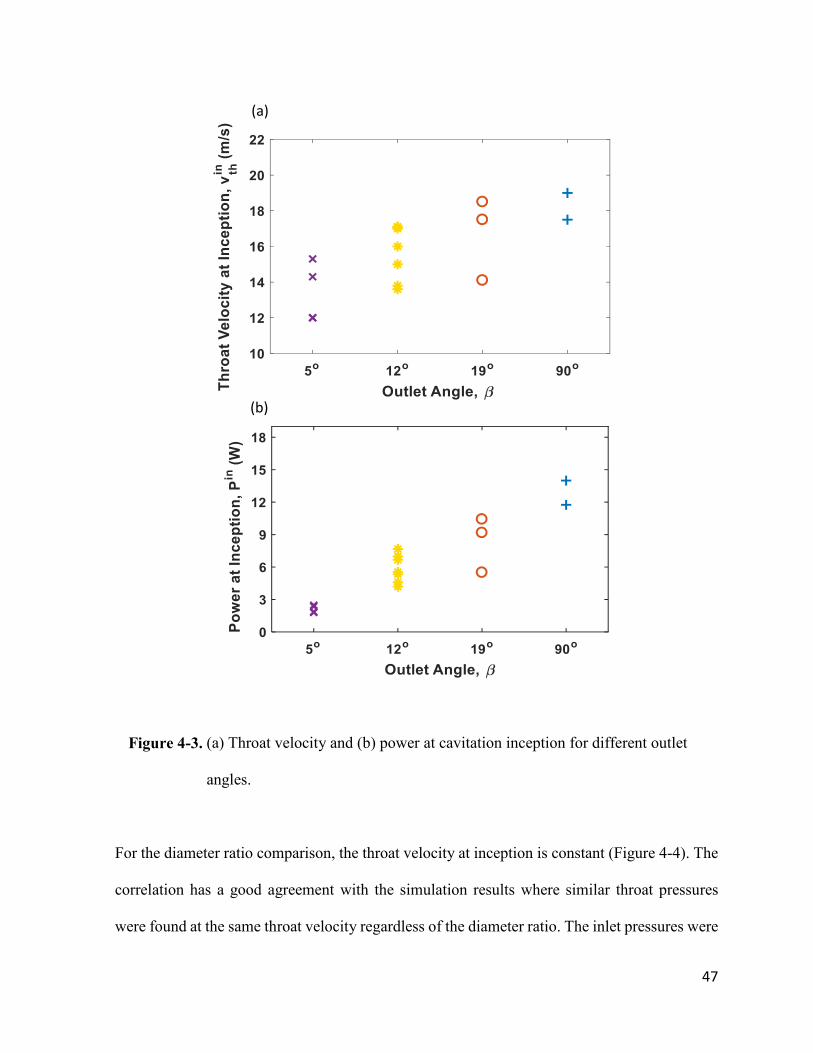
47
Figure 4-3. (a) Throat velocity and (b) power at cavitation inception for different outlet
angles.
For the diameter ratio comparison, the throat velocity at inception is constant (Figure 4-4). The
correlation has a good agreement with the simulation results where similar throat pressures
were found at the same throat velocity regardless of the diameter ratio. The inlet pressures were
(b)
(a)
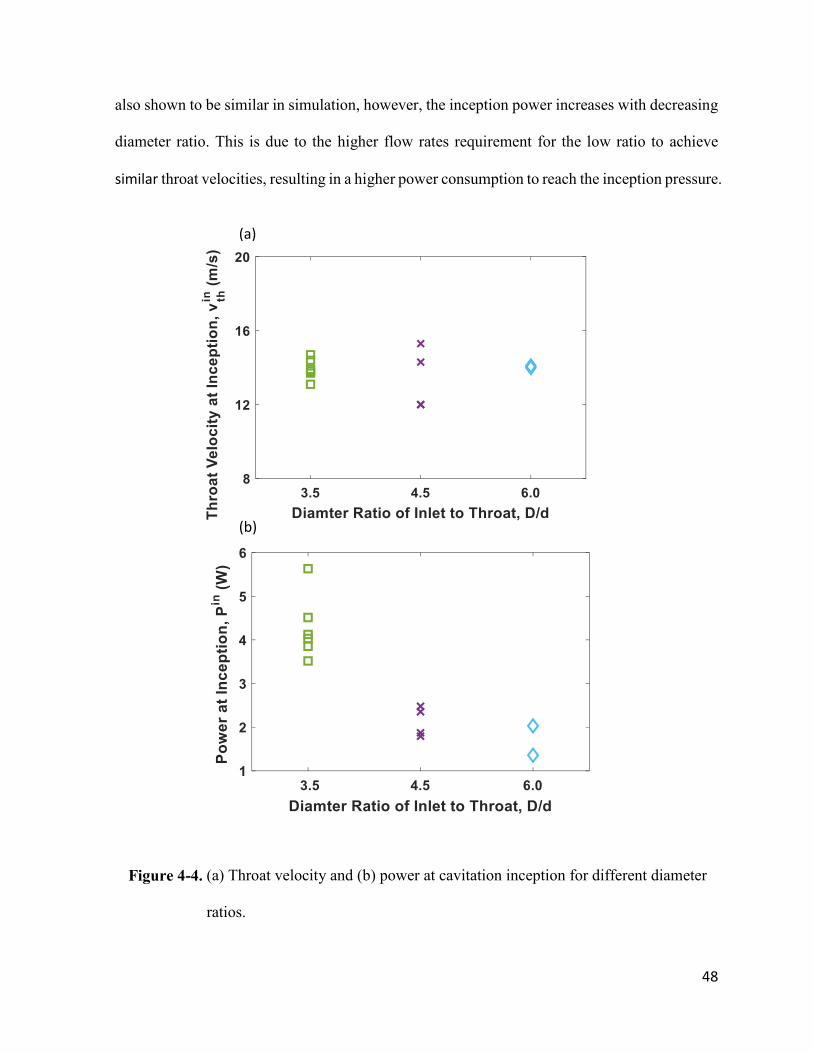
48
also shown to be similar in simulation, however, the inception power increases with decreasing
diameter ratio. This is due to the higher flow rates requirement for the low ratio to achieve
similar throat velocities, resulting in a higher power consumption to reach the inception pressure.
Figure 4-4. (a) Throat velocity and (b) power at cavitation inception for different diameter
ratios.
(b)
(a)
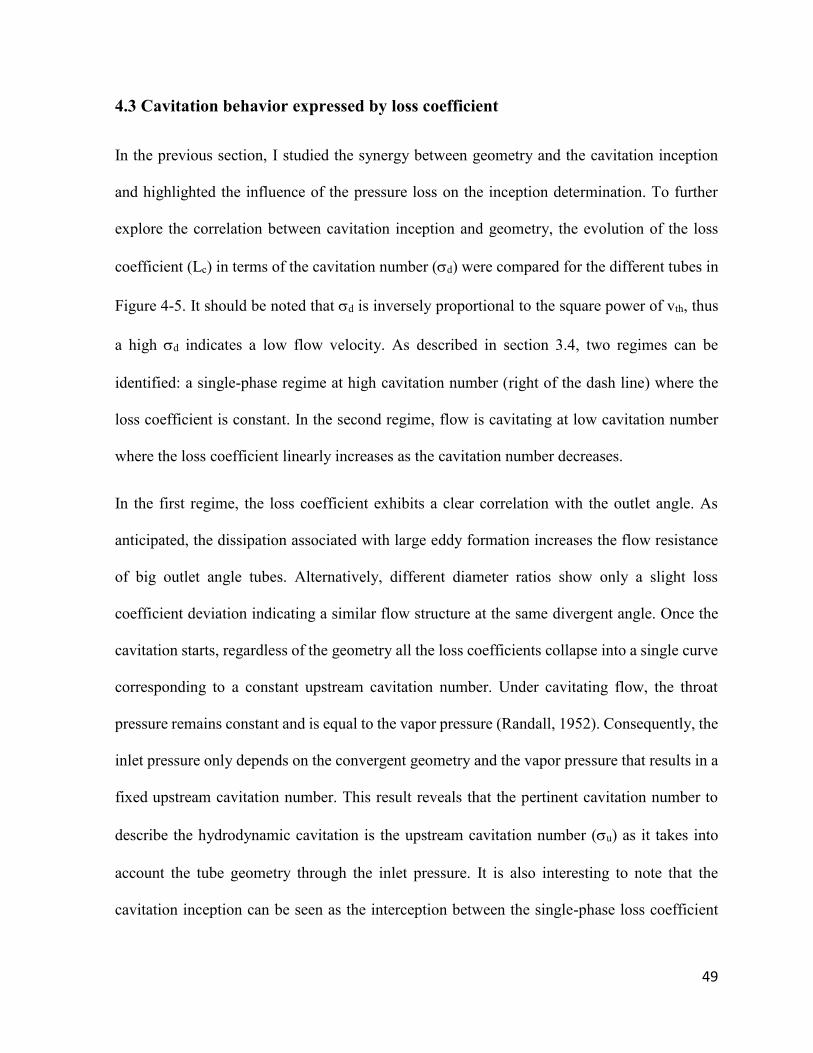
49
4.3 Cavitation behavior expressed by loss coefficient
In the previous section, I studied the synergy between geometry and the cavitation inception
and highlighted the influence of the pressure loss on the inception determination. To further
explore the correlation between cavitation inception and geometry, the evolution of the loss
coefficient (Lc) in terms of the cavitation number (d) were compared for the different tubes in
Figure 4-5. It should be noted that d is inversely proportional to the square power of vth, thus
a high d indicates a low flow velocity. As described in section 3.4, two regimes can be
identified: a single-phase regime at high cavitation number (right of the dash line) where the
loss coefficient is constant. In the second regime, flow is cavitating at low cavitation number
where the loss coefficient linearly increases as the cavitation number decreases.
In the first regime, the loss coefficient exhibits a clear correlation with the outlet angle. As
anticipated, the dissipation associated with large eddy formation increases the flow resistance
of big outlet angle tubes. Alternatively, different diameter ratios show only a slight loss
coefficient deviation indicating a similar flow structure at the same divergent angle. Once the
cavitation starts, regardless of the geometry all the loss coefficients collapse into a single curve
corresponding to a constant upstream cavitation number. Under cavitating flow, the throat
pressure remains constant and is equal to the vapor pressure (Randall, 1952). Consequently, the
inlet pressure only depends on the convergent geometry and the vapor pressure that results in a
fixed upstream cavitation number. This result reveals that the pertinent cavitation number to
describe the hydrodynamic cavitation is the upstream cavitation number (u) as it takes into
account the tube geometry through the inlet pressure. It is also interesting to note that the
cavitation inception can be seen as the interception between the single-phase loss coefficient
50
(Lc0) and the constant inlet cavitation number (u). Low flow resistance tubes (small Lc0) have
a higher inception downstream cavitation number (din) as shown in the inception study.
Figure 4-5. Loss coefficient in terms of downstream cavitation number for different
Venturi tube geometries.
51
4.4 Effect of Venturi geometry on bubble generation
The cavitation phenomena consist of the nucleation of bubbles inside a liquid where the local
pressure drops below the saturation pressure. As the pressure recovers, a part of this bubble
collapses while the other part can be stabilized by the dissolved gas inside the liquid and
therefore can be recorded with a high-speed camera. This nucleation process is associated with
an increase of the loss as shown in Figure 4-5.
In Figure 4-6, the cumulative bubble volume recorded by the camera is plotted against the extra-
loss induced by the cavitation defined as the difference between the loss coefficient under
cavitation and the single-phase loss coefficient (Lc0):
△ 𝐿𝑐 = (𝐿𝑐 − 𝐿𝑐𝑜)
Table 4-1. The average single-phase loss coefficient Lc0 for the different geometries.
Tube Design Mean System Loss,
Lco
Standard
Deviation
β=90° D/d=4.5 1.372 0.047
β=19o D/d=4.5 1.250 0.042
β=12o D/d=4.5 1.030 0.072
β=5o D/d=4.5 0.621 0.013
β=5o D/d=3.5 0.583 0.032
β=5o D/d=6 0.669 0.075
(3.5)
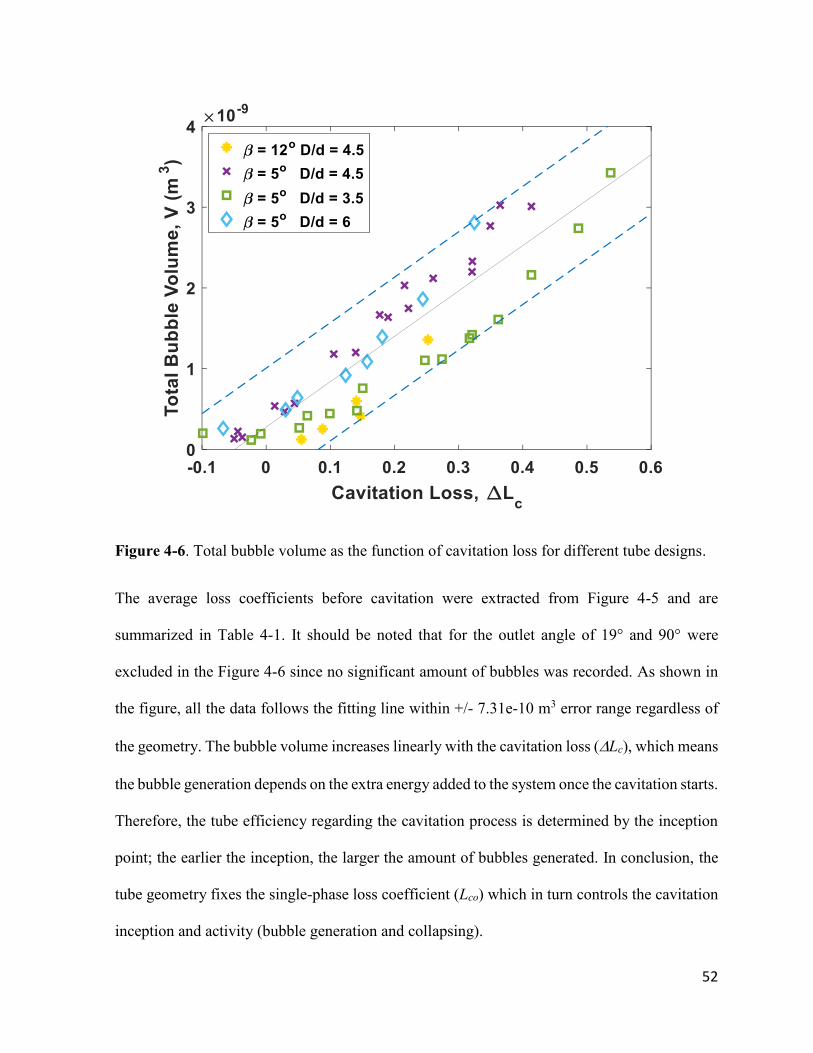
52
Figure 4-6. Total bubble volume as the function of cavitation loss for different tube designs.
The average loss coefficients before cavitation were extracted from Figure 4-5 and are
summarized in Table 4-1. It should be noted that for the outlet angle of 19° and 90° were
excluded in the Figure 4-6 since no significant amount of bubbles was recorded. As shown in
the figure, all the data follows the fitting line within +/- 7.31e-10 m3 error range regardless of
the geometry. The bubble volume increases linearly with the cavitation loss (Lc), which means
the bubble generation depends on the extra energy added to the system once the cavitation starts.
Therefore, the tube efficiency regarding the cavitation process is determined by the inception
point; the earlier the inception, the larger the amount of bubbles generated. In conclusion, the
tube geometry fixes the single-phase loss coefficient (Lco) which in turn controls the cavitation
inception and activity (bubble generation and collapsing).
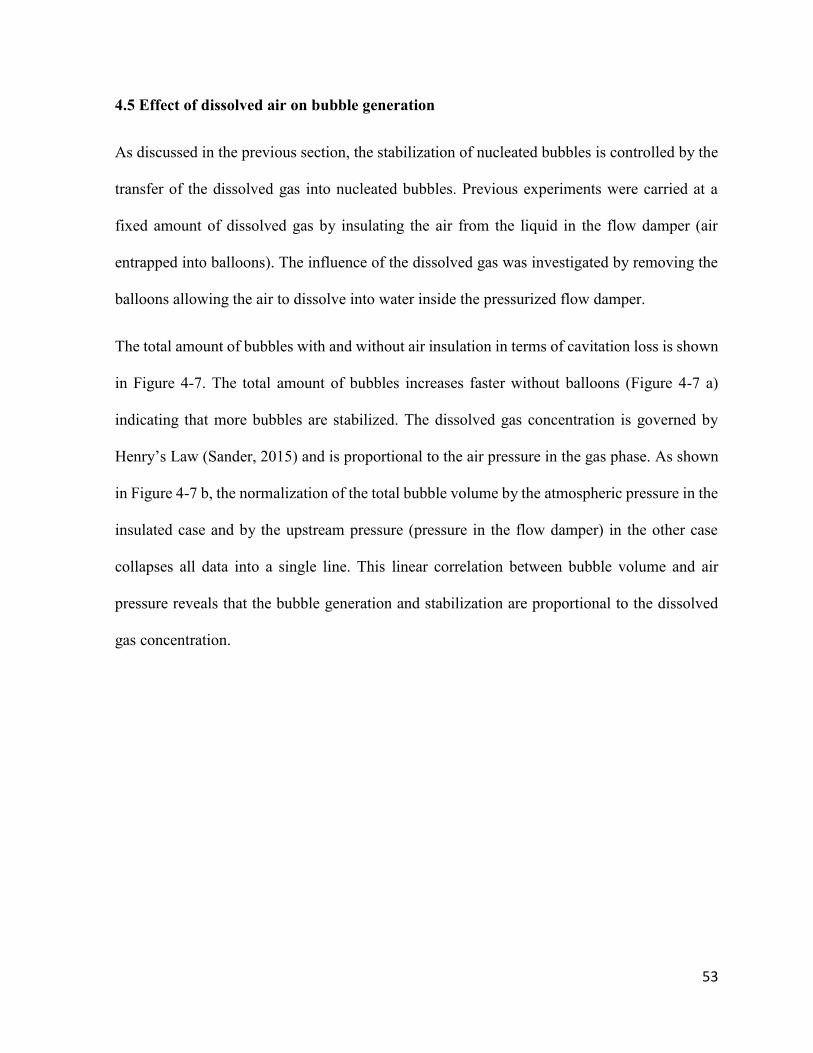
53
4.5 Effect of dissolved air on bubble generation
As discussed in the previous section, the stabilization of nucleated bubbles is controlled by the
transfer of the dissolved gas into nucleated bubbles. Previous experiments were carried at a
fixed amount of dissolved gas by insulating the air from the liquid in the flow damper (air
entrapped into balloons). The influence of the dissolved gas was investigated by removing the
balloons allowing the air to dissolve into water inside the pressurized flow damper.
The total amount of bubbles with and without air insulation in terms of cavitation loss is shown
in Figure 4-7. The total amount of bubbles increases faster without balloons (Figure 4-7 a)
indicating that more bubbles are stabilized. The dissolved gas concentration is governed by
Henry’s Law (Sander, 2015) and is proportional to the air pressure in the gas phase. As shown
in Figure 4-7 b, the normalization of the total bubble volume by the atmospheric pressure in the
insulated case and by the upstream pressure (pressure in the flow damper) in the other case
collapses all data into a single line. This linear correlation between bubble volume and air
pressure reveals that the bubble generation and stabilization are proportional to the dissolved
gas concentration.
54
Figure 4-7. (a) Total bubble volume and (b) normalized bubble volume in terms of the
cavitation loss with and without water-air insulation for a diameter ratio of 4.5
and outlet angle of 5°.
(a)
(b)
55
Chapter 5 Results and Discussion of particle and bubble influence on
hydrodynamic cavitation behavior
The bubble generation in cavitation processes is regarded as heterogeneous nucleation because
of the presence of solid and gas content in liquid phase providing sites with lower energy barrier
for bubble generation. Correspondingly, hydrodynamic cavitation can be theoretically
promoted by the presences of the solid/liquid interface, crevice structure of the solid surface,
and the pre-existing bubbles. In the Venturi tube geometry study of last Chapter, hydrodynamic
cavitation experiments were performed with merely tap water. The bubble nucleation took
places on sites including the tube wall and suspending gas nuclei, but the number and strength
of the sites were hard to manage. Modern industrial applications such as mineral flotation
involve hydrodynamic cavitation associated with particles slurries and bubble injection. To
better investigate the practical cavitation behavior involving particles and bubbles in the fluid,
a multi-phase system is required in the experimental study. In this Chapter, particles with
different wettability, concentration, surface structures, and bubbles with different injection rates
were introduced into the liquid system to investigate the effect of particle and bubble addition
on hydrodynamic cavitation.
56
5.1 Particle characterization
Table 5-1. Properties of tested particles
Particle Name Contact Angle (o) Structure D50 (µm)
Graphite N/A Irregular
Flake 66.2
Bare Silica (BS) 8 Irregular 23.8
Treated Silica (TS) 65 Irregular 23.8
Glass Bead (GB) N/A Smooth
spherical 44
Bare silica (fresh silica after 5 minutes of grinding), treated silica (bare silica with hydrophobic
treatment), graphite (graphite flakes after 2 minutes of grinding), and glass bead are the four
types of particles that were tested in the particle effect study. Their properties obtained from
section 3.5 are listed in Table 5-1. In Figure 3-13, the SEM images of particles are shown. The
glass beads exhibit spherical shape with a relatively smooth surface. On the other hand, silica
and graphite particles have irregular shapes with crevices distributed on the surfaces. The
Mastersizer measurement of particles sizes shows the graphite to have the largest mean
diameter because the soft edges on the graphite flakes weakened the effect of grinding.
Followed by the glass beads, silica particles are the smallest among all. The treated and
untreated silica particles have approximate contact angles of 8o and 65o respectively. The angle
measurements were performed on prepared flat surfaces made of the same material. Realizing
the difficulties in measuring the contact angle of graphite and glass bead, the method of film
flotation was adopted so the particles’ wettabilities could be compared by looking at the critical
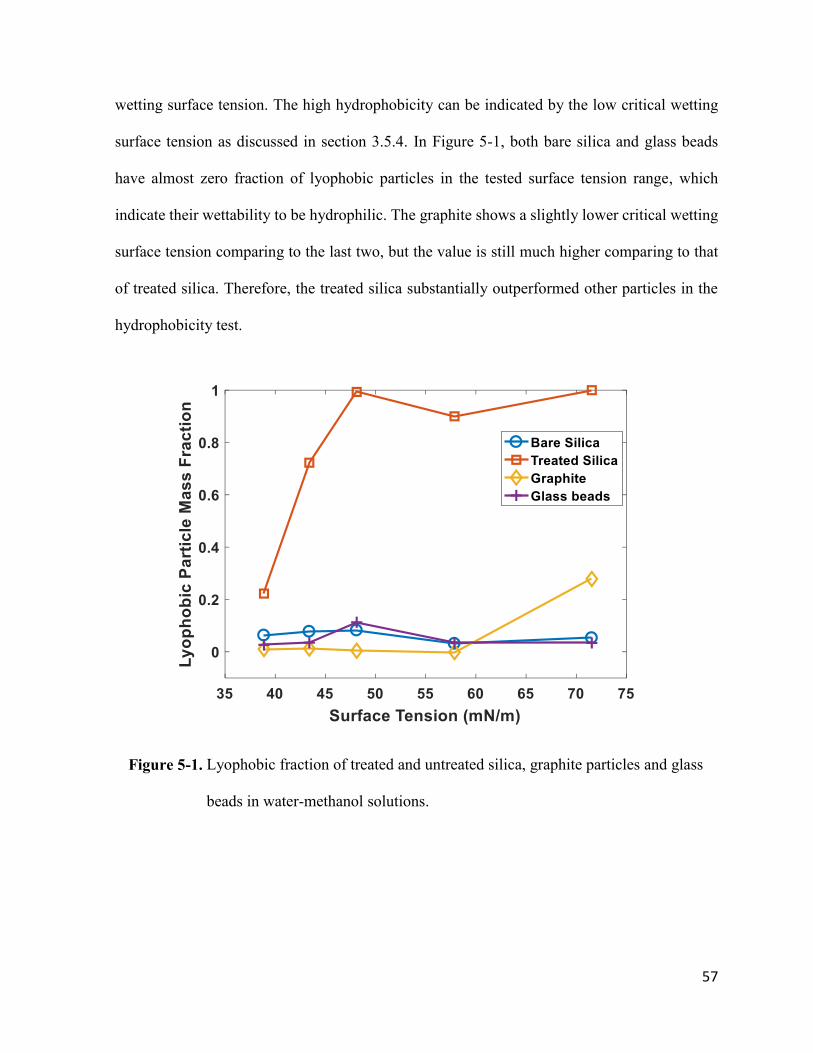
57
wetting surface tension. The high hydrophobicity can be indicated by the low critical wetting
surface tension as discussed in section 3.5.4. In Figure 5-1, both bare silica and glass beads
have almost zero fraction of lyophobic particles in the tested surface tension range, which
indicate their wettability to be hydrophilic. The graphite shows a slightly lower critical wetting
surface tension comparing to the last two, but the value is still much higher comparing to that
of treated silica. Therefore, the treated silica substantially outperformed other particles in the
hydrophobicity test.
Figure 5-1. Lyophobic fraction of treated and untreated silica, graphite particles and glass
beads in water-methanol solutions.
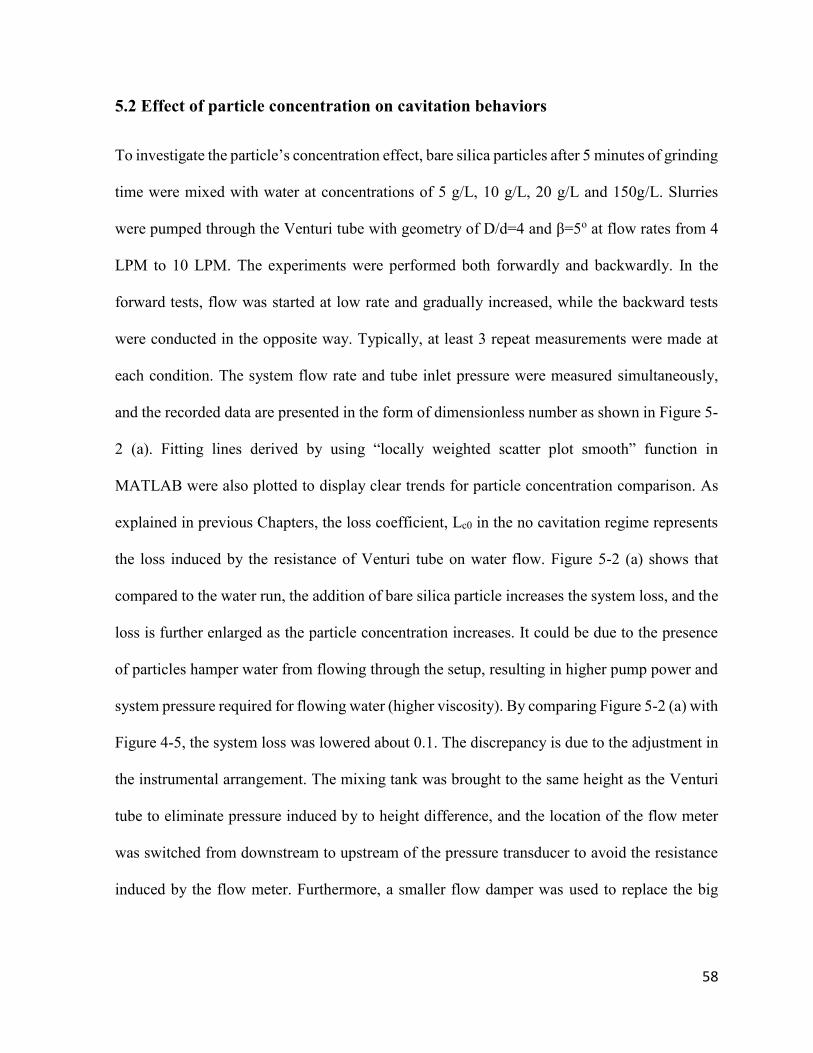
58
5.2 Effect of particle concentration on cavitation behaviors
To investigate the particle’s concentration effect, bare silica particles after 5 minutes of grinding
time were mixed with water at concentrations of 5 g/L, 10 g/L, 20 g/L and 150g/L. Slurries
were pumped through the Venturi tube with geometry of D/d=4 and β=5o at flow rates from 4
LPM to 10 LPM. The experiments were performed both forwardly and backwardly. In the
forward tests, flow was started at low rate and gradually increased, while the backward tests
were conducted in the opposite way. Typically, at least 3 repeat measurements were made at
each condition. The system flow rate and tube inlet pressure were measured simultaneously,
and the recorded data are presented in the form of dimensionless number as shown in Figure 5-
2 (a). Fitting lines derived by using “locally weighted scatter plot smooth” function in
MATLAB were also plotted to display clear trends for particle concentration comparison. As
explained in previous Chapters, the loss coefficient, Lc0 in the no cavitation regime represents
the loss induced by the resistance of Venturi tube on water flow. Figure 5-2 (a) shows that
compared to the water run, the addition of bare silica particle increases the system loss, and the
loss is further enlarged as the particle concentration increases. It could be due to the presence
of particles hamper water from flowing through the setup, resulting in higher pump power and
system pressure required for flowing water (higher viscosity). By comparing Figure 5-2 (a) with
Figure 4-5, the system loss was lowered about 0.1. The discrepancy is due to the adjustment in
the instrumental arrangement. The mixing tank was brought to the same height as the Venturi
tube to eliminate pressure induced by to height difference, and the location of the flow meter
was switched from downstream to upstream of the pressure transducer to avoid the resistance
induced by the flow meter. Furthermore, a smaller flow damper was used to replace the big
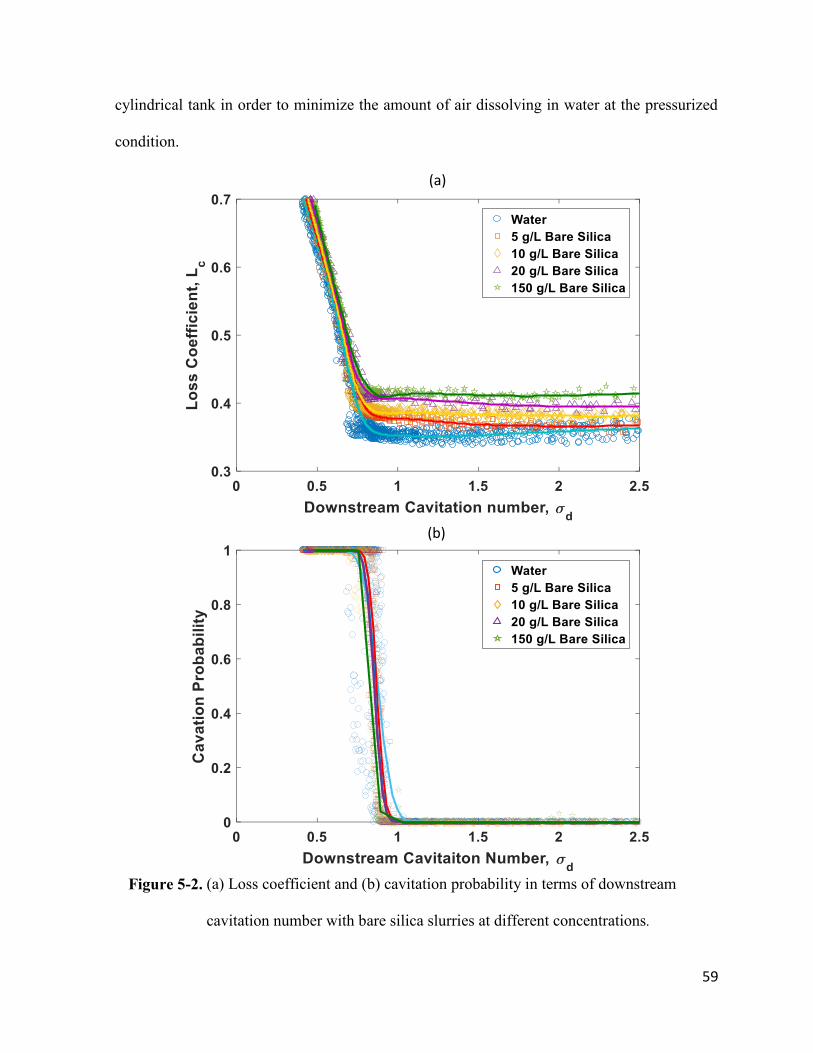
59
cylindrical tank in order to minimize the amount of air dissolving in water at the pressurized
condition.
Figure 5-2. (a) Loss coefficient and (b) cavitation probability in terms of downstream
cavitation number with bare silica slurries at different concentrations.
(a)
(b)
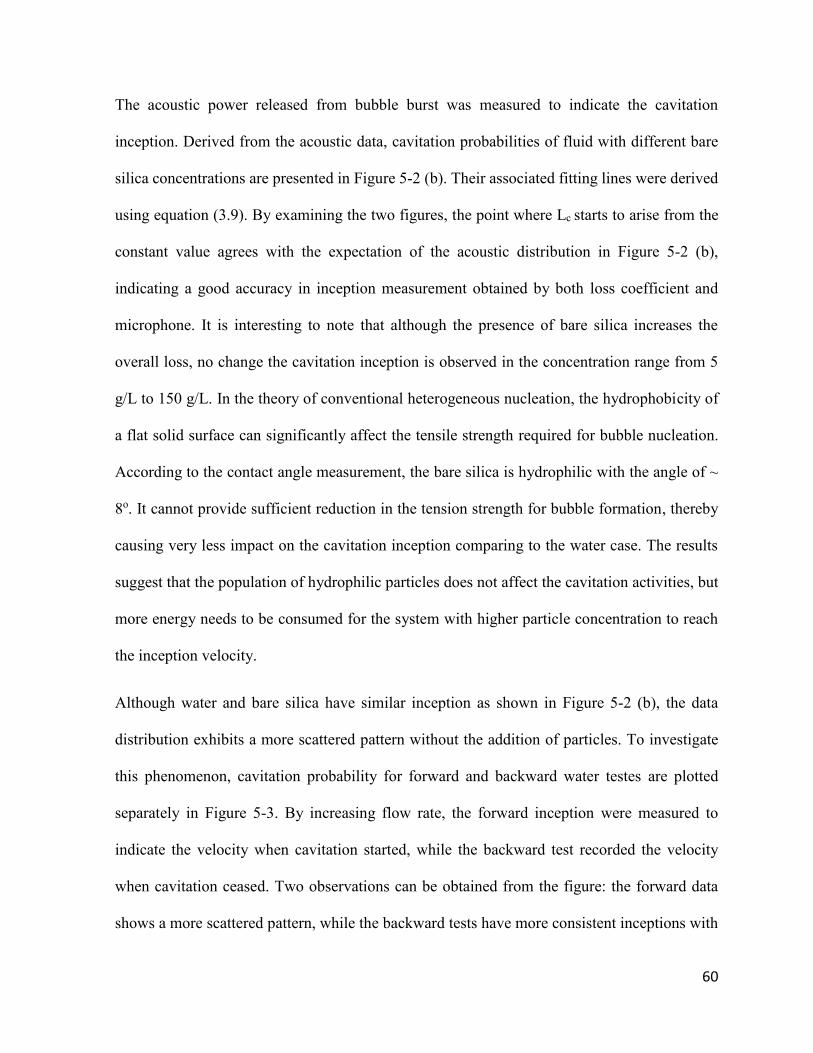
60
The acoustic power released from bubble burst was measured to indicate the cavitation
inception. Derived from the acoustic data, cavitation probabilities of fluid with different bare
silica concentrations are presented in Figure 5-2 (b). Their associated fitting lines were derived
using equation (3.9). By examining the two figures, the point where Lc starts to arise from the
constant value agrees with the expectation of the acoustic distribution in Figure 5-2 (b),
indicating a good accuracy in inception measurement obtained by both loss coefficient and
microphone. It is interesting to note that although the presence of bare silica increases the
overall loss, no change the cavitation inception is observed in the concentration range from 5
g/L to 150 g/L. In the theory of conventional heterogeneous nucleation, the hydrophobicity of
a flat solid surface can significantly affect the tensile strength required for bubble nucleation.
According to the contact angle measurement, the bare silica is hydrophilic with the angle of ~
8o. It cannot provide sufficient reduction in the tension strength for bubble formation, thereby
causing very less impact on the cavitation inception comparing to the water case. The results
suggest that the population of hydrophilic particles does not affect the cavitation activities, but
more energy needs to be consumed for the system with higher particle concentration to reach
the inception velocity.
Although water and bare silica have similar inception as shown in Figure 5-2 (b), the data
distribution exhibits a more scattered pattern without the addition of particles. To investigate
this phenomenon, cavitation probability for forward and backward water testes are plotted
separately in Figure 5-3. By increasing flow rate, the forward inception were measured to
indicate the velocity when cavitation started, while the backward test recorded the velocity
when cavitation ceased. Two observations can be obtained from the figure: the forward data
shows a more scattered pattern, while the backward tests have more consistent inceptions with
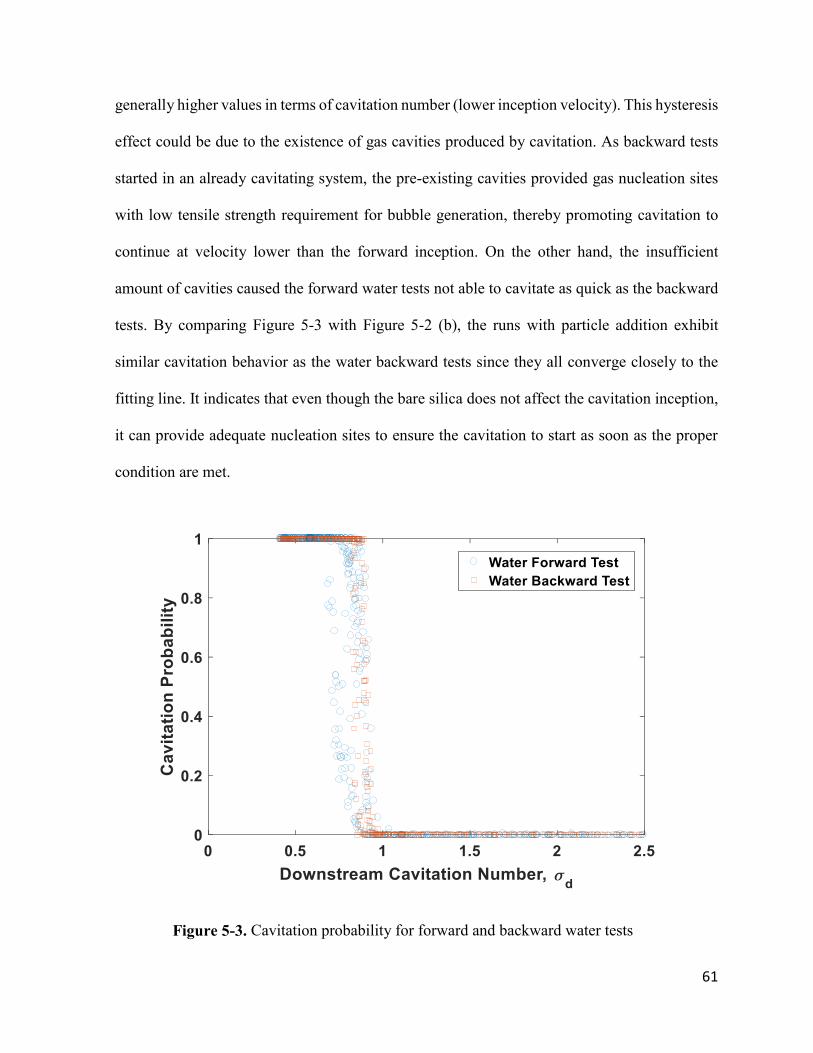
61
generally higher values in terms of cavitation number (lower inception velocity). This hysteresis
effect could be due to the existence of gas cavities produced by cavitation. As backward tests
started in an already cavitating system, the pre-existing cavities provided gas nucleation sites
with low tensile strength requirement for bubble generation, thereby promoting cavitation to
continue at velocity lower than the forward inception. On the other hand, the insufficient
amount of cavities caused the forward water tests not able to cavitate as quick as the backward
tests. By comparing Figure 5-3 with Figure 5-2 (b), the runs with particle addition exhibit
similar cavitation behavior as the water backward tests since they all converge closely to the
fitting line. It indicates that even though the bare silica does not affect the cavitation inception,
it can provide adequate nucleation sites to ensure the cavitation to start as soon as the proper
condition are met.
Figure 5-3. Cavitation probability for forward and backward water tests
62
5.3 Effect of particle wettability on cavitation behaviors
In the study of particle’s wettability effect on cavitation behaviors, treated silica with contact
angle ~65o were mixed to the cavitating flow at the concentration of 5 g/L, 10 g/L, and 20 g/L.
The hydrophobic-treated particles were prepared by immersing bare silica in the hydrophobic
bath for 10 s.
The loss coefficient against cavitation number curves and the associated fitting lines are plotted
in Figure 5-4 (a). As discussed in the last section, it is not surprising to observe the increase in
the system loss as the particle concentration increases. By examining the cavitation probability
curves plotted in Figure 5-4 (b), the presence of treated silica shows an earlier inception as
compared to the water case. Having the treated silica particles provided solid surfaces with a
higher hydrophobicity, the tensile strength required for bubble generation is lowered, and
cavitation inception becomes easier. Moreover, the hydrophobic surface property enhanced the
cavities immersing from the crevices, which would further promote nucleation when little
tensile strength is applied. As the particle concentration increases from 5 g/L to 20 g/L, no
noticeable change in the cavitation behavior is observed.
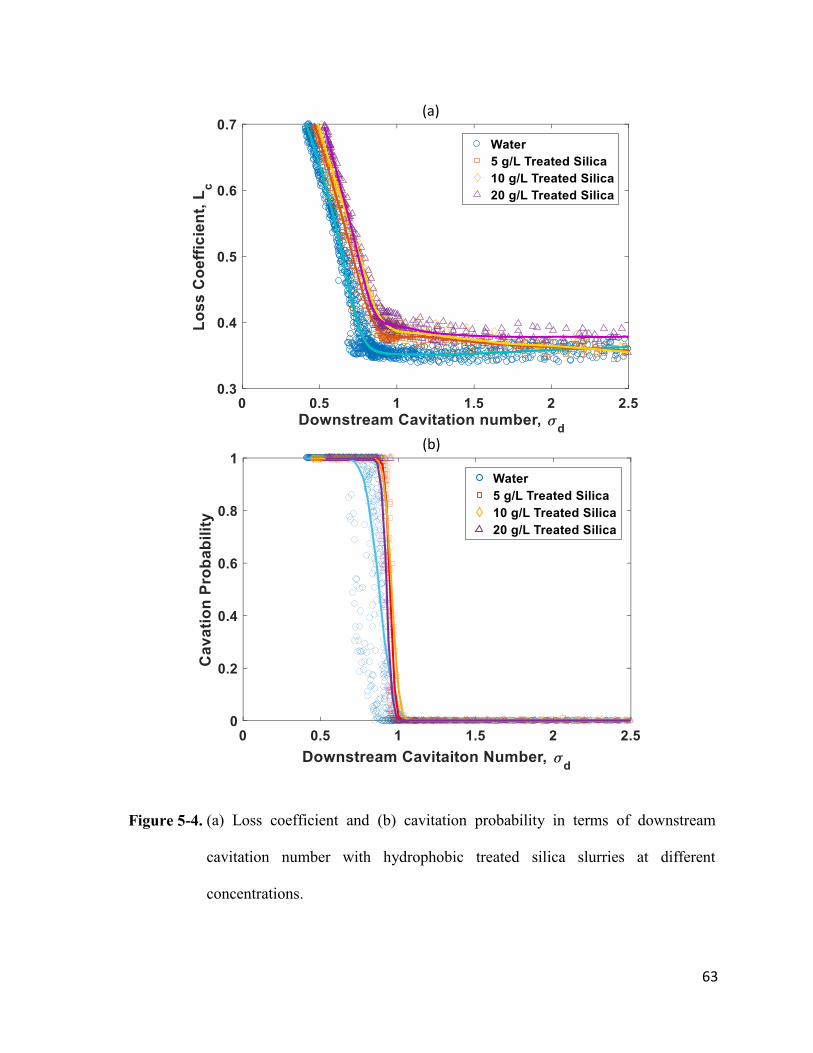
63
Figure 5-4. (a) Loss coefficient and (b) cavitation probability in terms of downstream
cavitation number with hydrophobic treated silica slurries at different
concentrations.
(b)
(a)
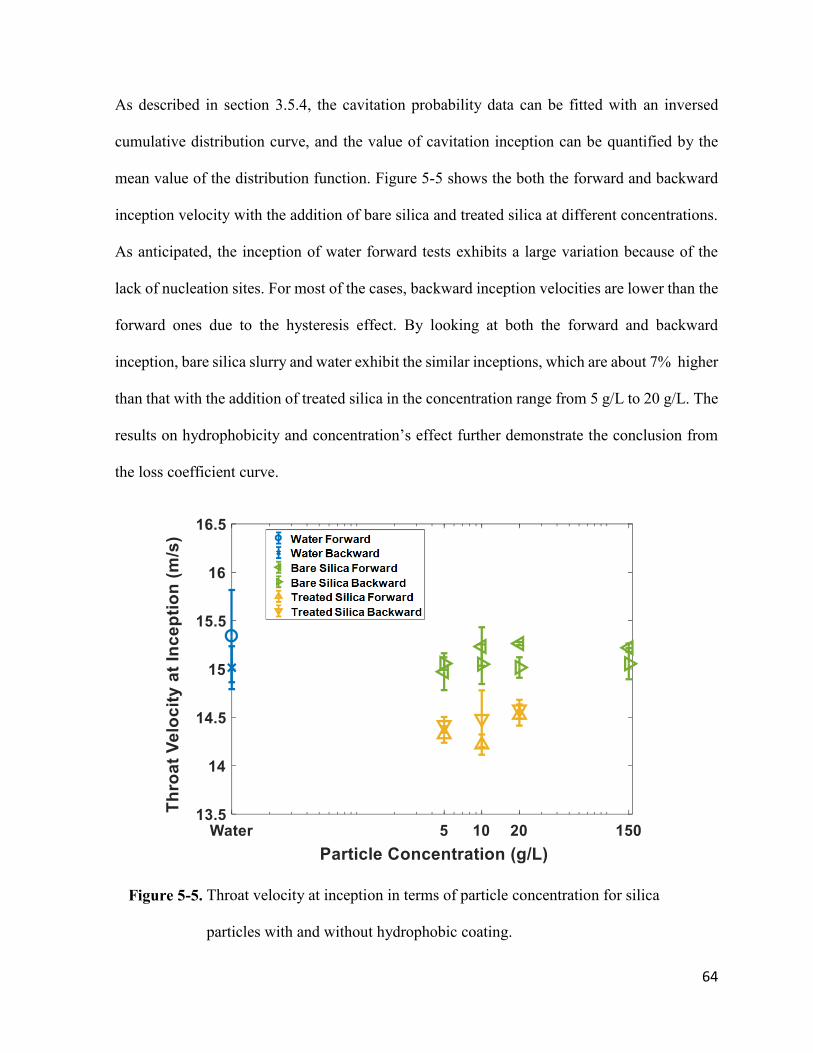
64
As described in section 3.5.4, the cavitation probability data can be fitted with an inversed
cumulative distribution curve, and the value of cavitation inception can be quantified by the
mean value of the distribution function. Figure 5-5 shows the both the forward and backward
inception velocity with the addition of bare silica and treated silica at different concentrations.
As anticipated, the inception of water forward tests exhibits a large variation because of the
lack of nucleation sites. For most of the cases, backward inception velocities are lower than the
forward ones due to the hysteresis effect. By looking at both the forward and backward
inception, bare silica slurry and water exhibit the similar inceptions, which are about 7% higher
than that with the addition of treated silica in the concentration range from 5 g/L to 20 g/L. The
results on hydrophobicity and concentration’s effect further demonstrate the conclusion from
the loss coefficient curve.
Figure 5-5. Throat velocity at inception in terms of particle concentration for silica
particles with and without hydrophobic coating.
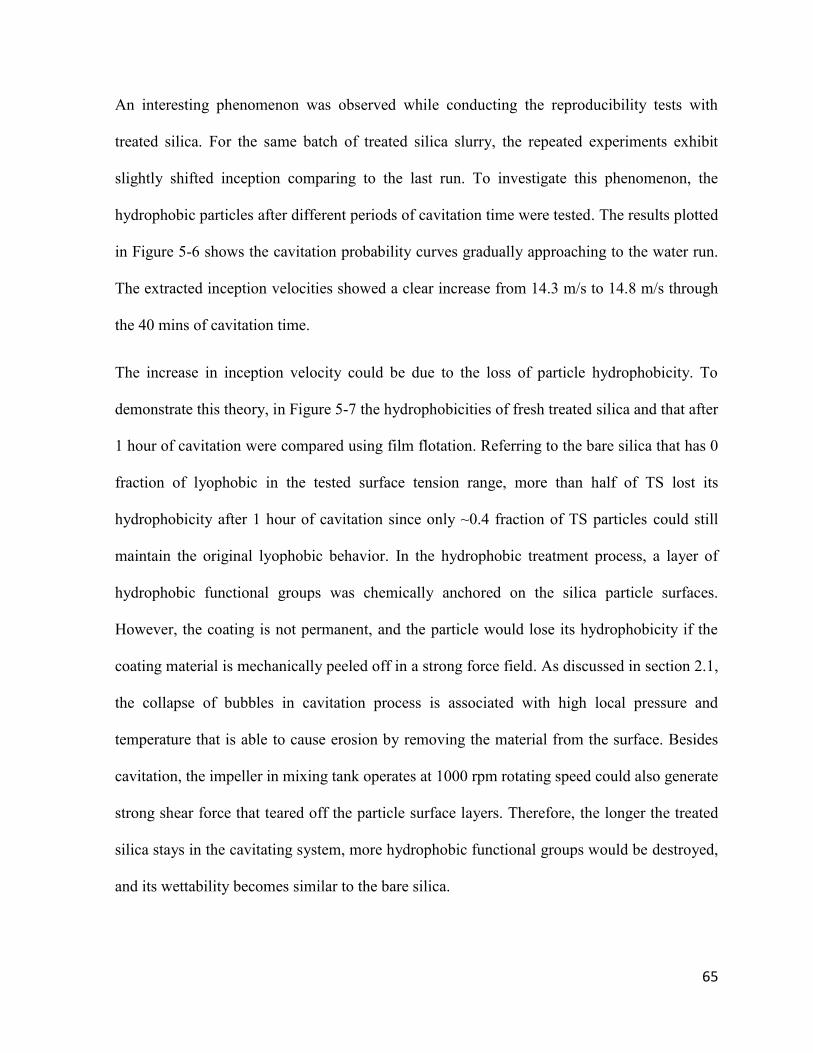
65
An interesting phenomenon was observed while conducting the reproducibility tests with
treated silica. For the same batch of treated silica slurry, the repeated experiments exhibit
slightly shifted inception comparing to the last run. To investigate this phenomenon, the
hydrophobic particles after different periods of cavitation time were tested. The results plotted
in Figure 5-6 shows the cavitation probability curves gradually approaching to the water run.
The extracted inception velocities showed a clear increase from 14.3 m/s to 14.8 m/s through
the 40 mins of cavitation time.
The increase in inception velocity could be due to the loss of particle hydrophobicity. To
demonstrate this theory, in Figure 5-7 the hydrophobicities of fresh treated silica and that after
1 hour of cavitation were compared using film flotation. Referring to the bare silica that has 0
fraction of lyophobic in the tested surface tension range, more than half of TS lost its
hydrophobicity after 1 hour of cavitation since only ~0.4 fraction of TS particles could still
maintain the original lyophobic behavior. In the hydrophobic treatment process, a layer of
hydrophobic functional groups was chemically anchored on the silica particle surfaces.
However, the coating is not permanent, and the particle would lose its hydrophobicity if the
coating material is mechanically peeled off in a strong force field. As discussed in section 2.1,
the collapse of bubbles in cavitation process is associated with high local pressure and
temperature that is able to cause erosion by removing the material from the surface. Besides
cavitation, the impeller in mixing tank operates at 1000 rpm rotating speed could also generate
strong shear force that teared off the particle surface layers. Therefore, the longer the treated
silica stays in the cavitating system, more hydrophobic functional groups would be destroyed,
and its wettability becomes similar to the bare silica.
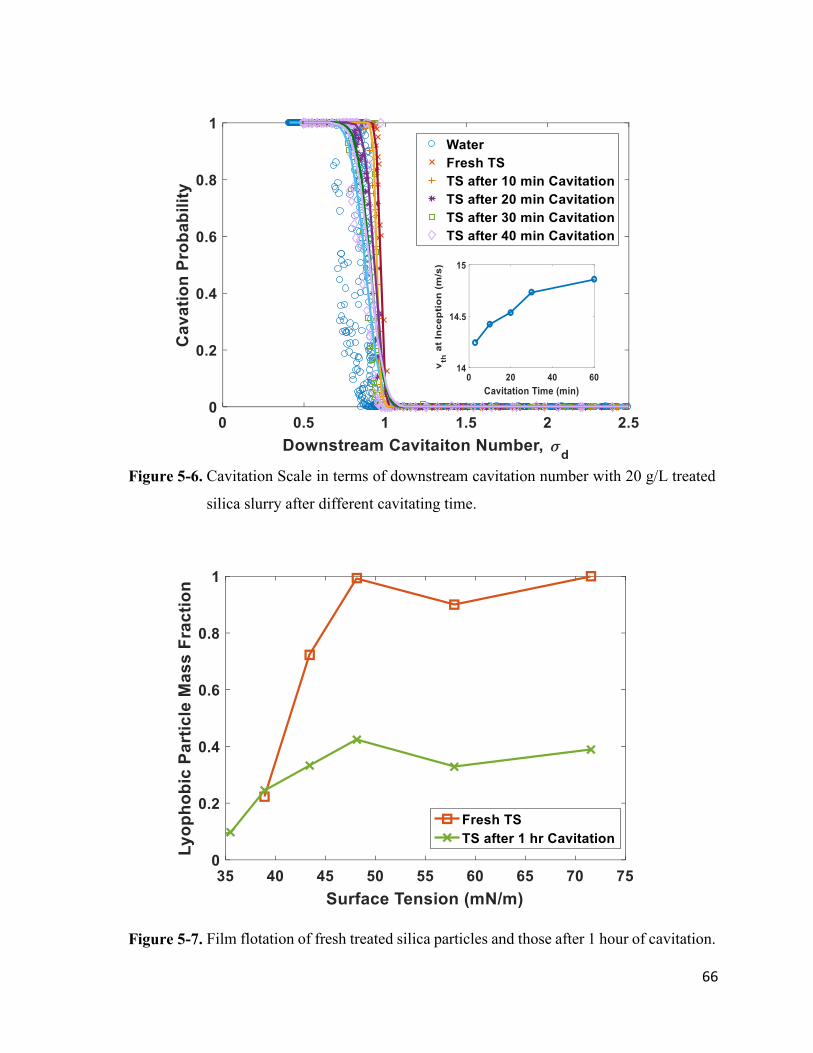
66
Figure 5-6. Cavitation Scale in terms of downstream cavitation number with 20 g/L treated
silica slurry after different cavitating time.
Figure 5-7. Film flotation of fresh treated silica particles and those after 1 hour of cavitation.
67
5.4. Effect of other particle addition on cavitation behavior
Glass beads and graphite particles were tested in the cavitation setup to acquire a general idea
of other particles’ effect on hydrodynamic cavitation. The loss coefficient in terms of
downstream cavitation number for different particles and their associated inception velocity are
shown in Figure 5-8. The particle comparisons were performed at the low concentration of 5
g/L because the infrared light emitted from flow meter could not penetrate through higher
concentration of dark materials. Based on the thin film flotation test, glass beads are hydrophilic
with similar wetting surface tension as the bare silica particles. In addition, their smooth
spherical structural does not have crevices to facilitate cavities, thus the effect of glass beads
on hydrodynamic cavitation is very limited. Although the graphite particles have slightly higher
contact angle than bare silica and glass beads, they did not show any promotion on the cavitation
inception neither. The acoustic measurement delivers similar results as the loss coefficient that
the addition of graphite and glass beads does not have a noticeable on the cavitation behaviors.
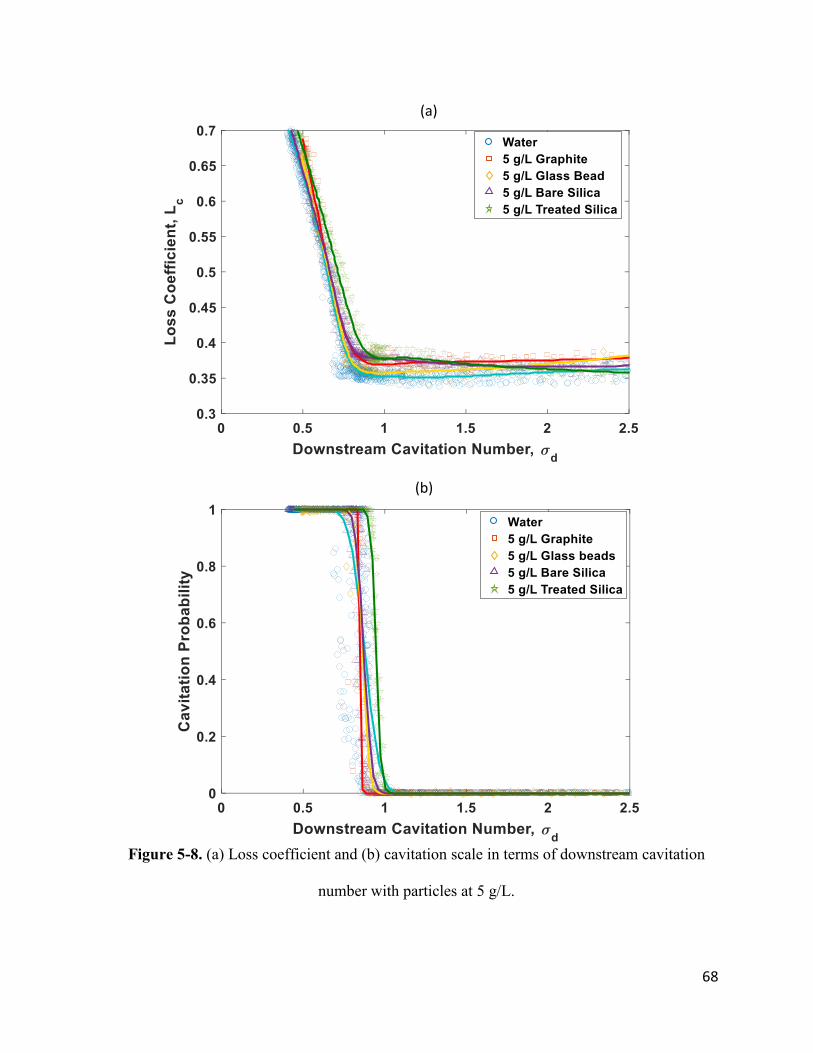
68
Figure 5-8. (a) Loss coefficient and (b) cavitation scale in terms of downstream cavitation
number with particles at 5 g/L.
(b)
(a)
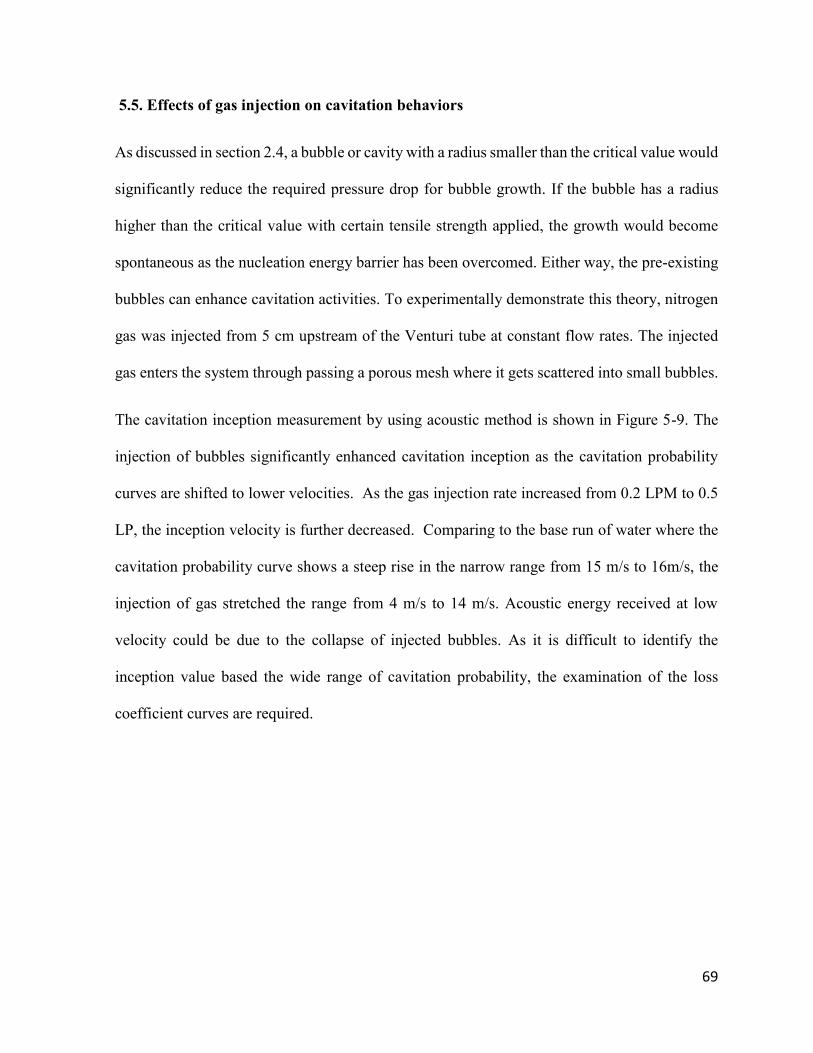
69
5.5. Effects of gas injection on cavitation behaviors
As discussed in section 2.4, a bubble or cavity with a radius smaller than the critical value would
significantly reduce the required pressure drop for bubble growth. If the bubble has a radius
higher than the critical value with certain tensile strength applied, the growth would become
spontaneous as the nucleation energy barrier has been overcomed. Either way, the pre-existing
bubbles can enhance cavitation activities. To experimentally demonstrate this theory, nitrogen
gas was injected from 5 cm upstream of the Venturi tube at constant flow rates. The injected
gas enters the system through passing a porous mesh where it gets scattered into small bubbles.
The cavitation inception measurement by using acoustic method is shown in Figure 5-9. The
injection of bubbles significantly enhanced cavitation inception as the cavitation probability
curves are shifted to lower velocities. As the gas injection rate increased from 0.2 LPM to 0.5
LP, the inception velocity is further decreased. Comparing to the base run of water where the
cavitation probability curve shows a steep rise in the narrow range from 15 m/s to 16m/s, the
injection of gas stretched the range from 4 m/s to 14 m/s. Acoustic energy received at low
velocity could be due to the collapse of injected bubbles. As it is difficult to identify the
inception value based the wide range of cavitation probability, the examination of the loss
coefficient curves are required.
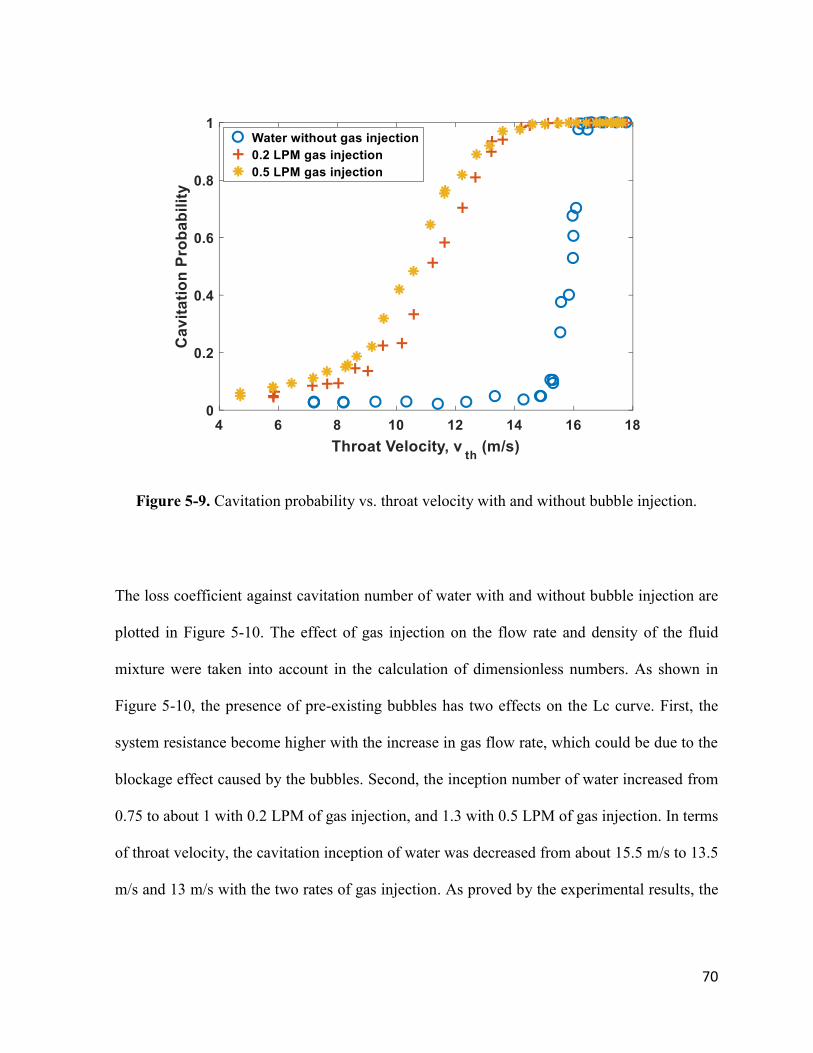
70
Figure 5-9. Cavitation probability vs. throat velocity with and without bubble injection.
The loss coefficient against cavitation number of water with and without bubble injection are
plotted in Figure 5-10. The effect of gas injection on the flow rate and density of the fluid
mixture were taken into account in the calculation of dimensionless numbers. As shown in
Figure 5-10, the presence of pre-existing bubbles has two effects on the Lc curve. First, the
system resistance become higher with the increase in gas flow rate, which could be due to the
blockage effect caused by the bubbles. Second, the inception number of water increased from
0.75 to about 1 with 0.2 LPM of gas injection, and 1.3 with 0.5 LPM of gas injection. In terms
of throat velocity, the cavitation inception of water was decreased from about 15.5 m/s to 13.5
m/s and 13 m/s with the two rates of gas injection. As proved by the experimental results, the
71
presence of bubbles can significantly reduce the tensile strength required to overcome the
energy barrier, thereby promoting cavitation at relatively high pressure and low throat velocity.
Figure 5-10. Loss coefficient in terms of downstream cavitation number with gas injection at
different rates
72
Chapter 6 Conclusion and Contribution to Original Knowledge
6.1 Conclusion
A geometric optimization of Venturi tubes regarding hydrodynamic cavitation was performed
using both simulations and experiments. The divergent angle and the diameter ratio were found
to be the two key parameters to decrease the throat pressure and the power consumption. Using
dimensionless numbers, two hydrodynamic regimes were identified in experiments: a single-
phase geometry-dependent regime at low throat velocity and a cavitating flow at high throat
velocity independent of the geometry. In the first regime, the flow resistance (dimensionless
pressure difference) is constant and increases with the divergent angle while in the cavitating
regime all loss coefficients increase and collapse into a single curve. The cavitation inception
corresponds to the intersection between these two regimes and is set by the loss coefficient
before cavitation. Higher flow resistance results in higher inception velocity.
Under cavitating flow, the bubble generation scales linearly with the extra loss induced by
cavitation (difference between the loss coefficient in the cavitating regime and the single-phase
flow) and with the dissolved gas concentration. This confirms the universal behavior under
cavitation for all the tested geometries. The efficiency of a Venturi tube to transfer the flow
energy to the cavitation is characterized by the cavitation loss and depends on the single-phase
flow resistance. Thus, the cavitation inception and activity (bubble generation and collapse) are
governed by the Venturi tube geometry through the loss coefficient before cavitation.
Consequently, a powerful way to design efficient cavitation Venturi tubes is to decrease the
single-phase flow resistance by lowering the divergent angle.
73
The particles’ effect on hydrodynamic cavitation behavior was reflected by the change in loss
coefficient and cavitation probability. By adding particles into cavitation system, the scattered
inception values become consistent due to the increase in nucleation sites. The change in
particle concentration did not show any obvious impact on the hydrodynamic behaviors except
for the flow resistance. The hydrophobic treatment of particle, on the other hand, lowered the
cavitation inception. Different types of particles were also tested under cavitation and
confirmed the wettability to be the most significant particle property in affecting cavitation
behavior. The pre-existing bubble’s effect on cavitation behavior was demonstrated in the
bubble injection experiment and earlier inceptions were observed with the increase in injection
rate.
74
6.2 Contribution to original knowledge
In the previous Venturi tube geometry study, most investigations were performed by using CFD
simulation. In this study, 3D printing technology allows us to fabricate tubes quickly with
different geometries, so the Venturi tube geometry’s effect on hydrodynamic cavitation could
be experimentally tested. The innovative methods of acoustic detection and high-speed
photography were used to measure the cavitation inception and bubble generation rate
respectively. The experimental results confirmed the trend described in simulation study, and
the dimensionless numbers such as loss coefficient and cavitation number were used so that the
behavior of hydrodynamic cavitation with different tube geometries could be globally described.
For the study of particle-cavitation interaction, most of the previous researches were conducted
by applying acoustic cavitation on substances in a static liquid condition. In this study, particles
with different properties were added to the flow under hydrodynamic cavitation. The change in
cavitation behaviors was described by using the dimensionless numbers and cavitation
probability. The results in this study provided better understanding of the synergy between
particle properties and hydrodynamic cavitation behaviors.
75
Chapter 7 Future Work
1) In the geometry study, lowering the Venturi tube outlet angle can reduce flow turbulence
at the throat outlet, thereby enhancing cavitation through decreasing the inception and
increasing the bubble generation rate. In the flotation industry, bubbles are generated
for collecting particles, and turbulence at the tube outlet might provide strong force field
to help bubble/particle attachment. Therefore, it would be an interesting topic to find
the optimization of outlet angle so that it is as low as possible to enhance bubble
generation, meanwhile large enough to provide turbulence for bubble/particle
interaction.
2) In the preliminary single-phase simulation study, Venturi tube inlet angle and throat
length have a negligible impact on pressure change inside the tube. However, turbulence
inside the throat might be induced if the inlet angle is large enough. Also, by increasing
the throat length, the fluid would spend longer period under low-pressure condition,
which is beneficial for bubble growth. Therefore, it is also necessary to experimentally
test the effects of tube inlet angle and throat length on cavitation behavior and size of
generated bubbles.
3) Besides of the Venturi tube geometry, the roughness of the inner tube wall would also
be an interesting parameter to look at. Since the rough surface would increase the tube
resistance, at the same time provides crevices to enhance bubble generation, it affects
cavitation from both positive and negative sides. Tests would be required to investigate
which effect would be more dominant.
76
4) The Venturi tube geometry study was performed with lab-scale tubes. To apply the
results in industry-scale applications, a scale-up test must be done to ensure the
consistency of cavitation behaviors with difference sizes of tubes.
5) In the particle addition study, due to the limitation of flow meter, cavitation tests were
performed with particles at relatively low concentration compared to the mineral
processing industry. The change in fluid density and viscosity would become influential
to hydrodynamic cavitation behaviors with further increase in the particle concentration.
To have a better understanding of this effect, particles with higher concentration need
to be tested in the future search.
6) The particle addition effect on hydrodynamic cavitation was monitored through the
change in inception and dimensionless numbers. However, the fundamental study of
bubble/particle interaction behaviors was not performed. If applicable, real-time
dynamics of bubble formation needs to be monitored by using a high-speed camera
shooting through a transparent Venturi tube. This study would give us better
understanding of bubble/particle interaction and location of bubble formation.
7) The implementation of hydrodynamic cavitation in fine particle flotation was proved
beneficial in previous researches. However, the fundamental cause for the recovery
increase still has not been clearly indicated. In cavitation process, the micron bubbles
improve bubble/particle attachment through two theoretical processes: forming
agglomerations of fine particles to increase the collision probability, or bridging the fine
particle and flotation bubbles to increase the attachment probability. To demonstrate
these causes, experiments need to be designed and tested in the future.
77
References
S. Arrojo and Y. Benito, “A theoretical study of hydrodynamic cavitation,” Ultrason.
Sonochem., vol. 15, no. 3, pp. 203–211, 2008.
A. P. A Mahulkar, “Analysis of hydrodynamic and acoustic cavitation reactors.” Germany:
VDM publishing, 2010.
A. Agarwal, W. J. Ng, and Y. Liu, “Principle and applications of microbubble and nanobubble
technology for water treatment,” Chemosphere, vol. 84, no. 9, pp. 1175–1180, 2011.
R. Ahmadi, D. A. Khodadadi, M. Abdollahy, and M. Fan, “Nano-microbubble flotation of fine
and ultrafine chalcopyrite particles,” Int. J. Min. Sci. Technol., vol. 24, no. 4, pp. 559–
566, 2014.
G. V. Ambulgekar, S. D. Samant, and A. B. Pandit, “Oxidation of alkylarenes using aqueous
potassium permanganate under cavitation: Comparison of acoustic and hydrodynamic
techniques,” Ultrason. Sonochem., vol. 12, no. 1–2 SPEC. ISS., pp. 85–90, 2005.
A. Andersen and K. A. Mørch, “Cavitation nuclei in water exposed to transient pressures,” J.
Fluid Mech., vol. 771, pp. 424–448, 2015.
A. Andersen et al., “Role of hydrodynamic cavitation in fine particle flotation,” Int. J. Miner.
Process., vol. 22, no. 4, pp. 139–149, 2015.
C. Anh Ho and M. Sommerfeld, “Modelling of micro-particle agglomeration in turbulent
flows,” Chem. Eng. Sci., vol. 57, no. 15, pp. 3073–3084, 2002.
K. B. Ansari et al., “Process Intensification of Upgradation of Crude Oil and Vacuum Residue
78
by Hydrodynamic Cavitation and Microwave Irradiation,” Indian Chem. Eng., vol. 57,
no. 3–4, pp. 256–281, 2015.
R. E. Apfel, “The Role of Impurities in Cavitation-Threshold Determination,” J. Acoust. Soc.
Am., vol. 48, no. 5B, p. 1179, 1970.
S. Arrojo, Y. Benito, and A. Martínez Tarifa, “A parametrical study of disinfection with
hydrodynamic cavitation,” Ultrason. Sonochem., vol. 15, no. 5, pp. 903–908, 2008.
M. Ashokkumar, R. Rink, and S. Shestakov, “Hydrodynamic cavitation – an alternative to
ultrasonic food processing,” 2011.
S. M. Ashrafizadeh and H. Ghassemi, “Experimental and numerical investigation on the
performance of small-sized cavitating Venturis,” Flow Meas. Instrum., vol. 42, pp. 6–
15, 2015.
A. a. Atchley and A. Prosperetti, “The crevice model of bubble nucleation,” J. Acoust. Soc.
Am., vol. 86, no. 3, p. 1065, 1989.
T. A. Bashir, A. G. Soni, A. V. Mahulkar, and A. B. Pandit, “The CFD driven optimisation of a
modified Venturi for cavitational activity,” Can. J. Chem. Eng., vol. 89, no. 6, pp. 1366–
1375, 2011.
D. Bhaga and M. E. Weber, “Bubbles in viscous liquids: shapes, wakes and velocities,” J. Fluid
Mech., vol. 105, pp. 61–85, 1981.
R. K. Bhaskaracharya, S. Kentish, and M. Ashokkumar, “Selected applications of ultrasonics in
food processing,” Food Eng. Rev., vol. 1, no. 1, pp. 31–49, 2009.
79
Biolin Scientific, “Static and dynamic contact angles and their measurement techniques,” pp.
1–3.
E. Bormashenko, R. Pogreb, G. Whyman, Y. Bormashenko, and M. Erlich, “Vibration-induced
Cassie-Wenzel wetting transition on rough surfaces,” Appl. Phys. Lett., vol. 90, no. 20,
pp. 1–3, 2007.
S. Bose, S. Vahabzadeh, and A. Bandyopadhyay, “Bone tissue engineering using 3D printing,”
Mater. Today, vol. 16, no. 12, pp. 496–504, 2013.
N. Bremond, M. Arora, S. M. Dammer, and D. Lohse, “Interaction of cavitation bubbles on a
wall,” Phys. Fluids, vol. 18, no. 12, 2006.
N. Bremond, M. Arora, C. D. Ohl, and D. Lohse, “Controlled multibubble surface cavitation,”
Phys. Rev. Lett., vol. 96, no. 22, pp. 1–4, 2006.
S. Brinkhorst, E. von Levante, and G. Wendt, “Numerical Investigation of Effects of Geometry
on Cavitation in Herschel Venturi-Tubes applied to Liquid Flow Metering,” no. April
2015, 2016.
S. Calgaroto, A. Azevedo, and J. Rubio, “Flotation of quartz particles assisted by
nanobubbles,” Int. J. Miner. Process., vol. 137, pp. 64–70, 2015.
J. Carpenter, M. Badve, S. Rajoriya, S. George, V. K. Saharan, and A. B. Pandit,
“Hydrodynamic cavitation: an emerging technology for the intensification of various
chemical and physical processes in a chemical process industry,” Rev. Chem. Eng., vol.
0, no. 0, 2016.
80
F. Caupin and E. Herbert, “Cavitation in water: a review,” Comptes Rendus Phys., vol. 7, no.
9–10, pp. 1000–1017, 2006.
E. Brennen, Cavitation and bubble dynamics. 2013.
E. Brennen, Cavitation and bubble dynamics, vol. 9, no. 1. 1995.
C. Crake et al., “Enhancement and Passive Acoustic Mapping of Cavitation from
Fluorescently Tagged Magnetic Resonance-Visible Magnetic Microbubbles In??Vivo,”
Ultrasound Med. Biol., vol. 42, no. 12, pp. 3022–3036, 2016.
J. J. Da Rosa and J. Rubio, “The FF (flocculation-flotation) process,” Miner. Eng., vol. 18, no. 7,
pp. 701–707, 2005.
I. Demers, “Enhancing Fine Particle Recovery in Flotation,” p. 51, 2005.
J. Diao and D. W. Fuerstenau, “Characterization of the wettability of solid particles by film
flotation 2. Theoretical analysis,” Colloids and Surfaces, vol. 60, no. C, pp. 145–160,
1991.
S. Eiamsa-ard, K. Wongcharee, and S. Sripattanapipat, “3-D Numerical simulation of swirling
flow and convective heat transfer in a circular tube induced by means of loose-fit
twisted tapes,” Int. Commun. Heat Mass Transf., vol. 36, no. 9, pp. 947–955, 2009.
D. Feng and C. Aldrich, “Effect of particle size on flotation performance of complex sulphide
ores,” Miner. Eng., vol. 12, no. 7, pp. 721–731, 1999.
E. Forbes, “Shear, selective and temperature responsive flocculation: A comparison of fine
particle flotation techniques,” Int. J. Miner. Process., vol. 99, no. 1–4, pp. 1–10, 2011.
81
E. Forbes, D. J. Bradshaw, and G. V. Franks, “Temperature sensitive polymers as efficient and
selective flotation collectors,” Miner. Eng., vol. 24, no. 8, pp. 772–777, 2011.
D. W. Fuerstenau and M. C. Williams, “Characterization of the lyophobicity of particles by
film flotation,” Colloids and Surfaces, vol. 22, no. 1, pp. 87–91, 1987.
D. Fuerstenau, “Characte , rization of the wettability film flotation 1 . Experimental
investigation,” vol. 60, pp. 127–144, 1991.
M. Goel, H. Hongqiang, A. S. Mujumdar, and M. B. Ray, “Sonochemical decomposition of
volatile and non-volatile organic compounds - A comparative study,” Water Res., vol.
38, no. 19, pp. 4247–4261, 2004.
P. R. Gogate, “Hydrodynamic Cavitation for Food and Water Processing,” Food Bioprocess
Technol., vol. 4, no. 6, pp. 996–1011, 2011.
P. R. Gogate and A. M. Kabadi, “A review of applications of cavitation in biochemical
engineering/biotechnology,” Biochem. Eng. J., vol. 44, no. 1, pp. 60–72, 2009.
P. R. Gogate and A. B. Pandit, “Engineering design methods for cavitation reactors II:
Hydrodynamic cavitation,” AIChE J., vol. 46, no. 8, pp. 1641–1649, 2000.
P. R. Gogate and A. B. Pandit, “A review and assessment of hydrodynamic cavitation as a
technology for the future,” Ultrason. Sonochem., vol. 12, no. 1–2, pp. 21–27, 2005.
J. Gregory and S. Barany, “Adsorption and flocculation by polymers and polymer mixtures,”
Adv. Colloid Interface Sci., vol. 169, no. 1, pp. 1–12, 2011.
D. Hart and D. Whale, “A review of cavitation-erosion resistant weld surfacing alloys for
82
hydroturbines,” Eutectic Aust. Pty. Ltd., Sydney, p. 15, 2007.
E. Herbert, S. Balibar, and F. Caupin, “Cavitation pressure in water,” Phys. Rev. E - Stat.
Nonlinear, Soft Matter Phys., vol. 74, no. 4, pp. 1–22, 2006.
S. Jones, “Bubble nucleation from gas cavities — a review,” Adv. Colloid Interface Sci., vol.
80, no. 1, pp. 27–50, 1999.
E. Joyce, S. S. Phull, J. P. Lorimer, and T. J. Mason, “The development and evaluation of
ultrasound for the treatment of bacterial suspensions. A study of frequency, power
and sonication time on cultured Bacillus species,” Ultrason. Sonochem., vol. 10, no. 6,
pp. 315–318, 2003.
K. K. Jyoti and A. B. Pandit, “Water disinfection by acoustic and hydrodynamic cavitation,”
Biochem. Eng. J., vol. 7, no. 3, pp. 201–212, 2001.
A. Karimi and F. Avellan, “Comparison of erosion mechanisms in different types of
cavitation,” Wear, vol. 113, no. 3, pp. 305–322, 1986.
M. A. Kelkar, P. R. Gogate, and A. B. Pandit, “Intensification of esterification of acids for
synthesis of biodiesel using acoustic and hydrodynamic cavitation,” Ultrason.
R. T. Knapp, “Recent Investigations of the Mechanics of Cavitation and Cavitation Damage,”
Trans. ASME, vol. 77, pp. 1045–1054, 1955.
D. Krefting, R. Mettin, and W. Lauterborn, “High-speed observation of acoustic cavitation
erosion in multibubble systems,” Ultrason. Sonochem., vol. 11, pp. 119–123, 2004.
P. S. Kumar and A. B. Pandit, “Modeling Hydrodynamic Cavitation,” Chem. Eng. Technol., vol.
83
22, no. 12, pp. 1017–1027, 1999.
J. M. Lee, M. Zhang, and W. Y. Yeong, “Characterization and evaluation of 3D printed
microfluidic chip for cell processing,” Microfluid. Nanofluidics, vol. 20, no. 1, pp. 1–15,
2016.
H. Li, “Role of hydrodynamic cavitation in fine particle flotation,” Int. J. Miner. Process., vol.
51, no. 1–4, pp. 139–149, 2014.
H. Li, A. Afacan, Q. Liu, and Z. Xu, “Study interactions between fine particles and micron size
bubbles generated by hydrodynamic cavitation,” Miner. Eng., vol. 84, pp. 106–115,
2015.
Q. Liu and Z. Xu, “Self-Assembled Monolayer Coatings on Nanosized Magnetic Particles Using
Malvern, “Mastersizer 3000,” p. 182, 2013.
C. S. Martin, H. Medlarz, D. C. Wiggert, and C. Brennen, “Cavitation Inception in Spool
Valves,” J. Fluids Eng., vol. 103, no. 4, p. 564, 1981.
Kosjek, Aleksandra Krivograd Klemenc, Martina Oder, Martin Petkovšek, Nejc Racki, Maja
Ravnikar, Andrej Šarc, Brane Širok, Mojca Zupanc, Miha Zitnik, “Ultrasonics
Sonochemistry Use of hydrodynamic cavitation in ( waste ) water treatment,”
Ultrason. Sonochem., vol. 29, pp. 577–588, 2016.
K. A. Matis, G. P. Gallios, and K. A. Kydros, “Separation of fines by flotation techniques,” Sep.
Technol., vol. 3, no. 2, pp. 76–90, 1993.
and K. K. Mawson, R., “A brief history of the application of ultrasonics in food processing,”
84
19-th ICA Congr. Madrid., 2007.
T. Miettinen, J. Ralston, and D. Fornasiero, “The limits of fine particle flotation,” Miner. Eng.,
vol. 23, no. 5, pp. 420–437, 2010.
P. J. Milly, R. T. Toledo, M. A. Harrison, and D. Armstead, “Inactivation of food spoilage
microorganisms by hydrodynamic cavitation to achieve pasteurization and
sterilization of fluid foods,” J. Food Sci., vol. 72, no. 9, pp. 414–422, 2007.
C. Mishra and Y. Peles, “An experimental investigation of hydrodynamic cavitation in micro-
Venturis,” Phys. Fluids, vol. 18, no. 10, p. 103603, 2006.
V. S. Moholkar and A. B. Pandit, “Modeling of hydrodynamic cavitation reactors: A unified
approach,” Chem. Eng. Sci., vol. 56, no. 21–22, pp. 6295–6302, 2001.
V. S. Moholkar and A. B. Pandit, “Numerical investigations in the behaviour of one-
dimensional bubbly flow in hydrodynamic cavitation,” Chem. Eng. Sci., vol. 56, no. 4,
pp. 1411–1418, 2001.
V. S. Moholkar and A. B. Pandit, “Bubble behavior in hydrodynamic cavitation: Effect of
turbulence,” AIChE J., vol. 43, no. 6, pp. 1641–1648, 1997.
N. P. Murphy and R. H. Petrmichl, “Hyghly durable hydrophobic coatings and methods,”
Us006743516B2, vol. 2, no. 12, 2004.
C. F. Naude and A. T. Ellis, “On the Mechanism of Cavitation Damage by Nonhemispherical
Cavities Collapsing in Contact With a Solid Boundary,” J. Basic Eng., vol. 83, no. 4, p.
648, 1961.
85
S. Paliwal and S. Mitragotri, “Ultrasound-induced cavitation: applications in drug and gene
delivery,” Expert Opin. Drug Deliv., vol. 3, no. 6, pp. 713–726, 2006.
L. Parkinson and J. Ralston, “Dynamic aspects of small bubble and hydrophilic solid
encounters,” Adv. Colloid Interface Sci., vol. 168, no. 1–2, pp. 198–209, 2011.
D. W. Peddie, “University of alberta - unofficial record,” vol. 1, pp. 1–3, 2011.
S. Perumal, Kumar, Sim Mei, “CFD Study of the Effect of Venturi Convergent and Divergent
Angles on Low Pressure Wet Gas Metering,” J. Appl. Sci., 2014.
D. V. Pinjari and A. B. Pandit, “Room temperature synthesis of crystalline CeO2 nanopowder:
Advantage of sonochemical method over conventional method,” Ultrason.
Sonochem., vol. 18, no. 5, pp. 1118–1123, 2011.
J. Ralston, “Inertial hydrodynamic particle – bubble interaction in flotation,” pp. 207–256,
1999.
L. N. Randall, “Rocket Applications of the Cavitating Venturi,” J. Am. Rocket Soc., vol. 22, pp.
28–38, 1952.
P. Rudolf, M. Hudec, M. Gríger, and D. Štefan, “Characterization of the cavitating flow in
converging-diverging nozzle based on experimental investigations,” EPJ Web Conf.,
vol. 2101, 2014.
M. Sadatomi, A. Kawahara, K. Kano, and A. Ohtomo, “Performance of a new micro-bubble
generator with a spherical body in a flowing water tube,” Exp. Therm. Fluid Sci., vol.
29, no. 5, pp. 615–623, 2005.
86
V. K. Saharan, M. A. Rizwani, A. A. Malani, and A. B. Pandit, “Effect of geometry of
hydrodynamically cavitating device on degradation of orange-G,” Ultrason.
Sonochem., vol. 20, no. 1, pp. 345–353, 2013.
P. J. Sanchez-Soto et al., “Talc from Puebla de Lillo, Spain. II. Effect of dry grinding on particle
size and shape,” Appl. Clay Sci., vol. 12, no. 4, pp. 297–312, 1997.
R. Sander, “Compilation of Henry’s law constants (version 4.0) for water as solvent,” Atmos.
Chem. Phys., vol. 15, no. 8, pp. 4399–4981, 2015.
A. Y. Seiji Shimizu, “EROSION IN HYDRAULIC OIL , HWCFs , AND TAP WATER,” 1989.
P. Senthil Kumar, M. Siva Kumar, and A. B. Pandit, “Experimental quantification of chemical
effects of hydrodynamic cavitation,” Chem. Eng. Sci., vol. 55, pp. 1633–1639, 2000.
R. Singh, S. K. Tiwari, and S. K. Mishra, “Cavitation erosion in hydraulic turbine components
and mitigation by coatings: Current status and future needs,” J. Mater. Eng. Perform.,
vol. 21, no. 7, pp. 1539–1551, 2012.
M. Sivakumar and A. B. Pandit, “Wastewater treatment: A novel energy efficient
hydrodynamic cavitational technique,” Ultrason. Sonochem., vol. 9, no. 3, pp. 123–
131, 2002.
J. G. Slowik et al., “Particle Morphology and Density Characterization by Combined Mobility
and Aerodynamic Diameter Measurements. Part 2: Application to Combustion-
Generated Soot Aerosols as a Function of Fuel Equivalence Ratio,” Aerosol Sci.
Technol., vol. 38, no. 12, pp. 1206–1222, 2004.
87
A. Sobhy and D. Tao, “Nanobubble column flotation of fine coal particles and associated
fundamentals,” Int. J. Miner. Process., vol. 124, pp. 109–116, 2013.
a Sobhy, R. Honaker, and D. Tao, “Nanobubble Column Flotation for More Efficient Coal
Recovery,” vol. 507, pp. 1–7, 2013.
T. V. Subrahmanyam and K. S. E. Forssberg, “Fine particles processing: shear-flocculation and
carrier flotation - a review,” Int. J. Miner. Process., vol. 30, no. 3–4, pp. 265–286, 1990.
M. C. Sukop and D. Or, “Lattice Boltzmann method for homogeneous and heterogeneous
cavitation,” Phys. Rev. E - Stat. Nonlinear, Soft Matter Phys., vol. 71, no. 4, pp. 1–5,
2005.
K. S. Suslick, “The Chemical Effects of Ultrasound,” Sci. Am., vol. 260, no. 2, pp. 80–86, 1989.
M. A. Sutton, N. Li, D. C. Joy, A. P. Reynolds, and X. Li, “Scanning electron microscopy for
quantitative small and large deformation measurements Part I: SEM imaging at
magnifications from 200 to 10,000,” Exp. Mech., vol. 47, no. 6, pp. 775–787, 2007.
D. Tao, “Role of Bubble Size in Flotation of Coarse and Fine Particles—A Review,” Sep. Sci.
Technol., vol. 39, no. 4, pp. 741–760, 2005.
D. Tao, S. Yu, X. Zhou, R. Q. Honaker, and B. K. Parekh, “Picobubble Column Flotation of Fine
Coal,” Int. J. Coal Prep. Util., vol. 28, no. 1, pp. 1–14, 2008.
W. J. Trahar and L. J. Warren, “The flotability of very fine particles - A review,” Int. J. Miner.
Process., vol. 3, no. 2, pp. 103–131, 1976.
J. R. Tumbleston et al., “Continuous liquid interface production of 3D objects,” Science
88
(80-. )., vol. 347, no. 6228, pp. 1349–1352, 2015.
K. D. Vernon-Parry, “Scanning electron microscopy: an introduction,” III-Vs Rev., vol. 13, no.
4, pp. 40–44, 2000.
Z. W. A, “Relation of the Equilibrium Contact Angle to Liquid and Solid Constitution,” Adv.
Chem., vol. 43, no. 2, pp. 1–51, 1964.
L. J. Warren, “Shear-flocculation of ultrafine scheelite in sodium oleate solutions,” J. Colloid
Interface Sci., vol. 50, no. 2, pp. 307–318, 1975.
M. E. Weber and D. Paddock, “Interceptional and gravitational collision efficiencies for single
collectors at intermediate Reynolds numbers,” J. Colloid Interface Sci., vol. 94, no. 2,
pp. 328–335, 1983.
Y. Xing, X. Gui, Y. Cao, D. Wang, and H. Zhang, “Clean low-rank-coal purification technique
combining cyclonic-static microbubble flotation column with collector emulsification,”
J. Clean. Prod., vol. 3, 2016.
Y. Yan and R. B. Thorpe, “Flow regime transitions due to cavitation in the flow through an
orifice,” Int. J. Multiph. Flow, vol. 16, no. 6, pp. 1023–1045, 1990.
X. Ye, X. Yao, and R. Han, “Dynamics of cavitation bubbles in acoustic field near the rigid
wall,” Ocean Eng., vol. 109, pp. 507–516, 2015.
J. Yin, J. Li, H. Li, W. Liu, and D. Wang, “Experimental study on the bubble generation
characteristics for an Venturi type bubble generator,” Int. J. Heat Mass Transf., vol.
91, no. November, pp. 218–224, 2015.
89
R. H. Yoon and G. H. Luttrell, “The Effect of Bubble Size on Fine Coal Flotation,” Coal Prep.,
vol. 2, no. 3, pp. 179–192, 1986.
R.-H. Yoon, D. H. Flinn, and Y. I. Rabinovich, “Hydrophobic interactions between dissimilar
surfaces,” J. Colloid Interface Sci., vol. 185, no. 2, pp. 363–370, 1997.
X. Yu and P. Felicia, “Optimization of cavitation Venturi tube design for pico and nano
bubbles generation,” Int. J. Min. Sci. Technol., vol. 25, pp. 523–529, 2015.
Yusuf G. Adewuyi, “Sonochemistry: Environmental Science and Engineering Applications,”
Ind. Eng. Chem. Res, no. 40, pp. 4681–4715, 2001.
W. Zhou, H. Chen, L. Ou, and Q. Shi, “International Journal of Mineral Processing Aggregation
of ultra- fi ne scheelite particles induced by hydrodynamic cavitation,” Int. J. Miner.
Process., vol. 157, pp. 236–240, 2016.
Z. A. Zhou, Z. Xu, and J. A. Finch, “On the role of cavitation in particle collection in flotation -
A critical review,” Miner. Eng., vol. 22, no. 5, pp. 419–433, 1994.
Z. a. Zhou, Z. Xu, J. a. Finch, H. Hu, and S. R. Rao, “Role of hydrodynamic cavitation in fine
particle flotation,” Int. J. Miner. Process., vol. 51, no. 1–4, pp. 139–149, 1997.
Z. A. Zhou, Z. Xu, J. A. Finch, J. H. Masliyah, and R. S. Chow, “On the role of cavitation in
particle collection in flotation – A critical review. II,” Miner. Eng., vol. 22, no. 5, pp.
419–433, 2009.