influence of water salinity on growth performance and
TRANSCRIPT

Influence of water salinity on growth performance and physiological responses in Nguni
goats
By
Zwelethu Mfanafuthi Mdletshe
Submitted in fulfilment of the requirements for the degree of Masters in Animal Science
Discipline of Animal and Poultry Science
School of Agriculture, Earth and Environmental Sciences
College of Agriculture, Engineering and Sciences
Pietermaritzburg, South Africa
Supervisor: Prof. M. Chimonyo
Co-supervisor: Prof. I. V. Nsahlai
December 2015
i
Declaration
I, Zwelethu Mfanafuthi Mdletshe, declare that this dissertation has not been submitted to any
University and that it is my original work conducted under the supervision of Prof. M. Chimonyo
and Prof. I. V. Nsahlai. All assistance towards the production of this work and all the references
contained herein have been duly credited.
________________________________ ______________________________
Zwelethu. M. Mdletshe Date
Approved as to style and content by:
_______________________________
Prof. M. Chimonyo
(Supervisor)
______________________________
Prof. I. V. Nsahlai
(Co-supervisor)
December 2015

ii
List of Abbreviations
ADFI average daily feed intake
ADG average daily gain
ADWI average daily water intake
AOAC Association of Official Analytical Chemists
BOD biochemical oxygen demand
BW body weight
CAPS census of agriculture provincial statistics
cm centimetre
COD chemical oxygen demand
CP crude protein
d day
DAGRIS domestic animal genetic resources information system
DM dry matter
dS/m decisiemens per meter
EC electrical conductivity
FAOSTAT food and agriculture organization statistics
FCR feed conversion ratio

iii
g grams
kg kilograms
km kilometres
L litre
m metre
ME metabolisable energy
mg/L milligram per litre
MJ mega joules
mL millilitre
NaCl sodium chloride
NAK ATPase sodium potassium adenosine triphosphatase
NRC national research council
NS not significant
P probability
ppm parts per million
PR pulse rate
RR respiration rate
RT rectal temperature
iv
SAS statistical analysis systems
SEM standard error of the mean
TDS/L total dissolved solids per litre
TSS total soluble salts
v
Abstract
Influence of water salinity on growth performance and physiological responses in Nguni
goats
By
Z. M. Mdletshe
A survey was conducted to investigate factors influencing water scarcity for goats in areas where
there are seasonal and perennial river systems in poor resource-limited smallholder communal
farming systems. About 8 and 26 % of the elderly respondents reported that over the past 30 years,
the river that are seasonal used to be perennial flow. Households located close (≤ 3 km) to the
nearest water source and areas where there were seasonal rivers reported drinking water for goats
a scarce resource compared to those located far (> 3km) from the nearest water source and located
in areas where there was perennial rivers. Negative effects of climate change associated with
drought conditions increased incidences of dry spells during the rainy seasons and short season
varieties. It was concluded that river systems, seasonal water sources, distance from the nearest
water source, and negative effects of climate change associated with drought conditions were
major factors which influenced water scarcity for goats in resource-limited communal farming
environments. Although farmers did not regard water quality as a factor which causes water
quality, however, water is an attribute which affects livestock.
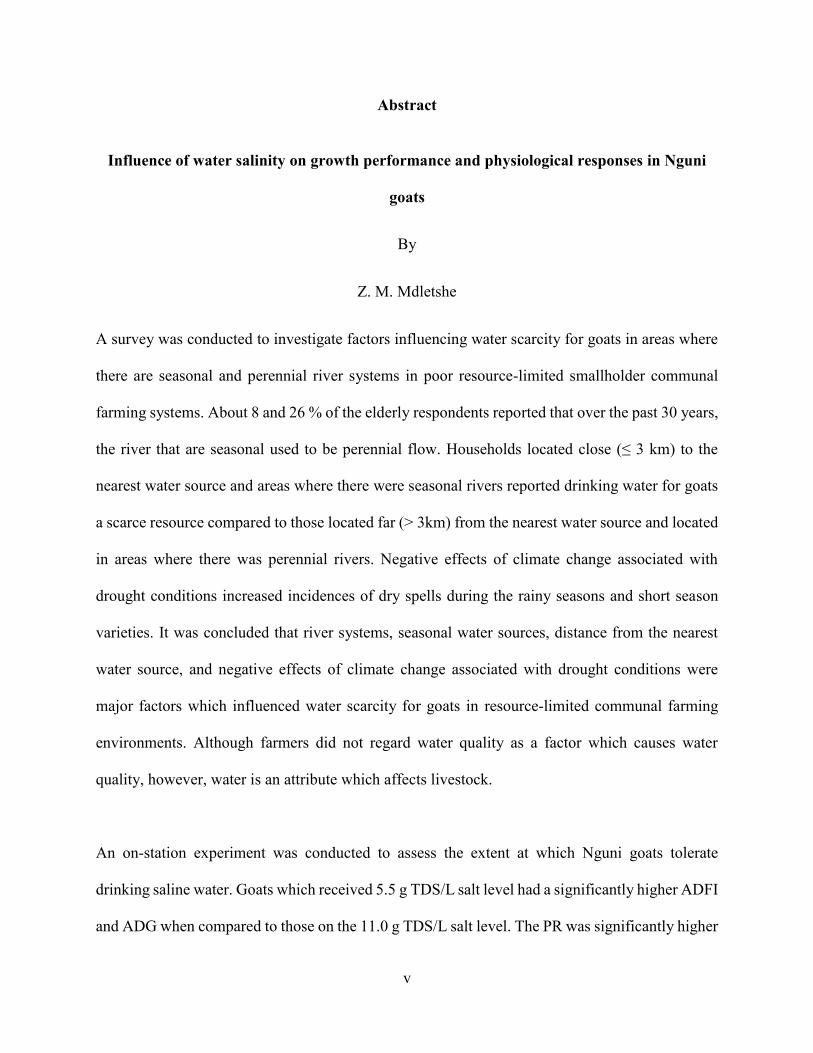
An on-station experiment was conducted to assess the extent at which Nguni goats tolerate
drinking saline water. Goats which received 5.5 g TDS/L salt level had a significantly higher ADFI
and ADG when compared to those on the 11.0 g TDS/L salt level. The PR was significantly higher

vi
in goats that received 11 g TDS/L than those on the 5.5 g TDS/L salt level. It was concluded that
Nguni goats can tolerate drinking water with salinity levels not above 5.5 g TDS/L. It is
recommended that Nguni goats be provided with greywater not contain salt levels above 5.5 g
TDS/L in areas were fresh drinking water is a scarce resource. This will reduce the demand for
fresh water.
Keywords: seasonal rivers; perennial rivers; water sources; droughts; average daily feed intake;
average daily water intake; pulse rate; rectal temperature; respiration rate.

vii
Acknowledgements
A thesis owes its plan, pattern and development, directly and indirectly, to people who inspire it,
encouraged its progress and contribution to its content. This is no exception. After finishing an
academic activity such as this one, one is usually overwhelmed by a feeling that it is not solely a
personal achievement. This is exactly how I feel about this work. Many people have contributed
to making this dream possible.
Although my indebtedness is to all, it gives me pleasure to mention a few by name:
My supervisor, Prof. Michael Chimonyo and co-supervisor, Prof. Ignatius Verla Nsahlai
for their guidance and support.
Dr. Titus Zindove and Mr. Jabulani Dlamini (Stats Department) for providing endless
guidance especially in the statistic section of my work.
Dr. Munyaradzi Christopher Marufu who assisted will all the veterinary advice and shaping
chapter 4 of this thesis.
Farmers from KwaNongoma area in their participation on the study.
Enumerators which were assisting with data collection during the survey study.
Chairperson from the Khulani farmer’s association, Mr. Ntshangase and extension officers
from KwaNongoma for assisting in identifying villages and households which are active
in goat production.
Chiefs and chief advisors for warmly accepting me and assisting me with accessing
communities were I had collect my data.
Extension officers from the Department of Agriculture (DoA) at KwaNongoma branch for
their support in approaching traditional leaders.

viii
Dr. Khumalo, the chairperson for the traditional council of Usuthu district, supported and
motivated me to work harder for my community.
Survey technicians from the Department of co-operative government and traditional affairs
(Pietermaritzburg and Ulundi) provided a map of all the three districts of Nongoma and its
villages.
My colleagues, postgraduate and undergraduate students at the University of KwaZulu-
Natal, Discipline of Animal and Poultry Science encourage and inspired me to keep
working hard. A special word of appreciation goes to Sithembile Ndlela, Thandokuhle
Mpendulo, Mr. Mehluli Moyo, Vusi Mkhwanazi, Thembelihle Memela, Cresswell
Mseleku, Lindokuhle Mhlongo, and Thando Tenza, Nomalanga Masondo, Lindokuhle
Ngcobo who, undergraduate students, technical staff, and colleagues took personal
commitment in assisting me with data collection for the survey chapter and the
experimental trial.
Technical staff at Ukulinga research farm (Mrs. Alert Botha; Mr. Samual Khumalo; Mr.
Emmanuel Makhoba; Mr. Dlamini) for assisting me with data collection
Mr. and Mrs. Mthethwa for opening their spacious home in Scottville for me when I was
still struggling to find own accommodation at varsity. From my heart, I value both of you
as family.
My family and my varsity family (F4YD) whose support I will eternally be grateful for. A
special word of appreciation also goes to my aunt (Ntombifikile Gebashe) who supported
me financially ever since I started tertiary education.
God the Father, Son and Holy Spirit for the gifts of life, salvation, health and the inspiration
to go through this work.

ix
Countless people, known and unknown, for ideas, suggestions, insights and especially
those who interceded for me for the duration of my study.
x
Contents of Content
Declaration ....................................................................................................................................... i List of Abbreviations ...................................................................................................................... ii Abstract ........................................................................................................................................... v
Acknowledgements ....................................................................................................................... vii Chapter 1: General introduction...................................................................................................... 1
1.1 Background ...................................................................................................................... 1
1.2 Justification ...................................................................................................................... 2
1.3 Objectives ......................................................................................................................... 3
1.4 Hypothesis ........................................................................................................................ 4
1.5 References ........................................................................................................................ 4
Chapter 2: Literature review ........................................................................................................... 8
2.1 Introduction ...................................................................................................................... 8
2.2 Goat production systems in resource-limited communal farming areas .......................... 9
2.3 Characteristics of goats under smallholder goat production ............................................ 9
2.4 Role of goats to livelihoods of smallholder communal farmers .................................... 10
2.5 Goat management practices in communal farming systems .......................................... 12
2.6 Importance of water and methods of assessing water quality in livestock production .. 13
2.6.1 Factors influencing water quality............................................................................ 15
2.7 Effect of water quality and breed on water intake ......................................................... 20
2.7.1 Intake of saline drinking water ............................................................................... 20
2.7.2 Growth and physiological responses to saline drinking water................................ 21
2.8 Measures of assessing health status of goats drinking saline water ............................... 22
2.8.1 Urine output ............................................................................................................ 22
2.8.2 Rectal temperature and respiratory rate .................................................................. 23
2.8.3 Frequency of drinking and urination....................................................................... 23
2.8.4 Symptoms of salt poisoning .................................................................................... 24
2.9 Summary of literature review ......................................................................................... 24
2.10 References ...................................................................................................................... 25
Chapter 3: Factors influencing water scarcity for goats in resource-limited communal farming environments ................................................................................................................................. 34
Abstract ..................................................................................................................................... 34
3.1 Introduction .................................................................................................................... 35
3.2 Material and methods ..................................................................................................... 37

xi
3.2.1 Description of study site ......................................................................................... 37
3.2.2 Household selection and data collection ................................................................. 38
3.2.3 Statistical analyses .................................................................................................. 40
3.3 Results ................................................................................................................................ 41
3.3.1 Household demography .......................................................................................... 41
3.3.2 Roles and functions of goats ................................................................................... 42
3.3.3 Constraints to goat production ................................................................................ 42
3.3.4 Water sources for goats ........................................................................................... 45
3.3.5 Odds ratio estimates for farmers experiencing water scarcity ................................ 48
3.3.6 Comparing the flow of rivers during dry seasons over the past 30 years ............... 49
3.4 Discussion ...................................................................................................................... 49
3.5 Conclusions .................................................................................................................... 54
3.6 References ...................................................................................................................... 55
Chapter 4: Effects of drinking saline water on growth performance and physiological responses in Nguni goats ............................................................................................................................... 58
Abstract ..................................................................................................................................... 58
4.1 Introduction .................................................................................................................... 58
4.2 Materials and Methods ................................................................................................... 60
4.2.1 Study site ................................................................................................................. 60
4.2.2 Saline water treatments ........................................................................................... 60
4.2.3 Goats, diets and experimental design ...................................................................... 60
4.2.4 Measurements ......................................................................................................... 62
4.2.5 Statistical analyses ........................................................................................................ 65
4.3 Results ............................................................................................................................ 66
4.2.3 Average daily feed intake ....................................................................................... 66
4.3.2 Average daily water intake ..................................................................................... 66
4.3.3 Average daily gain .................................................................................................. 67
4.3.4 Feed conversion ratio .............................................................................................. 67
4.3.5 Physiological parameters ........................................................................................ 67
4.4 Discussion ...................................................................................................................... 68
4.5 Conclusions .................................................................................................................... 74
4.6 References ...................................................................................................................... 74
Chapter 5: General discussion, conclusions and recommendations ............................................. 78
5.1 General discussion.......................................................................................................... 78
5.2 Conclusions .................................................................................................................... 79

xii
5.3 Recommendations and further research ......................................................................... 80
xiii
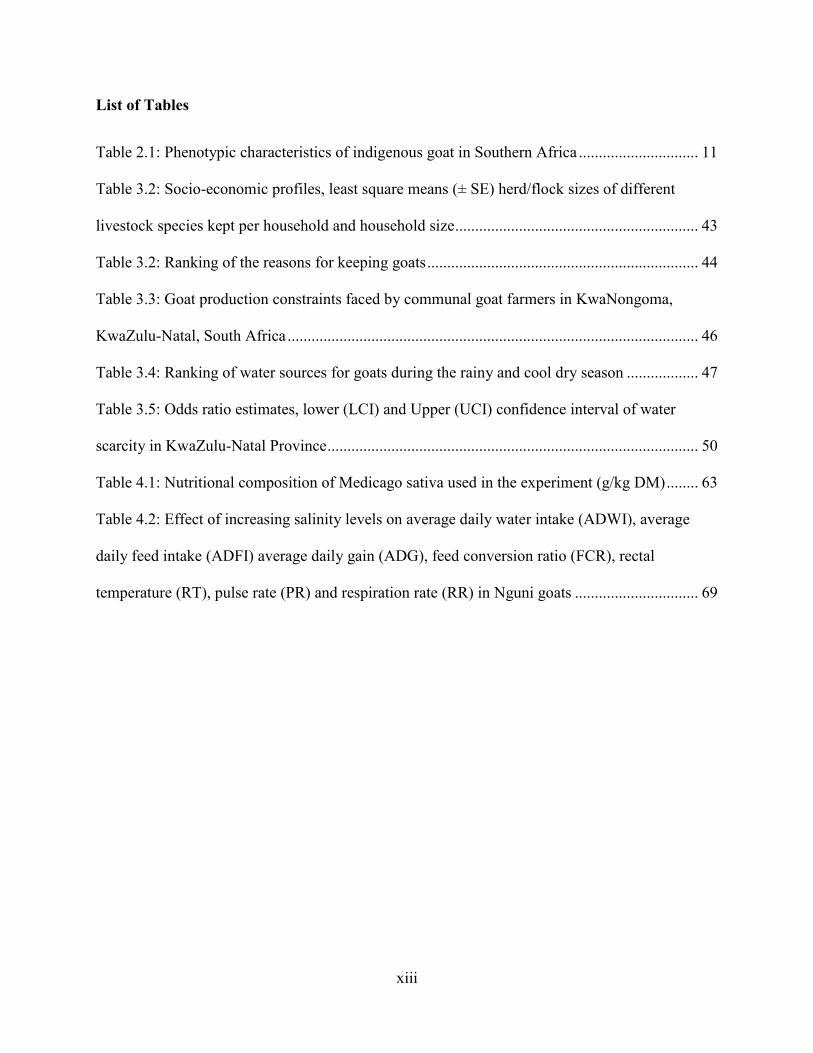
List of Tables
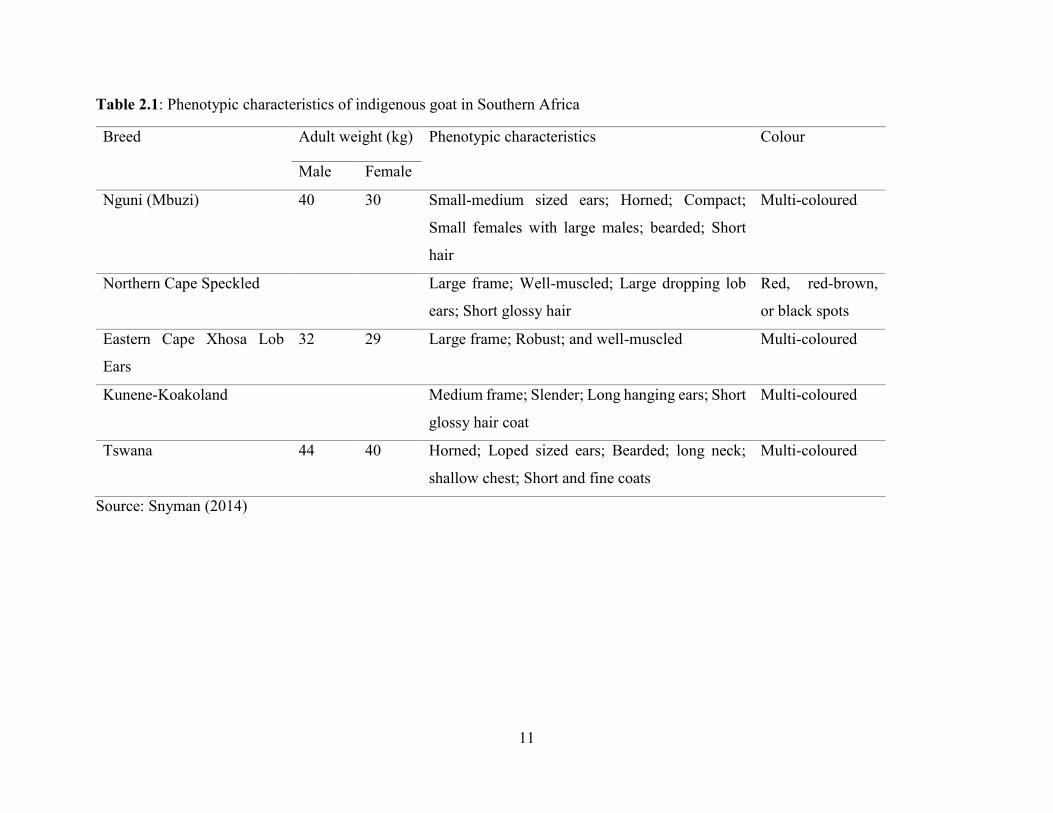
Table 2.1: Phenotypic characteristics of indigenous goat in Southern Africa .............................. 11
Table 3.2: Socio-economic profiles, least square means (± SE) herd/flock sizes of different
livestock species kept per household and household size ............................................................. 43
Table 3.2: Ranking of the reasons for keeping goats .................................................................... 44
Table 3.3: Goat production constraints faced by communal goat farmers in KwaNongoma,
KwaZulu-Natal, South Africa ....................................................................................................... 46
Table 3.4: Ranking of water sources for goats during the rainy and cool dry season .................. 47
Table 3.5: Odds ratio estimates, lower (LCI) and Upper (UCI) confidence interval of water
scarcity in KwaZulu-Natal Province ............................................................................................. 50
Table 4.1: Nutritional composition of Medicago sativa used in the experiment (g/kg DM) ........ 63
Table 4.2: Effect of increasing salinity levels on average daily water intake (ADWI), average
daily feed intake (ADFI) average daily gain (ADG), feed conversion ratio (FCR), rectal
temperature (RT), pulse rate (PR) and respiration rate (RR) in Nguni goats ............................... 69

xiv
List of Figures
Figure 4.1: Relationship between growth parameters to salinity levels in drinking water for goats
against time ................................................................................................................................... 70
Figure 4.2: Relationship between physiological responses to various salinity levels in drinking
water for goats against time .......................................................................................................... 71
xv
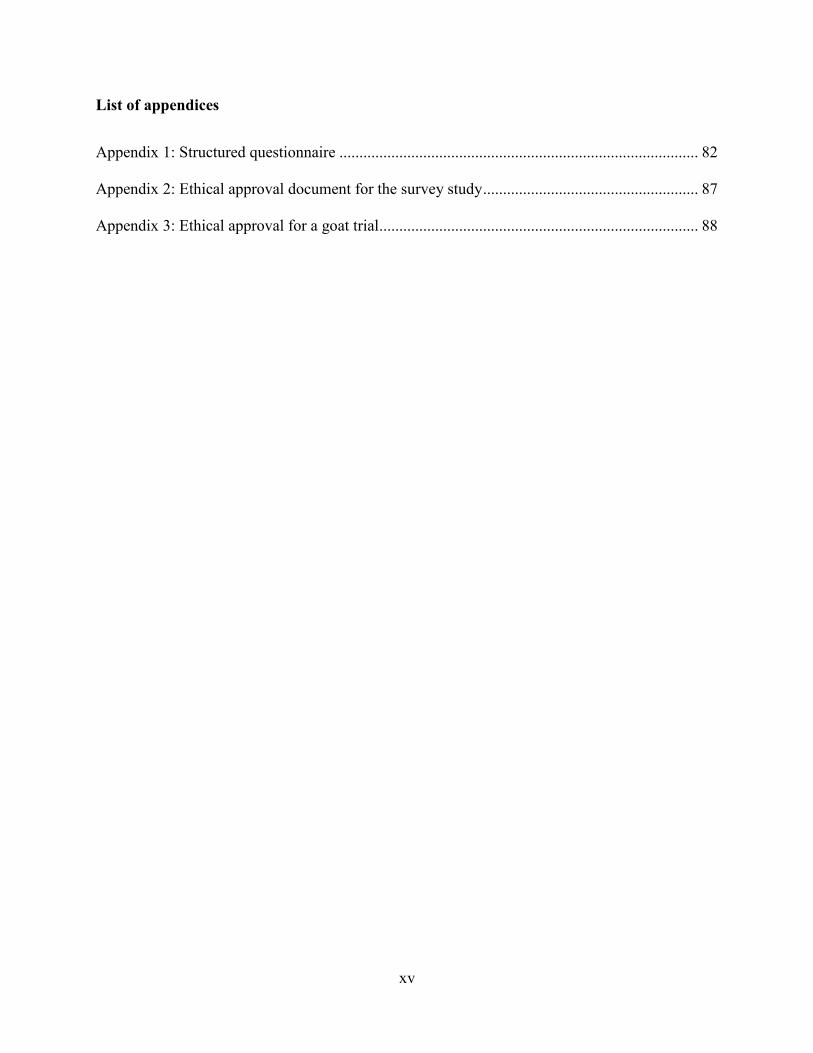
List of appendices
Appendix 1: Structured questionnaire .......................................................................................... 82
Appendix 2: Ethical approval document for the survey study ...................................................... 87
Appendix 3: Ethical approval for a goat trial ................................................................................ 88

1
Chapter 1: General introduction
1.1 Background
The world’s goat population was estimated at 981 878 863.2 million in 2011 (FAOSTAT, 2012)
with 96 % of these kept in developing countries. Africa accounts for 33.8 % of the world total goat
population (Aziz, 2010). However, 50 % of Africa’s total goat population is kept by smallholder
limited-resources farmers with low inputs (Rumosa Gwaze et al., 2009). Goats under these farming
systems are predominantly the indigenous genotypes (Lebbie, 2004). Goats contribute to poor
smallholder communal farmers through the provision of milk and meat consumption, traditional
rituals (Masika and Mafu, 2004) and financial security (Sebei, 2002; Peacock, 2005).
In Southern Africa, goat production is divided into two sectors, mainly the commercial and
communal farming systems. Under commercial farming systems, breeds which are mainly reared
include Angora, South African Savannah and Boer goats (DAGRIS, 2007). Angora goats are
reared for mohair production with excess of old stock being marketed in the goat meat sector. Boer
and other breeds are specifically used for chevon production (Tshabalala, 2000; Roets and Kirsten,
2005). Under communal farming systems, common goat breeds kept include indigenous Nguni,
Tswana, Northern Cape Speckled, Eastern Cape Xhosa Lob Ears, and Kunene-Koakoland goats
(CAPS, 2006; Morrison, 2007; Botha and Roux, 2008).
Goats owned by resource-limited communal farmers are kept under extensive communal grazing
systems (Masika and Mafu, 2004). Extensive communal production systems are characterized with
2
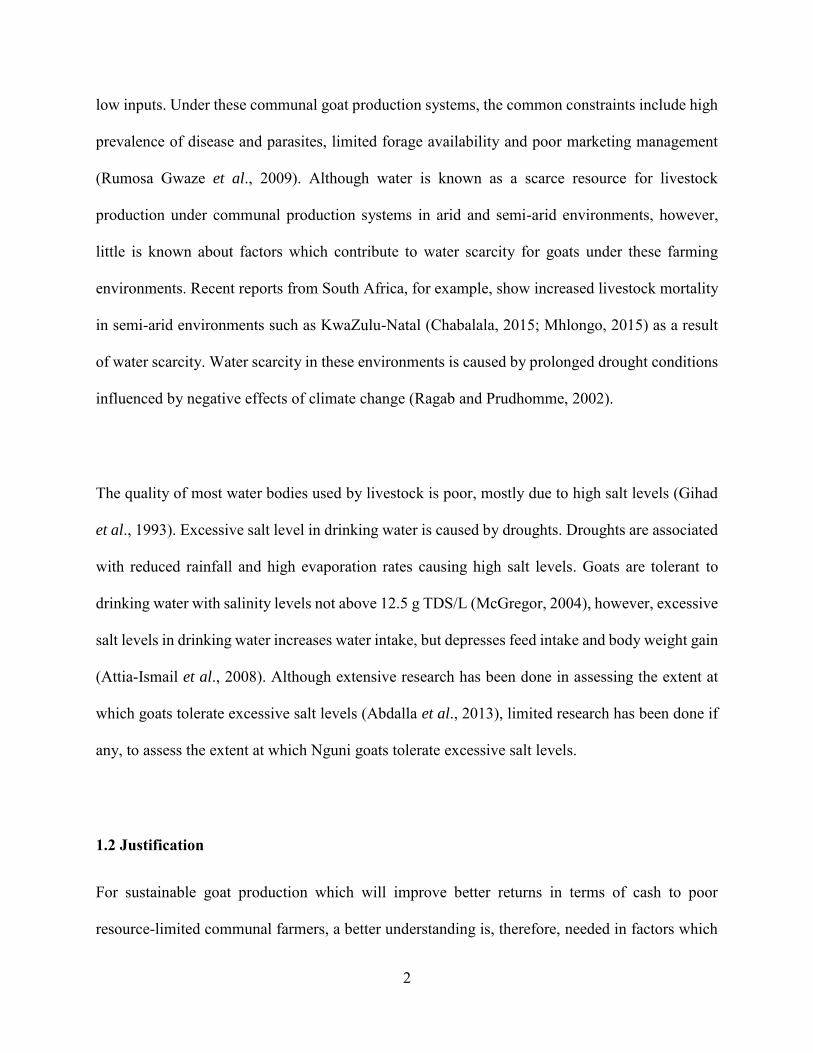
low inputs. Under these communal goat production systems, the common constraints include high
prevalence of disease and parasites, limited forage availability and poor marketing management
(Rumosa Gwaze et al., 2009). Although water is known as a scarce resource for livestock
production under communal production systems in arid and semi-arid environments, however,
little is known about factors which contribute to water scarcity for goats under these farming
environments. Recent reports from South Africa, for example, show increased livestock mortality
in semi-arid environments such as KwaZulu-Natal (Chabalala, 2015; Mhlongo, 2015) as a result
of water scarcity. Water scarcity in these environments is caused by prolonged drought conditions
influenced by negative effects of climate change (Ragab and Prudhomme, 2002).
The quality of most water bodies used by livestock is poor, mostly due to high salt levels (Gihad
et al., 1993). Excessive salt level in drinking water is caused by droughts. Droughts are associated
with reduced rainfall and high evaporation rates causing high salt levels. Goats are tolerant to
drinking water with salinity levels not above 12.5 g TDS/L (McGregor, 2004), however, excessive
salt levels in drinking water increases water intake, but depresses feed intake and body weight gain
(Attia-Ismail et al., 2008). Although extensive research has been done in assessing the extent at
which goats tolerate excessive salt levels (Abdalla et al., 2013), limited research has been done if
any, to assess the extent at which Nguni goats tolerate excessive salt levels.
1.2 Justification
For sustainable goat production which will improve better returns in terms of cash to poor
resource-limited communal farmers, a better understanding is, therefore, needed in factors which
3
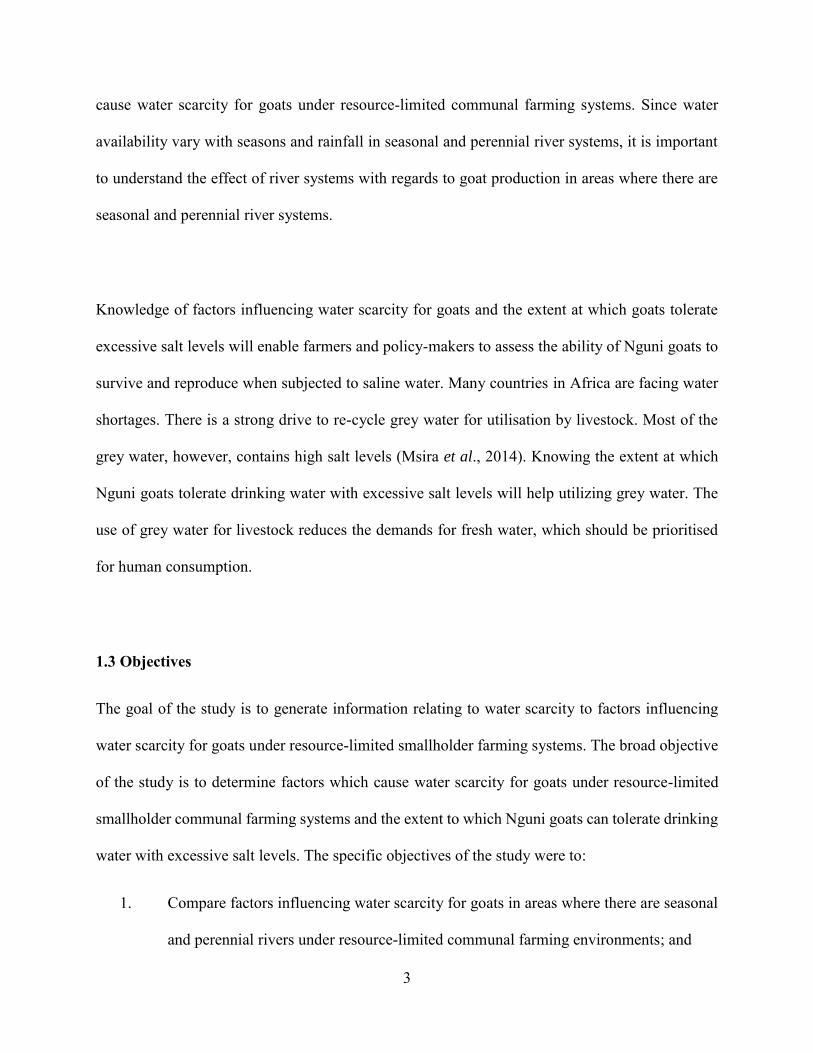
cause water scarcity for goats under resource-limited communal farming systems. Since water
availability vary with seasons and rainfall in seasonal and perennial river systems, it is important
to understand the effect of river systems with regards to goat production in areas where there are
seasonal and perennial river systems.
Knowledge of factors influencing water scarcity for goats and the extent at which goats tolerate
excessive salt levels will enable farmers and policy-makers to assess the ability of Nguni goats to
survive and reproduce when subjected to saline water. Many countries in Africa are facing water
shortages. There is a strong drive to re-cycle grey water for utilisation by livestock. Most of the
grey water, however, contains high salt levels (Msira et al., 2014). Knowing the extent at which
Nguni goats tolerate drinking water with excessive salt levels will help utilizing grey water. The
use of grey water for livestock reduces the demands for fresh water, which should be prioritised
for human consumption.
1.3 Objectives
The goal of the study is to generate information relating to water scarcity to factors influencing
water scarcity for goats under resource-limited smallholder farming systems. The broad objective
of the study is to determine factors which cause water scarcity for goats under resource-limited
smallholder communal farming systems and the extent to which Nguni goats can tolerate drinking
water with excessive salt levels. The specific objectives of the study were to:
1. Compare factors influencing water scarcity for goats in areas where there are seasonal
and perennial rivers under resource-limited communal farming environments; and

4
2. Assess the extent to which Nguni goats can tolerate drinking saline water
1.4 Hypothesis
Hypothesis to be tested were that:
1. Factors which cause water scarcity for goats was lower for households with access to
perennial river systems than those without; and
2. Increasing salinity of drinking water increases feed intake, water consumption and
growth rate of Nguni goats.
1.5 References
Abdalla, E. B., Gawish, H. A., El-Sherbiny, A. M., Ibrahim, N. H and El-Hawy, A. S., 2013.
Reproductive efficiency of Damascus goats in salt-affected lands in South Sinai, Egypt.
Journal of American Science, 9(8): 170-177.
Attia-Ismail, S. A., Abdo, A. R and Asker, A. R. T., 2008. Effect of salinity level in drinking water
on feed intake, nutrient utilization, water intake and turnover and rumen function in sheep
and goats. Egyptian J. of Sheep and Goat Sciences (Special Issue, 2" Inter. Sci. Conf. on
SR Production, 3(1): 77 – 92.
Aziz, M. A., 2010. Present status of the world goat populations and their productivity. Lohmann
information, 45 (2):42-52.
5
Botha, A. F and Roux, J. A., 2008. The Fibre, Yarn and Fabric Properties of South African
Indigenous Goat Hair. 4th International Cashmere/wool Technique Symposium. Erdos
City, China, 17 - 18 November, pp 140-147.
Burke, M. G., 1990. Seawater consumption and water economy of tropical feral goats. Biotropica,
22(4): 416-419.
Census of Agriculture Provincial statistics (CAPS) 2002-KwaZulu-Natal. Financial and
Production statistics. Statistics South Africa, department of Agriculture. Series no. 11-02-
06. Pretoria, South Africa.
Chabalala, J., 2015. More drought aid for KZN as shortages grip the country, News24. Available
from: http://www.news24.com/SouthAfrica/News/More-drought-aid-for-KZN-as-
shortages-grip-the-country-20151101 (01 November 2015).
Domestic Animal Genetic Resources Information System (DAGRIS), 2007. In: Rege, J. E. O.,
Hanotte, O., Mamo, Y., Asrai, B., and Dessie, T. (eds), International Livestock Research
Institute, Addis Ababa, Ethiopia. http://dagris.ilri.cgiar.org/ (Accessed 22-05-2014).
FAOSTAT, 2008. http://faostat3.fao.org/faostat-gateway/go/to/search/*/E (Accessed 27-05-
2014).
Gihad, E. A., 1993. Utilization of high salinity tolerant plants and saline water by desert animals,
in : H. Lieth, A.A. Massoom (Eds.), Towards the rational use of high salinity tolerant
plants, Kluwer Academic Publishers, Netherlands, pp. 443-447.
Lebbie, S. H. B., 2004. Goats under household conditions. Small Ruminant Research, 51: 131-
136.
6
Masika, P. J. and Mafu, J. V., 2004. Aspects of goat farming in the communal farming systems of
the central Eastern Cape, South Africa. Small Ruminant Research, 52 (1-2): 161-164.
McGregor, B. A., 2004. Water quality and provision for goats. A report for the Rural Industries
Research and Development Corporation. RIRDC Publication No. 04/036. Rural Industries
Research and Development Corporation, Canberra.
Mhlongo, F., 2015. ‘KZN livestock losses due to drought’, SABC NEWS 20 October. Available
from: http://www.sabc.co.za/news/a/559663804a476dc0b0adfb6d39fe9e0c/KZN-
livestock--continues-to-die-due-to-drought-20152010 (20 October 2015).
Morrison, J. W., 2007. A Guide to the identification of the Natural Indigenous Goats of Southern
Africa. Indigenous Veld Goat Club/ Inheemse Veld Bok Klub (I. V. G). For the Natural
Indigenous African Goat/ Vir die Natuurlike Inheemse Afrika Bok. http://landbou.com/wp-
content/uploads/2014/03/f2297405-a93f-4399-bdb7-6f3de538d75d.pdf. (Accessed: 04-
12-2015).
Msira, R. K., Patel, J. H and Baxi, V. R., 2014. Reuse potential of laundry greywater for irrigation
based on growth, water and nutrient use of tomato. Journal of Hydrology, 386 (1-4): 1-13.
Peacock, C., 2005. Goat-A pathway out of poverty. Small Ruminant Research, 60:179-186.
Ragab, R and Prudhomme, C., 2002. Climate Change and Water Resources Management in Arid
and Semi-arid Regions: Prospective and Challenges for the 21st Century. Biosystems
Engineering, 81(1): 3-34.
Roets, M and Kirsten, J. F., 2005. Commercialisation of goat production in South Africa. Small
Ruminant Research, 60 (1): 187-197.

7
Rumosa Gwaze, F., Chimonyo, M and Dzama, K., 2009. Communal goat production in Southern
Africa: a review. Tropical Animal Health and Production, 41: 1157-1168.
Sebei, P. J., 2002. The assessment of some factors influencing the survival of kids in a small-scale
communal goat production system. MSc (Veterinary Science) thesis, Faculty of Veterinary
Science, University of Pretoria, Pretoria.
Tshabalala, P., 2000. Meat quality of South African indigenous goat and sheep breeds. MSc thesis,
University of Pretoria, Pretoria, South Africa.

8
Chapter 2: Literature review
2.1 Introduction
Indigenous goats are the most dominant and underutilised protein source in resource-limited
communal farming systems of Southern Africa. Although they are well adapted to locally harsh
environmental conditions where water of poor quality and is a scarce resource, they have the
potential to increase food security, reduce poverty and improve livelihoods of the resource poor
farmers.
Amongst the challenges farmers face with regards to goat production include low-input
agricultural practices such as poor management which results in high disease incidences and
prevalence (Turton, 2004; Marume et al., 2012; Slayi et al., 2014); Poor housing practices, and
poor marketing management (Rumosa Gwaze et al., 2009b). Although water scarcity and poor
quality is another constraint to goat production under resource-limited communal farming systems,
limited research has been done, if any, to investigate water related challenges under resource-
limited communal farming systems.
Therefore, the aim of this review is to discuss water and water-related challenges which are faced
by poor resource-limited smallholder farmers with regards to goat production under communal
farming systems. It also discusses alternative water sources which could be used by goats to reduce
the demand of fresh water and methods which could be used to assess the general health status of
goats under conditions of poor water quality.

9
2.2 Goat production systems in resource-limited communal farming areas
Goat production system in poor resource-limited smallholder communal farming systems is based
on the extensive system which results to low goat performance (Masika et al., 1998). Goat
ownership vary with district and gender (Rumosa Gwaze et al., 2009b). Goat numbers per
household depends on the size of the farm where subsistence oriented farmers owns between one
and 10 goats per household (van Niekerk and Pimentel, 2004) and farmers with large land sizes
own more than 10 goats per household (Masika and Mafu, 2004).
Common goat constraints under these farming systems include high prevalence of diseases and
parasites, poor animal management, poor management practices, limited forage availability, lack
of investment into goat farming and production, unfounded preconceptions which limit goat
production and predators, such as jackals (Masika and Mafu, 2004; Rumosa Gwaze et al., 2009a).
Although was is not a commonly cited constraint to goat production, however, water shortage in
prolonged periods of times causes goat mortalities (Mhlongo, 2015), especially in arid and semi-
arid environments when goats are not adapted to prolonged water shortages.
2.3 Characteristics of goats under smallholder goat production
Table 2.1 summaries characteristics of indigenous goat breeds found in South Africa. Goat breeds
of Southern Africa are categorized into four classes which are commercially reared Boer goats
which are specifically used for meat production, long-haired goats, polled Boer goats and
indigenous genotypes which are mainly kept by smallholder resource-limited farmers (Tshabalala,
2000). Indigenous breeds are classified based on drooping ears (lop-ear), origin, colour, size and
length of hair (Tshabalala, 2000; Kuyamandi Development Services, 2007). Indigenous goat

10
breeds have slow growth rate which is a result of inbreeding depression (Silanikove, 2000).
Indigenous goats have good mothering ability, high reproductive efficiency, natural resistance to
a range of diseases such as pulpy kidney, gall sickness and gastro-intestinal parasites (Du Toit,
2008). The indigenous goats also have low body mass and metabolic requirements which enable
these goats to survive under conditions of water scarcity and limited feed availability (Silanikove,
2000).
Functions of goats under resource-limited communal systems include providing household
income, providing income, indigenous traditional ceremonies, meat consumption and to a lesser
extent milk and manure (Lebbie, 2004; Masika and Mafu, 2004). The importance of each of these
functions varies with production system, and socio-economic factors such as gender, age,
education and religion of farmers (Masika and Mafu, 2004).
2.4 Role of goats to livelihoods of smallholder communal farmers
Although goats are regarded as being secondary to cattle under rural communal households,
however, in Southern Africa goats are now considered the most important livestock animal. This
is more likely influenced by a decrease in cattle numbers and the role which goats play in replacing
cattle when performing traditional ceremonies. When performing any traditional rituals, colour,
sex and age contribute to the importance of goats during any traditional ritual (Sebei et al., 2004;
Rumosa Gwaze et al., 2009b). When used to perform traditional ceremonies, it is believed that
they provide a connection between the living and the living dead (Lebbie, 2004).
11
Table 2.1: Phenotypic characteristics of indigenous goat in Southern Africa
Breed Adult weight (kg) Phenotypic characteristics Colour
Male Female
Nguni (Mbuzi) 40 30 Small-medium sized ears; Horned; Compact;
Small females with large males; bearded; Short
hair
Multi-coloured
Northern Cape Speckled Large frame; Well-muscled; Large dropping lob
ears; Short glossy hair
Red, red-brown,
or black spots
Eastern Cape Xhosa Lob
Ears
32 29 Large frame; Robust; and well-muscled Multi-coloured
Kunene-Koakoland Medium frame; Slender; Long hanging ears; Short
glossy hair coat
Multi-coloured
Tswana 44 40 Horned; Loped sized ears; Bearded; long neck;
shallow chest; Short and fine coats
Multi-coloured
Source: Snyman (2014)

12
Peacock (2005) provides a list of products and services from goats. Under poor rural households,
indigenous goats provide employment and economic stability. This is achieved by selling goat
products in informal markets. Although financial figures from the review of Lebbie (2004) reveal
that goat products such as meat, milk, and skin provide employment for rural communities, no
accurate data is available to estimate the contribution of indigenous goats to human food security
and general livelihood in rural communities. Goat products are not being recorded under these
farming systems (Roets and Kirsten, 2005).
2.5 Goat management practices in communal farming systems
In most communal farming systems, goat management practices are composed of old age (Rumosa
Gwaze et al., 2009b) small-scale farmers. Earlier research reports highlight poor management
systems for goats (Masika et al., 1998; Rumosa Gwaze et al., 2009a) which results in poor
productivity. Poor animal management include lack of modern agricultural skills and low-input
agricultural practices. Low-input agricultural practices include poor feeding and housing practices,
inappropriate breeding practices and inadequate adoption of proper animal health practices
(Lebbie, 2004). In this review, issues pertaining to drinking water in goat management practices
poor resource-limited communal farming systems will be highlighted.
Water sources used by goats for drinking water under extensive production systems are mainly
shared with humans. These water sources are mainly found in grazing rangelands. Distance to
these rangelands varies with each community. However, most common water sources found in
these rangelands include dams, rivers, springs, rainwater harvesting, pans (Homann et al., 2007)

13
and groundwater (Meyer and Casey, 2000). Little is known about the quality of drinking water in
these water sources and the extent at which goats drink water from these water sources. Under
conditions of water stress where water is a scarce resource, goats walk long distance in search for
water (Assan, 2014). In areas where goats are tethered during the cropping season, water is
provided manually using either buckets or portable dishwashing pan. Provision of water using
buckets or dishwashing pans depends on water availability from water sources which are also by
humans for drinking water. Provision of washer to goats in this goat management practice is mainly
the work of school children or household goat owners.
2.6 Importance of water and methods of assessing water quality in livestock production
Water is essential for all metabolic processes. These metabolic processes include maintenance of
body temperature, growth, reproduction and lactation, digestion, metabolism, excretion and
hydrolysis of protein, fat and carbohydrates regulation of mineral homoeostasis lubricating joints
cushioning, the nervous system and transporting sound eyesight (Schlink et al., 2010; Gharibi et
al., 2012). Water requirements for goats depends on water requirements for maintenance of normal
water balance and production (NRC, 1981). Normal body water content in goats varies with age,
amount of fat and environmental temperature (NRC, 1981). Unlike sheep and cattle, which largely
depend on free water consumption to meet water requirements, goats obtain water to meet water
requirements from free water consumption and other sources such as water contained in ingested
feed which contain a high water content and metabolic water from oxidation of energy sources
(NRC, 1981; McGregor, 2004).

14
Water intake in goats depends on the dry matter intake, environment temperature and water
(Sileshi et al., 2002). Increasing environmental temperature causes an increase in water intake.
One of the most important determinants of water intake is water quality. Water quality is a measure
of water condition in relation to the requirements of one or more abiotic species (Beede, 2006).
Common factors which are considered when assessing water quality for livestock include
chemical, physical and physiochemical properties; biological agents; excess nutrients; and toxic
compounds (Bagley et al., 1997). Other factors which are considered include assessment of odour
and taste (organoleptic properties), concentration of macro- and micro minerals, hardiness
(calcium and concentrations), sulphate concentrations, nitrate concentrations, pH and microbial
agents (Hooda et al., 2000).
Indicators that are widely used to assess water quality include coliforms, faecal coliforms,
Escherichia coli and enterococci (McAllister and Topp, 2012). If water quality is not monitored
for goats, it can serve as a carrier for physical and biological contaminants which can have a
negative effect on the performance of goats (De Araújo et al., 2010).
Pathogenic organisms which are important biological contaminants of water include bacteria,
fungi and protozoa. Bacteria organisms include E. coli 0157:H7, Campylobacter jejuni (C. jejuni)

15
and Salmonella species. Fungi species include Cryptosporidium, Giardia lamblia, viruses such as
adenovirus-31 types, enteroviruses-71 types androtavirus. Protozoa include Balantidium coli,
Entamoeba histolytica, Giardia lamblia and helminthes such as Ancylostoma duodenale, Ascaris
lumbricoides and Dracunculus medinensis (Hooda et al., 2000; De Araújo et al., 2010).
2.6.1 Factors influencing water quality
2.6.1.1 Salinity
Salinity refers to the measure of salt content levels soil or water. Salinity can be measured as total
dissolved solids (TDS), total soluble salts (TSS) or electrical conductivity (EC). The TDS and TSS
is expressed in parts per millions (ppm) or milligram per litre (mg/L), and EC as reciprocal micro
ohms per centimeter (umhos/cm) or decisiemens per meter (dS/m) (Higgins and Agouridis 2008).
Excessive salinity levels in available surface water are a result of high evaporation rates. High
evaporation rates increases in top soil, which results to increase in salinity levels of surface water.
Tolerance to salinity in goats varies with breed, age, water requirements, season of the year, and
physiological conditions (De Araújo et al., 2010). Salts which are important contributors to salinity
content in water include sodium chloride, magnesium, calcium, sulphates and bicarbonates
(Bargley et al., 1997; Vincent, 2005). Although goats are more adapted to salinity levels above
5000 mg/L but not more than 11000 mg/L (McGregor, 2004), the tolerance of Nguni goats has not

16
been documented. Generally, goats prefer salinity content below 2000 mg/L (Bargley, 1997;
Vincent, 2005).
In goats, acceptability and tolerance to salt content in drinking water varies with season, age, water
requirement, water temperature, humidity, and minerals in water, physiological conditions and
total salt content in the diet (Araújo et al., 2010). Runyan and Bader (1994) reported 4.8 to 6.6 g
TDS/L as the limit salt content in drinking water for ruminants. The same authors also reported
6.6 g TDS/L as a high risk to young animals and 9.6 g TDS/L of salt content in drinking water as
a level which should not be provided to any livestock. McGregor (2004) reported 12.5 g TDS/L
of sodium chloride in drinking water for adult goats as the maximum tolerant level. The same
author also reported 9.5 g TDS/L as the optimum limit of salt content in drinking water for goats
were any water intake has no negative effect on feed intake. Goats drank seawater with 27.5 g
TDS/L and showed no signs of salt poisoning (McGregor, 2004), but reduced productivity.
Abdalla et al. (2013) reported a 36 % decrease in milk yield in adult female Damascus goats which
were fed saline water (6 g TDS/L) compared to goats which were fed fresh water (0.247 g TDS/L).
The same authors reported reduction in goats which were supplied with saline drinking water (6 g
TDS/L) body weight gain compare goats which are supplied with clear clean water.
2.6.1.2 Sedimentation
Another factor which affect water quality include sediments in water bodies, nitrogen and
phosphorus concentration, pathogens (bacterial and protozoan), and oxygen-demanding materials

17
(Strydom et al., 1993; Hooda et al., 2000; Hubbard et al., 2004). Other factors which contribute to
water quality degradation include pesticides such as sheep-dipping chemicals and ethno-veterinary
practices for controlling ticks in cattle (Moyo and Masika, 2009).
Sediments serve as a carrier for pollutants (pathogens, nutrients, and chemicals). Excess dissolved
or suspended sediments also serve as pollutants in lakes and rivers (Hubbard et al., 2004). In
livestock production, sedimatation mainly occurs under conditions of high animal stocking density
associated with trampling due to continuous overgrazing (Kauffman and Krueger, 1984).
Overgrazing causes a reduction in vegetation cover resulting to an increase in soil erosion.
Excessive sediments also result to a decrease in fish biomass and the percentage number of fishes
in the total fish composition.
2.6.1.3 Pathogenic bacteria
Pathogens impair water quality by high levels of faecal coliform bacteria and non-bacterial
infectious agents such as fungi and protozoa (Hooda et al., 2000; Hubbard et al., 2004). Although
faecal coliform bacteria serve as an indicator of faeces contamination, they also help to determine
acceptability for drinking (Hubbard et al., 2004). These pathogenic organisms which are important
biological contaminants of water include E. coli 0157:H7, C. jejuni, Salmonella species, fungi and
protozoa such as Cryptosporidium and Giardia lamblia species.
Cryptosporidium parvum is a protozoan parasite found in surface waters which is thought to
originate from livestock waste. It is host-specific and a major problem to newly born ruminants

18
(de Graaf et al., 1999). Infection occurs through the consumption of water which contains oocysts
previously eliminated with faeces of infected young ruminants (Olson et al., 1997; de Graaf et al.,
1999). It is resistant to most chemicals used during the water treatment process (Hooda et al.,
2000). Hooda et al. (2000) reported the feasibility of oocysts to remain for a time period of at least
140 days. Commonly, C. parvum is the causative agent for cryptosporidiosis. Clinical signs of
cryptosporidiosis include dehydration, weight loss, laziness and depression, anorexia, abdominal
pain, and mainly diarrhoea accompanied by shedding of a large number of oocysts, with yellow
faeces accompanied with unpleasant odour, and death in neonatal ruminants (Hooda et al., 2000;
Noordeen et al., 2012).
Giardia causes water-borne diarrhoeal infections in both humans and animals (Olson et al., 1997).
Infection occurs by the consumption of contaminated water. This organism infects the small
intestine and is then excreted as small cysts in large numbers (Hooda et al., 2000). Infection is
mainly a problem of young farm animals compare to older animals. Cysts for this organism remain
alive in water for 47 days (Hooda et al., 2000).
Salmonella is a water pathogen which causes gastroenteric infections in both humans and livestock
animals (Johnson et al., 2003). Livestock manure is regarded as the main reservoir (Hooda et al.,
2000). This organism is also a major problem to livestock animals compared to humans. Water is
contaminated with this organism through surface run-off after irrigation with infected excreta
through land application (Hutchison et al., 2005).
19
2.6.1.4 Oxygen demanding materials
Oxygen-demanding materials are decomposed organic waste materials in water (Hubbard et al.,
2004). This method of determining the quality of water is, however, used by dairy industries.
Organic matter from these decomposed waste materials serves as a substrate and an energy source
for the survival of bacterial in water. These bacterial organisms utilize dissolved oxygen which is
available in water to provide aerobic conditions (Hooda et al., 2000). Therefore, high levels of
organic matter being discharged increases the rate of oxygen depletion (Hubbard et al., 2004).
These oxygen demanding materials are usually measured by biochemical oxygen demand (BOD)
or chemical oxygen demand (COD) (Hubbard et al., 2004). The BOD measures the content
biologically degradable substances. In this technique, substances are broken-down by micro-
organisms in the presence of oxygen. The COD is technique which indicates the quantity of
pollutants in wastewater which can be oxidized by a chemical oxidant. Reagents which are used
in technique include acid solutions such as potassium dichromate/permanganate at high
temperatures. During the process of this technique, consumption of oxidant provides a measure of
the content of organic substances and is converted to a corresponding quantity of oxygen.
Considering the above-mentioned factors used to assess water quality in drinking water of goats,
drinking water of poor water quality have a negative effect on the performance of goats.

20
2.7 Effect of water quality and breed on water intake
Water quantity in goats depends on factors such as moisture in feeds, surface water such as dew
and rain, physiological status, ambient temperature, taste, and quality. Unlike other types of
livestock species, goats are more sensitive and cautious to the type and quality of water they
consume (NRC, 1981). Goats have a lower water intake compared to other ruminants (Gihad,
1976). Qinisa and Boomker (1998) reported a lower water intake for indigenous Pedi goats
compare to sheep. Ferreira et al. (2002) and Al-Ramamneh et al. (2010) reported a lower water
intake in Boer goats compare to sheep. Although goats have a good water management capacity
compare to other ruminants, however, indigenous goat breeds more adapted and tolerant poor
water qualities when compared to commercial breeds (McGregor, 2004).
2.7.1 Intake of saline drinking water
Intake of saline drinking with high salt content varies with species, breed and environmental
temperature. Baker (1989) reported higher water intake associated with loss in body weight in
goats which drank water with sodium chloride solution after dehydration. Burke (1990) reported
high water intake associated with large volume urine excretion with high salute concentration to
feral goats which drank seawater. The same author reported dry faeces from these goats. Attia-
Ismail et al. (2008) reported increase in water intake for both sheep and goats in response to an
increase in salt levels (8.15 g TDS/L) in drinking water. Goats had lower water intake when
compared to sheep. However, at higher salt level (12.33 g TDS/L) in drinking water, for both
species there was depression in water intake which was an indication that both species are not
tolerant to drinking water which contains salt content higher than 8.15 g TDS/L. McGregor (2004)

21
reported average daily water consumption of saline drinking water with a high salt content to be 4
l/animal/day depending on the environmental temperature. However, under high environmental
temperature conditions, water consumption is expected to increase (Suttle, 2010).
2.7.2 Growth and physiological responses to saline drinking water
Goats which have been fed saline drinking water with a high salt content have a higher water intake
and reduced feed intake (McGregor, 2004). Saline drinking water which has a high salt content,
causes kids to have lower weight gain (11.66 versus 10.66) and weaning weight (116.25 versus
105.72) (Abdalla et al., 2013).
Feed intake depression associated with higher water intakes and body weight loss is a basic method
of measuring the extent at which animals can tolerate saline drinking water with excessive salt
levels (Gihad, 1993; McGregor, 2004). Baker et al. (1989) reported weight loss in goats receiving
saline drinking water after dehydration. Ru et al. (2005) reported an increase in water intake of
Red and Fallow weaner deer at increasing salt levels in drinking water. These observations were
associated with weight loss and feeding depression. Earlier research reports from Attia-Ismail et
al. (2008) reported feeding depression in goats receiving drinking water with salt levels above 8.15
g TDS/L.
Physiological and behavioural mechanisms developed by goats to tolerate drinking water with
excessive salt content levels include the capacity of the kidney to concentrate urine and the ability
22
of the kidney in reducing urinary water loss during dehydration; feeding during cooler times of the
day; increased urinary output; increased water intake and decrease in feed intake; increased rate of
respiration (Gihad et al., 1993). Adaptive mechanism responsible for tolerance to drinking water
with excessive salt levels in goats include reduction of moisture in faeces, increased urine volume
associated with high water intake; and increased sodium potassium adenosine triphosphatase
(NAK ATPase) in the ileum, liver and kidneys (Burke, 1990; McGregor, 2004). Sodium/potassium
ATPase enzyme levels in the liver, ileum and kidneys of goats receiving drinking water with
excessive salt levels is responsible for regulating sodium out of the cells and potassium into the
intracellular space. McGregor (2004) reported the function of this enzyme after four days when
goats were receiving saline drinking water.
2.8 Measures of assessing health status of goats drinking saline water
Early proper diagnosis of salt poisoning is a pre-requisite loss in livestock. Methods which can be
employed in determining health status of goats receiving saline drinking water include feed intake,
water intake, body weight loss, urine output, rectal temperature, respiration rate, sodium/potassium
ATPase enzyme levels in the ilium, frequency of urination, blindness, ataxia (incoordination),
abdominal pain, diarrhoea, excessive thirst, weakness, head pressing and death.
2.8.1 Urine output
The use of urine specific gravity in determining urine volume and health status of livestock has
been reviewed by many authors (McGregor, 2004; Parrah et al., 2013; Jacob et al., 2014). This is
the most important test in urinalysis parameters which is used to assess the function of the kidney.

23
The test measures solute concentration (urine sodium, potassium, urea, and chloride content), urine
density and the capability of the kidney to concentrate or dilute urine over that of plasma. Chemical
properties for this technique are relative to the concentration of sediments by measuring its volume
(Parrah et al., 2013). In addition, since resource-limited communal farmers cannot afford
veterinary costs for diagnosing animals, colour observation of urine could be used as a health status
indicator for goats which are experiencing salt poisoning. Since there is a relationship between
urine colour and the concentration of solutes in urine. On the other hand, other parameters such as
feed and water intake, rectal temperature and respiration rate, and frequency of urination work
hand in hand with specific gravity in determining health status of goats under saline drinking water.
2.8.2 Rectal temperature and respiratory rate
Rectal temperature is a reference guide to the animal’s general health. Although this parameter
used as an indicator for the animal’s general health, however, it need can only be used with other
parameters in order to make conclusions about the health status of the animal. This parameter is
influenced by many factors such as environmental temperature, season, activity and age of the
animal, physiological status, disease and nutrition (Appleman and Delouche, 1958; Goodwin,
1998). In goats, rectal temperature ranges between 38.5 and 39.7℃ (Ayo et al., 1998; Goodwin,
1998).
2.8.3 Frequency of drinking and urination
Frequency of drinking and urination is associated with urine volume output. Under conditions of
saline water availability, goats release a large volume of urine associated with less sweating and

24
moisture content in faeces (McGregor, 2004). Goats excreted excess amount of solutes which are
of higher concentration and which are not desired by the body such as urea at the same time not
releasing any water content from the body through sweating or high moisture content in faeces
(Qinisa and Boomker, 1998; Silanikove, 2000).
2.8.4 Symptoms of salt poisoning
Rapid breathing, blindness, ataxia (incoordination), high temperature, abdominal pain, diarrhoea,
excessive thirst, weakness, head pressing, death are common signs of salt poisoning which is
reported in literature (Bagley, 1997; McGregor, 2004a; Abdalla et al., 2013). The technique could
easily be adopted by resource-limited smallholder farmers under communal farming system in
assessing goats which are negatively affected by saline drinking water.
2.9 Summary of literature review
Goats have the potential to contribute positively to income of resource-limited smallholder
communal farmers under arid and semi-arid environments were water is a scarce resource.
However, goats are constrained by many factors inherent in under these communities. These
constraints include high occurrence of diseases and parasites, and saline drinking water with a high
salt content. The impact of these constraints varies with geographical location, communities, socio-
economic backgrounds of the households and climatic change. Water scarcity associated with an
increase salt content in available surface drinking water is projected to increase which can cause
negative effect on production, growth performance and welfare of livestock including goats. The

25
extent at which indigenous Nguni goats tolerate saline drinking water is unknown, and warrants
investigation.
2.10 References
Abdalla, E. B., Gawish, H. A., El-Sherbiny, A. M., Ibrahim, N. H and El-Hawy, A. S., 2013.
Reproductive Efficiency of Damascus Goats in Salt-Affected Lands in South Sinai, Egypt.
Journal of Animal Science, 9(8): 170-177.
Al-Ramamneh, D., A. Riek and Gerken, M., 2010. Deuterium oxide dilution accurately predicts
water intake in sheep and goats. Animal 4: 1606–1612.
Appleman, R. D and Delouche, J. C., 1958. BEHAVIORAL, PHYSIOLOGICAL AND
BIOCHEMICAL RESPONSES OF GOATS TO TEMPERATURE, 0 ~ TO 40 ~ C.
Journal of Animal Science, 17(2): 326-335.
Assan, N., 2014. Goat production as a mitigation strategy to climate change vulnerability in
semiarid tropics. Scientific Journal of Animal Science, 3(11): 258-267.
Attia-Ismail, S. A., Abdo, A. R and Asker, A. R. T., 2008. Effect of salinity level in drinking water
on feed intake and turnover and rumen function in sheep and goats. Egyptian Journal of
Sheep and Goat Sciences, 3(1): 77-92.
Ayo, J. O., Oladele, S. B., Ngam, S., Fayomi, A and Afolayan, S. B., 1999. Diurnal fluctuations
in rectal temperature of the Red Sokoto goat during the harmattan season. Research in
Veterinary Science, 66(1):7-9.

26
Bagley, C. V., Amacher, J. K and Poe, K. F., 1997. Analysis of Water Quality for Livestock.
Archived USU Extension Publications, Utah State University
(http://digitalcommons.usu.edu/extension_histall/106).
Baker, M. A., 1989. Effects of dehydration and rehydration on thermoregulatory sweating in goats.
Journal of Physiology, 417: 421-435.
Beede, D. K., 2006. Evaluation of water quality and nutrition for dairy cattle. In proceeding 2006
High Plains Dairy Conference, pp 129-154.
Burke, M. G., 1990. Seawater consumption and water economy of tropical feral goats. Biotropica,
22(4): 416-419.
de Araújo, G. G. L., Voltolini, T. V., Chizzotti, M. L., Turco, S. H. N and de Carvalho, F. F. R.,
2010. Water and small ruminant production. Revista Brasileira de Zootecnia, 39: 326-336.
de Graaf, D. C., Vanopdenbosch, E., Ortega-Mora, L. M., Abbassi, H and Peeters, J. E., 1999. A
review of the importance of ctyptosporidiosis in farm animals. International Journal for
Parasitology, 29: 1269-1287.
Du Toit, D. J., 2008. The Indigenous Livestock of Southern Africa.
http://www.damarasheep.co.za/files/ParisRoundtable.pdf (Accessed 28-08-2014)
Ferreira, A.V., Hoffman, L.C., Schoeman, S.J. and Sheridan, R., 2002. Water intake of Boer goats
and Mutton merinos receiving either a low or high energy feedlot diet. Small Ruminant
Research, 43: 245-248.

27
Gharibi, H., Sowlat, H. S., Mahvi, A. H., Mahmoudzadeh, H., Arabalibeik, H., Keshavarz, M.,
Karimzadeh, N and Hassani, G., 2012. Development of a dairy cattle drinking water quality
index (DCWQI) based on fuzzy inference systems. Ecological Indicators, 20: 228-237.
Gihad, E. A., 1976. Intake, digestibility and nitrogen utilization of tropical natural grass hay by
goats and sheep. Journal of Animal Science, 43: 879-883.
Gihad, E. A., 1993. Utilization of high salinity tolerant plants and saline water by desert animals,
In: H. Lieth, A.A. Massoom (Eds.), Towards the rational use of high salinity tolerant plants,
Kluwer Academic Publishers, Netherlands, 1993, p. 443-447.
Goodwin, S. D., 1998. Comparison of Body Temperatures of Goats, Horses, and Sheep Measured
With a Tympanic Infrared Thermometer, an Implantable Microchip Transponder, and a
Rectal Thermometer. Contemporary topics in labolatory animal scince 37(3): 51-55.
Higgins, S. F and Agouridis, C. T., 2008. Drinking Water Quality Guidelines for Cattle. University
of Kentucky Cooperative Extension, 7: 1-4 (www.ca.uky.edu.).
Homann S, van Rooyen A, Moyo T and Nengomasha Z. 2007. Goat production and marketing:
Baseline information for semi-arid Zimbabwe. PO Box 776, Bulawayo, Zimbabwe:
International Crops Research Institute for the Semi-Arid Tropics: 1-84.
Hooda, P. S., Edwards, A. C., Anderson, H. A and Miller, A., 2000. A review of water quality
concerns in livestock farming areas. The Science of the Total Environment, 250:143-167
http://www.indigenousveldgoats.co.za/ (Accessed 26-05-2014).
28
Hubbard, R. K., Newton, G. L and Hill, G. M., 2004. Water quality and grazing animals. Journal
of Animal Science, 82: 255-263.
Hutchison, M. L., Walters, L. D., Avery, S. M., Munro, F and Moore, A., 2005. Analyses of
livestock production, waste storage, and pathogen levels and prevalences in farm manures.
Applied and Environmental Microbiology, 71(3): 1231-1236.
Jacob, C. C., Dervilly-Pinel, G., Biancotto, G and Le Bizec, B., 2014. Evaluation of specific
gravity as normalization strategy for cattle urinary metabolome analysis. Metabolomics,
10: 627-637.
Johnson, J. Y. M., Thomas, J. E., Graham, T. A., Townshend, I., Byrne, J., Selinger, L. B and
Gannon, V. P. J., 2003. Prevalence of Escherichia coli 0157:H7 and Salmonella spp. in
surface waters of southern Alberta and its relation to manure sources. Canadian Journal of
Microbiology, 49: 326-335.
Kauffman, J. B and Krueger, W. C., 1984. Livestock impacts on riparian ecosystems and
streamside management implications. A Review. Journal of Range Management, 37 (5):
430-438.
Kuyamandi Development Services (Pty) Ltd, 2007. GOAT MEAT PRODUCTION Feasibility
Study. Prepared for: Lepelle-Nkumpi Local Municipality. http://www.lepelle-
nkumpi.gov.za/docs/feasibility/GOATS%20FEASIBILITY.pdf (Accessed 15-10-2015).
Lebbie, S. H. B., 2004. Goats under household conditions. Small Ruminant Research, 51: 131-
136.

29
Marume, U., Chimonyo, M and Dzama, K., 2012. Influence of dietary supplementation with
Acacia karroo on experimental haemonchosis in indigenous Xhosa lop-eared goats of
South Africa. Livestock Science, 144: 132–139.
Masika, P. J and Mafu, J. V., 2004. Aspects of goat farming in the communal farming systems of
the central Eastern Cape, South Africa. Small Ruminant Research, 60: 161-164.
Masika, P. J., Mafu, J. V, Goqwana, M. V, Mbuti, C and Raats, J. G., 1998. A comparison of goat
growth performance in a communal and commercial farming system in the central Eastern
Cape Province, South Africa. In: De Bruyn, TD & Scogings, PF (Eds), Communal
rangelands in southern Africa: a synthesis of knowledge. Proceedings of a symposium on
policy-making for the sustainable use of Southern African communal lands. Department of
Livestock and Pasture Science, Alice: University of Fort Hare, 151-158.
McAllister, T. A and Topp, E., 2012. Role of livestock in microbiological contamination of water:
Commonly the blame, but not always the source. Animal Frontiers, 2(2), pp. 17-27.
McGregor, B. A., 2004. Water quality and provision for goats. A report for the Rural Industries
Research and Development Corporation. RIRDC Publication No. 04/036. Rural
Industries Research and Development Corporation, Canberra.
Meyer, J. A and Casey, N. H., 2004. Exposure assessment of potentially toxic trace elements in
indigenous goats in the rural communal production systems of the northern region of South
Africa. South African Journal of Animal Science, 34(1): 219-222.

30
Mhlongo, F., 2015. ‘KZN livestock losses due to drought’, SABC NEWS 20 October. Available
from: http://www.sabc.co.za/news/a/559663804a476dc0b0adfb6d39fe9e0c/KZN-
livestock--continues-to-die-due-to-drought-20152010 (20 October 2015).
Moyo, B and Masika, P. J., 2009. Tick control methods used by resource-limited farmers and the
effect of ticks on cattle in rural areas of the Eastern Cape Province, South Africa. Tropical
Animal Health and Production, 41: 517-523.
Noordeen, F., Rajapakse, R. P. V. J., Horadagoda, N. U., Abdul-Careem, M. F and Arulkanthan,
A., 2012. Cryptosporidium, an important enteric pathogen in goats – A review. Small
Ruminant Research, 106: 77-82.
NRC, 1981. Nutrient Requirements of Goats: Angora, Dairy and Meat Goats in Temperate and
Tropical Countries. National Academy Press, Washington D.C.
Olson, M. E., Thorlakson, C. L., Deselliers, L., Morck, D. W and McAllister, T. A., 1997. Giardia
and Cryptosporidium in Canadian farm animals. Veterinary Parasitology, 68: 375-381.
Parrah, J. D., Moulvi, B. A., Mohsin, A., Gazi, M. D., Makhdoomi, H., Din, M. U., Dar, S and
Mir, A. Q., 2013. Importance of Urinalysis in Veterinary Practice – A review. Veterinary
World 6(9): 640-646.
Peacock, C., 2005. Goat-A pathway out of poverty. Small Ruminant Research, 60:179-186
Qinisa, M. M and Boomker, E. A., 1998. Feed selection and water intake indigenous goat wether
under stall-feeding conditions. South African Journal of Animal Science, 28(3/4): 173-178.
31
Roets, M and Kirsten, J. F., 2005. Commercialization of goat production in South Africa. Small
Ruminant Research, 60: 187-196.
Ru, Y., Glatz, P. C and Bao, Y. M., 2005. Effect of salt level in water on feed intake and growth
rate of Red and fallow-Weaner Deer. Asian-Australasian Journal of Animal Science, 18(1):
32-37.
Rumosa Gwaze, F., Chimonyo, M and Dzama, K., 2009a. Communal goat production in Southern
Africa: a review. Tropical Animal Health and Production, 41: 1157-1168.
Rumosa Gwaze, F., Chimonyo, M and Dzama, K., 2009b. Variation in the functions of village
goats in Zimbabwe and South Africa. Tropical Animal Health and Production, 41: 1381-
1391.
Runyan, C and Bader, J., 1994. Water quality for livestock and poultry. In: Water quality for
agriculture. Rome: FAO, 186p. (Irrigation and Drainage Papers, 29).
Schlink, A. C., Nguyen, M. –L and Viljoen, G. J., 2010. Water requirements for livestock
production: a global perspective. Scientific and Technical Review of the Office
International des Epizooties, 29(3): 603-619.
Sebei. P. J., McCrindle, C. M. E and Webb, E. C., 2004. An economic analysis of communal goat
production. Journal of the South African Veterinary Association, 75(1): 19–23.
Silanikove, N., 2000. The physiological basis of adaptation in goats to harsh environments. Small
Ruminant Research, 35: 181-193.
32
Sileshi, Z., Tegegne Tekle, A and Tsadik, G., 2002. Water resources for livestock in Ethiopia:
Implications for research and development. In: International Workshop Proceedings:
Ethiopian Ministry of Water Resources/ Ethiopian Agricultural Research Organization/
International Water Management Institute/International Livestock Research Institute,
Addis Ababa, Ethiopia: pp 66-79.
Slayi, M., Maphosa, V., Fayemi, O. P and Mapfumo, M., 2014. Farmers’ perceptions of goat kid
mortality under communal farming in Eastern Cape, South Africa. Tropical Animal Health
and Production, 46: 1209-1215.
Snyman, M.A., 2014. South African goat breeds: Indigenous veld goat. Info-pack ref. 2014/004.
Grootfontein Agricultural Development Institute.
Strydom, J. P., Mostert, J. F and Britz, T. J., 1993. Effluent production and disposal in the South
African dairy industry: A postal survey. Water SA, 19 (3): 253-258.
Suttle, N. F., 2010. Mineral nutrition of livestock. 4th edition. Wallingford, CABI Publishing.
Tshabalala, P., 2000. Meat quality of South African indigenous goat and sheep breeds. MSc thesis,
University of Pretoria, Pretoria, South Africa.
Turton, J., 2004. Tick-borne diseases in ruminants. National Department of Agriculture,
Directorate Communication. http://www.elsenburg.com/info/nda/tick-borne_diseases.pdf
(Accessed 21-10-2014).
33
Van Niekerk, W. A and Pimentel, P. L., 2004. Goat production in the smallholder section in the
Boane district in Southern Mozambique. South African Journal of Animal Science, 34(1):
123-125.
Vincent, B. 2005. Farming meat goats: breeding, production and marketing. Collingwood, VIC,
Australia: Landlinks Press.
34
Chapter 3: Factors influencing water scarcity for goats in resource-limited communal
farming environments
Abstract
The objective of the current study was to compare factors influencing water scarcity for goats in
areas where there are seasonal and perennial rivers under resource-limited communal farming
environments. Data were collected using structured questionnaire (n = 285) administered randomly
to smallholder goat farmers from areas where there are seasonal rivers and perennial rivers.
Ceremonies were ranked as the major reason for keeping goats. Water scarcity was ranked as the
major constraint to goat production in areas where there are seasonal rivers when compared to
their counterparts (P < 0.05). Dams were ranked higher as a water source for goat drinking in areas
where there are seasonal river systems compare to rivers which was ranked higher in areas where
there are perennial river systems during the rainy season. Rivers were ranked higher as a water
source for goat drinking in both areas where there are seasonal and perennial river systems during
the cool dry season. About 8 and 26 % of the elderly respondents reported that over the past 30
years, the river that are seasonal used to be perennial flow. Households located close (≤ 3 km) to
the nearest water source and areas where there are seasonal rivers reported drinking water for goats
a scarce resource compare to those located far (> 3km) from the nearest water source and located
in areas where there was perennial rivers. Negative effects of climate change associated with
drought conditions increased incidences of dry spells during the rainy seasons and short season
varieties. It was concluded that river systems, seasonal water sources, distance from the nearest
water source, and negative effects of climate change associated with drought conditions were
35
major factors which influenced water scarcity for goats in resource-limited communal farming
environments. Although farmers did not regard water quality as a factor which causes water
scarcity, however, water quality is an attribute which affects livestock.
Keywords: seasonal rivers; perennial rivers; water sources; droughts.
3.1 Introduction
Amongst resource-limited farmers, goats are ranked second as the main sources of income (Masika
and Mafu, 2004, Delali et al., 2006). Resource-limited farmers mainly keep goats for slaughter
during traditional ceremonies, and to a lesser extent for milk, manure, skins, cashmere and mohair
(Masika and Mafu, 2004; Rumosa Gwaze et al., 2009). Goats contribute to household economy
helping maintain output for crop production by using its manure and urine as a free organic
fertiliser (Lebbie, 2004). Socio-economic and cultural value of goats, however, varies between
communities (Mahanjana and Cronje, 2000).
River systems which forms main rivers that are used by resource-limited farmers for crop
irrigation, drinking water for humans and livestock are a combination of many water sources such
as underground springs, run-off from rain, snowmelt, and glacial melt to form the main river. Main
rivers are mainly divided to seasonal and perennial rivers. Seasonal rivers are dependent on rainfall
and only flow during the rainy seasons. Perennial rivers contain water throughout the year.

36
Common constraints to goat production and productivity under smallholder resource limited
communal systems include high prevalence of diseases and parasite, poor management, limited
available forage, and poor marketing management (Rumosa Gwaze et al., 2009; Slayi et al., 2014).
Although water scarcity is hardly reported as a constraint to goat production and productivity in
communal farming systems, it is increasingly becoming a huge challenge, particularly in the face
of climate change. For example, in 2015, the KwaZulu-Natal province of South Africa was
declared a water scarce province. Reduced water levels in dams, drying of rivers due to drought
caused by prolonged dry seasons were evident (Chabalala, 2015). These drought conditions
negatively affect rural communities which results in water shortages for both livestock and
humans. These drought conditions increase livestock mortality (Mhlongo, 2015). Some
commercial farmers which are severely affected by these drought conditions have resorted to
purchasing water for their livestock or destocking (Pieterse, 2015).
Water scarcity for goats under communal resource-limited farming systems has important
consequences on herd management, feeding strategy and flock health. Much attention is put on
cattle and other intensively managed livestock. Little effort is placed on goats since they are
considered to be resilient to water shortage. To improve goat production and productivity for
smallholder farmers in communal farming systems, better understanding is needed on factors
influencing water scarcity for goats. Therefore, the objective of the current study was to compare
factors influencing water scarcity for goats in areas where there are seasonal and perennial rivers
37
under resource-limited communal farming environments. It was hypothesized that factors which
causes water scarcity for goats was lower for households with access to perennial river systems
than those without.
3.2 Material and methods
3.2.1 Description of study site
The study was conducted at KwaNongoma (27° 53′S 31° 38′E) in northern KwaZulu-Natal, South
Africa under Nongoma local municipality, Zululand district municipality. Nongoma is
characterized by mountainous areas with a topography that varies with deep ravines and high cliffs.
Classification of regions from the study site was based on types of river systems. Seasonal rivers
only had water during the rainy seasons for November to February and they become dry during
dry seasons. Perennial rivers had water available throughout the year. Perennial river systems from
the study site include Ivuna River, Black Mfolozi River and Mona. Bululwane, Manzimakhulu,
White-Sizilinda, Mngeni, Mseba, Entwani, and Wela rivers. Were seasonal river systems which
provided water for both humans and livestock.
The average annual rainfall in northern drier parts were there are seasonal river systems is < 600
mm, and between 800 and 1000 in wet areas where there are perennial river systems. Rain falls
between November and February (Mpanza, 1996). However, the highest rainfall recorded is during
mid-December and lowest rainfall recorded in July. The average maximum and minimum mean
annual temperatures are 29 ℃ and 7.4 ℃, respectively. Highest temperature is recorded in January

38
and lowest temperature recorded in June. Vegetation is mainly characterised with Zululand
thornveld, and northern tall grassland.
Apart from keeping goats, farmers from both regions also reared cattle and chickens. All grazing
animals grazed on communally owned land and are kept in kraals at night. Most farmers in areas
where there are perennial rivers herded their goats while most farmers in areas where there are
seasonal rivers practiced free grazing system were goats are allowed to graze and browse freely.
3.2.2 Household selection and data collection
Selection of the study site was based on the fact that water is a scarce resource for both humans
and livestock drinking (Savides, 2015). Selection of participants for the study was based on goat
ownership, distance to the water source which is used by goats for water drinking and the use of
either seasonal or perennial rivers as a water source for drinking.
Selection of households that kept goats was done with the assistance of local farmers association,
local traditional leaders (chiefs and chief advisors) and extension officers from the Department of
Agriculture officials. Villages from each area were selected randomly. Selection of households
from each village was done based on goat ownership, a household with a minimum of 10 goats
and the willing to participate in the study was interviewed. Goats from each household which was
interviewed include kids, bucks and does. Secondary informants were elderly members of each

39
community which assisted with data collection on historical availability of water for livestock,
particularly during the long dry seasons. The elderly members were those with at least 60 years of
age.
A total of 285 household goat owners were interviewed in July 2014. These farmers were from
nine villages in areas where there are seasonal rivers, and 10 villages from areas where there were
perennial rivers. An estimate of 186 household goat owners from areas where there seasonal rivers
and 99 farmers from areas where there are perennial rivers were interviewed using a semi-
structured questionnaire (see Appendix 1). Questionnaires were translated in vernacular isiZulu
language to improve the quality of responses from farmer when responding from questions and
also to improve the quality of data capture. Household heads, goat keepers, and elderly members
of the communities were targeted for the interviews. Secondary data about livestock species kept,
water sources and water availability comparison for the past 30 years were obtained from key
informants who were elderly members of each village and agricultural extension officers. Transect
walks were conducted for each village in grazing areas and different water sources for personal
observations vegetation grazed and browsed and water availability for goats drinking. Five trained
enumerators administered the questionnaires.
Aspects covered in the questionnaire included household demographic, goat production, water
accessibility and quality.

40
Ethical clearance (HSS/0287/014M)) for the study was granted by the University of KwaZulu-
Natal (Appendix 2).
3.2.3 Statistical analyses
All data were analysed using SAS (2010). General linear model was used to determine household
size and flock/herd sizes of different livestock species kept. Mean rank scores for reasons of
keeping goats, goat production constraints and water sources for goats were determined using a
general linear models (GLM) SAS (2010). Chi-square tests of association were computed for goat
production constraints and comparison of river flow during the dry seasons over the past 30 years.
An ordinal logistic regression (PROC LOGISTIC) was used to determine factors associated with
households experiencing water scarcity. The results were interpreted for age, gender, river systems
(seasonal and perennial rivers systems), production system (extensive and semi-intensive), goat
flock size, distance from the water source, and water quality assessment. The logistic regression
model is:
𝐿𝑜𝑔𝑖𝑡(𝑃𝑖) = 𝐿𝑜𝑔 [𝑃𝑖
1−𝑃𝑖] = 𝛽0 + 𝛽1𝑋𝑖1 + ⋯ + 𝛽𝑡𝑋𝑖𝑡 ...equation 1
𝑃 (𝑌𝑖 = 1) = 𝐸𝑋𝑃 (𝛽0+ 𝛽1𝑋𝑖1+⋯+ 𝛽𝑡𝑋𝑖𝑡)
1+ 𝐸𝑋𝑃 (𝛽0+ 𝛽1𝑋𝑖1+⋯+ 𝛽𝑡𝑋𝑖𝑡) …equation 2
Where i=1, 2,.., n and n is the sample size. Estimate 𝛽0 is the model intercept and 𝛽𝑗(𝑗 = 1, 2, … , 𝑡)
where t is the number of predictors in the model.
𝑃𝑖 = probability of a household experiencing water scarcity;
41
[𝑃𝑖/1 − 𝑃𝑖] = odds of a household experiencing water scarcity.
3.3 Results
3.3.1 Household demography
No differences were detected in the household demographics, flock and herd sizes among the
communities. Details of gender, age, level of education, household size and are shown in Table
3.1. More than 49 % of households were composed of youth. Elderly members of each community
were household members more of than 60 years of age. More than 60 % of households are headed
by males. The level of literacy was low since less than 3 % of respondents had formal education.
Average household size was 8. Average herd/flock size was 11, 14, 1, and 17 for cattle, goats,
sheep and chickens, respectively. Goats contributed to household income by selling live animals
and making traditional clothes which were sold to local people. Pigs, donkeys, peacocks, geese,
and ducks contributed little to household income.
Grazing areas was shared by farmers. Transect walks revealed that grazing areas where water
sources which are used by goats for drinking were about 3 km away from the nearest household.
Water sources which were used by goats were also used by humans for drinking. Rangeland sizes
were large, however, they were in poor condition. Dominant vegetation and plant species were
desert succulent plants with thorns, sourveld, and lowveld.

42
More than 50 % of the heads of household depended on social grants from the government (Table
3.1) which was R16 200 per annum for the elderly and R3 840 for child support. Other sources of
income such as salary, livestock and livestock products, vegetables and crops, all contributed lesser
extent to household income. Other sources of income were ploughing for neighbours and taxi
driving. Household demographic characteristics were similar between households with access to
perennial rivers and those without.
3.3.2 Roles and functions of goats
Table 3.2 shows rankings for major purposes of keeping goats. Rankings were similar between the
two communities. Traditional ceremonies was the major purpose of keeping goats followed by
sales of lives animals. Traditional ceremonies are common practices are a set of beliefs performed
in celebrating a particular event. In the context of African traditional religion, the amaZulu tribal
group use goats when communicating with their ancestors. Goats are slaughtered first before
proceeding with any activities of the ceremony.
3.3.3 Constraints to goat production
Ranking of goat related constraints varied across both areas where there were seasonal and
perennial rivers (Table 3.3). High prevalence of diseases and gastrointestinal parasites were ranked
first and second most important constraints to goat production in areas where there are seasonal
and perennial rivers, respectively. There was a difference (P < 0.05) in water scarcity and livestock

43
Table 3.2: Socio-economic profiles, least square means (± SE) herd/flock sizes of different livestock species kept per household and household size
Gender Males (%) 67.4 Females (%) 32.7 Age group < 30 years (%) 28.1 30 – 60 years (%) 49.1 More than 60 years (%) 22.8 Household size 8.1 ± 0.33 Highest education No education (%) 30.8 7 years of education (%) 39.0 12 years of education (%) 28.0 Tertiary education (%) 2.2 Household income Crops (%) 5.0 Livestock sales (%) 11.6 Livestock products (%) 7.4 Salary (%) 16.0 Government old age and social grant (%) 50.7 Other (%) 9.2 Livestock species Cattle 11.5 ± 1.40 Goats 14.5 ± 1.23 Sheep 1.8 ± 0.67 Chickens 17.2 ± 1.85 Pigs 0.3 ± 0.12 Donkeys 0.2 ± 0.16 Peacock 0.1 ± 0.03 Geese 0.3 ± 0.07 Ducks 0.1 ± 0.08

44
Table 3.2: Ranking of the reasons for keeping goats
Goat use Rank
Meat 3 (2.17)
Milk 4 (2.33)
Manure 6 (3.23)
Skin 7 (3.37)
Sales (live goats) 2 (2.06)
Investments 5 (2.52)
Ceremonies 1 (1.61)
Gifts 8 (4.43)
1The lower the mean ranked score (rank) of a use the greater its use.
Values in parentheses indicates means ranks

45
thefts as constraints to goat production. Water scarcity was ranked third in areas where there were
seasonal rivers compare to fifth ranking in areas where there are perennial rivers. Goat thefts were
ranked fourth in areas where there are seasonal rivers compare to sixth ranking in areas where
there are perennial rivers.
3.3.4 Water sources for goats
Ranking of common water sources which contributes to water drinking for goats are shown in
Table 3.4. Boreholes were generally ranked higher for both areas where there are seasonal and
perennial rivers during the rainy season compare to the cool dry season. In areas where there are
seasonal rivers, usage of boreholes was higher during the cool dry season when compared to the
rainy season. However, contribution of boreholes as a water source for goats were higher in areas
where there are perennial rivers (P < 0.001) during the rainy season when compared to areas where
there are seasonal rivers. Contribution of dams as a water source for goats was higher in areas
where there are seasonal rivers during the rainy season compare to the cool dry season (P < 0.001).
When compared to areas where there are perennial rivers in the rainy season, dams had a higher
contribution as a water source for water drinking of goats in areas where there are seasonal rivers
(P < 0.001). The use of rivers as a water source was higher in areas where there are perennial rivers
in the cool dry season compare to areas which has seasonal rivers.

46
Table 3.3: Goat production constraints faced by communal goat farmers in KwaNongoma, KwaZulu-Natal, South Africa
Constraint River systems Significance
Seasonal Perennial
Water scarcity 3 (1.57) 5 (1.73) *
Feed shortages 5 (1.64) 4 (1.69) NS
Ecto-parasites 6 (1.65) 3 (1.54) NS
Gastrointestinal parasites 2 (1.53) 1 (1.48) NS
Diseases 1 (1.43) 2 (1.48) NS
Thefts 4 (1.61) 6 (1.77) *
Predators 7 (1.94) 7 (1.94) NS
The lower the rank (mean rank score) of a constraint, the greater its importance
Values in parenthesis indicates means for ranks
*p<0.05; NS: Not significant (p>0.05).

47
Table 3.4: Ranking of water sources for goats during the rainy and cool dry season
Water source Rainy season Cool dry season Significance
Seasonal Perennial Seasonal Perennial
Boreholes 5 (1.96) 5 (1.73) 4 (1.87) 4 (1.80) ***
Dams 1 (1.26) 2 (1.56) 3 (1.80) 2 (1.72) ***
River 2 (1.27) 1 (1.23) 1 (1.69) 1 (1.46) ***
Springs 4 (1.62) 4 (1.60) 2 (1.77) 3 (1.80) NS
Rainwater 3 (1.61) 3 (1.59) 5 (1.96) 5 (1.90) *
The lower the rank (mean rank score), the greater its importance
Values in parenthesis indicates means for ranks
*p < 0.05; **p < 0.01; ***p < 0.001; NS: Not significant (p > 0.05)

48
The contribution of rivers as a water source for goats was higher in areas where there are seasonal
rivers during the rainy season compare to the cool dry season in the same area. When compared to
areas which has perennial rivers, rivers had a higher contribution as a water source for water
drinking of goats in areas where there are perennial rivers (P < 0.001) during the rainy season.
Although rivers were of same ranking level as a water source for water drinking in goats during
the cool dry season in areas where there are seasonal and perennial rivers, however, the use of
rivers was higher in areas where there are perennial rivers (P < 0.001) compared to areas where
there are seasonal rivers.
In areas where there are seasonal rivers, rainwater generally had a greater use as a water source for
water drinking in goats during the rainy season when compared to the cool dry season. Rainwater
was of greater use in areas where there are perennial rivers during the rainy season when compared
to areas where there are seasonal rivers. In areas where there are perennial rivers (P < 0.05), the
use of rainwater as a water source for water drinking in goats was higher compare to areas where
there are seasonal rivers during the cool dry season.
3.3.5 Odds ratio estimates for farmers experiencing water scarcity
The odds for occurrence of water scarcity in goats are shown in Table 3.5. The probability of goats
experiencing water scarcity in areas where there were seasonal rivers (P < 0.05) were 10.95 higher
compare to goats which were in areas where there were perennial rivers. Goats which were owned
by households located close (≤ 3 km) to the nearest water sources which were used by goats were

49
2.52 more likely to report water scarcity for goats compare to goats which were owned by
households located far (> 3 km) from the nearest water sources (P < 0.05).
3.3.6 Comparing the flow of rivers during dry seasons over the past 30 years
Possible changes in climate change and its impact on availability of water for goats over the past
30 years sought from the elderly members of the community. Secondary informants reported more
than 8 % of perennial rivers which changed to seasonal rivers over the past 30 years in areas where
there are seasonal river systems. In areas where there perennial river systems, respondents reported
more than 26 % changes in perennial rivers to seasonal rivers over the past 30 years. More than 58
% of secondary informants also reported a decrease in the length of the rainy season. 35 % of these
respondents also reported increased frequencies of dry spells during the rainy season. More than
70 % of these respondents also reported an increase in short season varieties and the use of drought
resistant crops such as sorghum and millet.
3.4 Discussion
The observed chicken flock sizes which were higher than goat flock sizes followed by cattle herds,
respectively agree with Ncobela (2014). The mean flock size of 15 goats per household agrees
with the previous findings of Mahanjana and Cronje (2000). Similarities in goat flock sizes per
household between the two areas where there are seasonal and perennial rivers explain the
tolerance of goats to harsh environmental conditions were water is a scarce resource. These
adaptation mechanisms of goats were explained earlier (Silanikove, 2000; Alexandre and
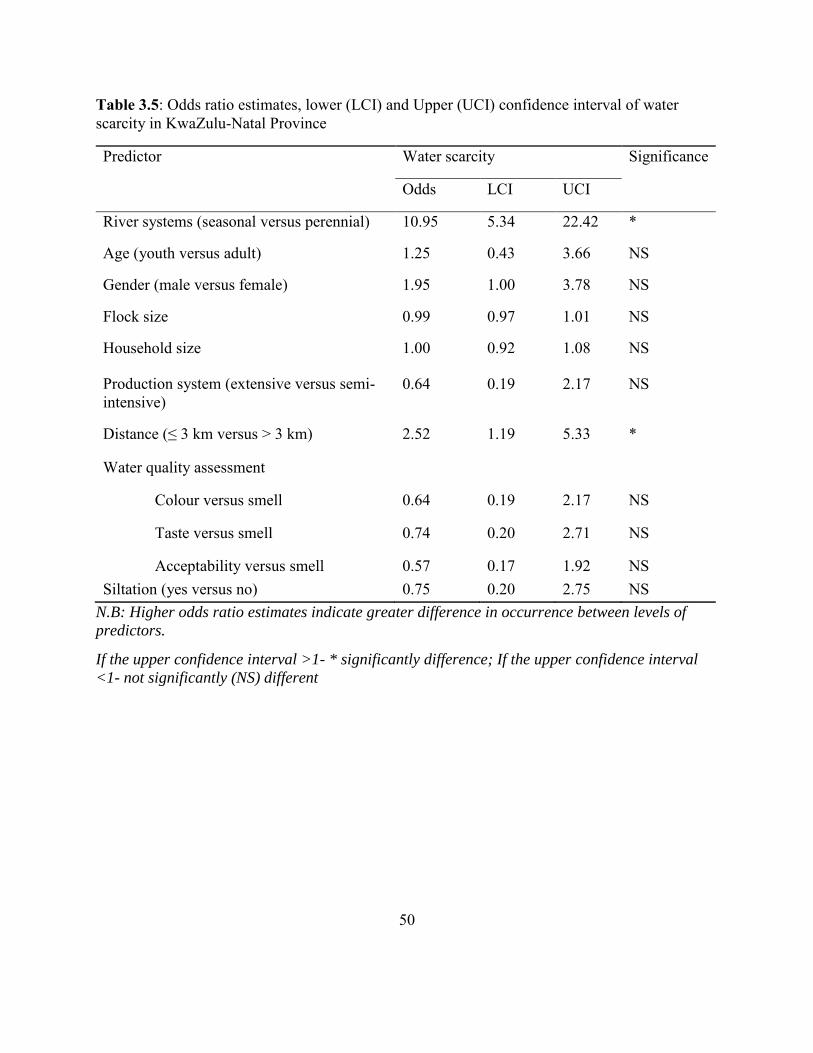
50
Table 3.5: Odds ratio estimates, lower (LCI) and Upper (UCI) confidence interval of water scarcity in KwaZulu-Natal Province
Predictor Water scarcity Significance
Odds LCI UCI
River systems (seasonal versus perennial) 10.95 5.34 22.42 *
Age (youth versus adult) 1.25 0.43 3.66 NS
Gender (male versus female) 1.95 1.00 3.78 NS
Flock size 0.99 0.97 1.01 NS
Household size 1.00 0.92 1.08 NS
Production system (extensive versus semi-intensive)
0.64 0.19 2.17 NS
Distance (≤ 3 km versus > 3 km) 2.52 1.19 5.33 *
Water quality assessment
Colour versus smell 0.64 0.19 2.17 NS
Taste versus smell 0.74 0.20 2.71 NS
Acceptability versus smell 0.57 0.17 1.92 NS Siltation (yes versus no) 0.75 0.20 2.75 NS
N.B: Higher odds ratio estimates indicate greater difference in occurrence between levels of
predictors.
If the upper confidence interval >1- * significantly difference; If the upper confidence interval
<1- not significantly (NS) different

51
Mandonnet, 2005). The observation that most farmers receive government grants reveal that
household income is low. These findings also reveal that most farmers who keep goats as part
of their livestock do afford to purchase water and subsidize goats from local suppliers in areas
where there are seasonal rivers especially during the seasons when water in not available from
common water sources.
The findings that major reasons for keeping goats were to perform traditional ceremonies, meat
and sale of live animals was also reported earlier (Mahanjana and Cronje, 2000; Masika and
Mafu, 2004; Rumosa Gwaze et al., 2009b). This means that function of goats are similar with
communities. Traditional ceremonies are common practices which are a set of beliefs
performed in celebrating a particular event. The observation that farmers use goats for
performing ritual ceremonies explains the importance of goats to rural communal farmers in
any sociocultural activities.
The findings that diseases, gastrointestinal parasites and water scarcity were the major
constraints to goat production were reported earlier (Slayi et al., 2014; Al-Khaza’leh et al.,
2015). Resource-limited farmers in most communal production systems do not treat against
diseases and gastrointestinal parasites, instead they expect goats to be hardy. Another reason
to this could be the fact that areas where there are perennial rivers have climatic conditions
which provides moisture that favours egg incubation, growth of ticks and gastrointestinal
parasites especially during the rainy seasons since earlier onset of spring and warmer winters
allow some parasites and pathogens to strive (Ragab and Prudhomme, 2002). Water scarcity
could be most likely be influenced by climatic conditions and decrease in rainfall frequency
which results in drought conditions (Pereira et al., 2002). Areas which have seasonal rivers are
more prone to droughts when rainfall frequencies decrease. However, this results in available
water becoming dry from available water sources which are used mainly by goats for drinking.

52
The observed use of boreholes as a water source for goats in both areas where there are seasonal
and perennial rivers for both rainy and cool dry seasons, marks the contribution of boreholes
as an alternative water source for goats when water is not available in other available water
sources. Greater use of this water source during the cool dry season in areas where there are
perennial rivers marks the availability of water in these areas. Greater use of dams as the major
water source for goats in areas where there are seasonal rivers during the rainy season
highlights the reliance of goats for these households. Greater use of rivers in both seasons for
both areas where there are seasonal and perennial rivers marks the importance of this water
source to goats for water drinking. Greater reliance on rivers during the cool dry season was in
areas where there perennial rivers. Greater reliance on rivers when compared to other water
sources in areas where there are seasonal rivers during the cool dry season could be influenced
by the fact that other water sources are becoming dry. Greater use of rainwater as alternative
water source for goats in areas where there are perennial rivers during the dry season indicates
that water for goat drinking is freely available in these areas.
The observation that more than 8 and 26 % of perennial rivers which converted to seasonal
rivers in areas where there are seasonal and perennial river systems respectively, shows that
climate change could have had a negative effect to available water sources which are used by
goats for water drinking. Conversional of rivers from perennial to seasonal indirectly agree
with predictions of Ragab and Prudhomme (2002) who predicted an annual rainfall decrease
for Southern Africa of between 5 and 15 %, especially in regions where there are arid and semi-
arid climatic conditions. Negative effects of climate change and environmental factors have
been reported to a decrease in body weight of goats over time (Mason et al., 2014). Although

53
limited evidence has been shown on the effect of climate and change on a decrease in body size
Nguni goats over time, small body size of Nguni goats could also be influenced by reduced
water availability for drinking, increase environmental temperatures influenced by climate
change which could results to a reduced forage quality in available. However, this reduces the
ability of energy stored reserves for growth.
Decrease in the length of the rainy season, increase frequencies of dry spells during the rainy
season and short season varieties reveal the negative effect of climate change on seasonal
distribution and inter-annual variability of rainfall. Short rainy season associated with less
rainfall and increase in evaporation rates causes a decrease in available water for drinking in
water source. This results in water shortages. The use of drought resistant crops such as
sorghum and millet is evidence that water is a scarce resource for goats during the rainy
seasons.
The findings that seasonal rivers had a higher probability of causing water scarcity for goats
agree with the findings that areas where there are seasonal river systems, storage water sources
were the most dominant water source used by goats in both rainy and dry seasons. These
findings also agree with the findings influenced by negative effects of prolonged drought
conditions in the conversion of perennial rivers to seasonal rivers which are water source used
by goats. Despite the fact that farmers did not regard water quality as a factor which causes
water scarcity, water is an attribute which affects livestock.
The findings that farmers which reported water scarcity for goats were located close the nearest
water sources implies that water sources located to households which are used by goats are
more progressively becoming worse and while those located far from households are being

54
under-used. This could also be influenced by a competition that exist between humans and
goats for available water in available water sources. As a result, goats walk long distances
searching for water in order to survive conditions of water scarcity.
3.5 Conclusions
Boreholes, dams, rivers and rainwater were the most preferred water sources for water drinking
in goats. Dams were ranked as the most highly used water source for water drinking in goats
in areas where there are seasonal rivers compare to areas where there are perennial rivers were
rivers were ranked as the most commonly used water source during the rainy season. Rivers
where ranked the most commonly used water source for goat drinking in both areas where there
are seasonal and perennial rivers during the cool-dry season. Water scarcity was higher in areas
where there are seasonal rivers compare to areas where there as perennial rivers. Decrease in
the length of the rainy season, increased frequencies of dry spells during the rainy season and
increase in short season varieties caused water shortage for goats. It was concluded that river
systems, and the distance from the nearest water source were major factors which influenced
water scarcity for goats in resource-limited communal farming environments. Since water
scarcity is associated with an increase in salinity of surface water bodies, it is important to
investigate the extent to which the indigenous Nguni goats can tolerate drinking saline water.

55
3.6 References
Alexandre, G and Mandonnet, N., 2005. Goat meat production in harsh environments. Small
Ruminant Research, 60: 55-66.
Al-Khaza’leh, J. M., Reiber, C., Al Baqain, R and Zárate, A. V., 2015. Drinking water sources,
availability, quality, access and utilization for goats in the Karak Governorate, Jordan.
Tropical Animal Health and Production, 47: 163-169.
Chabalala, J., 2015. More drought aid for KZN as shortages grip the country, News24.
Available from: http://www.news24.com/SouthAfrica/News/More-drought-aid-for-
KZN-as-shortages-grip-the-country-20151101 (01 November 2015).
Delali, B. K., Dovie, D. B. K., Charlie, M., Shackleton, C. M and Witkowski, E. T. F., 2006.
Valuation of communal area livestock benefits, rural livelihoods and related policy
issues. Land Use Policy, 23: 260-271.
Lebbie, S. H. B., 2004. Goats under household conditions. Small Ruminant Research, 51: 131-
136.
Mahanjana, A. M and Cronje, P. B., 2000. Factors affecting goat production in a communal
farming system in the Eastern Cape region of South Africa. South African Journal of
Animal Science, 30(2): 149-154.
Masika, P. J and Mafu, J. V., 2004. Aspects of goat farming in the communal farming systems
of the central Eastern Cape, South Africa. Small Ruminant Research, 52: 161-164.
Mason, T. H. E., Apollonio, M., Chirichella, R., Willis, S. G and Stephens, P. A., 2014.
Environmental change and long-term body mass declines in an alpine mammal.
Frontiers in Zoology, 11 (69): 1-13.

56
Mhlongo, F., 2015. ‘KZN livestock losses due to drought’, SABC NEWS 20 October.
Available from:
http://www.sabc.co.za/news/a/559663804a476dc0b0adfb6d39fe9e0c/KZN-livestock--
continues-to-die-due-to-drought-20152010 (20 October 2015).
Mpanza, S. M., 1996. The relationship between poverty and rural land use in Nongoma. MSc
Thesis, University of Zululand, Empangeni, South Africa.
Nardone, A., Ronchi, B., Lacetera, N., Ranieri, M. S., Bernabucci, U., 2010. Effects of climate
changes on animal production and sustainability of livestock systems. Livestock
Science, 130: 57-69.
Ncobela, N. C., 2014. Nutritional quality of protein-rich feed resources for scavenging
chickens. MSc Thesis, University of KwaZulu-Natal, Pietermaritzburg, South Africa.
Pereira, L. S., Cordery, I and Iacovides, I., 2002. Coping with water scarcity. International
Hydrological Programme. Technical Documents in Hydrology, No. 58, UNESCO,
Paris: 31-32.
Pieterse, C., 2015. KZN farmers battle to keep their livestock alive as drought worsens,
News24. Available from: http://www.news24.com/SouthAfrica/News/KZN-farmers-
battle-to-keep-their-livestock-alive-as-drought-worsens-20151103 (04 November
2015).
Ragab, R and Prudhomme, C., 2002. Climate change and water resources management in arid
and semi-arid regions: prospective and challenges for the 21st century. Biosystems
Engineering, 81(1): 3-34.
Rumosa Gwaze, F., Chimonyo, M and Dzama, K., 2009. Communal goat production in
Southern Africa: a review. Tropical Animal Health and Production, 41: 1157-1168.

57
SAS, 2010. Statistical Analysis System user`s Guide, Version 9.3. SAS Institute Inc. Cary,
North Carolina, USA.
Savides, M., 2015. Dams in KZN dry up: Not a drop to drink in Nongoma. The Times, pp 5.
Silanikove, N., 2000. The physiological basis of adaptation in goats to harsh environments.
Small Ruminant Research, 35: 181-193.
Slayi, M., Maphosa, V., Fayemi, O. P and Mapfumo, L., 2014. Farmers’ perceptions of kid
mortality under communal farming in Eastern cape, South Africa. Tropical Animal
Health and Production, 46: 1209-1215.
58
Chapter 4: Effects of drinking saline water on growth performance and physiological
responses in Nguni goats
Abstract
The objective of the current study was to assess the extent to which Nguni goats can tolerate
drinking saline water. Average daily feed intake (ADFI), average daily water intake (ADWI),
average daily gain (ADG) and physiological parameters were monitored. Thirty six clinically
healthy non-lactating Nguni goats with an average body weight of 19.9 ± 5.4 kg were assigned
to each of three treatments (0, 5.5 and 11 grams of total dissolved salts per litre (g TDS/L)).
Each treatment had 12 goats that were individually penned. The rectal temperature (RT), pulse
rate (PR) and respiration rate (RR) were measured once a week for 56 days. Goats which
received 5.5 g TDS/L salt level had a significantly higher ADFI and ADG when compared to
those on the 11.0 g TDS/L salt level. The PR was significantly higher in goats that received 11
g TDS/L than those on the 5.5 g TDS/L salt level. It was concluded that Nguni goats can tolerate
drinking water with salinity levels not above 5.5 g TDS/L.
Keywords: Average daily feed intake; average daily water intake; pulse rate; rectal
temperature; respiration rate
4.1 Introduction
Water scarcity is a global crisis for both humans and the agricultural sector (Getu, 2015). Key
factors which contribute to water scarcity include climate change (Ragab and Prudhomme,
59
2002), increase in economic growth, aridity, frequency of droughts and increasing human
population (Thornton et al., 2009).
Nguni goats are the predominant breed among resource-limited communal farmers in Southern
Africa. They are adapted to local conditions. They are also tolerant to diseases and parasites
(Lebbie, 2004). They have the ability to utilise fibrous feeds of poor quality (Lebbie, 2004).
They also have a high social and cultural value to communal resource-limited farmers.
In these farming systems, water is a scarce resource. Available water sources which are used
by both humans and goats contain high salt content levels (Meyer and Casey, 2000) than
normal, were sodium chloride is the major constituent (Gihad et al., 1993). Excessive salt
concentrations from available water in these water sources is a result of high salt levels in the
soil. High salt levels in the soil is a result of drought conditions influenced by increased air
temperature and high evaporation rates associated with reduced rainfall (Ragab and
Prudhomme, 2002; Mhlongo, 2015). Although extensive research has been done to assess the
extent to which livestock can tolerate drinking water with high salt levels (McGregor, 2004;
Attia-Ismail et al., 2008), limited research has been done, if any, to assess the extent to which
Nguni goats can tolerate drinking saline water. Understanding the ability of Nguni goats to
tolerate saline water or greywater can ensure that wastewater or grey water can be utilised for
goat production and recycling of water resources can reduce water demand.
Therefore, the objective of the current study was to assess the extent to which Nguni goats can
tolerate drinking saline water. It was hypothesized that increasing salinity of drinking water
increases feed intake, water consumption and growth rate of Nguni goats.

60
4.2 Materials and Methods
4.2.1 Study site
This study was conducted at the University of KwaZulu-Natal Research Farm (Ukulinga),
Pietermaritzburg, KwaZulu-Natal. It is approximately 700 m above sea level in subtropical
hinterland. Climatic conditions at this farm are characterized with an annual rainfall of 735 mm
which falls mainly in summer between October and April. The maximum and minimum mean
annual temperatures are 25.7 and 8.9℃, respectively. Light to moderate frost occurs mainly
during the cool-dry season.
4.2.2 Saline water treatments
Reservoir water was used and the control treatment level for the experiment. Salinity level of
the reservoir water was determined by measuring the total dissolved salt using a conductivity
meter (CDM210) and was expressed in grams total dissolved salts per litre (g TDS/L).
Reservoir water had a salinity level of 0.033 g TDS/L. Other saline treatment levels were
prepared by adding sodium chloride (NaCl) to the control which was adjusted to 5.5 and 11 g
TDS/L. Drinking water for goats was prepared on a daily basis for each goat. Ethical approval
was provided by the University of KwaZulu-Natal (see Appendix 3).
4.2.3 Goats, diets and experimental design
Thirty six clinically healthy adult female Nguni (between the ages of 18 and 36 months), non-
lactating goats were used in the study. These goats were purchased from Jozini communal area.
All the goats were weighed and the average body weight was 19.9 ± 5.4 kg. The goats were
put into 12 groups, based on body weight. From the three goats in each group, each goat was
randomly assigned to each saline treatment level. The arrangement was used to ensure that

61
body weights of the goats are similar among the three saline treatment groups. All goats were
housed in individual 140 × 80 cm pens.
During the 14 days adaptation period, water was given to each goat ad libitum to determine
daily water intake for each goat. Nutrient requirements for growing goats were determined
using AFRC (1993). Lucerne hay (Medicago sativa) hay, which met the nutrient requirements
for maintenance and growth (80 g/day CP; 5.69 MJ/day ME), was milled to pass through a 1
mm sieve before it was provided to each goat.
All chemical analyses were done in the Animal Science Laboratory of the University of
KwaZulu-Natal, Pietermaritzburg. Dry matter, organic matter and ash were analysed using the
procedures described by the Association of Official Analytical Chemists (AOAC, 1990).
Nitrogen content in hay was determined by combustion using a LECO FP2000 machine
(Pretoria, South Africa). Crude protein content was calculated by multiplying the nitrogen
content by a factor of 6.25. Neutral detergent fibre and acid detergent fibre were determined
according to van Soest et al. (1991) using the ANKOM machine (ANKOM Technology,
Fairport, New York, USA). Crude fat content was determined using the Soxhlet method
(Soxhlet Buchi machine, Switzerland). Calcium and phosphorus content was determined using
the inductively coupled atomic emission spectrophotometer (ICP-AES) (Spettrometro (ICP-
AES) Vista MXP Rad Varian). Nutritional composition of lucerne is given in Table 4.1. Feed
provided to each goat was weighed using a digital scale to 0.05 kg.
Before the commencement of the trial, all goats were drenched with Zolvix to control
gastrointestinal nematodes using a drenching gun. Monopantel is the active ingredient in
62
Zolvix. Dosage rate was 1 ml per 10 kg body weight. Goats were kept for 56 days including an
adaptation period of 14 days.
4.2.4 Measurements
4.2.4.1 Feed intake
Each goat was offered 1 kg of lucerne hay, once a day at 0800 h for the duration of the study.
Feed provided to each goat were placed in individual feeding troughs. A 100 % polypropylene
50 kg sack was placed below each feeding trough to collect any feed spillages. Spillages were
weighed and those which were contaminated with faeces and urine were discarded. Average
daily feed intake (ADFI) was measured by calculating the difference between the initial weight
and final weight of feed offered to each goat. Weight of feed was measured using a digital scale
(METTLER TOLEDO) to the nearest 10 g.
4.2.4.2 Water intake
Water was offered to each goat on a daily basis using 5 litre (L) buckets. Buckets which
contained water were placed next to feeding troughs and were tightened to pen railings using
thin flexible metallic wires. To avoid contamination, water was frequently checked twice in a
day. Average daily water intake (ADWI) for each goat was calculated as the difference in water
volume between the final and initial volumes divided by the interval in days. Volume of water
was measured to the nearest 10 mL using a plastic measuring cylinder. Loss of water due to
evaporation was assessed by measuring the volume of water lost from an identical bucket
which was kept beyond the reach of goats.

63
Table 4.1: Nutritional composition of Medicago sativa used in the experiment (g/kg DM)
Component Content (g/kg DM)
Dry matter 906
Crude protein 135.9
Acid detergent fibre 361.1
Neutral detergent fibre 524.1
Ash 88.60
Ether extracts 13.80
Calcium 7.10
Phosphorus 1.10

64
4.2.4.3 Body weight changes
Before the commencement of the trial, all goats were weighed using a digital scale (PN-440
sheep and goat scale) to the nearest 0.20 kg. Body weight (BW) for each goat was measured
and recorded weekly at 0800 h before feed was provided using a digital scale (PN-440 sheep
and goat scale) to the nearest 0.20 kg. Average daily gain (ADG), for each goat was calculated
as the difference in weight between the final and initial weight divided by the interval in days
from the dates the initial and final weights were taken.
4.2.4.4 Rectal temperature
Rectal temperature (RT) of goats was measured at 0800 h once every week to the nearest 0.1°C
using a digital thermometer (Uniontech) n the same day when body weight was measured.
Rectal temperature was measured and recorded before feed was provided to each goat. The
thermometer was inserted in the rectum to full depth until a stable automated reading was
obtained.
4.2.4.5 Respiration rate
The respiratory rate (RR) (breaths/min) for each goat was measured once every week at 0800
h on the same day when BW and RT was being measured. The measurement was done by
visually observation and counting the flank movements with the aid of a stop watch. Values
were taken for one minute of regular breathing with the goat standing quietly in its pen.
65
4.2.4.6 Pulse rate
Pulse rate (PR) (beats/min) was recorded once every week by counting the number of
movement flanks on the artery below and slightly inside the jaw with fingers with the aid of a
stop watch. The values were taken for one minute of regular breathing with the goat standing
quietly.
4.2.5 Statistical analyses
The PROC GLM procedure of SAS (2010) was used to determine the effect of salinity levels
on ADWI, ADFI, ADG, FCR, RT, RR and PR. A longitudinal repeated measures analysis was
also used to test the effect of salinity levels in drinking water on ADWI, ADFI, ADG, FCR,
RT, RR, and PR over time. The model was:
𝑌𝑖𝑗𝑘𝑙 = 𝜇 + 𝑆𝑖 + 𝑇𝑗 + (𝑆 × 𝑇)𝑖𝑗 + 𝐵𝑙𝑊𝑘 + 𝑒𝑖𝑗𝑘𝑙
Where 𝑌𝑖𝑗𝑘𝑙 is the individual observation, 𝜇 is the overall mean common to all observations, 𝑆𝑖
is the salinity level, 𝑇𝑗is the effect time in weeks, (𝑆 × 𝑇)𝑖𝑗 is the interaction between salinity
level and time, 𝐵𝑙𝑊𝑘 is the initial body weight and 𝑒𝑖𝑗𝑘𝑙 is residual error.
The PROC REG (SAS, 2010) was used to determine the relationship between salinity levels
and ADWI, ADFI, ADG, FCR, RT, RR and PR.

66
4.3 Results
4.2.3 Average daily feed intake
The relationship between ADFI and salinity level in drinking water of goats is shown in Table
4.2. Figure 4.1 shows the relationship between ADFI and time (weeks) for goats at various
saline treatment levels. Average daily feed intake (ADFI) linearly decreased with increasing
salinity levels in drinking water (P < 0.001). As salinity levels increased from 0 to 5.5 g TDS/L,
ADFI decreased from 780 to 678 g/d. As salinity level increased from 5.5 to 11 g TDS/L, ADFI
decreased from 678 to 448.98 g/d. Highest ADFI was observed in week 2 (P < 0.05) for control
treatment level, and week 6 (P < 0.05) for both 5.5 g TDS/L and 11 g TDS/L treatment levels.
Lowest ADFI was observed in week 1 for all treatment levels (P < 0.05).
4.3.2 Average daily water intake
The relationship between ADWI and various salinity levels in drinking water for goats are
shown in Table 4.2. Figure 4.1 shows the relationship between ADWI and time (weeks) for
goats at various saline treatment levels. Water intake linearly decreased with increasing salinity
levels (P < 0.001). As salinity levels increased from 0 to 5.5 g TDS/L, ADWI decreased from
1.23 to 1.01 l/d (P < 0.05), then generally decreased from 1.01 to 0.89 l/d at salinity level of
5.5 to 11 g TDS/L. the ADWI generally increased over time. Highest ADWI for the control
treatment level was observed in week 1 (P < 0.05), Week 2 for 5.5 g TDS/L treatment level,
and week 5 for 11 g TDS/L treatment level. The lowest ADWI was observed in week 2 for the
control, week 1 (P < 0.05) for both 5.5 and 11 g TDS/L treatment levels.

67
4.3.3 Average daily gain
The relationship between ADG and various salinity levels in drinking water for goats are shown
in Table 4.2. Figure 4.1 shows the relationship between ADG and time (weeks) for goats at
various saline treatment levels. Average daily gain (ADG) significantly decreased with
increasing salinity level (P < 0.05). As salinity level increased from 0 to 5.5 g TDS/L, ADG
decrease was from 57.6 to 48.3 g/d. Further increase in salinity level from 5.5 to 11 g TDS/L,
ADG further decreased from 48.3 to 17 g/d. There was no relationship between salinity levels
and body weight gain. Highest ADG the control treatment level was observed in week 5 (P <
0.05), week 1 (P < 0.05) for both 5.5 and 11 g TDS/L treatment levels. Lowest ADG was
observed in week 3 for all treatment levels.
4.3.4 Feed conversion ratio
The relationship between FCR and various salinity levels in drinking water for goats are shown
in Table 4.2. Figure 4.1 also shows the relationship between FCR and time (weeks) for goats
at various saline treatment levels. FCR increased with increasing salinity levels in drinking
water for goats. Highest FCR was observed in week 5 for the control treatment level, week 1
for 5.5 and 11 g TDS/L treatment level (P < 0.05). Lowest FCR was observed in week 3 for all
treatment levels.
4.3.5 Physiological parameters
There was a positive linear relationship (P < 0.05) between salinity level and physiological
parameters (Table 4.2). Figure 2 also shows the relationship between salinity levels in drinking
water against time. Salinity level in drinking water for goats had no significant effect on rectal
68
temperature (P > 0.05). Highest RT was observed in week 3 for all treatment levels. Lowest
RT was observed in week 1 for all treatment levels.
There was a positive linear relationship between salinity level and pulse rate (P < 0.05). As
salinity level increased from 0 to 5.5 g TDS/L, pulse rate generally increased from 107 to 113
beats per minute then significantly increased from 113 to 122 beats per minute. Highest PR
was observed in week 3 for the control and 5.5 g TDS/L treatment levels, and week 2 for 11 g
TDS/L treatment level. Lowest PR was observed in week 5 for the control treatment level,
week 1 for 5.5 g TDS/L treatment level, and week 3 for 11 g TDS/L treatment level.
Increasing salinity level had no significant effect on respiration rate (P > 0.05). Highest RR for
both control and 11 g TDS/L treatment level was observed in week 3 (P < 0.05), and week 1
for 5.5 g TDS/L treatment level. Lowest RR was observed in week 2 for all treatment levels.
4.4 Discussion
All goats were clinically healthy through the whole duration of the study. The current study
focused in assessing the extent at which Nguni goats tolerate salinity levels in drinking water
by measuring ADFI, ADWI, ADG, RT, PR and RR. It was expected that drinking water with
increasing salinity levels will increase water and feed intake. Negative effects of climate
change which results to drought conditions and cause water be a scarce resource for humans
and livestock. Available water resources under these conditions are of poor quality were
salinity level is at high level. Understanding the extent at which Nguni goats tolerate drinking
water with increasing salinity level could help in evaluating possible use of other water sources
in maintaining goat production and productivity if fresh water is not available.

69
Table 4.2: Effect of increasing salinity levels on average daily water intake (ADWI), average daily feed intake (ADFI) average daily gain (ADG), feed conversion ratio (FCR), rectal temperature (RT), pulse rate (PR) and respiration rate (RR) in Nguni goats
Parameters Salinity level (g TDS/L) SEM Linear regression coefficient Significance
0 5.5 11
ADWI (l/d) 1.23a 1.01b 0.89b -0.1744 61.91 ***
ADFI (g/d) 780.24a 678b 488.98bc 17.94 35.49 ***
ADG (g/week) 57.6a 48.3b 17bc NS
FCR 0.214 0.223 0.350 NS
RT (℃) 37.87 38.18 38.47 NS
PR (beats/min) 107a 113a 112ba 2.29 26.13 **
RR (breaths/min) 31 29 31 NS
SEM = standard error of the mean; NS: not significant; * P < 0.05; ** P < 0.01; *** P < 0.001; n=12

70
a) b)
c) d)
Figure 4.1: Relationship between growth parameters to salinity levels in drinking water for goats against time
ADFI: average daily feed intake; ADWI: average daily water intake; ADG: average daily gain; FCR: feed conversion ratio
0
200
400
600
800
1000
1200
1 2 3 4 5 6
AD
FI (
g/d
)
Time (weeks)
Control
5.5 g TDS/L
11 g TDS/L
-0.5
0
0.5
1
1.5
2
1 2 3 4 5 6
AD
WI
(l/d
)
Time (weeks)
Control
5.5 g TDS/L
11 g TDS/L
-200
-100
0
100
200
300
400
500
600
1 2 3 4 5 6
AD
G (
g/d
)
Time (weeks)
Control
5.5 g TDS/L
11 g TDS/L
-1
-0.5
0
0.5
1
1.5
2
2.5
1 2 3 4 5 6
FCR
Time (weeks)
Control
5.5 g TDS/L
11 g TDS/L
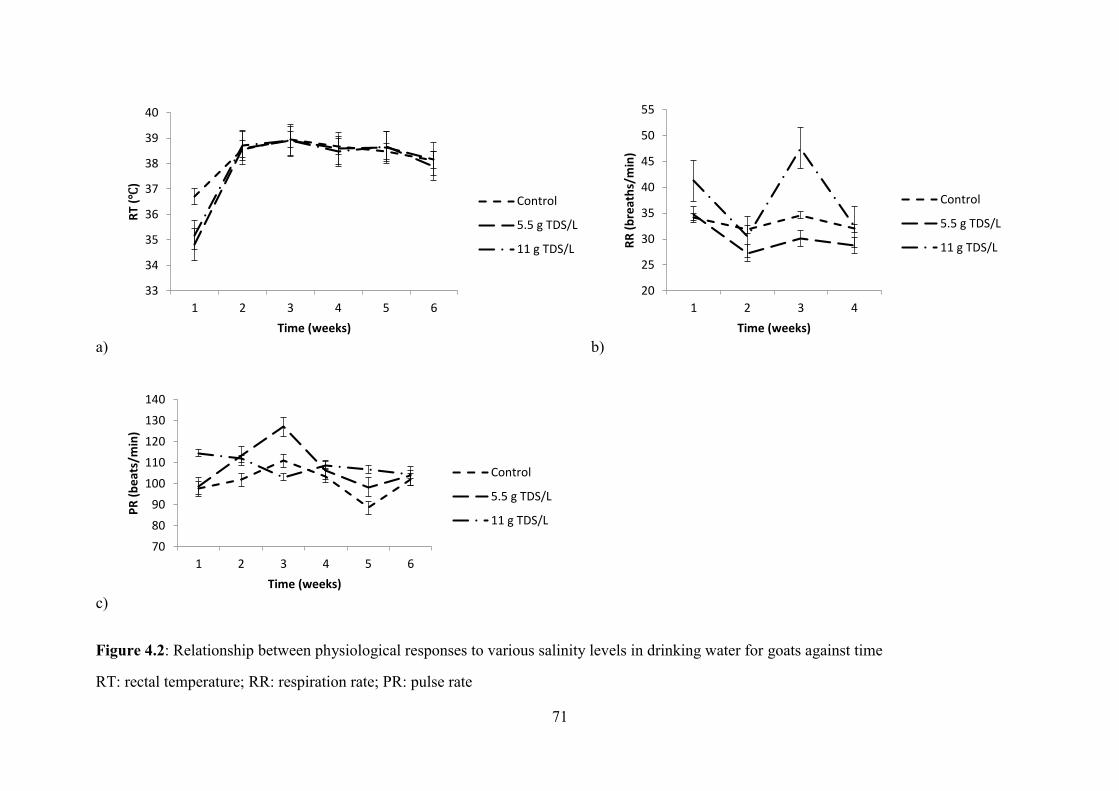
71
a) b)
c)
Figure 4.2: Relationship between physiological responses to various salinity levels in drinking water for goats against time
RT: rectal temperature; RR: respiration rate; PR: pulse rate
33
34
35
36
37
38
39
40
1 2 3 4 5 6
RT
(℃)
Time (weeks)
Control
5.5 g TDS/L
11 g TDS/L
20
25
30
35
40
45
50
55
1 2 3 4
RR
(b
reat
hs/
min
)
Time (weeks)
Control
5.5 g TDS/L
11 g TDS/L
70
80
90
100
110
120
130
140
1 2 3 4 5 6
PR
(b
eat
s/m
in)
Time (weeks)
Control
5.5 g TDS/L
11 g TDS/L

72
The observation that ADWI decreased with increasing salinity levels could be related to the fact
that these goats were not adapted to drinking water which has excessive amount of salts. These
finding agree with earlier reports (Gihad et al., 1993; Attia-Ismail et al., 2008). Low water intake
at high salinity levels could be explained by goats not drinking saline water which exceeds their
salt requirement levels. Although there was a poor relationship between salinity levels and ADWI,
however, goats were responsive to increasing salinity level in drinking water though goats were
not drinking high volume of water as expected in order to excrete excess salt ingested during water
drinking. Reduced water intake could also be a sign of osmotic effect (Gihad et al., 1993).
Observed difference in ADWI in week 1 could also be influenced by the fact that goats were still
not adapted to drinking water which contains salt levels higher than normal drinking water.
The observed decrease in ADFI at increasing salinity levels agree with earlier reports (McGregor,
2004; Ru et al., 2005). This suggest that Nguni goats cannot tolerate drinking water with salinity
levels above 5.5 g TDS/L since ADFI was depressed at 11 g TDS/L. Observed decrease in feed
intake at salinity level above 5.5 g TDS/L could be an adaptive mechanism in which Nguni goats
use in reducing salt levels in the blood. Sudden decrease in feed intake could also be influenced
by an increase in ruminal pH which could be caused by high salinity levels in drinking water.
Attia-Ismail et al. (2008) reported longer adaptation time in proteolytic bacteria under high salinity
levels, as a result, during the adaptation phase of these bacteria, goats had depressed feed intake.
Reduced ADFI for the current study could also be influenced by that fact that feed which was
provided to each goat contained a relatively low water content which could reduce water balance
in the body. Forages with high water content have been reported to maintain water balance in the
body if fresh water is not available (Burke, 1990).
73
Observations that FCR was lower for the control treatment level (P < 0.05) at week 1 reveal that
at this treatment level, salinity levels in drinking water had no negative effect in ADFI and ADG.
Higher FCR at 5.5 and 11 g TDS/L was influenced by lower ADFI and higher ADG.
Findings that ADG decreased with increasing salinity levels in drinking water agree with earlier
reports (Baker, 1989; McGregor, 2004; Ru et al., 2005). Reduced ADG could be influenced by
reduced ADFI and ADWI at salinity levels above 5.5 g TDS/L. This could also be influenced by
a direct osmotic effect in the blood (Gihad et al., 1993). The difference in ADG at week 1 and
depressed ADG above 5.5 g TDS/L reveal that the extent at which Nguni goats tolerate salt levels
in drinking water which is not above 5.5 g TDS/L.
Although TR, PR, and RR are physiological parameters which are used to assess the general health
of goats, however, at high salinity levels in drinking water for goats, TR, PR, and RR are expected
to increase as salinity levels increase in drinking water. Increasing salinity levels in drinking water
had no negative effects on RT and RR. The observed high PR at higher salinity levels in drinking
water for goats was expected and agree with earlier reports (Baker, 1989; McGregor, 2004). The
higher RR at 11 g TDS/L saline treatment level could suggest that Nguni goats were not tolerant
drinking water with salinity level above 5.5 g TDS/L.

74
4.5 Conclusions
Salt level in drinking water for goats positively affected ADWI. ADFI, ADG, and PR were
negatively affected by increasing salt level in drinking water for goats. Salt level 5.5 g TDS/L was
the extent at which Nguni goats tolerate salt levels in drinking water. Salinity levels above 5.5 g
TDS/L in drinking water caused a depressed ADWI, ADFI, and reduced ADG. PR was higher at
salt treatment level above 5.5 g TDS/L.
4.6 References
AFRC, 1993. Energy and Protein Requirements of Ruminants: an Advisory Manual Prepared by
the AFRC Technical Committee on Responses on Nutrients. CAB International:
Wallingford, UK.
AOAC, 1995. Association of Official Analytical Chemists. Official Method of Analysis, Method
920.39. Fat (crude) or ether extract in animal feed, final action. (16th edition). AOAC
International, Gaithersburg, MD, USA: pp 17.
AOAC, 1995. Association of Official Analytical Chemists. Official Method of Analysis, Method
978.10. Fibre (crude) in animal feed – fitted glass crucible method. AOAC International,
Gaithersburg, MD, USA: pp 20 – 21.
AOAC, 1995. Association of Official Analytical Chemists. Official Method of Analysis, Method
934.01. Loss on Drying (Moisture) at 95 – 100 ℃ for feed: Dry Matter on Oven Drying at
95 – 100 ℃ for feed. AOAC International, Gaithersburg, MD, USA: pp 1.
75
AOAC, 1997. Association of Official Analytical Chemists. Official Methods of Analysis, method
990.03, crude protein in animal feeds: Combustion method (16th ed.) Arlington, VA.
AOAC, 2000. Association of Official Analytical Chemists. Official Method of Analysis, Method
942.05. Ash of animal feed. (18th edition). AOAC International, Gaithersburg, MD, USA:
pp 8.
AOAC, 2006. Association of Official Analytical Chemists. Official Method of Analysis, Method
973.18. Fibre (acid detergent) and lignin in animal feed. (16th edition). AOAC
International, Arlington, VA, USA; pp. 28 - 29.
Attia-Ismail, S. A., Abdo, A. R and Asker, A. R. T., 2008. Effect of salinity level in drinking water
on feed intake, nutrient utilization, water intake and turnover and rumen function in sheep
and goats. Egyptian J. of Sheep and Goat Sciences (Special Issue, 2" Inter. Sci. Conf. on
SR Production, 3(1): 77 – 92.
Baker, M. A., 1989. Effects of dehydration and rehydration on thermoregulatory sweating in goats.
Journal of Physiology, 417: 421-435.
Burke, M. G., 1990. Seawater consumption and water economy of tropical feral goats. Biotropica,
22(4): 416-419.
Gihad, E.A., Leith, H. and Al mason, A. A. (1993). Utalization of high salinity tolerant plants and
saline water by desert animals. Towards the rational use of high salinity tolerant plants Vol
1: Towards the rational use of high salinity tolerant plants. Kluwer Academic Publishers;
pp. 443-447.

76
McGregor, B. A., 2004. Water quality and provision for goats. A report for the Rural Industries
Research and Development Corporation. RIRDC Publication No. 04/036. Rural Industries
Research and Development Corporation, Canberra.
Meyer, J. A and Casey, N. H., 2004. Exposure assessment of potentially toxic trace elements in
indigenous goats in the rural communal production systems of the northern region of South
Africa. South African Journal of Animal Science, 34 (1): 219-223.
Mhlongo, F., 2015. ‘KZN livestock losses due to drought’, SABC NEWS 20 October. Available
from: http://www.sabc.co.za/news/a/559663804a476dc0b0adfb6d39fe9e0c/KZN-
livestock--continues-to-die-due-to-drought-20152010 (20 October 2015).
Ru, Y. J., Glatz, P. C and Bao, Y. M., 2005. Effect of Salt level in water on feed intake and growth
rate of Red and Fallow Weaner Deer. Asian-Austrian Journal of Animal Science, 18(1):
32-37.
SAS, 2010. Statistical Analysis System user`s Guide, Version 9.3. SAS Institute Inc. Cary, North
Carolina, USA.
Stewart, G and Rout, R., 2007. Horizons regional council: Reasonable Stock Water Requirements
Guidelines for Resource Consent Applications - Technical report. AQUAS Consultants Ltd
& Aqualinc Research Ltd. https://www.horizons.govt.nz/assets/horizons/Images/one-plan-
tech-reports-
public/Reasonable%20Stock%20Water%20Requirements%20Guidelines%20for%20Res
ource%20Consent%20Applications.pdf (accessed 05-11-2015).
van Soest, P. J., Robertson, J. B and Lewis, B. A., 1991. Symoposium: Carbohydrate methodology
and nutritional implications in dairy cattle: Methods for dietary fiber, neutral detergent
77
fiber and non-starch polysaccharides in relation to animal nutrition. Journal of Dairy
Science, 74: 3583-3597.

78
Chapter 5: General discussion, conclusions and recommendations
5.1 General discussion
Nguni goats are the predominant breed kept by smallholder resource-limited communal farmers.
Earlier research reported water scarcity as one of the major constraints to communal goat
production systems, especially in arid and semi-arid environments. Although extensive research
has been done to assess the extent to which goats tolerate excessive salt levels in drinking water,
however, limited, if any, information, is available for Nguni goats. For sustainable and profitable
goat production in communal farming systems, it is important to explore strategies to utilise saline
water, which gives indications as to the extent to which re-cycled water can be utilised in goat
production.
The hypothesis tested in in the first objective (Chapter 3) was that factors which cause water
scarcity for goats was lower for households with access to perennial river systems than those
without. Although constraints to goat production varied with river systems, households in areas
where there were seasonal river systems reported water for goats as scarce resource compared to
households in areas where perennial rivers were present. Goats walk long distances in search for
water in areas where water is not a scarce resource. Factors which influenced water scarcity were
river systems, household distance to the nearest water source and the negative effects of climate
change associated with drought conditions. Water scarcity for goats was also reportedly high for
households that were located close to water sources. Such findings suggest that these water sources
were used by both humans and goats and other livestock.

79
Conversion of perennial rivers to seasonal rivers, decrease in the length of the rainy season and
increase frequencies of dry spells during the rainy season for the past 30 years was reported by the
elderly members of the community, suggesting the impact of climate change on goat production
is rife and is likely to increase. It also emerged that drought conditions are likely to cause excessive
salt levels in the soil. Consequently, water intake and goat productivity could be affected.
An on-station study was, therefore, conducted to test the hypothesis that increasing salinity of
drinking water increases feed intake, water consumption and growth rate of Nguni goats. Average
daily feed intake (ADFI), average daily water intake (ADWI), average daily gain (ADG), rectal
temperature (RT), and pulse rate (PR) and respiration rate (RR) were monitored. At saline
treatment levels above 5.5 g TDS/L, ADFI, ADWI and ADG was depressed. Pulse rate (PR)
increased at 5.5 g TDS/L saline treatment level and decreased at 11 g TDS/L saline treatment level.
Decrease in pulse rate (PR) at 11 g TDS/L, however, showed that Nguni goats were not tolerant to
drinking water with salt levels above 5.5 g TDS/L. Over time, Nguni goats became adapted to
excessive salt levels in drinking water. Therefore, the hypothesis was rejected since pulse rate
decreased at saline treatment level above 5.5 g TDS/L.
5.2 Conclusions
Farmers in areas where there were seasonal river systems reported water to be a scarce resource
for goats when compared to farmers in areas where there were perennial river systems. Households
located within 3 km from the nearest water source reported water as a scarce resource for goats
when compared to households located 3 km away from the nearest water source. Nguni goats

80
cannot tolerate drinking water with salt levels above 5.5 g TDS/L. These findings also indicate
that physiological parameters such as rectal temperature (RT), pulse rate (PR) and respiration rate
(RR) can be used to assess the general health status of goats under conditions of excessive salt
levels in drinking water for goats.
5.3 Recommendations and further research
In resource-limited farming environments were goats do not access to perennial river systems and
water is a scarce resource, alternative water sources such as grey water could be used for water
drinking in goats since they do not contain excessive salt content greater than 5.5 g TDS/L. The
use of wastewater as a strategy of improving goat production will also reduce the demand for fresh
water. The use of succulent plants as a supplement feed resource in combination with grey water
is also recommended since succulent plants contain high water content. Combination of the two
water sources will assist goats in meeting their daily water requirements.
Aspects that require further research include the following:
1. Urine output of goats exposed to saline water– urine specific gravity which assists in
assessing the concentration of solutes such as urine sodium, potassium, urea and chloride
content excreted in urine.
2. Measuring sodium/potassium ATPase concentrations in the kidneys to measure the activity
of this enzyme in regulating the concentration of sodium and potassium in the blood.
3. Behavioural effects – this include frequency of drinking and urination and duration of
drinking.

81
4. Determining the effect of age, physiological status and sex of goats on tolerance to saline
water.

82
5. Appendices
Appendix 1: Structured questionnaire
Objective:
Assessment of farmer perception on water availability and prevalence of gastrointestinal parasites in Nguni goats
Questionnaire number………………………………….. Village name………………………………
Enumerator name…………………. …………………… Ward number……………………………...
Date……………………………………………………..
SECTION A: Household demographics
1. Head of the household
a) Sex: M □ F □
b) Marital status: Married □ Single □Divorced □ Widowed □
c) Age:<18 □ 18-30 □ 31-50 □ > 50 □
d) Is the head of the household resident on the farm? Yes □ No □
e) Highest education level: No formal education □ Grade1-7 □ Grade8-12 □ Tertiary □
f) Have you ever received any training on goat production? Yes □ No □
g) What are major sources of income? Crops □ Livestock sales □ Livestock products □ Government grant □ Salary □ Other □, specify ……………………………..
2.What is your household composition?
Age group Males Female Adults (36+ years) Youth (13-35 years) Children (0-12 years)
3. Types of livestock species kept? (Please tick first column as appropriate. The second column is for the number of that appropriate livestock species. The last column is for rank levels of the other types of livestock species kept – 1 is for the highest priority)
Livestock species Tick (appropriate) Number of animals Rank Cattle Goats

83
Sheep Chickens Pigs Other (Specify)
SECTION B: Goat production
1. Why do you keep goats?(Please tick the first column for the purpose and the second column for ranking)
Tick Rank Meat Milk Manure Skin Sales Investment Traditional ceremonies Gift
2. Are you part of any farmer association? Yes □ No □
3. Who is the owner of the goats? Father □ Mother □ Children □ Other□ (specify)……….........
4. Who takes decisions about goat management? Owner□ Shepherd □ Children □Other□, specify……................
5. What goat production system do you use? Extensive □ Intensive □ Semi-intensive □ Tethering □Integrated livestock/crop system □
6. Which goats do you tether? Lactating does □ Dry does □ Bucks □ Kids □
7. What is the reason for tethering your goat?
Prevent kids from getting lost □ Protect kids from predators □ Prevent goat theft □ Allow kids to have more milking time □
8. What role (s) does each household member play in goat production?(You can tick appropriate one or more than one column in a row may be ticked)
Role Adults Youth
Hired labour Male Female
Feeding Penning goats Kraal construction and maintenance Mating/breeding management Health management Purchasing Slaughtering Selling Other (specify)…………….
9. What are the challenges facing goat production?

84
Feed shortage □ Diseases □Ecto-parasites □Internal parasites □ Inbreeding □ Theft □water scarcity □Other (specify) ………………
10. What is the composition of your goat flock?
Male Female Kids Castrates Adults
11. How do you breed your goats? Freely uncontrolled □ select bucks □ select does □
12. When is the breeding season for goats?
Rainy season □ Hot dry season □ Cool dry season □ Post-rainy season □All year round □ 13. What do you look for when selecting bucks for breeding?
14. Scrotal circumference □ Libido □ Body conformation □ Health status □ scrotal palpation □ Body condition □ Physical injuries □
15. How do you select does for breeding?
16. Body condition □ Health status □ Mothering ability □ Ability to produce 3 times in two years □
17. How do you manage kids before weaning? Let them go with mothers to the field □ Leave them in the goat house □ Keep them inside the human house □ Other (specify)…………………………………...
18. When do you wean kids?
Rainy season □ Post-rainy season □ Cool dry season □ Hot dry season □ 19. What is your method of weaning?
Minimum weight □ Age □ Feed availability □ 20. Do you milk your goats? Yes □ No □ (If not, please skip question no. 21)
21. How much milk is produced by goats in each season?
Season Milk production <500ml 500ml - 1L >1L None
Rainy season Post-rainy season Cool dry season Hot dry season
SECTION C: Goat health
1. Type of vegetationwhere goats browse?
Shrubs □ Grass □ Tree leaves □, specify the type ……………………………. 2. When do you experience feed shortage for goats?
Rainy season □ Post-rainy season □ Cool dry season □ Hot dry season □ All year round □ 3. Do you practice supplementary feeding during periods of feed shortage? Yes □ No □

85
4. Do you house your goats? Yes □ No □
5. When do you house your goats? Night □ Midday □
6. How long do you house them?
0-3 hrs□< 6hrs □<9hrs □<12hrs □<15hrs □ Overnight □ 7. What form of housing do you have for your goats?
Kraal □ Stall/Shed □ Yard □ None □ 8. What are common disease challenges that you encounter in your flock?
Diarrhea □ Coccidiosis □ External parasites □ Heart water □Orf□Mastitis □ Pneumonia □ Blue tongue □ Rift valley □Pulpy kidney□Abortion □Tetanus □ Foot abscesses □ Gastro-intestinal parasites □
9. Does mortality occur in adults □ orkids □?
10. How many kids died in the past 12 months?
11. What causes kid mortality?
Lack of colostrum □ No milk produced by lactating does□ Predators (Jackals) □Feed shortage □ 12. How do you assess health challenges in kids? Body weight □ Breathing difficulties □ Fever □
Mucus discharge in the nose□ears□eyes□vagina□anus □, and Watery faeces □
13. Do you deworm kids at weaning? Yes □ No □
14. What types of parasites are prevalent in this farm? (Can tick more than one)
Type of parasite Tick Rank Ticks Lice Flies Mites Tapeworrm Roundworm Liver fluke Other, specify…
15. Are parasite loads affected by housing and grazing land? Yes □ No □
16. How do you identifya goat which has a problem with gastro-intestinal parasites?
Loss of condition score□ Parasite in faeces□Bottle jaw □Anaemia□ Post-mortem □ 17. Who identifies parasites?Household head □ Shepherd □Teenagers □ None □
18. What is the effect of season on gastro-intestinal parasite prevalence?
Season Prevalence High Low
Rainy season Post-rainy season Cool dry season
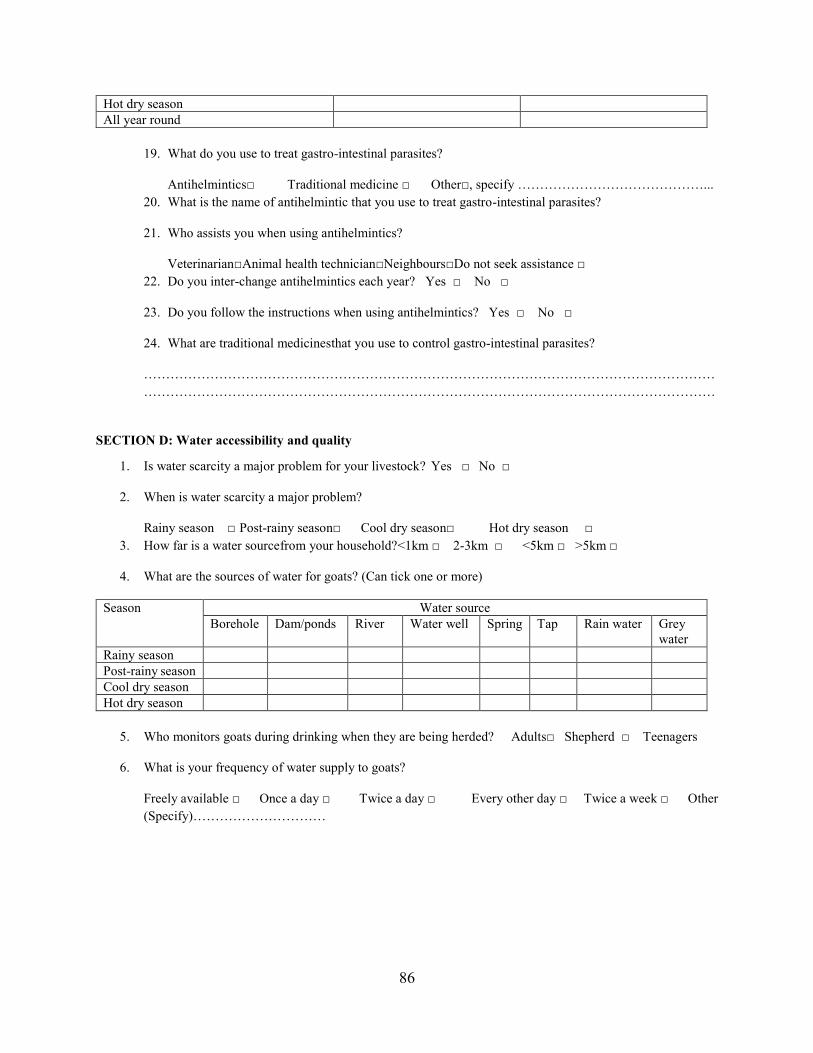
86
Hot dry season All year round
19. What do you use to treat gastro-intestinal parasites?
Antihelmintics□ Traditional medicine □ Other□, specify ……………………………………... 20. What is the name of antihelmintic that you use to treat gastro-intestinal parasites?
21. Who assists you when using antihelmintics?
Veterinarian□Animal health technician□Neighbours□Do not seek assistance □ 22. Do you inter-change antihelmintics each year? Yes □ No □
23. Do you follow the instructions when using antihelmintics? Yes □ No □
24. What are traditional medicinesthat you use to control gastro-intestinal parasites?
……………………………………………………………………………………………………………………………………………………………………………………………………………………………………
SECTION D: Water accessibility and quality
1. Is water scarcity a major problem for your livestock? Yes □ No □
2. When is water scarcity a major problem?
Rainy season □ Post-rainy season□ Cool dry season□ Hot dry season □ 3. How far is a water sourcefrom your household?<1km □ 2-3km □ <5km □ >5km □
4. What are the sources of water for goats? (Can tick one or more)
Season Water source Borehole Dam/ponds River Water well Spring Tap Rain water Grey
water Rainy season Post-rainy season Cool dry season Hot dry season
5. Who monitors goats during drinking when they are being herded? Adults□ Shepherd □ Teenagers
6. What is your frequency of water supply to goats?
Freely available □ Once a day □ Twice a day □ Every other day □ Twice a week □ Other (Specify)…………………………

87
Appendix 2: Ethical approval document for the survey study

88
Appendix 3: Ethical approval for the goat trial