influence versus selection: a network perspective on
TRANSCRIPT

International Journal of Communication 9(2015), 1002–1022 1932–8036/20150005
Copyright © 2015 (Thomas N. Friemel). Licensed under the Creative Commons Attribution Non-
commercial No Derivatives (by-nc-nd). Available at http://ijoc.org.
Influence Versus Selection:
A Network Perspective on Opinion Leadership
THOMAS N. FRIEMEL
University of Bremen, Germany
Over the past decades, research on opinion leaders has been based on an implicit
assumption that the structure of social networks is stable and that only attitudes and
behavior are subject to change in a diffusion process. The finding that social groups
often display similar attitudes or behavior was therefore regarded as evidence of opinion
leaders’ influence. However, network autocorrelation also can emerge due to social
selection processes in which likeminded people establish new ties and cut dissonant ties.
In fact, without controlling for social selection processes, one is likely to overestimate
the power of influence processes. Stochastic actor-oriented modeling of dynamic social
networks allows disentangling and quantifying these two processes. This reanalysis of a
four-wave panel survey of adolescents’ conversation networks and their TV use is the
first to do this on the level of specific TV programs. The results demonstrate that
influence of opinion leaders may become insignificant if parameters for social selection
and general patterns of program preferences are included in the analysis. Overall, this
study challenges an overly simplistic view of opinion leadership and illustrates the power
of longitudinal social network analysis for disentangling social influence and social
selection processes.
Keywords: opinion leader, diffusion, social network analysis, social influence, social
selection, stochastic actor-based modeling, TV program preferences, co-nomination
Introduction
The idea of social diffusion processes dates back to 1890, when Gabriel de Tarde published his
book Les lois de l’imitation in which he claimed that all similarities of social origin can be explained by
imitation. This notion implies that people change their behavior or attitude based on sympathy, education,
power, or other kinds of social relations. Hence, individual behavior and attitude are not an exclusively
individualistic issue but dependent on the social context—or, as Hartley (1950–1951) put it, “individual
opinion is a group matter” (p. 670). These ideas nourished research on opinions and behavior within social
Thomas N. Friemel: [email protected]
Date submitted: 2014–03–10

International Journal of Communication 9(2015) Influence Versus Selection 1003
groups with respect to various topics such as political opinion (Berelson, Lazarsfeld, & McPhee, 1954;
Lazarsfeld, Berelson, & Gaudet, 1944), consumer goods (Merton, 1949), and agricultural innovations
(Ryan & Gross, 1943). It was found that interpersonal exchange has an important influence on
information diffusion as well as opinion formation and therefore leads to similar opinions within social
groups (Rice, 2009). Yet influence processes are only one of two possible explanations when groups of
likeminded people are found in cross-sectional studies (Kandel, 1978). Alternative explanations point to
processes of homophilic selection or assortative pairing—the idea that people are more likely to become
connected with others similar to themselves. Again, this has been found to be true for several topics such
as race, gender, age, religion, education, and social class (McPherson, Smith-Lovin, & Cook, 2001). Thus,
there are two distinct explanations for the same outcome. This article argues that it is crucial to not only
take both processes—influence and selection—into account but to distinguish theoretically and empirically
between social influence and social selection in communication research in general and in opinion leader
research in particular.
Influence and Selection
A common finding in social network analysis and complexity science is that social structures are
not random (Rapoport & Horrath, 1961; Skvoretz, 1985). They are biased to form densely connected
subgroups that are only loosely connected to other subgroups. Opinions, attitudes, and behaviors are
related to these social structures and are more likely to be similar within social groups than between
them. Empirical evidence of this process has been found in studies of social status (Agneessens & Wittek,
2012), delinquency (Knecht, Sniders, Baerveldt, Steglich, & Raub, 2010), substance abuse (Huisman,
2014), music preferences (Steglich, Snijders, & West, 2006), and TV use (Friemel, 2012). This means that
people tend to have a comparable social status as their friends, a similar political orientation, a similar
level of delinquency and substance abuse, and tend to watch similar TV programs. In social network
analysis, this kind of network characteristic is termed network autocorrelation. Network autocorrelation is
high when nodes that are linked to each other have the same attributes.
From a traditional diffusion perspective, social structure is regarded as something that channels
processes of information dissemination. According to this logic, the likelihood of diffusion increases the
closer two persons are and the stronger their relation is. Furthermore, it is assumed that individual
adaptation is more likely if a larger number of related actors influence that “target” person (Kincaid, 2004;
Valente, 1995, 1996). These ideas of social influence are plausible and supported by a myriad of empirical
studies (Iyengar, van den Bulte, & Valente, 2011; Rice, 2009). However, as noted above, this perspective
tends to leave aside processes of social selection, which are a distinct phenomenon leading to the same
outcomes of network autocorrelation. In contrast to the diffusion perspective, the social selection
perspective holds that it is the relation and not the person’s attribute that changes. This means that actors
who are alike are more likely to get in touch with each other in the first place.
1004 Thomas N. Friemel International Journal of Communication 9(2015)
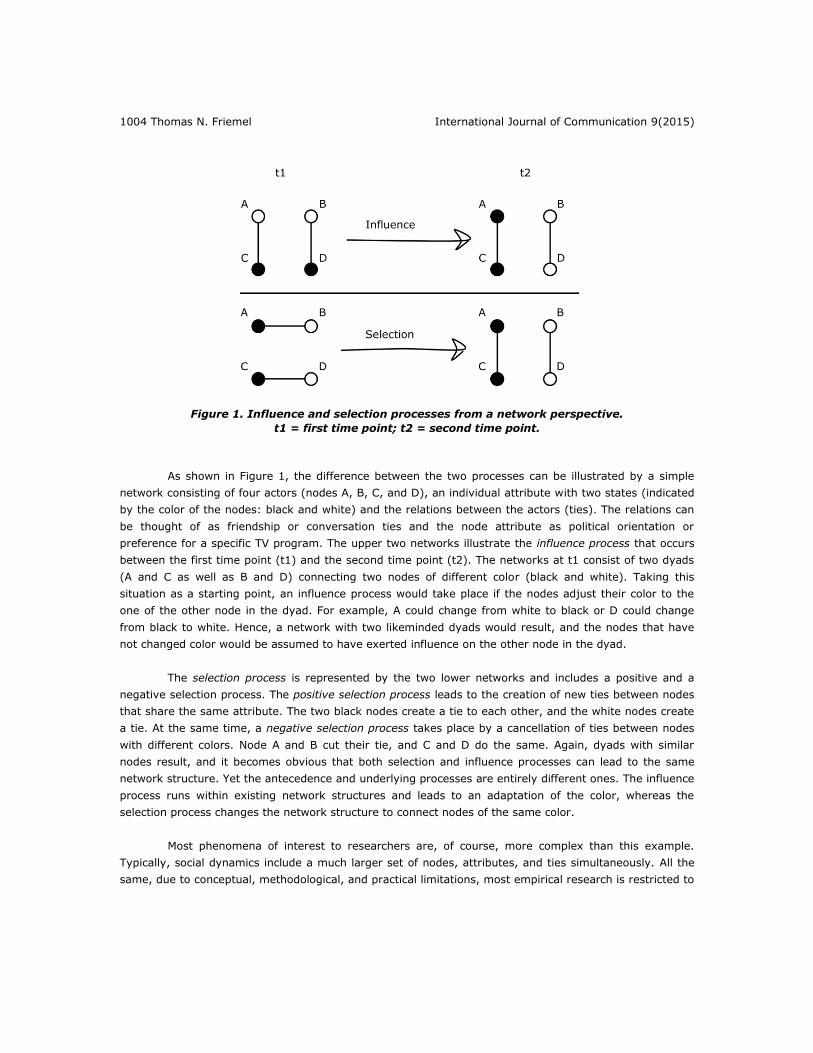
Figure 1. Influence and selection processes from a network perspective.
t1 = first time point; t2 = second time point.
As shown in Figure 1, the difference between the two processes can be illustrated by a simple
network consisting of four actors (nodes A, B, C, and D), an individual attribute with two states (indicated
by the color of the nodes: black and white) and the relations between the actors (ties). The relations can
be thought of as friendship or conversation ties and the node attribute as political orientation or
preference for a specific TV program. The upper two networks illustrate the influence process that occurs
between the first time point (t1) and the second time point (t2). The networks at t1 consist of two dyads
(A and C as well as B and D) connecting two nodes of different color (black and white). Taking this
situation as a starting point, an influence process would take place if the nodes adjust their color to the
one of the other node in the dyad. For example, A could change from white to black or D could change
from black to white. Hence, a network with two likeminded dyads would result, and the nodes that have
not changed color would be assumed to have exerted influence on the other node in the dyad.
The selection process is represented by the two lower networks and includes a positive and a
negative selection process. The positive selection process leads to the creation of new ties between nodes
that share the same attribute. The two black nodes create a tie to each other, and the white nodes create
a tie. At the same time, a negative selection process takes place by a cancellation of ties between nodes
with different colors. Node A and B cut their tie, and C and D do the same. Again, dyads with similar
nodes result, and it becomes obvious that both selection and influence processes can lead to the same
network structure. Yet the antecedence and underlying processes are entirely different ones. The influence
process runs within existing network structures and leads to an adaptation of the color, whereas the
selection process changes the network structure to connect nodes of the same color.
Most phenomena of interest to researchers are, of course, more complex than this example.
Typically, social dynamics include a much larger set of nodes, attributes, and ties simultaneously. All the
same, due to conceptual, methodological, and practical limitations, most empirical research is restricted to

International Journal of Communication 9(2015) Influence Versus Selection 1005
a limited and clearly bounded set of actors, a single attribute (e.g., adoption of an innovation or diffusion
of an information), and a specific type of tie (e.g., advice giving). Furthermore, research often focuses on
either selection or influence processes and rarely controls for the other process. With respect to diffusion
studies, this means that selection is often not controlled for (Greenan, 2015).
An illustrative example for this focus on influence processes is Kincaid’s (2004) study on bounded
normative influence. It addresses the question of how an innovation can ever diffuse in a social system
since an innovation typically represents a deviation from the existing social norm and the social norm is a
strong influencing factor to understand individual attitudes, intentions, and behavior (Festinger, 1954).
Kincaid’s rationale is strongly linked to the typical network structure described earlier. Due to irregular
structures in most social networks, an innovation becomes a social norm in small and densely knit parts of
the network before it is adopted by an increasing number of other network members. For this reason, the
social norm is first bounded to small structures and, step by step, spreads out to a larger set of nodes. To
test this hypothesis, a simulation study is conducted using a social network in a Bangladesh village. Even
though Kincaid’s study is able to demonstrate the potential of bounded normative influence, it reveals a
central conceptual peculiarity typical for many diffusion studies. Because the network structure is regarded
as stable, any kind of positive or negative selection processes are precluded. Thus, the simulated
processes of contraceptive adoption in the village do not take into account that the change in behavior of
the persons might have a backlash on the social structure. Whether this is a valid assumption or a serious
violation depends on the topic and the time frame. However, because diffusion studies usually address
issues for which a certain social relevance is assumed, it is not persuasive to assume that the respective
network structure will be stable over a longer period. In fact, a longitudinal study on discussion networks
about contraceptives in Nepal shows that discussion partners with similar attitudes were selected over a
period of 14 months, leading to an increased homogeneity in groups (Boulay & Valente, 2005).
An example for research in which selection was analyzed without controlling for influence is Baym
and Ledbetter’s (2009) study of the dynamic of friendship in an online music network. A tendency toward
positive social selection was found.
The inference between selection and influence processes is a serious issue for any research
addressing dynamics within social networks. It is crucial to control for selection processes if one is
interested in influence processes and vice versa. Various authors document the extent of this inference.
Kandel (1978), for example, refers to an overestimation of influence by 100%, and Aral, Muchnik, and
Sundararajan (2009) calculate an overestimation of 300% to 700% if selection processes are not
accounted for in the model.
The literature review demonstrates that both social influence and social selection processes have
a long tradition in social science and that the necessity to consider both processes has been stressed
repeatedly over the past decades. Nonetheless, theoretical concepts and methods to account for this
interdependence have not yet become standard. The next section discusses the limitations that result
from this discrepancy as well as the possibilities to incorporate both social influence and social selection
processes by focusing on the topic of media use in social contexts.
1006 Thomas N. Friemel International Journal of Communication 9(2015)
Dynamic Network Models of Media Use
Research on TV use typically distinguishes two sets of influencing variables: individual factors and
situational factors (Taneja & Viswanathan, 2014). Beside sociodemographic variables, a major line of
research on individual factors can be subsumed under the label of uses and gratifications research, which
gained influence in the 1970s (Brown, Cramond, & Wilde, 1974; Cazeneuve, 1974; Greenberg, 1974).
Although most motives of TV use can be considered to be purely individualistic (e.g., relaxation,
information, habit, entertainment), many authors also consider social motives to be relevant for media
use. Typically, these motives are referred to as “communicatory utility” (Palmgreen & Rayburn, 1979),
“interpersonal utility,” or “coin of exchange function” (Levy & Windhal, 1984). However, empirical
evidence remains inconclusive because social motives often correlate with other gratifications (Rubin,
1983) or might not be evident to the people interviewed. Situational factors include nonindividual factors
such as media availability and group viewing. Obviously, group viewing is conjoined with social processes
because all co-viewers must agree on the selected program. Most research on co-viewing focuses on
family settings. Findings regarding peer group settings are limited to frequency statistics (Suoninen, 2001)
or psychosocial functions of shared media use (Weber, 2013). Thus, they do not allow for a statistical
distinction of influence and selection processes. Hence, even though social factors are considered to be
relevant for individual TV use by many theoretical approaches, empirical investigations on the issue are
rather limited.
Comparable limitations can be identified for empirical studies on diffusion and opinion leadership,
because many are not based on relational data. Based on an extensive literature review of 1,084
publications, Rogers (1995) found that the majority of diffusion studies (58%) were applying random
sampling, and only 1% were actually addressing the diffusion network. This is rather surprising since the
“relational” idea is at the very heart of any diffusion study. Interestingly, 20 years later, few empirical
studies control for influence and selection processes in social networks of media use. Steglich, Snijders,
and West (2006) discuss the dynamic of music taste, Friemel (2012) analyzed the preferences for specific
TV genres, and Shoham et al. (2012) test the influence of screen time on friendship ties and body mass
index. All three studies were conducted in school settings and found evidence for selection as well as
influence processes by applying stochastic actor-oriented models (Snijders, van de Bunt, & Steglich,
2010). Steglich, Snijders, and West (2006) analyzed the co-evolution of adolescents’ friendship networks,
music taste, and alcohol consumption. The data set includes friendship nominations among 129 pupils in
three consecutive annual waves starting at the age of 13. Each participant was asked to name up to six
other pupils out of his or her age cohort at a Scottish school. Pupils also were asked to indicate substance
use and music preferences. Music taste was measured by a 16-item inventory of music genres (e.g., rock,
indie, chart music, jazz), which was then reduced by means of a Mokken scale analysis resulting in three
dimensions: classical, techno, and rock. The results reveal influence effects of rock and techno music,
while selection effects account for network autocorrelation with respect to classical music.
Friemel (2012) analyzed data from 707 students in 29 Swiss school classes, including four panel
waves within one school year. In contrast to Steglich, Snijders, and West (2006), the network data were
collected using a roster with the names of all pupils of a class. TV preferences were measured by asking
how often students watched 41 TV programs. Analogous to Steglich, Snijders, and West, two genres
International Journal of Communication 9(2015) Influence Versus Selection 1007
(procedural crime series and music TV shows) were extracted by a principal component analysis. TV usage
intensity (duration per day and per week) was included as a third behavioral variable. The results reveal
that the music TV genre accounts for social selection processes, and only partial support was found for an
influence process that was related to TV intensity. The third study by Shoham et al. (2012) similarly
reports a significant influence effect of screen time for only one out of two analyzed schools (including 624
and 1,151 pupils, respectively). In their study, network data was collected by nomination of up to five
male and five female friends in two annual waves.
A major advantage of these studies is that the effects result from an estimation process that
includes all parameters at the same time. Consequently, selection and influence processes mutually
control for each other. A noteworthy limitation to all three studies is the restricted number of behavioral
variables included in the analysis. This becomes most apparent for Steglich, Snijders, and West (2006)
and Friemel (2012), who have collected very detailed data on media use but have reduced the complexity
prior to analysis on the basis of dimensional reduction techniques. The authors argue that this step was
necessary because the statistical tests at that time were simply not able to include all variables
simultaneously. However, this also restrains the potential empirical evidence for influence processes. In
both instances (i.e., music and TV), it can be argued that media use and genre preferences are related to
stable personality traits (Webster & Wakshlag, 1983). Several empirical studies have shown that
personality types such as neuroticism, extroversion, openness, agreeableness, conscientiousness, and
psychoticism are related to preferences of TV watching (Weaver, 1991), the actual use of TV (Finn, 1997),
and specific TV and music genres (Hall, 2005; Shim & Paul, 2007). Because these personality traits also
have been found to be relevant for network formation (Selfhout et al., 2010; Vukadinovic Greetham,
Hurling, Osborne, & Linley, 2011), it cannot be ruled out that the selection processes in the networks are
an artifact of the confounding factor of personality traits.
Two solutions are possible to address these limitations of previous studies. First, the personality
traits that are known to be influential for media and genre preferences as well as for network formation
could be included in the analysis as covariates. Second, the level of analysis could be shifted from genre
to specific TV programs. It can be assumed that personality traits are not influencing which program
within a genre is being watched. For example, one would not expect any critical difference in personality
traits for people watching CSI New York versus those watching CSI Las Vegas. Hence, if people who are
closely related to each other are more likely to watch a specific program instead of two different programs
from the same genre, then this network autocorrelation cannot be explained solely by similar personality
traits of the persons involved. This argumentation is in line with the theoretical concept of TV program
choice proposed by Webster and Wakshlag (1983). In their model, a direct link between viewing group
and specific program preferences is suggested, and program type preferences (genre) are dependent from
individual viewer needs.
It is, of course, also relevant to closely examine the kind of network relations that are analyzed.
It can be hypothesized that influence and selection processes are most likely if the level of specificity is
about the same for network ties and node attributes. Therefore, general network ties such as friendship or
spending time together are likely to be related to media use behavior on the level of media types and
genre. In contrast, more specific network ties such as interpersonal communication about TV programs
1008 Thomas N. Friemel International Journal of Communication 9(2015)
might be closer linked to specific TV programs. Friemel (2012, 2013) refers to five functions of
interpersonal communication about mass media content: (1) cognitive elaboration, (2) affect regulation,
(3) social positioning, (4) media selection, and (5) information. The first four functions are of special
relevance for this study, and it can be argued for each of them that they exert more influence on the level
of specific TV programs than they do in relation to TV genre. Cognitive elaboration (1) refers to the fact
that interpersonal communication can help TV users to elaborate TV content cognitively (e.g., understand
a complicated story). It is obvious that someone who is watching the same program is more
knowledgeable and more helpful for cognitive elaboration than someone who knows about the same genre
but not the specific program (Rogers & Kincaid, 1981). Affect regulation (2) is supported by interpersonal
communication during and after media use. Typical examples are conversations while watching a sporting
event or referring to it the day after, both of which increase enjoyment (Raney, 2006). Again, affect
regulation is likely to be more powerful if two persons are able to refer to the same content (e.g., a
specific soccer game) instead of referring, for example, to two different sporting events. Social positioning
(3) includes processes of social integration as well as distinction from other persons (Bakagiannis &
Tarrant, 2006). Hence, conversations about TV programs not only help to elaborate the content
cognitively and affectively but serve social purposes. In line with the two previous functions, it can be
assumed that social positioning will be more specific when people refer to programs instead of genres. The
concept of media selection (4) refers to processes in which interpersonal communication helps to learn
about TV programs that are of interest. Because TV genres are rather stable compared to specific
programs, this function is likely to be more relevant to one’s selection of a particular program. This
rationale also suggests that processes of social influence are not necessarily the result of an intended
persuasion process by an opinion leader but rather a result of various individual and social motives.
Research Question and Hypotheses
Based on the above discussion, it can be hypothesized that influence and selection processes
occur on two levels. In a first step, people might select conversation partners according to their preference
similarity on the level of TV genre (e.g., soap operas, sports, crime) that correlates with their personality
traits. In a second step, they might influence each other on the level of specific programs (e.g., CSI New
York versus Navy CIS). Based on this idea of a second-level opinion leadership process, five hypotheses
can be derived which will be tested by a reanalysis of longitudinal network data from Swiss school classes
(Friemel, 2012).
First, it is hypothesized (H1) that pupils who watch similar TV programs are more likely to talk to
each other about TV programs (social selection). The rationale is that watching the same program
supports the functions of cognitive elaboration and affect regulation.
Second, it is hypothesized (H2) that pupils who talk about TV programs will adjust their TV use to
each other on the level of single programs (social influence). The rationale behind this hypothesis is that
the four functions of interpersonal communication about mass media content described above can be
maximized on the level of specific TV programs. Cognitive elaboration, affect regulation, and social
positioning are most effective if the involved pupils are watching the same TV program. Furthermore, the
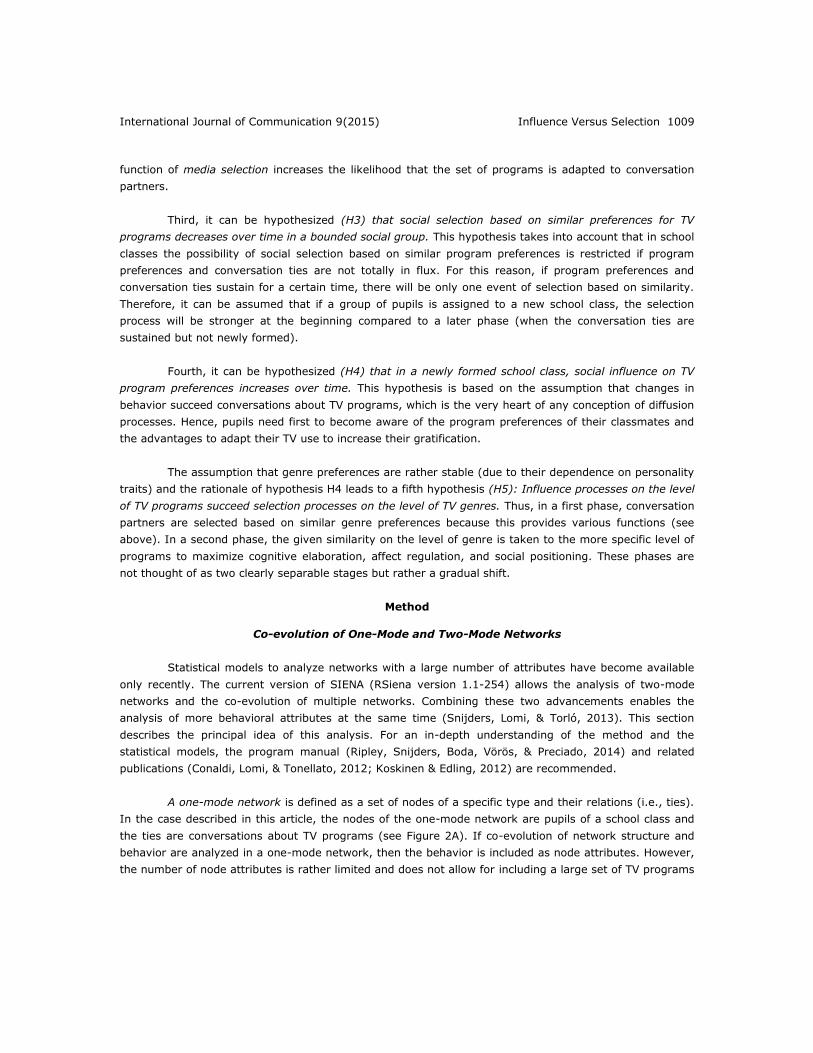
International Journal of Communication 9(2015) Influence Versus Selection 1009
function of media selection increases the likelihood that the set of programs is adapted to conversation
partners.
Third, it can be hypothesized (H3) that social selection based on similar preferences for TV
programs decreases over time in a bounded social group. This hypothesis takes into account that in school
classes the possibility of social selection based on similar program preferences is restricted if program
preferences and conversation ties are not totally in flux. For this reason, if program preferences and
conversation ties sustain for a certain time, there will be only one event of selection based on similarity.
Therefore, it can be assumed that if a group of pupils is assigned to a new school class, the selection
process will be stronger at the beginning compared to a later phase (when the conversation ties are
sustained but not newly formed).
Fourth, it can be hypothesized (H4) that in a newly formed school class, social influence on TV
program preferences increases over time. This hypothesis is based on the assumption that changes in
behavior succeed conversations about TV programs, which is the very heart of any conception of diffusion
processes. Hence, pupils need first to become aware of the program preferences of their classmates and
the advantages to adapt their TV use to increase their gratification.
The assumption that genre preferences are rather stable (due to their dependence on personality
traits) and the rationale of hypothesis H4 leads to a fifth hypothesis (H5): Influence processes on the level
of TV programs succeed selection processes on the level of TV genres. Thus, in a first phase, conversation
partners are selected based on similar genre preferences because this provides various functions (see
above). In a second phase, the given similarity on the level of genre is taken to the more specific level of
programs to maximize cognitive elaboration, affect regulation, and social positioning. These phases are
not thought of as two clearly separable stages but rather a gradual shift.
Method
Co-evolution of One-Mode and Two-Mode Networks
Statistical models to analyze networks with a large number of attributes have become available
only recently. The current version of SIENA (RSiena version 1.1-254) allows the analysis of two-mode
networks and the co-evolution of multiple networks. Combining these two advancements enables the
analysis of more behavioral attributes at the same time (Snijders, Lomi, & Torló, 2013). This section
describes the principal idea of this analysis. For an in-depth understanding of the method and the
statistical models, the program manual (Ripley, Snijders, Boda, Vörös, & Preciado, 2014) and related
publications (Conaldi, Lomi, & Tonellato, 2012; Koskinen & Edling, 2012) are recommended.
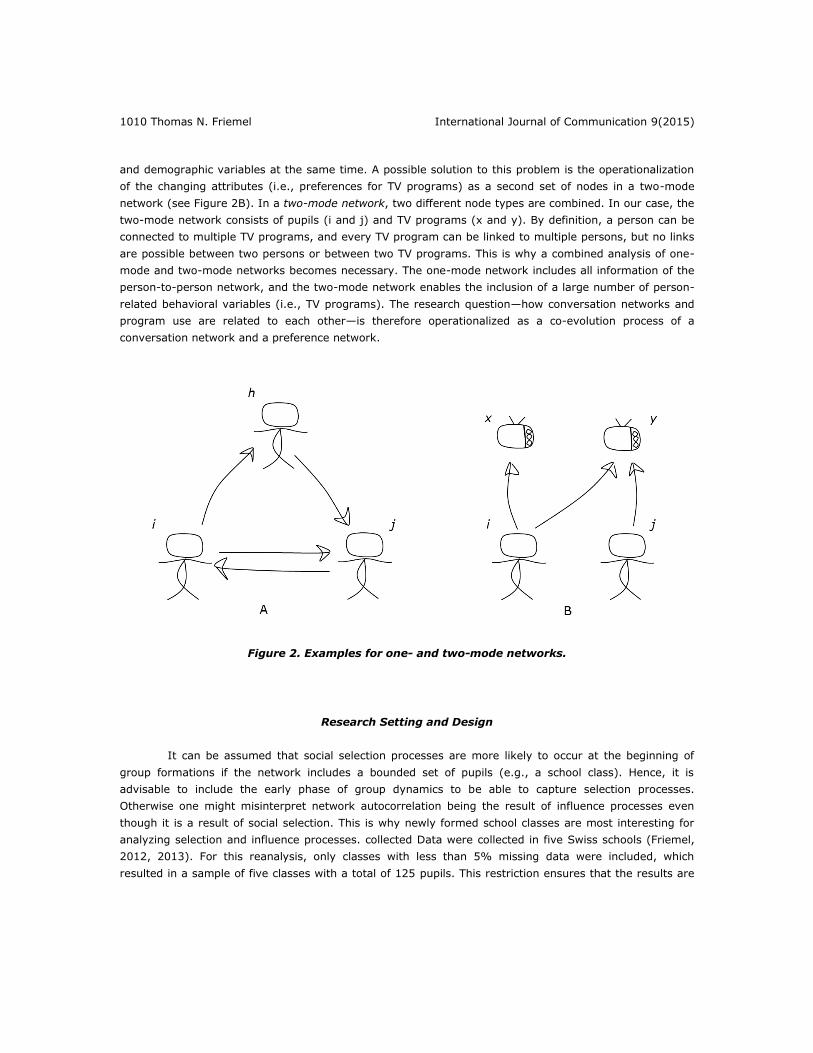
A one-mode network is defined as a set of nodes of a specific type and their relations (i.e., ties).
In the case described in this article, the nodes of the one-mode network are pupils of a school class and
the ties are conversations about TV programs (see Figure 2A). If co-evolution of network structure and
behavior are analyzed in a one-mode network, then the behavior is included as node attributes. However,
the number of node attributes is rather limited and does not allow for including a large set of TV programs
1010 Thomas N. Friemel International Journal of Communication 9(2015)
and demographic variables at the same time. A possible solution to this problem is the operationalization
of the changing attributes (i.e., preferences for TV programs) as a second set of nodes in a two-mode
network (see Figure 2B). In a two-mode network, two different node types are combined. In our case, the
two-mode network consists of pupils (i and j) and TV programs (x and y). By definition, a person can be
connected to multiple TV programs, and every TV program can be linked to multiple persons, but no links
are possible between two persons or between two TV programs. This is why a combined analysis of one-
mode and two-mode networks becomes necessary. The one-mode network includes all information of the
person-to-person network, and the two-mode network enables the inclusion of a large number of person-
related behavioral variables (i.e., TV programs). The research question—how conversation networks and
program use are related to each other—is therefore operationalized as a co-evolution process of a
conversation network and a preference network.
Figure 2. Examples for one- and two-mode networks.
Research Setting and Design
It can be assumed that social selection processes are more likely to occur at the beginning of
group formations if the network includes a bounded set of pupils (e.g., a school class). Hence, it is
advisable to include the early phase of group dynamics to be able to capture selection processes.
Otherwise one might misinterpret network autocorrelation being the result of influence processes even
though it is a result of social selection. This is why newly formed school classes are most interesting for
analyzing selection and influence processes. collected Data were collected in five Swiss schools (Friemel,
2012, 2013). For this reanalysis, only classes with less than 5% missing data were included, which
resulted in a sample of five classes with a total of 125 pupils. This restriction ensures that the results are
International Journal of Communication 9(2015) Influence Versus Selection 1011
not biased by the chosen treatment of missing values (Huisman & Steglich, 2008; Ripley et al., 2014). The
five selected classes did not differ significantly from the other classes with respect to variables such as
network structures and TV use. All classes are from so-called gymnasium schools, which are the
equivalent to grammar schools in the United Kingdom and academic high schools in the United States.
Class sizes range from 23 to 27 students, and the average age is 15 years. Data were collected in four
waves during the first year, with the first wave in weeks 4 to 6 after the school year had started. The time
interval between the waves was incrementally stretched from 8 to 12 to 16 weeks, because network
dynamics are generally assumed to slow down over time.
Measures
Based on an additional survey among the pupils some weeks before the first panel wave, a list of
TV programs was compiled. This resulted in a list of 46 TV programs for which pupils were asked to
indicate whether they knew a particular program and how frequently they watched it (never, sometimes,
frequently, or always). For this analysis, 39 programs were included which were aired during the entire
period of the panel survey. Since all programs were aired on free TV and 94% of all pupils had a TV set at
home, accessibility to the programs is unlikely to be a strong influencing factor. A roster including the
names of all pupils within the respective classes was used to measure the conversation network. Pupils
were asked to indicate how frequently they talked with each class member about TV programs (never,
sometimes, or often). Both networks were dichotomized for model calculation by including the two top
categories (i.e., frequently or always watching a program and sometimes or often talking with someone).
The average number of programs pupils watched at least frequently declined from 6.2 in the first wave to
4.6 programs in the last wave, which represents 12% to 16% of all programs. At the same time, the
average number of conversation partners increased form 3.6 in the first wave to 8.4 in the last wave.
Model Parameters
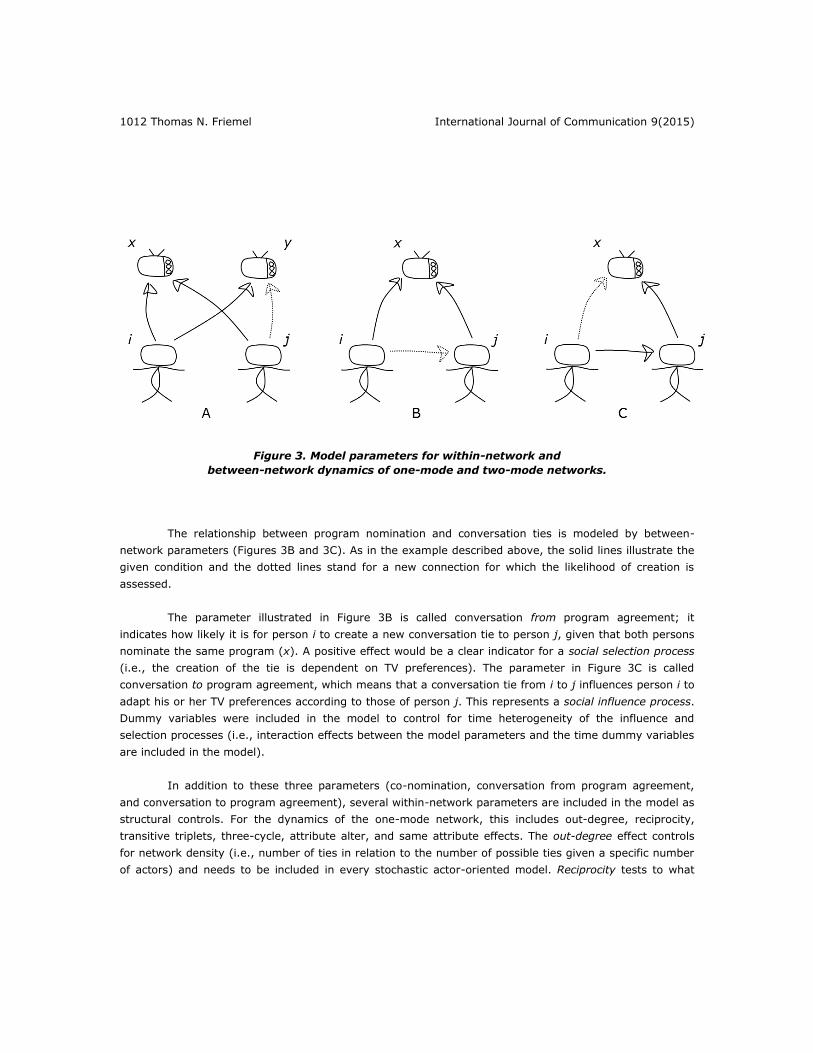
To test the hypotheses, three model parameters are of special interest. The first parameter is
called identical co-nomination or four-cycle and is illustrated in Figure 3A (Agneessens & Roose, 2008). A
co-nomination is given if two actors (i and j) who watch a specific TV program (x) both watch another
program (y). The stochastic actor-oriented model tests whether a program (y) is more likely to be chosen
by a person (j) depending on the nomination of another person (i) with whom j has other preferences in
common (program x). It can be assumed that, in a situation where persons i and j nominate program x
and person i is nominating program y (solid lines in Figure 3A), person j would tend to nominate program
y as well (dotted line in Figure 3A). However, this dynamic is not directly related to conversation
structures and therefore should not be mistaken as a direct measurement of an influence process.
Instead, it can be interpreted as a result of program preferences that are dependent on personality traits
and other individual program preferences. For example, two persons with a particular interest in sports
(similar audience characteristic) might watch two sports shows (similar program characteristic) even
though they have never talked about it and thus have neither influenced nor selected each other. Rather,
they share the same preferences, which results in similar patterns in the two-mode network. For this
reason, co-nomination can be regarded as an additional control variable to test for behavior dynamics not
related to conversation that might lead to network autocorrelation.
1012 Thomas N. Friemel International Journal of Communication 9(2015)
Figure 3. Model parameters for within-network and
between-network dynamics of one-mode and two-mode networks.
The relationship between program nomination and conversation ties is modeled by between-
network parameters (Figures 3B and 3C). As in the example described above, the solid lines illustrate the
given condition and the dotted lines stand for a new connection for which the likelihood of creation is
assessed.
The parameter illustrated in Figure 3B is called conversation from program agreement; it
indicates how likely it is for person i to create a new conversation tie to person j, given that both persons
nominate the same program (x). A positive effect would be a clear indicator for a social selection process
(i.e., the creation of the tie is dependent on TV preferences). The parameter in Figure 3C is called
conversation to program agreement, which means that a conversation tie from i to j influences person i to
adapt his or her TV preferences according to those of person j. This represents a social influence process.
Dummy variables were included in the model to control for time heterogeneity of the influence and
selection processes (i.e., interaction effects between the model parameters and the time dummy variables
are included in the model).
In addition to these three parameters (co-nomination, conversation from program agreement,
and conversation to program agreement), several within-network parameters are included in the model as
structural controls. For the dynamics of the one-mode network, this includes out-degree, reciprocity,
transitive triplets, three-cycle, attribute alter, and same attribute effects. The out-degree effect controls
for network density (i.e., number of ties in relation to the number of possible ties given a specific number
of actors) and needs to be included in every stochastic actor-oriented model. Reciprocity tests to what
International Journal of Communication 9(2015) Influence Versus Selection 1013
extent a nomination from i to j is reciprocated by a nomination from j to i {i j; j i} in a subsequent
time point (the annotation refers to the visual representation in Figure 2A). Transitive triplets indicate that
new ties are more likely to be created with actors to whom an indirect connection already exists {i h
j; i j}. Three-cycles account for the tendency that triads do not get closed by a transitive tie but by a
cyclical structure {i h j; j i}. Attribute alter effects take the attribute of the other node into
account, which was used to control for gender differences on the likelihood of tie formation (gender alter).
Same attribute effect takes the attribute of both nodes into account. A positive parameter indicates that
ties are more likely to be created between nodes with the same attribute. Hence, this parameter was used
to test for the tendency that ties are created to pupils of the same gender (Lubbers, Snijders, & van der
Werf, 2011). A more detailed elaboration of these effects and their mathematical definition can be found
in the user manual for RSiena (Ripley et al., 2014). In addition to theoretical assumptions, the model
specification process is supported by score tests that indicate which parameters should be included or
removed to develop a parsimonious and well-fitting model (Ripley et al., 2014).
Results
The Jaccard index provides a measure for the amount of change between successive networks.
The average values for the periods of conversation networks (t1–2 = .37; t2–3 = .53; t3–4 = .50) and TV use
(t1–2 = .56; t2–3 = .54; t3–4 = .52) are well above the suggested lower bound of .3 (Ripley et al., 2014). In
other words, both the conversation networks as well as the TV use networks include sufficient changes
(i.e., information) to calculate reliable models. Table 1 reports the parameter estimates, their standard
errors, and the significance of each parameter according to t statistics.
1014 Thomas N. Friemel International Journal of Communication 9(2015)
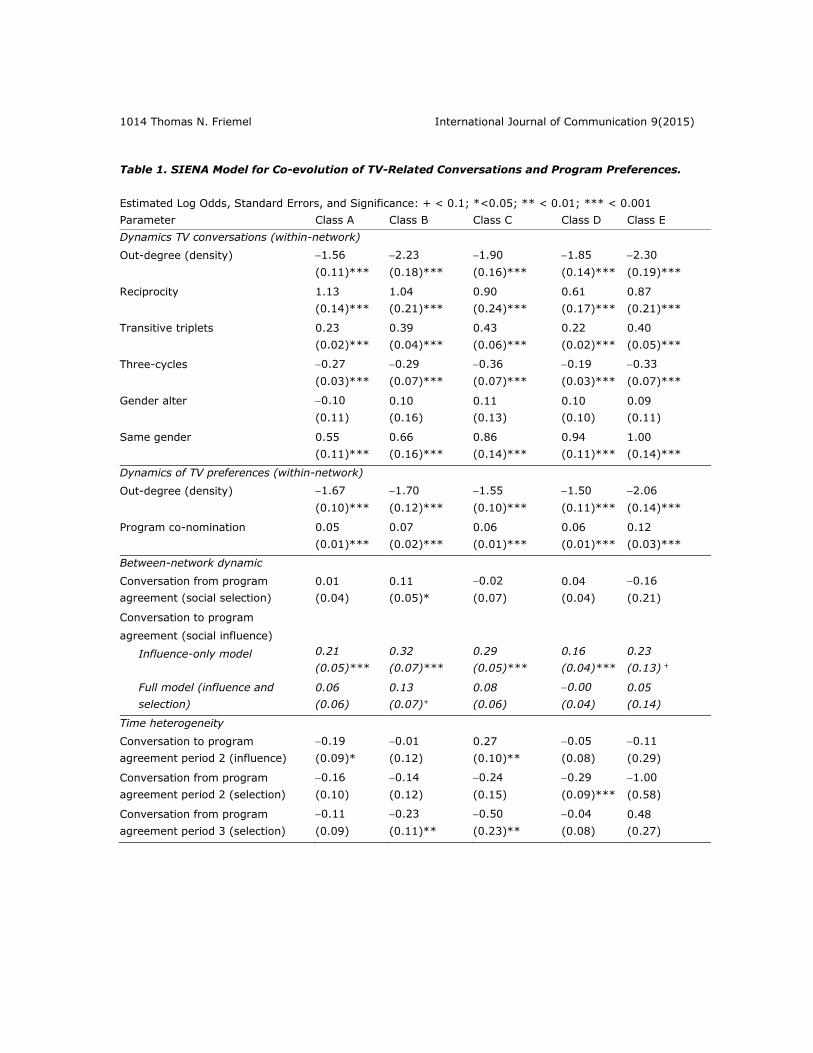
Table 1. SIENA Model for Co-evolution of TV-Related Conversations and Program Preferences.
Estimated Log Odds, Standard Errors, and Significance: + < 0.1; *<0.05; ** < 0.01; *** < 0.001
Parameter Class A Class B Class C Class D Class E
Dynamics TV conversations (within-network)
Out-degree (density) 1.56
(0.11)***
2.23
(0.18)***
1.90
(0.16)***
1.85
(0.14)***
2.30
(0.19)***
Reciprocity 1.13
(0.14)***
1.04
(0.21)***
0.90
(0.24)***
0.61
(0.17)***
0.87
(0.21)***
Transitive triplets 0.23
(0.02)***
0.39
(0.04)***
0.43
(0.06)***
0.22
(0.02)***
0.40
(0.05)***
Three-cycles 0.27
(0.03)***
0.29
(0.07)***
0.36
(0.07)***
0.19
(0.03)***
0.33
(0.07)***
Gender alter 0.10
(0.11)
0.10
(0.16)
0.11
(0.13)
0.10
(0.10)
0.09
(0.11)
Same gender 0.55
(0.11)***
0.66
(0.16)***
0.86
(0.14)***
0.94
(0.11)***
1.00
(0.14)***
Dynamics of TV preferences (within-network)
Out-degree (density) 1.67
(0.10)***
1.70
(0.12)***
1.55
(0.10)***
1.50
(0.11)***
2.06
(0.14)***
Program co-nomination 0.05
(0.01)***
0.07
(0.02)***
0.06
(0.01)***
0.06
(0.01)***
0.12
(0.03)***
Between-network dynamic
Conversation from program
agreement (social selection)
0.01
(0.04)
0.11
(0.05)*
0.02
(0.07)
0.04
(0.04)
0.16
(0.21)
Conversation to program
agreement (social influence)
Influence-only model
0.21
(0.05)***
0.32
(0.07)***
0.29
(0.05)***
0.16
(0.04)***
0.23
(0.13) +
Full model (influence and
selection)
0.06
(0.06)
0.13
(0.07)+
0.08
(0.06)
0.00
(0.04)
0.05
(0.14)
Time heterogeneity
Conversation to program
agreement period 2 (influence)
0.19
(0.09)*
0.01
(0.12)
0.27
(0.10)**
0.05
(0.08)
0.11
(0.29)
Conversation from program
agreement period 2 (selection)
0.16
(0.10)
0.14
(0.12)
0.24
(0.15)
0.29
(0.09)***
1.00
(0.58)
Conversation from program
agreement period 3 (selection)
0.11
(0.09)
0.23
(0.11)**
0.50
(0.23)**
0.04
(0.08)
0.48
(0.27)
International Journal of Communication 9(2015) Influence Versus Selection 1015
The first group of parameters models the within-network dynamics of the TV conversation
network. The parameter estimates are log odds indicating the likelihood of increasing tie strength by one
unit (i.e., creating a tie) given the respective condition. The negative sign of the out-degree effect
indicates that the creation and maintenance of a conversation tie requires resources and therefore is
limited (i.e., every new tie decreases the likelihood of a subsequent tie). The specific value of the out-
degree effect cannot be interpreted in a straightforward manner but needs to be included to control for
the overall density of the network. The positive reciprocity effect is typical for social networks and
indicates that it is more likely to create a new tie (or increase its strength by one unit) to a person by
whom one is nominated as well. In school class A, the log odd for this parameter is 1.131, which can be
converted to a probability value of 310% (e1.131 = 3.10). Thus, it is about three times as likely to
reciprocate a tie compared to creating a new tie to a person for which this condition is not met.
With respect to gender, no significant ego or alter effects were found (the results only report the
gender alter effect since the ego effect was not included in the final model). This means that male and
female pupils have the same likelihood to create a conversation tie or being chosen by someone.
Nevertheless, there is a clear tendency toward gender hemophilic selection (positive same-gender effect).
This means that males and females were more likely to create a new tie to someone of the same gender.
The second group of parameters includes the within-network dynamics of the two-mode network
regarding the TV preferences. Again, the out-degree effect controls for the overall density, and the
negative sign indicates that people have limited resources (e.g., time) to watch TV. The positive program
co-nomination effect confirms a significant tendency toward co-nomination of TV programs. This means
that if two people both watch a specific program, they are likely to have also another program in common.
The central parameters to test the hypotheses are reported in the third group. The two between-
network dynamic parameters model the influence of the conversation network on the TV preference
network and vice versa. The first parameter (conversation from program agreement) represents the
tendency to create new conversation ties based on the TV preference network (Figure 3B). A positive
parameter would support hypothesis H1, which assumes that pupils who watch similar TV programs are
more likely to talk to each other about TV programs. However, empirical support for this social selection
process is found in only one out of five school classes. The results for the other classes are not even close
to statistical significance.
The second parameter (conversation to program agreement) models the influence process. In a
first step, an influence-only model was calculated (excluding the social selection parameter reported above
as well as co-nomination). This baseline model provides a benchmark of what would have been found
without controlling for program co-nomination and TV-related selection processes (i.e., conversation from
program agreement). In four out of five school classes, clear influence processes would have been found,
and the parameter of the fifth class is significant at the 10% significance level. Converted to probability
values, the results indicate that a conversation tie to a person who is watching a specific program
increases the likelihood to start watching the same program by 17% to 37%. This value is multiplied by
every additional person. Thus, this process can result in a very strong influence—constrained only by the
number of available persons in the network and the resources to maintain the contacts, which are
1016 Thomas N. Friemel International Journal of Communication 9(2015)
represented by the negative density effect. At first glance, this suggests a clear and comparably strong
influence process. However, by including the selection effect and the co-nomination effect (full model), the
influence effect becomes insignificant. The only exception is class B, for which a weak influence effect is
found (at the 10% significance level). Therefore, no support is found for hypothesis H2 that pupils who
talk about TV programs will adjust their TV behavior to each other on the level of specific programs when
program co-nomination and TV-related social selection processes are included as controls.
Finally, it was tested whether these effects are stable over time or whether selection and
influence processes are increasing or decreasing. More precisely, a decreasing value for the selection
parameter (H3) and an increasing value for the influence parameter (H4) were assumed. Because the
data set includes four panel waves, three periods have been modeled. Score tests suggested including one
time dummy for the influence parameter (period 2) and two for the selection parameter (periods 2 and 3).
A positive parameter would indicate that, in the respective period, the selection or influence parameter is
stronger compared to period 1. For the hypothesized decrease of selection processes, some support is
found, because 3 out of 10 parameters are significant, and 9 out of 10 parameters have negative signs.
However, the results are inconclusive for the influence process. Although influence significantly decreases
in class A, it increases in class C. Hence, there is partial support for hypothesis H3 but not for H4.
Discussion
The aim of this article was to discuss the necessity of theoretical elaborations and empirical
methods for a network perspective on opinion leadership. A decisive argument is to analytically separate
selection processes from influence. Because both lead to network autocorrelation, one is likely to
misinterpret the strength of influence processes if selection processes are not controlled for (Aral et al.,
2009; Kandel, 1978). However, considering the large body of published research on diffusion and opinion
leadership, this is rarely done, and analyses of longitudinal network data have remained an exception. The
empirical evidence based on network data is limited probably because of the difficulty of data collection
and the fact that the necessary statistical tools (e.g., stochastic actor-oriented modeling) became
available only recently (Snijders, van de Bunt, & Steglich, 2010). This article makes use of an existing
data set (Friemel, 2012, 2013), which includes four panel waves of conversation ties and TV program
preferences of pupils in Swiss school classes.
In a first step, a baseline model was calculated that did not control for selection processes and
program co-nomination. Significant influence effects are found, but these effects lose significance when
the full model is calculated including selection processes and co-nomination. Therefore, little statistical
support for influence processes among pupils’ TV use is found. Only in one out of five school classes was
the influence parameter significant at the 10% level. This is in line with previous analyses (Friemel, 2012),
which included TV usage intensity and two selected genres (procedural crime series and music television).
However, in contrast to the reference study, little evidence was found for selection processes on the level
of TV programs. Only in one out of five school classes was a significant selection effect found. For this
reason, it is unlikely that pupils select their conversation partners according to their similarity of TV
program preferences. Based on these findings, the respective hypotheses (H1 regarding selection and H2
regarding influence) need to be rejected. Also the hypothesized time heterogeneity (H3 and H4) appears

International Journal of Communication 9(2015) Influence Versus Selection 1017
to be of minor relevance. However, it remains an open question whether this is due to the chosen time
frame of one school year, because Steglich, Snijders, and West (2006) as well as Shoham et al. (2012)
found evidence for influence processes in two-year and three-year panel surveys, respectively. Another
difference between the three studies is the method of data collection. The two studies in which network
data were collected by nomination (Steglich, Snijders, & West, 2006; Shoham et al., 2012) found support
for influence processes, and the rooster design (Friemel, 2012) provided more support for selection
processes.
Hypothesis H5 intended to link this reanalysis with the results of the original study, which
analyzed the TV usage intensity and preferences on the level of different genres. Because the original
study found clear evidence for selection processes (Friemel, 2012), it was assumed that influence
processes on the level of TV programs might succeed these selection processes. However, due to the
weak support for influence processes on the program level (H2) and the inconclusive finding for their
change over time (H4), there is no empirical support for this last assumption in the analyzed data.
In sum, the rejection of the traditional explanation of network autocorrelation (i.e., influence) is
not replaced by the most obvious alternative (i.e., selection). Controlling for selection processes decreases
the power of influence processes without being powerful enough to become significant on its own. Beside
various control variables, the only significant effect is the program co-nomination, which models general
patterns of program preferences. For all five networks, this effect was significant, indicating that if two
pupils have one program in common, this increases the likelihood for a second program to become of
mutual preference. This effect is not related to the conversation network. Therefore, it reflects a kind of
general pattern of program preferences. This is plausible since most pupils tend to have preferences for
specific genres.
This positive interrelatedness of TV programs is a major difference from the many diffusion
studies focusing on innovations that are typically rivaling with other innovations. It is understood that TV
programs also do stand in competition with one another, but since costs are low for pupils to watch
several programs of their preferred genre, this might be of less relevance. Hence, it cannot be ruled out
that these findings are valid only for a specific type of topic. Nevertheless, this study illustrates the
importance of controlling for alternative dynamics (i.e., co-nomination and social selection) in addition to
influence process. As has been demonstrated throughout this article, one would overestimate the power of
influence process and thereby the power of opinion leaders if one does not control for social selection at
the same time. This, of course, also holds true the other way around. Yet, because the idea of social
influence and the role of opinion leaders are much more prevalent as explanations for network
autocorrelation, the main plea of this network perspective on opinion leadership is that the inclusion of
social selection is a mandatory aspect when analyzing social influence processes.
1018 Thomas N. Friemel International Journal of Communication 9(2015)
References
Agneessens, F., & Roose, H. (2008). Local structural properties and attribute characteristics in 2-mode
networks: p∗ models to map choices of theater events. Journal of Mathematical Sociology, 32(3),
204–237. doi:10.1080/00222500802148685
Agneessens, F., & Wittek, R. (2012). Where do intra-organizational advice relations come from? The role
of informal status and social capital in social exchange. Social Networks, 34(3), 333–345.
doi:10.1016/j.socnet.2011.04.002
Aral, S., Muchnik, L., & Sundararajan, A. (2009). Distinguishing influence-based contagion from
homophily-driven diffusion in dynamic networks. Proceedings of the National Academy of
Sciences, 106(51), 21544–21549. doi:10.1073/pnas.0908800106
Bakagiannis, S., & Tarrant, M. (2006). Can music bring people together? Effects of shared
musical preference on intergroup bias in adolescence. Scandinavian Journal of Psychology, 47(2),
129–136. doi:10.1111/j.1467-9450.2006.00500.x
Baym, N. K., & Ledbetter, A. (2009). Tunes that bind? Information, Communication and Society, 12(3),
408–427. doi:10.1080/13691180802635430
Berelson, B. R., Lazarsfeld, P. F., & McPhee, W. N. (1954). Voting: A study of opinion formation in a
presidential campaign. Chicago, IL: University of Chicago Press.
Boulay, M., & Valente, T. W. (2005). The selection of family planning discussion partners in Nepal. Journal
of Health Communication, 10(6), 519–536. doi:10.1080/10810730500228789
Brown, J. R., Cramond, J. K., & Wilde R. J. (1974). Displacement effects of television and the child’s
functional orientation to media. In J. G. Blumler & E. Katz (Eds.), The uses of mass
communications: Current perspectives on gratifications research (pp. 93–112). Beverly Hills, CA:
SAGE Publications.
Cazeneuve, J. (1974). Television as a functional alternative to traditional sources of need satisfaction. In
J. G. Blumler & E. Katz (Eds.), The uses of mass communications: Current perspectives on
gratifications research (pp. 213–223). Beverly Hills, CA: SAGE Publications.
Conaldi, G., Lomi, A., & Tonellato, M. (2012). Dynamic models of affiliation and the network structure of
problem solving in an open source software project. Organizational Research Methods, 15(3),
385–412. doi:10.1177/1094428111430541

International Journal of Communication 9(2015) Influence Versus Selection 1019
de Tarde, G. (1890). Les lois de l’imitation. Étude sociologique. Paris, France: Alcan.
Festinger, L. (1954). A theory of social comparison processes. Human Relations, 7(2), 117–140.
doi:10.1177/001872675400700202
Finn, S. (1997). Origins of media exposure: Linking personality traits to TV, radio, print, and film use.
Communication Research, 24(5), 507–529. doi:10.1177/009365097024005003
Friemel, T. N. (2012). Network dynamics of television use in school classes. Social Networks, 34(3), 346–
358. doi:10.1016/j.socnet.2011.08.002
Friemel, T. N. (2013). Sozialpsychologie der Mediennutzung: Motive, Charakteristik und Wirkungen
interpersonaler Kommunikation über massenmediale Inhalte. Konstanz, Germany: UVK.
Greenan, C. C. (2015). Diffusion of innovations in dynamic networks. Journal of the Royal Statistical
Society, 178(1), 147–166. doi:10.1111/rssa.12054
Greenberg, B. S. (1974). Gratifications of television viewing and their correlates for British children. In J.
G. Blumler & E. Katz (Eds.), The uses of mass communications: Current perspectives on
gratifications research (pp. 71–92). Beverly Hills, CA: SAGE Publications.
Hall, A. (2005). Audience personality and the selection of media and media genres. Media Psychology,
7(4), 377–398. doi:10.1207/S1532785XMEP0704_4
Hartley, E. L. (1950–1951). The social psychology of opinion formation. Public Opinion Quarterly, 14(4),
668–674.
Huisman, C. (2014). Does it matter what friends think, say, or do? The role of friends’ smoking attitudes
and behavior for Dutch adolescents’ smoking behavior. Substance Use and Misuse, 49(6), 715–
723. doi:10.3109/10826084.2013.863347
Huisman, M., & Steglich, C. (2008). Treatment of non-response in longitudinal network studies. Social
Networks, 30(4), 297–308. doi:10.1016/j.socnet.2008.04.004
Iyengar, R., van den Bulte, C., & Valente, T. W. (2011). Opinion leadership and social contagion in new
product diffusion. Marketing Science, 30(2), 195–212. doi:10.1287/mksc.1100.0566
Kandel, D. B. (1978). Homophily, selection, and socialization in adolescent friendships. American Journal
of Sociology, 84(2), 427–436.
1020 Thomas N. Friemel International Journal of Communication 9(2015)
Kincaid, L. D. (2004). From innovation to social norm: Bounded normative influence. Journal of Health
Communication, 9, 37–57. doi:10.1080/10810730490271511
Knecht, A., Snijders, T. A. B., Baerveldt, C., Steglich, C. E. G., & Raub, W. (2010). Friendship and
delinquency: Selection and influence processes in early adolescence. Social Development, 19(3),
494–514. doi:10.1111/j.1467-9507.2009.00564.x
Koskinen, J., & Edling, C. (2012). Modelling the evolution of a bipartite network: Peer referral in
interlocking directorates. Social Networks, 34(3), 309–322. doi:10.1016/j.socnet.2010.03.001
Lazarsfeld, P. F., Berelson, B., & Gaudet, H. (1944). The people’s choice: How the voter makes up his
mind in a presidential campaign. New York, NY: Duell, Sloan & Pearce.
Levy, M. R., & Windhal, S. (1984). Audience activity and gratifications: A conceptual clarification and
exploration. Communication Research, 11(1), 51–78.
Lubbers, M. J., Snijders, T. A. B., & van der Werf, M. P. C. (2011). Dynamics of peer relationships across
the first two years of junior high as a function of gender and changes in classroom composition.
Journal of Research on Adolescence, 21(2), 488–504. doi:10.1111/j.1532-7795.2010.00688.x
McPherson, M., Smith-Lovin, L., & Cook, J. M. (2001). Birds of a feather: Homophily in social networks.
Annual Review of Sociology, 27, 415–444. doi:10.1146/annurev.soc.27.1.415
Merton, R. K. (1949). Patterns of influence: A study of interpersonal influence and of communications
behavior in a local community. In P. F. Lazarsfeld & F. N. Stanton (Eds.),
Communications research 1948–1949 (pp. 180–219). New York, NY: Harper.
Palmgreen, P., & Rayburn II, J. (1979). Uses and gratifications and exposure to public television.
Communication Research, 6(2), 155–179.
Raney, A. A. (2006). Why we watch and enjoy mediated sports. In A. A. Raney & J. Bryant (Eds.),
Handbook of sports and media (pp. 313–329). Mahwah, NJ: Lawrence Erlbaum.
Rapoport, A., & Horrath, W. J. (1961). A study of large sociogram. Behavioral Science, 6(4), 279–291.
Rice, R. E. (2009). Diffusion of innovations: Theoretical extensions. In R. L. Nabi & M. B. Oliver (Eds.), The
Sage handbook of media processes and effects (pp. 489–503). Thousand Oaks, CA: SAGE
Publications.
International Journal of Communication 9(2015) Influence Versus Selection 1021
Ripley, R. M., Snijders, T. A. B., Boda, Z., Vörös, A., & Preciado, P. (2014). Manual for RSiena. Retrieved
from http://www.stats.ox.ac.uk/~snijders/siena/RSiena_Manual.pdf
Rogers, E. M. (1995). Diffusion of innovations. New York, NY: Free Press.
Rogers, E. M., & Kincaid, L. D. (1981). Communication networks: Toward a new paradigm of research.
New York, NY: Free Press.
Rubin, A. M. (1983). Television uses and gratifications: The interactions of viewing patterns and
motivations. Journal of Broadcasting, 27(1), 37–51.
Ryan, B., & Gross, N. C. (1943). The diffusion of hybrid seed corn in two Iowa communities. Rural
Sociology, 8(1), 15–24.
Selfhout, M., Burk, W., Branje, S., Denissen, J., van Aken, M., & Meeus, W. (2010). Emerging late
adolescent friendship networks and big five personality traits: A social network approach. Journal
of Personality, 78(2), 509–538. doi:10.1111/j.1467-6494.2010.00625.x
Shim, J. W., & Paul, B. (2007). Effects of personality types on the use of television genre. Journal of
Broadcasting and Electronic Media, 51(2), 287–304. doi:10.1080/08838150701304852
Shoham, D. A., Tong, L., Lamberson, P. J., Auchincloss, A. H., Zhang, J., Dugas, L., & O’Connor, K. A.
(2012). An actor-based model of social network influence on adolescent body size, screen time,
and playing sports. PLOS ONE, 7(6). doi:10.1371/journal.pone.0039795
Skvoretz, J. (1985). Random and biased networks: Simulations and approximations. Social Networks,
7(3), 225–261. doi:10.1016/0378-8733(85)90016-4
Snijders, T. A. B., Lomi, A., & Torló, V. J. (2013). A model for the multiplex dynamics of two-mode and
one-mode networks, with an application to employment preference, friendship, and advice. Social
Networks, 35(2), 265–276. doi:10.1016/j.socnet.2012.05.005
Snijders, T. A. B., van de Bunt, G. G., & Steglich, C. E. (2010). Introduction to stochastic actor-based
models for network dynamics. Social Networks, 32(1), 44–60. doi:10.1016/j.socnet.2009.02.004

1022 Thomas N. Friemel International Journal of Communication 9(2015)
Steglich, C., Snijders, T. A. B., & West, P. (2006). Applying SIENA: An illustrative analysis of the
coevolution of adolescents’ friendship networks, taste in music, and alcohol consumption.
Methodology, 2(1), 48–56. doi:10.1027/1614-1881.2.1.48
Suoninen, A. (2001). The role of media in peer group relations. In S. Livingstone & M. Bovill (Eds.),
Children and their changing media environment: A European comparative study (pp. 201–219).
Mahwah, NJ: Lawrence Erlbaum.
Taneja, H., & Viswanathan, V. (2014). Still glued to the box? Television viewing explained in a multi-
platform age integrating individual and situational predictors. International Journal of
Communication, 8, 2134–2159.
Valente, T. W. (1995). Network models of the diffusion of innovations. Cresskill, NJ: Hampton.
Valente, T. W. (1996). Social network thresholds in the diffusion of innovations. Social Networks, 18(1),
69–89. doi:10.1016/0378-8733(95)00256-1
Vukadinovic Greetham, D., Hurling, R., Osborne, G., & Linley, A. (2011). Social networks and positive and
negative affect. Procedia: Social and Behavioral Sciences, 22, 4–13.
doi:10.1016/j.sbspro.2011.07.051
Weaver, J. B. (1991). Exploring the links between personality and media preferences. Personality and
Individual Differences, 12(12), 1293–1299. doi:10.1016/0191-8869(91)90203-N
Weber, M. (2013). Psychosocial functions of shared media use among German adolescents. Journal of
Children and Media, 7(3), 366–382. doi:10.1080/17482798.2012.755634
Webster, J. G., & Wakshlag, J. J. (1983). A theory of television program choice. Communication Research,
10(4), 430–446. doi:10.1177/009365083010004002