influences of watershed, riparian-corridor, and reach-scale characteristics on aquatic biota in...
TRANSCRIPT

JOURNAL OF THE AMERICAN WATER RESOURCES ASSOCIATIONVOL. 37, NO. 6 AMERICAN WATER RESOURCES ASSOCIATION DECEMBER 2001
INFLUENCES OF WATERSHED, RIPARIAN-CORRIDOR, AND REACH-SCALECHARACTERISTICS ON AQUATIC BIOTA IN AGRICULTURAL WATERSHEDS1
Jana S. Stewart, Lizhu Wang, John Lyons, Judy A. Horwatich, and Roger Bannerman2
ABSTRACT: Multivariate analyses and correlations revealedstrong relations between watershed and riparian-corridor landcover, and reach-scale habitat versus fish and macroinvertebrateassemblages in 38 warmwater streams in eastern Wisconsin.Watersheds were dominated by agricultural use, and ranged in sizefrom 9 to 71 km2 Watershed land cover was summarized fromsatellite-derived data for the area outside a 30-m buffer. Riparianland cover was interpreted from digital orthophotos within 10-, 10-to 20-, and 20- to 30-m buffers. Reach-scale habitat, fish, andmacroinvertebrates were collected in 1998 and biotic indices calcu-lated. Correlations between land cover, habitat, and stream-qualityindicators revealed significant relations at the watershed, riparian-corridor, and reach scales. At the watershed scale, fish diversity,intolerant fish and EPT species increased, and Hilsenhoff bioticindex (HBI) decreased as percent forest increased. At the riparian-corridor scale, EPT species decreased and HBI increased as ripari-an vegetation became more fragmented. For the reach, EPT speciesdecreased with embedded.ness. Multivariate analyses further indi-cated that riparian (percent agriculture, grassland, urban and for-est, and fragmentation of vegetation), watershed (percent forest)and reach-scale characteristics (embeddedness) were the mostimportant variables influencing fish (IBI, density, diversity, num-ber, and percent tolerant and insectivorous species) and macroin-vertebrate (HBI and EPT) communities.(KEY TERMS: riparian; aquatic biota; agriculture; watershed; landcover; biotic integrity.)
INTRODUCTION
Numerous studies have indicated that landuse/cover can play an important role in determiningstream water quality by influencing factors that con-trol runoff, sediments, nutrients, flow, water tempera-ture and channel morphology (Omernik et al., 1981;Schlosser and Karr, 1981; Lowrance et al., 1984;
Cooper et al., 1987; Osborne and Wiley, 1988;Richards and Host, 1994; Richards et al., 1996; Rothet al., 1996; Johnson et al., 1997; and Wang et al.,1997). In some cases land cover in the watershed wasfound to be more important than in the riparian corri-dor in determining turbidity and nutrient concentra-tions in streams (Omernik et al., 1981; Osborne andWiley, 1988; Gove and Edwards, 2000). In other stud-ies, riparian characteristics explained more variationin water chemistry parameters and biotic conditionthan watershed data (Johnson et al., 1997; Lammertand Allan, 1999). The importance of riparian areas asfiltering mechanisms for trapping sediment from agri-cultural fields before reaching a stream (Schlosserand Karr, 1981; Lowrance et al., 1984; Cooper et al.,1987) and in determining stream habitat and bioticcharacteristics (Karr and Schlosser, 1978) is well doc-umented. The differences in conclusions from thesestudies indicate that the influences of landscape fac-tors on streams are complex and may be operating atboth riparian and watershed scales (Richards et al.,1996; Lammert and Allan, 1999). To further confoundresults, many studies that have looked at relationsbetween watershed and riparian land cover versusbiota have included the land cover in the riparian cor-ridor as part of the watershed land cover, making itdifficult to separate the effects of riparian land coverfrom the watershed land cover. In addition, the landuse/cover data used in some of these studies werebased on air photo interpretations, from 10 to 20years ago, with a resulting resolution of 1 to 16 haand these differences may have contributed to theinability of separating the impacts of watershed from
1Paper No. 01024 of the Journal of the American Water Resources Association. Discussions are open until August 1, 2002.2Respectively, Geographer, U.S. Geological Survey, 8505 Research Way, Middleton, Wisconsin 53562; Research Watershed Ecologists, Wis-
consin Department of Natural Resources, 1350 Femrite Drive, Monona, Wisconsin 53716; Hydrologist, U.S. Geological Survey, 8505 ResearchWay, Middleton, Wisconsin 53562; and Water Resources Specialist, Wisconsin Department of Natural Resources, WRI2, 101 South WebsterStreet, Madison, Wisconsin 53708 (E-Mail/Stewart: [email protected]).
JOURNAL OF THE AMERICAN WATER RESOURCES ASSOCIATION 1475 JAWRA
Stewart, Wang, Lyons, Horwatich, and Bannerman
riparian land cover. These studies show clearly theneed for additional work with higher resolution andmore current land-use/cover data using refined meth-ods, as demonstrated by Moser et al. (2000).
This study focuses on describing the influences ofwatershed and riparian corridor land cover, andreach-scale habitat characteristics on biological com-munities using more recent and higher resolutiondata for eastern Wisconsin warmwater streams. Theobjectives of this study were: (1) to examine relationsbetween land-use/cover characteristics at differentscales versus stream habitat and biological communi-ties; (2) to compare land use/cover within differentareas of the riparian corridor and watershed onstream quality to determine if differences existbetween location of land cover and their affect onstream quality; and (3) to identify the importance ofcontinuity and width of an undisturbed riparian corn-dor to stream quality. These objectives were achievedby using Spearman rank correlation on individualpairs of biological and environmental variables and byapplying multivariate analyses to examine relationsbetween the biological measures as a group with indi-vidual environmental variables.
METHODS
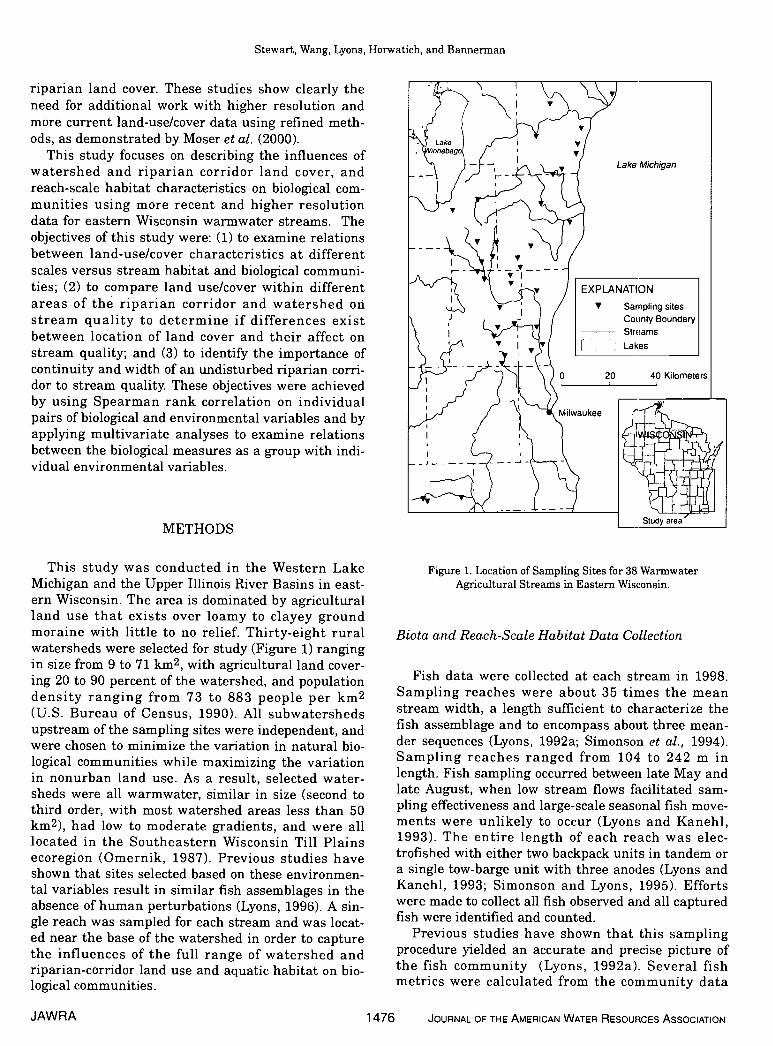
This study was conducted in the Western LakeMichigan and the Upper Illinois River Basins in east-ern Wisconsin. The area is dominated by agriculturalland use that exists over loamy to clayey groundmoraine with little to no relief. Thirty-eight ruralwatersheds were selected for study (Figure 1) rangingin size from 9 to 71 km2, with agricultural land cover-ing 20 to 90 percent of the watershed, and populationdensity ranging from 73 to 883 people per km2(U.S. Bureau of Census, 1990). All subwatershedsupstream of the sampling sites were independent, andwere chosen to minimize the variation in natural bio-logical communities while maximizing the variationin nonurban land use. As a result, selected water-sheds were all warmwater, similar in size (second tothird order, with most watershed areas less than 50km2), had low to moderate gradients, and were alllocated in the Southeastern Wisconsin Till Plainsecoregion (Omernik, 1987). Previous studies haveshown that sites selected based on these environmen-tal variables result in similar fish assemblages in theabsence of human perturbations (Lyons, 1996). A sin-gle reach was sampled for each stream and was locat-ed near the base of the watershed in order to capturethe influences of the full range of watershed andriparian-corridor land use and aquatic habitat on bio-logical communities.
Figure 1. Location of Sampling Sites for 38 WarmwaterAgricultural Streams in Eastern Wisconsin.
Biota and Reach-Scale Habitat Data Collection
Fish data were collected at each stream in 1998.Sampling reaches were about 35 times the meanstream width, a length sufficient to characterize thefish assemblage and to encompass about three mean-der sequences (Lyons, 1992a; Simonson et at., 1994).Sampling reaches ranged from 104 to 242 m inlength. Fish sampling occurred between late May andlate August, when low stream flows facilitated sam-pling effectiveness and large-scale seasonal fish move-ments were unlikely to occur (Lyons and Kanehl,1993). The entire length of each reach was elec-trofished with either two backpack units in tandem ora single tow-barge unit with three anodes (Lyons andKanehi, 1993; Simonson and Lyons, 1995). Effortswere made to collect all fish observed and all capturedfish were identified and counted.
Previous studies have shown that this samplingprocedure yielded an accurate and precise picture ofthe fish community (Lyons, 1992a). Several fishmetrics were calculated from the community data
JAWRA 1476 JOURNAL OF THE AMERICAN WATER RESOURCES ASSOCIATION

Influences of Watershed, Riparian-Corridor, and Reach-Scale Characteristics on Aquatic Biota in Agricultural Watersheds
(Table 1). A fish diversity index was calculatedaccording to Brewer (1979), and the index of bioticintegrity (IBI) for warmwater fishes was calculatedfor each stream as described in Lyons (1992b).
MetricRange ofValues Median
Percent Thierant Fish 22.21-95.84 63.96
Percent Intolerant Fish 0-5.48 0
Percent Insectivorous Fish 16.16-96.9 49.46
Number of Fish Species 6-21 12
Fish Density (fishJlOO m2) 27.65-864.9 233.25
Fish Diversity1 0.4-2.96 2.05
Index of Biotic Integrity2 0-55 30.0
Number of Macromvertebrates 76-506 148
Number of Macromvertebrate Species 13-34 18
Percent EPT Individuals3 0.76-85.2 35.7
Percent EPT Species 4.6-56.3 28.9
Macroinvertebrate Diversity4 1.21-3.0 2.18
HilsenhoffBiotic Index5 3.95-8.11 5.30
1Values range from heavy pollution (< 1), light pollution (2 to 3), tono or very slight pollution (> 3) (Brewer, 1979).
2Values range from very poor (0 to 19), poor (20 to 29), fair (30 to49), good (50 to 64), to excellent (65 to 100) (Lyons, 1992b).
3The number of Ephemeroptera, Plecoptera, and Trichoptera (EPT)genera were counted. EPT taxa are generally perceived to bepollution sensitive, indicating better water quality with presence(Lenat, 1988).
4Values generally range from 1.5 to 3.5 and rarely surpass 4.5,with higher values indicating healthier invertebrate communities(Magurran, 1988).
5Values range from excellent (0 to 3.5), very good (3.51 to 4.5), good(4.51 to 5.0), fair (5.01 to 5.75), fairly poor (5.76 to 6.5), poor (6.51to 7.25), to very poor (7.26 to 10.0) (Hilsenhoff, 1987).
Macroinvertebrates were sampled from riffles dur-ing late October 1998 within each reach using aD-frame net. Standard 'Biotic Index" sampling proce-dures were followed (Hilsenhoff, 1982; 1987). Threesamples were collected and combined for identifica-tion. For four of the 38 sites that did not have riffles,macroinvertebrates were sampled from snags, whichwas the best habitat available at that site. Capturedmacroinvertebrates were preserved in 95 percent
ethanol and sent to the University of Wisconsin-Stevens Point for identification, enumeration, andbiotic index calculation. The Hilsenhoff Biotic index(HBI) was calculated (Hilsenhoff, 1982) as measure ofstream biotic integrity (Table 1). In addition, the per-cent of Ephemeroptera, Plecoptera, and Trichoptera(EPT) individuals and percent EPT taxa were deter-mined (Lenat, 1988) and the Shannon Wiener diversi-ty index for macroinvertebrates was calculated(Magurran, 1988).
Habitat sampling occurred within a day of fishsampling. At each reach, 28 habitat variables, encom-passing channel morphology, bottom substrate, coverfor fish, bank conditions, and riparian land use, weremeasured or visually estimated along 12 transectsusing standardized procedures described in Simonsonet al., (1994) (Table 2). Percent fines were calculatedbased on the percent of substrate that was less than2 mm in diameter (sand, silt, or clay). These proce-dures yielded data with known levels of accuracy andprecision, typically ± 5 to 10 percent (Wang et al.,1996). A habitat rating score was calculated based onthese data according to Simonson et al. (1994).
Land-Cover Characteristics
Land cover characteristics used in this study aresummarized in Table 2. Watershed boundaries forsampling sites were delineated on U.S. GeologicalSurvey (USGS) 1:24,000 topographic quadrangles anddigitized using a geographic information system(GIS). Ground truth data were collected during thesummer of 1998 by driving the entire watershed andrecording and photo-documenting land cover at eachroad crossing of the stream. Additional field noteswere taken to further characterize watershed landuse, such as location of active barnyards, rural hous-ing developments, and gravel pits, and types of cropsand cropping practices. All ground truth and fieldnotes were used to help interpret and verify land useand land cover from digital orthophotos. Land coverat the watershed scale were compiled from theWISCLAND (Wisconsin Initiative for Statewide Coop-eration on Landscape Analysis and Data) satellite-derived land cover map for Wisconsin (Lillesand etal., 1998) using the Level I categories of urban, agri-culture, forest, grassland, and wetland (forested andnonforested). These data were collected by the Land-sat Thematic Mapper and have a 30-meter groundresolution. Population density at the watershed scalewas generated using 1990 Census data for minor civildivisions (U.S. Bureau of the Census, 1990).
Stream networks were digitized for each watershedfrom digital orthophoto quadrangles (DOQs) usingancillary data (1:24,000 State hydrologic layer and
TABLE 1. Variables Used to Describe Fish andMacroinvertebrate Communities at Sites.
JOURNAL OF THE AMERICAN WATER RESOURCES ASSOCIATION 1477 JAWRA

Agriculture (percent)
Forest (percent)
Grassland (percent)
Urban (percent)
Forested Wetland (percent)
Nonforested Wetland (percent)
Stewart, Wang, Lyons, Horwatich, and Bannerman
JAWRA 1478 JOURNAL OF THE AMERICAN WATER RESOLIRCES ASSOCIATION
TABLE 2. Summary Statistics for Watershed, Buffer, and Reach-Scale Variables Measured at, or Calculated for Each Site.(Land cover for the buffer is calculated as percent 30-rn buffer and for watershed as percent total watershed.
Units of measurement for each variable are listed in parenthesis next to each variable.)
Range ofVariable Scale Values Median
Buffer (0-10 in) .2-13.26 3.61Buffer (10-20 in) 0.64-19.2 8.4Buffer (20-30 in) 0.99-21.2 10.4Watershed (> 30 m buffer) 18.5-88 59.6
Buffer (0-10 in) 1.09-11.8 3.76Buffer (10-20 in) 1.0-8.9 3.1Buffer (20-30 m) 1.0-8.7 2.8Watershed (> 30 in buffer) 1.3-33.7 7.1
Buffer (0-10 m) 1.2-21.9 8.9Buffer (10-20 in) 1.4-11.7 5.7Buffer(20-30m) 1.9-11.3 5.1Watershed (> 30 in buffer) 0.6-32.9 11.7
Buffer (0-10 in) 0.09-1.6 0.43Buffer (10-20 in) 0. 13-2.6 0.64Buffer (20-30 m) 0.16-2.7 0.6Watershed (> 30 in buffer) 0.03-14.8 1.74
Buffer (0-10 in) 0.95-23.4 7.3Buffer (10-20 in) 0.83-19.6 6.7Buffer (20-30 in) 0.86-18.7 6.2Watershed (> 30 in buffer) 0.4-17.6 4.3
Buffer (0-10 in) 0.05-16.2 6.0Buffer (10-20 in) 0.01-14.8 5.5Buffer(20-30in) 0.03-13.1 4.7Watershed (> 30 m buffer) 1.05-13 5.0
Stream Length With Gaps in Riparian Vegetation (percent) Buffer (0-10 m) 3.2-68.6 27.8Buffer (10-20 m) 1.9-32 13.8Buffer (20-30 in) 1.7-12.4 7.2
Stream Length Without Gaps in Riparian Vegetation (percent) Buffer (> 30 in) 13.8-93.1 51.2
Mean Length of Gap in Riparian Vegetation (meters) Buffer (0-10 in) 48.8-276.3 141Buffer (10-20 in) 20.8-114.1 51Buffer (20-30 in) 20.5-64.2 38.5Buffer (0-30 in) 97.5-451.9 215.8
Mean Length of Riparian Vegetation Without Gaps (meters) Buffer (> 30 in) 76.5-666.5 194.4
Erosion (percent) Reach 1.5-51.7 15.6
Fines (percent) Reach 12.6-100 65.5
Width/Depth ratio Reach 4.4-31.6 10.1
Sediment Depth (cin) Reach 0.3-45.9 5.2
Embeddedness (percent) Reach 9.2-100 60.6
Fish Cover (percent) Reach 0-37.3 4.8
Habitat Score1 Reach 35-87 54.5
1Values range from poor (< 25), fair (25 to 49), good (50 to 74) to excellent (> or = 75) (Simonson et al., 1994).
Influences of Watershed, Riparian-Corridor, and Reach-Scale Characteristics on Aquatic Biota in Agricultural Watersheds
County soil survey maps) to guide the process. The1:24000 streams alone were inadequate to representthe stream network due to differences in scalebetween the 1:24000 streams and the digitalorthophotos, and the fact that the 1:24000 streamsare a cartographic portrayal of the hydrologic networkand may not accurately represent the true locationand extent of these hydrologic features (Leopold,1994). Digitized streams included perennial andintermittent streams, and ditches that were discern-able on the DOQs. The stream networks from pub-lished County soil surveys also included thesehydrologic features and were used as a guide to betterinterpret the hydrologic network at the DOQ scale.DOQs were produced from 1992 (1:40,000 scale) and1995 (1:19,200 scale) NAPP (National Aerial Photog-raphy Program) photography with a resulting groundresolution of 1 m and 0.6 rn, respectively. The highresolution of the digital orthophotography providedthe opportunity to investigate the influences of ripari-an land cover for narrower buffer widths than previ-ous investigations. The satellite-derived land coverwas not used for interpreting riparian land cover dueto the limitations posed by the 30-rn resolution of thedata. The suggested minimum mapping unit for thesatellite-derived data is five acres, or 25 pixels, mak-ing it too coarse for identifying riparian land cover ina 30-rn buffer.
Stream corridors were defined for the entire digi-tized stream network (perennial and intermittentstreams and ditches), using a 30-rn buffer on eachside of the stream. Land cover for the stream corridorscale was digitized and interpreted from DOQ5 usingancillary data including County soil survey maps,ground truth from field observations, and theWISCLAND land cover map. The land-use/cover cate-gories for the stream corridor were the same as thosefor the watershed, however, the urban category wascomprised of buildings and roads. It was not possibleto interpret a wetland category because of the inabili-ty to adequately interpret this category using theDOQ5. To accomplish this classification, the wetlandsfrom the WISCLAND land cover data were extractedfrom the 30-rn buffer, and were subsequently inter-preted into forested or nonforested wetland cate-gories. In some instances, extracted land cover wasinterpreted to a nonwetland category as a result ofscale differences between the DOQ5 and WISCLANDland cover data. Additional stream buffers of 10- and20-rn were created and vegetation for these buffersclipped from the interpreted 30-rn buffer land cover.
Each land cover type within the 10-, 10- to 20-, 20-to 30-, 0- to 20-, and 30-rn buffer was expressed aspercent land cover for the 30-rn buffer; and for thegreater than 30-rn buffer, was expressed as percentwhole watershed, to examine the differences on
stream quality between the buffer areas and thewatershed area outside the 30-rn buffer (Table 2). Tobetter understand the importance of continuity andfragmentation of riparian corridor natural vegetation,the extent of natural vegetation and associated gapswas measured for the 30-rn buffer (Figure 2). Areas ofthe riparian corridor where the natural vegetation(forest and both forested and nonforested wetland)extended less than 30-rn wide on both sides of thestream were considered gaps in the riparian vegeta-tion. Areas where the riparian vegetation extendedbeyond the 30-rn buffer on both sides of the streamwere areas without gaps in the riparian vegetation. Inmany cases, the riparian vegetation extended beyondthe 30-rn buffer on one side of the stream but lessthan 30-rn on the opposite side of the stream. In thesecases, the lack of riparian vegetation on one side ofthe stream took precedence and these stream seg-ments were treated as if they lacked riparian vegeta-tion on both sides of the stream. The reasoning forthis was due to the potential deleterious effects onstream quality that could result from the lack ofriparian corridor on only one side of the stream. Thepresence of riparian vegetation on the opposite side ofthe stream, while not contributing to potential delete-rious effects, would neither negate the potentialimpacts to stream quality. The gap extent was mea-sured for the 10-, 10- to 20-, and 20- to 30-rn bufferswith the total gap extent for each of these buffer loca-tions, summarized as the 30-rn buffer gap extent andexpressed as percent of total stream length and aver-age segment length. The extent of the riparian vege-tation without gaps was measured for the streamlength where riparian vegetation extended beyond the30-rn buffer and was expressed as percent of totalstream length and mean segment length. In mostcases streams had either very poor riparian corridors,with long continuous gaps or a high degree of frag-mentation, or had very well established riparian cor-ridors, with no gaps in the vegetation for most of thestream length.
Statistical Analyses
Descriptive statistics were calculated for all fish,macroinvertebrate, habitat and land use/cover vari-ables (Tables 1 and 2). Correlation analysis was usedto identify relations between biological communitieswith watershed and riparian-corridor land cover andreach-scale habitat characteristics. Data distributionsfor many characteristics were not normal, thus Spear-man rank correlations, which do not require theassumption of normal distributions, were used (John-son and Wichern, 1992). Significant correlations are
JOURNAL OF THE AMERICAN WATER RESOURCES ASSOCIATION 1479 JAWRA

Stewart, Wang, Lyons, Horwatich, and Bannerrnan
Figure 2. Methods for Characterizing Length of Riparian Corridor Natural Vegetation, With andWithout Gaps, for the 10-, 10- to 20-, 20- to 30-, and Greater Than 30-rn Buffer.
defined as those where the probability of Type I erroris less than 5 percent (p <0.05).
Multivariate statistics, including detrended corre-spondence analysis (DCA) (Hill, 1979) and canonicalcorrespondence analysis (CCA) (Ter Braak, 1986),were used to further verify relations among biologicalmeasures and land use/cover at different spatialscales using the CANOCO 4 program (Ter Braak andSmilauer, 1998). DCA was used to ordinate sitesalong axes of relative similarity in fish and macroin-vertebrate measures without the associated environ-mental variables. This exploratory tool is used to lookat site similarity based on species or species indica-tors, without associated environmental variables. Thescores of the sites in species indicator space (results ofDCA axes 1 and 2 based on fish and macroinverte-brate measures) were correlated to each variable forthe environmental data set (watershed and riparian-corridor land cover and reach-scale habitat character-istics) to aid in selection of representative variablesfor CCA. CCA was used to examine relations betweenwatershed, riparian-corridor, and reach-scale habitatcharacteristics with fish and macroinvertebrate
measures. Based on the results of DCA, initial CCA,and correlations among environmental variables,selected environmental variables we:re deleted fromCCA final analyses to avoid inclusion of variables thatwere highly inter-correlated. Monte Carlo permuta-tion tests were used to determine whether the CCAaxes were significant (p <0.05).
RESULTS AND DISCUSS.[ON
The number of fish species collected per site rangedfrom six to 21 and the number of individuals caughtranged from 28 to 865 per 100 m2 (Table 1). Fish IBIscores ranged from very poor to good (0 to 55) on ascale of 1 to 100 (Lyons, 1992b). MacroinvertebrateHBI scores, similar to IBI scores, ranged from 8.1 to4, very poor to very good (Hilsenhoff, 1987) (Table 1).The HBI is based on a 0 to 10 scale, wllth lower valuesindicating little to no organic pollution and highervalues indicating possible severe organic pollution.The Shannon-Wiener diversity for mac:roinvertebrates
JAWRA 1480 JOURNAL OF THE AMERICAN WATER RESOURCES ASSOCIATION

Influences of Watershed, Riparian-Corridor, and Reach-Scale Characteristics on Aquatic Biota in Agricultural Watersheds
ranged from 1.2 to 3 with higher values indicatinghealthier macroinvertebrate communities (Magurran,1988) (Table 1). Habitat scores ranged from 35 to 87,from fair to excellent (Simonson et al., 1994) (Table 2).
Land use/cover in watersheds, outside the 30-rnbuffer was predominantly agriculture and rangedfrom 19 to 88 percent (median 60 percent) of the totalwatershed area (Table 2). Land cover in the 10-rnbuffer was mainly grassland and ranged from 1.2 to21.9 percent of the 30-m buffer area (median 8.9 per-cent), and for the 10- to 20-rn, and 20- to 30-rn bufferwas predominantly agriculture and ranged from 0.6to 19.2 percent of the 30-rn buffer (median 8.4 per-cent) and 0.99 to 21.2 percent of the 30-rn buffer(median 10.4 percent), respectively. Riparian areasmay appear to be rather insignificant when consider-ing the size of the area relative to total watershedareas, however research indicates that the influenceof the riparian zone on aquatic systems is dispropor-tionate to its total land area (Johnson et al., 1997).The percent of stream length without gaps in rip arianvegetation ranged from 13 to 93 percent (median 51percent). The average length of gaps in the riparianvegetation for the 30-rn buffer ranged from 97 to 452m (median 216 m) while the length of riparian vegeta-tive segments, without gaps, ranged from 76 to 667m(median 194 m) (Table 2). Total stream length rangedfrom 10 to 84 km (median 25 km).
Correlations varied among aquatic communities,habitat, and watershed and buffer land cover charac-teristics. Correlations indicate that some factors maybe operating at a variety of scales while others may beimportant at a single scale. Similarly, some factorsmay affect only one aspect of the biological communi-ty where other factors may affect multiple aspects ofthe community (Table 3). The percent pollution intol-erant fish increased with percent forested wetland inthe 30-rn buffer and with percent forest in the water-shed. Similarly, the percent forest in the 30-m bufferwas negatively related to percent tolerant fishspecies. These results indicate that forested ripariancorridors and watersheds positively influence intoler-ant and negatively influence tolerant fish species. Thepercent insectivorous fish decreased as the percentforest in the 30-rn buffer increased. The presence offorested land near the stream, in the 30-rn buffer,may have affected benthic productivity of the streamthereby indirectly reducing the percent insectivorousfish. The total number of fish species increased withthe percent forest in the 20- to 30-rn buffer and water-shed, and the percent forested wetland in the 10-rnbuffer. Fish diversity also increased with the percentforest in the watershed. On the contrary, fish densitywas negatively related to the percent grassland inthe 20- to 30-rn buffer and percent urban in the
watershed. These measures indicated that higherpercentages of forest in the watershed and in thebuffer were related to healthy fish communities whilenear stream grasslands and urban land cover in thewatershed had a negative association with the healthof fish communities. Relations with the land covercategory of grassland may be problematic and requiresome explanation. The problem is due, in part to thedifficulty in separating the use of the land as pastureversus natural vegetation. Although ground truth wascollected to help distinguish grasslands from othervegetation types, it was not adequate to distinguishthe use for all grasslands encountered in this study,whether they be pasture or left as natural vegetation.However, in this particular study, it is rather commonto find near stream grasslands being used for the pur-pose of pasturing cows.
The HBI scores, higher values indicating poorerwater quality, decreased as the percentage of forest inthe 30-rn buffer and watershed outside the 30-mbuffer increased. Similar relations were found for HBIas the percent nonforested wetland in the 10- to 20-and 20- to 30-rn buffer, and watershed area, outsidethe 30-rn buffer increased. These results indicatedthat streams with higher percentages of forested landand non-forested wetland in the watershed, andforested land near the stream (10-rn buffer) had lessorganic or sediment pollution. The HBI scoresincreased as percent grassland in the 10-rn bufferincreased, again suggesting that near stream grass-lands might have been used for pastures and nega-tively influenced macroinvertebrate communities. Thepercent EPT species increased with percent forest inthe 30-rn buffer and watershed, and with the percentforested wetland in the 10-rn buffer. Similarly, thepercent EPT species was negatively related to thepercent grassland in the 10-m buffer and percentagriculture in the 10- to 20-rn buffer. These resultssuggest that EPT species are positively influenced byforested riparian corridors and watersheds, but arenegatively influenced by near stream agriculture andgrasslands. The percent EPT individuals alsodecreased with the percent urban in the 30-rn buffer,while the total number of macroinvertebrates collect-ed decreased with percent urban in the watershed.The macroinvertebrate diversity, higher values indi-cating healthier invertebrate communities, was nega-tively related to percent urban in the 10- to 20-, and20- to 30-rn buffer and percent urban in thewatershed. Urban land cover in the watershed andriparian corridor appears to have a negative impact,not only on EPT species but the entire macroinverte-brate community, as measured by total count. Weigelet al. (2000) found macroinvertebrate differencesbetween forested and grassy reaches, but one was not
JOURNAL OF THE AMERICAN WATER RESOURCES ASSOCIATION 1481 JAWRA

Stewart, Wang, Lyons, Horwatich, and Bannerman
A.C')C')
5?
c)5) a
CA ,•,, ,, , ,•° a a—
+ aV C '"1' N N C' O Co5) C) C') C') C') C') '1' C') C') , C') C') C')a a
5)
C')C')C')99a a' aI..
C)o C'),a
C')a. -i-'-
0 0
C')C') C')aC) ,C')' C'),aa a
a
CDV a a a a
U: ooc'as..•Z E-
cJ)C) a , C') , , C') C') C')a aaa
I-25?
a E a1 'Ec . -0 ' —' ' 'o E— . + a Ia0 00 , aCE a ,00 0? 5? 0)15?0,A ao 0CC') #5?C')O :o C'1C')dSt.: cs j 5) I5)a
5? .9 Ea Q .5?O 5) 2 ' El4z z i(1) cIJAWRA 1482 JOURNAL OF THE AMERICAN WATER RESOURCES AssociATioN

Influences of Watershed, Riparian-Corridor, and Reach-Scale Characteristics on Aquatic Biota in Agricultural Watersheds
inherently better than the other and in fact suggestedthat macroinvertebrates were mostly responding towatershed-scale influences.
An attempt was made to better understand therelations between the continuity and fragmentation ofriparian corridor natural vegetation versus fish andmacroinvertebrate measures. The percent intolerantfish decreased as the percent of total stream length,with gaps in the riparian corridor natural vegetation,increased for the 10-rn buffer. The percent insectivo-rous fish increased as the average length of gaps inthe nparian corridor natural vegetation increased forthe 20- to 30-rn buffer. Fish density increased with theincrease in the average length of riparian vegetationwithout gaps (> 30-m). The IBI decreased as the gaplength increased for the 10- to 20-rn buffer riparianvegetation. The HBI increased as the percent ofstream length, with gaps in the riparian vegetationincreased for the 10-rn buffer. Sirnilarly, the percentEPT species and individuals were negatively relatedto the percent of stream length with gaps in the 10-rnbuffer natural vegetation. These results indicatedthat streams dominated by riparian corridors, with-out gaps and with less fragmentation of natural vege-tation, had less organic and sediment pollution,healthier fish and macroinvertebrate communities,and a greater density of fish. There were no signifi-cant correlations between watershed population den-sity and any of the biotic factors, therefore thisvariable was dropped from further analysis.
Correlations reveal important relations betweenindividual pairs of biological and environmental vari-ables, which can be used for identifying environmen-tal variables that are important to biologicalcommunities. However, they are not useful for under-standing relations among groups of biological andenvironmental variables. Under natural conditions,relations between biological and environmental vari-ables are complex and rarely just limited to a simplepair relation. In fact, environmental factors are oftenhighly inter-correlated which makes it difficult todraw conclusions from correlation analysis alone.Multivariate analyses can examine relations amongmultiple biological and environmental variables atthe same time and were used in this study to betterunderstand relations among groups of biological andenvironmental variables.
Multivariate analyses revealed strong relationsamong biological measures and watershed-, riparian-corridor-, and reach-scale characteristics. Results ofDCA indicated that the first two axes explained 73.3percent of the variation in fish and macroinvertebratemeasures with eigenvalues of 0.123 for the first and0.024 for the second axis. The scores of the sites inspecies indicator space (results of DCA axes 1 and 2based on fish and macroinvertebrate measures) were
correlated to each variable for the environmental dataset (watershed and riparian-corridor land cover andreach-scale habitat characteristics) to aid in selectionof representative variables for CCA (Table 4). Theaverage length of riparian corridor without a gap in30-rn buffer natural vegetation was negatively corre-lated with DCA axis 1 scores, whereas percent grass-land in the 10- to 20- and 20- to 30-rn buffer werepositively correlated with axis 1 scores. The percentgrassland in the 10-rn buffer, percent agriculture inthe 30-rn buffer, percent urban in the 30-rn buffer,percent stream length with gaps in the riparian vege-tation for the 10-m buffer, and percent embeddednessfor the reach were negatively correlated with DCAaxis 2 scores. The percent forest in all portions of thebuffer and watershed, and percent stream lengthwithout gaps in the riparian corridor natural vegeta-tion were positively correlated to DCA axis 2 score.These results indicated that these factors were themost important environmental variables influencingthe fish and macroinvertebrate communities in thisstudy and were subsequently used in CCA analyses.Many of these factors were also found to have signifi-cant relations with biological variables based on theresults of correlation analysis.
TABLE 4. Significant Spearman Rank Correlation Coefficientsfor Detrended Correspondence Analysis (DCA) Site Scores
With Environmental Variables (-, not significant;p-value < 0.01 for r> 0.4, p-value < 0.05 for r> 0.3].
VariableDCA
Axis 1DCA
Axis 2
Percent AgricultureBuffer (10-20 m)Buffer (0-30 m)
--
-0.3-0.3
Percent ForestBuffer (0-10 m)Buffer (10-20 m)Buffer (20-30 m)Buffer (0-30 m)Watershed (> 30 m)
-----
0.370.350.380.370.35
Percent GrasslandBuffer (0-10 m)Buffer (10-20 m)Buffer (20-30 m)
-0.30.36
-0.34--
Percent UrbanBuffer (0-10 m)Buffer (10-20 m)Buffer (0-30 m)
---
-0.31-0.34-0.32
Gap —Percent Length (0-10 m buffer) - -0.34
No Gap — PercentLength (0-30 m buffer) - 0.3
No Gap - Mean Length (0-30 m buffer) -0.3 -
Embeddedness - -0.28
JOURNAL OF THE AMERICAN WATER RESOURCES ASSOCIATION 1483 JAWRA

Stewart, Wang, Lyons, Horwatich, and Bannerman
CCA procedures, unlike correlation that evaluatedrelations between individual pairs of biological andenvironmental variables, examined the relationsbetween groups of biological measures and land covervariables. The eigenvalues for the first four CCA axeswere 0.048, 0.015, 0.005, and 0.02, respectively. Thefirst four axes explained 34.8 of the cumulative per-centage variance of the fish and macroinvertebratemeasures and 97.1 percent of the cumulative percent-age variance of the fish and macroinvertebrate mea-sures-environment relation. All variable inflationfactors were less than eight and there was no signifi-cant covanance among variables used in the analysis.All environmental variables that showed significantcorrelations with DCA site scores (Table 4) were usedin preliminary CCA analyses. However, a number ofvariables were dropped in subsequent and final runsto avoid inclusion of variables that were highly inter-correlated. Because percent forest in the 10-m bufferwas highly correlated with percent forest in the 10- to20-rn buffer (0.96) and in the 20- to 30-rn buffer (0.93),the percent forest in the 30-m buffer was selected asthe representative variable in CCA and the otherswere dropped. Similarly, percent urban, percent agri-culture, and percent grassland, were each highly cor-related with their same cover type within differentzones of the 30-rn buffer. Therefore, percent landcover for the 30-m buffer was selected as the repre-sentative variable in CCA, for these individual covertypes. The results of the Monte Carlo test indicatedthat all axes were statistically significant (p = 0.015).
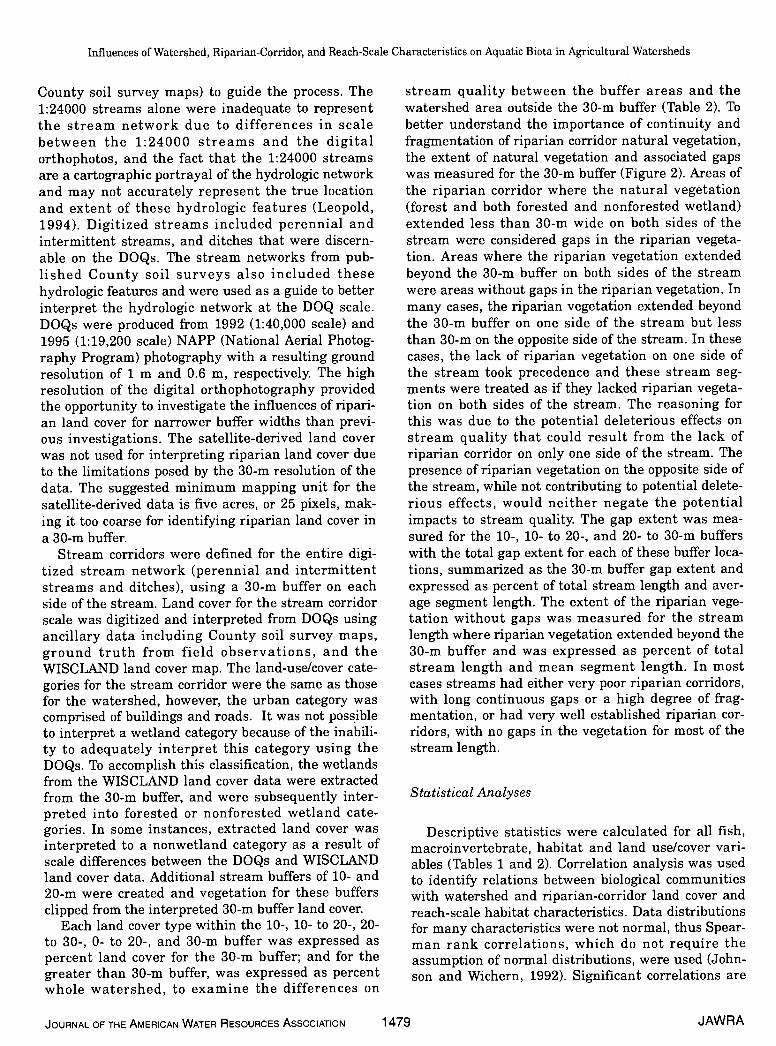
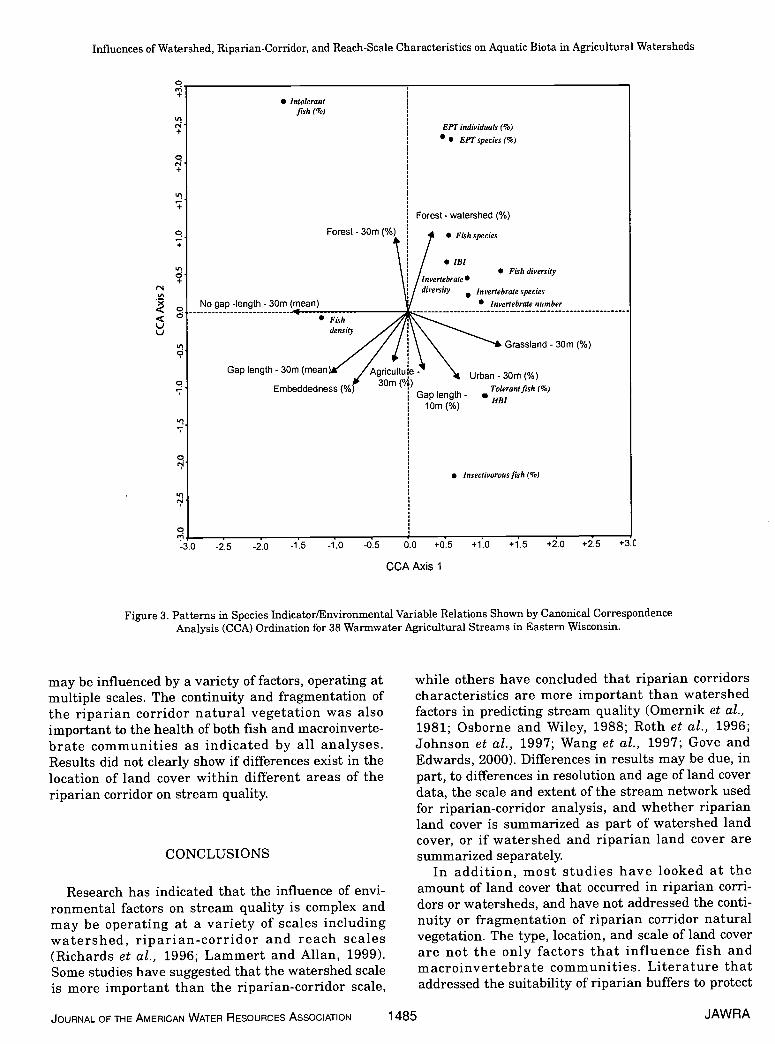
CCA revealed similar results as that of correlation,yet provided additional relations that were not evi-dent from correlation analysis. The most importantvariables indicated by CCA were, in order, for the firstaxis, mean length of riparian corridor without gaps inthe 30-m buffer, percent grassland in the 30-rn buffer,and mean length of riparian corridor for the 30-mbuffer with gaps. For the second axis, the most impor-tant variables were percent forest in the watershed(>30-m buffer), followed by percent forest in the 30-rnbuffer, percent embeddedness, percent urban in the30-rn buffer, mean length of riparian corridor withgaps in the 30-m buffer, percent of stream length withgaps in the 30-rn buffer, and percent agriculture inthe 30-rn buffer. The arrow for an environmental vari-able points in the direction of maximum change of theenvironmental variable and its length is proportionalto the rate of change for that variable. Environmentalvariables with long arrows are more strongly correlat-ed with the axes than shorter arrows, so are moreclosely related to the fish and macroinvertebrate mea-sures (Figure 3) (Ter Braak, 1986). The ordinationdiagram indicates that forested land cover is positive-ly related to the health of fish communities as mea-sured by number of species, fish diversity, percent
intolerant fish, and IBI whether it occurs in the 30-rnbuffer or in the watershed, outside the 30-rn buffer.These fish measures are inversely related to embed-dedness, percent agriculture in the 30-rn buffer, andthe mean gap length in riparian vegetation for the 30-m buffer. Similar relations were found with macroin-vertebrate communities, as measured by number ofindividuals, number of species, invertebrate diversity,and percent EPT individuals and species. Thesemacroinvertebrate measures were positively relatedto forested land cover in the watershed and negativelyrelated to embeddedness, percent agriculture in the30-m buffer, and gaps in the 30-rn buffer ripanan cor-ridor natural vegetation. In other words, near streamagriculture, in the 30-m buffer, has a stronger nega-tive relation to fish and invertebrate communitiesthan agricultural land cover further away from thestream. In addition, riparian corridors with morefragmentation, and longer gaps in the naturally vege-tated buffer, were negatively related to health of fishand invertebrate communities whereas riparian corri-dors with more continuous natural vegetation werepositively related to healthy fish and invertebratecommunities. The percent urban land cover, and to alesser degree, percent grassland in l;he 30-rn bufferwere positively related to the percent tolerant fishand HBI, and negatively related to the percent intol-erant fish, indicating a negative relation to biota.Similar results were found as the percent of totalstream length with gaps in the 10-rn buffer riparianvegetation increased. When the riparian corridor nat-ural vegetation was more continuous for the 10-rnbuffer, the density of fish in the stream became high-er. Based on DCA and CCA results, near stream agri-culture and riparian corridor fragmentation played astronger role in influencing fish and rnacroinverte-brate communities than agricultural land cover fur-ther away from the stream. Similarly, near streamurban also played a strong role in influencing fish andmacroinvertebrate communities as measured by HBIand percent tolerant fish. However, forested landcover played an important role, whether it occurrednear the stream or within the watershed.
Results of all analyses indicated that forested landcover plays an important role in infltiencing fish andmacroinvertebrate communities at both the water-shed and riparian corridor scales. On the other hand,near-stream grasslands and agriculture were moreimportant in influencing fish and macroinvertebratecommunities than those same cover types at thewatershed scale. Macroinvertebrate communitieswere more strongly influenced by urban land coverwhen located in the 30-rn buffer rat:her than in thewatershed, as well as reach-scale characteristicsrelated to sediment deposition. These results clearlyshow that fish and macroinvertebrate communities
JAWRA 1484 JOURNAL OF THE AMERICAN WATER RESOURCES ASSOCIATION
Influences of Watershed, Riparian-Corridor, and Reach-Scale Characteristics on Aquatic Biota in Agricultural Watersheds
r4
+
0
+
0+
0+
00
9
It,
0rI
0m-3.0 -2.5 -20 -1.5 -1.0 -0.5 d.0 +0.5
CCA Axis 1
+1.0 +1.5 +2.0 +2.5 +3.C
Figure 3. Patterns in Species Indicator/Environmental Variable Relations Shown by Canonical CorrespondenceAnalysis (CCA) Ordination for 38 Warmwater Agricultural Streams in Eastern Wisconsin.
may be influenced by a variety of factors, operating atmultiple scales. The continuity and fragmentation ofthe riparian corridor natural vegetation was alsoimportant to the health of both fish and macroinverte-brate communities as indicated by all analyses.Results did not clearly show if differences exist in thelocation of land cover within different areas of theriparian corridor on stream quality.
CONCLUSIONS
Research has indicated that the influence of envi-ronmental factors on stream quality is complex andmay be operating at a variety of scales includingwatershed, riparian-corridor and reach scales(Richards et al., 1996; Lammert and Allan, 1999).Some studies have suggested that the watershed scaleis more important than the riparian-corridor scale,
while others have concluded that riparian corridorscharacteristics are more important than watershedfactors in predicting stream quality (Omernik et al.,1981; Osborne and Wiley, 1988; Roth et al., 1996;Johnson et al., 1997; Wang et al., 1997; Gove andEdwards, 2000). Differences in results may be due, inpart, to differences in resolution and age of land coverdata, the scale and extent of the stream network usedfor riparian-corridor analysis, and whether riparianland cover is summarized as part of watershed landcover, or if watershed and riparian land cover aresummarized separately.
In addition, most studies have looked at theamount of land cover that occurred in riparian corri-dors or watersheds, and have not addressed the conti-nuity or fragmentation of riparian corridor naturalvegetation. The type, location, and scale of land coverare not the only factors that influence fish andmacroinvertebrate communities. Literature thataddressed the suitability of riparian buffers to protect
JOURNAL OF THE AMERICAN WATER RESOURCES ASSOCIATION 1485 JAWRA
• Intolerantfish (%)
EPT individuals (%)
EPT species (%)
Forest - watershed (%)
Forest - 30m (%)
No gap -length - 30m (mean)
7 5 Fish species
/ SIB!/ S Fish diversity/ InvertebrateS
/ diversity • Invertebrate species
/ Invertebrate number
Fish
density
Gap length - 30m (mean)*"./<ricultuEmbeddedness (%)
30m (
Grassland - 30m (%)
Urban-30m(%)Tolerant fish (%)
Gap length - HE!lOm (%)
5 Insectivorous fish (%)

Stewart, Wang, Lyons, Horwatich, and Bannerman
water quality suggested that effectiveness of riparianbuffers depends on such factors as width, length,degree of fragmentation, and type, density and struc-ture of vegetation present (Fischer et al., 2000). Inthis study, the continuity and fragmentation of theriparian corridor natural vegetation were found toplay an important role related to fish and macroinver-tebrate communities. As the gaps in riparian vegeta-tion increased in length, the health of fish andmacroinvertebrate communities decreased, as mea-sured by number of fish species, fish density, fishdiversity, IBI, HBI, and EPT species and as indicatedby both correlations and multivariate analyses.Results indicated that streams dominated by ripariancorridors without gaps and with less fragmentation ofnatural vegetation have healthier fish and macroil-vertebrate communities, and a greater density of fish.
Lammert and Allan (1999) found that land useimmediate to the stream predicted biotic conditionbetter than regional land use, but was less importantthan local habitat variables in explaining the variabil-ity observed in fish and macroinvertebrate assem-blages. In their study, fish showed a strongerrelationship to flow variability and immediate landuse, while macroinvertebrates correlated most strong-ly with dominant substrate. Similarly, Fitzpatrick etal. (2000) found fish communities to be more stronglyinfluenced by riparian and to a lesser degree water-shed land use and geologic setting. In our study, nearstream agriculture was more important in influencingfish and macroinvertebrate communities than agricul-tural land use in other portions of the watershed.While riparian areas may appear to be ratherinsignificant when considering the size of the area rel-ative to total watershed areas, research has indicatedthat the influence of the riparian zone on aquatic sys-tems is disproportionate to its total land area (John-son et al., 1997). At the reach scale, local habitatmeasures related to sediment deposition influencedmacroinvertebrate and to a lesser degree, fish com-munities. While these results suggest the importanceof agricultural land cover at the riparian scale, forest-ed land cover played an important role at both thewatershed and riparian-corridor scales for influencingboth fish and macroinvertebrate communities.
The results of this study suggest that streamhealth, as measured by fish and macroinvertebratecommunities, is related to environmental factors at avariety of scales and that resolution of land cover datamay need to vary depending on the scale of analysisand the specific question at hand. Although satellite-derived, watershed land cover was important forunderstanding many land cover/aquatic biota rela-tions, riparian-corridor land cover, derived fromDOQs, had the resolution to better understand near
stream land cover (within the 30-m buffer) and ripari-an fragmentation relations with aquatic biota. Inorder to properly understand these relations,researchers need to use higher resolution and morecurrent land cover data, stream networks defined at ascale that is similar to that of the land cover data, andriparian land cover should not be included as part ofwatershed land cover if the effects of watershed andriparian land cover versus aquatic biota are to be sep-arated. In addition, the role and importance of conti-nuity and fragmentation of riparian corridorvegetation, as it relates to fish and macroinvertebratecommunities is a key factor that should not be over-looked and requires additional study.
ACKNOWLEDGMENTS
This research was supported by the Wisconsin Department ofNatural Resources (WDNR), Bureaus of Watershed Managementand Integrated Science Services. We thank the many field techni-cians who collected and computerized the habitat, macroinverte-brate, and fish data, especially Paul Kanehl, WI)NR. We are alsograteful to Andrea Axel and Diana Downes, USGS, for their assis-tance in building and interpreting the GIS data sets.
LITERATURE CITED
Brewer, R., 1979. Principles of Ecology. W. B. Saunders Co.,Philadelphia, Pennsylvania, 299 pp.
Cooper, J. R., J. W. Gilliam, R. B. Daniels, and W. P. Robarge, 1987.Riparian Area as Filters for Agricultural Sediment. Soil ScienceSociety American Journal 51:416-420.
Fitzpatrick, F. A., E. M. P. Giddings, B. C. Scudder, D. J. Sullivan,and B. N. Lenz, 2000. Effects of Riparian Corr:idors and Hydrol-ogy on Agricultural Stream Biota. In: Proceedings of the Inter-national Conference on Riparian Ecology and Management inMulti-Land Use Watersheds, P. J. Wigingtc'n, Jr. and R. L.Beschta (Editors). American Water Resources Association, Mid-dleburg, Virginia, pp. 215-220.
Fisher, R. A., C. 0. Martin, and J. C. Fischenich, 2000. ImprovingRiparian Buffer Strips and Corridors for Water Quality andWildlife. In: Proceedings of the International Conference onRiparian Ecology and Management in Multi-Land Use Water-sheds, P. J. Wigington, Jr. and R. L. Beschta (Editors). AmericanWater Resources Association, Middleburg, Virginia, pp. 457-462.
Gove, N. E. and R. T. Edwards, 2000. Identifying RelationshipsBetween Longitudinal Water Quality Patterns and Land Cover:A Question of Scale. In: Proceedings of the Ir.ternational Con-ference on Riparian Ecology and Management in Multi-LandUse Watersheds, P. J. Wigington, Jr. and R. L. Beschta (Editors).American Water Resources Association, Middleburg, Virginia,pp. 517-522.
Hill, MO., 1979, DECORANA-A FORTRAN Program for DetrendedCorrespondence Analysis and Reciprocal Averaging. CornellUniversity, Ithaca, New York, 36 pp.
Hilsen.hoff, W. L., 1982. Using a Biotic Index to Evaluate WaterQuality in Streams. Technical Bulletin 132, Wisconsin Depart-ment of Natural Resources, Madison, Wisconsin, 23 pp.
Hilsenhoff, W. L., 1987. An Improved Biotic Index of OrganicStream Pollution. Great Lakes Entomologist 2030-39.
JAWRA 1486 JOURNAL OF THE AMERICAN WATER RESOURC:ES ASSOCIATION

Influences of Watershed, Riparian-Corridor, and Reach-Scale Characteristics on Aquatic Biota in Agricultural Watersheds
Johnson, L. B., C. R. Richards, G. E. Host, and J. W. Arthur, 1997.Landscape Influences on Water Chemistry in MidwesternStream Ecosystems. Freshwater Biology 37:193-208.
Johnson, R. A. and D. W. Wichern, 1992. Applied Multivariate Sta-tistical Analysis (Third Edition). Prentice Hall, New Jersey, 642pp.
Karr, J. R. and I. J. Schlosser, 1978. Water Resources and the Land-Water Interface. Science 20 1:229-234.
Lammert, M. and J. D. Allan, 1999. Environmental Auditing —Assessing Biotic Integrity of Streams: Effects of Scale in Mea-suring the Influence of Land Use/Cover and Habitat Structureon Fish and Macroinvertebrates. Environmental Management23:257-270.
Lenat, D. R., 1988. Water Quality Assessment of Streams Using aQualitative Collection Method for Benthic Macroinvertebrates.Journal of the North American Benthological Society 7:222-233.
Leopold, L. B., 1994. A View of the River. Harvard Press, pp. 227-228.
Lowrance, R., R. Thdd, J. Fail, Jr., 0. Hendrickson, Jr., R. Leonard,and L. Assmussen, 1984. Riparian Forests as Nutrient Filters inAgricultural Watersheds. Bioscience 34:374-377.
Lillesand, T., J. Chipman, D. Nagel, H. Reese, M. Bobo, andR. Goldmann, 1998. Upper Midwest Gap Analysis Image Pro-cessing Protocol. EMTC 98-G00, U.S. Geological Survey, EMTC,Onalaska, Wisconsin, 25 pp.
Lyons, J., 1996. Patterns in the Species Composition of Fish Assem-blages Among Wisconsin Streams. Environmental Biology ofFishes 45:329-341.
Lyons, J., 1992a. The Length of Stream to Sample With a 'IbwedElectrofishing Unit When Fish Species Richness is Estimated.North American Journal of Fisheries Management 12:198-203.
Lyons, J., 1992b. Using the Index of Biotic Integrity (IBI) to Mea-sure Environmental Quality in Warmwater Streams of Wiscon-sin. General Thchnical Report NC-149. U.S. Forest Service, St.Paul, Minnesota, 51 pp.
Lyons, J. and P. Kanehl, 1993. A Comparison of Four Electroshock-ing Procedures for Assessing the Abundance of SmallmouthBass in Wisconsin Streams. General Technical Report NC-159,U.S. Department of Agriculture, Forest Service, North CentralForest Experiment Station, St. Paul, Minnesota, 35 pp.
Moser, T. J., D. R. Lindeman, P. J. Wigington, Jr., M. J. Schuft, andJ. V. Sickle, 2000. Methods for Multi-spatial Scale Characteriza-tion of Riparian Corridors. In: Proceedings of the InternationalConference on Riparian Ecology and Management in Multi-Land Use Watersheds, P. J. Wigington, Jr. and R. L. Beschta(Editors). American Water Resources Association, Middleburg,Virginia, pp. 511-516.
Magurran, A. E., 1988. Ecological Diversity and Its Measurement.Princeton University Press, 179 pp.
Omernik, J. M., 1987. Ecoregions of the Conterminous UnitedStates. Annals of the Association of American Geographers77: 118-125.
Omernik, J. M., A. R. Abernathy, and L. M. Male, 1981. StreamNutrient Levels and Proxmity of Agricultural and Forest Landto Streams: Some Relationships. Journal of Soil and Water Con-servation 36:227-231.
Osborne L. L. and M. J. Wiley, 1988. Empirical RelationshipsBetween Land Use/Cover and Stream Water Quality in an Agri-cultural Watershed. Journal of Environmental Management26:9-27.
Richards, C. and G. E. Host, 1994. Examining Land Use Influenceson Stream Habitats and Macroinvertebrates: A GIS Approach.Water Resources Bulletin 30:729-738.
Richards, C., L. B. Johnson, and G. E. Host, 1996. Landscape-ScaleInfluences on Stream Habitats and Biota. Canadian Journal ofAquatic Science 53 (Supplement 1):295-311.
Roth, N. E., J. D. Allan, and D. L. Erickson, 1996. Landscape Influ-ences on Stream Biotic Integrity Assessed at Multiple SpatialScales. Landscape Ecology 11:141-156.
Schlosser, I. J. and J. R. Karr, 1981. Water Quality in AgriculturalWatersheds: Impact of Riparian Vegetation During Base Flow.Water Resources Bulletin 17:233-240.
Simonson, T. D. and J. Lyons, 1995. Comparison of Catch Per Effortand Removal Procedures for Sampling Stream Fish Assem-blages. North American Journal of Fisheries Management15:419-427.
Simonson, T. D., J. Lyons, and P. D. Kanehl, 1994. Guidelines forEvaluating Fish Habitat in Wisconsin Streams. General Thchni-cal Report NC-164, U.S. Forest Service, St. Paul, Minnesota, 36pp.
Ter Braak, C. J. F., 1986. Canonical Correspondence Analysis: ANew Eigenvector Method for Multivariate Direct Gradient Anal-ysis. Ecology 67: 1167-1179.
Thr Braak, C. J. F. and Petr Smilauer, 1998. CANOCO ReferenceManual and User's Guide to Canoco for Windows — Software forCanonical Community Ordination (Version 4). Centre for Biome-try, Wageningen, The Netherlands, 351 pp.
U.S. Bureau of the Census, 1990. TIGER/Line Precensus Files,1990: Thcbnical Documentation and TIGER/Line Files. Techni-cal Notes, 40 pp.
Wang, L., J. Lyons, P. Kanehl, and R. Gatti, 1997. Influences ofWatershed Land Use on Habitat Quality and Biotic Integrity inWisconsin Streams. Fisheries 22:6-12.
Wang, L., T. D. Simonson, and J. Lyons, 1996. Accuracy and Preci-sion of Selected Stream Habitat Estimates. North AmericanJournal of Fisheries Management 16:340-347.
Weigel, B. M., J. Lyons, L. K. Paine, S. I. Dodson, and D. J. Under-sander, 2000. Using Stream Macroinvertebrates to CompareRiparian Land Use Practices on Cattle Farms in SouthwesternWisconsin. Journal of Freshwater Ecology 15:93-106.
JOURNAL OF THE AMERICAN WATER RESOURCES ASSOCIATION 1487 JAWRA