influenza surveillance lisa mchugh, mph influenza surveillance coordinator new jersey department of...
TRANSCRIPT

Influenza Influenza SurveillanceSurveillance
Lisa McHugh, MPHLisa McHugh, MPHInfluenza Surveillance Influenza Surveillance
CoordinatorCoordinatorNew Jersey Department of Health New Jersey Department of Health
and Senior Servicesand Senior Services

Seasonal InfluenzaSeasonal Influenza
5-20% infected yearly (15-60 million*)5-20% infected yearly (15-60 million*) >200,000 U.S. hospitalizations>200,000 U.S. hospitalizations
63% in persons age 63% in persons age >> 65 65 Hospitalization rate children <5Hospitalization rate children <5
With high-risk condition 500/100,000With high-risk condition 500/100,000 Without high-risk condition 100/100,000Without high-risk condition 100/100,000
~36,000 U.S. deaths ~36,000 U.S. deaths Greater than 90% of all deaths in adults Greater than 90% of all deaths in adults >>
65 years65 years Deaths among children uncommon but can Deaths among children uncommon but can
occuroccur
*Based on population of US Census estimate for 2007

Influenza SurveillanceInfluenza Surveillance
When and where influenza activity is When and where influenza activity is occurringoccurring
Determine types of influenza virus Determine types of influenza virus circulatingcirculating
Detect changes in influenza virusesDetect changes in influenza viruses Track influenza-related illnessTrack influenza-related illness Measure influenza’s impact on Measure influenza’s impact on
deaths in the United Statesdeaths in the United States

Influenza Surveillance in Influenza Surveillance in NJNJ
Disease surveillanceDisease surveillance Virologic surveillanceVirologic surveillance

Disease SurveillanceDisease SurveillanceInfluenza-like Illness (ILI)Influenza-like Illness (ILI)
Impossible to count all cases of influenzaImpossible to count all cases of influenza Use ILI to approximate true disease Use ILI to approximate true disease
burdenburden ILI combined with other more reliable ILI combined with other more reliable
information (i.e., laboratory testing) can information (i.e., laboratory testing) can provide a good estimate of disease provide a good estimate of disease burdenburden
Limitation: casts a wide net and will Limitation: casts a wide net and will capture other respiratory illnesscapture other respiratory illness

Disease SurveillanceDisease Surveillance
Influenza-like illness (ILI) Influenza-like illness (ILI) surveillancesurveillance Active surveillance- School, ED, LTCFActive surveillance- School, ED, LTCF
Sentinel provider surveillance Sentinel provider surveillance networknetwork
Pediatric influenza surveillancePediatric influenza surveillance

Active ILI SurveillanceActive ILI Surveillance
Weekly reports from ED, LTCF, and Weekly reports from ED, LTCF, and SchoolsSchools ED and LTCF - # ILI* and total censusED and LTCF - # ILI* and total census Schools - # absent and total censusSchools - # absent and total census
Currently enrolled in surveillanceCurrently enrolled in surveillance LTCF - 132LTCF - 132 ED - 87ED - 87 Schools - 719Schools - 719
Analysis done at state, county and regional Analysis done at state, county and regional levellevel* Patients with fever (* Patients with fever (>>100°F, oral or equivalent) AND cough and/or 100°F, oral or equivalent) AND cough and/or
sore throat (in the absence of a known cause).sore throat (in the absence of a known cause).

CDRSS ILI ModuleCDRSS ILI Module

Sentinel Provider Sentinel Provider Surveillance Network Surveillance Network
(SPSN)(SPSN) A collaborative effort between the public health A collaborative effort between the public health and medical communities to monitor influenza and medical communities to monitor influenza
State and local health department recruit State and local health department recruit providers to participateproviders to participate
Providers report weekly the number of patients Providers report weekly the number of patients seen and the number with ILI by 5 age seen and the number with ILI by 5 age categoriescategories
Reporting is from October 1 to mid-May Reporting is from October 1 to mid-May (MMWR week 40 to 20) of each year but year-(MMWR week 40 to 20) of each year but year-round reporting is encouragedround reporting is encouraged

SPSN GoalsSPSN Goals
Establish the beginning of the influenza season Establish the beginning of the influenza season to guide vaccination practicesto guide vaccination practices
Monitor the antigenic changes of circulating Monitor the antigenic changes of circulating influenza strains by collecting point of care influenza strains by collecting point of care specimensspecimens
Maintain a surveillance system that provides Maintain a surveillance system that provides early warning and adequate monitoring early warning and adequate monitoring capabilities in the event of a pandemic or capabilities in the event of a pandemic or outbreakoutbreak
Provide medical entities and other NJ residents Provide medical entities and other NJ residents with current and accurate information regarding with current and accurate information regarding the incidence and severity of disease in NJthe incidence and severity of disease in NJ

SPSNSPSN

SPSNSPSNNew Jersey Department of Health and Senior Services
Influenza-like Activity - Sentinel Providers
0
0.5
1
1.5
2
2.5
3
3.5
4
4.5
5
40 42 44 46 48 50 52 2 4 6 8 10 12 14 16 18 20 22 24 26 28 30 32 34 36 38
MMWR Weeks
Pe
rce
nt
ILI
2007-2008 2006-2007

Pediatric Influenza Pediatric Influenza SurveillanceSurveillance
In the 2003-2004 influenza season, In the 2003-2004 influenza season, an increase in pediatric deaths an increase in pediatric deaths observed nationallyobserved nationally
CDC implemented pediatric CDC implemented pediatric mortality reportingmortality reporting
Subsequent years severe pediatric Subsequent years severe pediatric illness and mortality data collected illness and mortality data collected in NJin NJ

Pediatric Influenza Pediatric Influenza SurveillanceSurveillance
Case DefinitionCase Definition Pediatric patients (i.e., less than 18 years of age) with Pediatric patients (i.e., less than 18 years of age) with
laboratory confirmed influenza* laboratory confirmed influenza* ANDAND
Influenza-related deaths (in which there is no period of Influenza-related deaths (in which there is no period of complete recovery between illness and death); complete recovery between illness and death);
OROR Influenza encephalopathy (defined as altered mental Influenza encephalopathy (defined as altered mental
status, or personality changes in patients lasting more status, or personality changes in patients lasting more than 24 hours and occurring within 5 days of the onset of than 24 hours and occurring within 5 days of the onset of an acute febrile respiratory illness); an acute febrile respiratory illness);
OROR Severe illness defined as admission to an intensive care Severe illness defined as admission to an intensive care
unit for influenza-related illness (in previously health unit for influenza-related illness (in previously health children)children)

Pediatric Influenza Pediatric Influenza SurveillanceSurveillance
http://www.state.nj.us/health/flu/CaseReportForm.shtml

Pediatric Influenza Pediatric Influenza SurveillanceSurveillance
FindingsFindings
Season 2005-2006 2006-2007 2007-2008*
No. Reports 62 100 45
No. Meet Case Def. 25 17 19
Deaths 1 0 1
Vaccinated 4 1 3
Not Vaccinated 17 11 16
Unknown Vaccination
4 5 0
* As of March 11, 2008
New Jersey Pediatric Influenza Summary Report:2005-2006 Influenza Season can be found at: http://nj.gov/health/flu/documents/pediatric_flu_annual_report.pdf
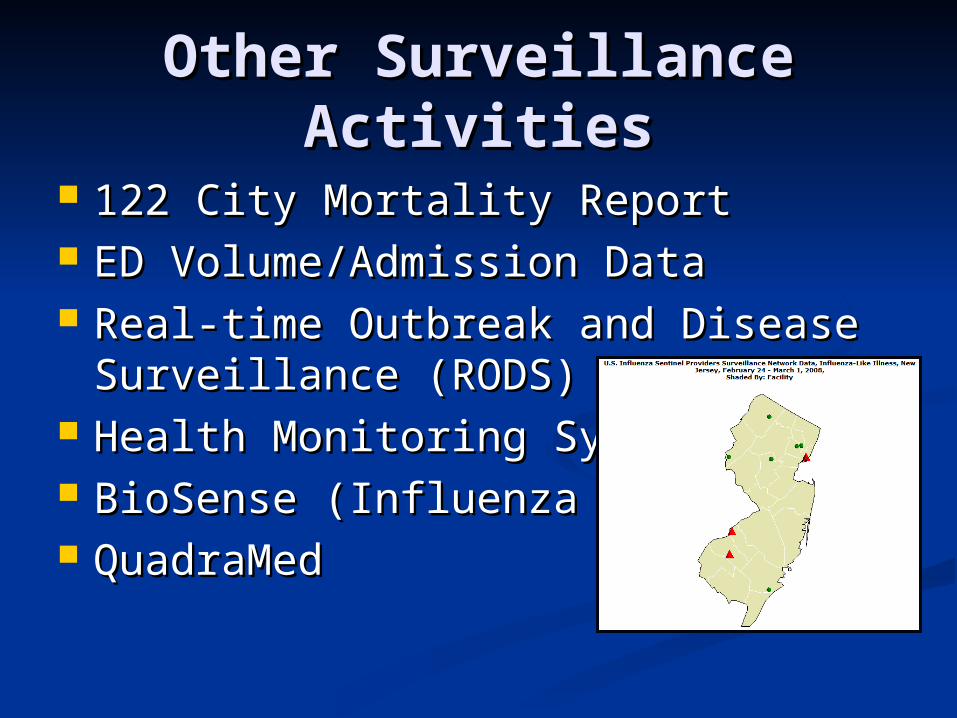
Other Surveillance Other Surveillance ActivitiesActivities
122 City Mortality Report122 City Mortality Report ED Volume/Admission DataED Volume/Admission Data Real-time Outbreak and Disease Real-time Outbreak and Disease
Surveillance (RODS) Surveillance (RODS) Health Monitoring SystemHealth Monitoring System BioSense (Influenza Module)BioSense (Influenza Module) QuadraMedQuadraMed

Virologic SurveillanceVirologic Surveillance
GoalsGoals Identify and characterize circulating Identify and characterize circulating
strains for vaccine developmentstrains for vaccine development Identify and characterize strains with Identify and characterize strains with
pandemic potentialpandemic potential Monitor trends and compare season Monitor trends and compare season
differencesdifferences ParticipantsParticipants
Any laboratory conducting influenza testsAny laboratory conducting influenza tests NREVSSNREVSS

Types of Influenza Types of Influenza TestingTesting
Influenza Diagnostic Table
Procedure Influenza
Types Detected
Acceptable Specimens Time forResults
Rapid result
available
Viral culture (GOLD STANDARD)
A and B NP swab, throat swab, nasal wash, bronchial wash, nasal aspirate, sputum
3-10 days No
Immunofluorescence DFA Antibody Staining
A and B NP swab, nasal wash, bronchial wash, nasal aspirate, sputum
2-4 hours No
RT-PCR A and B NP swab, throat swab, nasal wash, bronchial wash, nasal aspirate, sputum
1-2 days No
Serology A and B paired acute and convalescent serum samples6
>2 weeks No
Enzyme Immuno Assay (EIA)
A and B NP swab, throat swab, nasal wash, bronchial wash
15-30 minutes
Yes

NREVSS/WHONREVSS/WHO
National Respiratory and Enteric National Respiratory and Enteric Virus Surveillance SystemVirus Surveillance System 24 participating laboratories in NJ24 participating laboratories in NJ Report directly to CDC on 16 Report directly to CDC on 16
respiratory and enteric viruses respiratory and enteric viruses NJ receives and analyzes data weeklyNJ receives and analyzes data weekly

Virologic SurveillanceVirologic Surveillance
Rapid antigen test kit projectRapid antigen test kit project 2006-2007 Season2006-2007 Season
64 sentinel laboratories (8 facilities returned 64 sentinel laboratories (8 facilities returned kits)kits)
35 sentinel providers35 sentinel providers
NJDHSS asked that all positive tests be NJDHSS asked that all positive tests be forwarded to NJPHEL for PCR and forwarded to NJPHEL for PCR and cultureculture
678 samples received from 29 (45%) 678 samples received from 29 (45%) facilities facilities

Virologic SurveillanceVirologic Surveillance
*Data as of MMWR week 20
Test Results
2005-2006 2006-2007
CDC/WHO(n=135,973)
Positive=17,997
NJ(n=139)
Positive=75
CDC/WHO(n=172,735*)
Positive=23,181
NJ(n=810)
Positive =611
A13,857 (81%)
A8,209 (59%)
73 (97%)
H113
(18%) 18,392 (80%)
A12,290(67%)
428 (70%)
A49 (11%)
H1420(3%)
H13,872 (21%)
H1144 (34%)
H35,228 (38%)
H360
(82%)
H32,230 (12%)
H3235 (55%)
B 3,642 (18%) 2 (3%) 4,789 (20%) 183 (30%)
Other Virus
2 9
NVI/QNS 62 190

Influenza Subtype by Test Type (NJPHEL)2006-2007 Influenza Season
0
50
100
150
200
250
300
A AH1 AH3 B NVI QNS Other virus
Influenza Subtype
Fre
qu
en
cy
Culture PCR

Influenza Type by Age Group (NJPHEL)2006-2007 Influenza Season
0
20
40
60
80
100
120
<1 1 to 18 19 to 64 65+
Age group
Nu
mb
er
of
Po
sit
ive
s
A H1 A H3 B


Positive Influenza Samples by MMWR Week and Subtype2006-2007 Influenza Season
0
10
20
30
40
50
60
70
80
90
40 41 42 43 44 45 46 47 48 49 50 51 52 1 2 3 4 5 6 7 8 9 10 11 12 13 14 15 16 17 18 19 20
MMWR Week
Num
ber P
ositi
ve
Positive B Positive A not typed positive A H1 Positive A H3

New Jersey Department of Health and Senior ServicesInfluenza Laboratory Report
Viral Culture Positive Specimens by MMWR Week
0
10
20
30
40
50
60
70
80
90
40 41 42 43 44 45 46 47 48 49 50 51 52 1 2 3 4 5 6 7 8 9 10 11 12 13 14 15 16 17 18 19 20
MMWR Week
Nu
mb
er P
osi
tive
A H1 A H3 A UNK B
2007-2008 Influenza Culture Results by Subtype

RSV SurveillanceRSV Surveillance
Minimum of one hospital per county Minimum of one hospital per county reports the number of RSV tests and reports the number of RSV tests and the number positivethe number positive
Surveillance is important because Surveillance is important because RSV infection can often be confused RSV infection can often be confused with influenzawith influenza
Assists providers with administration Assists providers with administration of of
RSV-IGIV and palivizumabRSV-IGIV and palivizumab
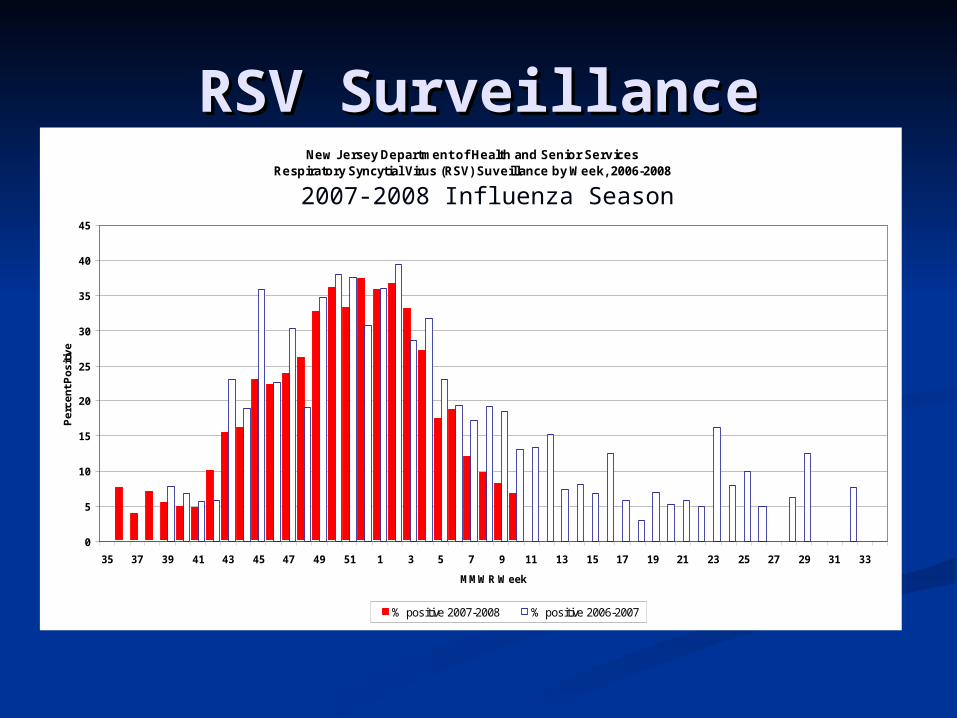
New Jersey Department of Health and Senior ServicesRespiratory Syncytial Virus (RSV) Suveillance by Week, 2006-2008
0
5
10
15
20
25
30
35
40
45
35 37 39 41 43 45 47 49 51 1 3 5 7 9 11 13 15 17 19 21 23 25 27 29 31 33
MMWR Week
Pe
rce
nt
Po
sit
ive
% positive 2007-2008 % positive 2006-2007
RSV SurveillanceRSV Surveillance
2007-2008 Influenza Season

RSV, Sentinel Providers and Influenza Positive LabsMMWR week 40 (2005) to MMWR week 20 (2007)
0
20
40
60
80
100
120
40 42 44 46 48 50 52 2 4 6 8 10 12 14 16 18 20 22 24 26 28 30 32 34 36 38 40 42 44 46 48 50 52 2 4 6 8 10 12 14 16 18 20
MMWR
% R
SV
and
# fl
u la
b po
sitiv
es
0
1
2
3
4
5
6
7
%IL
I Sen
tinel
pro
vide
rs
RSV Flu positives Sentinel ProviderFLU FLU
RSV RSV
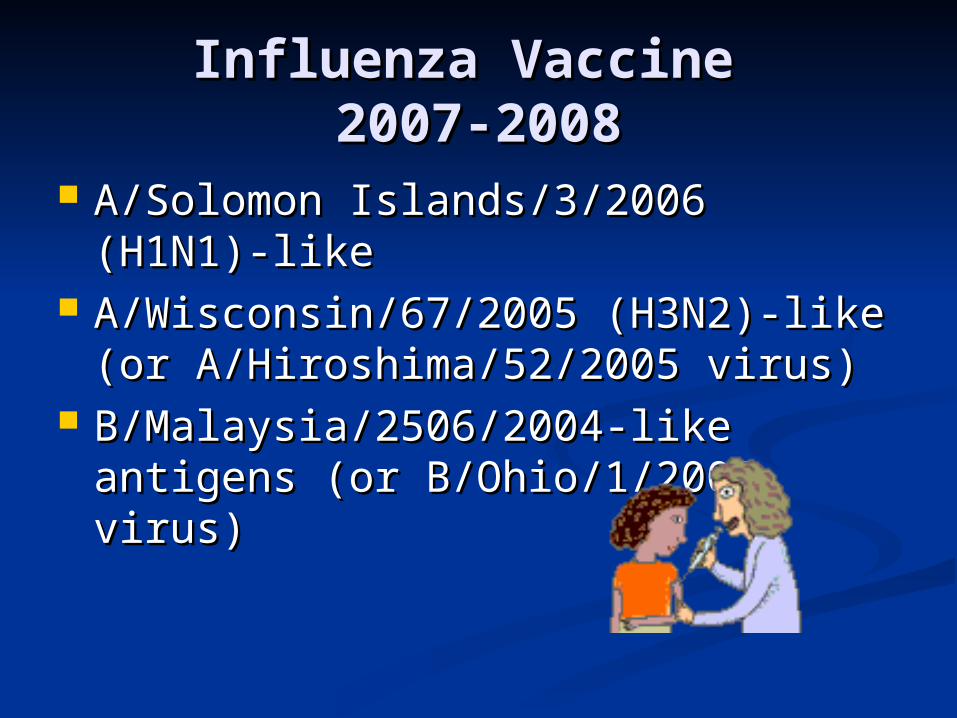
Influenza Vaccine Influenza Vaccine 2007-20082007-2008
A/Solomon Islands/3/2006 (H1N1)-A/Solomon Islands/3/2006 (H1N1)-likelike
A/Wisconsin/67/2005 (H3N2)-like (or A/Wisconsin/67/2005 (H3N2)-like (or A/Hiroshima/52/2005 virus)A/Hiroshima/52/2005 virus)
B/Malaysia/2506/2004-like antigens B/Malaysia/2506/2004-like antigens (or B/Ohio/1/2005 virus)(or B/Ohio/1/2005 virus)

2007-2008 Circulating 2007-2008 Circulating StrainsStrains
A- H1N1 (191 specimens)A- H1N1 (191 specimens) 147 (77%) 147 (77%) A/Solomon Islands/3/2006-likeA/Solomon Islands/3/2006-like 19 (10%) Reduced titers to A/Solomon 19 (10%) Reduced titers to A/Solomon
Islands/3/2006-likeIslands/3/2006-like 25 (13%) 25 (13%) A/Brisbane/59/2007-likeA/Brisbane/59/2007-like
A- H3N2 (86 specimens)A- H3N2 (86 specimens) 12 (14%) 12 (14%) A/Wisconsin/67/2005-likeA/Wisconsin/67/2005-like 67 (78%) 67 (78%) A/Brisbane/10/2007-likeA/Brisbane/10/2007-like 7 (8%) Reduced titers to 7 (8%) Reduced titers to
A/Wisconsin/67/2005-likeA/Wisconsin/67/2005-like
CDC data as of MMWR week 9

2007-2008 Circulating 2007-2008 Circulating StrainsStrains
B (89 tested)B (89 tested) Victoria lineage (6)Victoria lineage (6)
4 (67%) 4 (67%) B/Ohio/01/2005-like B/Ohio/01/2005-like 2 (33%) Reduced titers to 2 (33%) Reduced titers to
B/Ohio/01/2005-like B/Ohio/01/2005-like Yamagata lineage (83)Yamagata lineage (83)
82 (99%) 82 (99%) B/Florida/04/2006-likeB/Florida/04/2006-like 1 (1%) Reduced titers to 1 (1%) Reduced titers to
B/Florida/04/2006-likeB/Florida/04/2006-likeCDC data as of MMWR week 9

Influenza Vaccine Influenza Vaccine 2008-20092008-2009
FDA recommends all three vaccine FDA recommends all three vaccine components to be changed for the components to be changed for the 2008-2009 influenza season2008-2009 influenza season A/Brisbane/59/2007-like (H1N1)A/Brisbane/59/2007-like (H1N1) A/Brisbane/10/2007- like (H3N2)A/Brisbane/10/2007- like (H3N2) B/Florida/4/2006-like B/Florida/4/2006-like

Proposed New Influenza Proposed New Influenza Vaccine Rule Vaccine Rule
The NJDHSS is proposing a new rule at The NJDHSS is proposing a new rule at N.J.A.C.8:57-19 to establish that all N.J.A.C.8:57-19 to establish that all children six through 59 months of age children six through 59 months of age entering or attending a licensed child care entering or attending a licensed child care center or preschool facility on or after center or preschool facility on or after September 1, 2008 shall annually receive September 1, 2008 shall annually receive at least one dose of influenza vaccine at least one dose of influenza vaccine between September 1 and December 31 between September 1 and December 31 of each year.of each year.
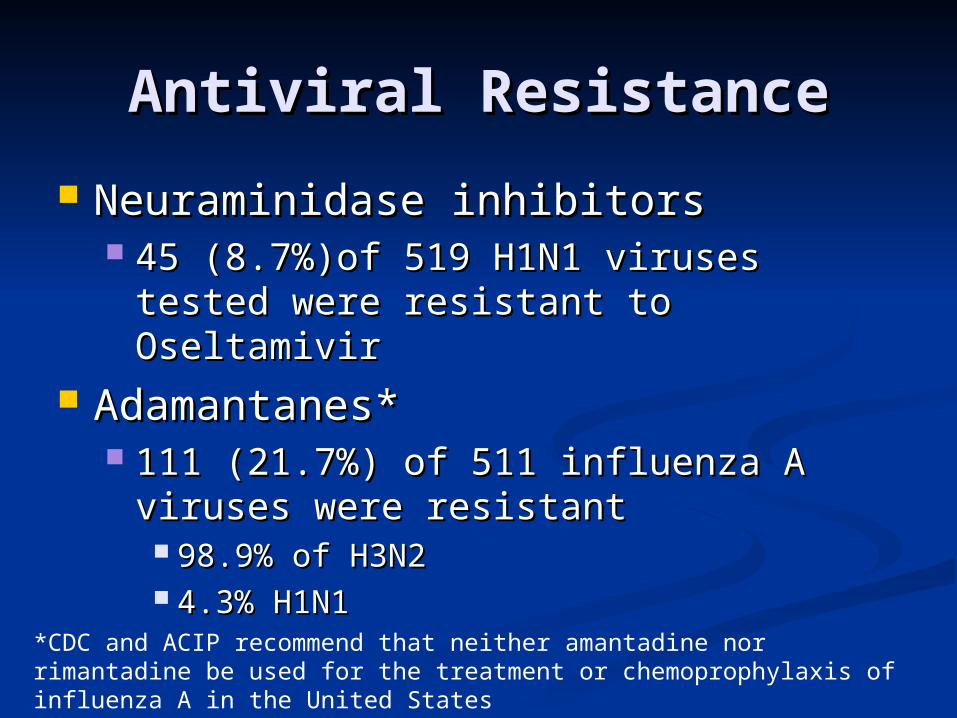
Antiviral ResistanceAntiviral Resistance
Neuraminidase inhibitorsNeuraminidase inhibitors 45 (8.7%)of 519 H1N1 viruses tested 45 (8.7%)of 519 H1N1 viruses tested
were resistant to Oseltamivirwere resistant to Oseltamivir Adamantanes*Adamantanes*
111 (21.7%) of 511 influenza A viruses 111 (21.7%) of 511 influenza A viruses were resistantwere resistant 98.9% of H3N298.9% of H3N2 4.3% H1N14.3% H1N1
*CDC and ACIP recommend that neither amantadine nor rimantadine be used for the treatment or chemoprophylaxis of influenza A in the United States

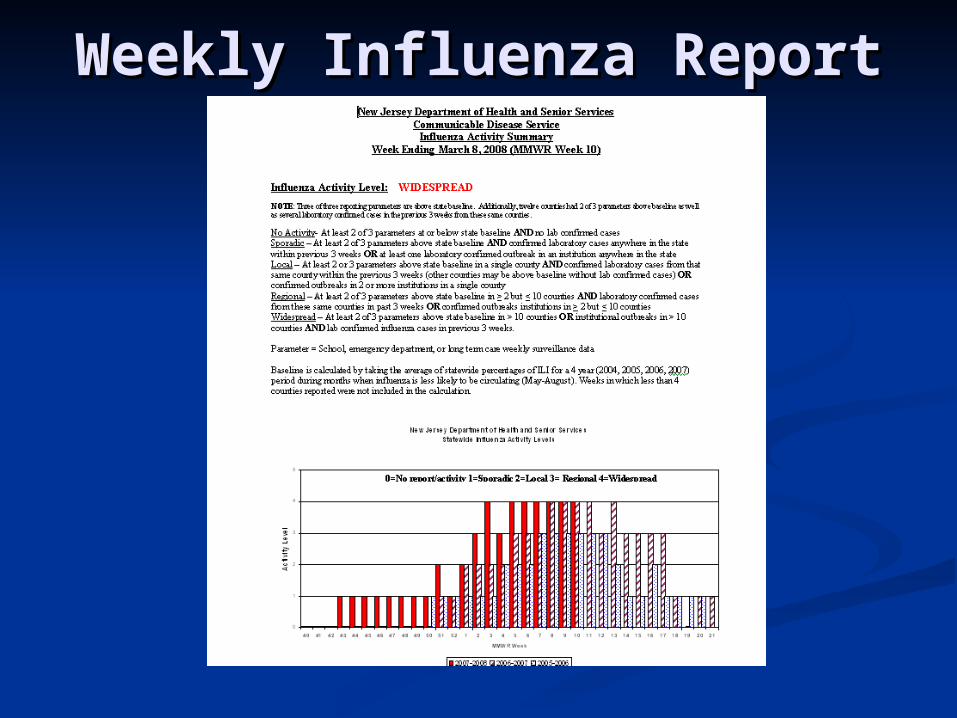
Weekly Influenza ReportWeekly Influenza Report
All surveillance data is analyzed on a All surveillance data is analyzed on a weekly basis (MMWR weeks)weekly basis (MMWR weeks)
Influenza activity level is evaluated Influenza activity level is evaluated for both the state and 5 public for both the state and 5 public health regionshealth regions

Activity LevelsActivity Levels No ActivityNo Activity-- At least 2 of 3 parameters at or At least 2 of 3 parameters at or
below state baseline below state baseline ANDAND no lab confirmed cases no lab confirmed cases SporadicSporadic – At least 2 of 3 parameters above – At least 2 of 3 parameters above
state baseline state baseline ANDAND confirmed laboratory cases confirmed laboratory cases anywhere in the state anywhere in the state OROR at least one laboratory at least one laboratory confirmed outbreak in an institution anywhere in confirmed outbreak in an institution anywhere in the statethe state
LocalLocal – At least 2 or 3 parameters above state – At least 2 or 3 parameters above state baseline in a single county baseline in a single county ANDAND confirmed confirmed laboratory cases from that same county within laboratory cases from that same county within the previous 3 weeks (other counties may be the previous 3 weeks (other counties may be above baseline without lab confirmed cases) above baseline without lab confirmed cases) OROR confirmed outbreaks in 2 or more institutions in confirmed outbreaks in 2 or more institutions in a single countya single county

Activity LevelsActivity Levels
RegionalRegional – At least 2 of 3 parameters above – At least 2 of 3 parameters above state baseline in state baseline in >> 2 but 2 but << 10 counties 10 counties ANDAND laboratory confirmed cases from these same laboratory confirmed cases from these same counties in past 3 weeks counties in past 3 weeks OROR confirmed confirmed outbreaks institutions in more than 2 but less outbreaks institutions in more than 2 but less than or equal to 10 countiesthan or equal to 10 counties
WidespreadWidespread – At least 2 of 3 parameters – At least 2 of 3 parameters above state baseline in more than 10 counties above state baseline in more than 10 counties OROR institutional outbreaks in more than 10 institutional outbreaks in more than 10 counties counties ANDAND lab confirmed influenza cases lab confirmed influenza cases in previous 3 weeks.in previous 3 weeks.

1 2 3 4 5 6 7 8 9 10 11 12 13 14 15 16 17 18 19 20
South Region
CW Region
NW Region
CE Region
NE Region
0
1
2
3
Activity Level
MMWR Week
Public Health Region
South Region CW Region NW Region CE Region NE Region
NE Region (Bergen, Essex, Hudson)CE Region (Middlesex, Monmouth, Ocean, Union)NW Region (Morris, Passaic, Sussex, Warren)CW Region (Hunterdon, Mercer, Somerset)South Region (Atlantic, Burlington, Camden, Cape May, Cumberland, Gloucester, Salem)
Weekly Influenza ReportWeekly Influenza Report

New Jersey Department of Health and Senior ServicesStatewide Influenza Activity Levels
0
1
2
3
4
5
40 41 42 43 44 45 46 47 48 49 50 51 52 1 2 3 4 5 6 7 8 9 10 11 12 13 14 15 16 17 18 19 20 21
MMWR Week
Act
ivit
y L
evel
2007-2008 2006-2007 2005-2006
Weekly Influenza ActivityWeekly Influenza ActivityNew JerseyNew Jersey
0=No report/activity 1=Sporadic 2=Local 3= Regional 4=Widespread

Weekly Influenza ActivityWeekly Influenza ActivityUnited StatesUnited States
http://www.cdc.gov/flu/weekly/usmap.htm

Questions?Questions?
Lisa McHugh, MPHLisa McHugh, MPH
Infectious & Zoonotic Disease ProgramInfectious & Zoonotic Disease ProgramInfluenza Surveillance ProgramInfluenza Surveillance Program
New Jersey Department of New Jersey Department of Health & Senior ServicesHealth & Senior Services
[email protected]@doh.state.nj.us