[email protected] | | +44 (0)207398 … amount is shown in trading station in the order window under...
TRANSCRIPT
FXCM Inc., a publicly traded company listed on the New York Stock Exchange (NYSE: FXCM), is a
holding company and its sole asset is a controlling equity interest in FXCM Holdings, LLC. Forex Capital
Markets Limited ("FXCM LTD") is an indirect operating subsidiary of FXCM Holdings, LLC. All
references on this site to "FXCM" refer to FXCM Inc. and its consolidated subsidiaries, including FXCM
Holdings, LLC and Forex Capital Markets Limited.
[email protected] | www.fxcm.com/uk | +44 (0)207398 4050

FXCM Trading Station User Guide
Welcome to the guide to our proprietary platform, Trading Station. FXCM is
devoted to providing our clients with the highest level of support when using the
platform. We take pride in providing intuitive functionality and readily accessible
trading tools. It is our hope that this guide provides a foundation for users to
navigate the various features and information available in Trading Station.
After opening the platform, the first thing that you see are red and blue flashing rates. This is the Advanced Dealing Rates Window.
Advanced Dealing Rates
Here you can see quote boxes with information on specific currency pairs, as defined by the symbol abbreviation at the top of the box. Directly to the right of the symbol is the time the exchange rate last changed.
Each symbol quote box contains both a buy (or ask) and sell (or bid). When a price flashes red, it represents a downward movement. When a price flashes blue, it means a rate has just moved higher. Press on the “Buy” price to place a long trade. Press on the “Sell” price to enter a short trade.

The difference between the price at which you can buy a pair and the price at which you can sell a pair is the spread. The spread can be seen already calculated in the middle of the quote box, right underneath the symbol.
Below the Spread you can see the Pip Cost for the for a preselected trade amount (found at the bottom of the quote box). The pip cost is the amount you gain or lose for every pip movement in that currency pair.
To the left and right of the pip cost is the Rollover. Rollover is the interest paid or earned for holding a position overnight (past 5p.m EST). Each currency has an interest rate associated with it, and because forex is traded in pairs, every trade also involves two different interest rates. RollS is the Rollover received per 10k if you sell the currency pair and RollB is the rollover received per 10k if you buy the currency pair.
At the very bottom of the quote box you can select a trade size for One Click Trading. This will be set to the base unit size of your account by default. You can only change the trade size here if you are using One Click Trading.
That covers the Advanced Dealing Rates Window. Now let’s look at the Simple Dealing Rates Window.
Simple Dealing Rates
The Simple Dealing Rates Window can be accessed by clicking the tab to the right of Advanced Dealing Rates. This window is an alternative to the Advanced Dealing Rates.
The first column shows the Symbol that represents a currency pair. It is then followed by a Sell (bid) and Buy (ask). When a price flashes blue, it means a price has just moved higher. When a price flashes red, it represents a downward movement. Press on the “Buy” Price to place a long trade. Press on the “Sell” price to enter a short trade.
Immediately following the Bid and Ask prices is the spread. The difference between the price at which you can buy a pair and the price at which you can sell a pair is called the spread.
After the spread, you will see columns labelled High and Low. As their names imply, the rates indicated in these columns represent the Highest and Lowest prices the currency pair has hit during the current trading day.
After the High and Low of the day, you can see the Rollover rates. Rollover is the interest paid or earned for holding a position overnight (past 5p.m EST). Each currency has an interest rate associated with it, and because forex is traded in pairs, every trade also involves two different interest rates. RollS is the Rollover received per 10k if you sell the currency pair and RollB is the rollover received per 10k if you buy the currency pair.
Pip Cost is the amount you gain or lose per lot for every pip movement in that currency pair.
Commission provides the estimated cost to be charged for a one lot position round turn (open and close). The commission shown is per 1k. There is no commission for CFDs; the full price of the trade is factored into the spread. Mini Accounts will not have a Commission column.
After the commission, you can view the MMR. This stands for Minimum Margin Requirement, or the margin value required per 1k to open a position.
The final column in Simple Dealing Rates, labelled Time, shows the last time the exchange rate changed.

Symbols List Left of the Dealing Rates is the Symbols List. This window is used to add
and remove the Currency Pairs and CFDs you want to trade. The Symbols List will not be open by default. You can display it by going to
ViewSymbols List
Only active symbols can be traded. An inactive symbol will not be displayed in Dealing Rates and cannot be looked at on a chart. Double click on the symbol to Add/Remove it. An active symbol will be displayed in bold, blue letters. Inactive symbols are displayed in plain black font. Symbols are separated into categories. You can toggle which categories are displayed in the Symbols List by clicking on the + or – sign next to the category. Users are limited to a maximum of 20 active symbols at a time.
• All Subscriptions lists the feeds you are subscribed to. They can be organized into groups. All the feeds and groups of feeds are included in the default root group All Subscriptions. Clicking on the plus sign will show the categories. You can choose a feed or a group of feeds from which you want to view a news item.
• Manage opens the Manage Subscriptions dialog box. You can subscribe to or unsubscribe from feeds and define settings for the feeds in this box.
• Filter allows you to search news topics by certain text.
Clicking on the tab directly to the right of News will take you to the Messages Tab.
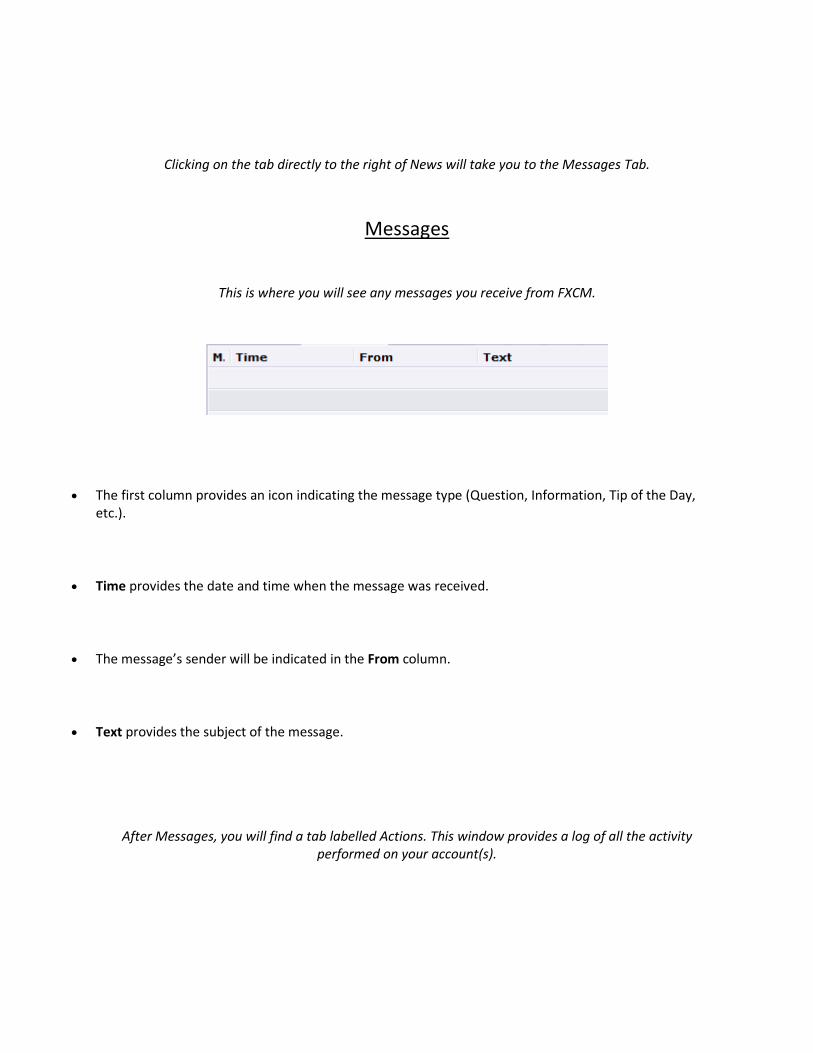
Messages
This is where you will see any messages you receive from FXCM.
• The first column provides an icon indicating the message type (Question, Information, Tip of the Day, etc.).
• Time provides the date and time when the message was received.
• The message’s sender will be indicated in the From column.
• Text provides the subject of the message.
After Messages, you will find a tab labelled Actions. This window provides a log of all the activity performed on your account(s).

Actions
• The first column provides an icon indicating the action status (in process, completed or cancelled).
• Actions lists a description of the actions performed. The actions are grouped by days.
• Sent Time provides the date and time when a request for the action was sent.
• Completed Time shows the date and time the action was completed, or “Processing..." if the request is in progress.
• Comments provides any remarks on the action.
Below the Dealing Rates and News you will find the Accounts Window.
Accounts
This window shows all pertinent account information.
Equity provides the "floating" value of funds on the account, including profits and losses on open positions.
Day P/L provides the profit and loss for the current trading session. This only includes the trading activity, not deposits and withdrawals. Day P/L resets at 5 p.m. EST (10 p.m. GMT).
After the P/L, there are several columns devoted to Margin. After the P/L, there are several columns devoted to Margin. Margin is the amount of funds you need as collateral in your account to maintain a position. This amount is shown in Trading Station in the Order Window under ‘amount’ before you even
place a trade. You need to have that amount or more as Usable Margin to open a trade.
Usd Mr (Used Margin) - This is the margin deposit required to maintain existing positions. Liquidation will trigger if Equity falls to this amount.
Usbl Mr (Usable Margin) - This is the margin deposit available for opening new positions. All positions are automatically liquidated when this amount goes below zero.
You can also view Margin information as a percentage of your total Equity.
Usbl Mr % (Usable Margin Percentage) - is [Usbl MR] / [Equity] X 100%. As above, all positions are automatically liquidated when this amount goes below zero. Gross P/L provides the total profit and loss for current open positions excluding commission and rollover.
MC (Margin Call) - The letters in the "MC" column denote the status of the margin call:
"N" means there is sufficient Maintenance Margin. "W" means a Maintenance Margin Warning has been issued. "Y" means liquidation of positions due to insufficient margin.
Type informs the user of the account’s hedging capability.
“Y” (Yes) - The account can hedge.
“N” (No) - The account cannot hedge.
If your Usable Margin hits 0 at any time, all positions will be automatically liquidated. This is known as a Margin Call. It means you no longer have enough equity in your account to maintain the open
position(s).
The window in the lower half of the screen is where you’ll find tabs used to keep track of positions.
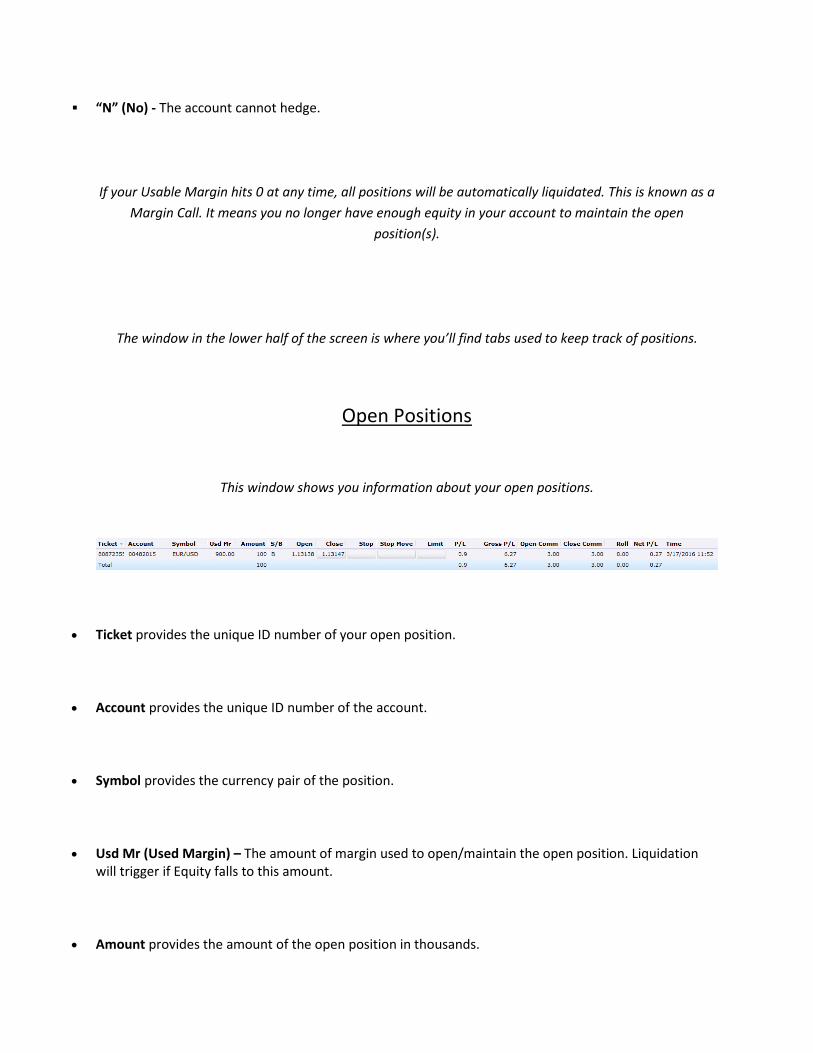
Open Positions
This window shows you information about your open positions.
• Ticket provides the unique ID number of your open position.
• Account provides the unique ID number of the account.
• Symbol provides the currency pair of the position.
• Usd Mr (Used Margin) – The amount of margin used to open/maintain the open position. Liquidation will trigger if Equity falls to this amount.
• Amount provides the amount of the open position in thousands.

• S/B (Sell/Buy) provides the trade operation of the position. If the trade operation is “S”, the position is short. If the trade operation is “B”, the position is long.
• Open provides the price at which the position was opened.
• Close provides the price at which the position can be closed at the moment.
• Stop allows you to set a stop-loss on the open position.
• Stop Move will provide the number of pips until your trailing stop is moved.
• Limit allows you to specify a take profit level for the open position.
• P/L (Profit/Loss) provides the current profit or loss of the position for in pips.
• Gross P/L provides the current profit or loss of the position in the account currency.
• Open Comm provides the amount of commission that has been charged for opening the position. The amount is expressed in the account currency. The column may be hidden if commission is not applicable to the account.
• Close Comm provides the estimated amount of the commission to be charged for closing the position. The amount is expressed in the account currency. For details, see the Trading Commissions section. The column may be hidden if commission is not applicable to the account.
• Roll (Rollover Interest) provides the amount of rollover interest received or paid for the position on rollover.
• Net P/L provides the amount of current profit or loss of the position. The amount includes rollover interest (Roll), the commission that has been charged for opening the position (Open Comm), and the estimated commission to be charged for closing the position (Close Comm). The profit or loss is expressed in the account currency.
• Time provides the date and time when the position was opened.
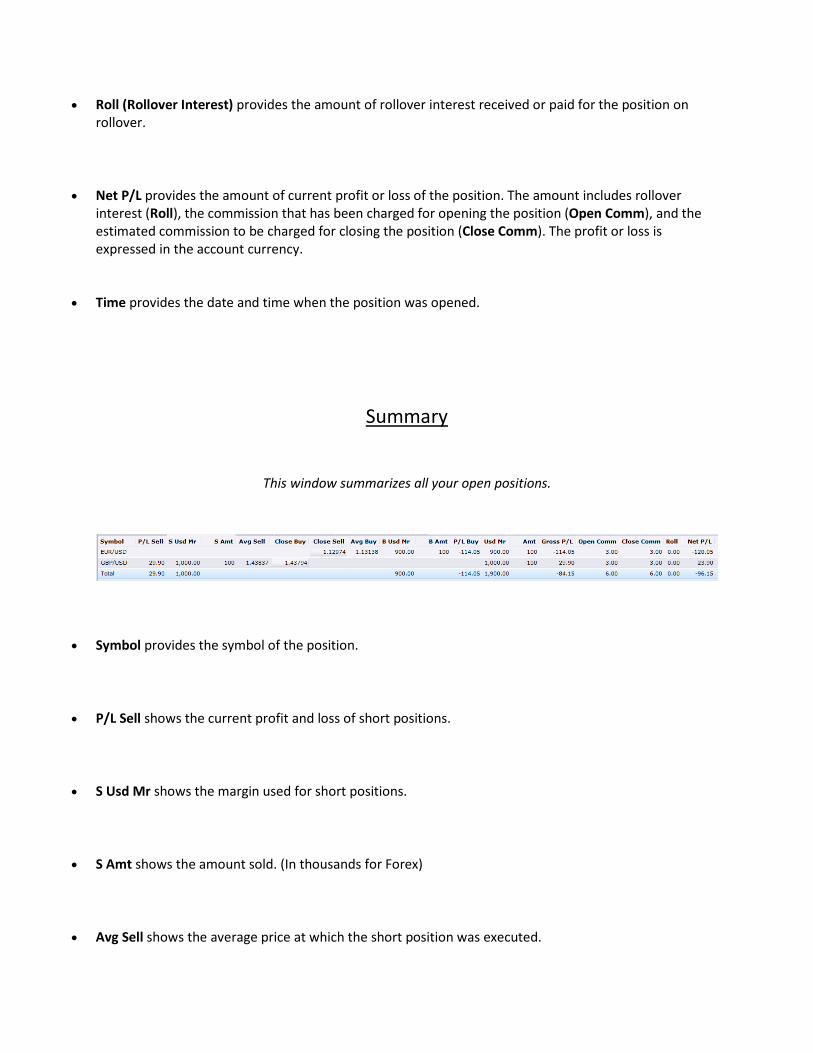
Summary
This window summarizes all your open positions.
• Symbol provides the symbol of the position.
• P/L Sell shows the current profit and loss of short positions.
• S Usd Mr shows the margin used for short positions.
• S Amt shows the amount sold. (In thousands for Forex)
• Avg Sell shows the average price at which the short position was executed.
• Close Buy shows the price at which a short position can be closed at the moment.
• Close Sell shows the price at which a long position can be closed at the moment.
• Avg Buy shows the average price at which the long position was executed.
• B Usd Mr shows the margin used for long positions.
• B Amt shows the amount bought. (In thousands for Forex)
• P/L Buy shows the current profit and loss of long positions.
• Usd Mr shows the margin used to open and maintain positions.
• Amt provides the amount bought or sold. (In thousands for Forex)
• Gross P/L provides the current profit or loss of the position in the account currency excluding commission and rollover.
• Roll (Rollover Interest) provides the amount of rollover interest received or paid for the position.
Net P/L provides the amount of the current profit or loss of the position. The amount includes rollover interest (Roll), the commission that has been charged for opening the position (Open Comm), and the estimated commission to be charged for closing the position (Close Comm). The profit or loss is
expressed in the account currency.
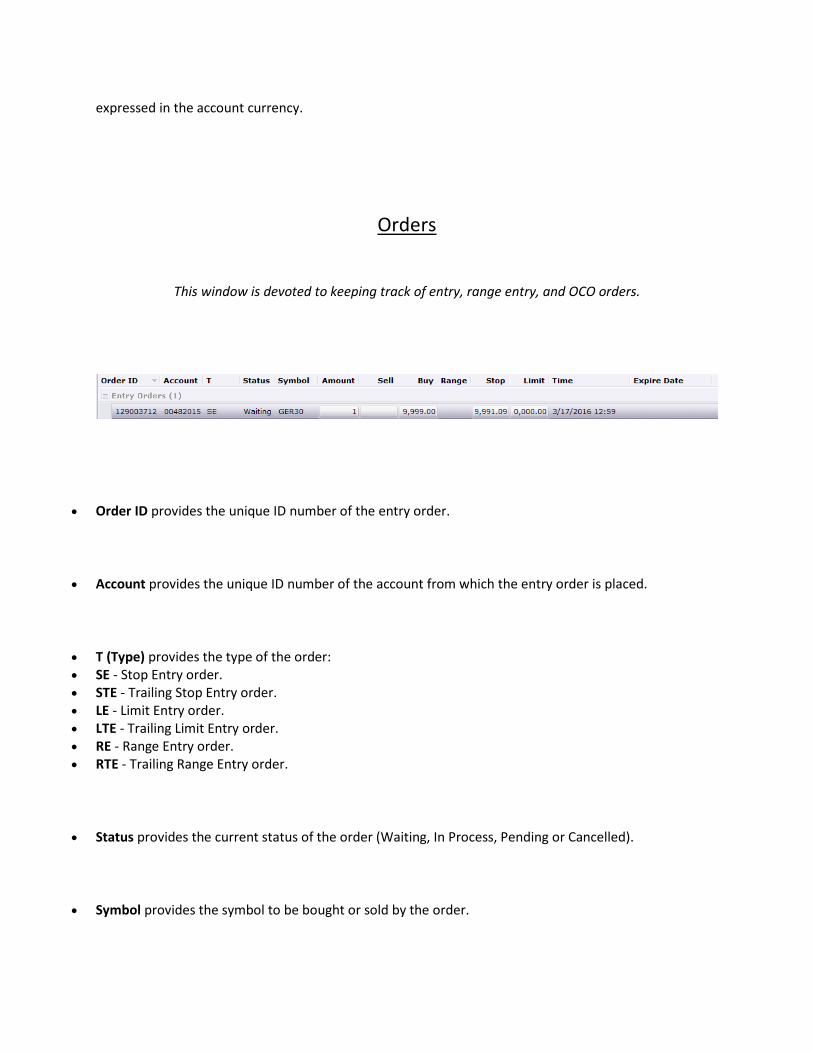
Orders
This window is devoted to keeping track of entry, range entry, and OCO orders.
• Order ID provides the unique ID number of the entry order.
• Account provides the unique ID number of the account from which the entry order is placed.
• T (Type) provides the type of the order: • SE - Stop Entry order. • STE - Trailing Stop Entry order. • LE - Limit Entry order. • LTE - Trailing Limit Entry order. • RE - Range Entry order. • RTE - Trailing Range Entry order.
• Status provides the current status of the order (Waiting, In Process, Pending or Cancelled).
• Symbol provides the symbol to be bought or sold by the order.

• Amount provides the amount of the order. The amount is expressed in thousands for Forex.
• Buy provides the order price of a long position. Sell provides the order price of a short position.
• Range is the amount of pips you are willing to deviate from if your order cannot be executed at the exact price specified.
• Stop provides the entry order stop price.
• Limit provides the entry order limit price.
• Time provides the date and time when the order was created.
• Expire Date provides the date and time when the order expires. This column provides data only for the entry orders with GTD time in force option.
Closed Positions
This window shows you information about your closed positions.

• Ticket provides the unique ID number of your closed position.
• Account provides the unique ID number of the account on which the position was closed.
• Symbol provides the symbol of the closed position.
• Amount provides the amount of the closed position. In thousands for Forex.
• S/B (Sell/Buy) provides the trade operation of the closed position. If the trade operation is “S”, the position was short. If the trade operation is “B”, the position was long.
• Open provides the price at which the position was opened.
• Close provides the price at which the position was closed.
• P/L (Profit/Loss) provides the profit or loss of the position in pips.
• Gross P/L provides the profit or loss of the position excluding commission and rollover.
• Comm provides the total commission that has been charged on the position.
• Roll (Rollover Interest) provides the amount of rollover interest received or paid on rollover. If the number is positive, the amount was received by the trader. If the number is negative, the amount was paid by the trader. Note: the column can be hidden for Interest Free Accounts.

• Net P/L provides the amount of the profit or loss realized from the position. The amount includes rollover interest (Roll) and the commission that has been charged on the position (Comm). The profit or loss is expressed in the account currency.
• Open Time provides the date and time when the position was opened.
• Close Time provides the date and time when the position was closed.
Strategy Dashboard
The Strategy Dashboard is used for monitoring Automated Strategies you have running on the account.
Any Strategy you have enabled will show up in the Dashboard.
This window will show you the name of the strategy, the symbol it is trading, the period it is using to trade, and the account number the strategy is running on.
The last column will show you if the strategy actually has permission to place live trades. A “No” in this column means the strategy will not execute any trades. A “Yes” is not necessary in this column. If you don’t see “No”, it means the strategy will place trades.

After you set up these windows the way you want them, you can save the set up by going to ViewProfilesSave Profile. When you reopen the platform, just open the profile you saved by going to
ViewProfilesOpen Profile.
Menu Bar
The menu bar will provide you with functions which you can utilize for trading.
• The Buy and Sell buttons can be used to place orders on various currency pairs. The default symbol selected will be the last currency pair you interacted with in the Dealing Rates Windows.
• Stop/Limit can be used to set a stop or limit order for Existing Positions. You will be unable to use this function unless a position is highlighted in the Summary Window or the Open Positions Window.
• Close allows you to close out existing positions. You will be unable to use this function unless a position is highlighted in the Summary Window or the Open Positions Window.
• Entry allows you to place an entry order.
• Trading Settings allows you to choose between One Click, Click and Confirm, and Double Click trading. It also allows you to set the parameters for One Click and Double Click.
• Strategies allows you to select a Strategy to run on your account. It also allows you to set parameters for the selected Strategy.

• Symbols allows you to select which currency pairs can be viewed on your platform from the available list.
• Report allows you to generate a Combined Account Statement for a selected period. Here you can view information such as your closed trades, outstanding orders, floating positions, and account activity. This same statement can be accessed through myfxcm.com
• MyFXCM redirects you to myfxcm.com, your account management portal.
• Chat redirects you to FXCM’s Client Services Chat.
• Create Chart will open up a new chart in Marketscope (discussed below).
• Backtest Strategy will allow you to evaluate a selected strategy’s success based of past data.
• Optimize Strategy enables you to test a strategy’s parameters to see which are hypothetically the most profitable.

The toolbar at the top is useful for changing settings and optimizing the platform for personal preferences.
• System- This is where most of the platform’s details can be changed, particularly in Options. Here, a trader can change anything from the color of candlesticks to the platform’s font.
• View can be useful for managing windows. Default Layout can be pressed to restore the platform back to the original layout.
• Trading allows you to access the trading functionality of various windows.
• Charts is best used to open new MarketScopes.
• Alerts and Automation contains everything that has to do with strategies and alerts.
• Help is the menu to visit if a trader ever finds themselves in need of assistance.

Charts
There are numerous ways to open a chart. Regardless of what method you choose, all charts will open in a new window called Marketscope. Marketscope is FXCM’s renowned charting software.
Opening a Chart
There are several ways to open a chart. Any one of these options will take you to Marketscope.
The Create Chart icon on the menu bar at the top of Trading Station.
Right clicking on a symbol in Advanced or Simple Dealing Rates and pressing “Open Chart”
By clicking on “Charts” on the toolbar at the top of Trading Station and pressing either “Create Chart” or “Open Chart” or “New Marketscope”
The final way to open a chart is to go to ChartsLayoutsOpen Layout. This method will only work if you have a layout saved.
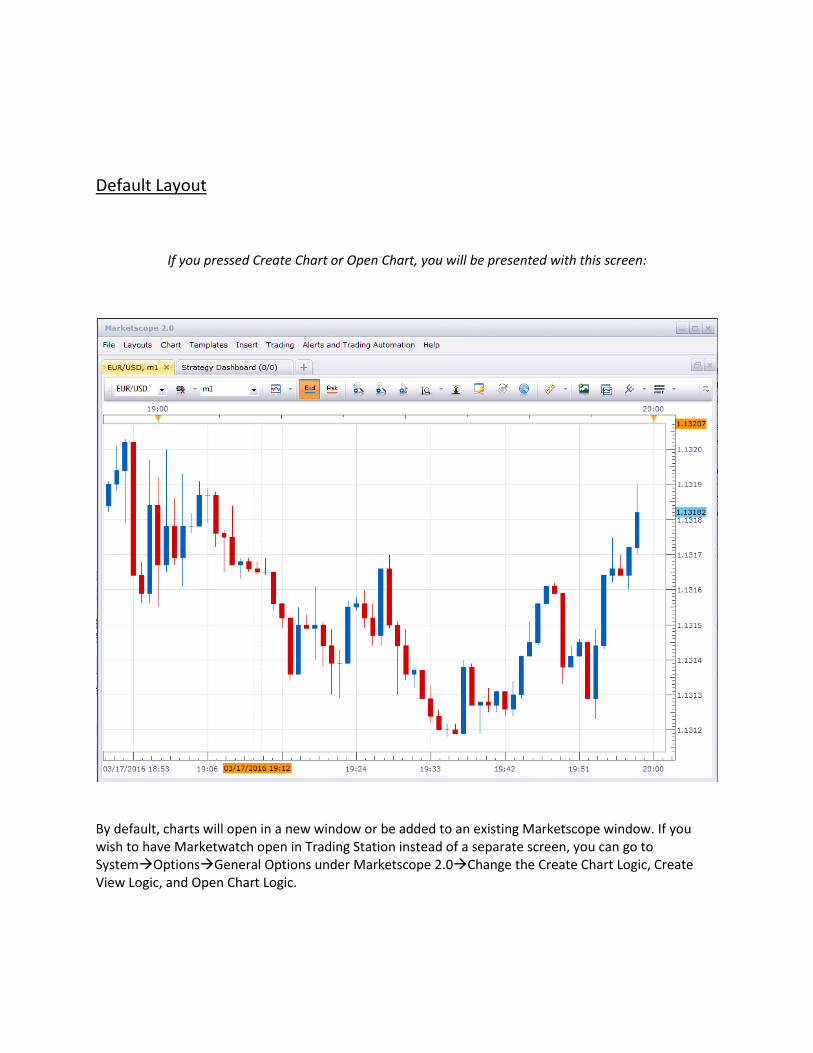
Default Layout
If you pressed Create Chart or Open Chart, you will be presented with this screen:
By default, charts will open in a new window or be added to an existing Marketscope window. If you wish to have Marketwatch open in Trading Station instead of a separate screen, you can go to SystemOptionsGeneral Options under Marketscope 2.0Change the Create Chart Logic, Create View Logic, and Open Chart Logic.
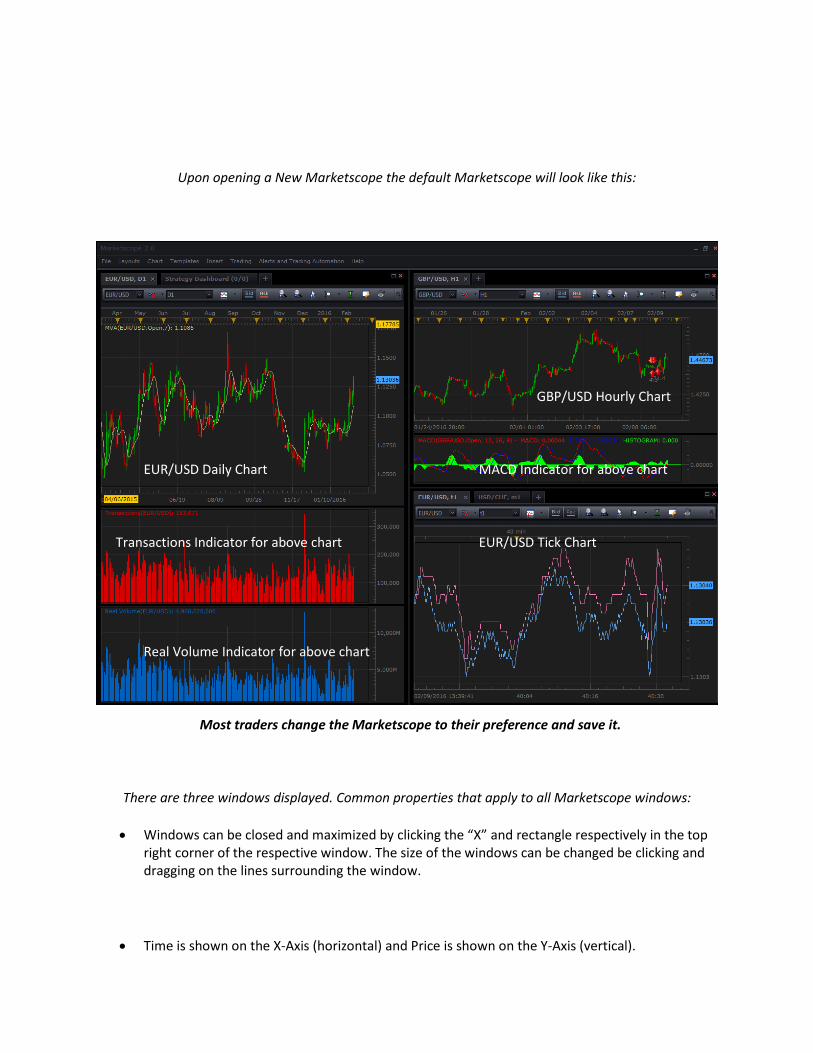
Upon opening a New Marketscope the default Marketscope will look like this:
GBP/USD Hourly Chart
EUR/USD Daily Chart MACD Indicator for above chart
Transactions Indicator for above chart EUR/USD Tick Chart
Real Volume Indicator for above chart
Most traders change the Marketscope to their preference and save it.
There are three windows displayed. Common properties that apply to all Marketscope windows:
• Windows can be closed and maximized by clicking the “X” and rectangle respectively in the top right corner of the respective window. The size of the windows can be changed be clicking and dragging on the lines surrounding the window.
• Time is shown on the X-Axis (horizontal) and Price is shown on the Y-Axis (vertical).

• Each window will have a tab at the top displaying the currency pair and time frame of the chart. Tabs can be closed by clicking on the “X” on the tab. New tabs can be added within windows by clicking on the “+” next to existing tabs.
• Windows can be moved by clicking and dragging on the window frame. Hover over the blue arrows while dragging the window to position the selected window to your liking.
• The toolbars at the top of the chart can be used to configure what the chart displays. Currency pairs as well as time frames can be changed using drop down menus on the toolbar. The toolbar will be discussed in detail later.
The bottom right window is a Tick Chart. A tick chart shows price movement in terms of the number of transactions. It moves every time a certain number of trades (ticks) have been completed. The tick chart shows two lines: one line for bid and one line for ask. The currency pair and number of ticks can be adjusted in the toolbar, as well as the Bid and Ask lines.
The two other windows display two different currency pairs with two different time frames. They also display indicators. We will now show how to add indicators to a chart along with a common setup.

Popular Setup
Most traders choose to have one chart open per Marketscope along with 1 or 2 indicators underneath it. This is done by closing the Tick Chart along with one of the currency pair windows, leaving only one
window open. Individual setup is of course, up to you.
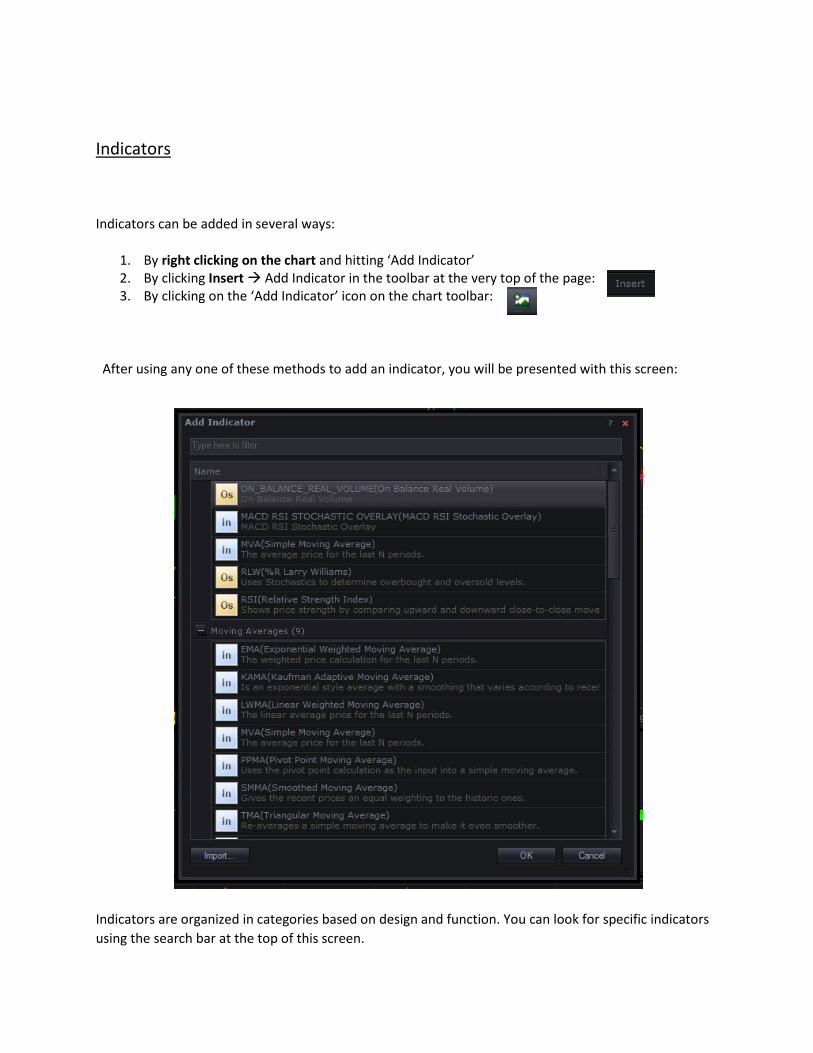
Indicators
Indicators can be added in several ways:
1. By right clicking on the chart and hitting ‘Add Indicator’ 2. By clicking Insert Add Indicator in the toolbar at the very top of the page: 3. By clicking on the ‘Add Indicator’ icon on the chart toolbar:
After using any one of these methods to add an indicator, you will be presented with this screen:
Indicators are organized in categories based on design and function. You can look for specific indicators using the search bar at the top of this screen.

After you have selected your indicator of choice, you will be asked to input its properties.
• Parameters is where you specify what you exactly want the indicator to track and how you want it to look. You will find settings organized into categories such as calculation, appearance, and style. To make a change, simply click on the box of the desired parameter. There will often be a menu that must be clicked in the bottom right corner of the box, as in the case of color selection.
• The Data Source tab is used to tell the indicator where to get its information. Indicators can derive data from a variety of sources. This is where you specify which numbers are used for calculation. The most popular source of data among traders is the Close price, or the final price of a period. Close is set as the data source for indicators by default.
• The tab labelled Location allows you to choose where the indicator will be displayed. Options generally include on the chart itself, in a separate area below the chart, as well as on other indicators you already have set up. For example, if you wanted your RSI to include some Moving
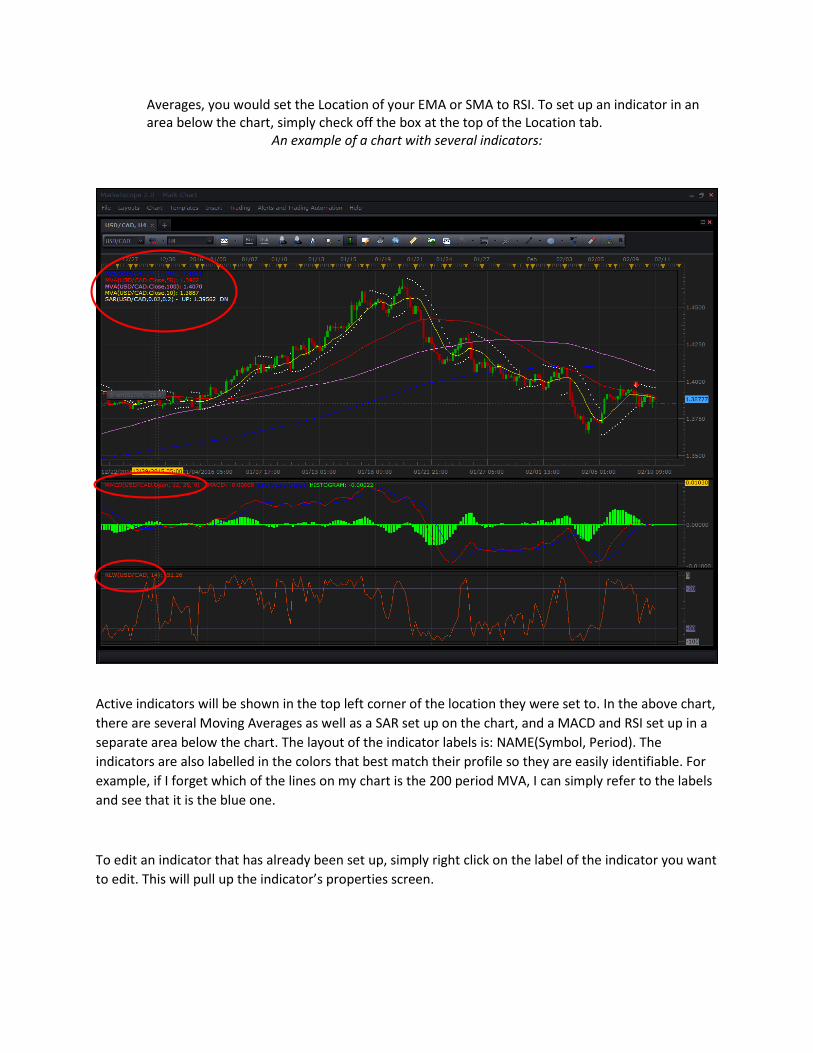
Averages, you would set the Location of your EMA or SMA to RSI. To set up an indicator in an area below the chart, simply check off the box at the top of the Location tab.
An example of a chart with several indicators:
Active indicators will be shown in the top left corner of the location they were set to. In the above chart, there are several Moving Averages as well as a SAR set up on the chart, and a MACD and RSI set up in a separate area below the chart. The layout of the indicator labels is: NAME(Symbol, Period). The indicators are also labelled in the colors that best match their profile so they are easily identifiable. For example, if I forget which of the lines on my chart is the 200 period MVA, I can simply refer to the labels and see that it is the blue one.
To edit an indicator that has already been set up, simply right click on the label of the indicator you want to edit. This will pull up the indicator’s properties screen.

Toolbar
This is the toolbar found directly above a chart. It is useful for changing chart settings, as well as adding useful tools to a chart.
If you ever forget what any of the icons do, you can hover over them and their name will pop up.
Use this drop down menu to change the symbol that you are viewing.
Links charts together allowing the trader to change the symbol on all linked charts simultaneously.
Use this drop down menu to change the period that you are viewing.
Use this menu to change the type of chart you are viewing (Candle, Bar, Line, and Table)
Use these buttons to alternate between viewing Bid and Ask prices.

These are zoom options. Use these as an alternative to your mouse’s scroll wheel.
Provides a dropdown menu that allows you to fit the chart vertically or horizontally.
This feature keeps the chart vertically scaled. Keep on if you don’t want prices getting cut off by the X-axis.
This feature will stop the platform from automatically moving the chart to the most recent candle.
Pressing on this icon will take you back to the most recent candle.
This icon will open up the cursor data window.
This is a measuring tool used by clicking and dragging. It shows your measurement in this layout: Price/number of candles/pips
Click on this icon to add an indicator.
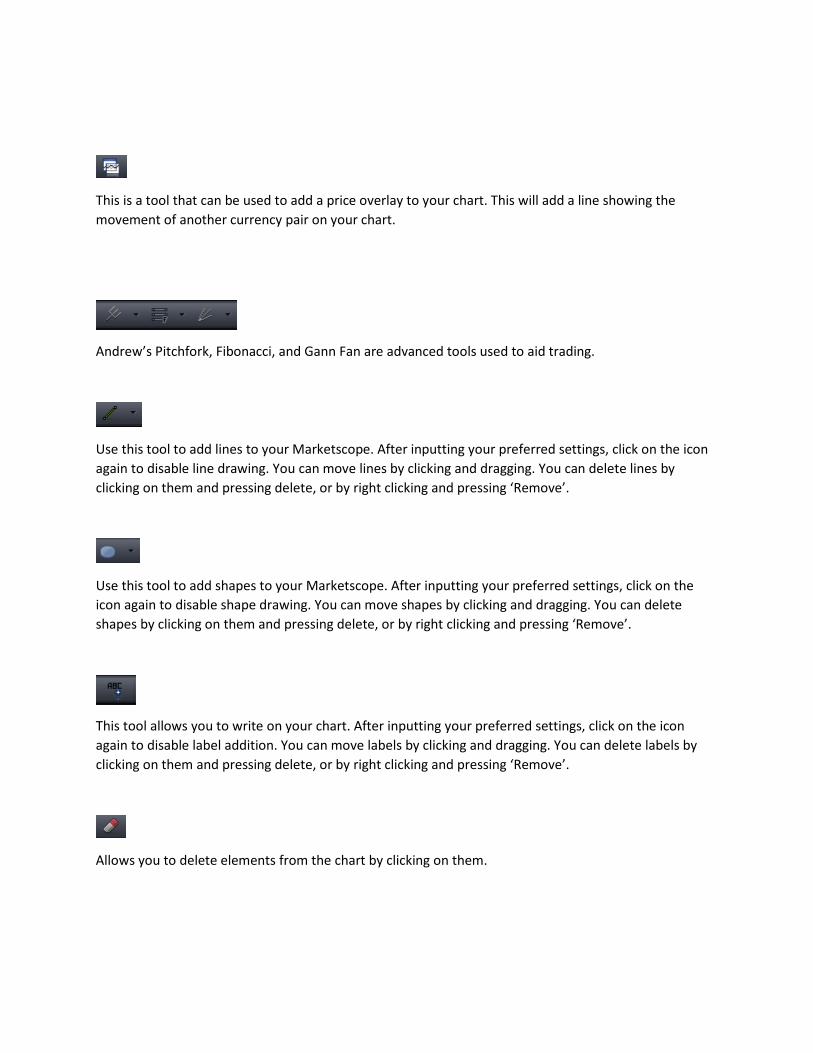
This is a tool that can be used to add a price overlay to your chart. This will add a line showing the movement of another currency pair on your chart.
Andrew’s Pitchfork, Fibonacci, and Gann Fan are advanced tools used to aid trading.
Use this tool to add lines to your Marketscope. After inputting your preferred settings, click on the icon again to disable line drawing. You can move lines by clicking and dragging. You can delete lines by clicking on them and pressing delete, or by right clicking and pressing ‘Remove’.
Use this tool to add shapes to your Marketscope. After inputting your preferred settings, click on the icon again to disable shape drawing. You can move shapes by clicking and dragging. You can delete shapes by clicking on them and pressing delete, or by right clicking and pressing ‘Remove’.
This tool allows you to write on your chart. After inputting your preferred settings, click on the icon again to disable label addition. You can move labels by clicking and dragging. You can delete labels by clicking on them and pressing delete, or by right clicking and pressing ‘Remove’.
Allows you to delete elements from the chart by clicking on them.

The Chart Elements feature is used to edit everything you have on your chart. Everything added on your Marketscope that has properties can be changed using this tool.
The final toolbar icon is the ‘Options’. Press on this icon to add or remove tools from the toolbar.
Menu
File contains the most general features such as printing and saving. You will also be able to access the ‘Options’ which can be used to make changes to the platform.
Layouts is useful for saving and loading your desired set up. Layouts save a set of charts and all chart elements: Indicators, Trend lines, Fibonacci retracements, etc. You can save all the work you’ve done to your chart in the Layout menu. Layouts save a set of charts and all chart elements: Indicators, Trend lines, Fibonacci retracements, etc. The
Chart contains features that change your view of the price history. These include changes to the chart mode, data range, as well as some of the tools offered on the toolbar.
Templates allow you to save a set of indicators that are applied on your chart. You can them apply the template, or set of indicators, to another chart by clicking ‘Manage Templates’.
Insert is an alternative to the toolbar. You’ll find many of the toolbar’s features found under this menu.

Trading has two functions: it is a menu used to open trades and a menu for trade display settings. The first four options are used to open different types of positions in the market. The ‘Show’ options allow you to alternate between seeing and hiding your trades on the chart.
Alerts and Trading Automation contains all the settings used for strategies and alerts. Strategies will trade for you; Alerts will warn you when a certain signal is triggered. Adding a strategy or alert is similar to adding an indicator. Simply choose the desired signal and input the parameters. Strategies will show up on the Strategy Dashboard which can be hidden or displayed at all times. You can also backtest your selected strategy to see how well it would have performed in the past.
Help refers you to a platform guide.
The Right Click Menu is accessed by right clicking anywhere on your chart. It offers many of the options available in other places on the platform in one concise menu. For most traders, this is the preferred method of opening positions, adding indicators, setting stops, and performing many other useful actions. Simply right click on your chart to access this menu.
Placing Trades
Now that we’ve covered how to use the platform, we can go over the various ways to open, close, and
manage positions.
The following options are available to open a trade in Marketscope:
• Right Clicking on a chart and selecting the type order you want to place.
• Accessing the ‘Trading’ menu at the top of Marketscope.
• Clicking on the rate on the X-axis. Clicking on the current price will open the Market Order Window. Clicking on any other price will open the Entry Order Window.
The following options are available to open a trade in the Trading Station:

• By clicking on the ‘Buy’ or ‘Sell’ button on the toolbar.
• By clicking on a rate in the Advanced Dealing Rates Window. Clicking on the Buy rate will set the order to ‘Buy’. Clicking on the Sell rate will set the order to ‘Sell’.
• By clicking on a rate in the Simply Dealing Rates Window. Clicking on the Buy rate will set the order to ‘Buy’. Clicking on the Sell rate will set the order to ‘Sell’.
• Accessing the ‘Trading’ menu at the top of Trading Station. Both the ‘Dealing Rates’ and ‘Orders’ menus contain different options for placing trades.
To close a trade in Marketscope:
• If you have ‘Show Open Positions’ enabled, you will see a rectangle with your trade information on the left side of the chart. You can click on this rectangle to open the ‘Close Positions’ window.
To close a trade in Trading Station:
• Right Click on the position in the Summary Window and click ‘Close Position’
• Right Click on the position in the Open Positions Window and click ‘Close Position’
• Right Click on the Order in the Orders Window and click ‘Remove Order’ (Entry Orders)
• Accessing the Trading menu at the top of Trading Station, navigating to Open Position, and clicking ‘Close Position’
Order Types
When you place a trade, you are actually sending an order for execution. There are several types of
orders for you to choose from.
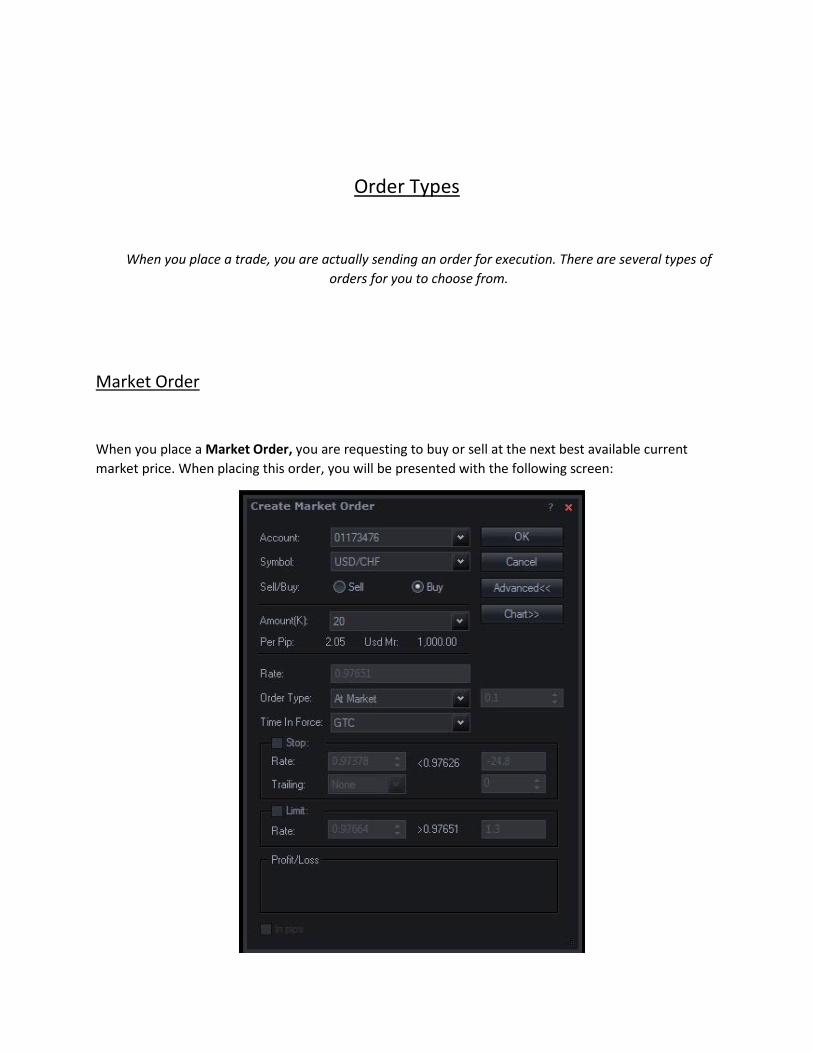
Market Order
When you place a Market Order, you are requesting to buy or sell at the next best available current market price. When placing this order, you will be presented with the following screen:
The Market Order Window allows you to input the details of a Market Order. This includes general options such as the symbol and amount, but also specifics such as the Order Type and Time in Force.
There are two Order Types to choose from when creating a Market Order: At Market and Market Range.
• At Market executes the order at the best price available to FXCM from its many liquidity providers, which includes FXCM's markup.
• A Market Range order will only execute if the order can be filled within the defined range that you set. For example, setting the range to 10 guarantees that the order will only execute within a price range that is either 10 pips above or below the order price, assuming liquidity is available. This order type is a good option when prices are volatile like they often are around news events.
You must also select the Time in Force for the order.
• GTC (Good ‘Til Cancelled) ensures that your entire order is executed. GTC orders may be broken up into partial orders if sufficient liquidity isn’t available to fill the entire order at the best available price. GTC is not available for Market Range orders.
• IOC (Immediate or Cancel) fills as much of your order as possible at the best available price. If the entire order cannot be filled at the best available price, the remainder cancels.
• FOK (Fill or Kill) when you want your entire order filled at the best available price. If the entire order cannot be filled at the best available price, the entire order cancels (no partial orders).
You can also choose to place a Stop or a Limit on your order. Both a Stop and a Limit are designed to get you out of a position at a desired price. A Limit is used to capture profits. Limit Orders guarantee price but not execution. A Stop Loss is used to protect against losses. Stop Orders guarantee execution but not price. Stops and Limits can be specified as rates, but can also be entered in pips by checking of “In
Pips” at the bottom of the window. Both Stop and Limits can be placed on a trade, but Stops also offer a Trailing option.

The Two Types of trailing stops are Fixed and Dynamic:
• Fixed Trailing Stops trail your stop by a fixed amount of pips as the market moves in your favor. This results in a Stop that waits for a certain number of pips to be accrued before moving. The minimum Fixed distance is 10 Pips.
For example, let’s say we had an initial -50 pip stop loss that we set to trail with a fixed-step of 10. Our stop will stay at -50 until the price moves in our favor a full 10 pips. Once +10 pips of floating profit is reached on the trade, our fixed-step stop would jump from -50 to -40. Our stop would then stay at -40 until the price moved in our favor another 10 pips up to +20 pips total.
• Dynamic Trailing Stops move your stop every 0.1 pips the market moves in your favor 0.1 pips. The 0.1 Pip move cannot be changed.
For example, let’s say we set our dynamic stop initially at -10 pips and then the trade moves in our favor 1 pip. Our stop would move 1 pip from -10 pips to -9 pips.

Entry Order When the current market price isn’t suitable for your strategy, an Entry Order lets you enter the market
at some time in the future. You specify a price above or below the current market price. If the market price reaches your entry price, your order attempts to execute as an At Market Order.
The Entry Order Window allows you to input the details of an Entry Order. It is similar to the Market Order Window, but it also lets you specify the Rate at which to enter a trade.
There are two Order Types to choose from when creating an Entry Order: Entry Order and Range Order.
• A regular Entry Order executes the order at the selected rate using the best price available to FXCM from its many liquidity providers, which includes FXCM's markup.

• A Range Entry order will only execute if the order can be filled within the defined range that you set. For example, setting the range to 10 guarantees that the order will only execute within a price range that is either 10 pips above or below the order price, assuming liquidity is available. This order type is a good option when prices are volatile like they often are around news events.
You must also select the Time in Force for the order.
• GTC (Good Till Cancelled) ensures that your entire order is executed. GTC orders may be broken up into partial orders if sufficient liquidity isn’t available to fill the entire order at the best available price. GTC is not available for Market Range orders.
• GTD (Good Till Date) orders remain active until the end of the trading day (5 p.m.) of the specified date, or until cancelled.
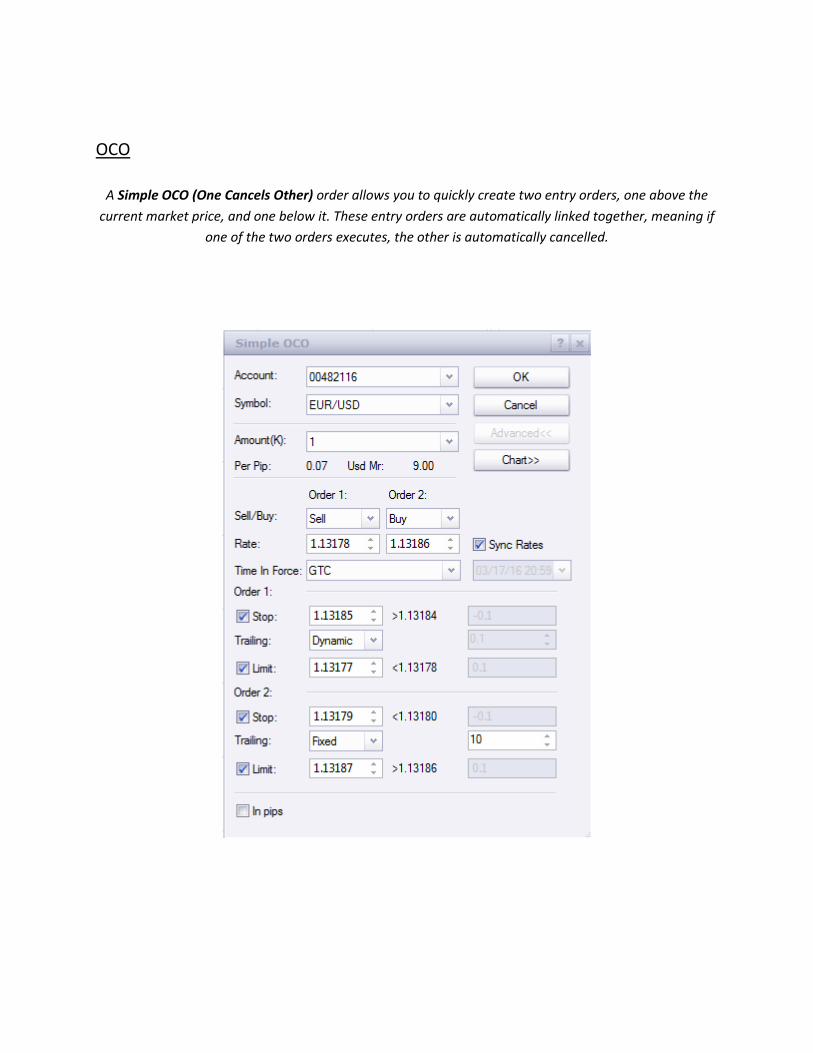
OCO
A Simple OCO (One Cancels Other) order allows you to quickly create two entry orders, one above the current market price, and one below it. These entry orders are automatically linked together, meaning if
one of the two orders executes, the other is automatically cancelled.

You will be presented with a screen asking you to input the symbol, amount, and 2 orders. You will be able to designate whether each of the orders is a Buy or Sell, the desired rate, and whether or not you
want them to have stops and limits. Complex OCO Orders allow you to link together any number of Entry Orders, including ones for different
currency pairs. If any one of those entry orders executes, all of the others that are linked to it will automatically cancel. Complex OCO orders are great way to manage multiple trading strategies at one
time.
The Complex OCO Window will show you a list of existing entry orders. In addition, you can also place Entry Orders on this screen. Select the order you want to be OCO, and click add. It will now show up in the OCO Order section. Repeat this for every order you want to be OCO. After you are happy with your
OCO selections, click ‘OK’
Placing a Stop/Limit on an Open Position
If you ever decide to place a Stop or a Limit on an Open Position or change an existing Stop or Limit, the following options are available to you:
In Marketscope:
• By Right Clicking on the arrow displaying entry of a position and click Change or Add Stop/Limit
• If you have ‘Show Open Positions’ enabled, you will see a rectangle with your trade information on the left side of the chart. You can Right Click on this rectangle and click Change or Add Stop/Limit.
In Trading Station:
• By Right Clicking on the Position in the Summary or Open Positions Windows and clicking Stop/Limit
• Inputting the Stop or Limit in the corresponding column in Open Positions.
• Highlighting a position by clicking on it in a window and clicking Stop/Limit in the toolbar.

FXCM representatives are available 24 hours a day, seven days a week by phone, e-mail, or live chat to answer your questions.
Toll-free: 0808 234 8789 ● UK Telephone: +44 (0)207398 4050
E-mail: [email protected]
FAQ
Get fast answers to FAQs including how to make a withdrawal, how trades execute over the weekend, and much more! Visit the FXCM FAQs.
MyFXCM
MyFXCM is an online account management tool that lets you conveniently access and manage the administrative aspect of your account. Log in Now.
Contact FXCM