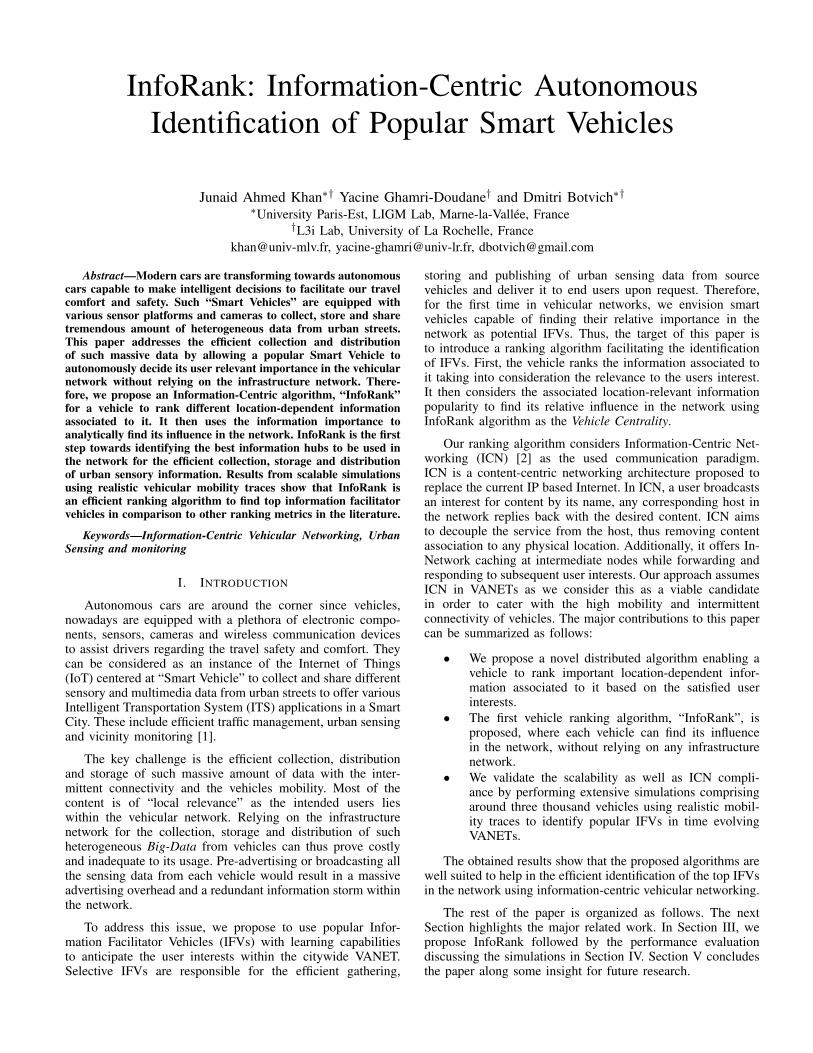
inforank: information-centric autonomous identification of
TRANSCRIPT

HAL Id: hal-01283729https://hal.archives-ouvertes.fr/hal-01283729
Submitted on 17 Mar 2016
HAL is a multi-disciplinary open accessarchive for the deposit and dissemination of sci-entific research documents, whether they are pub-lished or not. The documents may come fromteaching and research institutions in France orabroad, or from public or private research centers.
L’archive ouverte pluridisciplinaire HAL, estdestinée au dépôt et à la diffusion de documentsscientifiques de niveau recherche, publiés ou non,émanant des établissements d’enseignement et derecherche français ou étrangers, des laboratoirespublics ou privés.
InfoRank: Information-Centric AutonomousIdentification of Popular Smart Vehicles
Junaid Ahmed Khan, Yacine Ghamri-Doudane, Dmitri Botvich
To cite this version:Junaid Ahmed Khan, Yacine Ghamri-Doudane, Dmitri Botvich. InfoRank: Information-Centric Au-tonomous Identification of Popular Smart Vehicles. IEEE VTC Fall 2015, Sep 2015, Boston, MA,United States. pp.6, �10.1109/VTCFall.2015.7390985�. �hal-01283729�
InfoRank: Information-Centric AutonomousIdentification of Popular Smart Vehicles
Junaid Ahmed Khan∗† Yacine Ghamri-Doudane† and Dmitri Botvich∗†∗University Paris-Est, LIGM Lab, Marne-la-Vallee, France
†L3i Lab, University of La Rochelle, [email protected], [email protected], [email protected]
Abstract—Modern cars are transforming towards autonomouscars capable to make intelligent decisions to facilitate our travelcomfort and safety. Such “Smart Vehicles” are equipped withvarious sensor platforms and cameras to collect, store and sharetremendous amount of heterogeneous data from urban streets.This paper addresses the efficient collection and distributionof such massive data by allowing a popular Smart Vehicle toautonomously decide its user relevant importance in the vehicularnetwork without relying on the infrastructure network. There-fore, we propose an Information-Centric algorithm, “InfoRank”for a vehicle to rank different location-dependent informationassociated to it. It then uses the information importance toanalytically find its influence in the network. InfoRank is the firststep towards identifying the best information hubs to be used inthe network for the efficient collection, storage and distributionof urban sensory information. Results from scalable simulationsusing realistic vehicular mobility traces show that InfoRank isan efficient ranking algorithm to find top information facilitatorvehicles in comparison to other ranking metrics in the literature.
Keywords—Information-Centric Vehicular Networking, UrbanSensing and monitoring
I. INTRODUCTION
Autonomous cars are around the corner since vehicles,nowadays are equipped with a plethora of electronic compo-nents, sensors, cameras and wireless communication devicesto assist drivers regarding the travel safety and comfort. Theycan be considered as an instance of the Internet of Things(IoT) centered at “Smart Vehicle” to collect and share differentsensory and multimedia data from urban streets to offer variousIntelligent Transportation System (ITS) applications in a SmartCity. These include efficient traffic management, urban sensingand vicinity monitoring [1].
The key challenge is the efficient collection, distributionand storage of such massive amount of data with the inter-mittent connectivity and the vehicles mobility. Most of thecontent is of “local relevance” as the intended users lieswithin the vehicular network. Relying on the infrastructurenetwork for the collection, storage and distribution of suchheterogeneous Big-Data from vehicles can thus prove costlyand inadequate to its usage. Pre-advertising or broadcasting allthe sensing data from each vehicle would result in a massiveadvertising overhead and a redundant information storm withinthe network.
To address this issue, we propose to use popular Infor-mation Facilitator Vehicles (IFVs) with learning capabilitiesto anticipate the user interests within the citywide VANET.Selective IFVs are responsible for the efficient gathering,
storing and publishing of urban sensing data from sourcevehicles and deliver it to end users upon request. Therefore,for the first time in vehicular networks, we envision smartvehicles capable of finding their relative importance in thenetwork as potential IFVs. Thus, the target of this paper isto introduce a ranking algorithm facilitating the identificationof IFVs. First, the vehicle ranks the information associated toit taking into consideration the relevance to the users interest.It then considers the associated location-relevant informationpopularity to find its relative influence in the network usingInfoRank algorithm as the Vehicle Centrality.
Our ranking algorithm considers Information-Centric Net-working (ICN) [2] as the used communication paradigm.ICN is a content-centric networking architecture proposed toreplace the current IP based Internet. In ICN, a user broadcastsan interest for content by its name, any corresponding host inthe network replies back with the desired content. ICN aimsto decouple the service from the host, thus removing contentassociation to any physical location. Additionally, it offers In-Network caching at intermediate nodes while forwarding andresponding to subsequent user interests. Our approach assumesICN in VANETs as we consider this as a viable candidatein order to cater with the high mobility and intermittentconnectivity of vehicles. The major contributions to this papercan be summarized as follows:
• We propose a novel distributed algorithm enabling avehicle to rank important location-dependent infor-mation associated to it based on the satisfied userinterests.
• The first vehicle ranking algorithm, “InfoRank”, isproposed, where each vehicle can find its influencein the network, without relying on any infrastructurenetwork.
• We validate the scalability as well as ICN compli-ance by performing extensive simulations comprisingaround three thousand vehicles using realistic mobil-ity traces to identify popular IFVs in time evolvingVANETs.
The obtained results show that the proposed algorithms arewell suited to help in the efficient identification of the top IFVsin the network using information-centric vehicular networking.
The rest of the paper is organized as follows. The nextSection highlights the major related work. In Section III, wepropose InfoRank followed by the performance evaluationdiscussing the simulations in Section IV. Section V concludesthe paper along some insight for future research.

II. RELATED WORK
Urban Sensing and vicinity montioring using vehicles hasattracted lots of researchers in the past few years and severalschemes are proposed. One such scheme is Mobeyes [1] wheresensor-equipped vehicles monitor the surrounding and relayaggregated summaries to mobile agents. Similarly [3] proposeda compressive sensing based monitoring in a delay tolerantvehicular network. In [4], real time multimedia data fromurban streets is collected using vehicles. CarSpeak [5] allowsvehicle to collaborate and access sensory information capturedby neighboring vehicles in the same manner as it can access itsown. Recently, we observe a shift towards ICN in [6], [7] and[8] as the underlying routing protocol for Vehicular Networks.
Centrality measures such as Degree, Closeness, Between-ness and Eigenvector centrality are used to find importantnodes in the complex networks. Degree centrality considersthe number of direct (one hop) neighbors of a node. Closenesscentrality is the inverse of the sum of the lengths of theshortest paths from a node to the rest of the nodes in thenetwork. Betweenness centrality is the fraction of all pairsof shortest paths passing through a node, where Eigenvectorcentrality the node’s influence measure in the network [9].Typical applications include social networks to identify influ-ential information hubs for publishing/spreading information.Another interesting application is found in medical sciencesto find epidemic disease spreaders [10]. Similarly, Google’sPageRank [11] algorithm ranks the importance of a web-pagein an Internet search based on the number of directed linkstowards it. In Delay Tolerant Networks (DTNs), BubbleRap[12] is an example where nodes with high centrality score areused for data dissemination.
Unlike social networks and Internet, it is unfeasible to usecentrality-based popularity schemes in VANETs for multiplereasons; First, The rapid topological changes due to the highmobility of vehicles requires a continuous time varying analy-sis of the VANETs which is unfeasible by a practical scheme.Typical schemes assume a static graph topology with respect totime where the temporal network characteristics of VANETswould be ignored. Second, centrality measures such as Be-tweenness, Closeness and Eigenvector centrality computationrequires network wide parameters, while in VANETs a vehiclecannot have such information to make run-time decisions.Third, existing schemes consider shortest path metric to com-pute a node’s importance, while the highly dynamic VANETtopologies does not ensure the availability of a stable pathbetween nodes. Therefore, a new vehicle ranking algorithmadapted to VANETs and enabling vehicles to decide theirrelative importance in the network by overcoming the abovementioned constraints need to be thought about.
III. INFORANK: A FULLY DISTRIBUTED APPROACH
InfoRank is a centrality measure enabling each IFV toautonomously find its importance in the network independentof a centralized database. The rapid changes in the frequencyand duration of vehicle contacts cannot be used to decide itsimportance in the time evolving vehicular network. Though,the user’s interest satisfaction for content is considered as akey metric for a vehicle’s importance as it regularly respondsto user interests. Therefore, we introduce a new metric where
Figure 1: System Overview
each periodically finds its importance in the network withrespect to the user relevant information. Figure 1 shows thefinal targeted system using selected IFVs for data collection,storage and distribution within VANET. The name-based in-terest is issued by user, which is forwarded to the nearby IFVswithin VANET. The corresponding IFV replies with the desiredcontent using the underlying ICN architecture. The followingsection defines the network model enabling each vehicle tocompute its respective centrality.
A. Network Model
We consider a time varying VANET modeled as an undi-rected vehicular graph G(V(t),Ev(t)), where V(t) = {v} isa set of vertices v, each representing a vehicle on the road attime t. Ev(t) = {ejk(t) | vj , vk ∈ V, j 6= k} is the set of edgesejk(t) modeling the existence of a direct communication linkbetween vehicles j and k at time t. The number of edges Ev(t)depends on the transmission range of each vehicle. We assumeit as a simple unit disk model bounded by the communicationrange R. The city map is represented by the undirected graphG(X,Ex), the set of vertices X = {x} contains different urbanzones x and the set of edges Ex = {epq | xp, xq ∈ X, p 6= q}are their respective boundaries that connects different zonesthrough a road network.
Information Association: Information association is de-fined as a bipartite graph G(V,X,E), where V is the set thevertices v in the vehicular graph G(V(t),Ev(t)) and X isthe set of locations x in the city map G(X,Ex). The edgeE = {eij |vi ∈ V, xj ∈ X} associates each vehicle to a set ofregions Xv ⊂ X with respect to the user relevant content.
The associated information is classified by cluster-ing the regions using ICN hierarchical naming convention“/region/road-section/information-type”. Lane rules for roadsections are usually defined by the city municipality whileinformation type comprises different Intelligent ITS applica-tions (Safety warnings, Road congestion information, Info-tainment...) with varying content popularity and priority. Theregions are clustered using voronoi tessellation [13] where thevehicles concentrated in an zone closer to a point are associatedto the set of roads in a single voronoi region x ∈ G(X,Ex) asshown in Figure 1. For temporal VANET analysis, the time Tis divided into set of regular time-slots t = tk+1 − tk, whereeach vehicle finds its centrality at the time instant tk+1 basedon the known information in the current time-slot where tk isthe time instant at the beginning of the time-slot t.

The information distance d(x, xk) is the Euclidean normbetween the content location x and xk, the vehicles currentposition at time instant tk+1 where x, xk ∈ Xv . We assumeeach vehicle knows the map of the city, i.e. G(X,Ex). How-ever, it only knows information relevant to itself, i.e. scopeof the network information maintained in its cache. This isdue to each vehicle’s limited storage and coverage scope asit is unlikely for instance that it visited, and thus stored data,of all the traversable roads in the city. The content sourcecould be either the vehicle itself (data sensed) or anothervehicle for which it acted as an intermediate relay node. Wewill refer to content/information or location interchangeably inthe text since content (information related to safety or trafficcongestion) are associated to locations in the urban map.
B. Information Importance
Information importance measures the vehicle relevance tousers for a particular content. The interest-response frequencyis a vital factor to classify content’s importance. A vehicleholding popular content is considered as an important infor-mation hub in the network.
Definition 1: (Interest Satisfaction Frequency) We defineIvx(t) = rx(t)
Rxas the frequency of user interests satisfied in
the previous slot t, where rx(t) are the number of successfulresponds in the previous slot and Rx are the total successfulresponds for the content x ∈ Xv associated to the vehiclev ∈ V.
IFVs regularly updates each content importance value de-pending on the interest satisfaction frequency. We assume thateach IFV is capable to record the time and position each timeit responds as the content provider to a user interest. Interestfor each content specify the temporal scope of informationvalidity, For instance, road congestion information is onlyvalid during congestion. Therefore, in order to ensure theinformation importance is not substantially augmented after thedesired deadline, let tfx be the last successful respond time forthe content x and the average interest deadline as td = 1
n
∑ntx
associated with each content, where n are the total number ofinterests in the previous time-slot and tx is the deadline ofeach interest for content x.
Definition 2: (Information Timeliness) The information
timeliness τ(tk+1) =
{1
e−δtdtk+1 ≤ tfx + tdtk+1 > tfx + td
is the mea-
sure of the temporal information validity scope where δ is thetuning parameter depending on the application needs (E.g. 1hour for accident information validity).
If there are no active interests and the average interestvalidity time has passed, the information importance adapts anexponential delay since the information is of less importancein the network. However, τ is set to unity for content to bealways available in the network.
The corresponding content importance at the next timeinstant tk+1 is updated as follows:
Cvx(tk+1) = Cvx(tk) + τ(tk+1)Ivx(t)(1 + d(x, xk))
−λ
+svx(tk+1)(1)
The content importance depends on Cvx(tk) at the beginningof the time-slot (time instant tk). If it is not responded in the
previous slot, then Ivx(t) = 0 ensures the content importanceis not increased unnecessarily. Here 0 ≤ svx(tk+1) ≤ 1 is thepercentage of time the vehicle itself acted as the original sourcefor any content x. The term svx(tk+1) is updated regularly toensure the content relevant to vehicle retain its value in case thevehicle does not respond in the previous slot. The interest laterin time could finally route to the vehicle which maintains itsvalue as the original source for particular content. The tuningparameter λ decide the value with respect to the associatedcontent.
C. Vehicle Centrality
The vehicle considers its importance with respect to theassociated information in order to measure its influence inthe networks. Besides information importance in Equation 1,we also consider the overall coverage scope as an importantparameter to decide a vehicle importance in an urban environ-ment.
Definition 3: (Coverage Entropy) We define Hv =−∑∀x∈X
p(x) log p(x), as the coverage entropy of the vehicle
periodically computed with respect to the entire city map (i.evehicle associated sub-graph Xv ∈ G(X,Ex)). The probabilityp(x) is the visiting frequency to each region x ∈ X before theimportance computation time tk+1.
Assume the vehicle’s coverage in the map can be repre-sented as a set of mobility between regions. The vehicles Aand B coverage scope are bounded by the set of regions MA ={x3, x2, x2, x3, x5, x2} and MB = {x1, x2, x3, x5, x4, x1}.A visits the regions x2,x3 and x5 with probabilities 2
6 , 36and 1
6 , while B visits the regions x1,x2 x3,x4, and x5 withprobabilities 2
6 , 16 , 16 , 16 and 16 respectively. The corresponding
coverage entropy is calculated as:
HA = − 26 log
26 −
36 log
36 −
16 log
16 = 0.439,
HB = − 26 log
26 −
(16 log
16 ∗ 4
)= 0.639,
Vehicle A has a narrow coverage scope due to its limited geo-graphical coverage, while B has a wider geographical coveragewith respect to the urban map. Therefore, we consider coverageentropy as the coverage metric for the vehicle importance withrespect to all locations in the city.
Algorithm 1 shows the steps allowing a vehicle to find therespective InfoRank. For a given location-dependent content incache, the corresponding information importance is updated forthe next time-slot at time instant tk+1. The information-centriccentrality function is as follows:
fvI (tk+1) =(1 + Ivm(tk+1))
−ε
|Xv|∑x∈Xv
Cvx(tk+1).wx+Hv(tk+1)
(2)For all contents x ∈ Xv associated to v, Ivm(tk+1) are the ratioof missed interest to the total interests received by the vehiclewhile ε is the tuning parameter. Missed interest provides thevehicle reliability regarding successful respond to the incominginterests. Cvx(tk+1) is the respective content importance at timeinstant tk+1, wx = Rx
RTis the edge weight of information
association graph G(V,X,E) considering the interest satisfiedfor the content x among all the contents in cache. Rx is the

number of responds for x and RT is the number of respondsfor all contents in the cache. |Xv| is the cardinality of the sub-graph Xv ⊂ X, all regions associated to the vehicle v ∈ V.
The vehicle centrality at the time instant tk+1 is updated asthe Exponential Weighted Moving Average (EWMA) function:
Cv(tk+1) = (1− θ)Cv(tk) + θfvI (tk+1)
where θ is a tuning parameter to adjust the value for the pastcentrality score and the corresponding InfoRank in the currenttime-slot.
Algorithm 1 InfoRankINPUT: G(V,X,E) : information association graphOUTPUT: Updated InfoRank for the next time-slot at time-instant tk+1
for each vehicle v ∈ V dofor each content x ∈ Xv in cache do
Find d(x, xk), τ(tk+1), svx(tk+1), wx
Compute Ivx(t)←rx(t)Rx
if Ivx(t) 6= 0 thenUpdate Cvx(tk+1) using Equation 1
elseCvx(tk+1) = Cvx(tk) + svx(tk+1),
end ifend forFind missed interests ratio Ivm(tk+1), Coverage entropyHv(tk+1)Compute fvI (tk+1) using Equation 2
end forreturn Cv(tk+1)
IV. PERFORMANCE EVALUATION
One of the basic requirement for evaluating the effi-ciency of InfoRank is scalability. Therefore, we use NetworkSimulator-3 (NS-3)[14] as a scalable simulation platform forabout three thousand vehicles vehicles. The performance ofInfoRank is validated by a set of simulation runs under arealistic mobility scenario. We perform each simulation fivetimes by analyzing different set of nodes as informationproducers and consumers in order to compute 95% confidenceintervals. We rank the top information facilitators vehiclesin the network by comparing their InfoRank score with therespective Degree, Closeness, Betweenness and Eigenvectorcentrality score.
Moreover, we consider a realistic mobility traces fromCologne, Germany to evaluate our proposed algorithms. To thebest of our knowledge, it is considered as the most accuratemobility trace available for Vehicular Networks [15]. Startingfrom this trace, we regenerate a more easily usable versionof it considering an area of 6X6km2 for Cologne city centerfor 1-hour duration with a granularity of one second . Thesimulation parameters are summarized in Table I, followedby a description of the simulation scenarios used for theperformance evaluation.
A. Simulation Scenario
We use the ndnSIM [16] module available for NS-3 tointegrate Named Data Networking (NDN). The simulation
Table I: Simulation Parameters
Parameter ValueSimulation platform NS-3Number of nodes 2986Mobility trace Cologne, GermanyArea 6X6km2 city centerDuration 1 hourCommunication range 100mPacket size 1024 bytesTime granularity 1 secSimulation Runs 5
Table II: InfoRank in different set of Simulations
Simumation 1 2 3 4 5ID Score ID Score ID Score ID Score ID Score Mean
1 34 1 1013 1 59 1 1210 1 10 1 12 2414 0.9719 1051 0.9966 63 0.9984 113 0.9930 56 0.9957 0.99113 1239 0.9639 543 0.9958 108 0.9969 14 0.9923 1195 0.9838 0.98654 108 0.9612 442 0.9919 348 0.9967 2372 0.9883 127 0.9833 0.98435 517 0.9567 2366 0.9808 392 0.9958 184 0.9881 577 0.9801 0.98036 414 0.9557 318 0.9788 152 0.9917 157 0.9875 658 0.9754 0.97787 31 0.9516 2728 0.9770 48 0.9890 189 0.9834 5 0.9749 0.97528 571 0.9506 268 0.9738 26 0.9839 197 0.9808 54 0.9742 0.97279 502 0.9501 54 0.9735 37 0.9821 196 0.9803 1888 0.9718 0.971610 2174 0.9489 150 0.9729 137 0.9819 30 0.9789 192 0.9714 0.9708
scenario implements the following two applications:
Producer: Producer vehicle is the information source inthe network where the areas visited in a time-slot beforethe InfoRank computation time are considered as contentassociated with the producer.
Consumer: Consumer vehicles are the potential user nodesplanning to visit an area. Each consumer vehicle generatesan interest for a content associated to a location in the city,which is routed to producer vehicles using the underlying ICNarchitecture.
It is crucial to choose a suitable scenario for analyzingthe performance of InfoRank. For this reason, we considerurban sensing as our use case scenario as a special case oftypical VANET operation. The city map is divided into voronoizones/regions. The producers declare themselves as contentsource for the areas visited in the map. Consumers generateinterests for the content associated with the area. We assumethe interests follows a Zipf distribution, where interests forpopular contents are more frequent [17]. This results in ahigh interests probability for popular locations in the city. Thetuning parameters λ, δ and ε are set to 0.5 in order to regulatethe corresponding metrics. td is set to 1 hour considering anurban sensing validity scope.
B. Simulation Results
The objective of our simulation study is to find answersto the fundamental question: How well can it identify the topIFVs? InfoRank score for the top 10 IFVs from five simulationruns are shown in Table II. For each rank, the average scorelies within a confidence interval of 0.01 for a confidence levelof 95%. Simulation traces for the top 100 nodes are obtainedfrom five runs but here we show only the top ten nodes IDsand their score in each simulation for brevity. The centralityscore is normalized with respect to the top identified node,i.e. the top node with a unity score followed by the relativescore of other vehicles. We will use the same convention tointerpret results in the later sections. In the first simulation, thevehicle 34 is identified to have the top InfoRank score among

0
0.2
0.4
0.6
0.8
1
1.2
Node ID
Cen
trality
Sco
re
693
700
255
2275
354
182
744
267
234
210
543
170
221
140
2002
184
481
1720
1823
64
796
950
700
744
168
InfoRank
Degree
Closeness
Betweenness
Eigenvector
0
0.2
0.4
0.6
0.8
1
1.2
Node ID
Cen
trality
Sco
re
543
700
102
234
700
957
312
228
1567
312
182
278
430
1113
969
28
969
682
1999
278
685
267
796
408
110
InfoRank
Degree
Closeness
Betweenness
Eigenvector
0
0.2
0.4
0.6
0.8
1
1.2
Node ID
Cen
trality
Sco
re
957
461
1720
947
969
543
467
312
1695
152
182
969
950
408
461
28
152
162
241
467
685
312
940
1245
312
InfoRank
Degree
Closeness
Betweenness
Eigenvector
0
0.2
0.4
0.6
0.8
1
1.2
Node ID
Cen
trality
Sco
re
543
255
1117
1113
255
182
957
796
947
957
28
1932
152
140
152
685
1824
1824
241
1932
362
152
467
976
1824
InfoRank
Degree
Closeness
Betweenness
Eigenvector
Figure 3: Temporal snapshots after each 15 minutes comparing top identified nodes by each schemes
1st 2nd 3rd 4th 5th0
0.5
1
1.5
2
2.5
3
3.5
4
4.5
5
5.5x 10
5
Node Rank
Cu
mu
lati
ve
Sa
tis
fie
d I
nte
re
sts
InfoRank
Degree
Closeness
Betweenness
Eigenvector
Figure 2: Cumulative Satisfied Interests by top identified nodesusing each scheme over an average of five different simulationscenarios
the selected IFVs in the network as it satisfied the incominginterests more frequently throughout the simulation.
We consider the following performance metrics in compar-ison with the state of the art importance computation schemes( Degree, Closeness, Betweenness and Eigenvector centrality):
• Cumulative Satisfied Interests (CSI) for the top iden-tified nodes by each scheme
• Comparison of top nodes identified by each schemewith their respective centrality scores
• Average aggregated throughput of the identified topranked nodes by each scheme
• Cache hit rate for the top nodes by each schemeto evaluate InfoRank along ICN in VANET mobilityscenarios
1) Cumulative Satisfied Interests: Cumulative Satisfied In-terests refers to the total number of user interests satisfied afterone hour. Figure 2 shows the CSI score of the top five nodesidentified by all these schemes in an average of five set ofsimulations. Typical ranking schemes only takes into accountphysical topology towards computing a node importance inthe network, ignoring the satisfied user interests. Nevertheless,InfoRank satisfied more user interests than other schemes inall the five set of simulations due to the consideration ofuser interest satisfaction as a key factor towards a vehicleimportance in the network.
2) Temporal behavior analysis of top nodes: It is im-portant to efficiently analyze the time varying behavior of
our algorithm due to the dynamic VANET environment. Thetime varying behavior of the relative score of the top fivenodes identified by all schemes are shown by periodic networksnapshots after each 15 minutes interval in Figure 3. Weconsider the top node identified by each scheme as benchmarkby assigning it a unity score. At the beginning, vehicle 693 isranked as top IFVs by InfoRank, thought the other schemesunderrated it. Vehicles also change places along the rankingorder. For example, around 30 minutes, the node 543 replaced693 as the top IFV, then it is replaced by the node 975 around45 minutes and finally it regained the top position.
An interesting results was observed around 15 minutes:Only one node yields a high Eigenvector centrality score. Weinvestigate this effect and found that the principle eigenvalueyields the top node where the eigenvector is shifted towardsthe principle component. Thus, resulting in one major centralnode. This shows that the famous Eigenvector centrality failsto assign significant score to a large fraction of nodes in a largenetwork, while InfoRank do not reflect such behavior. Othercentrality schemes result in different set of top nodes at everysnapshot since such schemes only consider the instantaneousshortest paths requiring complete topological information.However, such complete network information is not availableto an individual vehicle in highly unstable VANETs. InfoRankis not affected by such network dynamics since we are able torank each vehicle considering relatively stable metrics.
3) Aggregated Per Node Throughput: We also evaluatethe ranking scheme by analyzing the throughput at importantnodes in the network. Figure 4 shows the aggregated per nodethroughput of the top nodes identified by each scheme. Theaverage aggregated throughput (Kbps) is computed over theentire simulation duration for five set of simulations. The topnodes identified by InfoRank yields more throughput comparedto other schemes. We observe that the throughput of the thirdnode is relatively higher, thus inferring a variation between dif-ferent ranks. Similar variation is seen for Degree, Betweennessand Eigenvector centrality. However, InfoRank outperformedall schemes as it incorporates information importance factortowards vehicle importance computation, while other schemesrely only on topological measures (node degree or shortestpaths) towards vehicle importance computation.
4) ICN Evaluation - In-Network Caching: We evaluate theICN built-in feature of In-Network caching at the intermediatenodes by computing the cache hit rate at the top nodesidentified by each scheme as shown in Figure 5. A secondsuccessful response by a node for the same content is consid-

1st 2nd 3rd 4th 5th0
20
40
60
80
100
120
140
160
Node Rank
Ag
gre
gate
d T
hro
ug
hp
ut
(Kb
ps)
InfoRank
Degree
Closeness
Betweenness
Eigenvector
Figure 4: Average aggregated throughput by the top identifiednodes using each scheme in five simulations
1st 2nd 3rd 4th 5th0
10
20
30
40
50
60
70
80
Node Rank
Avera
ge C
ach
e H
its (
Perc
en
tag
e)
InfoRank
Degree
Closeness
Betweenness
Eigenvector
Figure 5: Average cumulative cache hit rate by the top identi-fied nodes using each scheme in five simulations
ered a cache hit. The cumulative cache hit rate is computedfor the entire simulation duration for five set of simulations.The top nodes identified by InfoRank yield a higher hit ratethan all the other schemes in all the five simulations. Thisis because InfoRank considers information importance as akey factor, thus, the vehicle containing important informationresponds and subsequently cache more frequently compared toother vehicles. This proves that In-Network caching offered byICN in InfoRank implementation overcomes the mobility andintermittent connectivity constraints in VANETs for efficientcontent access.
Responding to the question posed before, How well canit identify the top IFVs? From the simulation results, It isclear that a relatively stable set of top IFVs are identified byInfoRank compared to the other schemes in dynamic VANETs.It is also shown that InfoRank can identify nodes whichsatisfied more user interests with higher aggregated per nodethroughput and more cache hit rate compared to the otherschemes. Thus, the overall comparative analysis of InfoRankwith different network ranking schemes in the literature provedit as an efficient vehicle ranking algorithm.
V. CONCLUSIONS AND FUTURE DIRECTIONS
We introduced the first vehicle ranking algorithm “In-foRank”, enabling popular Smart vehicles to rank themselvesin a fully distributed VANET. InfoRank first ranks importantlocation-dependent information based on the user interestssatisfaction frequency. We then employed InfoRank using
content-centric networking architecture supporting in-networkcaching to cater high mobility and intermittent connectivity inVANETs. Extensive simulations were performed using realisticmobility traces to evaluate the efficiency of the proposedalgorithm and a time varying network behavior is analyzed.Results by comparing with state of the art centrality schemesrevealed that InfoRank is best suited to efficiently identifyimportant information facilitator vehicles in VANETs.
Identification of top IFV can be helpful in different smartcity applications such as urban sensing mentioned in the paper.Popular IFVs can be used for efficient data collection, storageand distribution in VANETs. Designing such efficient schemeswill be the subject of our future research.
ACKNOWLEDGMENT
This work is funded by the French Ministry of Industryunder the CarCoDe (ITEA2 11037) project.
REFERENCES
[1] U. Lee, B. Zhou, M. Gerla, E. Magistretti, P. Bellavista, and A. Corradi,“Mobeyes: smart mobs for urban monitoring with a vehicular sensornetwork,” Wireless Communications, IEEE, vol. 13, no. 5, pp. 52–57,2006.
[2] B. Ahlgren, C. Dannewitz, C. Imbrenda, D. Kutscher, and B. Ohlman, “Asurvey of information-centric networking,” Communications Magazine,IEEE, vol. 50, no. 7, pp. 26–36, 2012.
[3] H. Wang, Y. Zhu, and Q. Zhang, “Compressive sensing based monitor-ing with vehicular networks,” in INFOCOM, 2013 Proceedings IEEE.IEEE, 2013, pp. 2823–2831.
[4] R. Bruno and M. Nurchis, “Efficient data collection in multimediavehicular sensing platforms,” Pervasive and Mobile Computing, 2014.
[5] S. Kumar, L. Shi, N. Ahmed, S. Gil, D. Katabi, and D. Rus, “Carspeak:a content-centric network for autonomous driving,” ACM SIGCOMMComputer Communication Review, vol. 42, no. 4, pp. 259–270, 2012.
[6] P. Talebifard and V. Leung, “Towards a content-centric approach tocrowd-sensing in vehicular clouds,” Journal of Systems Architecture,vol. 59, no. 10, pp. 976–984, 2013.
[7] M. Amadeo, C. Campolo, A. Molinaro, and G. Ruggeri, “Content-centricwireless networking: A survey,” Computer Networks, vol. 72, pp. 1–13,2014.
[8] M. Gerla, E.-K. Lee, G. Pau, and U. Lee, “Internet of vehicles: Fromintelligent grid to autonomous cars and vehicular clouds,” in Internetof Things (WF-IoT), 2014 IEEE World Forum on. IEEE, 2014, pp.241–246.
[9] S. P. Borgatti, “Centrality and network flow,” Social networks, vol. 27,no. 1, pp. 55–71, 2005.
[10] M. Kitsak, L. K. Gallos, S. Havlin, F. Liljeros, L. Muchnik, H. E. Stanley,and H. A. Makse, “Identification of influential spreaders in complexnetworks,” Nature Physics, vol. 6, no. 11, pp. 888–893, 2010.
[11] L. Page, S. Brin, R. Motwani, and T. Winograd, “The pagerank citationranking: Bringing order to the web.” 1999.
[12] P. Hui, J. Crowcroft, and E. Yoneki, “Bubble rap: Social-based forward-ing in delay-tolerant networks,” Mobile Computing, IEEE Transactionson, vol. 10, no. 11, pp. 1576–1589, 2011.
[13] A. Okabe, B. Boots, K. Sugihara, and S. N. Chiu, Spatial tessellations:concepts and applications of Voronoi diagrams. John Wiley & Sons,2009, vol. 501.
[14] “Network simulator 3 - http://www.nsnam.org.”[15] S. Uppoor, O. Trullols-Cruces, M. Fiore, and J. M. Barcelo-Ordinas,
“Generation and analysis of a large-scale urban vehicular mobilitydataset,” Mobile Computing, IEEE Transactions on, vol. 13, no. 5, pp.1061–1075, 2014.
[16] A. Afanasyev, I. Moiseenko, and L. Zhang, “ndnSIM: NDN simulatorfor NS-3,” NDN, Technical Report NDN-0005, October 2012. [Online].Available: http://named-data.net/techreports.html
[17] L. Breslau, P. Cao, L. Fan, G. Phillips, and S. Shenker, “Web caching andzipf-like distributions: Evidence and implications,” in INFOCOM’99.Eighteenth Annual Joint Conference of the IEEE Computer and Com-munications Societies. Proceedings. IEEE, vol. 1. IEEE, 1999, pp.126–134.