informal sectorcosit.gov.iq/documents/population/demographic/reports/unesco-eu lms... · the...
TRANSCRIPT

BAKERY PRODUCTS
textile fibres
ceramic productsMEAT
MEALS
Assessment of the Labour Market & Skills Analysis Iraq and Kurdistan Region-Iraq
Informal Sector


Assessment of the Labour Market & Skills Analysis Iraq and Kurdistan Region-Iraq
Informal Sector
Published by:
United Nations Educational, Scientific and Cultural Organization7. place of Fotenoy, 75352 Paris 07 SP, France
United Nations Educational, Scientific and Cultural Organization, Office for IraqUN Compound, International Zone, Baghdad, Iraq
Education Sector
E-mail: [email protected]
UNESCO 2019
All rights reserved
Designed by: Alaa Al Khayat

UNESCO and Sustainable Development Goals
UNESCO actively helped to frame the Education 2030 agenda which is encapsulated in UNESCO’s work and Sustainable Development Goal 4. The Incheon Declaration, adopted at the World Education Forum in Korea in May 2015, entrusted UNESCO to lead and coordinate the Education 2030 agenda through guidance and technical support to governments and partners on how to turn commitments into action.

This report is the result of the strong and collaborative relationship between the Government of Iraq and Kurdistan Region-Iraq (KR-I), European Union, and UNESCO. The report was drafted by David Chang, Rory Robertshaw and Alison Schmidt under the guidance of Dr. Hamid K. Ahmed, Louise Haxthausen and the Steering Committee Members of the TVET Reform Programme for Iraq and KR-I. The Central Statistical Organization (CSO) and the Kurdistan Regional Statistics Office (KRSO) provided valuable feedback and contributions to which the design and implementation of the survey was made possible.
Acknowledgements


ContentsExecutive Summary 12
Chapter 1: Introduction to the Sector Skills Analysis Project 14
1.1 Global expectations of TVET 141.2 Context of the project 151.3 Scope of the project 16
1.3.1 Focus on selected economic sectors 161.3.2 Focus on a sample of governorates 171.3.3 Focus on TVET skills providers 18
1.4 Methodologies of the project 191.4.1 Methodology overview 191.4.2 Desk-based research methodology 201.4.3 Mapping the supply and demand systems 201.4.6 Skills supply methodology 221.4.7 Enterprise Survey methodology 24
Chapter 2: Introduction to the context for skills development 33
2.1 Overview of the economic sectors in Iraq and KR-I 332.2 Overview of the demographics and the labour market in Iraq and KR-I 35
2.2.1 Public sector employment 362.2.2 Women in employment 372.2.3 Foreign workers in employment 372.2.4 Youth unemployment in Iraq 38
2.3 Overview of the skills supply in Iraq and KR-I 392.3.1 Planning for TVET 392.3.2 Financing TVET 402.3.3 Demand for TVET 412.3.4 Employment of graduates 422.3.5 Relationships between TVET providers and employers 422.3.6 Provision of vocational preparatory education by MoE 432.3.7 Provision of technical education by MoHESR 442.3.8 Provision of vocational training by MoLSA 452.3.9 Provision of technical and vocational training by other ministries 46
Chapter 3: The informal sector in Iraq and KR-I 48
3.1 Key statistics and overview of the sector 483.2 Composition of the sector 49
3.2.1 Youth 513.2.2 Women 513.2.3 Refugees 513.2.4 Internally displaced people (IDP) 52

3.3 Types of informal sector enterprises 523.3.1 Domestic industries 523.3.2 Street vendors 543.3.3 Casual labour 543.3.4 Family farms 553.3.5 Informal business/self-employment 55
3.4 Factors impacting on the growth and development of the sector 553.4.1 Political and economic factors 553.4.2 Social factors 583.4.3 Technological factors 593.4.4 Environmental factors 593.4.5 Legal factors 59
Chapter 4: Skills supply to the informal sector 60
4.1 MoLSA training and microfinance 604.2 Other entrepreneurship training 614.3 NGO training courses for refugees 624.4 Informal apprenticeship 62
Chapter 5: Demand for skills in the informal sector 63
5.1 Outcomes of the Informal Sector Council meeting 635.1.1 Challenges of the informal sector 635.1.2 Opportunities identified by the Informal Sector Council 655.1.3 Presentations by members of the Informal Sector Council 665.1.4 Goals of the Informal Sector Council 67
Chapter 6: Recommendations for skills development in the informal sector 69
6.1 General observations 696.2 Skills supply in relation to demand 69
Appendix 72
Table of FiguresFigure 1: TVET Reform Programme for Iraq and KR-I is aligned with global thinking about TVET 15Figure 2: Relationship between the Sector Skills Analysis (SSA) Project and other elements of the TVET Reform Programme 15Figure 3: Map of governorates of Iraq and KR-I showing those selected for the Enterprise Survey 18Figure 4: Structure of TVET provision 18Figure 5: Overview of the Sector Skills Analysis (SSA) Project 20Figure 6: Sample frame for the Enterprise Survey 24Figure 7: Enterprise Survey population and sample frames & target and sample sizes 25Figure 8: Enterprise Survey lines of enquiry 27Figure 9: Contribution to Iraqi GDP (non-oil economic sectors), 2014 33Figure 10: Oil GDP, non-oil GDP and oil prices, 2009-2015 34Figure 11: Selected sectorial GDP, 2009-2015 34Figure 12: Formal employment in Iraq by economic sector and worker profile, 2014 36Figure 13: Youth unemployment rates for the Middle East, OECD and world, 2007-2017 38Figure 14: Vocational education average cohort size by specialisation in Iraq, 2015-2017 43Figure 15: Vocational education average cohort size by specialisation in KR-I, 2015-2016 44Figure 16: MoLSA Iraq vocational training average cohort size by specialisation, 2013-2015 45Figure 17: MoLSA KR-I vocational training average cohort size by specialisation, 2014-2016 46Figure 18: Informal sector employment in MENA countries, 2012 50Figure 19: Informal sector employment in MENA countries by rural and urban areas, 2012 50Figure 20: Informal sector participation by age group in MENA countries, 2012 50Figure 21: Informal sector participation by level of education in MENA countries, 2012 51Figure 22: Activity of street vendors in Iraq and KR-I, 2015 54Figure 23: Selection of major constraints affecting formal sector enterprises, 2011 56Figure 24: Access to banking services in the formal sector, 2011 57Figure 25: MoLSA enrolment for work-readiness, home industries, entrepreneurship and self-employment in Iraq and KR-I (estimated 2013-2016) 61

Table of TablesTable 1: Selected economic sectors and subsectors 17Table 2: Enterprise Survey lines of enquiry 28Table 3: Key demographic and labour market statistics 35Table 4: Total enrolment in Iraq technical universities, 2014-2015 44Table 5: Total enrolment in KR-I polytechnic universities, 2013-2016 44Table 6: Key statistics of the informal sector 48Table 7: Percentage of total sales and revenues of different household industries in Iraq (excluding KR-I), 2012 53Table 8: Number of employees and percentage of female employees of different household industries (excluding KR-I), 2012 53

12
Executive Summary
Anbar
Babylon
Baghdad
Basrah
Diyala
Kerbala
Kirkuk
Erbil
Missan
Muthanna
Najaf
Ninewa
Qadissiya
Salah al-Din
Thi-Qar
Wasit
Dahuk
Sulaymaniyah
TVET Reform Programme for Iraq and KR-I
This is one of a series of reports on selected key economic sectors in Iraq and Kurdistan Region-Iraq (KR-I), prepared by UNESCO under the auspices of the European Union funded TVET Reform Programme, in partnership with the government of Iraq and KR-I. The purpose of the reports is to inform decision makers and education and training providers about issues of supply and demand in priority sectors. Research and data collection activities were implemented in 2017 and the reports were completed in 2018.
Desk-based research on the sector was based on publicly available documents and statistics; and on documents and submissions provided by the relevant ministries, agencies and organisations. Research on the supply of skills to the sector relied on data submissions from the Ministry of Education (MoE), Ministry of Labour and Social Affairs (MoLSA), Ministry of Higher Education and Scientific Research (MoHESR). Every effort was made to mitigate issues of the completeness, quality and currency of the data available.
Qualitative data for this report were collected during interviews with ministry officials and professional body representatives; and during two days of discussions with eight pilot sector councils constituted to provide public and private sector perspectives on the challenges and opportunities of the sector. A survey of firms in each sector (excluding the informal sector) was implemented in eight governorates through the Central Statistical Organization (CSO) and the Kurdistan Regional Statistics Office (KRSO).
Informal sector
The informal sector is the biggest employer in Iraq, providing jobs and livelihood for millions of people. Almost all private sector workers work in the informal sector.
In this report the informal sector includes all those who work without formal contracts, outside of government regulation and taxes. It includes workers who are hired without formal contracts by formal registered business and public organisations; as well as a wide range of unregistered small businesses such as household (domestic) industries and street vendors; self-employed and free-lance workers; casual, seasonal and day labourers, temporary and part time workers; smugglers and black-market dealers and people who work without wages in family businesses.
13
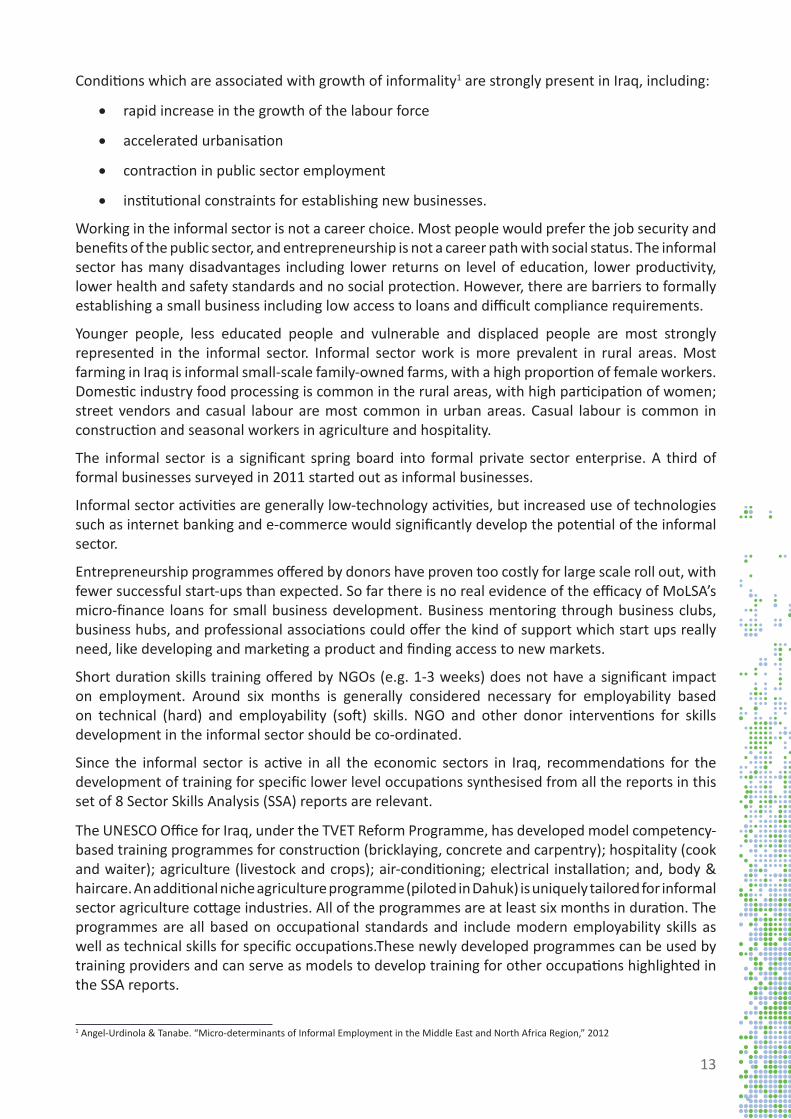
Conditions which are associated with growth of informality1 are strongly present in Iraq, including:
• rapid increase in the growth of the labour force
• accelerated urbanisation
• contraction in public sector employment
• institutional constraints for establishing new businesses.
Working in the informal sector is not a career choice. Most people would prefer the job security and benefits of the public sector, and entrepreneurship is not a career path with social status. The informal sector has many disadvantages including lower returns on level of education, lower productivity, lower health and safety standards and no social protection. However, there are barriers to formally establishing a small business including low access to loans and difficult compliance requirements.
Younger people, less educated people and vulnerable and displaced people are most strongly represented in the informal sector. Informal sector work is more prevalent in rural areas. Most farming in Iraq is informal small-scale family-owned farms, with a high proportion of female workers. Domestic industry food processing is common in the rural areas, with high participation of women; street vendors and casual labour are most common in urban areas. Casual labour is common in construction and seasonal workers in agriculture and hospitality.
The informal sector is a significant spring board into formal private sector enterprise. A third of formal businesses surveyed in 2011 started out as informal businesses.
Informal sector activities are generally low-technology activities, but increased use of technologies such as internet banking and e-commerce would significantly develop the potential of the informal sector.
Entrepreneurship programmes offered by donors have proven too costly for large scale roll out, with fewer successful start-ups than expected. So far there is no real evidence of the efficacy of MoLSA’s micro-finance loans for small business development. Business mentoring through business clubs, business hubs, and professional associations could offer the kind of support which start ups really need, like developing and marketing a product and finding access to new markets.
Short duration skills training offered by NGOs (e.g. 1-3 weeks) does not have a significant impact on employment. Around six months is generally considered necessary for employability based on technical (hard) and employability (soft) skills. NGO and other donor interventions for skills development in the informal sector should be co-ordinated.
Since the informal sector is active in all the economic sectors in Iraq, recommendations for the development of training for specific lower level occupations synthesised from all the reports in this set of 8 Sector Skills Analysis (SSA) reports are relevant.
The UNESCO Office for Iraq, under the TVET Reform Programme, has developed model competency-based training programmes for construction (bricklaying, concrete and carpentry); hospitality (cook and waiter); agriculture (livestock and crops); air-conditioning; electrical installation; and, body & haircare. An additional niche agriculture programme (piloted in Dahuk) is uniquely tailored for informal sector agriculture cottage industries. All of the programmes are at least six months in duration. The programmes are all based on occupational standards and include modern employability skills as well as technical skills for specific occupations.These newly developed programmes can be used by training providers and can serve as models to develop training for other occupations highlighted in the SSA reports.
1 Angel-Urdinola & Tanabe. “Micro-determinants of Informal Employment in the Middle East and North Africa Region,” 2012
14
Chapter 1: Introduction to the Sector Skills Analysis Project
This report on the informal sector is one of a series of eight reports on the seven economic sectors and informal sector in Iraq and Kurdistan Region-Iraq (KR-I). The series consists of:
• Report on the Agriculture, Forestry and Fishing sector in Iraq and KR-I
• Report on the Manufacturing sector in Iraq and KR-I
• Report on the Construction sector in Iraq and KR-I
• Report on the Wholesale and Retail and Repair of Motor Vehicles sector in Iraq and KR-I
• Report on the Transport and Storage sector in Iraq and KR-I
• Report on the Accommodation and Food Services (Hospitality) sector in Iraq and KR-I
• Report on the Information and Communication sector in Iraq and KR-I
• Report on the Informal sector in Iraq and KR-I
These reports are the culmination of a series of primary and secondary research activities implemented in 2017.
The Sector Skills Analysis (SSA) Project2 is a component of the Technical and vocational education and training (TVET) Reform Programme, funded by the European Union and in partnership with the government of Iraq and KR-I. The twin aims of the SSA project are (I) to inform education policy and priorities at secondary and tertiary levels, especially curriculum development for TVET and the development of training and opportunities for unskilled and/or unemployed people (with emphasis on women and youth) to enter the labour market and participate in formal and informal economic activity and (ii) to build the capacity of stakeholders to survey businesses and analyse employer demand in order to determine the best use of funding and target relevant TVET provision to better meet the demand of the labour market.
1.1 Global expectations of TVET
TVET is widely understood to be key to achieving a range of sustainable development goals including alleviation of poverty by empowering people to work and create jobs for others; increasing productivity and economic growth; promoting social equity, stability and peace; and increasing awareness of environmental issues and promoting green practices. TVET is regarded as pivotal to the achievement of inclusive, equitable and sustainable economic growth of industry and business, youth employability and enhanced social well-being. A TVET system has potential to influence work practices in the long term by emphasising occupational and professional standards, through developing skills and knowledge for sustainable work practices, and by introducing new technologies.
A TVET system capable of achieving these aspirations should be demand-driven by the current and projected needs of the labour market and by identified social and economic development opportunities for the future, so that it is relevant to the needs of employers and the opportunities of the formal and informal sectors.
2 The full title of the project is “Labour Market Assessment and Sector Skills Analysis. In this document, the short name “Sector Skills Analysis” is used to refer to all parts of the project, including assessment of the labour market
15
It needs to be accessible to all social groups (including urban and rural and marginalised segments of the population) and include a range of components to ensure that graduates (especially youth) are equipped with work-ready skills.
1.2 Context of the project
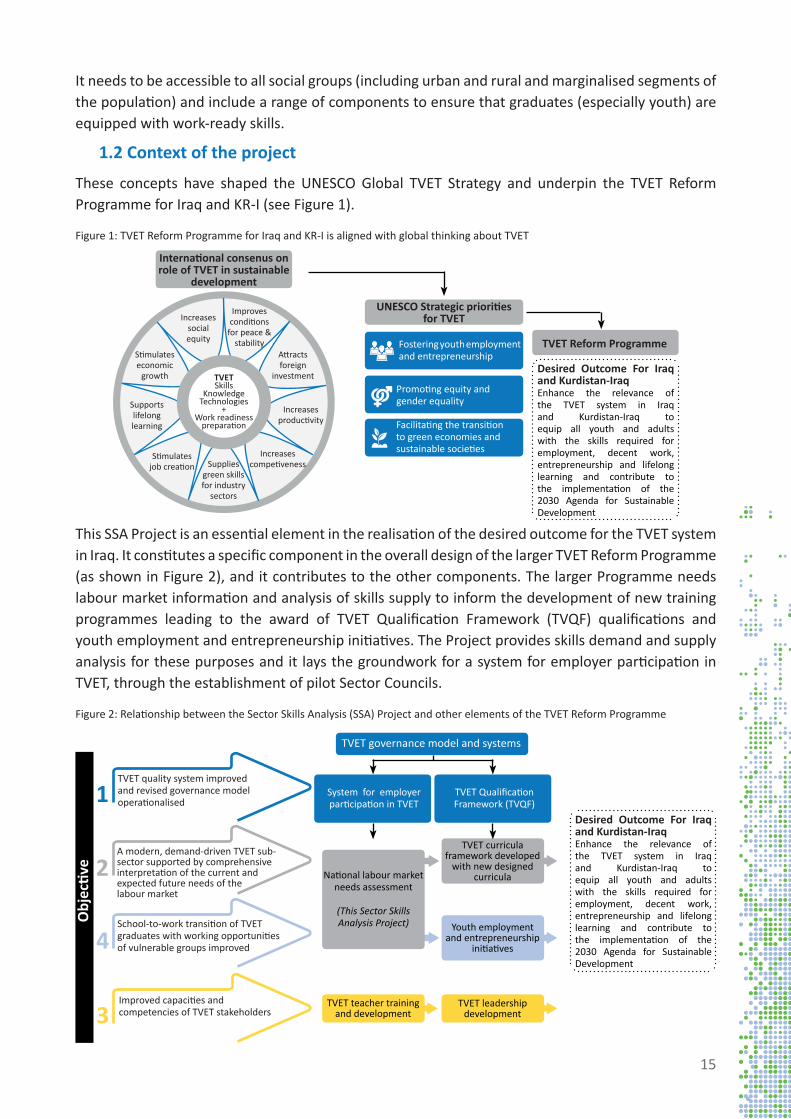
These concepts have shaped the UNESCO Global TVET Strategy and underpin the TVET Reform Programme for Iraq and KR-I (see Figure 1).
Figure 1: TVET Reform Programme for Iraq and KR-I is aligned with global thinking about TVET
This SSA Project is an essential element in the realisation of the desired outcome for the TVET system in Iraq. It constitutes a specific component in the overall design of the larger TVET Reform Programme (as shown in Figure 2), and it contributes to the other components. The larger Programme needs labour market information and analysis of skills supply to inform the development of new training programmes leading to the award of TVET Qualification Framework (TVQF) qualifications and youth employment and entrepreneurship initiatives. The Project provides skills demand and supply analysis for these purposes and it lays the groundwork for a system for employer participation in TVET, through the establishment of pilot Sector Councils.
Figure 2: Relationship between the Sector Skills Analysis (SSA) Project and other elements of the TVET Reform Programme
Improves conditions
for peace & stability
Increases social equity
Stimulates economic
growth
Attracts foreign
investment
Supports lifelong learning
Increases productivity
Stimulates job creation
Increases competivenessSupplies
green skills for industry
sectors
TVETSkills
Knowledge Technologies
+ Work readiness
preparation
International consenus on role of TVET in sustainable
development
UNESCO Strategic priorities for TVET
TVET Reform ProgrammeFostering youth employment and entrepreneurship
Promoting equity and gender equality
Facilitating the transition to green economies and sustainable societies
Desired Outcome For Iraq and Kurdistan-IraqEnhance the relevance of the TVET system in Iraq and Kurdistan-Iraq to equip all youth and adults with the skills required for employment, decent work, entrepreneurship and lifelong learning and contribute to the implementation of the 2030 Agenda for Sustainable Development
TVET quality system improved and revised governance model operationalised
A modern, demand-driven TVET sub-sector supported by comprehensive interpretation of the current and expected future needs of the labour market
School-to-work transition of TVET graduates with working opportunities of vulnerable groups improved
Improved capacities and competencies of TVET stakeholders
1
2
4
3
TVET governance model and systems
System for employer participation in TVET
TVET Qualification Framework (TVQF)
TVET leadership development
National labour market needs assessment
(This Sector Skills Analysis Project) Youth employment
and entrepreneurship initiatives
TVET curricula framework developed
with new designed curricula
TVET teacher training and development
Obj
ectiv
e
Desired Outcome For Iraq and Kurdistan-IraqEnhance the relevance of the TVET system in Iraq and Kurdistan-Iraq to equip all youth and adults with the skills required for employment, decent work, entrepreneurship and lifelong learning and contribute to the implementation of the 2030 Agenda for Sustainable Development

16
1.3 Scope of the project
There are no established systems in Iraq and KR-I for monitoring changes in the demand for labour and ascertaining employers’ changing requirements for human capital, and there are no systematic arrangements for responding to emerging skills needs by adapting curricula, developing qualifications or designing learning provision to meet those needs. Information on labour market trends and skills needs is scarce, and any existing information is the result of ad-hoc initiatives of national and international institutions. As a result, the mix of occupational training offered, and the number of students enrolled in each occupation have little relationship with the needs of the labour market.
Assessing the needs of the labour market requires synthesis and analysis of information about the dynamic relationship between the labour market, the economy and the education and training system. The Project synthesises information about these three systems by collating data from the past (existing data and identified trends), from the present (actual current situation and needs of employers) and about the potential future (planned and untapped potential development). It includes desk review of existing data and past trends, qualitative and quantitative data from the present situation (Enterprise Survey, interviews and structured pilot Sector Council meetings) and projected and planned future development (national and sectoral strategic plans, Enterprise Survey and pilot Sector Council meetings).
1.3.1 Focus on selected economic sectors
The Project focuses on seven ISIC3 economic sectors and the informal sector. The seven economic sectors selected for the focus of the Project are shown in Table 1.
The selection criteria for the economic sectors, which were determined in consultation with the Programme Steering Committee, the Inter-Ministerial Working Group (IMWG), the Central Statistical Organization (CSO) and the Kurdistan Regional Statistics Office (KRSO), were as follows:
• Minimum of 6 sectors relevant to both Iraq and KR-I
• Sectors considered to be drivers for inclusive, equitable and sustainable economic growth in Iraq and KR-I
• Sectors conducive to fostering youth employment, decent jobs and entrepreneurship
• Sectors that can support the reconstruction of the country and transition to green economies and environmental sustainability
• Sectors with potential for leveraging employment opportunities and business development in other sectors
• Include primary, secondary and tertiary sectors of the economy
• Take into consideration growth potential in terms of GDP, employment and exports, and changing technology
• Capable of using and applying the results and insights from a sectoral skills analysis (i.e. the sector is relatively well organised).
3 International Standard Industrial Classification of All Economic Activities

17
Table 1: Selected economic sectors and subsectors
Section Sector Selected subsectors of interest based on consultation and desk-review
A Agriculture, Forestry and Fishing
01 - Crop and animal production, hunting and related service activities03 - Fishing and aquaculture
C Manufacturing
10 - Manufacture of food products
11 - Manufacture of beverages
19 - Manufacture of coke and refined petroleum products
20 - Manufacture of chemicals and chemical products
21 - Manufacture of basic pharmaceutical products and pharmaceutical preparations
22 - Manufacture of rubber and plastics products
23 - Manufacture of other non-metallic mineral products
24 - Manufacture of basic metals
25 - Manufacture of fabricated metal products, except machinery and equipment
26 - Manufacture of computer, electronic and optical products
27 - Manufacture of electrical equipment
28 - Manufacture of machinery and equipment32 - Other manufacturing
F Construction41 - Construction of buildings
42 - Civil engineering43 - Specialised construction activities
G
Wholesale and Retail Trade, Repair of Motor Vehicles and Motorcycles
45 - Wholesale and retail trade and repair of motor vehicles and motorcycles
H Transport and Storage 49 - Land transport and transport via pipelines
52 - Warehousing and support activities for transportation53 - Postal and courier activities
I Accommodation and Food Services
55 - Accommodation56 - Food and beverage service activities
J Information and Communication
61 - Telecommunications
62 - Computer programming, consultancy and related activities63 - Information service activities
1.3.2 Focus on a sample of governorates
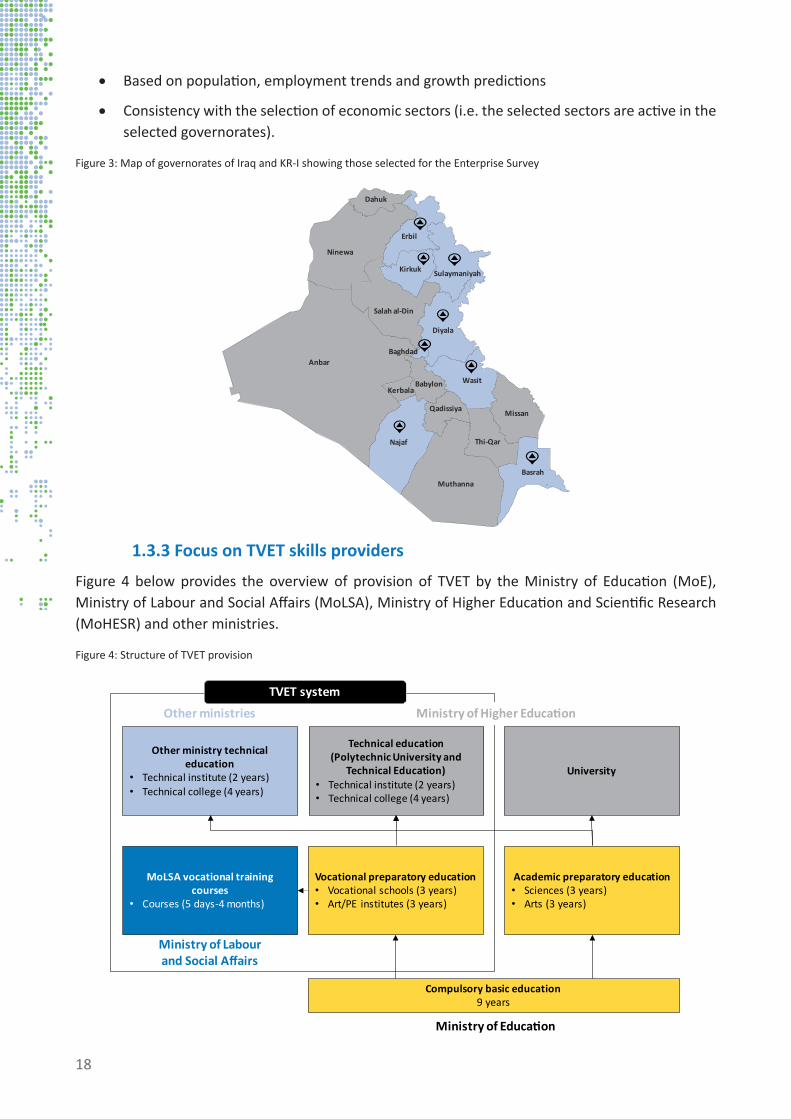
The scope of the Enterprise Survey included a sample of firms from each of the 7 economic sectors from 8 governorates, as shown in Figure 3 (survey was not conducted for the informal sector).
The selection criteria of the governorates for the Survey were as follows:
• Have at least 5 governorates in Central and Southern Iraq (CSI) and 2 governorates in KR-I to represent the whole country
• Urban and rural economic areas
18
• Based on population, employment trends and growth predictions
• Consistency with the selection of economic sectors (i.e. the selected sectors are active in the selected governorates).
Figure 3: Map of governorates of Iraq and KR-I showing those selected for the Enterprise Survey
1.3.3 Focus on TVET skills providers
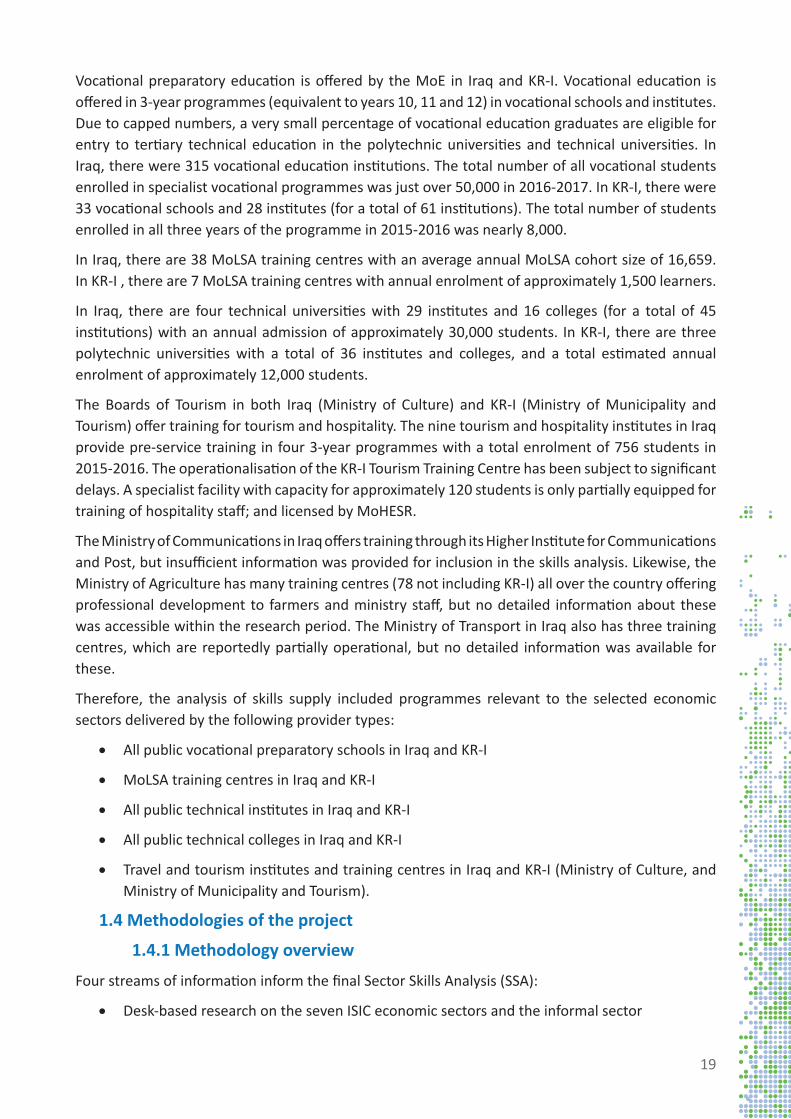
Figure 4 below provides the overview of provision of TVET by the Ministry of Education (MoE), Ministry of Labour and Social Affairs (MoLSA), Ministry of Higher Education and Scientific Research (MoHESR) and other ministries.
Figure 4: Structure of TVET provision
Anbar
Babylon
Baghdad
Basrah
Diyala
Kerbala
Kirkuk
Erbil
Missan
Muthanna
Najaf
Ninewa
Qadissiya
Salah al-Din
Thi-Qar
Wasit
Dahuk
Sulaymaniyah
Other ministry technical education
• Technical institute (2 years)• Technical college (4 years)
Technical education(Polytechnic University and
Technical Education)• Technical institute (2 years)• Technical college (4 years)
Vocational preparatory education• Vocational schools (3 years)• Art/PE institutes (3 years)
MoLSA vocational training courses
• Courses (5 days-4 months)
Academic preparatory education• Sciences (3 years)• Arts (3 years)
Compulsory basic education9 years
University
TVET system
Other ministries
Ministry of Education
Ministry of Higher Education
Ministry of Labour and Social Affairs
19
Vocational preparatory education is offered by the MoE in Iraq and KR-I. Vocational education is offered in 3-year programmes (equivalent to years 10, 11 and 12) in vocational schools and institutes. Due to capped numbers, a very small percentage of vocational education graduates are eligible for entry to tertiary technical education in the polytechnic universities and technical universities. In Iraq, there were 315 vocational education institutions. The total number of all vocational students enrolled in specialist vocational programmes was just over 50,000 in 2016-2017. In KR-I, there were 33 vocational schools and 28 institutes (for a total of 61 institutions). The total number of students enrolled in all three years of the programme in 2015-2016 was nearly 8,000.
In Iraq, there are 38 MoLSA training centres with an average annual MoLSA cohort size of 16,659. In KR-I , there are 7 MoLSA training centres with annual enrolment of approximately 1,500 learners.
In Iraq, there are four technical universities with 29 institutes and 16 colleges (for a total of 45 institutions) with an annual admission of approximately 30,000 students. In KR-I, there are three polytechnic universities with a total of 36 institutes and colleges, and a total estimated annual enrolment of approximately 12,000 students.
The Boards of Tourism in both Iraq (Ministry of Culture) and KR-I (Ministry of Municipality and Tourism) offer training for tourism and hospitality. The nine tourism and hospitality institutes in Iraq provide pre-service training in four 3-year programmes with a total enrolment of 756 students in 2015-2016. The operationalisation of the KR-I Tourism Training Centre has been subject to significant delays. A specialist facility with capacity for approximately 120 students is only partially equipped for training of hospitality staff; and licensed by MoHESR.
The Ministry of Communications in Iraq offers training through its Higher Institute for Communications and Post, but insufficient information was provided for inclusion in the skills analysis. Likewise, the Ministry of Agriculture has many training centres (78 not including KR-I) all over the country offering professional development to farmers and ministry staff, but no detailed information about these was accessible within the research period. The Ministry of Transport in Iraq also has three training centres, which are reportedly partially operational, but no detailed information was available for these.
Therefore, the analysis of skills supply included programmes relevant to the selected economic sectors delivered by the following provider types:
• All public vocational preparatory schools in Iraq and KR-I
• MoLSA training centres in Iraq and KR-I
• All public technical institutes in Iraq and KR-I
• All public technical colleges in Iraq and KR-I
• Travel and tourism institutes and training centres in Iraq and KR-I (Ministry of Culture, and Ministry of Municipality and Tourism).
1.4 Methodologies of the project
1.4.1 Methodology overview
Four streams of information inform the final Sector Skills Analysis (SSA):
• Desk-based research on the seven ISIC economic sectors and the informal sector
20
• Synthesis and augmentation of the desk-based research by the eight pilot Sector Councils
• Analysis of skills supply
• Results of the Enterprise Survey (not conducted for the informal sector).
The sources of primary data for the analysis include (i) the Enterprise Survey, (ii) 32 interviews with ministries and leading private sector organisations, and (iii) eight pilot Sector Council meetings. The secondary data sources for the background research included existing documents (strategies, plans, reviews, policies, laws), and international and national websites and data sets.
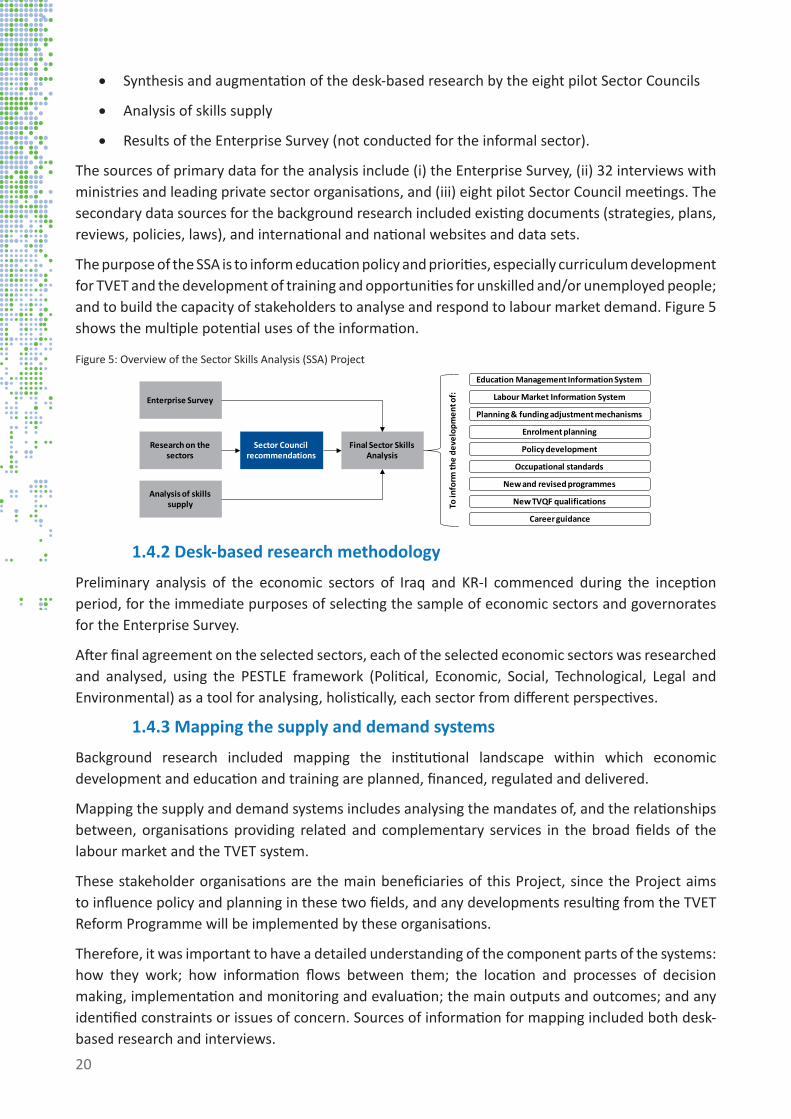
The purpose of the SSA is to inform education policy and priorities, especially curriculum development for TVET and the development of training and opportunities for unskilled and/or unemployed people; and to build the capacity of stakeholders to analyse and respond to labour market demand. Figure 5 shows the multiple potential uses of the information.
Figure 5: Overview of the Sector Skills Analysis (SSA) Project
1.4.2 Desk-based research methodology
Preliminary analysis of the economic sectors of Iraq and KR-I commenced during the inception period, for the immediate purposes of selecting the sample of economic sectors and governorates for the Enterprise Survey.
After final agreement on the selected sectors, each of the selected economic sectors was researched and analysed, using the PESTLE framework (Political, Economic, Social, Technological, Legal and Environmental) as a tool for analysing, holistically, each sector from different perspectives.
1.4.3 Mapping the supply and demand systems
Background research included mapping the institutional landscape within which economic development and education and training are planned, financed, regulated and delivered.
Mapping the supply and demand systems includes analysing the mandates of, and the relationships between, organisations providing related and complementary services in the broad fields of the labour market and the TVET system.
These stakeholder organisations are the main beneficiaries of this Project, since the Project aims to influence policy and planning in these two fields, and any developments resulting from the TVET Reform Programme will be implemented by these organisations.
Therefore, it was important to have a detailed understanding of the component parts of the systems: how they work; how information flows between them; the location and processes of decision making, implementation and monitoring and evaluation; the main outputs and outcomes; and any identified constraints or issues of concern. Sources of information for mapping included both desk-based research and interviews.
Enterprise Survey
Research on the sectors
Analysis of skills supply
Sector Council recommendations
Final Sector Skills Analysis
To in
form
the
deve
lopm
ent o
f:
Education Management Information System
Labour Market Information System
Planning & funding adjustment mechanisms
Enrolment planning
Policy development
Occupational standards
New and revised programmes
New TVQF qualifications
Career guidance
21
1.4.4 Interview methodology
The ministries relevant to all the selected economic sectors in Iraq and KR-I were involved in the research through participation in interviews, submission of documents, and participation in the pilot Sector Council workshops. The other main public sector participants included MoLSA, MoHESR, and MoE.
32 interviews were conducted in Baghdad and Erbil between January and February 2017 and some additional interviews were conducted in Erbil in April 2017. In some cases, formal data requests were sent to the interview participants in advance, and in some cases written requests followed the interviews. The format of the interviews varied according to the availability of participants and prior access to relevant information. In most cases interviews took between 1 and 2 hours.
1.4.5 Sector Council methodology
Both the Enterprise Survey and the pilot Sector Council meetings are mechanisms for collecting information about employer demand and increasing employer participation in TVET. The qualitative data collected from the pilot Sector Councils complements the quantitative data collected in the Enterprise Survey.
Eight pilot Sector Councils were established to represent the public and private leadership of each of the selected seven economic sectors and the informal sector. Private sector representatives included the Chamber of Commerce and Industry and relevant professional federations, unions and associations.
The rationale for including an Informal Sector Council includes these considerations:
• The Enterprise Survey of employers includes mainly formal sector businesses
• Skills development should acknowledge the skills needed for informal economic development opportunities and transition to the formal sector
• The informal sector includes traditional forms of informal skills training such as informal apprenticeships which can be further developed
• Women and vulnerable groups like unemployed youth, displaced people and refugees work in the informal sector
• Entrepreneurship initiatives often start on a small scale in the informal sector
• Green skills and sustainable development practices need to penetrate all of society and all workplaces
• The informal sector employs a substantial proportion of the population.
Sector representative bodies are a necessary element of a demand-led TVET system. The system can only be ‘demand-led’ if the sectors have organised leadership that is well informed and able to advise on the skills needed by the sector.
Formal establishment of permanent Sector Councils will take time as the concept needs to be widely discussed and agreed upon, and policy and legislative implications need to be considered. Thus, for the purposes of this project, ‘pilot’ Sector Councils were constituted to act as ‘think tanks’ for the sector; to provide a forum for strategic discussion about sector growth and development; to identify challenges and opportunities; and to develop goals to address challenges and exploit the opportunities and achieve its goals.
22
The eight pilot Sector Councils met between April and July 2017, and played an important role in validating, augmenting and interpreting the findings of the desk-based research; and providing explanations and illustrative stories behind the statistical information presented.
Each two-day workshop (with slight variation for the Informal Sector) consisted of a structured series of progressive small group activities to explore the issues of the sector and identify the prioritised skills needs. Five worksheets were designed to guide the deliberations of the small groups and capture brief written responses from the small group activities. The structured activities were as follows:
• Activity 1: Define 3-4 main challenges that impact the growth and development of the sector (a problem statement)
• Activity 2: Identify new opportunities and untapped potential to be explored
• Activity 3: Formulate goal statements to address the challenges and/or seize the identified opportunities for the sector
• Activity 4: Identify occupations needed for the sector to address challenges, seize opportunities and achieve goals
• Activity 5: What should the training for the identified occupation look like?
Analysis of the written and verbal outputs of each meeting triangulated what the participants wrote down, what they presented and responded in small groups, and any other response or critique of the participants.
1.4.6 Skills supply methodology
The data supplied by MoE, MoHESR and MoLSA, and data accessed from CSO, have significant weaknesses in terms of sufficiency and adequacy for estimating the supply of skills to each economic sector in this study.
The minimum information required for a results-oriented evaluation of a TVET system generally includes enrolment by level and programme, retention, progression, completion, success, graduation and employment rates of graduates. Ideally, this information would be routinely collected by all providers and uploaded to a central TVET Management Information System (MIS). However, in Iraq, routine, standardised, continuously updated and centrally managed TVET data collection does not routinely occur, nor is there any systematic use of skills supply data to inform enrolment planning.
Weakness in the data available for estimating the skills supply included:
• The data obtained from various sources was a mix of enrolment numbers and graduate numbers. It included these variations for each specialisation and programme:
o Enrolment in each year of a three-year programme.
o New enrolment in the first stage of a programme each year for a 3-4-year period.
o New enrolment for two years (2014 and 2016) over a 3-year period.
o Graduates over a period of three years.
• In some cases, two spreadsheets provided at the same time, by the same organisation, were contradictory in some respects (e.g. different totals), which raised more questions than answers

23
• Spreadsheets provided by ministries included adding and formula errors (e.g. vertical summation contradicted horizontal summation). Tables provided in Word format were especially prone to this kind of error
• In some cases, much data processing effort has been devoted to inputs (e.g. number of workshops held, number of teaching and training staff, and other matters which are of exclusive interest to supply management) or issues of low significance, with little or no attention given to investigating outcomes and issues relevant to the labour market
• There appears to be no indicators or benchmarks to guide (i) what units of analysis and data are required to evaluate the quality and effectiveness of skills supply and (ii) how to recognise data which are causes for concern or require further analysis, and which data are within an agreed normal range, and do not require further analysis.
Because of the limitations of the data, it was decided that both average student cohort size and average graduate cohort size by specialisation will be used as proxies for skills supply. This means that the estimation of skills supply can only be regarded as a rough guide.
Generally, student cohort size is larger than graduate cohort size, because some students do not graduate (i.e., they fail and/or drop out). There is not enough information available to estimate a drop out-rate to apply to student cohorts at all levels. The only reported drop-out rate (5% reported by CSO in 2015) is for vocational (school) education. Longer programmes at non-compulsory levels generally have much higher drop-out rates than short or compulsory school programmes. With no scientific basis for estimating drop out and failure rates, no adjustments could be made to the average cohort size to allow for failure and drop out.
It is possible that an overestimated proxy for supply (average cohort size) is somewhat balanced out by (i) the absence of any data in this study for NGO training (mainly for refugees and IDPs) or private providers (very few), and (ii) the exclusion of informal apprenticeship training, which is unrecorded but may be substantial, especially in fields like construction. This is, of course, an assumption without any evidence.
Calculating average cohort size is valid when enrolment seems steady (when the difference from one year to another is negligible), but not when there is a significant difference. A dramatic difference suggests either (i) a new or discontinued programme or (ii) some kind of external shock, such as temporary closure of a specialist institution due to the ISIL/Da’esh incursion. In the few cases where averaging does not seem to give a correct reflection of the skills supply, this is noted in the Chapter 4 tables by an asterisk (*).
In some parts of Iraq, colleges and institutes have closed. This appears to have inflated enrolment in other colleges and institutions (with big differences between 2014-2015 and 2015-2016 cohorts). Information provided by the MoHESR was incomplete for 2015-2016. In many cases, only one enrolment figure is available. Therefore, for all Technical Foundation University programmes, the ‘cohort size’ is the last known enrolment (see Chapter 4 tables, noted by an asterisk*).
As can be seen from the discussion above, at best the figures provided in this report for skills supply are indicative. However, since there has been no previous study on this scale to quantify the supply of skills to the specific sectors of the economy, this assessment can provide a benchmark estimation based on the best evidence available. For the first time in this study the unit of analysis is not the institution or the governorate which supplies the skills, but the economic sector which demands the skills.

24
1.4.7 Enterprise Survey methodology
The survey was carried out so that it can inform reforms to the TVET system i.e. to make it more demand driven. In view of this, firms were surveyed (excluding for the informal sector) regarding the number and kind of employees at present, with consideration of labour requirements for the future. The goal of the survey was to enable a view into the future skill needs of Iraq’s economy so that relevant capacity could be built to fulfil such needs, in terms of offering the relevant TVET training programmes at TVET institutions.
Sample design
The sample was chosen from the CSO (Central Statistical Organization) Business Register. Established in 2009, the Register contains all firms in Iraq found during a census survey, numbering 490,080 across the 18 governorates of Iraq and KR-I. It is developed at the establishment level, meaning that all units of a firm (the headquarters as well as all subsidiaries) are identified within the Register (‘population frame’). This is presented in Appendix 1.
The sample taken aimed to assess the needs of firms, with 10 or more employees, within the 8 selected governorates. From the Register (‘population frame’) there are 5,091 such firms (‘sample frame’) in total, which can be seen below in Figure 6. A complete breakdown of the sample frame can be found in Appendix 2.
Figure 6: Sample frame for the Enterprise Survey
The Register was stratified by both 27 subsectors (across the seven ISIC selected economic sectors) and the 8 selected governorates. A simple random sampling method (each firm equally likely to be selected) was used for each of the 216 strata (27x8) with the goal of minimizing the margin of errors within each stratum. The result was a target sample size of 4,432 firms of which 2,010 were surveyed (‘actual sample size’). More details on the sample sizes are provided in Figure 7 and in the following sections.
Anbar
Babylon
Baghdad(1,961)
Basrah(518)
Diyala(295)
Kerbala
Kirkuk(312)
Erbil(620)
Missan
Muthanna
Najaf(361)
Ninewa
Qadissiya
Salah al-Din
Thi-Qar
Wasit(265)
Dahuk
Sulaymaniyah(759)
25
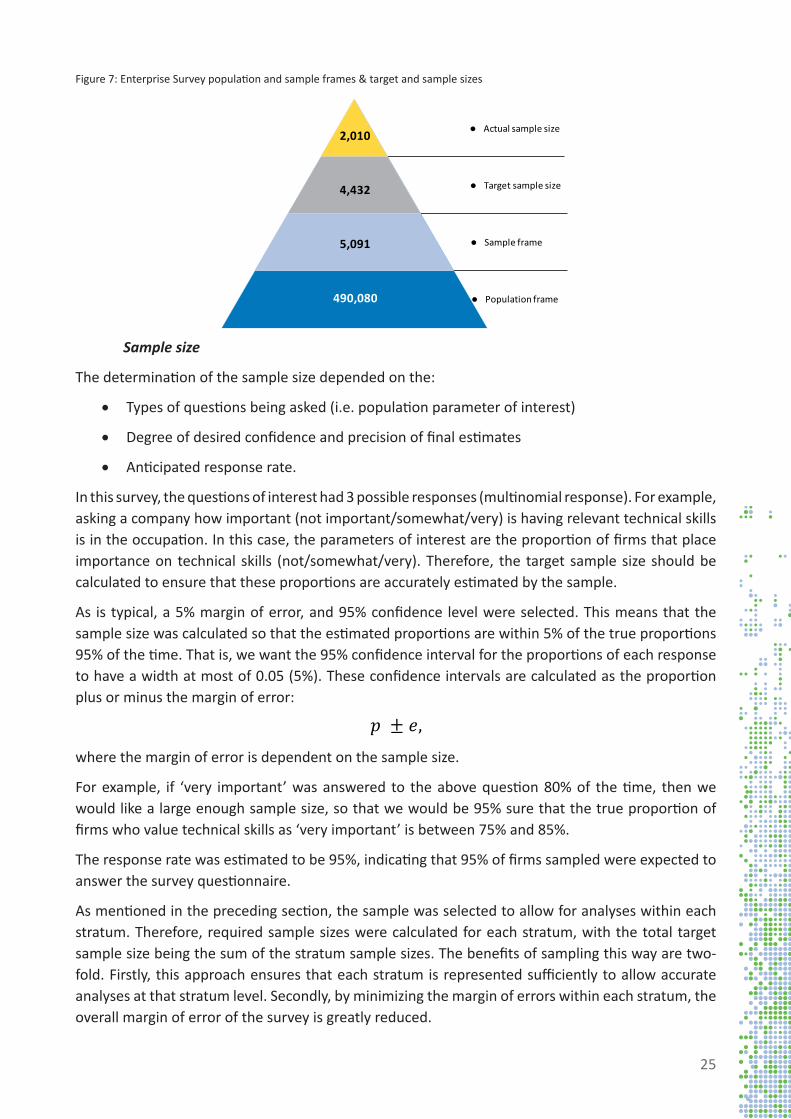
Figure 7: Enterprise Survey population and sample frames & target and sample sizes
Sample size
The determination of the sample size depended on the:
• Types of questions being asked (i.e. population parameter of interest)
• Degree of desired confidence and precision of final estimates
• Anticipated response rate.
In this survey, the questions of interest had 3 possible responses (multinomial response). For example, asking a company how important (not important/somewhat/very) is having relevant technical skills is in the occupation. In this case, the parameters of interest are the proportion of firms that place importance on technical skills (not/somewhat/very). Therefore, the target sample size should be calculated to ensure that these proportions are accurately estimated by the sample.
As is typical, a 5% margin of error, and 95% confidence level were selected. This means that the sample size was calculated so that the estimated proportions are within 5% of the true proportions 95% of the time. That is, we want the 95% confidence interval for the proportions of each response to have a width at most of 0.05 (5%). These confidence intervals are calculated as the proportion plus or minus the margin of error:
where the margin of error is dependent on the sample size.
For example, if ‘very important’ was answered to the above question 80% of the time, then we would like a large enough sample size, so that we would be 95% sure that the true proportion of firms who value technical skills as ‘very important’ is between 75% and 85%.
The response rate was estimated to be 95%, indicating that 95% of firms sampled were expected to answer the survey questionnaire.
As mentioned in the preceding section, the sample was selected to allow for analyses within each stratum. Therefore, required sample sizes were calculated for each stratum, with the total target sample size being the sum of the stratum sample sizes. The benefits of sampling this way are two-fold. Firstly, this approach ensures that each stratum is represented sufficiently to allow accurate analyses at that stratum level. Secondly, by minimizing the margin of errors within each stratum, the overall margin of error of the survey is greatly reduced.
490,080
5,091
4,432
2,010 Actual sample size
Target sample size
Sample frame
Population frame
𝑝 ± 𝑒,

26
For example, for the telecommunication firms in Baghdad, there are = 120 firms in the Register of size 10 or more employees. To find the sample size required for a margin of error of 5% ( = 0.05) with a 95% confidence level ( =1.96) and 5% non-response rate ( =0.05) we need only to determine a value of to use in the above formula. Often, previous surveys or pilot data are used to determine an approximate value for . Since no pilot data exists for a survey of this kind, we want to use a value of that will result in a conservative value of . In this case, in the formula above is largest when =0.5. Therefore, we use =0.5 to ensure that the value of will be sufficiently large to estimate any true value of .Inserting all these values into the above formula gives a stratum sample size of =97. A similar calculation was done for all 216 strata. The result was a total target sample size of 4,432 to ensure the 5% margin of error for each stratum. The complete breakdown of the target sample size can be found in Appendix 3.
In the above formula, the calculated target sample size applies to estimating the proportion of a single response to a question, i.e., the possible responses are treated as binary for the purpose of calculation (the single response/not). For example, if we are interested in the needed sample size to estimate the proportion of firms who answered ‘very important’ to the ‘technical skills’ question, then for the purpose of the calculation, the possible responses are treated as ‘very important’ and ‘any other response’. As mentioned above, the case that requires the largest sample size is when the proportion of firms answering ‘very important’ is 50% ( = 0.5). Therefore, = 0.5 is used in the above formula to determine the sample size needed to accurately estimate the proportion of firms answering ‘very important’. To determine the sample size needed to estimate the ‘somewhat important’ and ‘not important’ categories an analogous approach is taken. Since we use = 0.5 in all 3 cases, we get the same result from the above formula. This means that the same value for is sufficient to estimate each of the 3 proportions accurately.
Since in the above we set each of the 3 proportions to be 50% ( = 0.5) for the purpose of the calculations, we are ignoring the fact that the 3 proportions must sum to 100%. That is, we are treating the 3 proportions as independent when in reality they depend on each other. Ignoring this dependency is not of concern as the calculation leads to having a sufficient sample to ensure each question is answered to within the specified margin of error independently of one another.
Based on the above assumptions, the sample size within each strata was calculated as:
Where:
: the required sample size in stratum
: the proportion of firms that select a particular response within a given question
: the value (z-score) associated with a 95% confidence level ( = 1.96)
: the margin of error
: the number of firms in the CSO Business Register in stratum
: the anticipated non-response rate
𝑵𝒉𝒆
𝒛 𝑵𝑹𝒑
𝒑
𝒑𝒑
𝒑𝒑 𝒏𝒉𝒏𝒉
𝒏𝒉
𝒏𝒉
𝒑𝒑
𝒑𝒏𝒉
𝒑
=2 1 −
e2 +2 1 −
11 −
ℎ
ℎ
𝒆
𝑵𝒉
𝑵𝑹
𝒛

27
Alternative methods that properly account for this dependence, such as those in Thompson (1987)4, can be used to estimate the sample size. For reference, using this approach the total sample size for the stratum margin of errors to be 5% is 4,457. For this survey, the calculated total size of 4,432 (as outlined above) was used for the sample size as it is sufficient to ensure each question is answered to within the 5% margin of error within each stratum.
As discussed below, these sample sizes proved to be challenging to obtain, and in some strata replacement methods were required which still allowed for the analyses undertaken to find significant results. In total, 2,010 firms with 10 or more employees were surveyed (see Appendix 4 for breakdown). The fact that the Register has not been updated since 2009 makes it possible that these 2,010 firms represent a greater proportion of the population.
Design of the questionnaire
The survey explored information about the employers’ current workforce and workforce management practices. In particular, it collected information about current and future employment opportunities; about occupations in employment; about the skills of current and prospective employees, and the hiring and service training practices of the firms (as illustrated in Figure 8).
Figure 8: Enterprise Survey lines of enquiry
4 Thompson, S. “Sample Size for Estimating Multinomial Proportions,” February 1987
Survey of skills needed in the Sector
What influences employers’ hiring
decisions?
Which training providers are
centres of excellence?
What are the drivers of change?
What is the profile of the workforce?
Which strategies are essential for
business success?
What weaknesses
do employers identify in
applicants?
How satisfied are employers with
training?
What in-service training do
employers offer?
Which occupations are
employed in the Sector?
What are the current and future
skills needs?

28
Implementation of the survey
The Register is typically updated annually for medium (11-29 employees) and large (30+ employees) firms. However, given recent turmoil in Iraq with the dual crisis of decreased oil prices and the ISIL/Da’esh conflict, the Register has only been updated for large firms in the manufacturing sector since 2009. As a result, all other sectors in the Register were out of date, and many of the firms listed had ceased operations. Therefore, many of the initial firms randomly selected to be surveyed were no longer operational and replacement firms were identified by CSO regional offices. These replacements were selected from the same stratum in such a way as to ensure similar characteristics to the no longer operational firms.
In some strata, the CSO regional office could not identify a sufficient number of firms with 10 or more employees. In these cases, the threshold was lowered, first to 7 or more, and in some cases to 5 or more employees. This replacement was done in an attempt to maintain as closely as possible the original sample size, and stratum allocation.
Despite this replacement strategy, the final actual sample taken contains 2,010 firms with 10 or more employees, and an additional 643 firms with 5-9 employees (totalling 2,653). Since the original sample was chosen from the firms of 10 or more employees, the primary analyses focus on this group only. This allows for the most accurate representation of the target population, and most accurate calculation of the sample weights.
Although not included in the primary analysis, the 643 firms of size 5-9 have been analysed as an independent subset as to make best use of the data. These analyses are presented in Chapter 5.
Survey quality assessment
A subsample of the firms were interviewed and audit analysis was done to ensure that interviews had been completed. Information was also collected from interviewed firms selected for the monitoring exercise to evaluate the quality of the interviews and the understanding of the objectives of the survey and its usefulness. The proportion of firms to be interviewed was targeted at 10%.
As noted in Table 2 below, calls were made to a total of 583 of the total records reaching 448 which corresponds to a sample size of 18% of the total. Of the 448 contacted, 400 of the firms surveyed (89% of the sample) verified that interaction between a CSO/KRSO surveyor and a company representative took place.
Table 2: Enterprise Survey lines of enquiry
Iraq KR-I TotalTotal firms surveyed 1,787 866 2,653
Total calls made 412 171 583Contact made 295 153 448
% Contacted 16.5% 17.7% 16.9%Verified 260 140 400
% Verified 88% 92% 89%Inconclusive survey respondents 34 14 48

29
Definition of Terms
• Contact made: All respondents that were reached by phone. This group does not include wrong numbers where an individual was reached, or calls where a person was reached but language precluded identification.
• Verified: All respondents that were reached by phone and with whom an interview by a CSO or KRSO surveyor was determined to have been made.
• Inconclusive: All respondents that were reached by phone but whose participation in the survey could not be verified.
As one would expect, the time spent on the survey varied between interviewers. Using time spent on individual survey interviews as a primary indicator of whether a valid survey was performed, the results show that more than 70% of respondents indicated that the interviewer spent at least 30 minutes doing the interview. This 30-minute benchmark was applied as the minimum time required based on the training conducted for both CSO and KRSO.
As a part of the planned monitoring process, field personnel were instructed to submit reports. However, some of the field personnel did not respect the reporting schedule. In some cases, information was not transmitted until the end of the survey collection period, eliminating the possibility of corrections and feedback to weaker interviewers.
While the results support the conclusion that the survey activity was completed successfully, based on the information provided by respondents, there are indications that the quality of survey results varied from interviewer to interviewer. Some surveys did not meet the benchmark minimum time needed, and interviewers may not have effectively communicated with the company representatives. This is further supported by the responses from several respondents indicating that they did not understand the reason for the survey.
Analysis of the data
From the initially planned sample of 4,432 firms, 2,010 (45.4%) completed the entire survey questionnaire. Although this response rate is lower than hoped, the fact that the Register has not been updated since 2009 makes the true population size difficult to estimate. Therefore, it is possible that these 2,010 firms represent a greater proportion of the population.
Margin of error. The non-response rate and degree of replacement varied by governorate and subsector. Therefore, the margin of errors within the strata can be expected to vary. For example, in the manufacture of food products subsector in Baghdad, the calculated sample size (based on 5% non-response rate) for a margin of error of 5% was to try sample 144 of the 211 total firms in this stratum. In the actual sample, only 81 were obtained (56.2%). Therefore the true non-response rate for this stratum was 44%. We use the following formula to compute the margin of error in each of these situations:
where is the margin of error, = 1.96 (for a 95% confidence level), =0.5 is the assumed proportion of a specific answer (as in the ‘Sample size’ section above), is the sample size, and is the population sample size.
In the above example, if we sample the full 144, the margin of error is 4.6%. If the non-response rate was 5% (as originally assumed) then the sample size is 137 and the margin of error is 5%. Finally, if the sample size is 81 (actual), then the non-response rate is 43.8% and the margin of error is 8.5%.
𝑒 =𝑧 𝑝 1 − 𝑝�
𝑛�1 −
𝑛𝑁
�
𝒆 𝒛𝒑𝑛
𝑁

30
The differences in the above margin of errors result in differences in the width of the confidence intervals for the survey estimates. Specifically, holding everything else fixed, the confidence intervals will be (in this case) 8.5%/5% = 1.7 times wider. For example, if 20% ( =0.2) of firms answered ‘very important’ to technical skills question then in the above example with a sample size of 137 the 95% confidence interval would be [16%, 24%]. With the increased non-response rate (and therefore a higher margin of error) the confidence interval would be [13%, 27%].
Most results are available at the subsector and governorate level, however, given the small number of firms in some strata, it is important to verify the response rate for these strata before presenting the results. In all governorates, there was no responses to the survey in two subsectors (32 – Other manufacturing and 62 – Computer programming, consultancy and related activities). The target sample size was small in each of these two subsectors, which helps explain the no response rate. These subsectors are not included in the results.
In the firms that did respond, missing data was not a problem, and therefore imputation methods were not required.
Weighting. In a given sample, it is preferred that it represents the true population with respect to all variables under consideration in the survey. For example, if the sample contained 60% males in telecommunication firms and the true population contains 70% for a given stratum, population inferences can therefore only be made by appropriate weighting.
Sample weights for each stratum were calculated based on the Register. The strata weights were based on the inverse probability of selection for a given company in that stratum. That is, the weights were calculated as:
where is the number of firms in the Register of size greater than 10 for stratum and is the size of the sample of firms of size greater than 10 drawn from stratum .
As non-response may cause some groups to be over- or under-represented, these weights were further adjusted to obtain final strata weights of:
where is the number of respondents in stratum .
For example, according to the Register, in Baghdad, there are 120 telecommunication firms of at least 10 employees of which 97 were selected to be sampled. Of these 97, 23 responded and were interviewed for the survey. Therefore, the weight for this stratum was calculated as:
Across all strata the average sample weight was 2.96.
𝑊ℎ = 𝑊ℎ∗ ×𝑛ℎ𝑛ℎ𝑟
ℎ𝑛ℎ𝑟
12097
×9723
= 5.22
𝒑
𝑊ℎ∗ = 𝑁ℎ 𝑛ℎ⁄
ℎℎ
𝒏𝒉𝑵𝒉

31
The above weights are based on the Register from 2009 and are therefore subject to bias if the true population has changed significantly since then. Given this potential problem, the survey data is analysed both with and without weighting and the primary report includes only the unweighted data, as this is deemed less likely to introduce significant bias. As a result, inferencing is limited because of cases where, for example, there could be a high range of variation in responses and reliable conclusions cannot be drawn. Some cases include:
• Cross strata (e.g. technical workers are paid more in Governorate A than Governorate B)
• Aggregation across strata (e.g. how important are technical skills in the construction sector? That is, aggregation across all the construction subsectors).
For the firms of size 5-9, sample weights should be used with extreme care as the population strata sizes in the Register are quite large, and the sample sizes are quite small. Using sampling weights as outlined above could lead to situations in which 1-2 sampled firms are weighted to represent 100 or more firms in that stratum. Given these concerns, weights are not computed for the size 5-9 firms and only unweighted data is displayed.
Limitations and potential bias. There are several limitations in the interpretation of the survey results, many of which are a result of the lack of up to date population of firms to draw the sample from.
As previously mentioned, the Register was last updated in 2009 for small- and medium-sized and non-manufacturing large firms. Given the change in economic and societal conditions in Iraq during this time, it is unlikely that the Register provides an accurate representation of the population of firms in the 8 selected governorates. This potential weakness was identified prior to the survey, but given that the Register was the only national reference of firms available, it was determined that it was the best possible reference population.
This discrepancy between the Register and the true population of firms on the ground led to many cases where those firms selected for the sample were no longer operating. Therefore, CSO used the replacement strategy, outlined previously in Chapter 1, to attempt to maintain the needed stratum sizes. Since the firms selected as replacements were not from a national register and were the result of field knowledge from local CSO offices, there is the potential that these replacement firms do not constitute a random sample of the population. Therefore, depending on the true populations of the stratum, this replacement strategy may introduce bias towards those firms known to CSO and possibly larger firms.
Furthermore, in cases where there were insufficient number of firms of size 10 or more the inclusion criteria were reduced to include firms of 7 or more employees, and in some stratum 5 or more employees. There is a total of 643 such firms. Given that the sample was created based on those firms in the Register with 10 or more employees, these firms of smaller size are not representative of the population sampled from. Therefore, these 643 firms of size less than 10 have not be used in the primary analyses referring to firms of larger size.
In principle, these 643 smaller firms could be used to attempt to make inference about the population of firms sized 5-9, although this has several limitations. Most importantly, this sample size is too small to accurately represent the 12,952 firms of size 5-9 in the Register at the subsector level in each governorate.

32
Moreover, the selection of these 643 firms was non-randomly drawn from the 12,952 firms in the Register and their selection was highly dependent on stratum (as this replacement strategy was only used in strata where not enough larger firms were available). Nonetheless, these 643 firms may be used to provide a snapshot of possible needs of smaller firms, and the data resulting from them are presented in Chapter 5. No strong conclusions should be drawn from them, but the data may help inform future areas of research.
Despite these replacement strategies, the overall sample size (2,010 firms of 10 or employees, 643 of size 5-9) is still potentially low for making inference at the strata level. Therefore, the margin of errors within the strata may be higher than the pre-specified 5%. These margin of errors within the strata depend on both the number of firms sampled within strata, and the variability in the answers given and therefore are difficult to predict prior to analysis. In general, those strata where the sample sizes are lower will likely yield higher margin of errors.
Finally, as mentioned previously, the discrepancy between the Register and the true number of firms in operation makes the calculation of sampling weights problematic. As outlined in Chapter 1, the strata weights are based primarily on the probability of a firm being sampled from the Register. Therefore, since the Register is out of date and some firms were sampled (via replacement) that were not part of the 2009 Register, it is likely that the sampling weights are not calibrated to the true population. Nonetheless, they constitute the best available given the available information, but any analysis involving them should be interpreted with care.
33
Chapter 2: Introduction to the context for skills development
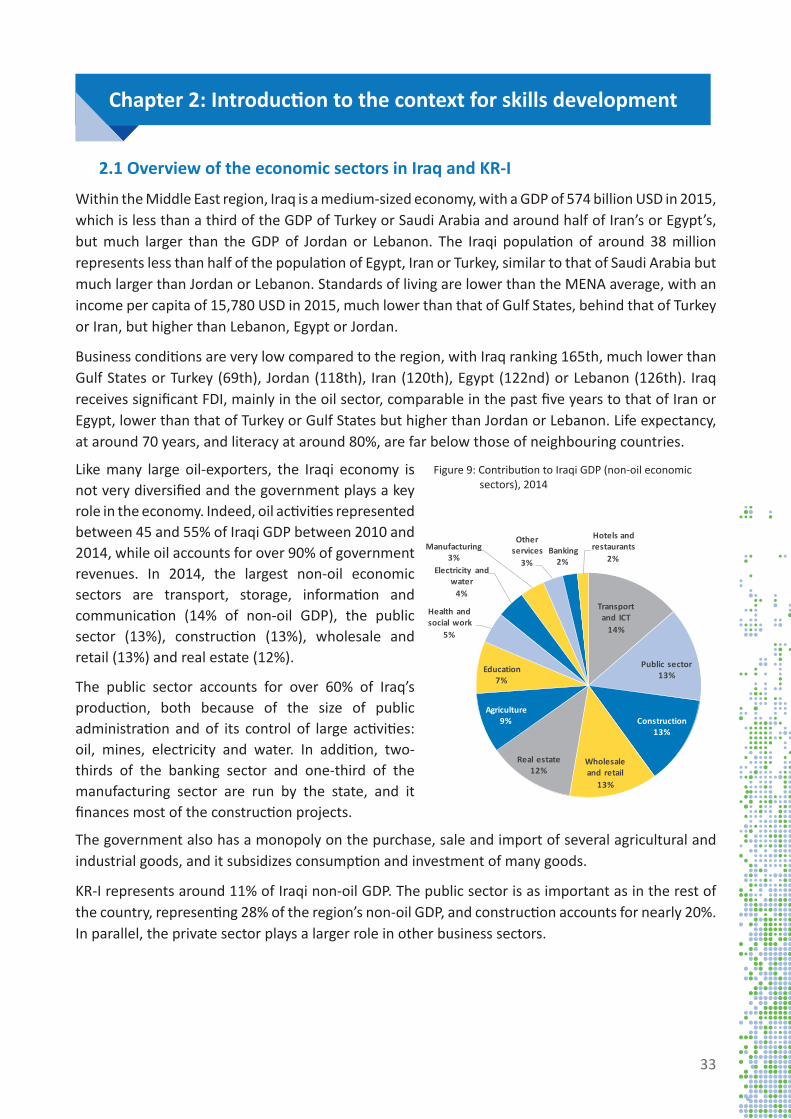
2.1 Overview of the economic sectors in Iraq and KR-I
Within the Middle East region, Iraq is a medium-sized economy, with a GDP of 574 billion USD in 2015, which is less than a third of the GDP of Turkey or Saudi Arabia and around half of Iran’s or Egypt’s, but much larger than the GDP of Jordan or Lebanon. The Iraqi population of around 38 million represents less than half of the population of Egypt, Iran or Turkey, similar to that of Saudi Arabia but much larger than Jordan or Lebanon. Standards of living are lower than the MENA average, with an income per capita of 15,780 USD in 2015, much lower than that of Gulf States, behind that of Turkey or Iran, but higher than Lebanon, Egypt or Jordan.
Business conditions are very low compared to the region, with Iraq ranking 165th, much lower than Gulf States or Turkey (69th), Jordan (118th), Iran (120th), Egypt (122nd) or Lebanon (126th). Iraq receives significant FDI, mainly in the oil sector, comparable in the past five years to that of Iran or Egypt, lower than that of Turkey or Gulf States but higher than Jordan or Lebanon. Life expectancy, at around 70 years, and literacy at around 80%, are far below those of neighbouring countries.
The government also has a monopoly on the purchase, sale and import of several agricultural and industrial goods, and it subsidizes consumption and investment of many goods.
KR-I represents around 11% of Iraqi non-oil GDP. The public sector is as important as in the rest of the country, representing 28% of the region’s non-oil GDP, and construction accounts for nearly 20%. In parallel, the private sector plays a larger role in other business sectors.
Like many large oil-exporters, the Iraqi economy is not very diversified and the government plays a key role in the economy. Indeed, oil activities represented between 45 and 55% of Iraqi GDP between 2010 and 2014, while oil accounts for over 90% of government revenues. In 2014, the largest non-oil economic sectors are transport, storage, information and communication (14% of non-oil GDP), the public sector (13%), construction (13%), wholesale and retail (13%) and real estate (12%).
The public sector accounts for over 60% of Iraq’s production, both because of the size of public administration and of its control of large activities: oil, mines, electricity and water. In addition, two-thirds of the banking sector and one-third of the manufacturing sector are run by the state, and it finances most of the construction projects.
Transport and ICT
14%
Public sector13%
Construction13%
Wholesale and retail
13%
Real estate12%
Agriculture9%
Education7%
Health and social work
5%
Electricity and water
4%
Manufacturing 3%
Other services
3%Banking
2%
Hotels and restaurants
2%
Figure 9: Contribution to Iraqi GDP (non-oil economic sectors), 2014

34
Figure 10: Oil GDP, non-oil GDP and oil prices, 2009-2015
Iraq relies very much on imports, importing over 15% of its GDP in most recent years. Iraq’s main imports are machinery and mechanics, as well as electrical and electronic equipment, both accounting for 10-12% of total imports. China, Turkey and the UAE are its main suppliers. On the other hand, KR-I was responsible for 40% of Iraqi imports in 2014, purchasing mainly from Turkish, Iranian, Chinese and American suppliers.
Meanwhile, the economic and political turmoil drove away tourism and foreign investment, which fell by around 30%.
Upon normalization of the political situation, the country still faces a number of important challenges including economic diversification away from oil-related activities, fighting corruption, training and integrating youth and women in the labour force, building institutional capacity and reducing the size of the informal sector.
2014 marked a turning point. The ISIL/Da’esh insurgency in mid-2014 caused significant economic damage. Trade routes were closed, economic activities in the northern regions were held hostage, most notably the agricultural production of the largest Iraqi crops, wheat and barley, which severely declined. Military expenditure also increased substantially. Simultaneously, in 2014, oil prices were halved on international markets, drying up the government’s main source of revenues and foreign currency. As a result, the government fiscal deficit more than doubled, from 5.6% of Iraqi GDP in 2014 to 13.7% in 2015.
Iraq’s real GDP fell modestly in 2014. In 2015, it grew by 2.4% because of a significant increase in oil production but the sharp fall in the value of that production caused Iraqi nominal GDP to fall by around 30% in 2015, triggering a severe economic recession across economic activities. Sectors in ISIL-held areas were more severely hit, as were sectors that relied extensively on public financing such as construction. Indeed, the sector lost half of its value in 2015, while other more resilient sectors, such as wholesale and retail, fared better. In 2016, growth resumed, with an estimated 11% increase in real GDP.
0
50
100
150
200
250
300
0
20
40
60
80
100
120
2009 2010 2011 2012 2013 2014 2015
GD
P (t
rillio
n IQ
D)
Oil
pric
es p
er b
arre
l (U
SD)
Non-oil GDP (r ight) Oil GDP (right) Oil pr ices (left)
Figure 11: Selected sectorial GDP, 2009-2015
9.1
15.8
20.6
0
50
100
150
200
250
300
0
5
10
15
20
25
30
2009 2010 2011 2012 2013 2014 2015
GD
P (t
rillio
n IQ
D)
Sect
or G
DP
(tril
lion
IQD
)
GDP (r ight axis) Agriculture
Construction Transport, storage, ICT
Wholesale and retail, hospitality

35
2.2 Overview of the demographics and the labour market in Iraq and KR-I
Table 3: Key demographic and labour market statistics
Population • Estimated at approximately 38 million in 20165 • Growth rate estimated at 3.3%6
Age of the population • Estimated 40.2% are under 15 years• Only 3.2% are over 657
Gender of the population Approximately 49% are female
Education level of the population
• In 2011 38% had no education8 • Approximately 50% had primary and intermediate schooling. 11% had a diploma
or aboveLocation of the population Approximately 70% urban and 30% rural9
Working age population 21.5 million10
Economically active and inactive
• 42% of working age population was economically active in 201111
• National labour force: Estimated at 8 million (2011) to 10.5 million (2017)12
• In 2014 76.2% of the economically inactive were female, 23.8% were male youth (15-25) represented 42.2% of the economically inactive13
• In 2014 the formally employed labour force consists of 86.1% males, 13.9% females (12% in KR-I in 201214). Youth (15-25) represented 24.5% of the formally employed15
Unemployment • In 2014 67% of unemployed were males and 33% were females. 51.7% of unemployed were youth16
• National: 34.1% of 15-19 year olds available for and actively seeking work are unemployed17
• KR-I: in 2012 the unemployment rate for female youth was exceptionally high, at 48.3%, compared to 13.4% for young men18
Public Sector employment • National: the government provides 40% of all jobs19 and employs 60% of female workers
• KR-I: in 2014 the public sector employed 80% of all employed women and 45% of all employed men20
Private sector employment 60-70% of jobs in formal and informal private sector employment
Oil employment Oil accounts for 32% of GDP21 and over 90% of government revenue, but only 1% of employment22
The population of Iraq is approximately 38 million, of which 70% live in urban areas. Around 40% of the population are children under 15 years, and the population is growing at a rate of 3.3% on average. Less than half of the working age population is economically active (i.e. working or looking for work).
5 CSO6 UN Statistics Division7 CSO8 CSO; UN9 CSO10 CSO11 UN12 ILO13 CSO14 Save the Children Assessment of Youth Labour Market and Entrepreneurship Opportunities in the KRG (2014)15 CSO16 CSO17 CSO18 Save the Children Assessment of Youth Labour Market and Entrepreneurship Opportunities in the KRG (2014)19 UNDP20 Save the Children Assessment of Youth Labour Market and Entrepreneurship Opportunities in the KRG (2014)21 CSO22 UNDP
36
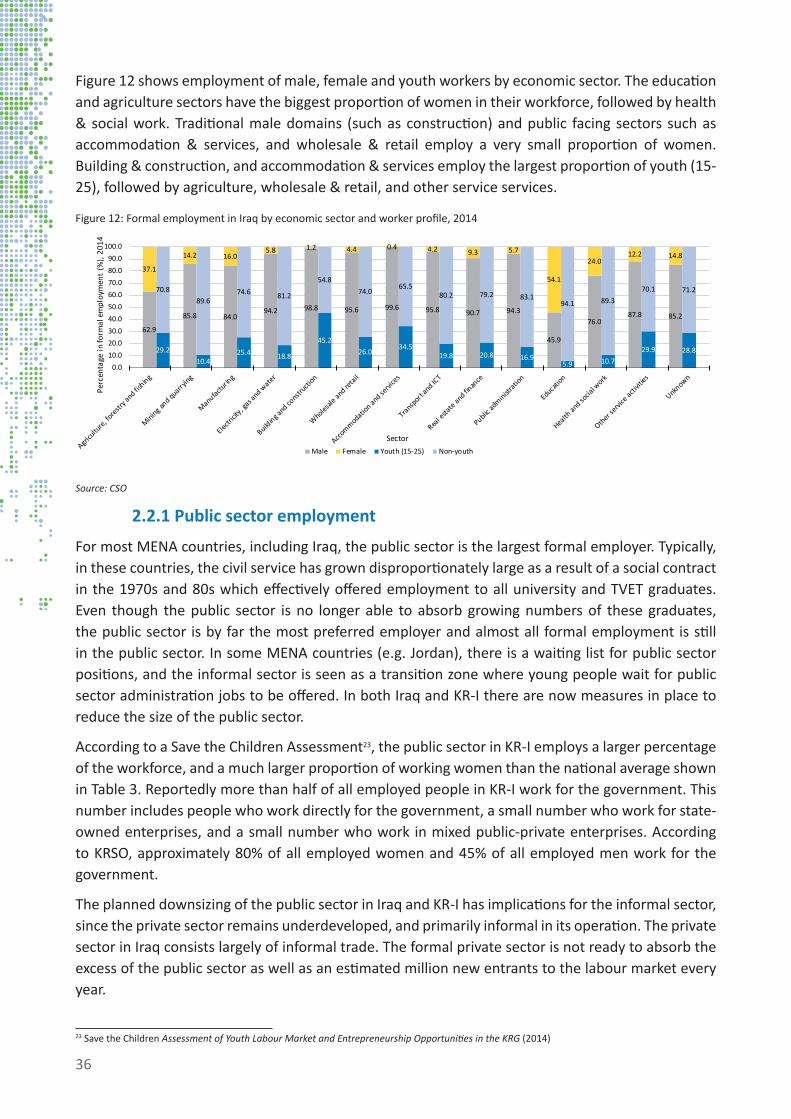
Figure 12 shows employment of male, female and youth workers by economic sector. The education and agriculture sectors have the biggest proportion of women in their workforce, followed by health & social work. Traditional male domains (such as construction) and public facing sectors such as accommodation & services, and wholesale & retail employ a very small proportion of women. Building & construction, and accommodation & services employ the largest proportion of youth (15-25), followed by agriculture, wholesale & retail, and other service services.
Figure 12: Formal employment in Iraq by economic sector and worker profile, 2014
Source: CSO
2.2.1 Public sector employment
For most MENA countries, including Iraq, the public sector is the largest formal employer. Typically, in these countries, the civil service has grown disproportionately large as a result of a social contract in the 1970s and 80s which effectively offered employment to all university and TVET graduates. Even though the public sector is no longer able to absorb growing numbers of these graduates, the public sector is by far the most preferred employer and almost all formal employment is still in the public sector. In some MENA countries (e.g. Jordan), there is a waiting list for public sector positions, and the informal sector is seen as a transition zone where young people wait for public sector administration jobs to be offered. In both Iraq and KR-I there are now measures in place to reduce the size of the public sector.
According to a Save the Children Assessment23, the public sector in KR-I employs a larger percentage of the workforce, and a much larger proportion of working women than the national average shown in Table 3. Reportedly more than half of all employed people in KR-I work for the government. This number includes people who work directly for the government, a small number who work for state-owned enterprises, and a small number who work in mixed public-private enterprises. According to KRSO, approximately 80% of all employed women and 45% of all employed men work for the government.
The planned downsizing of the public sector in Iraq and KR-I has implications for the informal sector, since the private sector remains underdeveloped, and primarily informal in its operation. The private sector in Iraq consists largely of informal trade. The formal private sector is not ready to absorb the excess of the public sector as well as an estimated million new entrants to the labour market every year.
23 Save the Children Assessment of Youth Labour Market and Entrepreneurship Opportunities in the KRG (2014)
62.9
85.8 84.094.2 98.8 95.6 99.6 95.8 90.7 94.3
45.9
76.087.8 85.2
37.1
14.2 16.05.8 1.2 4.4 0.4 4.2 9.3 5.7
54.1
24.012.2 14.8
29.210.4
25.4 18.8
45.226.0
34.519.8 20.8 16.9
5.9 10.729.9 28.8
70.889.6
74.6 81.2
54.874.0
65.580.2 79.2 83.1
94.1 89.370.1 71.2
0.010.020.030.040.050.060.070.080.090.0
100.01 2 3 4 5 6 7 8 9 10 11 12 13 14 15 16 17 18 19 20 21 22 23 24 25 26 27 28 29 30 31 32 33 34 35 36 37 38 39 40 41 42 43
Sector
Perc
enta
ge in
form
al em
ploy
men
t (%
), 20
14
Male Female Youth (15-25) Non-youth
37
2.2.2 Women in employment
87% of women in Iraq are economically inactive (not working or looking for work) and 78% are housewives.24 In KR-I, only 12% of women are economically active. Of those who are economically active (working or looking for work) in Iraq, 13% are unemployed. In 2014 only 13.9% of all citizens who were formally employed were women.
Traditional societal norms cast women as mothers.25 The working hours of other types of work, that might keep them out of the house after dark, or roles that require them to work with males not in their families, are barriers that contribute to females in Iraq and KR-I not working. However, the UN reported a change in attitudes, noting that 66% of youth, compared to 42% of older people, support women’s right to work outside the home.26 Nationally 60% of all female workers are employed by the government. In KR-I this number is reportedly closer to 80%. In 2011 only 2% of all private sector workers were women.27 Female unemployment is reportedly lower in rural areas due to high female employment in agriculture.
2.2.3 Foreign workers in employment
Although, according to the Labour Law (under revision) there is no specific requirement for at least 50% of employees of companies to be Iraqi, this condition is part of the Investment Law. In both Iraq and KR-I, the Investment Law states that the investor may employ local and foreign manpower but should give priority to local manpower with an equal skill set.28 In recent years, however, the government has stopped the granting of work permits for Arab and non-Arab expatriates workers in several instances.29
It is difficult for MoLSA to control the number of foreign workers since reportedly Recommendation 46 (2012) allows for employers to employ 50% foreign labour, and Law 80 (2013) allows foreign companies with government contracts to bring in their own labour without approval for one month. Some of these unregistered workers do not register, or return to their home country, and become illegal immigrants.
MoLSA in Iraq and KR-I issue work permits for ‘domestic’ and ‘project’ foreign workers. The cost to the applicant of obtaining a permit is insubstantial, and no disincentive. MoLSA does not have records of technical or professional level foreign workers. There is no complete record of the technical skills or qualifications of foreign workers. Classification and quantification of the skills of foreign workers would be a strong indicator of skills needed in Iraq and KR-I. Information from MoLSA KR-I shows that just over 10,000 foreign workers got permits for project and domestic work in 2015. Foreign workers originate mainly from many countries. In 2015 the largest numbers came from Nepal, Indonesia, India, Ghana, Georgia and Pakistan. Others have come from Iran, Syria, Turkey, the Philippines, Somalia, Ethiopia and Bangladesh. Positions as maids and nannies are often given to women from Bangladesh and Ethiopia.
Foreign labour can be found in all sectors of the economy, in both skilled and unskilled roles. In some sectors, foreign workers are preferred, for example in the hotel and construction industries. The HR
24 CSO25 Save the Children Assessment of Youth Labour Market and Entrepreneurship Opportunities in the KRG (2014)26 UN Women in Iraq. Factsheet – CSO/KRSO/UNFPA/Pan Arab Project for Family Health, Iraqi Women Integrated Social and Health Survey (I-WISH 2011), 2012 27 UN Women in Iraq. Factsheet (CSO/KRSO/UN) Iraq Knowledge Network, 2011 28 Law No. 4/2006. Investment Law in the Iraqi Kurdistan Region29 http://www.tamimi.com/en/magazine/law-update/section-6/march-5/employment-of-expatriate-workers-in-iraq.html

38
manager of a five-star hotel in Erbil reported in 2014 that of a staff of 303, only 55 were Iraqi Kurds, because Iraqi Kurds do not have the market-relevant skills needed and they lack the necessary command of English and Arabic.30 Employers and policy makers who were interviewed for this report generally agreed that graduates of the TVET system in Iraq do not have enough practical experience to be useful on the job.
There is a perception amongst employers that foreign workers will work harder and for longer hours, for less money31 , and make fewer demands on their employers. The typical transaction type described by a foreign labour recruitment agency is ‘no questions asked’ in exchange for low rates of pay. In 2014, it was reported that foreign labour will work for two-thirds the wage expected by Iraqi youth. Refugees will apparently accept even less than foreign labour. Because exchange rates have changed.
2.2.4 Youth unemployment in Iraq
According to the ILO, the Middle East region has the highest youth unemployment rate in the world at a level of 30% in 2017 (Figure 13). The youth unemployment rate for the Middle East has been more than twice the global and OECD youth unemployment rate since 2014. The OECD youth unemployment rate is reported at 12%, but some individual OECD countries (e.g. Spain, Italy and Greece) have higher youth unemployment rates than the regional rate for the Middle East.32
Figure 13: Youth unemployment rates for the Middle East, OECD and world, 2007-2017
Sustainable development indicators for decent work and economic development include substantially reducing the proportion of youth not in employment, education or training (NEET). Very high unemployment of youth is associated with poverty and social unrest.
The Save the Children Assessment of the Labour Market (2014) states that at the start of 2010, Iraq had the highest rates of unemployment in the Middle East: more than half of the country’s young urban males were unemployed as well as the large majority of young women. The official national unemployment rate in Iraq is 11%33 , youth unemployment stands at 18%, while female youth unemployment reaches 27%, against 17% for males.34 Youth unemployment rates for KR-I are reported as 48.3% for young women and 13.4% for young men.30 Save the Children Assessment of Youth Labour Market and Entrepreneurship Opportunities in the KRG (2014)31 Ibid 32 OECD33 UNDP34 CSO. Labour Force Factsheet (2011)
30.0
11.9
12.7
0.0
5.0
10.0
15.0
20.0
25.0
30.0
35.0
2007 2008 2009 2010 2011 2012 2013 2014 2015 2016 2017
Yout
h un
empl
oym
ent r
ate
(%)
Middle East OECD World
39
The youthfulness of the Iraqi population (40.2% are under 15 years) has implications as millions of new workers will enter the labour force in the next 20 years. In KR-I alone it is estimated that over the next 20 years between 850,000 and 1.1 million new workers will enter the labour market.35 No comparable data was available for the whole of Iraq.
2.3 Overview of the skills supply in Iraq and KR-I
2.3.1 Planning for TVET
The National Development Plan (NDP) for Iraq 2013-2017 has been replaced with the new NDP 2018-2022. The NDPs include some objectives relevant to TVET reform. Other planning for TVET (vocational schools) is included in the National Strategy for Education and Higher Education in Iraq for 2012-2022. There is also a TVET Strategy (2014-2023) for Iraq and KR-I, which is a ten-year strategic plan developed by an inter-ministerial group with funding from the EU and support from the British Council. The TVET Strategy provides analysis of the challenges and opportunities and sets out objectives for eight axes which include these focus areas:
1. Legal and governance framework
2. Infrastructure and equipment
3. Enrolment and private sector participation
4. Quality of staff and recognition of graduates’ skills (including NQF)
5. Labour market observatory and occupational standards
6. Research and innovation
7. Quality and accreditation
8. Funding.
In both Iraq and KR-I, the Ministries of Planning are at the centre of planning activities. The identified needs of districts and governorates filter upwards, through municipalities and governorates and other ministries to the Ministry of Planning. The Ministries of Planning work with development partners; commissioning and receiving studies; and co-ordinating and developing overarching planning agenda, in collaboration with the Ministry of Finance. Therefore, planning is an iterative process, which synthesises information from many sources, including ‘bottom up’ information from all parts of the country, and ‘top down’ information which is responsive to international developments and country and sector-wide analysis.
Some ministries have quantitative human resource development information which can feed straight into skills training and Human Resource Development planning (HRD). For example, the Ministry of Health in KR-I has produced detailed analysis of over- and undersupply (based on established norms of number of inhabitants per health professional) of all types of health personnel.
The development of a labour market information system has long been suggested and planned, and even attempted, but so far without significant advancement until the implementation of this UNESCO programme. Lack of labour market information has been a major inhibitor to any kind of structured HRD planning.
35 Save the Children Assessment of Youth Labour Market and Entrepreneurship Opportunities in the KRG (2014)

40
CSO and KRSO (attached to the two Ministries of Planning) conduct surveys periodically. The last Household Survey was in 2011-12 with an update in 2014. The last Employment and Unemployment Survey was in 2008. Other surveys reviewed for this Sector Skills Analysis project include, for example:
• CSO Hotel and Tourist Accommodation Survey 2012
• CSO Survey of Household Industries 2012
• CSO Repair of Machinery, Equipment and Appliances Services Survey for 2012
• CSO Report on University Education 2013-2014
• CSO Report on Vocational Education 2014-15
• CSO/KRSO Survey of Street Vendors 2015.
Both CSO and KRSO periodically collect and publish data on the productive sectors of the economy, such as crops in agriculture, building and construction, manufacturing and trade. Typically, CSO and KRSO reporting on survey data is descriptive but not analytical. The reader must derive the meaning from the data provided in the tables. The data does not seem to be collected to satisfy specific lines of enquiry, relevant to planning and decision making.
From the interviews conducted for this Sector Skills Analysis Project it does not appear that CSO and KRSO work plans are based on the commissioning of specific surveys and reports by the Ministry of Planning or by other ministries specifically to inform planning. CSO and KRSO operations are based on commitment to updating existing information; so that planners can help themselves to statistical data which exist, as it seems relevant to their purposes.
2.3.2 Financing TVET
Interviews held in Iraq and KR-I suggested that specific budget allocations for education and training are subsumed within the overall budget for ministries’ running costs.
Each ministry negotiates its annual budget based on its own perceived short term operating and capital development needs, within parameters which are based on previous budget usage. The MoHESR, for example, will negotiate for a budget slightly larger than the previous budget, irrespective of the development plans of other ministries, which may have implications for HRD.
Ministries (such as MoE, MoHESR and MoLSA) have a budget for the delivery of their core business services, irrespective of the number of students trained. Interviews in Iraq and KR-I suggested that the allocation of funding from the ministries to their education and training institutions is based on historical operating costs, with no mechanisms which enables budgetary consideration to be given to changes in the number of students, or running cost implications of delivering new or amended programmes. There is no per full-time-equivalent student cost formula which provides a baseline for different types and specialisations and levels of education and training.
There is no TVET levy fund in Iraq or KR-I. In many countries education and training is partially funded by a levy on private sector business. Different countries have developed different approaches, and the levy can be based on a percentage of taxable income, payroll or work permits. Contributors to the levy fund also have access to education and training for their local staff.
Education and training at all levels is fully subsidised by the state for those students who meet the required academic entry criteria. Students receive living allowances and other subsidies.

41
Many countries have found full state-funding of all tertiary education unsustainable in the context of the ”massification” of tertiary education, and have introduced various cost sharing schemes. Full government subsidy of all students does not discriminate between those that need financial assistance and those who could afford to contribute to their own education and training. In some countries where all the living expenses of students are fully funded by the government, students prefer to remain enrolled for as long as possible, since study with benefits is preferable to unemployment.
MoHESR is able (by decision of the Council of Ministers) to supplement the state budget allocation through the ‘parallel system’ of fee-paying students who did not quite meet the criteria for state sponsorship. This provides another source of income for polytechnic and technical universities. Separate streams of government funded students (who got good grades at school) and privately funded students (who did not get good enough grades to meet the entry requirement) are common in some post-Soviet countries. This practice is associated with some risks such as compromising the quality of the qualification by lowering the entry requirement, and institutions may be tempted to raise the official entry requirement for the purpose of generating more income. There may be other ways for institutions to generate income (such as education with production) which are less discriminatory and less compromising.
The mandate of MoLSA is to provide training to people who are registered umemployed. Nevertheless, there is some evidence of private sector companies requesting professional development training for their employees on a per-student fee basis from MoLSA training centres, such as the Swedish Academy in Erbil. Engagement of the private sector in requesting and paying for training seems to be uncommon. In general, social demand, rather than labour market demand, is the driver of enrolment. Numbers of students enrolled are only constrained by space in the classrooms.
2.3.3 Demand for TVET
Social demand for education and training is largely dictated by society values and beliefs. Within such values and belief systems, in many developing countries including Iraq, there may be a strong belief in a hierarchy of occupational status, in which young people with the “best” results should become doctors, and those with the next best grades should, for example, become lawyers or engineers. This is reinforced by the post-secondary admission system that limits entry into programmes which lead to such occupations. In this way, many young people train for the highest status occupation for which they can meet the entry requirement, rather than the occupation which suits them in terms of their aptitude or the occupation for which there is labour market demand.
Another factor which determines enrolment behaviour in Iraq, and in many other developing countries, is the historical legacy of public service employment, which was permanent and pensionable with many benefits. Even though the governments of Iraq and KR-I no longer absorb all graduates, and plan for mandatory downsizing of the public service, the idea of being qualified to work in the public service is still a very compelling option for young people and their families.
Certain occupations are very low down in the occupation hierarchy, such as hospitality services, and ‘dirty jobs’ such as blue-collar jobs in construction. Working in the private sector is unattractive, since it is believed that the work in the private sector offers lower pay, less job security and little or no social security. The private sector is very small as well as underdeveloped (mostly informal), and therefore offers less opportunities than the public sector.
42
2.3.4 Employment of graduates
As a result of these dynamics of preference, there may be a surplus of graduates for high status occupations such as engineers, and “white-collar, high security” jobs such as administrators, bankers and statisticians, and these graduates may be more likely to face unemployment than their peers. However, since there is no practice, in any of the education and training providers, of systematically following up TVET graduates (tracer studies) to find out how well their training prepares them to enter the workforce or pursue further study, there is only anecdotal evidence about employment and unemployment of graduates in each field of work.
Interviews with the Vice President and the Career Development Advisor of a Polytechnic University in KR-I, and with MoHESR and MoLSA in Iraq and KR-I, confirmed that there is no surveying of graduates (tracer studies), and despite the strong direction in the TVET strategy, there is still very little meaningful interaction between employers and training institutions.
Many countries which have experienced extreme regime changes (like post-Soviet countries), seem in some respects, to have “thrown out the baby with the bathwater” in their drive to distance themselves from the past. In Iraq, there is sense that some of the systems of the past had merit and should not have been discontinued without anything to replace them.
One example of a discontinued good practice from the past is the practice of surveying graduates. Even though the intention to survey graduates is still current and even recently renewed, it was not possible, over the course of several interviews, to locate a single example of a past or current graduate survey instrument.
2.3.5 Relationships between TVET providers and employers
Good practices of the past which were impacted negatively, and even completely disrupted, by political and social upheaval include the practices of close relationship between training providers and (often adjacent) production sites including factories, farms and service providers. These relationships offered easy access to work-based practice experiences, continuous employer feedback on student and graduate skills, and employment opportunities for graduates.
Another loss is the practice of ”training-with-production,” which includes actual production of goods and services for sale (revenue steam for the institution and the ‘workers’) and actual work experience for trainees, within the concept of training. More recently there is a small resurrection of this concept in the form of 14 “experimental” agriculture “training-with-production” programmes (MoE Iraq) with financial benefits for all parties, including trainees.
Many of the interviewees and pilot Sector Council participants, in both Iraq and KR-I, made the point that the training in technical fields which is currently offered in the institutes and colleges of MoHESR is very theoretical in nature, and is designed to prepare people for desk jobs in ministries. This is reportedly true of most fields of training, including those which would be expected to lead to practical work, such as agriculture and highway engineering. The Contractors Union reported that despite the availability of graduates in construction trades, the standard practice of building contractors is to hire unqualified labour or unskilled labour, and train them on the job.
The concept of ‘summer training’ which is intended to provide work experience for TVET students during ‘vacation’ periods is an example of a potential enhancement of the training to increase the practical skills and employability of graduates. The fact that educators are not paid to supervise

43
summer training is certainly a contributing factor to the failure of the concept to provide meaningful work experiences for learners. Supervision of work-place-based work experiences should be part of the assigned workload of educators and trainers. Work experiences need to be designed with close alignment to the competencies (learning outcomes) to be achieved, and closely supervised and monitored to ensure that learners have sufficient range of opportunities to practice and demonstrate their competence. Work experience should be a meaningful and worthwhile experience which is valued by learners, as well as a ‘credit-bearing’ component of the training programme.
An example of good practice for ‘summer training’ was provided by the Ministry of Transport (MoT) which offers ‘summer training’ to over 750 students each year. Experience with public universities is not positive (students don’t show up), but MoT has good experience with some private universities (e.g. Al Mansour). Their students are supervised by University staff and can be sent to the field (i.e. they have useful skills) and the University requests a report on each student. This successful experience can provide a model of good practice.
2.3.6 Provision of vocational preparatory education by MoE
Vocational preparatory education consists of 3-year programmes (equivalent to Years 10, 11 and 12) in vocational schools and institutes. Over 400 schools and institutes offer these programmes in Iraq and KR-I with a total enrolment of just under 60,000 students (over 50,000 in Iraq and around 8,000 in KR-I). More specialisations are offered in the governorates of Iraq than in KR-I (as shown in Figures 14 and 15). In Iraq, electricity and computer maintenance are the most popular vocational specialisations. In KR-I, student enrolment in trade and commerce programmes (accounting, administration, and commercial and tourism management) account for approximately half of all MoE vocational education enrolment.
Figure 14: Vocational education average cohort size by specialisation in Iraq, 2015-2017
Source: Author compiled from tables provided by MoE Directorate of Vocational Education, February 2017
16 18 20 22 26 34 39 42 50 52 55 66 80 81 94 112 112 116 137 152 167
219 230 263
350 544
625 685
753 859 865
963 1,543
2,007 2,451
3,699
PrintIndutrial technology
Ceramics and glassWater
Food industryLaser systems maintenance
Engineering drawingTexture
Mechatronics carsFoundry
Agricultural mechanisationScenery/décor
TourismElectronic management
Media technologyLaptops and mobile technology
Elevator maintenanceEnergy
Computers and networksCommunication
CarpentryBuilding
PetrochemicalsAgriculture
Conditioning and coolingWelding and metal forming
AutomobileGeneral commercial
Electronic and control systemsMechanic
Family sociologyMedical equipment
AdministrationAccounting
Computer assembly and maintenanceElectricity
Spec
ialis
atio
n
Average cohort size
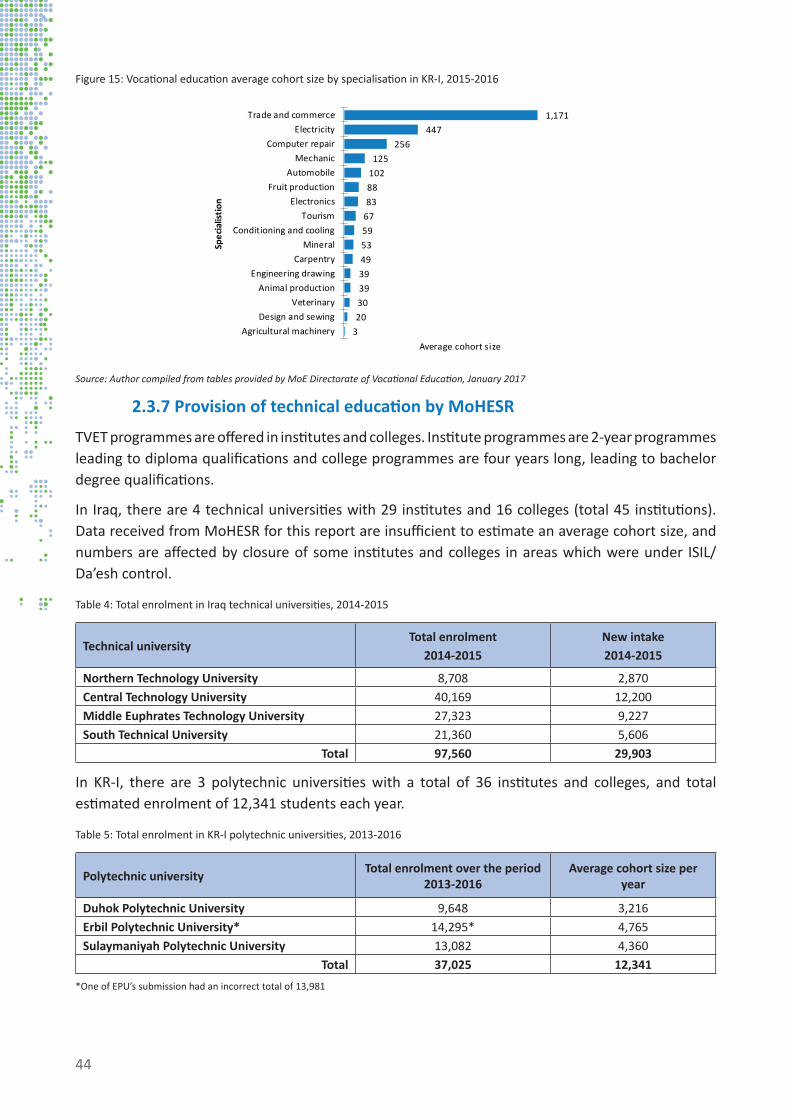
44
Figure 15: Vocational education average cohort size by specialisation in KR-I, 2015-2016
Source: Author compiled from tables provided by MoE Directorate of Vocational Education, January 2017
2.3.7 Provision of technical education by MoHESR
TVET programmes are offered in institutes and colleges. Institute programmes are 2-year programmes leading to diploma qualifications and college programmes are four years long, leading to bachelor degree qualifications.
In Iraq, there are 4 technical universities with 29 institutes and 16 colleges (total 45 institutions). Data received from MoHESR for this report are insufficient to estimate an average cohort size, and numbers are affected by closure of some institutes and colleges in areas which were under ISIL/Da’esh control.
Table 4: Total enrolment in Iraq technical universities, 2014-2015
Technical universityTotal enrolment
2014-2015New intake 2014-2015
Northern Technology University 8,708 2,870Central Technology University 40,169 12,200Middle Euphrates Technology University 27,323 9,227South Technical University 21,360 5,606
Total 97,560 29,903
In KR-I, there are 3 polytechnic universities with a total of 36 institutes and colleges, and total estimated enrolment of 12,341 students each year.
Table 5: Total enrolment in KR-I polytechnic universities, 2013-2016
Polytechnic university Total enrolment over the period 2013-2016
Average cohort size per year
Duhok Polytechnic University 9,648 3,216Erbil Polytechnic University* 14,295* 4,765Sulaymaniyah Polytechnic University 13,082 4,360
Total 37,025 12,341*One of EPU’s submission had an incorrect total of 13,981
3 20 30 39 39 49 53 59 67 83 88 102 125
256 447
1,171
Agricultural machineryDesign and sewing
VeterinaryAnimal production
Engineering drawingCarpentry
MineralConditioning and cooling
TourismElectronics
Fruit productionAutomobile
MechanicComputer repair
ElectricityTrade and commerce
Average cohort size
Spec
ialis
tion

45
2.3.8 Provision of vocational training by MoLSA
In Iraq, there are 38 MoLSA training centres with an average annual MoLSA cohort size of 16,659. Students are 66% female. The largest enrolment in this group is in business innovation (which may be linked to small loans) and is followed by the next four largest specialisations of sewing, computing, hairdressing, and English language. These top 5 specialisations make up over 70% of total enrolment (Figure 16).
Figure 16: MoLSA Iraq vocational training average cohort size by specialisation, 2013-2015
Source MoLSA Iraq
In KR-I there are 7 MoLSA training centres. Total enrolment was 1,504 in 2014 and 1,414 in 2016. The data from MoLSA KR-I shown in Figure 17 below is an amalgamation of three data sets with data cleaning modifications. Computer, sewing and English language courses have the biggest share of enrolment (over 50%). MoLSA KR-I students are 55% male and 45% female. Dahuk has by far the largest share of MoLSA enrolment in KR-I (34% of enrolment) and Erbil has the second highest share (18%).
2 3 3 5 7 9 12 12 13 18 19 19 20 22 22 23 24
55 58 64 82 90 102
148 152 167 170 198 208 212 240 267
417 465
587 670
1,059 1,476
2,736 3,316
3,488
FoundryMechanical engineering
TourismElectric motor winding
ElectricityReproduction
Oil pipeline connectingAutomobile painting
Parts paintingLeather
Electrical liftsHeavy equipment
Electric motor vehiclesCrane operating
AluminumOil pipe weldingElectrical power
Wood carvingScreen printing
MillingHealth sciences
BuildingHome devices
EngravingElectronics
Generator maintenanceCarpentry
Arabic languageHeating and cooling
MechanicMobile phone maintenance
WeldingElectrical building
Computer maintenanceLife skills
KABEnglish language
HairdressingComputing
SewingBusiness innovation
Average cohort size
Spec
ialis
tion
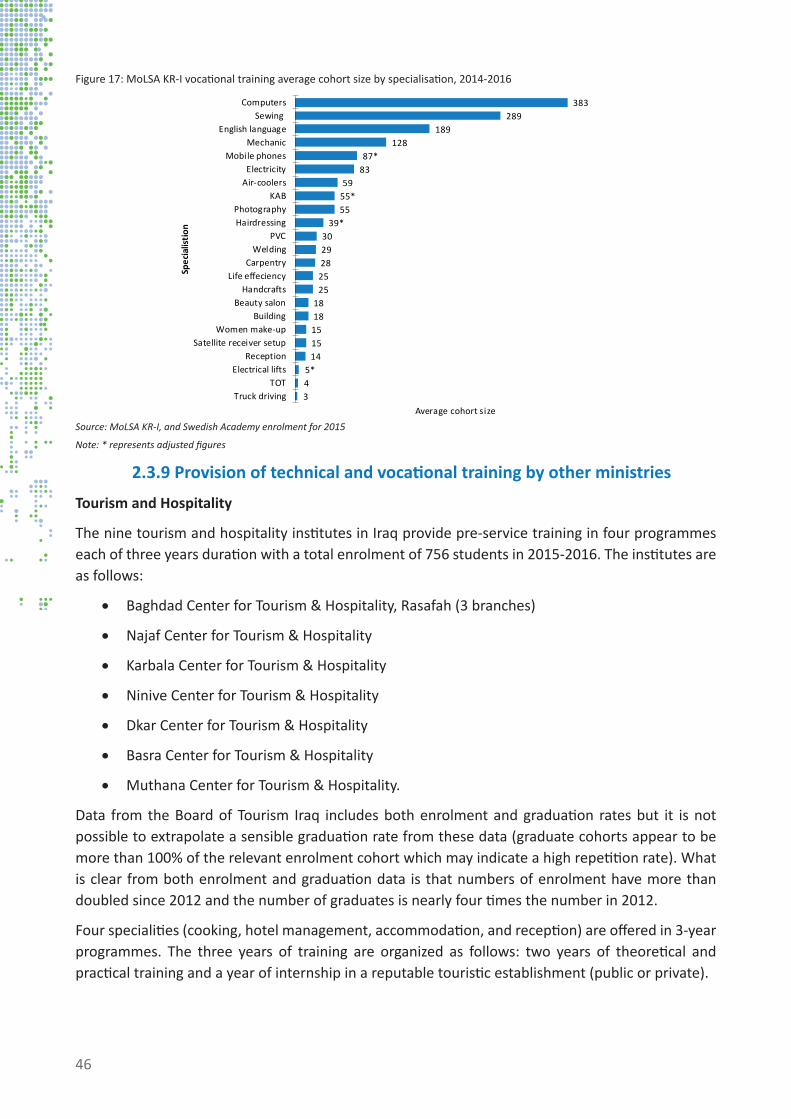
46
Figure 17: MoLSA KR-I vocational training average cohort size by specialisation, 2014-2016
Source: MoLSA KR-I, and Swedish Academy enrolment for 2015
Note: * represents adjusted figures
2.3.9 Provision of technical and vocational training by other ministries
Tourism and Hospitality
The nine tourism and hospitality institutes in Iraq provide pre-service training in four programmes each of three years duration with a total enrolment of 756 students in 2015-2016. The institutes are as follows:
• Baghdad Center for Tourism & Hospitality, Rasafah (3 branches)
• Najaf Center for Tourism & Hospitality
• Karbala Center for Tourism & Hospitality
• Ninive Center for Tourism & Hospitality
• Dkar Center for Tourism & Hospitality
• Basra Center for Tourism & Hospitality
• Muthana Center for Tourism & Hospitality.
Data from the Board of Tourism Iraq includes both enrolment and graduation rates but it is not possible to extrapolate a sensible graduation rate from these data (graduate cohorts appear to be more than 100% of the relevant enrolment cohort which may indicate a high repetition rate). What is clear from both enrolment and graduation data is that numbers of enrolment have more than doubled since 2012 and the number of graduates is nearly four times the number in 2012.
Four specialities (cooking, hotel management, accommodation, and reception) are offered in 3-year programmes. The three years of training are organized as follows: two years of theoretical and practical training and a year of internship in a reputable touristic establishment (public or private).
345*
1415151818
2525282930
39*5555*59
8387*
128189
289383
Truck drivingTOT
Electrical liftsReception
Satellite receiver setupWomen make-up
BuildingBeauty salon
HandcraftsLife effeciency
CarpentryWelding
PVCHairdressingPhotography
KABAir-coolersElectricity
Mobile phonesMechanic
English languageSewing
Computers
Average cohort size
Spec
ialis
tion

47
Information on new enrolments in 2015-201636 (189 for accommodation and 202 for reception) suggests that in the future there will be more graduates in these two areas, whereas enrolment for cooking (182) and hotel management (183) suggest little expected growth in skills supply in those two areas.
The KR-I Tourism Training Centre has a training and production kitchen, restaurant, canteen and hotel rooms. However, currently the facility is substantially used by the Ministry of Municipality and Tourism for office space, since the delivery of programmes is not expected to start until a future date.
Agriculture
The Ministry of Agriculture Iraq has 78 training centres all over the country for professional development of farmers and Ministry staff. Specialised training includes focus on rural women and rural youth.
Communication
The Ministry of Communications (MoC) Iraq offers training through its Higher Institute for Communications and Post.
Transport
The Ministry of Transport’s Department of Training and Development coordinates three existing training centres for civil aviation (two campuses), sea port and railways, which are partially operational.
36 Board of Tourism Iraq

48
Chapter 3: The informal sector in Iraq and KR-I
3.1 Key statistics and overview of the sector
Table 6: Key statistics of the informal sector
Size of sector• Estimated two thirds of all workers in Iraq work informally• Informal sector contributes one third of non-oil GDP37
Importance of sector
• The informal sector contributes significantly to employment creation, production and income generation
• One third of formal businesses surveyed in 2011 started their operation as informal businesses38
Employment
Informal sector participation correlates with age and levels of education• The likelihood of working in the informal sector decreases with age • The less educated people are, the more likely it is that they will work in the
informal sector• In 2014, 80% of refugee households reported having someone employed in
the informal sector (239,008 Syrian refugees in August 2016)• IDPs (3.4 million in 2017) are often forced to take informal sector work
Share of the private sector The World Bank estimated (in 2012) that 99.1% of the private sector is informal
Current conjunctureConditions which favour informality, such as accelerated urbanisation; displacement of people; bureaucratic constraints, low access to finance and corrupt practices, are strongly present
Main challenges Low productivity, poor working conditions, poor returns on investment in education
The World Bank report of 201239 reported that around two thirds of all workers in Iraq work in the informal sector (see Figure 18) but according to the Ministry of Planning, in 2014, only one million people work in the informal sector throughout Iraq (i.e. approximately 13% of workers).40
The big differences in these estimates points to two major difficulties in quantifying the informal sector. The first problem is obviously that informal sector workers are un-registered workers and even if they are working for formal employers they may not be counted as employees, since they are temporary/casual workers and/or do not have formal contracts. It seems highly likely that employers would only report on formal employees to government officials. The second problem which may account for widely variable estimates is the narrow and broader definitions of the informal sector. A narrow definition may only consider informal businesses (e.g. street vendors) and a broader definition also includes all those who work without formal contracts, outside of government regulation and taxes.
For the purposes of this report the informal sector is broadly defined as businesses, workers, and activities that operate outside the legal and regulatory frameworks, or ‘outside government regulation, taxation, and observation’. It can include, for example, workers who are hired without formal contracts by formal registered business and public organisations; as well as a wide range of unregistered small businesses such as household (domestic) industries and street vendors; self-
37 Angel-Urdinola & Tanabe. “Micro-determinants of Informal Employment in the Middle East and North Africa Region,” 201238 World Bank Group. “Enterprise Survey: Iraq,” 201139 Angel-Urdinola & Tanabe. “Micro-determinants of Informal Employment in the Middle East and North Africa Region,” 201240 Save the Children. “Assessment of Youth Labour Market and Entrepreneurship Opportunities in the KRG,” 2014
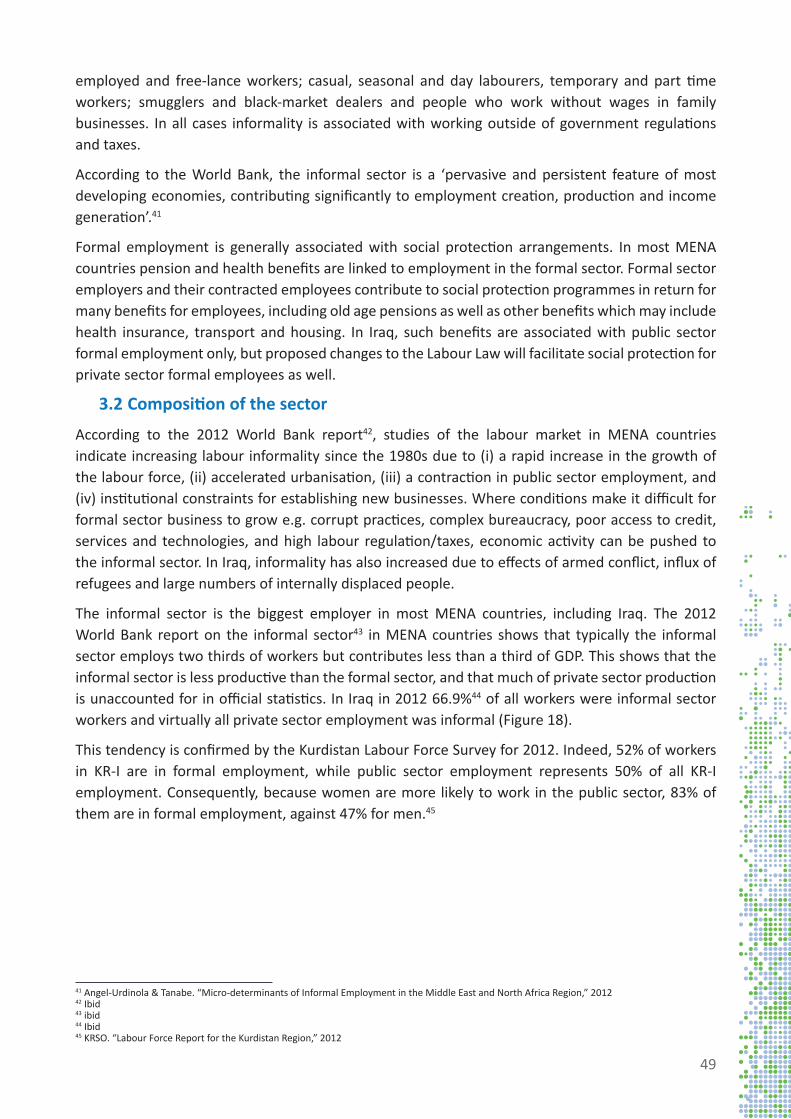
49
employed and free-lance workers; casual, seasonal and day labourers, temporary and part time workers; smugglers and black-market dealers and people who work without wages in family businesses. In all cases informality is associated with working outside of government regulations and taxes.
According to the World Bank, the informal sector is a ‘pervasive and persistent feature of most developing economies, contributing significantly to employment creation, production and income generation’.41
Formal employment is generally associated with social protection arrangements. In most MENA countries pension and health benefits are linked to employment in the formal sector. Formal sector employers and their contracted employees contribute to social protection programmes in return for many benefits for employees, including old age pensions as well as other benefits which may include health insurance, transport and housing. In Iraq, such benefits are associated with public sector formal employment only, but proposed changes to the Labour Law will facilitate social protection for private sector formal employees as well.
3.2 Composition of the sector
According to the 2012 World Bank report42, studies of the labour market in MENA countries indicate increasing labour informality since the 1980s due to (i) a rapid increase in the growth of the labour force, (ii) accelerated urbanisation, (iii) a contraction in public sector employment, and (iv) institutional constraints for establishing new businesses. Where conditions make it difficult for formal sector business to grow e.g. corrupt practices, complex bureaucracy, poor access to credit, services and technologies, and high labour regulation/taxes, economic activity can be pushed to the informal sector. In Iraq, informality has also increased due to effects of armed conflict, influx of refugees and large numbers of internally displaced people.
The informal sector is the biggest employer in most MENA countries, including Iraq. The 2012 World Bank report on the informal sector43 in MENA countries shows that typically the informal sector employs two thirds of workers but contributes less than a third of GDP. This shows that the informal sector is less productive than the formal sector, and that much of private sector production is unaccounted for in official statistics. In Iraq in 2012 66.9%44 of all workers were informal sector workers and virtually all private sector employment was informal (Figure 18).
This tendency is confirmed by the Kurdistan Labour Force Survey for 2012. Indeed, 52% of workers in KR-I are in formal employment, while public sector employment represents 50% of all KR-I employment. Consequently, because women are more likely to work in the public sector, 83% of them are in formal employment, against 47% for men.45
41 Angel-Urdinola & Tanabe. “Micro-determinants of Informal Employment in the Middle East and North Africa Region,” 201242 Ibid43 ibid44 Ibid45 KRSO. “Labour Force Report for the Kurdistan Region,” 2012
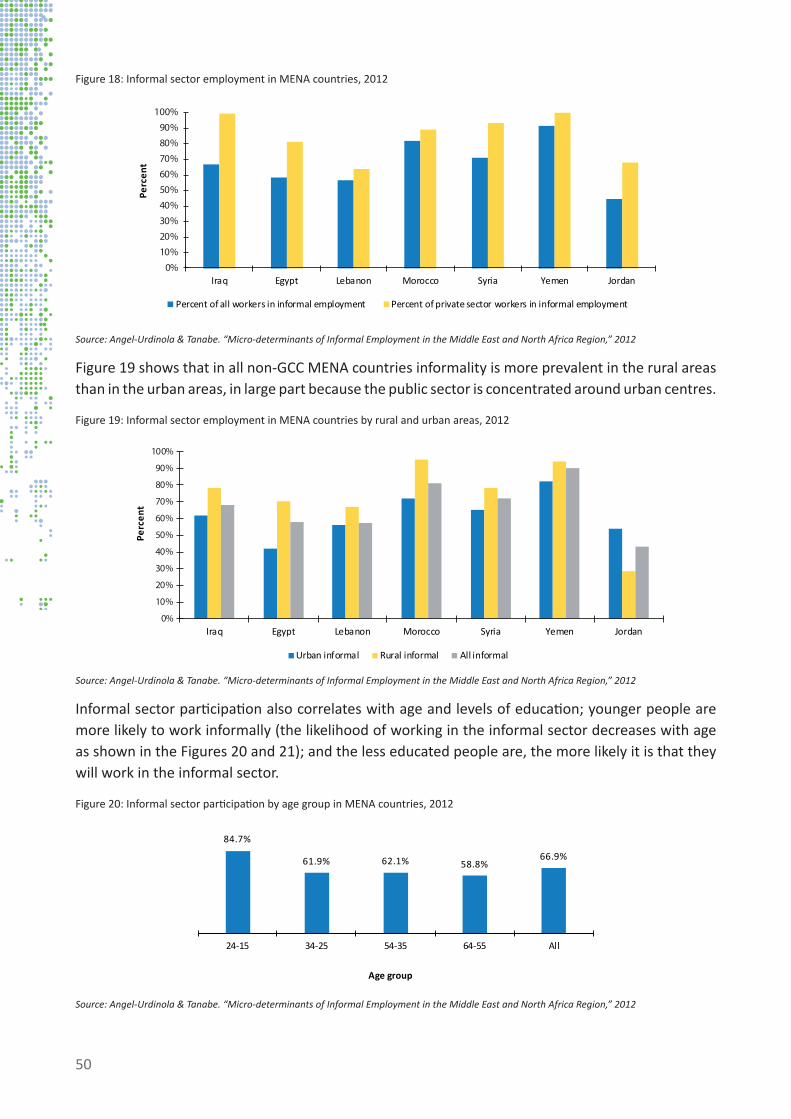
50
Figure 18: Informal sector employment in MENA countries, 2012
Source: Angel-Urdinola & Tanabe. “Micro-determinants of Informal Employment in the Middle East and North Africa Region,” 2012
Figure 19 shows that in all non-GCC MENA countries informality is more prevalent in the rural areas than in the urban areas, in large part because the public sector is concentrated around urban centres.
Figure 19: Informal sector employment in MENA countries by rural and urban areas, 2012
Source: Angel-Urdinola & Tanabe. “Micro-determinants of Informal Employment in the Middle East and North Africa Region,” 2012
Informal sector participation also correlates with age and levels of education; younger people are more likely to work informally (the likelihood of working in the informal sector decreases with age as shown in the Figures 20 and 21); and the less educated people are, the more likely it is that they will work in the informal sector.
Figure 20: Informal sector participation by age group in MENA countries, 2012
Source: Angel-Urdinola & Tanabe. “Micro-determinants of Informal Employment in the Middle East and North Africa Region,” 2012
0%
10%
20%
30%
40%
50%
60%
70%
80%
90%
100%
Iraq Egypt Lebanon Morocco Syria Yemen Jordan
Perc
ent
Percent of all workers in informal employment Percent of private sector workers in informal employment
0%
10%
20%
30%
40%
50%
60%
70%
80%
90%
100%
Iraq Egypt Lebanon Morocco Syria Yemen Jordan
Perc
ent
Urban informal Rural informal All informal
84.7%
61.9% 62.1% 58.8%66.9%
24-15 34-25 54-35 64-55 All
Age group

51
Figure 21: Informal sector participation by level of education in MENA countries, 2012
Source: Angel-Urdinola & Tanabe. “Micro-determinants of Informal Employment in the Middle East and North Africa Region,” 2012
3.2.1 Youth
Globally young people are more likely than older people to engage in casual, temporary, and vulnerable employment46, especially in the informal sector. Youth are also highly represented in sectors which are associated with high levels of informality e.g. construction, and food and accommodation services. Service sectors employ the highest proportion of youth in most countries but in lower income countries, the majority of youth are engaged in agriculture.47
3.2.2 Women
Gender is associated with high rates of informality in some MENA countries (especially more agricultural countries are likely to have more female workers) and less in others (especially where there is more public sector employment). In Iraq most women workers are employed in the public sector, mostly in the field of education, so they are under-represented in the informal sector, except in agriculture (especially domestic milk product processing).
In 2012 there were an estimated 450,000 to one million female headed households (FHHs) in Iraq or approximately one in every ten households nationwide.48 According to USAID these women may be widowed, divorced, separated or caring for a sick spouse.49 In 2012 nearly all women in FHHs (98%) were unemployed, retired, doing odd jobs or unwilling or unable to work. More than a third of these women rated access to work as their highest priority; a higher priority than even housing or health.50
3.2.3 Refugees
In August 2016 there were 239,008 Syrian refugees registered in Iraq. Most Syrian refugees are in KR-I. As of March 2014, when the total Syrian refugee population in KR-I was 219,579; 56.34% lived in non-camp settings, while 43.66% lived in camps.51 Despite KR-I’s policy of allowing registered refugees to work, it was still difficult for Syrians to find employment outside the informal sector; 80% of refugee households reported having someone employed in the informal sector in February 2014.52
46 ILO. “Global Employment Trends for Youth 2015,” 201547 Ibid48 UN Iraq. “Women in Iraq Fact Sheet,” 6 March 201249 USAID. “FIELD Report No. 15: Creating Jobs and Economic Opportunities in Iraq,” September 201250 Ibid51 Save the Children. “Assessment of Youth Labour Market and Entrepreneurship Opportunities in the KRG,” 201452 Ibid
82.2%67.6%
35.2%25.4%
66.9%
Education level

52
In a small sample survey conducted by Un Ponte Per (UPP) and Public Aid Organization, which concentrated on the Domiz refugee camp in Dahuk, 51.4% of respondents were currently unemployed, 19.3% were informally employed, and 6.8% said that they ran their own business. Those who are running their own enterprises did so as a survival strategy.53
3.2.4 Internally displaced people (IDP)
It was estimated that there were 3.3 million internally displaced people in Iraq in December 201554 and in June 2017 the official figure was 3.4 million.55
According to USAID in 2012 (when there were still only 1.3 million IDPs) over 70% of IDP households have no family members employed. IDPs are often forced to take on jobs below their level of skill as day labourers and/or street vendors just to survive.56
The greatest need cited by IDPs in 2012 was gaining access to jobs.57 Finding work is a significant challenge for IDPs especially since access to jobs is reportedly more dependent on ‘who you know’ rather than what you know, and IDPs are likely to have weakened social networks.
3.3 Types of informal sector enterprises
3.3.1 Domestic industries
In an introduction to the 2012 Survey of Household Industries58, CSO acknowledges the contribution of domestic manufacture to gross domestic production in areas such as sewing, embroidery and pottery as well as food processing activities such as manufacture of dates, canning, vegetables preserving, fish salting, pickles and jams and other products.
CSO surveyed 5,535 urban and rural household industries in 2012 in all governorates excluding those in KR-I (Erbil, Sulaymaniyah and Dahuk). Household industries employed over 10,000 people, mostly un-waged, with a total production value (purchases and other revenues) of almost 93 billion IQD. Of this total production value, the vast majority (72 billion) is dairy product activity. Manufacture of clothing (9 billion) and manufacture of ‘other’ food products (6 billion) are the next most productive home industries. The list of all the activities of the surveyed households by percentage of sales and revenues is shown in Table 7 below.
53 Costantini. “Assessment on Livelihood and Employment Condition of Syrian Refugees and Asylum Seekers Residing in Domiz Camp,” February 201454 IDMC: “Iraq IDP Figures Analysis,” 2016 55 UN OCHA. “Iraq - Key Figures” 56 USAID. “FIELD Report No. 15: Creating Jobs and Economic Opportunities in Iraq,” September 201257 Ibid58 CSO

53
Table 7: Percentage of total sales and revenues of different household industries in Iraq (excluding KR-I), 2012
ISIC Code ActivityPercentage of total sales and
revenues1050 Manufacture of dairy products 77.63%1410 Manufacture of wearing apparel 10.01%1079 Manufacture of other food products n.e.c59 6.49%1071 Manufacture of bakery products 1.47%1030 Processing and preserving of fruit and vegetables 1.46%2393 Manufacture of ceramic products 0.64%3100 Manufacture of furniture 0.55%1311 Preparation and spinning of textile fibres 0.45%1010 Processing and preserving of meat 0.33%1392 Manufacture of made-up textile articles 0.31%1393 Manufacture of carpets and rugs 0.22%1073 Manufacture of sugar confectionary 0.19%1075 Manufacture of prepared meals and dishes 0.15%1040 Manufacture of vegetable and animal oils and fats 0.05%3290 Manufacture of turab and rosaries 0.04%
Source: CSO
The dairy products domestic industry is the biggest employer of these domestic industries, followed by manufacture of clothing (wearing apparel; see Table 8). Informal dairy production presumably goes hand in hand with small scale animal husbandry, and so this activity is inextricably linked to family farms and identified (by the pilot Agriculture Sector Council in May 2017) skills needs for agriculture, including subsistence livestock farmer (ASCO 6210034). Female workers make up 71% of all domestic industry workers, and the breakdown by sub sector is shown in Table 8.
Table 8: Number of employees and percentage of female employees of different household industries (excluding KR-I), 2012
ISIC Code Activity Total employees
% of female employees
1410 Manufacture of wearing apparel 2,334 98.2%1392 Manufacture of made-up textile articles 129 97.7%1311 Preparation and spinning of textile fibres 61 96.7%3290 Manufacture of turab and rosaries 31 93.5%1071 Manufacture of bakery products 301 92.7%3100 Manufacture of furniture 334 84.7%1393 Manufacture of carpets and rugs 48 81.3%1010 Processing and preserving of meat 66 74.2%2393 Manufacture of ceramic products 275 63.6%1050 Manufacture of dairy products 5,502 62.1%1075 Manufacture of prepared meals and dishes 18 55.6%1079 Manufacture of other food products n.e.c 802 55.1%1040 Manufacture of vegetable and animal oils and fats 20 55.0%1030 Processing and preserving of fruit and vegetables 467 48.8%1073 Manufacture of sugar confectionary 13 46.2%
Source: CSO
`
59 Olive oil, vinegar, pickles, olive packing, rose water, molasses, pomegranate juice

54
3.3.2 Street vendors
Informal sector activities are widely visible in the urban centres of Iraq and KR-I. Activities include selling cell-phones products (e.g. airtime and accessories), selling home-made and manufactured food products, fruit and vegetables, selling and cooking fish, cigarettes and water.
A combined CSO/KRSO survey of street vendors in 2015 concluded that there were 37,619 street vendor units in Iraq and KR-I, with over 46,000 workers, mostly unwaged (less than 5% waged in the KR-I sample). Nearly 40% of all street vendors in Iraq are in Baghdad and just over 20% in Basrah. All the other governorates have a small share with a total of 7.2% for the three governorates of KR-I, which have only 2,842 street vendors. In KR-I 77.7% street vendors had a fixed location and 22.3% were mobile vendors. Their income was calculated at 2.8 million IQD and their expenditure was 0.37 million IQD. The most common activity for street vendors is selling food and drinks and cigarettes and other sundry goods and clothing (Figure 22).
Figure 22: Activity of street vendors in Iraq and KR-I, 2015
Source: CSO
3.3.3 Casual labour
Casual labour includes people who work on a per-job basis, and temporary or seasonal workers on an hourly or day rate. Informal employment within the formal sector is associated with casual labour, especially seasonal or temporary workers, who may be hired by formal registered companies. These people are mostly paid ‘cash-in-hand’ and are not formally recorded as employees of the organisation.
Casual labour seems to be particularly prevalent in the construction sector, which employed 13% of KR-I workforce in 2013. Reportedly there are allocated places where labourers can gather each day so that they can be selected by employers seeking casual workers.
Some people prefer to work as casual labourers rather than contracted labour. Focus group discussions in 2014 indicated that employers are not trusted to pay fairly at the end of a contract, so one-day-at-a-time payment is preferred; and that contracted positions often mean working away from home, and this is not wanted by many construction sector job seekers.60 60 Save the Children. “Assessment of Youth Labour Market and Entrepreneurship Opportunities in the KRG,” 2014
12,58811,235
5,868
2,111 2,0311,087 1,071 1,054 462 113
Num
ber o
f str
eet v
endo
rs
55
The standard daily rate for unskilled labour in 2013 was 25,000 IQD (around 21 USD) increasing to about 40,000 IQD (33 USD) if the labourer possessed a specific skill (welding, plastering, masonry, etc.).61 However, competition from Syrian refugees who were willing to work for less, was negatively impacting the amount that casual labourers could ask for. Construction sector employers indicated a strong preference for foreign and refugee labour, mainly for this reason.
A disadvantage for youth and refugee job seekers in the informal construction industry is that they often do not have the proper tools and/or safety equipment, both of which could provide a competitive advantage when seeking temporary employment as day-labourers.62
3.3.4 Family farms
Agriculture is a priority sector for the government with great potential for job creation (especially for women) and import-replacement (products which can be grown in Iraq are also imported because domestic production is less than demand). Most farming in Iraq is informal small-scale family-owned farms, with a high proportion of female workers. Recruitment is mainly through family and informal social networks.
3.3.5 Informal business/self-employment
Other types of informal sector employment include freelance workers who may be craftsmen and tradesmen who hawk for business and offer their services on a per-job basis.
It also includes small home-based un-registered businesses (e.g. consultancy or translation services) which may hire freelance workers on a per-job basis as well as people who informally rent business premises (sub-letting, back-street operations, etc.) and offer goods and services to the markets.
Evidence from the World Bank data set on enterprise surveys shows that in 2011 only 62.4% of enterprises were formally registered when they started operations (compared with 89% in all countries), so this shows that a third of formal sector businesses in the sample began as informal business and made the transition to formal business after they had commenced their business.63
3.4 Factors impacting on the growth and development of the sector
3.4.1 Political and economic factors
The private sector in Iraq consists mostly of informal sector activities. The informal sector is the largest employer in Iraq and it is estimated to be growing fast due to rapid growth of the population (youth of the population); accelerated urbanisation; displacement of people due to civil war in Syria and ISIL/Da’esh incursion in Iraq; reduction of the public sector; bureaucratic constraints and corrupt practices in the processes for establishing small business (e.g. access to land and credit).
There are significant barriers to entry into the formal private sector business arena. Some of these are shown in Figure 23 below, based on World Bank Enterprise survey data.64 For many small business owners, the requirements for formalising their operation are onerous
61 Save the Children. “Assessment of Youth Labour Market and Entrepreneurship Opportunities in the KRG,” 201462 Ibid63 World Bank Group. “Enterprise Survey: Iraq,” 201164 Ibid
CONSTRAINTS

56
e.g. taxes, requirements for social security contributions, minimum wage and other compliance requirements. The same source provides evidence of the practice of giving and receiving gifts in exchange for contracts and permits, which is a hidden cost of doing business.
While formal employment (mostly public sector) is associated with social security and good working conditions, the informal sector is associated with low pay, low productivity, poor conditions and no social security. However as discussed previously, there is informal employment within the formal sector so “decent work” is not invariably a characteristic of the formal sector.
The main constraints for both formal and informal businesses in Iraq were identified in 2009 as65:
• Difficulty accessing loans
• Lack of reliable infrastructure e.g. electricity, internet
• Corruption at the many levels of national, provincial, local and industry specific registration
• Lack of competitive business culture and negative influence of perceptions (of families and communities) of private sector/informal enterprises.
These themes are largely confirmed in the data shown in Figure 23, for 2011, and affirmed in the qualitative data collected in interviews and the pilot Informal Sector Council meetings in 2017.
Figure 23: Selection of major constraints affecting formal sector enterprises, 2011
Source: World Bank Group. “Enterprise Survey: Iraq,” 2011
In Iraq there is a general mistrust of banking institutions and no culture of borrowing money. Complaints about access to loans expressed during the pilot Informal Sector Council meetings, and reported low usage of on-line payment systems can be triangulated with survey data shown in Figure 24 from the World Bank Group (2011), showing very low levels of borrowing and less than half of sampled businesses with bank accounts.
65 Desai, S. “Entrepreneurship in Iraq: Understanding the Constraints,” November 2009
26.5%
10.8%
13.0%
20.4%
30.3%
35.7%
12.3%
17.4%
20.8%
29.2%
46.2%
26.2%
39.8%
29.5%
40.0%
0% 5% 10% 15% 20% 25% 30% 35% 40% 45% 50%
Percent of firms identifying access to finance
Percent of firms identifying labour regulations
Percent of firms identifying business licensing and permits
Percent of firms identifying tax administration
Percent of firms identifying tax rates
Iraq Middle East & Africa All countries
100%

57
Figure 24: Access to banking services in the formal sector, 2011
Source: World Bank Group. “Enterprise Survey: Iraq,” 2011
Decent work and economic growth (Goal 8) is one of 17 Global Goals that make up the 2030 Agenda for Sustainable Development. An integrated approach is crucial for progress across the multiple goals. The indicators of Sustainable Development Goal 8 are foreshadowed in the ILO report “Jobs for Iraq: Employment and decent work strategy” in 200766 which aimed for the creation of jobs “in which fundamental principles and rights at work are fully respected, which provide productive and adequately remunerative employment, there is an affordable degree of social protection and adequate opportunity for social dialogue between the government, employers’ and workers’ organizations”. The main policy recommendations from the study are as follows:
• Increasing the employment intensity of the reconstruction effort
• Adopting a macroeconomic framework which encourages domestic investment
• Investing in skills development and developing a demand-driven training system
• Strengthening labour market institutions, including workers’ and employers’ organisations
• Making decent employment explicit in the national development strategy and developing the institutional capacity to monitor labour market developments
• Strengthening the growth of small and medium-sized enterprises through reform of the policy and regulatory environment, provision of business development services and microfinance, promoting entrepreneurship among youth, encouraging economic empowerment of women and linking large and medium-sized enterprises
• Reconstructing of the social security system in the context of transition
• Seeking the views and support of independent organisations of employers and workers in the formulation and pursuit of employment policy
• Cooperating with women’s organisations in order to promote equal employment opportunities and conditions without any discrimination
• Preparing the economy to adapt to structural change and absorb new technologies and global competitiveness.
66 ILO. “Jobs for Iraq: Employment and decent work strategy,” 2007
33.8%
86.8%
25.6%
75.9%
3.8%
43.2%
0% 10% 20% 30% 40% 50% 60% 70% 80% 90% 100%
Percent of firms with a bank loan/line of credit
Percent of firms with a checking or savings account
Iraq Middle East & Africa All countries
58
3.4.2 Social factors
Working in the informal sector is strongly correlated with youth and low levels of education, but people of all ages and levels of education can be found in the informal sector, working across all the economic sectors, in rural and urban areas.
Research shows that in the informal sector returns on investment in education are relatively poor. A worker with 12-14 years of education in the informal sector may earn the same as a person with only primary education in the formal sector. Whereas in the formal sector a person with 12-14 years of education can expect to earn 2-3 times more than a person with only primary education.67
Clearly there are significant benefits to the individual of moving from the informal to the formal economy. According to the ILO Recommendation R20468, “the transition from the informal to the formal economy is essential to achieve inclusive development and to realize decent work for all.” The recommendation to ILO Members is to “facilitate the transition of workers and economic units from the informal to the formal economy.” Facilitation of the transition includes adjustment to legal and policy frameworks for employment and social protection.
Skills development and transition-to-work programmes should be oriented to skills which facilitate the transition to formal employment, while recognising the enormous potential of the informal sector as the starting point of many successful businesses.
Despite this potential, and the example of many well know global giants which started in garages and kitchens in the informal sector (e.g. Microsoft, Body Shop), families in Iraq prefer public employment for their members and discourage entrepreneurship. Even though the government is no longer able to absorb graduates, the allure of better-paid and higher-status public employment informs young people’s career choices.
Syrian refugees have some advantages over Iraqi Kurds as job seekers, since they are prepared to work for less money and they can speak Arabic (many young Kurds do not speak Arabic) and increasing numbers of business people in KR-I are from other Arab countries.
However, interviews conducted and focus groups informants of several studies reviewed for this report indicate that access to jobs is to a great extent based on preferential treatment related to social and family connections. This works in favour of the well connected, but disadvantages vulnerable groups, such as Syrian refugees who are not well connected.
Syrian refugees are no longer given residency in Iraq (since April 2013). Although Syrian refugees are able to work without residency, having no residency permit makes job seeking refugees less attractive to employers because of their uncertain status.
67 Angel-Urdinola & Tanabe. “Micro-Determinants of Informal Employment in the Middle East and North Africa Region,” 201268 ILO. “R204 - Transition from the Informal to the Formal Economy Recommendation, 2015 (No. 204),” 2015
EDUCATIONA G E
59
3.4.3 Technological factors
Informal sector activities are generally low-technology activities, but with increased availability of internet and e-commerce services, including internet banking, there would be increased potential for informal sector operators (especially women) to work from home. This kind of work is also suitable for IDPs who currently have no fixed abode, but may have access to internet (for example via mobile phones).
3.4.4 Environmental factors
The informal sector is outside any government control in terms of health and safety issues, industrial standards and codes for disposal of waste products. The safety of working conditions is another reason why ILO promotes transition from informal employment to formal employment.
More than half of the household industries surveyed by CSO claimed that they produced no waste, and a tiny minority (3%) have health licences, although the majority of household industries are dairy and food processing industries.69
3.4.5 Legal factors
The labour law allows for easy employment of foreign workers and many recruitment companies make it easier to hire foreign workers than to find suitably qualified Iraqis, especially in the absence of comprehensive registration of job seekers, with heavy reliance on social and family networks for sourcing employees. There needs to be more rigorous data collection, transparency and more availability of information about vacancies, job seekers, and the skills of foreign workers.
Iraq is signatory to ILO conventions related to youth employment and child labour. The Ministry of Labour and Social Affairs (MoLSA) sets a minimum monthly wage for unskilled workers (currently 250,000 IQD). In addition, according to Iraqi law, all formal employers must provide some level of transport, accommodation, and food allowances for each employee. The law does not fix these allowance amounts.
69 CSO
I N T E R N E T
H E A L T H
60
Chapter 4: Skills supply to the informal sector
The informal sector includes a huge range of occupations and levels from freelance professionals to unskilled workers, and it includes work in all the economic sectors. The skills-needs of the informal sector cut across all sectors, so there is no specific training for the informal sector.
In both Iraq and KR-I MoLSA offers training courses which are specific to occupations in the economic sectors which are the focus of this Sector Skills Analysis (SSA) Project.70 MoLSA training courses relevant to the occupations of the selected employment sectors are listed in the relevant reports.
MoLSA also offer training courses which are aimed at other employment sectors (not selected for this skills analysis), on skills for women’s self-employment, on entrepreneurship and on work readiness in general.
People with low levels of education, unemployed people, youth and entrepreneurs gravitate to the informal sector. These target groups are the main target groups for MoLSA and NGOs. The Ministry of Agriculture offers training opportunities to rural youth and rural women which have some overlap with opportunities provided by MoLSA e.g. handicrafts, sewing and hairdressing. The extent of this overlap has not been quantified. This chapter discusses programmes available for these target groups.
4.1 MoLSA training and microfinance
MoLSA training is offered to registered unemployed people (with Iraq residency, including IDPs and some refugees) at 38 institutions in Iraq and 7 institutions in KR-I and varies in duration from 5 days to 3 months, with some competency-based training (CBT) courses of longer duration.
The total number of people trained annually through MoLSA courses is small: approximately 1,500 in KR-I in 2016 and an average of 16,659 per year in the rest of Iraq (average of 2013-2015). Some researchers have concluded that MoLSA training is not sufficiently market driven.71 Very short duration training does not necessarily increase a person’s employability. Lack of graduate destination surveys (tracer studies) makes it difficult to evaluate the effectiveness of the training for reducing unemployment.
Graduates of MoLSA TVET courses can access small loans (with additional entrepreneurship training) from MoLSA (no interest with repayment after 6 years). Entrepreneurship training and microfinance is a major thrust of MoLSA’s job creation strategy, especially in Baghdad. In MoLSA Baghdad the Department for Employment and Loans registers unemployed people, directs them towards training opportunities, links them to job opportunities, and grants small business loans.
In KR-I there are 12 centres for small loans but the Directorate of Small Loans stopped offering new loans in 2016. Some problematic issues in the system (apart from lack of finance) included criteria which reportedly prevented successful applicants from accessing government jobs for the six-year duration of the loan period, and lack of effective monitoring and follow up.
70 Accommodation and food services (hospitality); construction; wholesale, retail and automotive; transport and storage; ICT; manufacturing (MoLSA does not provide training for agriculture occupations)71 Save the Children. “Assessment of Youth Labour Market and Entrepreneurship Opportunities in the KRG,” 2014

61
The size of the MoLSA training implementation from Baghdad is overall more than ten times larger than the KR-I training implementation. MoLSA Baghdad students are 66% female. MoLSA KR-I students are 55% male and 45% female. The largest MoLSA cohort is in business innovation, which is not currently offered in KR-I.
The chart in Figure 25 shows the estimated cohort size of people enrolled in MoLSA courses related to work-readiness, home industries, entrepreneurship and self-employment.
Figure 25: MoLSA enrolment for work-readiness, home industries, entrepreneurship and self-employment in Iraq and KR-I (estimated
2013-2016)
Source: MoLSA
4.2 Other entrepreneurship training
Entrepreneurship has the potential for new business development and job creation, and it provides opportunities to work from home, which are attractive for Iraqi women. Refugees also often prefer self-employment in their own micro enterprises, however access to finance is very limited for Syrians.
A number of entrepreneurship development programmes exist throughout the Middle East region. For example, there are four UNIDO/government funded Enterprise Development Centers (EDCs) in Baghdad, Thi-Qar, Basrah and Erbil. Support is provided through these centres for development of small- and medium-size enterprises through the provision of business plan development support, counselling support, access to finance and the facilitation of linkages.72
In a review of their own programmes for youth employment, USAID reviewers drew some useful conclusions about the cost and the value of apprenticeship/internship/entrepreneurship development models:
The Youth Employment Promotion (YEP) was an employability skills training programme with internship placements (called an apprenticeship programme but not actually fitting the apprenticeship model) which was found to be too small in scale (expected to result in 480 permanent jobs), too narrow in scope (in terms of the range of economic sectors) and too expensive (at $2,000 USD per job) and not replicable to meet the needs of tens of thousands of people needing jobs.
72 Desai, S. (UN University). “Entrepreneurship in Iraq: Understanding the Constraints,” November 2009
3,488 3,316
2,736
1,4761,059
670 587198 148 55
289 38339 189 55 25 33 25
0
500
1,000
1,500
2,000
2,500
3,000
3,500
4,000
Enro
lmen
t
Estimated cohort size Iraq Estimated cohort size KR-I

62
The USAID Iraqi Youth Initiative (IYI) includes the Youth Entrepreneurship Resource Centre (YERC) and the Youth Entrepreneurship Access to Finance (YEAF) as components.73 The YERC provided the counselling and business development services to those who qualified for YEAF. The estimated cost is $3,825 USD for each start-up (1,603 new businesses started by half of those who received the training) including the cost of the loan.
In the final analysis, even though entrepreneurship development programmes (EDPs) are very popular with donors and government agencies as a job creation strategy, and even though they have strong educational value and support the acquisition of transferable skills, this approach is thought to be a costly and ineffective for the large-scale unemployment problem in Iraq. Not everyone has what it takes to be a successful entrepreneur. Many start-ups fail in the first year.74 The kind of business services which start ups need e.g. assistance to access new markets and develop new positioning strategies for their products, are not offered by business development providers.
The USAID FIELD report recommends that entrepreneurship training should be used selectively as a type of “self-employment readiness training” for the few who show definite aspirations and entrepreneurial abilities along business lines; and that instead of internships, graduates of the training should be encouraged to form business clubs, linked to Chambers of Commerce and Industry, and join business associations. Experienced business people should be encouraged to ‘give back’ to the community by mentoring groups of new entrepreneurs. The business community needs to be part of the solution.
4.3 NGO training courses for refugees
Vocational training available (free of charge) to Syrians is mostly very short duration (1-3 weeks) whereas up to 6 months is generally considered necessary for employability based on skills. According to the Save the Children Assessment 60% of surveyed youth in refugee camps had taken short NGO training courses but half of these were not using the skills they had learned, and two thirds of job seekers were graduates of such courses.75
4.4 Informal apprenticeship
Informal apprenticeship is often not considered as a source of skills since it exists outside the formal TVET system, but in some countries, traditional apprenticeships is the most common and preferred form of vocational training. Interview informants in KR-I reported that most builders learn their job at the workplace from their elders; the same for car mechanics, for cleaners and even for cooks and waiters in restaurants.76
73 USAID. “FIELD Report No. 15: Creating Jobs and Economic Opportunities in Iraq,” September 201274 Up to 90% according to popular media: https://www.forbes.com/sites/neilpatel/2015/01/16/90-of-startups-will-fail-heres-what-you-need-to-know-about-the-10/#58ecf642667975 Save the Children. “Assessment of Youth Labour Market and Entrepreneurship Opportunities in the KRG,” 201476 Ibid

63
Chapter 5: Demand for skills in the informal sector
Information on the demand for skills comes from the meeting of the pilot Informal Sector Council.
5.1 Outcomes of the Informal Sector Council meeting
The pilot Sector Council, representing the leadership of the sector, was established by nominations based on information gathered in fieldwork interviews and during desk research, and drawing on professional networks and databases.
A demand-led TVET system requires that the leadership of the sectors is organised into representative bodies to advise on the training needs of their sector. Thus, in the future, permanent sector councils will need to be formally established through legislation.77 The membership of formally and legally established sector councils will need to be decided by the sector itself, probably in consultation with the members of the original pilot Sector Council.
The pilot Informal Sector Council meeting was held in Erbil on 4-5 July 2017. The meeting was attended by public and private organisations along with informal sector stakeholders from Iraq and KR-I.
5.1.1 Challenges of the informal sector
The informal sector is the biggest employment sector, including a significant proportion of youth. The informal sector is fertile ground for developing and trying out new ideas, for innovation and entrepreneurship. Although there is a need to increase the formality of business operations, the informal sector should not be seen as a problem to be solved, but rather as an enormous potential for the future.
The informal sector lacks social and government support, and there is lack of co-ordinated support for youth. The current generation of young people is described as a generation without hope. If the economy is to be revitalised, then the government and other stakeholders need to channel significant effort into developing curricula and training teachers to spread a message of hope and a vision for a better future; and preparing young people with skills and technologies for the world of work.
Informal sector workers are not paid fairly, have no job security and no support for skills development. Employers are unwilling to contribute to social protection. The risks of the informal sector are not only social and economic; there are also health and environmental risks due to lack of health and safety regulation e.g. street vendors selling foodstuff without knowledge of food safety.
Lack of accurate and integrated data is a major challenge to addressing the needs of the informal sector. There is an absence of labour market information, and multiple data sets which exist (e.g. MoP, MoLSA, MoA) are not centralised. There is a need to unify or link data sets held in different ministries, so that cross referencing and meta-analysis are possible. Data relevant to the informal sector which are held in different locations may not be accurate for many reasons, including different definitions of ‘unemployed’ and ‘youth’.
77 In the document ‘Government Restructuring for the TVET Sector in Iraq’, developed under the UNESCO TVET Reform Programme for Iraq and KR-I, ‘Sector Council’ is referred to as ‘Sector Skills Advisory Coordination Services (SACS)’ bodies as their role includes the development and validation of respective sector national occupational skills standards and qualifications

64
Lack of co-ordination in efforts to address the needs of the informal sector is not only due to lack of communication between ministries; donors also do not co-ordinate their efforts, and focus on their specific initiatives in isolation, without consideration of the broader context. Stakeholders would benefit more if these efforts were co-ordinated.
Strategic planning is not a powerful tool unless there is also implementation planning, and funding for implementation. Public officials are frustrated with policies and plans that cannot be implemented due to lack of resources. Although there is much frustration that laws exist but are not implemented, there is also acknowledgement that many laws are very old, and before they can usefully be implemented they need to be reviewed and updated for relevance to the reality of Iraq and KR-I today.
According to participants it is difficult for MoLSA to control the number of foreign workers since Recommendation 46 (2012) allows for employers to employ 50% foreign labour, and because Law 80 (2013) allows foreign companies with government contracts to bring in their own labour without approval for one month. Some of these unregistered workers do not register, or return to their home country, and become illegal immigrants.
There is frustration with wastage of resources, including financial resources, human resources and local product.
• Regarding financial resources it is believed that there is low return on significant investment by the government (see Section 5.1.3: MoLSA presentation) in small businesses in the form of micro-finance loans, due to insufficient monitoring and evaluation, and lack of the right type of follow up support. MoLSA efforts to monitor the outcomes of small loans were reportedly unreliable, and a new system of business hubs will take over this function. In particular, it is believed that small businesses need support to develop and market products.
• Women are an under-utilised human resource in Iraq and KR-I. Empowering women to access formal employment and self-employment opportunities needs to be a priority. The work of women is generally low status and low paid or not paid. Women are productive but their work is not recognised. Strengthening the role of women will also strengthen families and society in general.
• The work of academicians, and the government funding assigned to them, is thought to be not as well used for the benefit of the country as it should be. For example, doctoral (PhD) theses which are funded by the government should be relevant to real current problems; and should have some practical application. Titles of theses should be discussed with the relevant industry sector to make sure that there is good return on the investment of money, time and effort
• Local product is wasted due to lack of co-ordinated solutions to make good use of it. The example given was milk, which is not able to be collected, processed and transported in some areas, and is therefore wasted in huge quantities on a daily basis, while at the same time dairy products are imported.
The pilot Sector Council emphasised that the focus should be on making best use of local resources; focussing on producing what people need; using the product efficiently; protecting the national production and retaining financial resources within the country. As part of that strategy, increasing national productivity and import substitution should be a major goal of the government.

65
The concept of making better use of existing resources informed the pilot Sector Council’s development of some examples of opportunities for creating new jobs and supporting the formalisation of the informal sector.
5.1.2 Opportunities identified by the Informal Sector Council1. Steel and cast-iron factory
Features of this concept:
• Recycle gas waste product of oil fields to use as the energy source
• Process scrap metal from old cars, armaments, old government equipment
• Create jobs (collection, transport, processing)
• Use the product for construction and manufacture.
Needed for implementation:
• Legislation for public-private partnership (PPP)
• Legislation for recycling government property.
2. Green landscapes
Features of this concept:
• Create green spaces in urban environments e.g. roof gardens
• Compensation for oil field pollution
• Identify suitable plants for the climate and urban conditions
• Create jobs for youth
• Recycle air conditioner water.
3. Bee keeping in liberated areas
Features of this concept:
• Provide hives and equipment
• Create jobs and livelihoods for rural families
• Suitable work for rural women
• Agriculture depends on bees for pollination.
4. Small livestock farming in the liberated areas
Features of this concept:
• Distribute a few lambs or goats to each rural family
• Supply feed for six months
• Train people on how to breed animals and make their own animal feed.
5. “Introduce your country”
Features of this concept:
• Provide jobs for youth and reduce poverty
• Support the tourism industry

66
• Market unique sites e.g. marshes
• Use modern technologies e.g. language headsets
• Stimulate national pride
• Create demand for handicrafts.
6. Another project to make use of existing resources could be making better use of the date palm tree; not just the fruit but also the wood (for furniture) and the leaves.
5.1.3 Presentations by members of the Informal Sector Council
Three presentations were made but only two are summarised in some detail here. The third presentation was a brief overview of some of the activities of the NGO Women’s Empowerment Organisation, highlighting some success stories, and challenges.
Presentation of MoLSA Department of Employment and Loans (Baghdad)
Each unemployed person can register via the website, automatically creating an entry in a central database. This entry can be seen by the employment office in the relevant governorate, which then invites the unemployed person to an appointment. One of the problems with the unemployment data base is that people do not update their status, and so, since it started in 2003, the database has grown very large. New procedures require people to update every year, or their ‘account’ is frozen. Based on the number of updated entries, the number of registered unemployed is estimated at approximately 600,000.
Committees of the Department of Employment identify employment opportunities by visiting potential employers. Employers are then offered a list of possible candidates for interview and selection. Although most job seekers prefer public sector jobs, these days there is almost zero new employment in the public sector. No new posts are created, and when people retire they are not replaced by new employees.
There are several different funds for micro-loans for unemployed people:
• Funds (267 billion IQD) for interest free loans to 18-45-year-old applicants for profitable projects. The loan application is automatically linked with data entered when the person first registered unemployed. The application is scored according to an algorithm which assigns a score according to whether the applicant is married, number of children, level of training and so on. The Fund is administered by the Minister with a committee, including other ministry and banking sector representatives
Each loan is guaranteed and it is estimated that 73% of loans are repaid. The repayment amount can be deducted from the salary of the guarantor if the recipient defaults. The inspection committees which were formerly tasked with following up on the success of project financed by loans are to be replaced by business hubs (to be established with Norwegian support) which should prepare people for successful projects and help loan recipients to overcome obstacles
• Funds from Ministry of Finance (20-25 billion IQD annually) for loans to 45-55-year-old applicants (8 million per loan) as part of the Poverty Reduction Strategy, with repayment within 8 years
• Social rehabilitation loans (3 million IQD per loan) for people with special needs

67
• Industrial Service Department loans (5 million IQD per project) to revitalise licensed projects.
Presentation of Ministry of Agriculture Department of Guidance (Baghdad)
The Department includes 13 departments for different fields of agriculture (e.g. horticulture and veterinary) and departments for rural youth and rural women. The aim of these departments is to build the capacity of rural families in terms of vocational skills and farming technologies as well as cultural and social development.
The Ministry has 76 training centres. Projects for increasing the livelihood of rural women include:
• Milk and dairy products
• Processing pickles
• Canned and bottled food
• Pastry and sweets
• Handicrafts
• Sewing
• Hairdressing
• Agricultural equipment and maintenance.
In the pilot Sector Council meeting, there was vigorous discussion about the fact that some of these training areas are not specific to agriculture, and overlap with MoLSA areas of responsibility. Ministry of Agriculture has more training centres than MoLSA, and has cultivated close and influential relationships with rural families, so from this perspective they are well placed to offer such training. On the other hand, MoLSA has a specific mandate for vocational training and the existing mandate of MoLSA needs to be extended to offer qualifications and skill sets aligned to the TVET Qualifications Framework (TVQF). Without recognised TVQF outcomes, Ministry of Agriculture trainees will be disadvantaged. It was agreed that co-operation between the two Ministries needs to be strengthened.
5.1.4 Goals of the Informal Sector Council
1. Develop a strategic plan for the informal sector which includes goals, programmes and activities and financial allocation and fully supported by all the implementing parties
2. Establish a comprehensive database for the informal sector in co-ordination with all the relevant governmental institutions, private sector and international organisations
3. Map the labour market of the informal sector in order to categorise and quantify their projects based on the statistics
4. Strengthen the relationship between the relevant government institutions and the informal sector to ensure the revitalisation of the sector and strengthen its contribution to sustainable development and diversification of the economy
5. Provide capacity building programmes to build the capacity of workers in the informal sector and the capacity of the relevant institutions supporting the informal sector
6. Empower women and youth of the informal sector to use innovative technologies and contribute to national production and environmental sustainability

68
7. Raise awareness of the importance of transitioning from the informal sector to formal sector through organising unions and syndicates which consider workers’ rights and affairs, and represent the interests of the informal sector to the government
8. Develop legislation to facilitate the processes transition from the informal to the formal sector, and co-ordinate the tasks of the relevant bodies and institutions
9. Provide financial and/or emotional (moral) incentives to the employers in the informal sector to register their projects in the formal sector
10. Lobby and advocate for job opportunities to be provided by the government.

69
Chapter 6: Recommendations for skills development in the informal sector
6.1 General observations
The informal sector permeates all the economic sectors, so there is no specific field of training. All the conditions for the growth of the informal sector are present in Iraq, so it can be expected to continue to grow in the foreseeable future.
Although informal sector work has low social status and low economic returns, and other disadvantages, it provides livelihood for millions of people in Iraq and KR-I, and it is a stepping stone towards the formal sector. Many businesses start informally and register once they are operating successfully.
Youth with low levels of education, and vulnerable and displaced people are strongly represented in the informal sector. The level of skills training programmes for the informal sector should target young people who have not completed secondary schooling.
Business development programmes are often too costly for large scale roll out, and there is no solid evidence of the efficacy of micro-finance loans for small business development. Business mentoring through business clubs, business hubs, and professional associations, in addition to business incubators offered through broadened services of ministries, may yield better results. New start ups need help to develop and market their products or service sand access new markets.
6.2 Skills supply in relation to demand
Since the informal sector is active in all the economic sectors in Iraq, some recommendations from all the reports in this set of Sector Skills Analysis (SSA) reports are relevant, especially:
• Top jobs in construction include building construction labourer, bricklayers and stonemasons, heavy truck drivers, and carpenters
• Top jobs in hospitality include cooks and waiters and kitchen helpers/cleaners
• Top jobs in agriculture are mostly for livestock workers
• Top jobs in wholesale and retail include shop assistants, cashiers and ticket clerks, vehicle cleaners
• Lower level jobs which appear in the top ten for more than one sector are relevant, e.g.:
o Freight-handlers
o Earth moving machine operators
o Cooks
o Security guards
o Cleaners and kitchen helpers
• Industries which are mostly in private hands are relevant e.g.:
o Food processing
o Mineral products
70
o Rubber and plastic
o Furniture manufacture
o Clothing manufacture.
Very short training courses (less than 6 months) do not develop the skill levels needed for employment. Short courses in employability skills (such as computer skills, business innovation, English language) do not increase the employability of young people except in conjunction with occupations skills needed by the specific sectors. A solid foundation in technical occupational skills is needed as well as a range of modern employability skills.
The UNESCO Office for Iraq, under the TVET Reform Programme, has developed model competency-based training programmes for construction (bricklaying, concrete and carpentry); hospitality (cook and waiter); agriculture (livestock and crops); air-conditioning; electrical installation; and, body & haircare. An additional niche agriculture programme (piloted in Dahuk) is uniquely tailored for informal sector agriculture cottage industries. All of the programmes are at least six months in duration. The programmes are all based on occupational standards and include modern employability skills as well as technical skills for specific occupations.
To address the factors which influence hiring decisions, each UNESCO programme includes preparation for employment, job search skills (including interview behaviour) and work-place based learning. Work-place based learning includes a detailed record of task performed in relation to the learning outcomes, with employer comments, showing evidence of practical experience; and overall evaluation by the employer, which can be used as a reference document.
It is recommended that these benchmarked competency-based programmes are used as a model to develop other artisan training programmes for occupations identified in the eight Sector Skills Analysis (SSA) reports.

71

72
Appendix

73
Appendix 1 Population frame
CSO Business Register (‘Population Frame’)
4-19-5
49-1099-50
499-100999-500
1000 +N
ot Stated Total
01 - Crop and animal production, hunting and related service activities
187,8544,625
77248
250
01,238
194,56203 - Fishing and aquaculture
99030
140
10
09
1,044Subtotal
188,8444,655
78648
260
01,247
195,60610 - M
anufacture of food products13,375
2,965593
4820
32
36617,372
11 - Manufacture of beverages
18292
9511
82
016
40619 - M
anufacture of coke and refined petroleum products
135113
17514
121
027
47720 - M
anufacture of chemicals and chem
ical products476
135102
37
03
56782
21 - Manufacture of basic pharm
aceutical products and pharmaceutical preparations
804
124
30
24
10922 - M
anufacture of rubber and plastics products1,011
18571
22
32
371,313
23 - Manufacture of other non-m
etallic mineral products
4,5152,719
1,480124
369
9142
9,03424 - M
anufacture of basic metals
1,144111
234
10
237
1,32225 - M
anufacture of fabricated metal products, except m
achinery and equipment
29,7351,227
18712
40
0226
31,39126 - M
anufacture of computer, electronic and optical products
34615
82
10
07
37927 - M
anufacture of electrical equipment
31273
343
104
310
44928 - M
anufacture of machinery and equipm
ent512
5539
41
00
10621
32 - Other m
anufacturing708
215
10
00
7742
Subtotal52,531
7,7152,824
232105
2223
94564,397
41 - Construction of buildings2,501
434335
3018
32
973,420
42 - Civil engineering360
86155
2719
54
21677
43 - Specialized construction activities4,049
9677
1410
00
344,280
Subtotal6,910
616567
7147
86
1528,377
45 - Wholesale and retail trade and repair of m
otor vehicles and motorcycles
102,8172,588
41124
100
5612
106,467Subtotal
102,8172,588
41124
100
5612
106,46749 - Land transport and transport via pipelines
952168
14320
162
160
1,36252 - W
arehousing and support activities for transportation59,153
1,414812
10468
510
6,51868,084
53 - Postal and courier activities76
59161
1610
10
7330
Subtotal60,181
1,6411,116
14094
811
6,58569,776
55 - Accomm
odation2,487
524432
4019
10
3273,830
56 - Food and beverage service activities33,504
2,466735
206
11
26136,994
Subtotal35,991
2,9901,167
6025
21
58840,824
61 - Telecomm
unications 3,089
355371
5431
21
413,944
62 - Computer program
ming, consultancy and related activities
25510
40
00
01
27063 - Inform
ation service activities268
6858
73
10
14419
Subtotal3,612
433433
6134
31
564,633
450,88620,638
7,304636
34143
4710,185
490,080
Transportation and Storage
Accomm
odation and Food Service Activities
Information and Com
munication
Total
Type of Economic Activity
No. of Em
ployees
Agriculture, Forestry and Fishing
Manufacturing
Construction
Wholesale and Retail Trade; Repair of
Motor Vehicles and M
otorcycles

74
Appendix 2 Sample frame
Sample frame: 8 governorates, 27 subsectors, 10+ employee-sized firms
Sulaymaniyah
KirkukErbil
DiyalaBaghdad
Wasit
Najaf
BasrahTotal
01 - Crop and animal production, hunting and related service activities
13225
6932
11646
3241
49303 - Fishing and aquaculture
10
10
03
06
11Subtotal
13325
7032
11649
3247
50410 - M
anufacture of food products28
2631
29211
1532
36408
11 - Manufacture of beverages
89
55
332
54
7119 - M
anufacture of coke and refined petroleum products
2112
1413
1610
418
10820 - M
anufacture of chemicals and chem
ical products3
54
053
54
781
21 - Manufacture of basic pharm
aceutical products and pharmaceutical preparations
00
11
130
00
1522 - M
anufacture of rubber and plastics products9
614
018
03
555
23 - Manufacture of other non-m
etallic mineral products
10173
5294
30047
9743
80724 - M
anufacture of basic metals
12
00
130
14
2125 - M
anufacture of fabricated metal products, except m
achinery and equipment
238
213
623
119
14026 - M
anufacture of computer, electronic and optical products
01
10
21
10
627 - M
anufacture of electrical equipment
22
07
260
13
4128 - M
anufacture of machinery and equipm
ent4
25
19
21
327
32 - Other m
anufacturing0
01
02
00
14
Subtotal200
146149
153758
85160
1331,784
41 - Construction of buildings42
832
991
1816
48264
42 - Civil engineering26
1218
628
76
18121
43 - Specialized construction activities25
16
016
39
1272
Subtotal93
2156
15135
2831
78457
45 - Wholesale and retail trade and repair of m
otor vehicles and motorcycles
3913
509
14011
1729
308Subtotal
3913
509
14011
1729
30849 - Land transport and transport via pipelines
1013
113
503
622
11852 - W
arehousing and support activities for transportation94
2953
29290
2828
88639
53 - Postal and courier activities16
417
1334
69
13112
Subtotal120
4681
45374
3743
123869
55 - Accomm
odation52
1285
9108
1340
27346
56 - Food and beverage service activities73
2673
10196
2423
41466
Subtotal125
38158
19304
3763
68812
61 - Telecomm
unications 37
2144
16120
1813
32301
62 - Computer program
ming, consultancy and related activities
00
00
10
02
363 - Inform
ation service activities12
212
613
02
653
Subtotal49
2356
22134
1815
40357
759312
620295
1,961265
361518
5,091
Governorate
Agriculture, Forestry and Fishing
Manufacturing
Construction
Wholesale and Retail Trade; Repair of
Motor Vehicles and M
otorcycles
Transportation and Storage
Accomm
odation and Food Service Activities
Information and Com
munication
Total
Type of Economic Activity

75
Appendix 3 Target sample size
Target sample size: 8 governorates, 27 subsectors, 10+ employee-sized firms
Sulaymaniyah
KirkukErbil
DiyalaBaghdad
Wasit
Najaf
BasrahTotal
01 - Crop and animal production, hunting and related service activities
10425
6232
9444
3239
43203 - Fishing and aquaculture
10
10
03
06
11Subtotal
10525
6332
9447
3245
44310 - M
anufacture of food products28
2631
29144
1532
35340
11 - Manufacture of beverages
89
55
322
54
7019 - M
anufacture of coke and refined petroleum products
2112
1413
1610
418
10820 - M
anufacture of chemicals and chem
ical products3
54
050
54
778
21 - Manufacture of basic pharm
aceutical products and pharmaceutical preparations
00
11
130
00
1522 - M
anufacture of rubber and plastics products9
614
018
03
555
23 - Manufacture of other non-m
etallic mineral products
8565
4980
17845
8241
62524 - M
anufacture of basic metals
12
00
130
14
2125 - M
anufacture of fabricated metal products, except m
achinery and equipment
238
213
573
119
13526 - M
anufacture of computer, electronic and optical products
01
10
21
10
627 - M
anufacture of electrical equipment
22
07
260
13
4128 - M
anufacture of machinery and equipm
ent4
25
19
21
327
32 - Other m
anufacturing0
01
02
00
14
Subtotal184
138146
139560
83145
1301,525
41 - Construction of buildings40
832
978
1816
45246
42 - Civil engineering26
1218
628
76
18121
43 - Specialized construction activities25
16
016
39
1272
Subtotal91
2156
15122
2831
75439
45 - Wholesale and retail trade and repair of m
otor vehicles and motorcycles
3813
479
10911
1729
273Subtotal
3813
479
10911
1729
27349 - Land transport and transport via pipelines
1013
113
473
622
11552 - W
arehousing and support activities for transportation80
2950
29174
2828
76494
53 - Postal and courier activities16
417
1333
69
13111
Subtotal106
4678
45254
3743
111720
55 - Accomm
odation49
1274
989
1339
27312
56 - Food and beverage service activities65
2665
10137
2423
39389
Subtotal114
38139
19226
3762
66701
61 - Telecomm
unications 36
2142
1697
1813
32275
62 - Computer program
ming, consultancy and related activities
00
00
10
02
363 - Inform
ation service activities12
212
613
02
653
Subtotal48
2354
22111
1815
40331
686304
583281
1,476261
345496
4,432
Transportation and Storage
Accomm
odation and Food Service Activities
Information and Com
munication
Total
Type of Economic Activity
Governorate
Agriculture, Forestry and Fishing
Manufacturing
Construction
Wholesale and Retail Trade; Repair of
Motor Vehicles and M
otorcycles
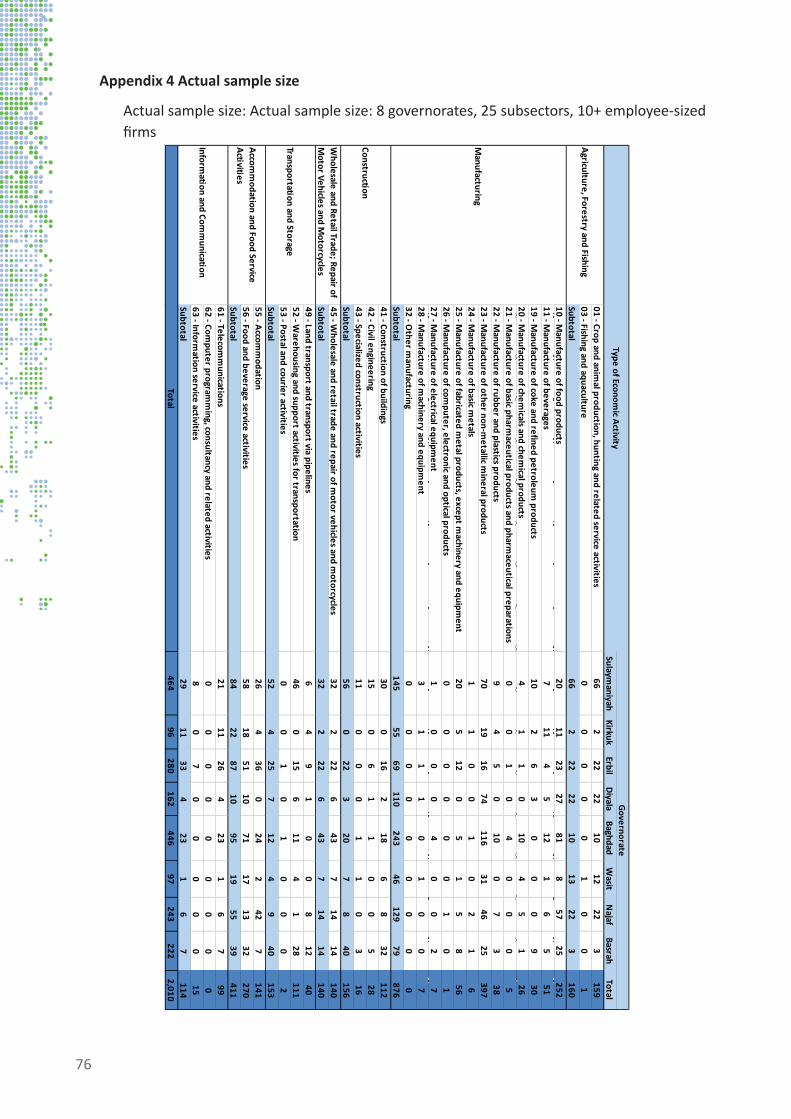
76
Sulaymaniyah
KirkukErbil
DiyalaBaghdad
Wasit
Najaf
BasrahTotal
01 - Crop and animal production, hunting and related service activities
662
2222
1012
223
15903 - Fishing and aquaculture
00
00
01
00
1Subtotal
662
2222
1013
223
16010 - M
anufacture of food products20
1123
2781
857
25252
11 - Manufacture of beverages
711
45
121
65
5119 - M
anufacture of coke and refined petroleum products
102
63
00
09
3020 - M
anufacture of chemicals and chem
ical products4
11
010
45
126
21 - Manufacture of basic pharm
aceutical products and pharmaceutical preparations
00
10
40
00
522 - M
anufacture of rubber and plastics products9
45
010
07
338
23 - Manufacture of other non-m
etallic mineral products
7019
1674
11631
4625
39724 - M
anufacture of basic metals
11
00
10
21
625 - M
anufacture of fabricated metal products, except m
achinery and equipment
205
120
51
58
5626 - M
anufacture of computer, electronic and optical products
00
00
00
10
127 - M
anufacture of electrical equipment
10
00
40
02
728 - M
anufacture of machinery and equipm
ent3
11
10
10
07
32 - Other m
anufacturing0
00
00
00
00
Subtotal145
5569
110243
46129
79876
41 - Construction of buildings30
016
218
68
32112
42 - Civil engineering15
06
11
00
528
43 - Specialized construction activities11
00
01
10
316
Subtotal56
022
320
78
40156
45 - Wholesale and retail trade and repair of m
otor vehicles and motorcycles
322
226
437
1414
140Subtotal
322
226
437
1414
14049 - Land transport and transport via pipelines
64
91
00
812
4052 - W
arehousing and support activities for transportation46
015
611
41
28111
53 - Postal and courier activities0
01
01
00
02
Subtotal52
425
712
49
40153
55 - Accomm
odation26
436
024
242
7141
56 - Food and beverage service activities58
1851
1071
1713
32270
Subtotal84
2287
1095
1955
39411
61 - Telecomm
unications 21
1126
423
16
799
62 - Computer program
ming, consultancy and related activities
00
00
00
00
063 - Inform
ation service activities8
07
00
00
015
Subtotal29
1133
423
16
7114
46496
280162
44697
243222
2,010
Transportation and Storage
Accomm
odation and Food Service Activities
Information and Com
munication
Total
Type of Economic Activity
Governorate
Agriculture, Forestry and Fishing
Manufacturing
Construction
Wholesale and Retail Trade; Repair of
Motor Vehicles and M
otorcycles
Appendix 4 Actual sample size
Actual sample size: Actual sample size: 8 governorates, 25 subsectors, 10+ employee-sized firms

77