informal networks and white collar crime: an - cornell university
TRANSCRIPT

Informal Networks and White Collar Crime: An Extended Analysis of the Madoff Scandal
Michael Shores Department of Policy Analysis & Management
Cornell University Ithaca, NY 14850
email: [email protected] May 2010

2
ACKNOWLEDGEMENTS
I would like to thank Emily Owens for her continued guidance, support and mentorship in this process. I
thank Robert Apel, Shawn Bushway, Benjamin Cornwell, Matthew Freedman, Sarah Pearlman, Sharon
Sassler, and John Wallis for helpful feedback. Also, I also thank Phomika Palmer for assistance with the
NCCS data web. All errors are my own.

3
Table of Contents PAGE
INTRODUCTION..............................................................................................................5
THE MADOFF SCANDAL ..............................................................................................9
LITERATURE REVIEW ...............................................................................................11
DATA ................................................................................................................................22
ANALYTIC FRAMEWORK .........................................................................................26
RESULTS .........................................................................................................................31
JEWISH NETWORKS & THE PROBABILITY OF VICTIMIZATION .....................31
JEWISH NETWORKS & THE QUANTITY OF VICTIMIZATION ..........................37 CONCLUSION ................................................................................................................43
REFERENCES .................................................................................................................46
APPENDIX .......................................................................................................................53

4
ABSTRACT
Understanding the nature of white collar crime is a central issue in public policy.
Testing the theories presented by Benson, Madensen and Eck (2009), I examine the role
of informal religious networks in the criminal activity of Bernard Madoff, perpetrator of
one of the largest white collar crimes in United States history. In contrast to previous
studies that suggest that religion may reduce the incidence of criminal behavior, I show
that the opposite can also be true. Most white collar crimes, like those perpetrated by
Madoff, are exploitations of trust, which can be fostered by a shared religious identity
between the victim and perpetrator. Using data from the National Center of Charitable
Statistics, I construct two measures of Jewish religious network strength at the county
level: the concentration of Jewish non-profit organizations and the revenue of Jewish
non-profit organizations. Additionally, using data from the Jewish Community Center
Association of North America and several U.S. Kosher certification organizations, I
construct the number of Jewish community centers and the number of kosher restaurants
per county. I show that conditional on the number of high income individuals in a
county, residents of counties in which there were stronger Jewish networks were more
likely to have been victimized by Madoff. In addition, I show that residents of areas
where Madoff lived or worked were more likely to be victims, but that Jewish network
strength appears to counteract this “distance effect.” Non-profit organizations, which
were also victims of Madoff, were less affected by the strength of this informal network.

5
I. INTRODUCTION Social networks have long been considered important sources of jobs, information
and assistance. Social networks form through individuals linked by a common bond,
social status, geographic or cultural connection. Social networking websites like
Facebook, MySpace, and LinkedIn have exploded in recent years, with companies even
using these websites to research and recruit potential employees. Additionally,
celebrities often suggest that to achieve fame, individuals must explore social groups and
settings in order to build the necessary relationships. Many books even suggest that if
you want to get anywhere in life, you need to connect with people.
Substantial research has shown that there are real benefits of social networks.
Membership in social networks may provide substantial physical and mental health
benefits (Maulik, Eaton & Bradshaw, 2009; Smith & Nicholas, 2008). Trusting
relationships and tight knit bonds often form from members’ shared common interests or
characteristics (Karlan, Mobius, Rosenblat, & Szeidl, 2009). It is likely that these
relationships may foster non-pecuniary benefits, such as increased friendship and
companionship. However, this same sense of trust may lead network members to take
greater within-network financial and business risks (Light & Rosenstein, 1995). In
sociological theory, these risks have been termed “generalized exchanges,” or
transactions between two individuals in which one participant provides a good to the
other without any immediate return, purely based on the trust they place in the other party
(Bearman, 1997). One typical example is a susu, in which ethnic West Indians, Africans,
Mexicans and Asians pool an amount of money with others from their ethnic-social
network and rotate the recipient of a fixed amount on a monthly basis (Halter, 1995).

6
The existence of susus could imply that members trust each other as much or more than
they trust federally regulated and insured banks where they could easily deposit their
money.
However, the potential for these networks to be abused is often not considered.
Social networks can also be used to promote illegal markets, such as drug (Reuter &
Calkuins, 2004) and under-the-table employment markets (Venkatesh, 2006), which
would ordinarily fail due to the prohibitively high costs and risks associated with their
existence. Social networks have also been used to collude in the heavy electrical
equipment industry (Baker & Faulkner, 1993) and to shelter fraud in companies with both
legal and illegal operations (Baker & Faulkner, 2003). These markets thrive based on
members’ beliefs that fellow members would not hurt “their own.” Excessive trust can
leave members of these social networks open to theft, fraud and deceit.
White-collar crime is commonly described as an abuse of trust (Schover, 1998).
Unlike victims of street crime, many victims of white-collar crime do not know that they
are victims until after the crime has occurred, if even then. As Levi (2009) highlights,
white collar crime is typically committed by known individuals, whereas the public
typically thinks of criminals as strangers. Thus, individuals may be at a particularly high
risk for white collar crime victimization as they are not as skeptical of the offender. The
elimination of the “necessary link of geographic propinquity between victim and
offender” means that the criminal could be across the country or in one’s own
neighborhood (Levi, 2009). Though white-collar crime is commonly associated with the
banking industry, white-collar crime has pervaded a variety of industries, including auto
repair (Schneider, 2009), real estate (Levitt & Syverson, 2008), newspaper sales

7
(Pruckner & Sausgruber, 2008), food sales (Levitt, 2006) and sumo wrestling (Duggan &
Levitt, 2002). The costs of these crimes often cannot be calculated because of the
“invisible” nature of white-collar crime and the difficulty in compiling data on discovered
offenses. However, in the wake of Tyco, Enron and now the Madoff scandal, the public
outcry suggests that people are heavily affected by these offenses.
White collar crime poses a particular issue for government policy because a
deterrent white-collar crime cannot be effectively developed without being able to
measure the causes and effects of white-collar crime. Survey data has consistently shown
for over two decades that the public views white collar crime almost as serious an offense
as traditional street crime (Evans et al. 1993; Levi, 1987). The social harm caused by
white-collar crime may be far more damaging than the social harm caused by street
crime. White collar crime can erode the public’s trust in institutions and increases
transaction costs as people become increasingly suspicious of others and require
excessive amounts of information for economic transactions (Levi, 2009; Shleifer &
Vishny, 1993). In fact, as Levi (2009) highlights, the increases in transaction costs can
be so large that they merit heavy consideration in the cost-benefit analysis of crime
control policies. Moreover, unlike street crime, where victims typically know ways to
protect themselves either privately (e.g. installing a home security system) or publicly
(e.g. voting for officials who want to increase police presence), little is known about
methods of protection from white-collar crime.
To contribute to this newly emergent field, I attempt to disentangle the effect of
religious network strength on white-collar crime victimization. Unlike other research
which exploits variation in the regulatory environment to identify the incidence of
8
victimization (Duggan and Levitt, 2002; DellaVigna & Ferrara, 2007) or creates
experimental situations that artificially manipulate victimization (Pruckner & Sausgruber,
2008; Schneider, 2009), my research uses the universe of known victims in the Bernard
Madoff Ponzi Scheme. This difference in datasets and measurement allows me to
measure the average white-collar crime (opposed to the marginal crime). As I will later
discuss, this difference will allow for more precise victimization measurement and
resultant crime policy. This study will explore the allegation that Bernard Madoff used
his membership in the Jewish American enclave to defraud investors and will examine
the extent to which social networks facilitate white-collar crime and.
The paper proceeds as follows. I begin with a short description of the Madoff
scandal in section II. I then describe the history of social networking theory, why Jewish-
Americans can be considered a social network, the role that informal networks can play
in investment behavior, and how individuals in those networks can be at increased risk of
white collar crime victimization. In section IV, I describe the data that I use to measure
white collar crime and informal religious network strength, and in section V present my
analytic strategy for identifying the relationship between these variables. Next, I discuss
my empirical results in section VI and finally conclude in section VII.
9
II. THE MADOFF SCANDAL
Bernard Madoff founded Bernard L. Madoff Investment Securities LLC (hereafter
Madoff LLC) in 1960. Although initially investors’ returns were ordinary relative to the
market, between the mid 1980s and early 1990s, returns began to sky rocket. Madoff
became known for double-digit returns on investments (typically around 12-15%). His
guarantee of high returns attracted high-wealth individuals and organizations alike from
across the country including major non-profits, unions and multimillionaires. However,
unbeknownst to investors, these high returns were actually assets of subsequent investors.
The investors were victims of the largest Ponzi Scheme in US history.
Even without the benefit of hindsight, choosing to invest in Madoff was a high-
risk choice. Madoff was exempt from certain SEC regulation. News reports and the SEC
itself have suggested that Madoff played a prominent role in creating an exemption,
which permitted him to temporarily sell stock that he did not own as long as the purpose
was to “maintain liquidity” (Wutkowski, 2008). Additionally, Madoff used many “feeder
funds,” which allowed him to officially report far fewer individual investors than existed
(Chew, 2009). Therefore, Madoff faced far less daily scrutiny than did the average
investment firm (Krug, 2008).
Additionally, the SEC’s Inspector General found that between 1992 and 2008, the
SEC ignored six substantive complaints against Madoff (Stout, 2009). For example, in
May 2000 Harry Markopolos, a Massachusetts-based financial analyst, sent a letter to the
SEC urging an investigation of Madoff LLC, which he believed was a Ponzi scheme.1
1 The media suggests Madoff may have been able to escape SEC investigation in spite of Markopolos’ allegations because Madoff had built a tight, trusted social network with SEC employees (Zuckerman & Scannell, 2008). It should be noted that a recent report issued by the SEC Inspector General found no

10
Nonetheless, the SEC failed to take any action. Despite such evasion, on December 11,
2008, Madoff confessed that he had been running a Ponzi scheme. In subsequent
months, Madoff plead guilty to 11 counts of filing false reports with the SEC; theft; and
securities, wire, and mail fraud. Ultimately, Madoff paid an undisclosed fine to the SEC,
was banned from working in the financial sector and received a 150-year term prison
sentence.
Besides taking money from many of the socially elite, it has been widely
suggested that Madoff preyed in particular on fellow members of his Jewish-American
social network (Fox News, 2009). Reports often cite his wife’s Kosher cookbook
(Cowan, 2009), his purported strict adherence to Jewish practices (Cowan, 2009), and his
involvement in Jewish organizations like Yeshiva University (Chiber, 2009) as examples
of how Madoff built trust within the Jewish-American network.2 As a result of the
Madoff scheme, some researchers have even called for charitable foundations to alter the
size and structure of their operations in order to decrease their reliance on “personal ties”
(Jagpal & Craig, 2009).
substantial relationship between Madoff and SEC Chairman Mary Schapiro, who formerly headed the Financial Industry Regulatory Authority (Associated Press, 2009). 2 Although unverified, rumors have spread that Madoff had an affinity for pork sausage, which suggests he may have not been as religious as he suggested, since this would clearly violate the same laws of Kashrut that he and his wife swore they upheld.

11
III. LITERATURE REVIEW
A. The History of Social Networks Research
Social networks are associations of people drawn together by family, work,
hobbies, ethnicity or other defining characteristics. Early social network research is
traced to Compte’s examination of static (social interconnections) relationships in the
mid-nineteenth century (Freeman, 2004). Durkheim also pioneered the field with his
1897 cornerstone work, Suicide: A Study in Sociology, In his theory of norms of social
control, Durkheim asserted that religious groups exert an informal control over their
constituents. This sense of control and belonging to a community, Durkheim argued led
to regulation in excessive aspects of one’s life. Without such control, individuals would
feel anomie (i.e., alienation and a lack of purpose). This theory suggests that religious
social networks may have positive social effects by reducing excessive behavior, which
would in turn promote rational actions.
Building on Durkheim’s fundamentals, later social theorists continued to extend
social network theory research. Tönnies (1935) characterized social groups using his
theories of Gemeinschaft and Gesellschaft. Gemeinschaft, as defined by Tönnies,
explains bonding between friends and families; he argues that these relationships are
based upon emotional bonding and unity. On the other hand, Gesellschaft promoted the
continuation of impersonal social relationships based on individuals needs to fulfill
certain fundamental monetary needs (Tönnies, 1935). Barnes’ (1954) seminal piece on
social relationships in a small Norwegian village explicitly defined social networks for
the first time as “an association of people drawn together by family, work or hobby.”
This term was later expanded by a series of researchers to include all social categories

12
(e.g. race, gender, ethnicity) and fixed-relationship categories (e.g. family and tribes)
(Berkowitz, 1982).
Although there are many metrics for social network strength, one defining feature
of social networks is the strength of the tie. Two common distinctions are strong ties and
weak ties. Strong ties, as defined by Sir Hebert Spencer and Chalres Horten Cooley in
the early twentieth century are connections mainly characterized by primary relationships
(Freeman, 2004; Granovetter, 1973). Primary relationships are often warmer, closer
relationships such as friends, family and lovers (Gordon, 1964). These strong ties may
lead to more trusting bonds (Coleman, 1988). Weak ties, in contrast, are associated with,
among other things, secondary relationships, lower frequencies of contact, lower duration
of the tie, less emotional closeness (Granovetter, 1973). Gordon (1964) identifies these
bonds as looser links, often constructed through employment, civic engagement (e.g.
social clubs) and political activism. Granovetter (1973) suggested that weak ties allowed
individuals who barely knew each other to associate through sharing a common belief or
characteristic. Moreover, he suggested that strong ties could not develop without
preexisting weak ties.
Centrality, the measurement of individuals’ position in a social network, is also
important in measuring social networks. Centrality can be measured in terms of the
number of connections an individual has (degree centrality), the number of individuals
between two unconnected individuals (betweeness centrality), and the social distance
between individuals in a network (closeness centrality) (Hanneman & Riddle, 2005).
Research has associated increased centrality with increased power and influence in a
social network (Brass, 1984; Friedkin, 1993). Additionally, Burt (1992) argues that being

13
at the center of many disconnected people is critical to holding group power. By being in
contact with many otherwise disorganized people, this coordinating person can more
easily manipulate the group and prevent others within the group from colluding against
you. Such power may even provide the coordinating individual the exclusive power to
direct the flow of resources between individuals (Burt, 1992).
B. The Formation of the American Jewish Social Network
The existence of Judaism as an ethnicity demonstrates the existence of a Jewish
American social network. Ethnicity is a socially defined concept based on cultural
characteristics: language, religion, history, appearance, ancestry and/or region (Nagel,
1994). Under this definition, Jewish Americans are an ethnic group: they share a
common religion, religious language and history composed of stories of events, a
homeland and oppression. Moreover, many Jewish Americans’ share a common heritage
as many of their ancestors immigrated from Central and Eastern Europe (Diner, 2004).
Additionally, there are many population clusters of Jewish Americans in particular cities
throughout the United States, such as New York City, Miami and Los Angeles (American
Jewish Committee, 2007). As defined by Berkowitz (1982), the existence of such a clear
ethnic community would prove the existence of a Jewish American social network.
Historical and continued persecution of American Jews has strengthened the
Jewish American culture. Discrimination against Jews is widely traced back to the
seventeenth century. During the early 1900s, following a sizeable increase in the Jewish-
American community, large groups of Jewish American immigrants were victims of
discrimination (Tobin & Sassler, 1988). Starting in the late nineteenth century, cities
began to implement restrictive zoning, which overtly banned Jews from living in certain

14
neighborhoods. While the Supreme Court banned these zoning restrictions, developers
quickly turned to restrictive deed covenants in order to circumvent the federal ban. The
Supreme Court’s support of these covenants in Corrigan v. Buckley (1926) has been
considered a serious promoter of widespread segregation in suburbia (Jones-Correa,
2000/2001). For example, in Baltimore, developers advertised developments that
“safeguard owners from…uses of property detrimental to the value and general good of a
residential section” (Power, 1996). While the 1926 ruling was overturned in 1948, a
considerable amount of segregation already existed (Jones-Correa, 2000/2001).
To overcome this discrimination, Jews bound together as a “middleman
minority.” Middlemen minorities, such as American Jews, are minority groups that take
an intermediate status position between consumers and producers, typically in trade and
commerce markets. For example, many Jews in New York City at the turn of the
twentieth century lived and worked together in trade in order to save money (Sowell,
2005) and Palestinian-Arabs are often found to be middlemen in the grocery store
business in cities where they reside (Cohen & Tyree, 1994). Bonacich (1973) argues that
the continued hostility from the host society (i.e., Christian America) alienates American
Jews, and in turn, reinforces a sentiment of Jewish American organization and structure.
This increased Jewish American structure feeds increased host hostility. Ultimately, this
cycle promotes and continues Jewish American enclaves and social networks (Bonacich,
1973). This theory is also consistent with Burt’s (1992) argument that the being the
connector in a group holds the most power. In the case of middlemen minorities, such as
Jewish Americans, they were able to connect consumers and producers while maintaining
significant market power.

15
Although most Jewish Americans currently easily coexist with other Americans in
residential, marital and occupation settings, anti-Semitism remains a source of concern in
the United States. A 2007 survey found that 15% of the general population reported
holding strong anti-Semitic views (Anti-Defamation League, 2007). Additionally,
approximately 70% of all religious hate crimes committed in 2007 were against Jews
(Gimpson, 2008). Such discrimination may encourage the formation of weak ties
amongst the Jewish community by bonding over their historical and modern inequity.
According to the theory of homophily, individuals of similar attributes are more likely to
connect with each other (McPherson, Smith-Lovin & Cook, 2001). Mehra, Kildruff &
Brass (1998) provide support for this theory in finding that individuals of racial and
gender minority groups were more likely to form social bonds with similar individuals in
both a work and academic context. Such network formation was highly attributed to
individual preferences for friends with common backgrounds and exclusionary practices
by majority group members. Bernard Madoff provides an excellent example of a
minority who surrounded himself with others of a similar background. Madoff was a
child of the 1940s, when private organizations like schools, country clubs and
neighborhoods discriminated more heavily against Jews. Madoff was likely unable to
expand his social network as a child, only furthering his propensity to build notably
stronger networks with other Jewish Americans. Later, Madoff became a member of the
Board of Trustees for Yeshiva University, was heavily involved in Jewish non-profit
work and professed his devotion to Jewish religious circles (Chibber, 2009).
C. The Effects of Distance on Social Network Strength

16
Historically, social distance has been widely accepted as a feature of social
networks. Social distance was first introduced in Simmel’s analysis of “the stranger,” in
which he argues that there is an optimal distance for individuals to keep between
themselves and acquaintances (Simmel, 1950). The definition has been refined and now
often refers to the similarity of individuals based on demographic characteristics (Poole,
1927). Most commonly known, however, is Bogardus’ Social Distance Scale, which asks
questions related to willingness to participate in different social activities with other
individuals such as being neighbors, marrying and working together. Scores from this
scale can be summed and used to calculate how individuals perceive other groups and
how willing these individuals are to interact with differing groups (Bogardus, 1926).
Important characteristics of social distance include race, ethnicity, economic resources,
social background and gender.
Closeness centrality, or social distance, likewise has been found to contribute to
the strength of social networking. Hipp & Perrin (2009) find that as social distance
between individuals in a neighborhoods increases, the likelihood of strong or weak ties
forming significantly decreases. Research has also suggested that individuals minimize
interaction with more distant individuals because there is a direct relationship between
physical distance and costs of maintaining ties, ceteris paribus (Zipf, 1949). While the
costs of maintaining ties may be decreasing with the growing ability of technology to
connect individuals, this relationship still seems to hold, as an equivalent decrease in
network ties is equal to either a 10% change in the social distance or a 5.6% increase in
physical distance (Hipp & Perrin, 2009). This is consistent with the observed spatial
distribution of Madoff victims. Specifically, the most physically distant counties from

17
Madoff’s homes and office have many fewer Madoff investors, presumably due to the
lack of social ties and social similarity to Madoff. Therefore, the presence of any Madoff
victims in a distant area might suggest the presence of developed networks through which
information and (misplaced) trust in Madoff could spread rapidly.
The homophily principle states that the flow of information between individuals is a
declining function of social distance (McPherson & Ranger-Moore, 1991). Essentially,
this suggests that as social distance increases (i.e., people become increasingly
dissimilar), people are less likely to interact and exchange information. Homophily has
been demonstrated in racial diversity of school friendships (Quillian and Campbell, 2003;
Mouw and Entwisle, 2006), gender grouping in volunteer organizations (McPherson &
Smith-Lovin, 1987) and interracial professional relations at work (Bacharach, Bamberger
& Vashdi, 2005). Lazersfeld & Merton (1954) even distinguished homophily effects
based on individual’s social status (occupation or group membership) and social values,
important abstract standards that dictate decision making (individualism or aggression).
Social networks may provide an opportunity for offenders to interact with victims (Eck &
Clarke, 2003). Ultimately, social distance between offender and victim may be a
significant factor in determining likelihood of white collar victimization (Benson,
Madensen & Eck, 2009).
The effect of propinquity, physical distance, on social network strength is
extremely important when considering Madoff’s potential abuse of a social network.
Caplow and Forman (1950) showed that married couples in college dorms were more
likely to befriend other couples who were more physically proximate. Similarly,
Festinger, Schacter and Back (1950) demonstrated the same relationship by studying

18
friendships in apartment buildings. Individuals were most likely to be friends with their
neighbors and least likely to be friends with people on different floors of the building
(Festinger et al., 1950). This implies that areas with high concentrations of Jewish
Americans may have been particularly vulnerable to Madoff because word of Madoff
would have spread more quickly in these densely Jewish areas and individuals may have
been more likely to follow their peers’ suggestions to invest with Madoff.
Within criminological theory, physical proximity is related to the frequency of
street crimes in both crime pattern theory and situational crime prevention theory.
According to crime pattern theory, crimes are more likely to be committed in locations
that are familiar to the offender. For example, an analysis of robberies in Chicago
illustrates that robbers were more likely to travel further to an area that was similar to
their own neighborhood rather than rob an individual that was physically closer but
demographically different (Brantingham & Brantingham, 1991). Situational crime
prevention theory, on the other hand, suggests that an increase in physical distance acts as
a deterrent to commit a crime. Empirically, physical proximity to offenders is a positive
predictor of street crime (Capone & Nichols 1976; Bernasco & Block, 2009). Again, this
trend is consistent with Madoff data as the counties with highest victim rates are
relatively close to Madoff’s homes.
D. The Effects of Networks on Trust
Both strong and weak social network ties have a direct impact of trust. Several
studies have found that within businesses, weak ties and the ability to bridge networks are
incredibly important in allowing Directors and Officers to influence decisions and shape
policies in large, public companies (Burt, 2005; Coleman 1988). However, research

19
examining board members of private companies, similar in size to Madoff’s firm, suggest
that strong ties are also critical to building trusting relationships within a network
(Stevenson & Radin, 2009). Moreover, Berardo (2009) examined 22 communities across
the nation and has suggested that network centrality greatly improves trust within a
network. He finds that groups with increased centrality have more trusting relationships.
Trusting relationships may lead individuals or firms to perform repeat transactions with
the same individual/firm because the trusting relationship will lower transaction costs so
significantly that this option becomes the most efficient solution (Granovetter, 1985),
These findings have also been generalized to community relationships and friendships
(Karlan et al., 2009). Therefore, one might expect Jewish Americans to have some trust
for other Jewish Americans through weak ties; the existence of strong ties within local
Jewish communities would reinforce preexisting weak-tie trust. As I will discuss in
further detail, this trust may have lead to less monitoring by investors, allowing Madoff
to escape undetected until his collapse.
The propagation of trust through social networks has serious consequences on
individuals’ sources of information and outcome perspectives. The problems associated
with decision-making are commonly divided into two categories: questions of uncertainty
(i.e., a lack of sufficient information on how to do something) and questions of ambiguity
(i.e., sufficient information but the decision is difficult) (Saint Charles & Mongeau,
2009). Saint Charles & Mongeau (2009) find that individuals dealing with questions of
uncertainty often turn toward perceived experts in the field with whom they often share
weak ties. However, people rely on friends and family (strong ties) for questions of
ambiguity. Additionally, individuals who are only distantly connected to a subject tend

20
to have unrealistically positive views (Smith-Doerr, Manev & Rizova, 2004). In the
context of the Madoff Scheme, individuals who were unsure of where to invest their
money (a question of uncertainty) may have acted on the advice of experts within their
social network and overvalued the quality of Madoff’s work. This could have lead to
reduced efforts exerted by investors in monitoring the performance of their assets.
Moreover, if individuals were unsure of how much to invest (a question of ambiguity),
they likely would have consulted their friends. By consulting other Jewish Americans on
both with whom to invest and how much to invest, Jewish individuals may have suffered
particularly heavily.
E. White-collar Crime & Religion
The fact that the network I explore is religiously based warrants further
discussion. Studies have demonstrated in experimental settings that appealing to
potential criminals’ sense of religion or morality significantly decreases individuals’
propensity to commit crime (Pruckner & Sausgruber, 2008). Levitt (2006) reaffirmed
this finding through an investigation of crime and changes in public opinion.
Interestingly, an appeal to moral codes (e.g. religion) seems to be more effective at
deterring crime than threats of reputation costs (Schneider, 2009), formal legal penalties
(Pruckner & Sausgruber, 2008), and the probability of being caught (Levitt, 2006). In
order for crimes of trust to occur, the victim must have some reason to believe the
offender is acting in good faith. Because a shared social network can promote trust
between the offender and the victim, the strength of both weak and strong ties may
increase the likelihood of white-collar crime. The net effect of Jewish network strength

21
on Madoff victimization is therefore theoretically unclear and thus warrants further
investigation.

22
III. DATA
A. Dataset Description To construct a measure of Jewish network strength, I rely on a series of pre-
constructed datasets. The first measure of Jewish network strength is the Urban
Institute’s National Center for Charitable Statistics’ count of religious non-profit
organizations per county. The data, created from organizations’ 990 tax returns, include
the total number of organizations in each county, the total revenue of religious non-
profits in a county, the total assets of religious nonprofits in a county, the religious
affiliation of each non-profit and total donations made by religious non-profits in a
county. These data are separately provided for Jewish organizations as well. Because
religious organizations are not required to file a Form 990 with the Internal Revenue
Service, some counties may have an undercount of the number of Jewish nonprofits.
Similarly, because tax laws of particular states and counties may be correlated with these
non-profit measures as well as the number of Madoff investors, there is a potential for
bias in my estimates.
To generate my dependent variables, I use data from a list of 13,563 individual
Madoff victims that was generated by the SIPC, court-appointed attorney and trustee of
Madoff LLC’s remaining holdings.3 This list contains individuals’ names and addresses.
It should be noted that there were some duplicates in this list; however, media outlets
such as the Wall Street Journal and the Associated Press have speculated that this is
because some individuals had multiple accounts over time, and not that these repeated
listings were due to error (Wall Street Journal, 2009). I include all duplicates reasoning
3 Data from the Uniform Crime Report cannot be used because it does not measure white-collar crime (Federal Bureau of Investigation, 2005). Similarly, the National Crime Victimization Survey is of little use as most victims of white-collar crime do not know they are a victim to such crime.
23
that any miscounts are classical measurement error in the dependent variable. My
dependent variable related to non-profit organizations comes from a complete list of all
148 non-profit organizations that used Madoff LLC as their investment manager. In this
list, generated by a consultant to the New York Times, each non-profit organization is
listed along with its business address, total assets, total revenue, and the amount invested
in Madoff LLC as of the most recently completed IRS Form 990 filing. From these two
data sources, I can create my dependent measures: 1) a binary measure for the presence
of any Madoff victims in a county, 2) a count of individual Madoff victims per county
and 3) a count of non-profit Madoff victims per county.
To address these issues, I include two additional measures of Jewish network
strength that are likely unaffected by tax regulations. The second source of network
measurement is the number of Kosher restaurants and catering halls in a county. I argue
that the number of Kosher eating establishments is positively correlated with the size of a
Jewish social network. The database I used was maintained by Hebrew College,
supplemented by a series of nationally recognized Kosher-certification organizations (e.g.
Star-K) and was current as of July 2009. I find that the number of kosher restaurants per
county is highly correlated with the number of Jewish religious non-profits (ρ=0.74) and
the revenue of those non-profits (ρ=0.75). However, the correlation between kosher
restaurants and religious non-profits generally is weaker, with ρ equal to 0.65 and 0.46
respectively. Lastly, I include the number of the Jewish Community Centers and Young
Men’s Hebrew Associations in each county. These data come from the national JCC

24
Association and were current as of July 2009.4 The correlation between the number of
JCCs per county and the number of kosher restaurants is relatively strong (ρ=.67). While
the number of JCCs per county is highly correlated with the number of religious
organizations per county (ρ=.70), it is more weakly correlated with the per-county
number of Jewish religious organizations (ρ=.48), the revenue of those Jewish nonprofits
(ρ=.48) religious profits as a whole (ρ=.45). These correlations suggest that the number
of JCCs may be a measure of another aspect of the Jewish social network, as they are at
least not linearly related to the number or strength of Jewish nonprofit organizations yet
clearly are a part of the Jewish social network.
Since one would reasonably expect that Madoff victims were more likely to be in
wealthier and physically closer areas, it is important to control for such effects. While
annual Census Bureau estimates of the number of impoverished households per county
are easily accessible, the same is not true for estimates of the number wealthy
households. To overcome this obstacle, I estimate cross-sectional variation in high
income through the number of doctors per county in 2007 and the number of households
over grossing over $200k annually in the year 2000.5 The county level measures are
taken from the Department of Health and Human Services’ Health Resources Survey and
the 2000 Decennial Census provide these data, respectively. Although clearly neither
estimate is a perfect measure of high-income individuals in 2007, examining the
sensitivity of my results to either definition will help quantify the magnitude of the
4 Attempts to incorporate Jewish population estimates were unsuccessful as the U.S. Census does not ask for individuals to identify their religion and estimates from the American Jewish Committee’s American Jewish Year Book were at varying and inconsistent geographic levels. 5 In 2000, the correlation between the number of doctors and the number of households with over $200K in income was over 0.9.

25
measurement error. Population and income measures are from the U.S. Census and the
Bureau of Labor Statistics. To calculate the physical distance of potential victims from
Madoff, I use geographic population weighted county centroids as calculated by the US
Census Bureau. Centroid calculations are based upon information from the 2000 Census.
I use Vincenty’s formula to calculate these distances.6
B. Descriptive Statistics
While not taking into account the effects of wealth, descriptive statistics related to
the geographic distribution of Madoff victims and the frequency and sizes of the various
proxies for Jewish American social network strength are informative (Table 2). Quite
noticeably, there were very few counties with Madoff victims (N=308) (Figure 1).
Moreover, the 148 non-profit victims were limited to only 41 counties. As depicted in
Figure 1, victims were particularly concentrated in the New York City, NY; Palm Beach,
FL and Denver, CO metropolitan areas (Figure 2). On average, counties with any
Madoff investors had significantly more victims (33.9) than the national average (3.33).
The counties with Madoff victims help also contained 0.6 Jewish nonprofit organizations,
on average. These same counties had Jewish organizations that grossed larger revenue
and more religious organizations overall. Madoff-affected counties averaged 5.7 kosher
restaurants, and 0.57 JCCs or YMHAs. All of these statistics are significantly different
from the means of these variables for unaffected counties. The large number of zero-
victim counties, however, necessitates cautious economic modeling.
6Vincenty’s formula, which accounts for the oblate spheroid shape of Earth, is commonly used as it has been proven to be the most accurate compared to other methods. Calculations are accurate to 0.005mm.

26
IV. ANALYTIC STRATEGY:
Approximately 90% of all US counties had no Madoff victims. Meanwhile, 2.7%
of counties had one victim and 2.6% of counties had 11 or more victims, with an average
of 116 victims per county. Due to this skewed distribution of victimization, I am
interested in measuring factors that increased the probability of a county having any
victims as well as what factors increased the total number of victims per county. I first
estimate the importance of Jewish networks using a standard logit model that relates the
extensive margin, or the probability of there being any Madoff victims in county c, to a
set of demographic characteristics Xc, the strength of Jewish networks in that county
Religionc, the number of kosher restaurants in a county Kosherc and the existence of a
Jewish Community Center JCCc as follows:
(1) ( ) ( )[ ]
( )[ ] 1JCC'Kosher'Religion'Distance'exp1
*JCC'Kosher'Religion'Distance'exp−+++++
++++=
ccccc
cccccc
X
XAnyVictimsP
τρθκγ
τρθκγ
I model the number of victims (i.e., the intensive margin) in a given county using
a series of count models. In the first and most basic specification, I use a negative
binomial count model, a generalized version of the Poisson count model. This model of
the number of victims is:
(2) ( )cccccc eXVictim JCC'Kosher'Religion'Distanc'exp τρβλδα +++++=
Where Victimc is the number of investors (individual or organizational) in county
c.7 There are several important independent variables in each of the models. Distance c
measures the physical distance between the population weighted county centerand
7 I do not specify any independent variables that could affect whether there are any victims in a county but not the number of victims, conditional on vc being greater than zero. Neither economic theory nor institutional information directs me to any such variables. Instead, I allow the relationship between Xc and Networkc to vary on the intensive (θ) and extensive (β) margins.

27
Madoff’s nearest residence or office. Networkc,is the measure of the concentration of
Jewish religious organizations in county c. I use four different measures of Religion: the
number of Jewish religious organizations in the county, the percentage of organizations
in a county that are Jewish, the total revenue of all Jewish organizations in fiscal year
2008 per county and the total number of religious organizations per county in 2008. An
increase in the number of Jewish religious organizations should be positively correlated
with both stronger Jewish informal networks and an increase in individual religious
participation. However, contributions to religious organizations, which would also signal
strong network presence in the community, have been shown to be a substitute for
religious participation [Gruber (2005)]. A positive correlation between the number of
victims and each of the Religion measures would suggest that religious devotion and
participation is associated with increased vulnerability to being a Madoff victim.
I include JCCc and Kosherc in order to account for ethnic Jewish network
strength. Unlike data on religious organizations, the number of kosher restaurants and
JCCs should be largely independent of county and state tax laws. Moreover, although
JCCs commonly have a religious aspect to the organization, they are primarily locations
for members to socialize in a non-religious context (e.g. friends going to the gym
together) and these organizations often have non-Jewish members. Historically, JCCs,
many of which were formerly called YMHAs (Young Men’s Hebrew Associations) were
established as opposition to the nation’s YMCAs. The number of kosher restaurants
represents a bridge between religious and ethnic network strength, as those who keep
kosher are likely more religious Jews, while restaurants are commonly associated with
friendship networks, regardless of religious affiliation. JCCc is a count variable for the

28
number of JCCs within county c and Kosherc is a count of the number of kosher
restaurants in county c. A positive correlation between either or both of these variables
would suggest that increased Jewish ethnic and cultural networks increased susceptibility
to white-collar crime. In order to test how these network measures change with
closeness, I will explore possible heterogeneity in the impact of the social networks with
respect to distance by interacting my network measures with physical distance.8
I control for multiple potentially confounding variables. X is a matrix of county
characteristics including: the log of the county population, the log of median household
income, the percent of the county’s population that is White (non-Hispanic), the percent
of the county’s population that is over 65, the percent of the population that is over 65
and have a college degree and either the percent of households earning more than $200k
in 2000 or the number of doctors per county in 2007. The final two measures in
particular I predict should be highly correlated with white-collar crime victimization, as
they are likely to be predictors of participation in financial markets.
An important distinction to note when estimating crime related measures is the
difference between a marginal crime and the average crime. Using the Madoff scandal as
an example, a marginal victim would be a victim that is least likely to be victimized
given a change in practices, whereas the average victim is the victim with characteristics
that are the average of all known victims. This difference can result in sizeable
differences in estimates of victimization. For example, in criminal incarceration data the
average inmate in state prison may commit 12 crimes per year (DiIulio & Piehl, 1991;
DiIulio & Piehl, 1995), but the marginal prisoner affected by a sentence enhancement
8 In practice, I do this by calculating the value of ∂2Victim/∂{Network Measure}∂Distance for each observation and will present these mean values. Since neither model is linear, calculating the means of the estimated coefficient on the interaction term is not the same magnitude or sign as the cross partial effect.

29
will likely commit only 1 crime per year (Owens, 2009). As the Becker model of
criminal behavior postulates, the marginal crimes that are deterred by increases in the
probability of apprehension will be the least beneficial to the victim, and likely the least
harmful to the criminal (Becker, 1968). Such a model suggests that the marginal
victim/crime and average victim/criminal may be fundamentally different. Therefore, for
policy purposes, crime rates are typically better characterized by average characteristics
rather than marginal characteristics.
While equation (2) uses more information on Madoff victimization, it is notable
that the logit equations capture a large fraction of the total variation in victimization rates
across counties. A-priori, it is unclear whether the effect of social networks on the
probability of there being any victims in a county is that same as the effect on the number
of victims. In order to assure that my estimates are not driven by misspecification of the
victimization process, I will estimate three separate count models: a sub-sample of only
counties with any victims, the full set of counties and full sample zero-inflated negative
binomial. Using a zero-inflated negative binomial will allow me to relax the assumption
that a constant relationship on the extensive and intensive margins exists.
The key coefficients are θ, β, ρ and τ, the estimates of the conditional correlation
between informal religious social networks and victimization. If, on net, participation in
a religious and ethnic informal network is associated with greater risk of white-collar
crime, then the estimates of θ, β, ρ and τ will be greater than zero. Records of Madoff
victims include both individual account holders and non-profit organizations. It seems
plausible that individuals would be more influenced by informal networks than would
corporations. In addition, the financial decisions made by non-profit board members are

30
subject to regulation by the Internal Revenue Service and Better Business Bureau. If
these regulatory agencies constrained the firm’s behavior, the pattern of non-profit
victimization should be less related to Jewish network strength. I predict that informal
networks will better predict patterns of white-collar victimization for individual accounts
than organizations’ accounts.

31
V. RESULTS:
A. Jewish Networks & The Probability of Victimization
i. ALL INVESTORS:
I begin my analysis of the relationship between social networks and white collar
crime victimization on the extensive margin. I report the mean marginal effects for the
probability of any Madoff victims in a given county in Table 2. Results show that there
is a positive relationship between the number of Jewish organizations and the likelihood
of a Madoff victim in a county. On average, every ten new Jewish organization is
associated with a 9 percentage point (se=3) increase in the likelihood of Madoff victims.
Additionally, as criminal opportunity and social networking theory would predict,
physical distance is consistently negatively associated with probability of victimization.
Also worth noting, is that the percent of senior citizens with a college degree is a positive
predictor of victimization. Though this contradicts traditional thought regarding the size
of the educated senior population and traditional street crime, a positive relationship
between the educated senior population and white collar crime has been widely
demonstrated (Shover, 1998). Also consistent with theories of social distance and crime,
areas with higher percentages of wealthy households is significantly related to the
probability of victimization. For instance, in Model 1, an increase of 1% in the
households making more than 200k is associated with a 1.89% point (se=0.50) increase
in the likelihood of a victim. These last two relationships hold for analysis using all
Jewish network measures. Upon first glance, Madoff may have been exploiting both
Jewish and high-income social networks.

32
To further evaluate the validity of this statement, I consider both the relative
number of Jewish organizations to other religious organizations and those organizations’
size, as measured by revenue. Model 2 includes the total number of religious
organizations and the percentage of Jewish organizations in a county. Thus, one can
consider the Jewish organization ratio variable as a change in the affiliation of one of the
organizations in the county. According to the regression, for every 1% increase in the
percent of Jewish organizations in a county, there is approximately a 0.8% (se=0.23)
point increase in the likelihood of having Madoff victims in a county. The fact that this
relationship exists while there is no relationship between probability of victimization and
the total number of religious organizations in a county further may support the idea that
Madoff specifically targeted Jews and also may support the argument that Jews were
seeking out Madoff. Otherwise, one would have necessarily seen a relationship between
likelihood of victimization and the total number of religious organizations and may have
seen a relationship between victimization and the percentage of Jewish organizations. A
similar relationship exists in Model 3, where conditional on the total revenue of religious
organizations, a 1% change in religious revenue being redirected to Jewish organizations
is associated with a 0.15% point increase in the probability of victimization. While total
revenue is the amount of money an organization has, it also can be considered a measure
for the visibility of an organization. For example, organizations with higher revenues are
more likely to have public functions, like religious schooling, fairs and community
outreach.
Using the alternative methods of measuring Jewish social networks, the number
of Kosher restaurants (Model 4) and the number of JCCs (Model 5), I find consistent
33
results. For each additional Kosher restaurant in a county, there is a 2.7% point (se=0.6)
increase in the likelihood of victimization. In addition, each JCC in a county translates
into a 5.6% point (se=1.5) increase in the likelihood of a victim. These results are
particularly interesting as they show that regardless of local or state tax benefits that a
religious institution would have, the number of religiously affiliated businesses and
meeting areas can be used to predict Madoff victimization. The combination of these and
prior results, including a joint test that all network measures are equal to zero, which is
rejected at the 99.99% confidence level, suggests that Madoff was targeting Jews as
potential victims.
To evaluate my hypotheses related to physical proximity, I focus my analyses on
the geographic distance measure. Analyses reveal that each increase of 1,000km in the
minimum distance between Madoff and a victim translates into roughly a 2% point
decrease in the likelihood of victimization. As Zapf (1949) argued, ceteris paribus,
Madoff’s cost of contacting an individual should have increased proportional to the
distance between him and the individual. Thus, an analysis of the interaction of each
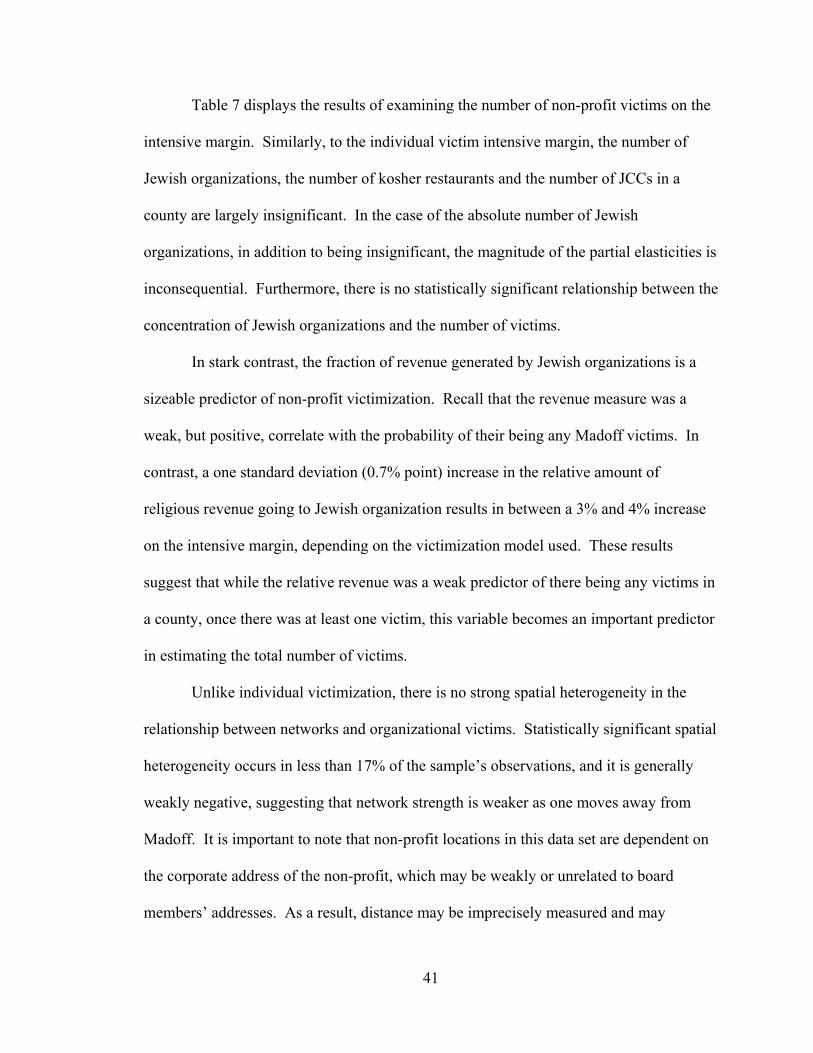
network measure and distance is appropriate. Figure 3 shows a sizeable level of
heterogeneity in the effect of proximity on social networks. As distance increases, the
effect of Jewish organizations on victimization falls faster in places where there is the
lowest probability of victimization. However, in likely areas of Madoff victimization
(i.e. high levels of income, education) that are physically distant from Madoff, the
positive relationship between Jewish organizations and victimization is ever larger than it
is in areas close to Madoff. Therefore, the predictive power of social network variables
related to Madoff become increasingly large as physical distance increases.

34
Similar patterns of heterogeneity when measuring informal networks using the
percentage of all religious organizations that are Jewish (Figure 4), the percent of all
religious revenue that goes towards Jewish organizations (Figure 5), the number of
Kosher restaurants (Figure 6) and the number of JCCs (Figure 7). The measure that was
most correlated with victimization on average, the fraction of religious organizations that
were Jewish, appears to decay the least with geographic distance. I can reject the null
hypothesis that these informal networks do not decay with distance with 95% confidence
in only the areas with the lowest probability of victimization.
While the estimated relationships are in large highly significant and robust to
measures of distance and income, in order to verify these results, I substituted the number
of doctors in 2007 for the percent of households with incomes over $200 thousand
counted in the 2000 Decennial Census. As I have previously mentioned, the two
variables in the year 2000 are highly correlated (r>.90). Thus, using the 2007 count of
the number of doctors may provide a more current estimate of the number of wealthy
individuals in a county. By rerunning the same logistic models with the number of
doctors as the measure of county wealth, I find very similar results. In each case, the
pseudo R-squared is similar in magnitude, often deviating by less than 0.10.
Additionally, a visual comparison of the signs and magnitudes of coefficient estimates
yield consistent results. For all estimates in all models, signs and magnitudes are
consistent. For example, each additional Jewish organization increases the probability
ofa county having a Madoff victim by 0.9% points (se = 0.3). Moreover, each 1%
increase in the number of Jewish organizations, holding the total number of religious
organizations constant, results in a 0.88% point (se=0.18) increase in the probability of a

35
Madoff victim and a 1% increase in the percent of revenue going to a Jewish religious
organization results in a 0.13% point (se=0.41) increase in the likelihood of Madoff
victimization. Differences in these estimates compared to previous models are
negligible. Similar comparisons also hold for estimates using the number of Kosher
restaurants9 (β=0.025, se=0.007) and the number of JCCs per county (β=0.050, se=0.016)
(Table 8). These comparisons further demonstrate that the previously discussed estimates
of likelihood of Madoff victimization based upon my independent variables are robust.
ii. NON-PROFIT INVESTORS:
The likelihood of non-profit victimization is likely different from that of
individual and overall victimization patterns. Such differences may be explained because
non-profit organizations’ (NPO’s) decisions to invest often fall to a board of directors.
These choices are also often subject to government regulation and oversight. Therefore,
there is a duty of a company’s officers to investigate more heavily into potential
investments. Moreover, majority consent is often required in Board structures and so
unlike where one individual may decide whether to invest, multiple individuals here must
agree before action is taken. However, NPO Boards are often full of high-status
individuals, who are more likely to be familiar with Madoff. These stronger distant
connections may have lead NPOs to invest more with Madoff. Therefore, based upon the
ambiguous net effect of NPO Boards on Madoff victimization, I choose to run separate
analyses on this subset of victims.
Results displayed in Table 4 suggest that differences in victimization patterns
likely do exist. In fact, all three religious organization measures (the number of Jewish
9 Analyses using the percent of kosher restaurants per county yield similar results in sign and magnitude for all analyses.

36
organizations, their relative revenues and their relative prevalence per county) are all
indistinguishable from zero. Moreover, the number of kosher restaurants plays an
insignificant role in modeling victimization. Intuitively this seems logical, as an NPO is
less likely affected by small business and community relationships than would be
individuals. However, the number of JCCs in a county is a significant predictor in the
probability of Madoff victimization. Following the results in Table 4, each JCC accounts
for an approximate 0.4% point (se=0.2) increase in the likelihood that a Madoff victim
will be in a given county. Additionally, geographic distance from Madoff continues to
play a distinct, significant role in the likelihood of victimization with the likelihood of
victimization decreasing by 0.3% points (se=0.01) for every 1,000km the county is from
Madoff’s closest home location. Also worth noting, with the exception of seniors with at
least a college degree, the demographic characteristics of the county, including wealth,
become insignificant predictors. Presumably, the average NPO is more detached from its
surrounding community, so one would expect these local networks to play a weak role, if
any, in corporate investments.
Further consideration suggests the differences in the relationship between Jewish
religious institutions and geographic distance for non-profit and individual victims.
Unlike in individual victim analysis, where a clear upward sloping trend existed between
physical distance and strengthening of the informal networks was present, on average
there is no significant spatial deterioration or strengthening of the informal networks.
One exception does hold. That is, in counties with approximately a 60% chance of
victimization, the predicative power of Jewish network strength, particularly as measured
by the fraction of organizations that are Jewish, is higher in areas located further from

37
Madoff. Overall, one can summarize these findings by stating that in counties distant
from Madoff, where the observed predictors do not clearly predict victimization, the
proxy for the strength of weak ties is a better predictor of victimization.
B. Jewish Networks & The Amount of Victimization
Having established the positive relationship between Jewish social network
measures and the likelihood of Madoff victimization in a county, I now examine the
intensive margin of victimization. I conduct these analyses because it seems unclear
whether the probability of any victimization in a county and the level of victimization,
measured in quantity of investors, should be the same. I model the number of victims in
a county in three ways. First, I restrict the sample to only counties with any Madoff
victims (Models 1 and 4). Next, I estimate model (2) and (5) for all counties, which
considers all counties, regardless of the number of Madoff victims. These models restrict
the coefficients of equation (1) and equation (2) to be equal by imposing the assumption
that θ = β. Finally, I present results from a zero inflated negative binomial model
(Models 3 and 6). This essentially process produces weighted averages of the results of
models (1) and (2). This specification allows for variation in the effects of Madoff on the
intensive and extensive margins of victimization.
i. ALL INVESTORS
Table 6 displays partial elasticities for the various count models, where the
number of all Madoff investors in a county is the dependent variable in each model.
Previously, in the logistic analyses, the number of Jewish organizations predicted the
likelihood of there being any victims. However, models using this network measure to
estimate the increase in victimization rates (the top panel) prove to be statistically

38
indistinguishable from zero. In summary, areas with more Jewish organizations were
more likely to have at least one victim, but in areas where network ties did exist seem to
have no measurable effect on increasing the victimization rate.
Although increasing the total number of Jewish organizations had no effect on
victimization rates, the conversion of one non-Jewish organization to a Jewish
organization does impact the number of victims (the second panel). A one standard
deviation (2.2% point) increase in the percent of organizations that are Jewish is
associated with a roughly 28% increase in the number of victims when there is at least
one victim in a county, a 51% increase in the overall number of victims, or a 31%
increase when one allows for a structural break between the intensive and extensive
margins. Undoubtedly, these effects are quite sizeable and suggest that the relative
concentration of Jewish social networks in an area plays an important role when
considering the quantity of victimization in a county.
Using relative revenue to measure network strength (bottom panel) reveals similar
results. Conditional on the total revenue of religious organization in the county, a one
standard deviation (5.6 percentage points) increase in the fraction of revenue which goes
to Jewish organizations is associated with a 26% increase in victimization among
victimized counties. Combining the intensive and extensive margins provides a slightly
larger increase, 28%. Nonetheless, the difference between these estimates is not
statistically significant. The relative magnitudes of both the revenue based and
institutional based effects are the same for the extensive and intensive margins.
Similar to the results when examining the relationship between victimization
levels and the number of Jewish organizations, I find no significant relationship for the

39
number of JCCs or Kosher restaurants in a county and victimization rates. This supports
the pattern that the absolute number of Jewish-American organizations does not affect
Madoff victimization. Each of these findings is robust to the inclusion of measures of
population age, education, median income and wealth. Indeed, the best predictors of
determining the intensity of Madoff victimization is relative strength of Jewish social
networks compared to other religious networks.
Physical distance, as measured in this study, between Madoff and his victims is a
consistent predictor of extensive victimization, but there is no statistically precise
relationship between distance and the number of victims in a county. More notably,
however, there is significant heterogeneity in the predictive value of religious ties with
respect to geography. Inspection of counties that had at least one victim (column 4)
shows that the interaction between concentration based measures of network strength and
geographic distance is positive and statistically different from zero over 95% of the time.
In other words, as one moves further from Madoff, the fraction of all religious
organizations and the fraction of all revenue going to Jewish organizations become
stronger predictors of the number of victims. Consistent with network theory, geographic
closeness of Madoff to potential victims and Jewish network strength appear to be
substitutes in predicting victimization. The importance of this interaction effect is
weaker when determining the probability of there being any victims, as the interaction
effect is generally statistically insignificant when the intensive and extensive effects are
restricted to be equal. Relax this restriction (column 6), however, shows that the
concentration of Jewish organizations and Jewish religious revenue is positively

40
correlated with county victimization, and the magnitude of this relationship is larger the
further away one moves from Madoff.
Again, these results seem to be robust to the substitution of the number of wealthy
households per county in the year 2000 with the number of doctors per county. Again,
the signs, magnitudes and significance of each of the mean partial elasticities are roughly
equal. For example, a one standard deviation increase in the percent of Jewish
organizations in a county for counties with any Madoff victims is associated with a
27.5% increase in the number of Madoff investors, compared to the previously computed
28% using household wealth as the measure. There are also only marginal increases in
the number of victims per county when examining relative Jewish revenue in counties:
using wealth data, the estimate is a 26% increase in the number of victims compared to a
24% increase when using the number of doctors per county. Again, there are no
significant relationships between the number of victims and the number of Jewish
organizations, number of kosher restaurants or the number of JCCs in a county.
Measures of heterogeneity do differ when using the number of doctors as the measure of
wealth in a county. Although there is a significant relationship between the interaction of
distance and the percent of Jewish organizations, the interaction between distance and
relative revenue is statistically imprecise. However, the partial elasticity for the
interaction of the number of JCCs and distance is significant. Overall, there is little
change to the previously discussed findings when one considers the alternative measure
of wealth in a county.
ii. NON-PROFIT INVESTORS
41
Table 7 displays the results of examining the number of non-profit victims on the
intensive margin. Similarly, to the individual victim intensive margin, the number of
Jewish organizations, the number of kosher restaurants and the number of JCCs in a
county are largely insignificant. In the case of the absolute number of Jewish
organizations, in addition to being insignificant, the magnitude of the partial elasticities is
inconsequential. Furthermore, there is no statistically significant relationship between the
concentration of Jewish organizations and the number of victims.
In stark contrast, the fraction of revenue generated by Jewish organizations is a
sizeable predictor of non-profit victimization. Recall that the revenue measure was a
weak, but positive, correlate with the probability of their being any Madoff victims. In
contrast, a one standard deviation (0.7% point) increase in the relative amount of
religious revenue going to Jewish organization results in between a 3% and 4% increase
on the intensive margin, depending on the victimization model used. These results
suggest that while the relative revenue was a weak predictor of there being any victims in
a county, once there was at least one victim, this variable becomes an important predictor
in estimating the total number of victims.
Unlike individual victimization, there is no strong spatial heterogeneity in the
relationship between networks and organizational victims. Statistically significant spatial
heterogeneity occurs in less than 17% of the sample’s observations, and it is generally
weakly negative, suggesting that network strength is weaker as one moves away from
Madoff. It is important to note that non-profit locations in this data set are dependent on
the corporate address of the non-profit, which may be weakly or unrelated to board
members’ addresses. As a result, distance may be imprecisely measured and may

42
introduce attenuation bias in my estimates of the effect of geographic closeness, making
it more difficult to identify a non-zero relationship. Again, all intensive margin estimates
of non-profit victimization are robust to the substitution of the county wealth measure
with the number of doctors in a county.

43
VI. CONCLUSION
Typically when one thinks of white collar crime, Nigerian scams and other
telephone and Internet scams come to mind. However, corporations commit most white
collar crime (Posner, 1979). As previously described, white collar crime is an abuse of
trust (Shover, 1998). Thus, social networks may play an important role in the incidence
of white collar crime. Prior to this study, however, the correlates of modern white collar
crime were largely unknown as it is often difficult if not impossible to accurately measure
or contact the victims of such offense. As a result, testing the theoretical effects of
inciting religion, social networks and distance on the commission of white collar crime is
difficult. In these ways, the Madoff case raised a particularly interesting opportunity to
examine each of these questions.
Results from this study show that social networks, particularly religious social
networks, have serious consequences for both the probability of victimization and the
intensity of victimization. I show that despite the likely increased costs of investing with
an unknown, risky investor, individuals in counties with strong Jewish social networks
were more likely to invest with Madoff. Moreover, I find that when the network, as
measured by both the relative concentration of Jewish organizations and the relative
revenue of Jewish organizations in a county, was stronger, more individuals invested with
Madoff. Thus, it seems prudent that individuals recognize the potentially negative effects
of participating in transactions with individuals within their own social networks.
This study also highlighted the effects of distance on victimization which Zipf
(1949) so clearly asserted. Examining the first order effect of distance, I find a
consistently negative relationship between distance and likelihood and level of

44
victimization. However, this negative effect is often smaller than the positive
relationships between victimization and network strength. Continued analysis of the
distance measure reveals a more meaningful description of distance’s relationship to
victimization. I find that as the physical distance from Madoff increased, the importance
of Jewish network strength steadily increased. This result suggests that victims likely
increasingly relied on information passing through these networks as other possible
routes to discerning the quality of Madoff’s firm became more costly. I propose that
individual investors’ reliance on information spread though the Jewish social network
aided in Madoff’s commission of the largest Ponzi scheme in US history.
Relative to indirect victimization, Jewish network strength and the geographic
distribution of non-profit Madoff victims are only weakly related. In fact, a significant
relationship exists between victimization and only the amount of revenue generated by
Jewish organizations, not the number or concentration of those organizations. I conclude
that the boards of non-profit foundations rely less on informal networks than do
individual investors in making investment decisions, and are therefore less susceptible to
victimization in crimes of trust. The fact that this relationship becomes weaker as the
geographic distance between the non-profit and Madoff increases highlights that
alternative personal connections between board members and Madoff may have played a
role.
While Madoff’s Ponzi scheme clearly had seriously negative consequences on the
US economy and society, overall it provided an excellent opportunity to study and craft
effective policy to prevent future white collar schemes. This study has served to
highlight that while inciting religion may help to decrease street crime, the use of religion

45
can foster white collar schemes and victimization. This suggests that there may be an
increased purpose for the government to supervise organizations and individuals who are
perceived to be associated with religious networks. There also may be cause to terminate
boutique investment firms’ exemptions from federal monitoring. It seems quite plausible
that had Madoff been required to submit to detailed federal oversight, he likely would not
have been able to continue his scheme without detection. Increased federal oversight
would help limit the negative effects of asymmetric information on behalf of investors
who do not realize there is a lack of oversight and investors who cannot accurately
ascertain the value of the assets sold by firms like Madoff LLC. In summation, this study
highlights the importance of careful evaluation of investments rather than relying on
information spread through informal, and likely ill-informed, social networks.

46
REFERENCES American Jewish Committee. 2007. The American Jewish Yearbook of 2007 (Vol 107).
Binghamton, NY: Maple-Vail Book Manufacturing Group. Anti-Defamation League. 2007. American attitudes towards jews in America [Powerpoint
Slides]. Retrieved from: Anti-Defimation League Web Site: http://www.adl.org/Anti_Semitism/poll_2007/Anti-Semitism%20Poll%202007.pdf.
Associated Press. 2009. Madoff surprised he wasn’t caught earlier. MSN News October
31, 2009. http://www.msnbc.msn.com/id/33560855/ns/business-us_business Bacarach, Samuel B., Peter A. Bamberger and Dana Vashdi. 2005. Diversity and
homophily at work: supportive relations among white and african-american peers. Academy of Management Journal, 48(4), 619-644.
Baker, Wayne and Robert R. Faulkner. 2003. Diffusion of fraud: Intermediate economic
crime and investor dynamics. Criminology, 41, 1173-1206. Barnes, J. A. 1954. Class and committees in a norwegian island parish. Human Relations,
7, 39-58. Bearman, Peter.1997. Generalized exchange. The American Journal of Sociology, 102,
1383-1415. Becker, Gary. 1968. Crime and punishment: An economic approach. Journal of Political Economy 76 (2):169-217.
Benson, Michael L. Tamara D. Madensen, and John E. Eck. 2009. “White-Collar Crime from an Opportunity Perspective” in The criminology of white-collar crime, ed. Sally S. Simpson and David Weisburd. New York: Springer Science+ Business Media. 79-110.
Berardo, Ramiro. 2009. Generalized trust in multi-organizational policy arenas studying its emergence from a network perspective. Political Research Quarterly, 62(1), 178-189.
Berkowitz, Stephen D. 1982. An introduction to structural analysis: The network approach to social research. Toronto: Butterworth.
Bernasco, Wim and Richard Block. 2009. Where offenders choose to attack: A discrete choice models of robberies in Chicago. Criminology 47(1): 93-129.
Bogardus, Emory. 1926. Social distance in the city. Proceedings and Publications of the American Sociological Society, 20: 40-46.

47
Bonacich, Edna. 1973. A theory of middleman minorities. American Sociological
Review, 38(5): 583-594. Brantingham, Paul and Patricia Brantingham. 1991. Environmental criminology. Prospect
Heights, IL: Waveland Press. Brass, Daniel J. 1984. Being in the right place: A structural analysis of individual
influence in an organization. Administrative Science Quarterly, 29, 518–539. Burt, Ronald S. 1992. Structural Holes. New Haven, CT: Harvard University Press. Burt, Ronald S. 2005. Brokerage and closure: An introduction to social capital. Oxford:
Oxford University Press. Capone, Donald L. and Woodrow W. Nichols, Jr. 1976. Urban structure and criminal
mobility. The American Behavioral Scientist 20(2) 199-213. Chew, Robert. 2009. How Madoff’s feeder stole my retirement. Retrieved March 10,
2010 from Time Magazine’s web site: http://www.time.com/time/business/article/0,8599,1889393,00.html
Chibber, Kabir. 2009. Madoff’s road to riches ends in court. Retrieved October 1, 2009,
from BBC News Web site: http://news.bbc.co.uk/2/hi/business/7939145.stm Cohen, Yinon and Andrea Tyree. (1994). Palestinian and jewish israeli-born immigrants
in the United States. International Migration Review, 28(2), 243-255. Coleman, James. 1988. Social capital in the creation of human capital. American Journal
of Sociology Supplement, 94, 93–120. Cowan, Alison. 2009. A Madoff cookbook has a secret, too. Retrieved October 17, 2009,
from the New York Times website: http://www.nytimes.com/2009/01/15/business/15cook.html
DellaVigna, Stefano and Eliana La Ferrara. 2007. Detecting illegal arms trade. Working paper DiIulio, John. and Anne M. Piehl. 1991. Does prison pay? The stormy national debate over the cost-effectiveness of imprisonment. The Brookings Review 9: 28-35. DiIulio, John. and Anne M. Piehl. 1995. Does prison pay? Revisited. The Brookings Review 13: 20-25.

48
Diner, H.R. 2004. The jews of the united states, 1654 to 2000. Berkeley, CA: University of California Press.
Duggan, Mark and Steven Levitt. 2002. Winning isn’t everything: Corruption in sumo
wrestling. The American Economic Review, 92(5), 1594-1605. Durkheim, Emile. 1897. Suicide: A study in sociology. Trans. J. Spaulding, & G.
Simpson. New York: The Free Press.
Eck, John and Ronald Clarke. 2003. Classifying common police problems: A routine activity approach in Theory for practice in situational crime prevention: Crime prevention studies, ed. M.J. Smith and D. B. Cornish, Vol. 16. Monsey NY: Criminal Justice Press.
Evans, T. David, Frank Cullen, R. Gregory Dunaway, & Velmer S. Burton, Jr. 1995. Religion and crime reexamined: The impact of religion, secular controls, and social ecology on adult criminality. Criminology, 33(2), 195-.
Federal Bureau of Investigation. 2005. Crime in the united states 2004: Uniform crime reports. Washington, DC: U.S. Government Printing Office.
Freeman, Linton. 2004. The development of social network analysis: A study in the
sociology of science. Vancouver, BC, Canada: Empirical Press. Friedkin, Noah E. 1993. Structural bases of interpersonal influence in groups: A
longitudinal case study. American Sociological Review, 58, 861-872. FOX News. 2009. Madoff targeting jews? Washington, DC: Fox News Corporation,
2009. News Broadcast Granovetter, Mark S. 1973. The strength of weak ties. American Journal of Sociology.
78(6), 1360-1380. Gimpson, Ashley. 2008. Religious hate crimes down overall, up against jews. Retrieved
October 2, 2009, from USA Today Web site: http://www.usatoday.com/news/religion/2008-10-28-hate-crimes_N.htm
Gordon, Milton M. 1964. Assimilation in American Life. New York: Oxford University
Press. Halter, Marilyn. 1995. Migrants in the marketplace: Boston’s ethnic entrepreneurs.
Amherst, MA: University of Massachusetts Press. Hanneman, Robert A. and Mark Riddle. 2005. Introduction to social network methods.
Riverside, CA: University of California, Riverside.

49
Hipp, John R. and Andrew Perrin. 2006. Nested loyalties: Local networks’ effects on neighborhood and community cohesion. Urban Studies, 43, 2503–2523.
Jagpal, Niki and Julia Craig. 2009. Learning from Madoff: lessons for foundation boards” National Committee for Responsive Philanthropy
Jones-Correa, Michael. 2000/2001. The origins and diffusion of racial restrictive covenants. Political Science Quarterly 115: 541-568.
Karlan, Dean S., Markus Mobius, Tanya Rosenblat and Adam Szeidl. 2009. Trust and societal collateral. Quarterly Journal of Economics, 124(3), 1307-1361.
Krug, Anita. 2009. Regulatory response to Madoff. Berkeley Center for Law, Business and the Economy, University of California, Berkeley School of Law. White Paper.
Lazersfeld, Paul F. and Robert K. Merton. 1954. Friendship as a social process: A
substantive and methodological analysis, in Freedom and control in modern society, ed. M. Berger, T. Abel, and C. H. Page. Princeton, NJ: Van Nostrand.
Levi, Michael. 2009. White-collar crimes and the fear of crime: A review in The criminology of white-collar crime ed. Sally S. Simpson and David Weisburd. New York: Springer Science+ Business Media. 175-193.
Levi, Michael. 1987. Regulating fraud: White-collar crime and the criminal process. London: Routledge/Tavistock.
Levitt, Steven. 2006. White-collar crime writ small: A case study of bagels, donuts, and
the honor system. The American Economic Review, 96(2), 290-294. Levitt, Steven and Chad Syverson. 2008. Market distortions when agents are better
informed: the value of information in real estate transactions. Review of Economics and Statistics, 90(4), 599-611.
Light, Ivan H. and Carolyn Rosenstein. 1995. Race, ethnicity, and entrepreneurship in
urban America. New York, NY: Aldine Transaction. Maulik, Pallab K., William W. Eaton and Catherine P. Bradshaw. 2009. The role of
social network and support in mental health service use: Findings from the baltimore ECA study. Psychiatric Services, 60(9), 1222-1229.
McPherson, J. Miller, Lynn Smith-Lovin, and James Cook. 2001. Birds of a feather:
Homophily in social networks. Annual Review of Sociology, 27, 415-44.

50
McPherson, J. Miller and James R. Ranger-Moore. 1991. Evolution on a dancing landscape: Organizations and networks in dynamic blau space. Social Forces, 70, 19–42.
McPherson, J. Miller and Lynn Smith-Lovin. 1987. Homophily in voluntary
organizations: Status distance and the composition of face-to-face groups. American Sociological Review, 52, 370–379.
Mehra, Ajay, Martin Kilduff and Daniel J. Brass. 1998. At the margins: A distinctiveness approach to the social identity and social networks of underrepresented groups. Academy of Management Journal, 41(4), 441-452.
Mouw, Ted and Barbara Entwisle. 2006. Residential segregation and interracial friendship in schools. American Journal of Sociology, 112, 394–441.
Nagel, Joane. 1994. Constructing ethnicity: Creating and recreating ethnic identity and
culture. Social Problems, 41(1), 152-176. Owens, Emily G. 2009. More time, less crime? Estimating the incapacitative effect of sentence enhancements. Journal of Law and Economics. 52(3): 551-579. Poole, Willard C. Jr. 1927. Distance in sociology. The American Journal of Sociology,
33, 99–104. Power, Garrett. 1996. The residential segregation of Baltimore's jews: restrictive
covenants or gentlemen's agreement? Generations, 5-7. Pruckner, Gerald and Rupert Sausgruber. 2008. Honesty on the streets: A natural field experiment on newspaper purchasing. Working paper Quillian, Lincoln and Mary E. Campbell. 2003. Beyond black and white: the present and
future of multiracial friendship segregation. American Sociological Review, 68, 540–566.
Reuter, Peter and Jonathon Caulkins. 2004. Illegal “lemons”: Price dispersion in cocaine
and heroin markets. Bulletin on Narcotics, 56(1-2): 141-165. Saint-Charles, Johanne and Pierre Mongeau. 2009. Different relationships for coping
with ambiguity and certainty in organizations. Social Networks 31: 33-39. Schneider, Henry. 2009. Agency problems and reputation in expert services: Evidence from auto repair. Working paper. Shleifer, Andre and Robert Vishny. 1993. Corruption. Quarterly Journal of Economics
108 (3): 599-617.

51
Shover, Neal. 1998. White-collar crime. in The handbook of crime and punishment, ed. Tonry, Michael. New York: Oxford University Press.
Simmel, Georg. (1950). The sociology of Georg Simmel. Trans. Kurt Wolff. Glencoe, IL: Free Press.
Smith, Kirsten and Nicholas Christakis. 2008. Social networks and health. Annual Review of Sociology, 34, 405-29.
Smith-Doerr, Laurel, Ivan M. Manev and Polly Rizova. 2005. The meaning of success:
network position and the social construction of project outcomes in an R&D lab. Journal of Engineering Technology Management, 21, 51-81.
Sowell, Thomas. 2005. Is anti-semitism generic? Hoover Digest, Vol. 3. Retrieved from:
http://www.hoover.org/publications/digest/2931421.html.
Stevenson, William and Robert Radin. 2009. Social capital and social influence on the board of directors. Journal of Management Studies, 46(1), 16-44.
Stout, David. 2009. Report details how Madoff’s web enamored SEC. Retrieved on March 10, 2010 from New York Times Web Site: http://www.nytimes.com/2009/09/03/business/03madoff.html
Tobin, Gary with Sharon L. Sassler. 1988. Jewish perceptions of anti-semitism. New York: Plenum Press.
Tönnies, Ferdinand. 1935. Fundamental concepts of sociology: Gemeinschaft und gesellschaft (8th ed.) New York: American Book Company.
Totterdell, Peter, David Holman and Amy Hukin. 2008. Social networkers: Measuring and examining individual differences in propensity to connect with others. Social Networks, 30(4), 283-296.
Venkatesh, Sudhir. (2006). Off the books: The underground economy of the working poor. Cambridge: Harvard University Press.
Wall Street Journal. March 6, 2009. Madoff’s Victims. The Wall Street Journal.
Retrieved from http://s.wsj.net/public/resources/documents/st_madoff_victims _20081215.html.
Wutkowski, Karey. 2009. SEC staff saw Madoff as a voice of authority. Retrieved on
March 10, 2010 from Reuters Web Site: http://www.reuters.com/article/idUSTRE4BG6US20081217
Zipf, George K. 1949. Human behavior and the principle of least effort: An introduction
to human ecology. Cambridge, MA: Addison-Wesley.

52
Zuckerman, Gregory and Scannell, Kara. 2008. Madoff misled SEC in ’06, got off. The
Wall Street Journal December 18. http://online.wsj.com/article/SB122956182184616625.html

53
APPENDIX Figure 1. Presence of Madoff Victims by County
Figure 2. Concentration of Madoff Victims by County
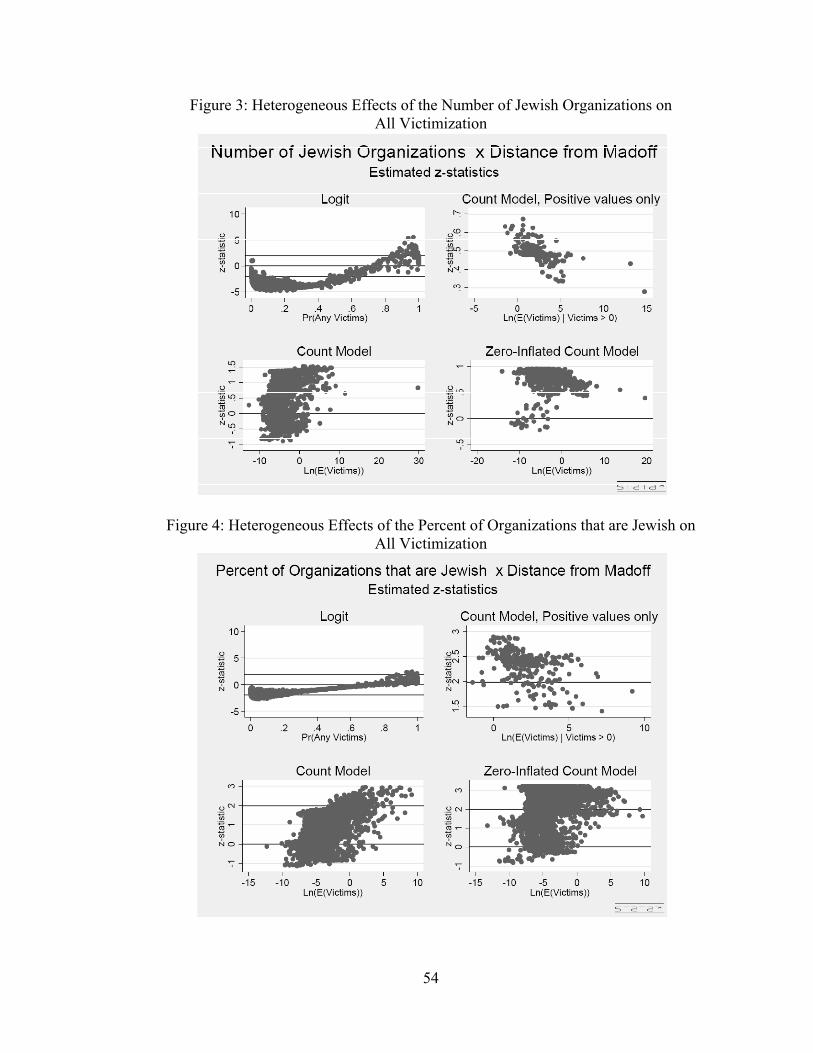
54
Figure 3: Heterogeneous Effects of the Number of Jewish Organizations on All Victimization
Figure 4: Heterogeneous Effects of the Percent of Organizations that are Jewish on All Victimization

55
Figure 5: Heterogeneous Effects of the Percent of all Revenue collected by Jewish Organizations on All Victimization
Figure 6: Heterogeneous Effects of the Number of Kosher Restaurants on on All Victimization

56
Figure 7: Heterogeneous Effects of the Number of Jewish Community Centers on All Victimization
Figure 8: Heterogeneous Effects of the Number of Jewish Organizations on Non-Profit Victimization

57
Figure 9: Heterogeneous Effects of the Percent of Organizations that are Jewish on
Non-Profit Victimization
Figure 10: Heterogeneous Effects of the Percent of all Revenue collected by Jewish Organizations on Non-Profit Victimization

58
Figure 11: Heterogeneous Effects of the Number of Kosher Restaurants
on Non-Profit Victimization
Figure 12: Heterogeneous Effects of the Number of Jewish Community Centers on Non-Profit Victimization

59
Table 1: Characteristics of Madoff Victims and Victimization by County
All Counties n=3,141
Any Clients n=308
No Clients
n= 2,833 p(difference) =
0
Number of Clients 3.33 33.9 0 .0000
[49.7] [156] [0]
Non-Profit Clients .0471 .464 .00177 .0000 [.817] [2.57] [.062]
Assets Invested with Madoff (10k) 72.4 734 0.51 .0000
[2,060] [6,560] [193]
Religious Organizations, 2008 68.0 368 35.4 .0000 [242] [669] [74.7]
Jewish Organizations, 2008 1.86 17.6 0.148 .0000
[31.2] [98.4] [0.816] Jewish Organizations / Religious Organizations
0.005 0.028 0.002 .0000 [0.022] [0.057] [0.001]
Revenue of Religious Organizations, 2008 (100k)
43.1 303 14.9 .0000 [269] [777] [79.7]
Revenue of Jewish Organizations, 2008 (100k)
2.18 21.4 0.956 .0000 [36.7] [116] [1.56]
Total Rev. of Jewish Org./ Total Rev. of Religious Org.
0.007 0.053 0.002 .0000 [0.056] [0.131] [0.036]
Kosher Restaurants, 2009 .577 5.70 .0201 .0000
[6.44] [19.9] [.209]
JCC Organizations 0.061 .565 .006 .0000 [0.41] [1.19] [.082]
Number of Doctors, 2007 253 1776 88.13 .0000
[1084] [2943] [293]
Population, 2008 96,803 519,698 50,827 .0000
[312,135] [830,013] [108,526]
Per Capita Income, 2008 42,705 55,875 41,274 .0000
[10,959] [14,587] [9,443]
Percent White, Non-Hispanic, 2007 86.5 82.9 86.9 .0000
[16.0] [14.0] [16.2] Standard deviations in brackets.
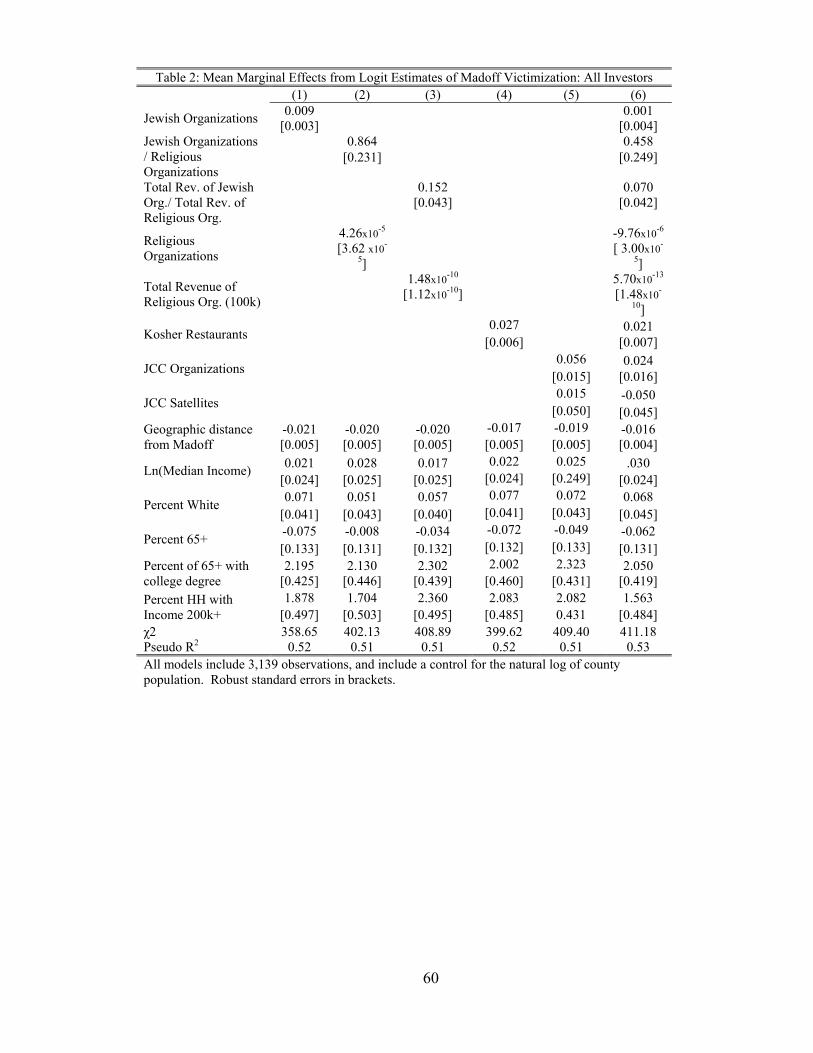
60
Table 2: Mean Marginal Effects from Logit Estimates of Madoff Victimization: All Investors (1) (2) (3) (4) (5) (6)
Jewish Organizations 0.009 0.001 [0.003] [0.004]
Jewish Organizations / Religious Organizations
0.864 0.458 [0.231] [0.249]
Total Rev. of Jewish Org./ Total Rev. of Religious Org.
0.152 0.070 [0.043] [0.042]
Religious Organizations
4.26x10⁻⁵ -9.76x10⁻⁶ [3.62 x10-
5] [ 3.00x10-
5]
Total Revenue of Religious Org. (100k)
1.48x10⁻¹⁰ 5.70x10⁻¹³ [1.12x10⁻¹⁰] [1.48x10-
10]
Kosher Restaurants 0.027 0.021 [0.006] [0.007]
JCC Organizations 0.056 0.024 [0.015] [0.016]
JCC Satellites 0.015 -0.050 [0.050] [0.045]
Geographic distance from Madoff
-0.021 -0.020 -0.020 -0.017 -0.019 -0.016 [0.005] [0.005] [0.005] [0.005] [0.005] [0.004]
Ln(Median Income) 0.021 0.028 0.017 0.022 0.025 .030 [0.024] [0.025] [0.025] [0.024] [0.249] [0.024]
Percent White 0.071 0.051 0.057 0.077 0.072 0.068 [0.041] [0.043] [0.040] [0.041] [0.043] [0.045]
Percent 65+ -0.075 -0.008 -0.034 -0.072 -0.049 -0.062 [0.133] [0.131] [0.132] [0.132] [0.133] [0.131]
Percent of 65+ with college degree
2.195 2.130 2.302 2.002 2.323 2.050 [0.425] [0.446] [0.439] [0.460] [0.431] [0.419]
Percent HH with Income 200k+
1.878 1.704 2.360 2.083 2.082 1.563 [0.497] [0.503] [0.495] [0.485] 0.431 [0.484]
χ2 358.65 402.13 408.89 399.62 409.40 411.18 Pseudo R2 0.52 0.51 0.51 0.52 0.51 0.53 All models include 3,139 observations, and include a control for the natural log of county population. Robust standard errors in brackets.

61
Table 3: Mean Marginal Effects from Logit Estimates of Madoff Victimization: All Investors with Distance Interactions (7) (8) (9) (10) (11)
Jewish Organizations 0.019 [0.005]
Jewish Organizations / Religious Organizations
1.026 [0.354]
Total Rev. of Jewish Org./ Total Rev. of Religious Org.
0.156 [0.066]
Religious Organizations 1.39 x10⁻⁵ [4.82x10⁻⁵]
Total Revenue of Religious Org. (100k) 1.49x10⁻¹⁰ [1.12x10⁻¹⁰]
Kosher Restaurants 0.024 [0.007]
JCC Organizations 0.062 [0.020]
JCC Satellites 0.139 [0.063]
Geographic distance from Madoff -0.012 -0.011 -0.019 -0.018 -0.019 [0.006] [0.006] [0.005] [0.005] [0.005]
Distance x Jewish Organizations -4.43x10⁻⁶ [-1.30x10-
6]
Distance x Jewish Organizations / Religious Organizations
-0.125 [0.174]
Distance x Jewish Rev. / Religious Rev. -8.83 x10⁻⁶ [5 x10⁻⁵]
Distance x Kosher Restaurants 0.004 [0.005]
Distance x JCC Organizations -0.005 [0.011]
Ln(Median Income) 0.026 0.034 0.057 0.019 0.024 [0.024] [0.025] [0.040] [0.024] [0.024]
Percent White 0.067 0.063 0.057 0.084 0.075 [0.043] [0.045] [0.039] [0.042] [0.044]
Percent 65+ -0.072 -0.011 -0.033 -0.081 -0.052 [0.125] [0.129] [0.132] [0.131] [0.132]
Percent of 65+ with college degree 2.088 1.651 2.300 2.278 2.330 [0.417] [0.437] [0.439] [0.423] [0.429]
Percent HH with Income 200k+ 1.763 1.651 2.360 2.014 2.089
[0.468] [0.506] [0.494] [0.464] [0.484] χ2 389.60 459.49 431.26 396.86 424.09 Pseudo R2 0.52 0.52 0.51 0.52 0.51 All models include 3,139 observations, and include a control for the natural log of county population. Robust standard errors in brackets.

62
Table 4: Mean Marginal Effects from Logit Estimates of Madoff Victimization: Non Profit Investors (1) (2) (3) (4) (5) (6)
Jewish Organizations 3.64x10⁻⁵ 3.37x10⁻⁵ [2.77x10-
5] [0.0001]
Jewish Organizations / Religious Organizations
0.031 -0.013 [0.018] [0.068]
Total Rev. of Jewish Org./ Total Rev. of Religious Org.
0.013 -0.004 [0.010] [0.018]
Religious Organizations -1.21x10⁻⁶ -8.29x10⁻⁶ [1.84x10-
6] [4.56x10⁻⁶]
Total Revenue of Religious Org. (100k)
-1.29x10-
11 -6.08x10-
13 [1.54x10-
11] [1.91x10-
11]
Kosher Restaurants 2.32x10-
4
2.67x10⁻⁴ [0.0001] [2.04x10-
4]
JCC Organizations 0.004 0.002 [0.002] [0.003]
JCC Satellites -0.003 -0.0004 [0.002] [0.003]
Geographic distance from Madoff -0.003 -0.003 -0.003 -0.003 -0.003 -0.002 [0.002] [0.002] [0.001] [0.001] [0.002] [0.001]
Ln(Median Income) -0.003 -0.007 -0.006 -0.002 -
0.0007 -0.004 [0.002] [0.011] [0.011] [0.010] [0.011] [0.010]
Percent White 0.021 0.018 0.015 0.022 0.021 0.023 [0.018] [0.017] [0.017] [0.019] [0.019] [0.018]
Percent 65+ -0.028 -0.037 -0.037 -0.035 -0.029 -0.054 [0.052] [0.055] [0.056] [0.050] [0.052] [0.054]
Percent of 65+ with college degree
0.341 0.369 0.361 0.357 0.349 0.412 [0.172] [0.182] [0.189] [0.163] [0.168] [0.173]
Percent HH with Income 200k+ 0.195 0.199 0.217 0.160 0.150 0.124 [0.121] [0.125] [0.123] [0.123] [0.120] [0.130]
χ2 162.87 154.60 142.15 162.74 162.09 141.92 Pseudo R2 0.59 0.59 0.59 0.60 0.59 0.60 All models include 3,139 observations, and include a control for the natural log of county population. Robust standard errors in brackets.

63
Table 5: Mean Marginal Effects from Logit Estimates of Madoff Victimization: Non Profit Investors with Distance Interactions (7) (8) (9) (10) (11)
Jewish Organizations 2.38x10⁻⁵ 1.77x10⁻⁵
Jewish Organizations / Religious Organizations
0.021 [0.018]
Total Rev. of Jewish Org./ Total Rev. of Religious Org.
0.011 [0.011]
Religious Organizations -2.49x10⁻⁶ [4.30x10⁻⁶]
Total Revenue of Religious Org. (100k) -1.28x10⁻¹¹ [1.54x10-
11]
Kosher Restaurants 2.07x10⁻⁴ [1.22x10-
4]
JCC Organizations 0.003 [0.002]
JCC Satellites -0.001 [0.003]
Geographic distance from Madoff -0.005 -0.005 -0.003 -0.003 -0.004 [0.002] [0.002] [0.002] [0.002] [0.002]
Distance x Jewish Organizations 1.42x10⁻⁷ [9.53x10⁻⁸]
Distance x Jewish Organizations / Religious Organizations
0.104 [0.027]
Distance x Jewish Rev. / Religious Rev. 0.0005 [1.30x10⁻⁵]
Distance x Kosher Restaurants 0.0001
[1.74x10-
4]
Distance x JCC Organizations 0.001 [0.001]
Ln(Median Income) -0.006 -0.005 -0.005 -0.003 -0.001 [0.010] [0.011] [0.010] [0.010] [0.011]
Percent White 0.023 0.018 0.019 0.024 0.023 [0.017] [0.017] [0.017] [0.019] [0.019]
Percent 65+ -0.034 -0.038 -0.033 -0.035 -0.034 [0.049] [0.051] [0.055] [0.050] [0.052]
Percent of 65+ with college degree 0.325 0.366 0.360 0.350 0.350 [0.164] [0.180] [0.186] [0.162] [0.168]
Percent HH with Income 200k+ 0.205 0.154 0.204 0.162 0.150 [0.124] [0.124] [0.124] [0.125] [0.119]
χ2 172.16 136.61 149.47 166.44 164.13 Pseudo R2 0.59 0.59 0.60 0.59 0.59 All models include 3,139 observations, and include a control for the natural log of county population. Robust standard errors in brackets.

Table 6: Mean Partial Elasticities from Negative Binomial Estimates of Madoff Victimization: All Investors (1) (2) (3) (4) (5) (6)
Jewish Organizations 0.007 0.015 0.008 -.006 0.006 0.007 [0.009] [0.020] [0.011] [0.009] [0. 101] [0.010]
Geographic distance from Madoff
0.003 -0.198 -0.059 -0.083 -0.344 -0.171 [0.088] [0.129] [0.116] [0.135] [0.158] [0.161]
Distance x Jewish Organizations 0.008 0.010 0.008 [0.007] [0.011] [0.011]
Jewish Organizations / Religious Organizations
12.7 25.4 15.4 3.23 8.71 4.35 [6.20] [6.60] [6.73] [3.15] [5.11] [3.57]
Geographic distance from Madoff
0.020 -0.187 -.034 -0.138 -0.343 -0.271 [0.085] [0.118] [0.100] [0.087] [0.152] [0.128]
Distance x Jewish Organizations / Religious Organizations
15.2 4.30 10.9 [7.08] [4.93] [5.15]
Total Rev. of Jewish Org./ Total Rev. of Religious Org
4.77 4.98 5.08 3.19 2.61 3.19 [1.41] [1.54] [1.58] [1.03] [0.84] [1.11]
Geographic distance from Madoff
0.015 -0.198 -0.019 -0.076 -0.273 -0.133 [0.069] [0.128] [0.087] [0.053] [0.148] [0.093]
Distance x Jewish Rev. / Religious Rev.
26.0 1.34 2.80 [13.7] [1.63] [1.52]
Kosher Restaurants 0.039 0.075 0.049 0.034 0.039 0.033
[0.022] [0.041] [0.029] [0.017] [0.023] [0.018] Geographic distance from Madoff
0.019 -0.120 -0.028 -0.039 -0.280 -0.129 [0.080] [0.125] [0.092] [0.098] [0.141] [0.096]
Distance x Kosher Restaurants 0.014 0.014 0.014 [0.030] [0.025] [0.026]
JCC Organizations 0.239 0.227 0.207 0.366 0.404 0.253
[0.129] [0.174] [0.139] [0.125] [0.208] [0.152]
JCC Satellites 0.167 0.148 0.202 0.511 0.522 0.592
[0.406] [0.428] [0.412] [0.497] [0.669] [0.488] Geographic distance from Madoff
0.029 -0.171 -0.008 0.129 -0.129 0.138 [0.085] [0.127] [0.099] [0.094] [0.125] [0.149]
Distance x JCC Organizations
-0.136 -0.194 -0.154 [0.057] [0.067] [0.060]
N 308 3,139 3,139 308 3,139 3,139 Additional controls include the log of county population, the percent of residents over 65 with a college degree, the percent of residents who are over 65, the log of median household income, the percent of household earning more than $200k in 2000, and the percent of residents who are white (non-Hispanic). Columns 2, 3, 5 and 6 include the total number of religious organizations(2 and 4) and the total amount of revenue collected by those organizations (3 and 5), as well as the interaction of those measures with distance in columns 5 and 6. Robust standard errors in brackets.

65
Table 7. Mean Partial Elasticities from Negative Binomial Estimates of Madoff Victimization: Non Profit Investors (1) (2) (3) (4) (5) (6)
Jewish Organizations -0.0004 3.05x10⁻⁴ -0.0013 -0.0004 -2.4x10⁻⁵ -0.0013 [0.0006] [0.0007] [0.0008] [0.0006] [0.001] [0.001]
Geographic distance from Madoff
-0.430 -0.698 -0.749 -0.404 -0.669 -0.686 [0.116] [0.189] [0.213] [0.117] [0.192] [0.196]
Distance x Jewish Organizations
-7.52 x10⁻⁵ 0.0002 0.001 [0.0003] [0.0009] [0.001]
Jewish Organizations / Religious Organizations
3.449 3.96 0.718 6.417 3.953 11.844 [5.122] [3.112] [3.227] [3.660] [3.251] [6.321]
Geographic distance from Madoff
-0.305 -0.594 -0.334 -0.365 -1.000 -0.343 [0.1285] [0.183] [0.301] [0.218] [0.272] [0.382]
Distance x Jewish Organizations / Religious Organizations
-4.01 -10.65 -5.16
[6.31] [10.0] [4.86]
Total Rev. of Jewish Org./ Total Rev. of Religious Org
4.386 2.750 5.811 4.472 3.140 5.935
[0.989] [1.475] [1.311] [1.107] [1.689] [1.437]
Geographic distance from Madoff
-0.1057 -0.584 -0.177 -0.0207 -0.468 -0.226 [0.110] [0.168] [0.138] [0.122] [0.187] [0.244]
Distance x Jewish Rev. / Religious Rev.
-0.0004 0.0003 0.0013 -0.0004 -2.4x10⁻⁵ -0.0013 [0.0006] [0.0007] [0.0008] [0.0006] [0.001] [0.001]
Kosher Restaurants 0.010 0.005 0.011 0.011 0.006 0.013
[0.005] [0.006] [0.008] [0.005] [0.006] [0.006] Geographic distance from Madoff
-0.304 -0.664 -0.514 -0.247 -0.621 -0.300 [0.108] [0.201] [0.319] [0.116] [0.205] [0.168]
Distance x Kosher Restaurants
-0.004 -0.004 -0.004 [0.001] [0.001] [0.001]
JCC Organizations 0.234 0.015 0.197 0.222 -0.019 0.155
[0.191] [0.260] [0.310] [0.221] [0.261] [0.342]
JCC Satellites -0.178 -0.027 -0.246 0.408 0.697 0.031 [0.198] [0.499] [0.255] [0.528] [1.01] [0.807]
Geographic distance from Madoff
-0.373 -0.693 -0.556 -0.142 -0.569 -0.182 [0.116] [0.190] [0.207] [0.123] [0.204] [0.205]
Distance x JCC Organizations
-0.093 0.004 -0.018 [0.066] [0.170] [0.018]
N 41 3,139 3,139 41 3,139 3,139 Additional controls include the log of county population, the percent of residents over 65 with a college degree, the percent of household earning more than $200k in 2000, the log of median household income and the percent of residents who are white (non-Hispanic) and the percent of residents who are over 65. Columns 2, 3, 5 and 6 include the total number of religious organizations (2 and 4) and the total amount of revenue collected by those organizations (3 and 5), as well as the interaction of those measures with distance in columns 5 and 6. Robust standard errors in brackets.

66
Table 8: Mean Marginal Effects from Logit Estimates of Madoff Victimization: All Investors (1) (2) (3) (4) (5) (6)
Jewish Organizations 0.009 1.98x10⁻⁴ [0.003] [0.003]
Jewish Organizations / Religious Organizations
0.882 0.633 [0.184] [0.229]
Total Rev. of Jewish Org. / Total Rev. of Religious Org.
0.134 0.064 [0.041] [0.041]
Religious Organizations -3.96x10⁻⁵ -2.57x10⁻⁵ [3.62 x10⁻⁵] [ 3.93x10⁻⁵]
Total Revenue of Religious Org. (100k)
9.60x10⁻¹² 2.23x10⁻¹¹ [1.24x10⁻¹⁰] [1.42x10⁻¹⁰]
Kosher Restaurants 0.025 0.019 [0.007] [0.007]
JCC Organizations 0.050 0.025 [0.016] [0.017]
JCC Satellites -0.015 -0.038 [0.040] [0.047]
Geographic distance from Madoff
-0.020 -0.018 -0.020 -0.016 -0.019 -0.014 [0.005] [0.005] [0.005] [0.005] [0.005] [0.005]
Ln(Median Income) 0.086 0.089 0.097 0.091 0.097 .084 [0.022] [0.022] [0.022] [0.022] [0.023] [0.022]
Percent White 0.106 0.086 0.113 0.114 0.117 0.099 [0.050] [0.051] [0.051] [0.051] [0.053] [0.053]
Percent 65+ -0.165 -0.052 -0.142 -0.169 -0.143 -0.118 [0.133] [0.132] [0.136] [0.138] [0.138] [0.134]
Percent of 65+ with college degree
2.699 2.330 2.752 2.804 2.812 2.387 [0.416] [0.413] [0.406] [0.402] [0.410] [0.407]
Number of Doctors 1.43x10⁻⁵ 3.37x10⁻⁵ 3.21x10⁻⁵ 1.55x10⁻⁵ 2.18x10⁻⁵ 1.41x10⁻⁵
[1.08x10⁻⁵] [1.11x10⁻⁵] [1.14x10⁻⁵] [1.34x10⁻⁵] [1.15x10⁻⁵] [1.31x10⁻⁵] χ2 357.36 384.37 393.99 404.15 409.40 408.53 Pseudo R2 0.51 0.52 0.51 0.52 0.51 0.53 All models include 3,139 observations, and include a control for the natural log of county population. Robust standard errors in brackets.

67
Table 9: Mean Marginal Effects from Logit Estimates of Madoff Victimization: All Investors with Distance Interactions (7) (8) (9) (10) (11)
Jewish Organizations 0.019 [0.005]
Jewish Organizations / Religious Organizations
0.807 [0.272]
Total Rev. of Jewish Org./ Total Rev. of Religious Org.
0.153 [0.066]
Religious Organizations 4.03 x10⁻⁵ [3.62x10-
5]
Total Revenue of Religious Org. (100k) 7.42x10⁻¹² [1.24x10-
10]
Kosher Restaurants 0.024 [0.007]
JCC Organizations 0.058 [0.023]
JCC Satellites -0.018 [0.040]
Geographic distance from Madoff -0.011 -0.019 -0.020 -0.017 -0.019 [0.006] [0.005] [0.005] [0.005] [0.005]
Distance x Jewish Organizations -0.005 [-0.001]
Distance x Jewish Organizations / Religious Organizations
-0.043 [0.139]
Distance x Jewish Rev. / Religious Rev. -0.035 [0.060]
Distance x Kosher Restaurants 0.003 [0.006]
Distance x JCC Organizations -0.007 [0.011]
Ln(Median Income) 0.086 0.089 0.098 0.090 0.098 [0.022] [0.051] [0.022] [0.022] [0.023]
Percent White 0.106 0.086 0.114 0.119 0.117 [0.054] [0.051] [0.051] [0.051] [0.137]
Percent 65+ -0.156 -0.047 -0.143 -0.176 -0.146 [0.130] [0.133] [0.136] [0.139] [0.137]
Percent of 65+ with college degree 2.550 2.335 2.744 2.826 2.822 [0.391] [0.410] [0.405] [0.408] [0.411]
Number of Doctors 1.65x10⁻⁵ 3.38x10⁻⁵ 3.26x10⁻⁵ 1.45x10⁻⁵ 2.22x10⁻⁵ [1.02x10-
5] [1.11x10-
5] [1.13x10⁻⁵] [1.41x10-
5] [1.12x10-
5] χ2 185.84 151.28 196.08 186.84 190.23 Pseudo R2 0.60 0.63 0.61 0.60 0.60 All models include 3,139 observations, and include a control for the natural log of county population. Robust standard errors in brackets.

68
Table 10: Mean Marginal Effects from Logit Estimates of Madoff Victimization: Non Profit Investors (1) (2) (3) (4) (5) (6)
Jewish Organizations 2.21x10⁻⁵ 5.15x10⁻⁵ [1.86x10-
5] [1.16x10-
4] Jewish Organizations / Religious Organizations
0.041 -0.014 [0.020] [0.060]
Total Rev. of Jewish Org. / Total Rev. of Religious Org.
0.006 -0.009 [0.009] [0.013]
Religious Organizations -8.65x10⁻⁶ -1.76x10⁻⁵ [4.04x10-
6] [5.35x10-
6]
Total Revenue of Religious Org. (100k)
-4.00x10-
11
-1.09x10⁻¹¹ [3.51x10-
11] [2.11x10-
11]
Kosher Restaurants 1.82x10⁻⁴ 2.09x10⁻⁴ [1.40x10-
4] [1.87x10-
4]
JCC Organizations 0.003 0.001 [0.002] [0.003]
JCC Satellites -0.004 -0.002 [0.003] [0.003]
Geographic distance from Madoff
-0.003 -0.003 -0.003 -0.003 -0.003 -0.002 [0.002] [0.001] [0.002] [0.002] [0.002] [0.001]
Ln(Median Income) -0.010 -0.003 -0.009 0.009 0.010 -0.002 [0.008] [0.008] [0.008] [0.008] [0.007] [0.003]
Percent White 0.018 0.013 0.016 0.020 0.018 0.017 [0.019] [0.017] [0.019] [0.020] [0.019] [0.018]
Percent 65+ -0.030 -0.052 -0.040 -0.037 -0.029 -0.054 [0.051] [0.052] [0.052] [0.050] [0.052] [0.052]
Percent of 65+ with college degree
0.396 0.443 0.417 0.037 0.386 0.441 [0.158] [0.167] [0.163] [0.050] [0.156] [0.159]
Number of Doctors 1.86x10⁻⁶ 2.88x10⁻⁶ 2.44x10⁻⁶ 1.50x10⁻⁶ 1.75x10⁻⁶ 3.58x10⁻⁶ [9.33x10-
7] [8.63x10-
7] [8.44x10-
7] [1.10x10-
6] [1.13x10-
6] [1.07x10-
6] χ2 189.48 170.66 186.74 184.06 187.61 160.39 Pseudo R2 0.61 0.62 0.60 0.60 0.63 0.61 All models include 3,139 observations, and include a control for the natural log of county population. Robust standard errors in brackets.

69
Table 11: Mean Marginal Effects from Logit Estimates of Madoff Victimization: Non Profit Investors with Distance Interactions (7) (8) (9) (10) (11)
Jewish Organizations 2.03x10⁻⁵ 1.53x10⁻⁵
Jewish Organizations / Religious Organizations
0.030 [0.019]
Total Rev. of Jewish Org./ Total Rev. of Religious Org.
0.007 [0.011]
Religious Organizations -7.47x10⁻⁶ [4.32x10-
6]
Total Revenue of Religious Org. (100k) -4.04x10⁻¹¹ [3.54x10-
11]
Kosher Restaurants 1.80x10⁻⁴ [1.39x10-
4]
JCC Organizations 0.003 [0.002]
JCC Satellites -0.004 [0.002]
Geographic distance from Madoff -0.004 -0.005 -0.003 -0.003 -0.003 [0.002] [0.002] [0.002] [0.002] [0.002]
Distance x Jewish Organizations 6.99x10⁻⁵ [1.19x10-
5]
Distance x Jewish Organizations / Religious Organizations
0.087 [0.027]
Distance x Jewish Rev. / Religious Rev. -0.002 [0.013]
Distance x Kosher Restaurants 2.67x10⁻⁵
[2.00x10-
4]
Distance x JCC Organizations -6.29x10⁻⁴ [0.001]
Ln(Median Income) -0.009 -0.003 -0.010 -0.009 -0.010 [0.007] [0.008] [0.007] [0.008] [0.008]
Percent White 0.019 0.015 0.016 0.020 0.018 [0.019] [0.017] [0.019] [0.020] [0.019]
Percent 65+ -0.035 -0.050 -0.040 -0.037 -0.028 [0.050] [0.050] [0.052] [0.049] [0.051]
Percent of 65+ with college degree 0.399 0.422 0.417 0.407 0.388 [0.156] [0.161] [0.162] [0.154] [0.156]
Number of Doctors 1.53x10⁻⁶ 2.42x10⁻⁶ 2.45x10⁻⁶ 1.46x10⁻⁶ 1.84x10⁻⁶ [1.09x10-
6] [8.89x10-
7] [8.45x10⁻⁷] [1.18x10-
6] [1.14x10-
6] χ2 184.88 156.24 192.95 184.30 189.99 Pseudo R2 0.59 0.61 0.60 0.60 0.60 All models include 3,139 observations, and include a control for the natural log of county population. Robust standard errors in brackets.

Table 12: Mean Partial Elasticities from Negative Binomial Estimates of Madoff Victimization: All Investors (1) (2) (3) (4) (5) (6)
Jewish Organizations 0.003 0.006 -0.0004 -.0025 0.003 0.002 [0.006] [0.012] [0.0005] [0.0052] [0. 006] [0.006]
Geographic distance from Madoff
0.006 -0.164 -0.452 -0.057 -0.266 -0.177 [0.088] [0.136] [0.158] [0.134] [0.147] [0.186]
Distance x Jewish Organizations
0.006 0.010 0.008 [0.015] [0.010] [0.012]
Jewish Organizations / Religious Organizations
12.5 24.1 14.7 1.96 7.23 3.33 [6.00] [5.60] [6.21] [1.78] [4.23] [2.47]
Geographic distance from Madoff
0.037 -0.150 -.032 -0.085 -0.269 -0.233 [0.076] [0.118] [0.097] [0.080] [0.146] [0.111]
Distance x Jewish Organizations / Religious Organizations
12.0 6.33 8.23 [4.20] [4.31] [4.24]
Total Rev. of Jewish Org./ Total Rev. of Religious Org
4.25 3.69 5.38 2.85 2.10 2.80 [1.55] [1.04] [1.19] [1.21] [0.685] [1.23]
Geographic distance from Madoff
0.017 -0.166 -0.278 -0.052 -0.205 -0.130 [0.070] [0.133] [0.229] [0.054] [0.142] [0.086]
Distance x Jewish Rev. / Religious Rev.
1.20 1.39 1.87 [3.10] [1.46] [1.48]
Kosher Restaurants 0.040 0.070 0.005 0.035 0.045 0.039 [0.024] [0.038] [0.005] [0.021] [0.027] [0.023]
Geographic distance from Madoff
0.029 -0.155 -0.403 -0.019 -0.217 -0.076 [0.079] [0.127] [0.168] [0.098] [0.135] [0.023]
Distance x Kosher Restaurants 0.012 0.012 0.012 [0.031] [0.025] [0.023]
JCC Organizations 0.241 0.342 0.041 0.378 0.599 0.343 [0.160] [0.243] [0.247] [0.158] [0.261] [0.180]
JCC Satellites -0.105 -0.535 -0.181 0.005 -0.643 -0.070 [0.420] [0.312] [0.258] [0.452] [0.351] [0.446]
Geographic distance from Madoff
0.030 -0.148 -0.495 0.247 -0.078 0.287 [0.081] [0.136] [0.168] [0.109] [0.127] [0.145]
Distance x JCC Organizations
-0.522 -0.457 -0.509 [0.189] [0.150] [0.167]
N 308 3,139 3,139 308 3,139 3,139 Additional controls include the log of county population, the percent of residents over 65 with a college degree, the percent of residents who are over 65, the log of median household income, the number of doctors, and the percent of residents who are white (non-Hispanic). Columns 2, 3, 5 and 6 include the total number of religious organizations (2 and 4) and the total amount of revenue collected by those organizations (3 and 5), as well as the interaction of those measures with distance in columns 5 and 6. Robust standard errors in brackets.

71
Table 13. Mean Partial Elasticities from Negative Binomial Estimates of Madoff Victimization: Non Profit Investors (1) (2) (3) (4) (5) (6)
Jewish Organizations -0.0003 0.0005 -0.0004 -0.0003 -0.0005 -0.004 [0.0004] [0.0005] [0.0005] [0.0004] [0.0004] [0.0005]
Geographic distance from Madoff
-0.361 -0.626 -0.436 -0.189 -0.517 -0.294 [0.118] [0.184] [0.159] [0.123] [0.177] [0.227]
Distance x Jewish Organizations
-0.001 -0.0009 -0.001 [0.0001] [0.002] [0.001]
Jewish Organizations / Religious Organizations
3.01 4.46 4.52 3.94 2.45 -3.30 [2.12] [2.76] [2.45] [3.33] [2.99] [3.60]
Geographic distance from Madoff
-0.140 -0.476 -0.309 -0.160 -0.758 -0.189 [0.108] [0.170] [0.484] [0.204] [0.239] [0.325]
Distance x Jewish Organizations / Religious Organizations
-1.22 -2.91 -1.68
[4.55] [7.06] [10.6]
Total Rev. of Jewish Org./ Total Rev. of Religious Org
3.98 1.96 5.38 4.292 2.43 5.33 [0.973] [1.29] [1.18] [1. 076] [1.46] [1.51]
Geographic distance from Madoff
-0.107 -0.561 -0.278 -0.061 -0.409 -0.170 [0.117] [0.174] [0.229] [0.141] [0.197] [0.501]
Distance x Jewish Rev. / Religious Rev.
-0.0005 0.0002 -0.003 [0.001] [0.002] [0.008]
Kosher Restaurants 0.007 -0.0003 0.005 0.007 -0.0004 0.006 [0.005] [0.007] [0.005] [0.005] [0.006] [0.186]
Geographic distance from Madoff
-0.281 -0.621 -0.403 -0.163 -0.531 -0.300 [0.115] [0.187] [0.168] [0.112] [0.179] [0.168]
Distance x Kosher -0.003 -0.001 -0.006 Restaurants [0.001] [0.006] [0.004]
JCC Organizations 0.158 0.005 0.041 0.147 -0.028 0.126 [0.162] [0.236] [0.247] [0.135] [0.120] [0.209]
JCC Satellites -0.174 -0.199 -0.181 0.341 0.310 -0.023 [0.176] [0.460] [0.258] [0.346] [0.502] [0.450]
Geographic distance from Madoff
-0.327 -0.641 -0.495 -0.148 -0.407 0.118 [0.126] [0.195] [0.167] [0.130] [0.184] [0.296]
Distance x JCC Organizations
-0.210 -0.084 -0.342 [0.070] [0.140] [0.004]
N 41 3,139 3,139 41 3,139 3,139 Additional controls include the log of county population, the percent of residents over 65 with a college degree, the number of doctors, and the log of median household income, the percent of residents who are white (non-Hispanic) and the percent of residents who are over 65. Columns 2, 3, 5 and 6 include the total number of religious organizations (2 and 4) and the total amount of revenue collected by those organizations (3 and 5), as well as the interaction of those measures with distance in columns 5 and 6. Robust standard errors in brackets.