informality in emerging markets: a cross-country examination
TRANSCRIPT

Informality in Emerging Markets: A Cross-Country Examination 2012 The Global Fairness Initiative www.globalfairness.org
1
EXECUTIVE SUMMARY
Informality encompasses legal economic activities parallel to a nation's regulated economy. The absence of adequate documentation inherent to the informal sector contributes to the legal and economic disempowerment of workers, robbing them of the protections and benefits formalized institutions provide. The parallel economy informality creates tends to be larger in developing nations. In these countries, informal employment functions as a short-term survival strategy. With rapid population growth and urbanization, developing nations have yet to develop adequate social safety nets and regulatory structures to legally represent the majority of their populations. Thus, informal employment absorbs labor force expansion resulting from rapid growth in the absence of sufficient income-generating employment opportunities.i Under these conditions, informal employment contributes substantially to job creation and income generation.ii Chronically high informality levels, however, are indicative of legal and political vulnerability, allowing institutional and regulatory inefficiencies to persist in the long run. Ultimately, informal employment undermines economic stability, providing a short-term solution for long-running, systemic problems. The broad scope of societal, economic, legal, and political issues associated with high informality renders favorable macroeconomic conditions alone insufficient to reduce informal employment in developing nations.iii This report examines the implications of informality in 15 developing nations, focusing on civil society, government, labor, and the private sector. Primary findings include:
• The causes of informality are variable and not mutually exclusive; they tend to exist on a continuum. Two general conditions contribute to the informal economy: ◦ Involuntary exclusion of workers from the formal labor market ◦ Voluntary exclusion of workers as firms choose to “opt out” of the formalized
economy because of ineffective regulatory frameworks
• The informal economy may contribute to short-term economic growth by bolstering income and production levels in developing nations. However, the long-term effects of informality are associated with underdevelopment and stagnation. These long-term effects include: ◦ Distortion and limitations to the power of labor markets at community and individual
levels ◦ Further marginalization of marginalized groups, particularly women and youth
populations ◦ Reduced competitiveness of and investment in the private sector
…local solutions for a global economy
Informality in Emerging Markets: A Cross-Country Examination

Informality in Emerging Markets: A Cross-Country Examination 2012 The Global Fairness Initiative www.globalfairness.org
2
◦ Erosion of the rule of law ◦ Diminished tax base and revenues ◦ Misappropriation of tax and foreign aid funds
DEFINITION & CHARACTERISTICS OF INFORMALITY
Definition Informality encompasses legal economic activities external to a nation's regulated economy. The International Labor Organization (ILO) includes the following types of workers in its definition of informal employment:
• Informal wage employees • Members of informal producers' cooperatives • Own-account workers • Contributing family members • Employers (self-employed with employees) in their own informal sector enterprisesiv
This definition includes unregistered employees without explicit, written contracts or who are not subject to labor legislation, as well as workers who do not benefit from paid annual or sick leave or social security and pension schemes. Most paid domestic employees of households and casual, short-term, and seasonal workers satisfy ILO's definition for informal employment. Notably, ILO's definition excludes agricultural employment.v

Informality in Emerging Markets: A Cross-Country Examination 2012 The Global Fairness Initiative www.globalfairness.org
3
Exclusion of Agriculture from Informal Employment The exclusion of agricultural employment from informal employment is attributable to the nature of this sector. As temporary and often migrant workers comprise a substantial portion of agricultural employment, estimating the number of these laborers proves difficult in regions whose economies rely heavily on agriculture, such as Asia and Africa. The difficulty in quantifying this segment of informality, however, does not negate its significance. Informal agricultural workers account for more than 65% of the estimated total wage employment in most developing regions.
Total informal employment is comprised of two components: employment within the informal sector and employment outside the informal sector. Employment outside the informal sector includes informal self-employment in addition to informal employees employed informally by formal sector employers.vi Characteristics Informality is a fundamental characteristic of underdevelopment, implying vulnerability. Informal employment accounts for more than 50% of non-agricultural employment and 65% of agricultural employment in most developing regions. While informality is conventionally considered the result of involuntary exclusion of workers due to lack of viable employment and distorted regulation, many factors influence the size of the informal economy – including country size, availability of resources and labor, economic development, demographics, and productivity as well as the role of the public sector.vii These factors are not mutually exclusive and likely coexist in a continuum.viii Factors relating to economic development are the predominant causes of informality. Demographic trends characteristic of developing economies, such as rapid population growth and urbanization, often enlarge the informal sector. As the formal labor market struggles to meet the increased demand for jobs, the informal sector tends to absorb most of the expanding labor force in urban areas.ix In many countries, especially those that lack social safety nets or suffer from low wages and pensions, informal employment functions as a survival mechanism.x Additional contributing factors related to economic development levels include the prevalence of wealth, education levels, and labor demand features. Informality generally decreases as wealth increases, but unemployment increases with wealth. This trend suggests lower-income workers pursue informal employment opportunities instead of claiming unemployment, while higher-income workers are better able to afford to claim such a status. Education levels, which generally increase with income, are also negatively correlated with informality. This association

Informality in Emerging Markets: A Cross-Country Examination 2012 The Global Fairness Initiative www.globalfairness.org
4
is partially attributable to more-educated workers entering the formal labor force, with a large education gap existing between the managers of informal versus formal firms.xi Labor demand features, including the types and availability of jobs and workers' relative bargaining power, also influence the size of the informal economy. Informality is higher in countries where agriculture accounts for a large share of total employment and lower where the public sector comprises 30 to 35 of overall employment.xii Informality is also more prevalent among small firms engaged in low-productivity activities with fewer than five workers.xiii Informal employment tends to be higher among the youth population: young informal workers transition to formalized public-sector jobs or self-employment as they become adults.xiv Women are also more likely to be informally employed, as they are more likely to work in unpaid and/or subsistence agriculture.xv Regardless of development levels, an ineffective regulatory environment deters participation in the formal economy, distorting the costs and benefits associated with entrepreneurship and employment.xvi Faced with prohibitive costs or procedures for registering, some entrepreneurs and workers make the rational choice to “opt out” of the formal sector.xvii Imperfect information — for example, lack of awareness about retirement needs and health risks — also affects workers' and firms' decisions to participate in the informal economy. Imperfect information may be associated with exclusion margins, such as geographic location and low human capital. Impoverished workers in remote areas and uneducated agricultural workers, for example, may not have access to or knowledge of social security systems but would participate if they could.xviii A developing country may “outgrow” its informal economy as economic growth facilitates the implementation of more effective regulations. The persistence of ineffective regulations, however, inhibits the equitable allocation of the benefits associated with economic growth, further increasing the size of the informal sector.
Informality is self-perpetuating, providing a short-term solution for long-running, systemic problems.
CAUSES FOR ACTION: THE IMPACTS OF INFORMALITY
While informality is largely associated with negative externalities that may be the source of economic slowdown, it does provide some short-term benefits to the labor market and population. Most significant, informality offers employment opportunities in the form of job creation and serves as a safety net during periods of transition, such as recession.xix By bolstering production and income levels, informality may contribute to a country's overall economy.xx The informal sector can be a source of innovation and entrepreneurship: many firms in developing economies begin operations informally and formalize as they grow. Notably, as employment is a lagging indicator, informal employment may appear to have a positive correlation with economic growth in many developing countries. Despite these potential short-term benefits, the long-term costs associated with informality are extensive. Informality indicates vulnerability, limiting opportunities for economic and social

Informality in Emerging Markets: A Cross-Country Examination 2012 The Global Fairness Initiative www.globalfairness.org
5
development at both individual and community levels.xxi The overarching consequences of informality are economic instability and stagnation, including income inequality and high rates of poverty. Informality’s negative effects can become endemic, spanning labor markets and institutions, the private sector, and governments. This report focuses on the negative impacts most strongly associated with informality, including: Labor markets and institutions: • Legal and economic disempowerment of workers • Limited access to credit by informal workers and firms • Segmentation of the labor market
Private Sector: • Reduced competitiveness • Deterred domestic and foreign investment
Governments: • Erosion of the rule of law • Diminished tax revenues • Decreased effectiveness and efficiency of foreign aid
The effects of informality are not limited to those in this report. The direct and indirect consequences of informality may vary depending on the role informality plays within a particular economy as well as its size relative to the formal sector. Regardless of the circumstances, informality is self-perpetuating, becoming more difficult to address as the parallel economy develops in size and importance. Because of the broad scope of societal, economic, legal, and political issues associated with informality, favorable macroeconomic conditions alone are insufficient to reduce informal employment in developing nations.xxii Effective strategies for reducing informal employment via transition to the formal sector must emphasize legal empowerment of workers along with regulatory reforms appropriate to country-specific factors.

Informality in Emerging Markets: A Cross-Country Examination 2012 The Global Fairness Initiative www.globalfairness.org
6
DATA ANALYSIS: INFORMALITY IN THE DEVELOPING WORLD
This report examines the short- and long-term effects of informality on labor markets and institutions, the private sector, and governments in 15 developing countries:1
Africa Kenya South Africa Uganda
Asia & Europe Indonesia Kyrgyzstan Ukraine
Central America Costa Rica Honduras Mexico Nicaragua Panama
South America Colombia Ecuador Peru Uruguay
Overview Generally, the size of a nation's informal economy is negatively correlated with its rate of national growth.xxiii The statistical link between informality and economic performance remains ambiguous because informality is self-perpetuating, both contributing to and resulting from instability. Thus, some measures of economic performance may appear to be stable or increasing in developing countries that rely heavily on the informal sector. The cross-country comparisons made in this report are subject to a multitude of external factors, rendering some trends regarding informality inconsistent across countries and regions. The sample countries with the highest gross domestic product (GDP) levels illustrate how reliance on the informal sector may result in stable performance measures despite the existence of systemic problems. These sample countries include Mexico, Indonesia, South Africa, Colombia, Peru, and Ukraine. Despite growing GDP rates, most of these countries suffer from income inequality, low per-capita incomes, or high poverty rates in addition to other issues. For instance, both Indonesia and Ukraine exhibit per-capita GDP levels of about $1,000, on par with less developed countries such as Nicaragua. South Africa has the highest Gini index values of the sample countries, decreasing from 67 to 63 over the reference period, indicating a high degree of income inequality. South Africa also suffers from a poverty headcount ratio at $2 per day of 31%, indicating that nearly one-third of South Africa's population subsists on an income of less than $2 per day. In addition, South Africa's unemployment rate was significantly higher than those of other sample countries, reaching 24% of the labor force in 2010. Notably, many of the sample countries with the highest GDP levels also exhibit informality rates in excess of 50% of non-agricultural employment, including Mexico, Indonesia, Colombia, and Peru. The remaining sample countries with high GDP levels experienced substantial increases in informality over the reference period. 1 See Appendix A, “Statistical Considerations,” and Appendix B, “Country Backgrounds,” for clarification regarding data sources and cross-‐country comparisons.

Informality in Emerging Markets: A Cross-Country Examination 2012 The Global Fairness Initiative www.globalfairness.org
7
Informal Employment (% of total non-agricultural employment)

Informality in Emerging Markets: A Cross-Country Examination 2012 The Global Fairness Initiative www.globalfairness.org
8
GDP (2000, US$, billions)

Informality in Emerging Markets: A Cross-Country Examination 2012 The Global Fairness Initiative www.globalfairness.org
9
The impacts of informality appear more congruent among the sample countries with the lowest GDP levels, including Uganda, Honduras, Nicaragua, and Kyrgyzstan. Informality rates exceeded 50% of non-agricultural employment by 2010 in each of these countries, with each of them except Uganda experiencing a double-digit increase. Income inequality is less prevalent among these low-income countries, where per-capita GDP levels were less than $1,500. Poverty rates were generally high, with more than one-third of the populations in Nicaragua and Honduras as well as 65% of Uganda's population subsisting on less than $2 per day. The high prevalence of poverty in these countries is likely attributable to their economies' reliance on agriculture: this sector accounted for more than one-third of employment in Honduras, Nicaragua, and Kyrgyzstan, and 66% in Uganda. Productivity in the agricultural sector tends to be low in developing countries, translating to low wage rates for agricultural

Informality in Emerging Markets: A Cross-Country Examination 2012 The Global Fairness Initiative www.globalfairness.org
10
workers. Indeed, agriculture comprised 21% of GDP in Nicaragua and Kyrgyzstan, 25% in Uganda, and 14% in Honduras.
!"!#$%$&'$()$)*+,-./'0.1$23$!""45$6$7778/90:*9;*-<.=++80</$6$>=9$!"!8?@?8@"!!$6$AB*-9C$-.;0D/90:*9;*-<.=++80</$ !
!""# !""$ !""% !""& !""' !""( !"") !"*""
*
!
#
$
%
&
'
(
)
*"!"#$%&'$()%*+)$,-...$/012$+3456)7869$
+,-,./01 +,23145061 76819,: ;,<98:12 =<9,<>201
?><@1 ?@:A@B231< C>D06, E061:1A81 F1<1.1
F>:8 G,83H4IJ:061 KA1<91 KL:10<> K:8A81@

Informality in Emerging Markets: A Cross-Country Examination 2012 The Global Fairness Initiative www.globalfairness.org
11
Agricultural employment is often largely associated with informality, further depressing wage rates. Detailed informality data for select years indicate the portion of agricultural wage employment attributable to informality for select sample countries. In Uganda, Kyrgyzstan, Honduras, and Nicaragua, informality accounted for at least 78% of total agricultural wage employment. Notably, informal agricultural employment was high in other sample countries with low per-capita GDP levels, such as Indonesia, Ecuador, and Peru.
Reliance on agriculture engenders other labor issues related to informality, including child employment.2 Among children 7-14 years of age, 99% in Kyrgyzstan, 95% in Uganda, and more than 60% in Honduras and Nicaragua worked in the agricultural sector. LABOR MARKETS & INSTITUTIONS
Informality is detrimental to workers, labor markets, and their institutions. It disempowers workers, restricting or eradicating their ability to seek protection or use the law to advance rights and interests as citizens and economic actors.xxiv Informality also limits both firms' and workers' access to and use of credit and contributes to labor market segmentation, undermining the economic contribution of marginalized groups. Ultimately, informality distorts labor supply and demand features and increases the prevalence of poverty, eroding relations between workers and firms. Legal Disempowerment The absence of adequate documentation inherent to the informal sector renders its participants exempt from taxation or national labor legislation. Informal workers do not benefit from legal 2 See sub-‐heading “Labor Market Segmentation” under the “Labor Markets & Institutions” section for further analysis.

Informality in Emerging Markets: A Cross-Country Examination 2012 The Global Fairness Initiative www.globalfairness.org
12
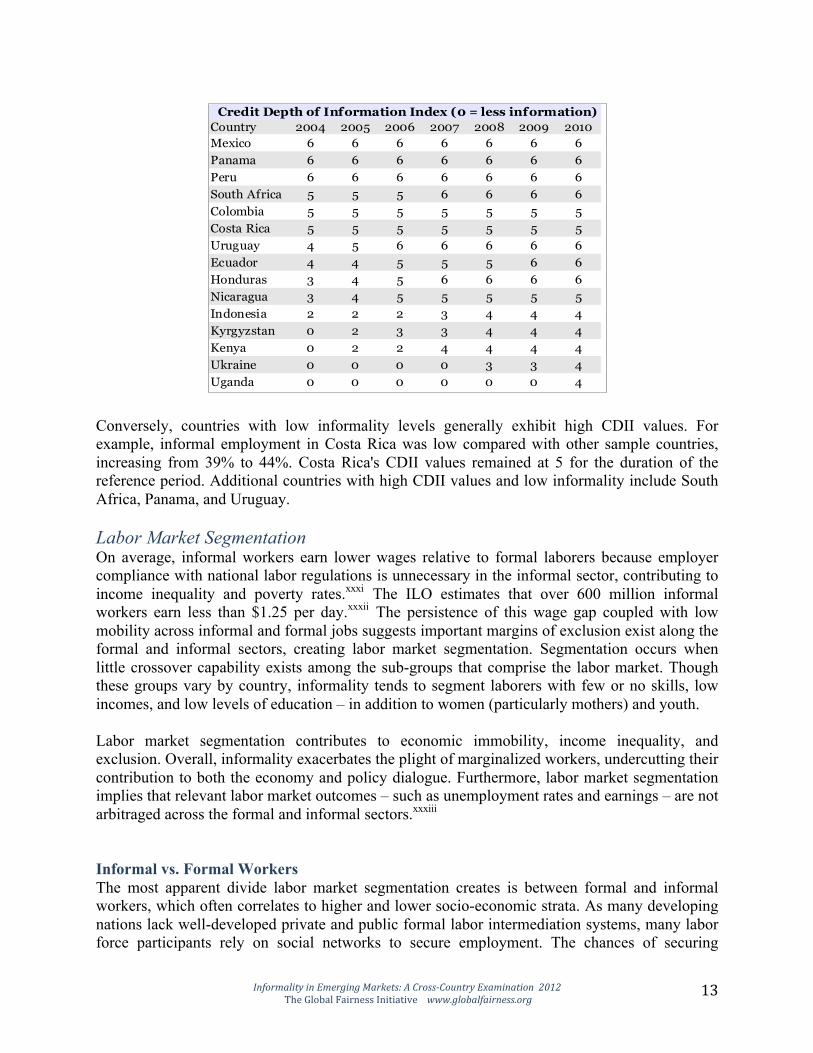
protections, receive employment benefits such as paid sick leave, or participate in social safety net schemes such as unemployment insurance. Informality disempowers workers in a legal context by eliminating their ability to seek enforcement of labor market regulations (such as a minimum wage), ensure redress for violations and employer abuses, or utilize collective bargaining power. Informal workers often endure significant occupational risks, including less safe and decent work environments, as well as risks related to old age and health problems.xxv Notably, informality can also impact employees in the formal sector. Informality diminishes the ability of trade unions (both formal and informal) to secure or maintain legally protected rights and benefits. Competition from informal laborers willing to work for comparatively lower compensation weakens trade unions, limiting their bargaining power with employers and their influence in policymaking.xxvi The United Nations (UN) notes legal empowerment of the poor as a necessary condition for creating an environment that enables the provision of sustainable livelihoods and the eradication of poverty.xxvii With its inherent disempowerment of the working poor, informality jeopardizes the ability of developing countries to ensure sustainable and equitable growth. Credit Access and Use The lack of documentation intrinsic to informality affects how informal workers may use or capitalize on their earnings, limiting access to financial and public services and the use of income as collateral for credit purposes.xxviii Capital resulting from informal income or used in an informal business transaction (“dead capital”)xxix is not legally protected, precluding division or recombination to raise additional capital. Informal enterprises sustain many of the same externalities associated with lack of documentation, but the associated opportunity cost is potentially much higher. The inability to access the formal property rights system eliminates the incentive for informal entrepreneurs to invest in the human and physical capital necessary for large-scale, long-term investment, eradicating the opportunity to specialize and develop economies of scale.xxx The World Bank's credit depth of information index (CDII) provides a quantitative measure of access to credit.3 The sample countries' CDII values roughly correspond with relative informality levels. Uganda's CDII remained at zero for much of the reference period, increasing to 4 in 2010. Uganda's CDII values are consistent with its comparatively high informality rates, which increased from 67% to 69% over the reference period. Other countries with generally low CDII values and high informality rates include Indonesia, Kenya, and Kyrgyzstan.
3 Credit depth of information index measures rules affecting the scope, accessibility, and quality of credit information available through public or private credit registries. The index ranges from 0 to 6, with higher values indicating the availability of more credit information, from either a public registry or a private bureau, to facilitate lending decisions. Values for 2003 are unavailable.
Informality in Emerging Markets: A Cross-Country Examination 2012 The Global Fairness Initiative www.globalfairness.org
13
Conversely, countries with low informality levels generally exhibit high CDII values. For example, informal employment in Costa Rica was low compared with other sample countries, increasing from 39% to 44%. Costa Rica's CDII values remained at 5 for the duration of the reference period. Additional countries with high CDII values and low informality include South Africa, Panama, and Uruguay. Labor Market Segmentation On average, informal workers earn lower wages relative to formal laborers because employer compliance with national labor regulations is unnecessary in the informal sector, contributing to income inequality and poverty rates.xxxi The ILO estimates that over 600 million informal workers earn less than $1.25 per day.xxxii The persistence of this wage gap coupled with low mobility across informal and formal jobs suggests important margins of exclusion exist along the formal and informal sectors, creating labor market segmentation. Segmentation occurs when little crossover capability exists among the sub-groups that comprise the labor market. Though these groups vary by country, informality tends to segment laborers with few or no skills, low incomes, and low levels of education – in addition to women (particularly mothers) and youth. Labor market segmentation contributes to economic immobility, income inequality, and exclusion. Overall, informality exacerbates the plight of marginalized workers, undercutting their contribution to both the economy and policy dialogue. Furthermore, labor market segmentation implies that relevant labor market outcomes – such as unemployment rates and earnings – are not arbitraged across the formal and informal sectors.xxxiii Informal vs. Formal Workers The most apparent divide labor market segmentation creates is between formal and informal workers, which often correlates to higher and lower socio-economic strata. As many developing nations lack well-developed private and public formal labor intermediation systems, many labor force participants rely on social networks to secure employment. The chances of securing

Informality in Emerging Markets: A Cross-Country Examination 2012 The Global Fairness Initiative www.globalfairness.org
14
formalized employment are significantly higher if one's parent holds such a position. Conversely, informal laborers are more likely than formal employees to work informally for a family member or friend.xxxiv Such a reliance on personal connections distorts labor supply features by limiting the available talent pool from which firms can hire employees. Informal employees earn lower incomes, tend to be less educated, and are less likely to receive on-the-job training. Furthermore, low earnings reduce the incentive or ability of informal workers to improve their skill set, partially as a result of needing to work longer hours to earn a sustainable income.xxxv Thus, informality creates segmentation between low-skilled, informal laborers and educated, formal workers. Comparison of educational attainment rates with unemployment levels among the sample countries illustrates this divide. For example, during the study period, the highest level of education attained by about 55% of the labor force in Costa Rica was primary school, but these workers accounted for 67% of unemployment. Costa Rican workers with a secondary education level comprised roughly equal portions of the labor force and the unemployed, about 24% and 23%, respectively. Workers with a tertiary-education level, however, represented 18% of the labor force and only 8% of unemployment. A similar trend among workers with a secondary-education level is evident in Kyrgyzstan, Panama, South Africa, and Ukraine. Examination of the percentage of firms offering formal training to employees further demonstrates segmentation between skilled and unskilled workers. Generally, countries with high informality – such as Honduras, Indonesia, Kenya, Kyrgyzstan, and Uganda – have fewer firms offering formal training. In contrast, countries with lower levels of informality – including Mexico, South Africa, Ukraine, and Uruguay – have comparatively more firms offering formalized training.
Another factor contributing to labor market segmentation is the existence of ineffective labor regulations. These regulations might include strictly enforced minimum wage levels that do not appropriately reflect actual conditions, restrictive termination requirements, and overly generous severance pay. In response, firms may resort to employing workers informally to circumvent costly regulations, reinforcing segmentation between “insiders” (formal, protected employees) and “outsiders” (informal workers).xxxvi

Informality in Emerging Markets: A Cross-Country Examination 2012 The Global Fairness Initiative www.globalfairness.org
15
Informality within the formal sector reached about 80% of total non-agricultural informal employment in Indonesia, Honduras, and Peru. These data suggest ineffective labor and enforcement regulations contribute significantly to informality rates in these countries.
Women Women are perhaps the most segmented sub-group of the labor market because of informality. The parallel economy is generally a larger source of employment for women, who tend to perform the most hazardous and poorly compensated jobs. In developing nations, female vulnerability in this context is partially attributable to cultural attitudes that emphasize domesticity: societal norms may preclude work outside the home, limiting a woman's economic activities. The prevalent relegation of household work and childcare to women also constrains job opportunities for females. Absent public and private support, informal employment is often the only option that affords low-income women the flexibility to balance income-generating activities with family responsibilities.xxxvii Data for fertility rates and the percentage of women ages 20-24 years first married by age 18 years provide some insight regarding gender-based social attitudes among the sample countries. Nicaragua, Honduras, and Kenya each exhibited high fertility rates along with a relatively large portion of young women first married by age 18 years. Congruently, these countries experienced relatively high female informality rates of roughly 67%, 58%, and 65%, respectively. Sample countries with high fertility rates alone, including Uganda and Peru, also experienced significant female informality rates. Female informal employment was generally highest among Central American sample countries, where women have a diminished participation in the national labor force, with total female labor participation rates falling below 45% of the labor force, compared with the roughly 60% female participation rate among the total labor force in the other sample countries. This discrepancy

Informality in Emerging Markets: A Cross-Country Examination 2012 The Global Fairness Initiative www.globalfairness.org
16
suggests that strong social and cultural norms in the Central American sample countries discourage women from entering the formalized workforce.
Beyond child-rearing, other social norms in developing countries may require women to spend most of their time at home, such as female responsibility for the majority of household tasks and constraints regarding how far a woman may travel. Self-employment enables women confined to their homes in developing countries to balance professional and familial duties. In a study of small enterprises in Bangladesh, 13 percent of women reported family responsibilities as a reason for pursuing entrepreneurial activities, compared with less than 1 percent of men. The same study also found that female entrepreneurs in Tunisia and Zimbabwe were more likely than their male counterparts to work at time intervals throughout the day or to work only mornings, afternoons, or evenings to meet unpaid domestic duties. Formal self-employment requires registration or a similar process, often deterring women from operating their business within the formal economy. In Zambia and Tanzania, women reported that the time required to register a business was burdensome and directly conflicted with family responsibilities.xxxviii
!"#$!%&'()#*+,-#./,-#012#*.,-#$345367893():#;!<393$-#40=5(3#6!%17$834#<87'#'8&'#"3$78(87)#$0734#0(!13#0(4!#3>53$831632#48&18"86017#"3=0(3#81"!$=0(87)#$0734-#816(%281&#?&0120#012#@3$%:#
A173$34781&()-#"3=0(3#81"!$=0(#3=5(!)=317#<04#&313$0(()#'8&'347#0=!1&#B317$0(#C=3$8601#40=5(3#6!%17$834-#<'3$3#"3=0(3#(0D!$#50$78685078!1#$0734#"3((#D3(!<#E.,#!"#7'3#(0D!$#"!$63-#6!=50$32#<87'#$!%&'()#*F,#50$78685078!1#$0734#0=!1'3#7!70(#(0D!$#"!$63:#G'84#2846$35016)#4%&&3474#4!680(#012#6%(7%$0(#1!$=4#81#7'3#B317$0(#C=3$8601#40=5(3#6!%17$834#2846!%$0&3#<!=31#"$!=#3173$81'3#"!$=0(8H32#<!$I"!$63:
J3)!12#6'8(2K$30$81&-#!7'3$#4!680(#1!$=4#81#2393(!581!%17$834#=0)#$3L%8$3#<!=31#7!#45312#=!47#!"#7'38$#78=3#07#'!=3-#4%6'#04#"3=0(3#$345!148D8(87)#"!$#7'3#=0M!$87)#!"#'!%43'!(2#704I4#012#6!147$08174#$3&0$281&#'!<#"0$#0#<!=01#=0)#7$093(:#B!1"8132#7!#7'38$#'!=3-#43("K3=5(!)=317#0(4!#310D(34#<!=31#81#2393(!581!%17$834#7!#D0(0163#5$!"3448!10(#012#"0=8(80(#2%7834:#A1#0#47%2)#!"#4=0((#3173$5$8434#81#J01&(0234'-#NO#53$6317#!"#<!=31#$35!$732#"0=8()#$345!148D8(87834#04#0#$304!1#"!$#5%$4%81Ľ$35$313%$80(#0678987834-#6!=50$32#<87'#(344#7'01#N#53$6317#!"#=31:#G'3#40=3#47%2)#0(4!#"!%12#7'07#"3=0(3#317$35$313%$4#81#G%18480#012#P8=D0D<3#<3$3#=!$3#(8I3()#7'01#7'38$#=0(3#6!%173$50$74#7!#<!$I#07#78=3#8173$90(4#7'$!%&'!%7#7'3#20)#!$#7!#<!$I#!1()#=!$181&4-#0"73$1!!14-#!$#393181&4#7!#=337#%15082#2!=34786#2%7834:#;!<393$-#"!$=0(#43("K3=5(!)=317#$3L%8$34#$3&847$078!1#!$#0#48=8(0$#5$!6344-#2373$$81&#<!=31#"$!=#0((!<81'38$#D%481344#7!#!53$073#<87'81#7'3#"!$=0(#36!1!=):#A1#P0=D80#012#G01H0180-#<!=31#$35!$732#7'07#7'3#78=3#$3L%8$32#7!#$3&8473$#0#D%481344#<04#D%$2314!=3#012#28$367()#6!1"(86732#<87'#"0=8()#$345!148D8(87834:O+
G'3#53$63170&3#!"#81"!$=0(#43("K3=5(!)=317#077$8D%70D(3#7!#<!=31#<04#'8&'347#0=!1!%17$834#<87'#6%(7%$0(#07787%234#7'07#3=5'048H3#0#<!=01Q4#$!(3#81#7'3#'!=3-#816(%281&#;!12%$04-#R860$0&%0-#@3$%-#012#?&0120:#R!70D()-#"3=0(3#81"!$=0(#43("K3=5(!)=317#<04#&313$0(()#'8&'347#81#B317$0(#C=3$8601#40=5(3#6!%17$834:
!"!#$%$&'$()$)*+,-./'0.1$23$!""45$6$7778/90:*9;*-<.=++80</$6$>=9$!"!8?@?8@"!!$6$AB*-9C$-.;0D/90:*9;*-<.=++80</$ !"
!"#$%&%$'()*$"(+,%#$-.(/"#(012*34
B!%17$) SFFO SFFE SFF. SFF* SFF+ SFF/ SFFT SFNF
?&0120 + + + + * * * *
U31)0 . . . . . . . .
E E O O O O O O
U)$&)H4701 O O O O O O O O
R860$0&%0 O O O O O O O O
@3$% O O O O O O O O
O O O O O O O S
@010=0 O O O O O O O S
V!%7'#C"$860 O O O O O O S S
B!(!=D80 O O S S S S S S
O O S S S S S S
S S S S S S S S
A12!13480 S S S S S S S S
S S S S S S S S
?I$0813 N N N N N N N N
;!12%$04#
W6%02!$#
X3>86!#
B!470#Y860#
?$%&%0)#
B!%17$) Z30$ @3$63170&3
B!(!=D80 SFF. SO
SFFE SS
A12!13480SFF* OT
SFF+ SS
U31)0SFFO SE
SFFT S*
U)$&)H4701 SFFO S.
SFF* NF
R860$0&%0SFF* SO
SFF+ EN
@3$%SFF. N/
SFFT NT
V!%7'#C"$860 SFFE N+
?&0120 SFFO *
?I$0813
SFF. *
SFF* E*
SFF+ NF
512"3(!%#.$(6*##%"7(,'(89"(:;( (+<(012"3(*9".(=>?=@('"*#.4
;!12%$04#
X3>86!#

Informality in Emerging Markets: A Cross-Country Examination 2012 The Global Fairness Initiative www.globalfairness.org
17
Female Informal Employment (% of total non-agricultural employment)

Informality in Emerging Markets: A Cross-Country Examination 2012 The Global Fairness Initiative www.globalfairness.org
18
The percentage of informal self-employment attributable to women was highest among countries with cultural attitudes that emphasize a woman's role in the home, including Honduras, Nicaragua, Peru, and Uganda. Notably, female informal self-employment was generally highest in Central American sample countries.
Female informal employment is particularly detrimental to long-term economic mobility in developing nations. Impoverished mothers are especially vulnerable, as economic need may compel all household members to seek employment. The precarious alternatives these women have to affordable childcare are often limited to leaving children alone during work hours, enlisting the help of an older sibling, or bringing children to the job site. Each of these alternatives contributes to destitution in the long run, trapping the family in a cycle of poverty. For example, older siblings may compromise educational and employment opportunities to provide childcare. Younger children who accompany their mothers to work gradually take on work tasks as they grow, contributing to issues of child labor as well as informality.xxxix Children of any age who accompany their mothers to work can be exposed to unhealthy work environments and may forgo educational opportunities. Notably, several countries with high female informality rates – Honduras, Nicaragua, Panama, Peru, and Uganda – also exhibited high rates of child employment. In these countries, the agricultural sector employed more than 60% of children ages 7-14 years. Mothers, too, suffer the negative consequences of performing informal labor to enable the supervision of their children while they work. As informal labor is typically low paying, mothers must work longer hours to ensure subsistence-level earnings, detracting from time and income for their families. Mothers with children at work also have less time to invest in professional pursuits, such as training, further limiting income potential.xl

Informality in Emerging Markets: A Cross-Country Examination 2012 The Global Fairness Initiative www.globalfairness.org
19
Youth Finally, informality segments the youth population. Informal workers are likely to be younger, as many labor force participants transition from informal to formal employment upon reaching adulthood.xli In Mexico, young labor force participants typically work in the informal sector for two years before transitioning to formalized employment.xlii Among the sample countries, youth unemployment rates generally declined over the reference period, but were higher than both overall and female unemployment rates. For much of the study period, at least a quarter of the population between 15-24 years of age was unemployed in South Africa, Uruguay, Indonesia, Panama, and Colombia. Youth unemployment reached 48 percent in South Africa. PRIVATE SECTOR
Many of the growth-suppressing problems that informality creates manifest themselves in the private sector. Informality negatively affects the development process, limiting the dynamism and competitiveness of the private sector and stifling foreign direct investment over the long-term.xliii Participation in the informal economy is preferable to formalization when firms or workers are unable to comply with or can easily circumvent costly regulations, such as high taxes, bureaucratic complexity, and administrative requirements.xliv Among the primary concerns entrepreneurs cite as obstacles to formalization, corruption ranked the highest, followed by business licensing and permitting, tax administration and rates, labor regulations, and access to financing.

Informality in Emerging Markets: A Cross-Country Examination 2012 The Global Fairness Initiative www.globalfairness.org
20
Accountability, Transparency & Corruption The parallel economy is in essence the private sector's response to an ineffective and inefficient regulatory environment.xlv An ineffective regulatory framework lacks accountability and transparency, encouraging corruption and eroding competitiveness. With the absence of documentation or registration of its activities, the informal sector inherently lacks accountability. Accountability allows governing bodies and market participants to attribute credit or liability for economic activities or violations while informality obscures the identity of economic actors. The formal sector contributes to this problem, however, by failing to register when operations first begin, sometimes taking years to complete the bureaucratic requirements to formalize a business. Indeed, some firms never register at all.xlvi

Informality in Emerging Markets: A Cross-Country Examination 2012 The Global Fairness Initiative www.globalfairness.org
21
Indonesia had the lowest portion of firms formally registered upon start-up (29%) as well as the second-longest period before formalization (2.4 years). Nicaragua also had a low rate of initial registration (74%), as well as the third-longest period before formalization (2 years). Notably, Indonesia and Nicaragua exhibited higher informality rates of about 65% and 74%, respectively. Additional countries with lengthy periods before formalization include Colombia (1.4 years) and Kyrgyzstan (4.3 years). Informal employment in Colombia remained at about 60% throughout the reference period, while in Kyrgyzstan informality jumped from 24% to 59%. Generally, upwards of 80% of firms in most sample countries were formally registered when operations started, or formalized within about a year or less. Informality expands to include non-registered self-employment as well as informal employees working within the formal sector. Formal firms may hire employees informally to circumvent costly labor regulations, contributing to a lack of accountability in the market.xlvii Informality outside the informal sector was generally less than 20% in most of the sample countries, indicating that most informal employment occurs at informal enterprises. Informal employment external to its sector was largest in Ecuador and Peru, where 24% and 22% of formal non-agricultural employment was attributable to informality, respectively. Of the roughly one-fifth of informal employment external to its sector in Ecuador and Peru, 70% and 80%, respectively, occurred within the formal sector. Notably, total informal employment in Ecuador and Peru was about 60% and 71%, respectively, over the reference period. Of the remaining sample countries, Indonesia and Honduras exhibited rates of 79% and 78%, respectively, of informal employment occurring in the formal sector. Overall, many of the sample countries had rates in excess of 40% of informality within the formal sector, permeating the lack of accountability fostered by the parallel economy into the formal economy. Transparency is another key component of any effective regulatory framework. Just as it lessens accountability, the lack of documentation inherent to informality reduces transparency or the reliability of relevant information (such as policy, capital transactions, and market indicators). For instance, both small and large firms may not register their activities to avoid paying taxes or other administrative costs in part or in full. This practice underestimates actual labor force participation rates, skewing policy decisions and appropriation of tax funds.

Informality in Emerging Markets: A Cross-Country Examination 2012 The Global Fairness Initiative www.globalfairness.org
22
Among the sample countries, Uganda and Costa Rica had the highest percentages of firms that did not report all sales data for tax purposes, 74% and 68%. Uganda had one of the highest informality rates of all the sample countries, decreasing from 76% to 65%; and Costa Rica's informal employment levels increased from 39% to 44% over the same period. Ukraine exhibited the lowest levels of firms that do not report all sales data for tax purposes at 27%; this country also had one of the lowest levels of informality, increasing to 9% by 2010. Furthermore, a prevalence of uncertainty in the market creates barriers to competition among formal and informal firms alike. Policy uncertainty and discretion in regulatory implementation constrain investment and reinforce the role of existing firms, eroding competition within both the parallel and formalized economies.xlviii Informal firms may exercise competitive advantage over formalized firms as a result of lower input costs attributable to tax evasion and labor abuses. Ultimately, informality threatens the competitiveness of both formal and informal enterprises within an economy, reducing a country's ability to participate in globalized markets.xlix This trend is apparent in countries with high informality rates, as firms in these countries rate the practices of both the generalized informal sector and competitors in the informal sector as major constraints to business. For example, 55% of firms in Colombia and 51% of firms in Peru identified this factor. Informality rates in both these countries were high, remaining at 60% in Colombia and decreasing to 71% in Peru. Countries with lower rates of informality, such as Panama and South Africa, had fewer firms cite this factor, at 6% and 11% respectively.

Informality in Emerging Markets: A Cross-Country Examination 2012 The Global Fairness Initiative www.globalfairness.org
23
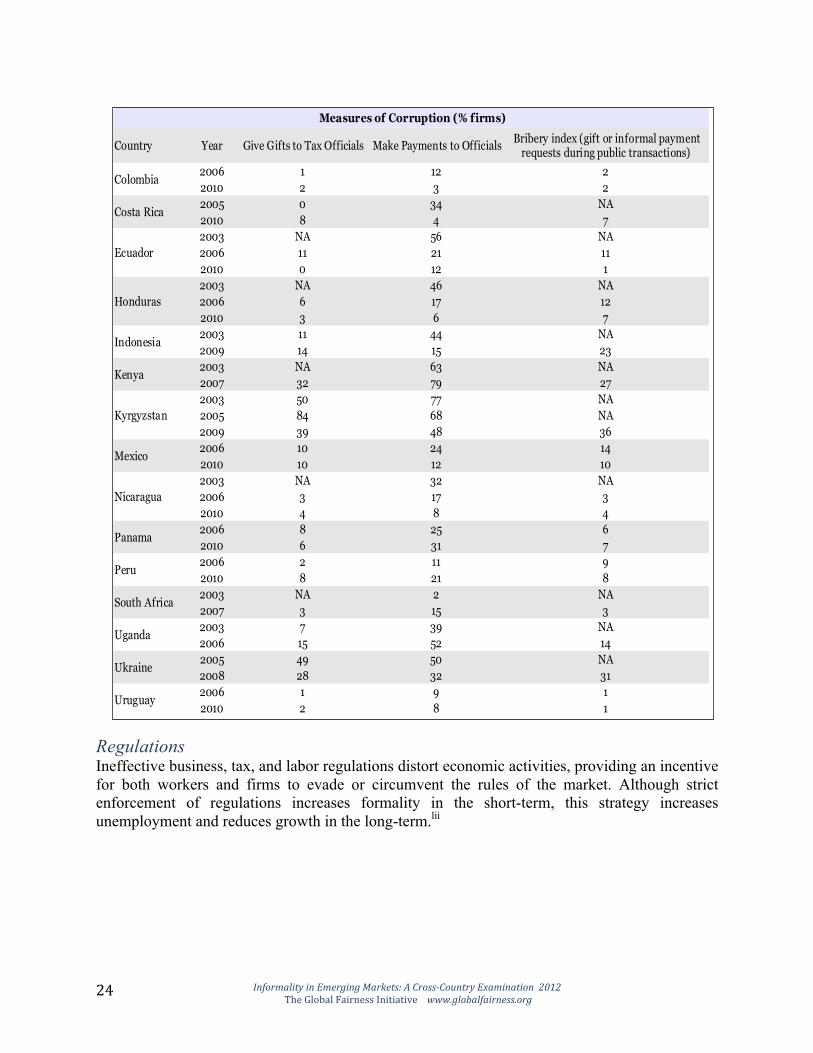
Lack of accountability and of transparency breeds corruption, constraining investment, increasing the costs of goods and services, and distorting economic activity.l Corruption and the size of the informal economy are positively correlated.li Quantitative measures of corruption include the percentage of firms expected to give gifts in meetings with tax officials and the percentage of firms making informal payments to public officials. An additional measure of corruption is the World Bank's bribery index, which is the percentage of firms that report requests for gifts or informal payments during public transactions. Countries with high informality rates generally exhibited more prevalent corruption. Corruption was most widespread in Kyrgyzstan and Kenya. The percentages of firms expected to give gifts in meetings with tax officials and make informal payments during meetings with public officials were 84% and 77% in Kyrgyzstan and 32% and 79% in Kenya; however, these figures did decrease by 2009. These two countries also exhibited relatively high bribery index values of 36% in Kyrgyzstan and 27% in Kenya. Conversely, corruption was less prevalent in countries with low informality, such as South Africa and Uruguay. In these countries, the percentages of firms expected to give gifts in meetings with tax officials and make informal payments during meetings with public officials were 3% and 15% in South Africa and 2% and 8% in Uruguay. Furthermore, South Africa and Uruguay exhibited low bribery index values of 3% and 1%, respectively. Informality rates in these two countries were approximately 33% in South Africa and 40% in Uruguay, relatively low compared with other sample countries.
Informality in Emerging Markets: A Cross-Country Examination 2012 The Global Fairness Initiative www.globalfairness.org
24
Regulations Ineffective business, tax, and labor regulations distort economic activities, providing an incentive for both workers and firms to evade or circumvent the rules of the market. Although strict enforcement of regulations increases formality in the short-term, this strategy increases unemployment and reduces growth in the long-term.lii
Informality in Emerging Markets: A Cross-Country Examination 2012 The Global Fairness Initiative www.globalfairness.org
25
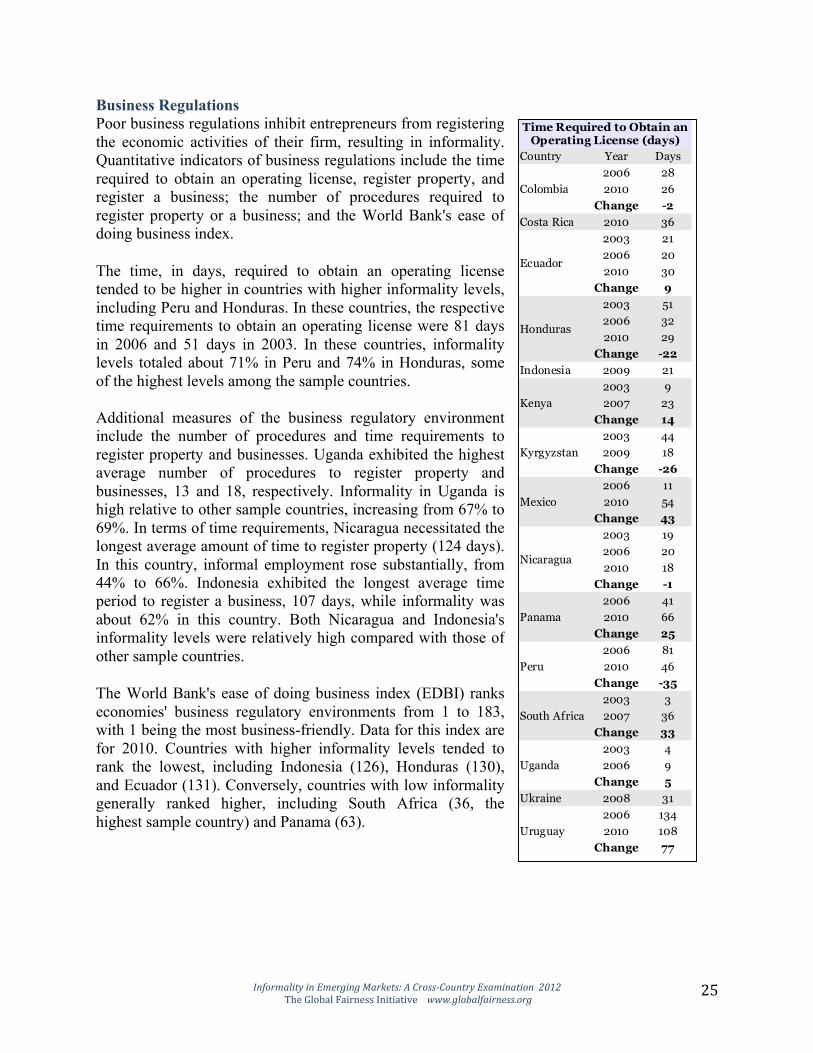
Business Regulations Poor business regulations inhibit entrepreneurs from registering the economic activities of their firm, resulting in informality. Quantitative indicators of business regulations include the time required to obtain an operating license, register property, and register a business; the number of procedures required to register property or a business; and the World Bank's ease of doing business index. The time, in days, required to obtain an operating license tended to be higher in countries with higher informality levels, including Peru and Honduras. In these countries, the respective time requirements to obtain an operating license were 81 days in 2006 and 51 days in 2003. In these countries, informality levels totaled about 71% in Peru and 74% in Honduras, some of the highest levels among the sample countries. Additional measures of the business regulatory environment include the number of procedures and time requirements to register property and businesses. Uganda exhibited the highest average number of procedures to register property and businesses, 13 and 18, respectively. Informality in Uganda is high relative to other sample countries, increasing from 67% to 69%. In terms of time requirements, Nicaragua necessitated the longest average amount of time to register property (124 days). In this country, informal employment rose substantially, from 44% to 66%. Indonesia exhibited the longest average time period to register a business, 107 days, while informality was about 62% in this country. Both Nicaragua and Indonesia's informality levels were relatively high compared with those of other sample countries. The World Bank's ease of doing business index (EDBI) ranks economies' business regulatory environments from 1 to 183, with 1 being the most business-friendly. Data for this index are for 2010. Countries with higher informality levels tended to rank the lowest, including Indonesia (126), Honduras (130), and Ecuador (131). Conversely, countries with low informality generally ranked higher, including South Africa (36, the highest sample country) and Panama (63).

Informality in Emerging Markets: A Cross-Country Examination 2012 The Global Fairness Initiative www.globalfairness.org
26
Tax Regulations High tax rates as well as an excessively complex tax code contribute to informality by deterring both formal and informal businesses from informing the government of their economic activities. High taxes imply a high cost of regulatory compliance.liii Colombia and Kyrgyzstan had the highest average total tax rates (or percentage of commercial profits), 81% and 65%, respectively. Informality rates were generally high in both these countries, with informal employment remaining at 60% in Colombia and increasing significantly to 59% in Kyrgyzstan. The time requirement to prepare and pay taxes was highest in Ecuador, 25 days. Informality comprised 61% of non-agricultural employment in Ecuador, a relatively high level.

Informality in Emerging Markets: A Cross-Country Examination 2012 The Global Fairness Initiative www.globalfairness.org
27
Labor Regulations Labor regulations — including minimum wage, mandated benefits such as paid leave, and termination costs — can impact informality with regard to the private sector. Examination of the minimum wage for a 19-year-old laborer among the sample countries illustrates how the private sector responds to distorted wage rates, either with informality or unemployment. Countries with the highest minimum wages for a 19-year-old laborer, like South Africa ($543 per month) and Panama ($371 per month), had generally low levels of informality coupled with higher youth (ages 15-24 years) unemployment rates. Informality in South Africa and Panama increased from 14% to 33% and 36% to 44%, respectively from 2004 to 2010. South Africa had the highest youth unemployment rate, decreasing from 57% to 48%. Panama's youth unemployment rate was also quite high, falling from 29% to 15%. As these countries have relatively higher total and per-capita GDP levels, jobless labor force members likely claimed unemployment instead of pursuing informal work for income. While South Africa's GDP levels were higher than Panama's (which are at the lower-middle range of the sample country distribution), per-capita GDP levels in Panama were higher. This discrepancy likely contributed to relative informality levels and their significant increases in these countries. Panama experienced a comparatively lower increase of 8% despite higher informality rates than South Africa, while informality increased comparatively more (19%) in South Africa. These trends likely result from firms either not hiring (forcing labor force participants to the informal sector) or hiring employees informally to circumvent high minimum wages.

Informality in Emerging Markets: A Cross-Country Examination 2012 The Global Fairness Initiative www.globalfairness.org
28
The comparative total and per-capita GDP levels may also partly explain why South Africa's unemployment levels are drastically higher than Panama's: lower per-capita GDP levels suggest actual average wage rates are lower in South Africa than in Panama, reducing the incentive for labor force participants to pursue formalized work.
Another factor affecting firms' hiring practices are firing costs, as firms do sometimes find it necessary to terminate redundant employees or those with obsolete skill sets. Consistent with

Informality in Emerging Markets: A Cross-Country Examination 2012 The Global Fairness Initiative www.globalfairness.org
29
previous trends, countries with high informality rates, including Ecuador and Indonesia, also exhibit high firing costs of 135 weeks of wages and 108 weeks of wages, respectively. Access to Financing Informality impedes the private sector's access to capital: income earned and assets procured informally cannot be used as collateral for the purposes of trading, investment or credit. Informality inhibits access to financing by also deterring potential outside investors. Survey results indicate that potential investors cite policy uncertainty, unfair competition, and corruption as major concerns;liv all of these are factors associated with informality. The World Bank's business extent of disclosure index (BEDI) measures the extent to which business investors are protected through disclosure of ownership and financial information. Index values range from 0 to 10, with 10 indicating higher disclosure.lv Countries with high rates of informality typically exhibited low BEDI values. For example, Honduras and Ecuador had BEDI values of 0 and 1, with informality rates of roughly 74% and 61%, respectively. Conversely, countries with lower levels of informal employment had correspondingly higher BEDI values. South Africa's informality rates reached 33% over the reference period while its BEDI value remained at 8. Net foreign direct investment (FDI) inflows are consistent with previous trends. Ecuador, Kenya, Kyrgyzstan, Nicaragua, and Uganda exhibit the lowest net FDI inflow levels, falling below $1 billion. Informality in these countries exceeded 60% from 2003 to 2010. Conversely, the countries with the highest levels of net FDI inflows had low informality rates, including Ukraine and South Africa. Net FDI Inflows (2000, US$, billions)

Informality in Emerging Markets: A Cross-Country Examination 2012 The Global Fairness Initiative www.globalfairness.org
30
Firm Size, Productivity, Human Capital & Growth Three factors are highly correlated with informality: small firm size, low firm productivity, and lower education attainment levels of firm workers, particularly managers.lvi These three factors are heavily intertwined, emphasizing the self-perpetuating nature of informality and eroding the potential for economic growth. Small firms are more likely to be informal because they are less able to pay the administrative costs associated with registering a business. They are also less likely to report wages to the social security administration. At the same time, informality limits firms' growth opportunities, ability to access economies of scale, and participation in industry information transfer. As many firms in developing economies begin operations informally and formalize as they grow, an ineffective regulatory framework may inhibit new, productive firms that have the potential to drive overall growth in a dynamic economy. Over the long term, staying small may prohibitively increase the costs associated with formalization.lvii

Informality in Emerging Markets: A Cross-Country Examination 2012 The Global Fairness Initiative www.globalfairness.org
31
Smaller firms tend to be newer. Sample countries with firms that are younger on average exhibited high informality rates. Kenya and Uganda, with informal employment levels approaching 80% and 70%, respectively, both had average firm ages of 12 years, the lowest among the sample countries. Conversely, firms in Uruguay and Costa Rica tended to be older, averaging 25 years and 21 years, respectively, with informality levels at 44% in both countries. Though in different manner, throughout the sample countries firm size correlated with informality rate. For example, Indonesia and Uganda had some of the smallest average firm sizes of 24 employees and 43 employees, respectively, with informality rates of about 62% and 69%. In countries with larger firm sizes, informality increased as firm size decreased (these countries include Kyrgyzstan, Honduras, Ukraine, Costa Rica, and Panama). In Ecuador, informality actually decreased as firm size increased.

Informality in Emerging Markets: A Cross-Country Examination 2012 The Global Fairness Initiative www.globalfairness.org
32
Firm size is related to productivity, with smaller firms tending to be less productive. Lower production levels and competitiveness limit overall growth potential, deterring investment. Lower investment levels decrease the availability of funds for the purposes of capital creation, keeping small firms small and increasing the costs associated with formalization in the long term.lviii

Informality in Emerging Markets: A Cross-Country Examination 2012 The Global Fairness Initiative www.globalfairness.org
33
Firms typically use the ratio of minimum wage to value added per worker to determine whether to hire additional workers: when this ratio reaches 1, firms cease hiring. This ratio, in combination with data for the minimum wage for a 19-year-old worker/apprentice, allows a rough estimation of productivity levels in the sample countries. Consistent with previous trends, sample countries with the highest productivity rates exhibited the lowest informality levels, including South Africa, Costa Rica, and Panama. Conversely, countries with low productivity levels experienced high informality rates, such as Kyrgyzstan and Uganda.
Examination of per-firm employment by type provides insight regarding human capital levels and informality. A large education gap exists between managers at formal versus informal firms, with informal managers tending to attain lower education levels.lix Among the sample countries, permanent full-time workers comprised the largest portion of average employment per firm, at least 45%. Unskilled production workers comprised the second-largest portion, between 41% and 11%. Temporary workers accounted for the smallest portion, between 2% and 16%. Among these employee types, unskilled production workers and temporary workers are more likely to be working informally. Education and skill levels for these workers tend to be lower, as these employees' short-term status precludes the firm's incentive to provide training.

Informality in Emerging Markets: A Cross-Country Examination 2012 The Global Fairness Initiative www.globalfairness.org
34
Kenya and Uganda exhibited the largest portion of unskilled production workers and sizable percentage-shares of temporary workers. In Kenya, production workers accounted for 41% of average employment per firm while these workers comprised 37% of per-firm employment on average in Uganda. In Kenya and Uganda temporary workers accounted for 14% and 13% of the averages for employment per firm, respectively. Conversely, countries with low levels of informality, including Ukraine, Mexico, and Panama, had the highest percentage-shares of full-time permanent workers: 87%, 79%, and 77%, respectively. The combined effects of a poor regulatory environment and limited opportunity for investment reduce levels of growth. New business densities (or new firms per 1,000 people ages 15-64 years) among the sample countries confirm this trend. Countries with low informality – including Costa Rica, Panama, and Uruguay – had the highest new business densities of roughly 10, 4, and 3, respectively. Except for Peru, all remaining sample countries had consistent new business densities of 1 or 0.

Informality in Emerging Markets: A Cross-Country Examination 2012 The Global Fairness Initiative www.globalfairness.org
35
Government Inherently a symptom of non-compliance with existing regulation, the informal economy erodes the strength of the rule of law. Additional effects of informality on governments include decreased tax revenue and reduced effectiveness of foreign aid. Overall, informality diminishes the government's authority over and ability to engage with its constituents, increasing the potential for political instability. The World Bank's public sector management and institutions cluster average rates the quality of these institutions by country on a scale of one to six, with six indicating the highest level of quality. This cluster average includes the World Bank's ratings for property rights and rule-based governance; quality of budgetary and financial management; efficiency of revenue mobilization; quality of public administration; and transparency, accountability, and corruption in the public sector.lx Though data are sparse, the sample countries with observations exhibited some of the highest informality rates, including Honduras, Kenya, Kyrgyzstan, Nicaragua, Uganda, and Indonesia. Most of these countries received a public sector management and institutions cluster average rating of three throughout the reference period, except for Honduras. In Honduras, this rating decreased from four in 2005 to three by 2010. The public sector management and institutions cluster average ratings for these relatively politically stable countries are comparatively low, likely reflecting high informality levels. For example, this rating decreased in Honduras, where informality increased substantially, from 55% to 74% over the reference period. Rule of Law Like many other consequences of informality, the economic and political implications associated with a weaker rule of law are far-reaching and threaten stability. Furthermore, the prevalence of both informality and circumvention of legally binding statutes is self-perpetuating in nature, diminishing the probability of effective reform.

Informality in Emerging Markets: A Cross-Country Examination 2012 The Global Fairness Initiative www.globalfairness.org
36
The World Bank's quality of public administration rating assesses the extent to which a country’s civilian central government staff is structured to design and implement government policy and deliver services effectively on a scale of one to six, with six indicating the highest level of quality.lxi This series serves as a quantitative measure of the potential effectiveness of policy implementation while the World Bank's property rights and rule-based governance rating provides a measure of actual effectiveness. The property rights and rule-based governance rating assesses the extent to which private economic activity is facilitated by an effective legal system and rule-based governance structure in which property and contract rights are reliably respected and enforced. Like the quality of public administration rating, the property rights and rule-based governance rating is on a scale of one to six, with six indicating the highest level of effectiveness.lxii Though data are sparse, the sample countries with observations exhibited some of the highest informality rates, including Honduras, Kenya, Kyrgyzstan, Nicaragua, Uganda, and Indonesia. As poorly designed regulations are an inherent cause of informality, ratings for quality of public administration were generally low (three), except in Kenya and Indonesia, which received ratings of four for much of the study period. The property rights and rule-based governance ratings for Kenya and Indonesia are both three, implying that actual policy effectiveness was lower than the levels for which the regulatory frameworks in these countries designed. This discrepancy likely reflects high informality levels in these countries.
Tax Revenues As informal economic activity inherently lacks documentation, informality reduces the overall size of the tax base and imposes a heftier tax burden on the formal sector. While the informal sector uses and congests public infrastructure, it does so without contributing to the tax revenue necessary for maintenance.lxiii

Informality in Emerging Markets: A Cross-Country Examination 2012 The Global Fairness Initiative www.globalfairness.org
37
Total tax revenues generally comprised a larger portion of GDP in sample countries with lower rates of informality. South Africa exhibited by far the highest portion of GDP attributable to tax revenues, approximately 25%, congruent with its comparatively low informality rate of about 33% in 2010. Tax revenue's percentage-share of GDP in the remaining sample countries ranged between roughly 10% and 20%. Uruguay's portion of GDP attributable to tax revenues was also consistent with its informality levels: tax revenue's percentage share of GDP increased from 17% to 19% while informality rates fell from 41% to 40% over the reference period. Conversely, tax revenue's percentage share of GDP was consistently below 16% in countries with higher informality rates, including Honduras, Peru, Indonesia, Colombia, and Uganda. Specifically, Indonesia, Colombia, and Uganda exhibited the lowest percentage-shares of GDP attributable to tax revenues, between 11% and 12%. Informality rates were about 60% in Colombia and Indonesia, while reaching nearly 70% in Uganda.

Informality in Emerging Markets: A Cross-Country Examination 2012 The Global Fairness Initiative www.globalfairness.org
38
Inadequate tax revenue resulting from a large informal sector inhibits the provision of social safety nets that could alleviate income inequality.lxiv The percentage-share of GDP attributable to social contributions – or social security contributions by employees, employers, the self-employed, other contributors whose source cannot be determined, and actual or imputed government contributions – was generally higher in countries with low informality and vice-versa.lxv Social contributions were highest in Ukraine, Costa Rica, and Uruguay, comprising approximately 36%, 33%, and 25% of these countries' respective GDPs and reflecting low informality rates. Conversely, social contributions were below 13% of GDP in Honduras, Peru, Colombia, and Kenya, where informality rates were in excess of 60%.
Research suggests that persistently high levels of informality may contribute to income inequality. This is due to the access to benefits existing for formal sector employees and enterprises while informal workers lack comparable access to basic health, unemployment, and social security protections and benefits.lxvi Foreign Aid Effectiveness Inefficient allocation of foreign aid funding is another result of informality. As international aid functions within the framework of international and national laws it immediately removes itself from the informal sector. Foreign aid does not typically reach the informal sector unless specifically targeted for such a purpose. Furthermore, although the goal is economic access for the poor, aid benefits medium-sized enterprises that can afford such legal mechanisms as certifications. Thus, these valuable funds tend not to reach the workers with the most need, as informal employees generally have the lowest incomes and the least education. Similarly, aid directly targeted to the poorest of the poor either in food assistance or micro-enterprise development does not address formalization, maintaining the poor in a parallel economy. The effectiveness of foreign aid would likely increase with a reduction in the informal economy, improving macroeconomic conditions and diminishing the initial need for foreign aid. Net official development assistance (ODA) and official aid received (OAR) were generally the highest among the African sample countries, where informality levels were also highest. With respective informality rates approaching 70% and 80%, Uganda and Kenya were the largest aid recipients, ranging from $1.3 billion to $1.7 billion and $650 million to $1.6 billion, respectively. On a regional basis, countries with the largest informal economies consistently exhibited higher levels of net ODA and OAR. Among the South American countries, Uruguay was the smallest aid recipient, ranging from roughly $30 million to $50 million, reflecting its low informality rate of about %40. By comparison, in the remaining South American sample

Informality in Emerging Markets: A Cross-Country Examination 2012 The Global Fairness Initiative www.globalfairness.org
39
countries of Colombia, Ecuador, and Peru, informality exceeded 60%, while net ODA and OAR levels were above $150 million for much of the reference period. The same trend is apparent among the Central American as well as Asian & European sample countries. In Central America, net ODA and OAR levels were above $500 million for the two countries with the highest informality levels (Nicaragua and Honduras) but below $500 million for the remaining Central American sample countries, where informality was below 55%. In Asia & Europe, Indonesia's aid levels were dramatically higher than Ukraine's or Kyrgyzstan's, decreasing from $2.1 billion to $1.3 billion. Net Official Development Assistance and Official Aid Received (2009, US$, millions)
Examination of development assistance data indicates that the highest percentages of total U.S. aid are generally allocated to countries with higher informality rates.

Informality in Emerging Markets: A Cross-Country Examination 2012 The Global Fairness Initiative www.globalfairness.org
40
REDUCTION & TRANSITION STRATEGIES
Effective strategies seeking to reduce informality must focus on transitioning informal enterprises and workers to the formal sector via effective dialogue among citizens, government, labor organizations, and the private sector. A multi-stakeholder engagement is necessary as not only does informality constitute an economic phenomenon but entrenched informal practices also become a cultural norm that needs to shift toward a culture of formality. This transition must occur endogenously using appropriate regulatory reforms that incentivize formal-sector participation with an emphasis on efficiency, accountability, and transparency. Reforms must be appropriate to the nation's current performance levels and potential for economic growth. Strategies must also address country-specific issues, particularly economic development and the threat of stagnation. Though the causes of informality exist on a continuum and are not mutually exclusive, the World Bank provides general guidelines for reduction and transition strategies based on the sources of informality. If informality exists as a result of involuntary exclusion from formal employment, policies that reduce existing barriers to the formal labor market are necessary to improve welfare. Such a strategy might include labor market reform as well as rationalizing regulations to ensure that small and large firms compete more fairly. Conversely, if informality exists as a result of more workers and firms “opting out” of the regulatory system based on rational choice, policy interventions that rebalance the perceived costs and benefits of participating in the formal sector are necessary. Such policies could focus on improving the quality and outreach of key public services, enhancing communication and transparency about social services, and redesigning and extending instruments for better management of health- and age-related risks.lxvii In reality, a combination of these measures is likely necessary to address informality in varying conditions in developing economies.

Informality in Emerging Markets: A Cross-Country Examination 2012 The Global Fairness Initiative www.globalfairness.org
41
Reduction strategies must also account for country-specific variables to ensure that the transition of informal enterprises and employees to the formal sector deters participation in the parallel economy over the long term. For example, in many countries informality is a result of the labor market’s failure to keep pace with rapid levels of economic growth. Under these conditions, eliminating the informal sector too quickly stifles job creation and precludes economic development initiatives. Overall, the most important component of any effective reduction strategy is its ability to implement reforms capable of adapting to variability in social and economic conditions. Based on the findings and the recommendations of reputable organizations as stated above, the basic strategies for formalization include:
• Sound employment statistics gathered independently by each government • Direct surveying of workers to understand needs and perceptions • Development of country-specific and sector-specific policies that can progressively
transition workers and enterprises to the formal sector4 • Affordable and accessible tax regimes that progressively create tax revenue • Collaboration of government with the private sector to increase compliance • Investment in missing middle financing to increase the size of local enterprises, increase
productivity, and lower informality • Promotion of youth flexible trade and entry-level placements for the integration of new
workers to the formal labor market • Aid to specific countries tied to improved legislation for the integration of the informal
sector5 From Uganda to Ukraine, poverty and inequality can be addressed by the legal inclusion of national parallel economies. Though this report provides a broad framework looking at 15 countries, each one has the data to enact concrete policies that can jump-start their economies. Only through formalization will this be done fairly and sustainably.
APPENDIX A: STATISTICAL CONSIDERATIONS
The International Labor Organization (ILO) provides comprehensive data for informal employment in two key publications: Key Indicators of the Labor Market (KILM), Seventh Edition, (published October 2011) and an enhanced database on informal employment produced in partnership with Women in Informal Employment: Globalizing and Organizing (WIEGO) (published April 2012).
4 For example, set accessible registration hours, or a mobile registration system, for female-‐prone sectors such as domestic workers. 5 The Millennium Challenge Corporation, started in 2004 with the goal to deliver smarter US assistance bases funding on policy performance. A similar approach can be to add national statistics as indicators, including percentage of active labor force with access to social security/pension system, access to finance for micro-‐and-‐small enterprises, and average firm size.

Informality in Emerging Markets: A Cross-Country Examination 2012 The Global Fairness Initiative www.globalfairness.org
42
Definition ILO's definition of informal employment comprises the following labor groups:lxviii
• Informal wage employees: employees who get a basic remuneration not directly dependent on the revenue of the employer – among whom countries may need and be able to distinguish "employees with stable contracts" (including "regular employees")
• Members of informal producers' cooperatives: workers who hold self-employment jobs in a cooperative producing goods and services, where the members take part on an equal footing in making major decisions concerning the cooperative
• Own-account workers: laborers who hold self-employment jobs and do not engage ‘employees’ on a continuous basis
• Contributing family members: laborers who hold self-employment jobs in an establishment operated by a related person, with a too limited degree of involvement in its operation to be considered a partner
• Employers in their own informal sector enterprises: workers who hold self-employment jobs (i.e. whose remuneration depends directly on the [expectation of] profits derived from the goods and services produced) and engage one or more person to work for them as ‘employees’ on a continuous basis
This definition includes unregistered employees without explicit, written contracts or who are not subject to labor legislation as well as workers who do not benefit from paid annual or sick leave or social security and pension schemes. Most paid domestic employees of households and casual, short-term, and seasonal workers satisfy ILO's definition for informal employment. ILO's definition excludes agricultural employment.lxix Three basic components are common to both KILM and the enhanced database:lxx
• Employment in the informal sector: employees holding jobs in informal enterprises • Informal employment outside the informal sector: employees holding informal jobs in
formal enterprises (including government units and non-profit institutions), as paid domestic workers employed by households, or as contributing family workers in formal enterprises
• Informal employment: the sum of employment in the informal sector and informal employment outside the informal sector, less formal employees in informal enterprises
For the purposes of this analysis, the reference period is limited to 2003 to 2010 because of an ILO definitional change in 2003. KILM KILM provides data in terms of numeric value and percentage share of non-agricultural employment for 48 countries for three series: employment in the informal sector, informal employment outside the informal sector, and total informal employment. Only 15 of the 48 countries with observations for the reference period have more than one data point for either the “informal employment” series or the “employment in the informal sector” series. The analysis sample is therefore limited to these 15 countries for the purposes of identifying cross-country trends. These countries include:

Informality in Emerging Markets: A Cross-Country Examination 2012 The Global Fairness Initiative www.globalfairness.org
43
Employment in the Informal Sector Informal Employment
Colombia (2003-2004) Costa Rica (2003-2005) Honduras (2003) Indonesia (2003-2009) Nicaragua (2003-2005) Panama (2003) Uruguay (2003-2005)
Colombia (2005-2007, 2010) Costa Rica (2009) Ecuador (2005-2007, 2009) Honduras (2009) Kenya (2003-2007) Kyrgyzstan (2003, 2009) Mexico (2005-2007, 2009) Nicaragua (2009) Panama (2005-2007, 2009) Peru (2005-2007, 2009) South Africa (2004, 2010) Uganda (2009-2010) Ukraine (2003-2004, 2009) Uruguay (2009)
Enhanced Database ILO and WIEGO's enhanced database on informal employment includes data for 47 countries. Series include:
• Total numeric and percentage share of non-agricultural employment by gender and location (urban/rural):
o Informal employment o Employment in the informal sector o Formal employment in the informal sector o Informal employment outside the informal sector
• Percentage share of total employment in the informal sector by status in employment and
by gender and location (urban/rural):
o Employers, own-account workers, and members of producers' cooperatives o Contributing family workers o Employees
• Percentage share of informal non-agricultural employment by status and by gender and
location (urban/rural):
o Employers, own-account workers, and members of producers' cooperatives Owners of informal sector enterprises Producers of goods exclusively for own final use
o Contributing family workers o Employees
Formal sector employees Informal sector employees Domestic workers employed by households

Informality in Emerging Markets: A Cross-Country Examination 2012 The Global Fairness Initiative www.globalfairness.org
44
• Informal non-agricultural self-employment as a percentage share of total non-agricultural self-employment by status in employment and by gender and location (urban/rural):
o Employers and members of producers' cooperatives o Own-account workers
Enterprise owners o Total informal self-employment (including contributing family workers)
• Informal wage employment as a percentage share of total wage employment by type of
employees and by gender and location (urban/rural):
o Agricultural employees o Non-agricultural employees
Formal sector employees Informal sector employees Domestic workers employed by households
o Total informal employees
• Percentage share of total informal non-agricultural employment outside the informal sector by type and by gender and location (urban/rural):
o Producers of goods exclusively for own final use o Contributing family workers: formal sector o Employees
Formal sector employees Domestic workers employed by households
• Percentage share of women in employment by type:
o Total employment o Agricultural employment o Agricultural wage employment
Formal agricultural wage employment Informal agricultural wage employment Agricultural self employment
o Non-agricultural employment o Non-agricultural wage employment
Formal non-agricultural wage employment Informal non-agricultural wage employment
o Non-agricultural self employment Formal non-agricultural self employment Informal non-agricultural self employment

Informality in Emerging Markets: A Cross-Country Examination 2012 The Global Fairness Initiative www.globalfairness.org
45
• Percentage share of women in informal non-agricultural employment by component:
o Informal employment Self employment Wage employment
o Employment in the informal sector Self employment Wage employment
o Informal employment outside the informal sector Self employment Wage employment
▪ Formal sector ▪ Domestic work
• Percentage share of total informal employment by kind of non-agricultural activity and
by gender:
o All non-agricultural activities o Manufacturing o Construction o Trade o Transportation o Services other than trade or transportation
• Percentage share of total non-agricultural employment by gender, formal/informal nature, and kind of activity:
o Manufacturing o Construction o Trade o Transportation o Services other than trade or transportation
Unlike KILM, the ILO enhanced database provides data only for single years. Where cited, these data are used for regional comparisons.

Informality in Emerging Markets: A Cross-Country Examination 2012 The Global Fairness Initiative www.globalfairness.org
46
Constraints Ostensibly, the lack of documentation inherent to informality inhibits quantitative measurement of informal employment. Additional factors hindering cross-country analysis of informal employment include:lxxi
• High level of variation among existing data • Lack of consensus regarding definitions of informal employment and its components • Variation in the exclusion of specific economic activities • Lack of long-term data
ILO maintains a flexible concept of the informal sector to accommodate country-specific conditions and needs, resulting in a high level of variation in reporting periods and definition criteria among submissions. ILO summarizes the causes of data comparability issues as the differences in:lxxii
• Data sources • Geographic coverage • Branches of economic activity covered: at one extreme are countries that cover all kinds
of economic activity, including agriculture, while at the other are countries that cover only manufacturing
• Criteria defining the informal sector: for example, size of the enterprise or establishment versus non-registration of the enterprise or the worker
• Size criteria for enterprise classification • Inclusion or exclusion of paid domestic workers • Inclusion or exclusion of persons who have a secondary job in the informal sector but
whose main job is outside the informal sector, e.g. in agriculture or in public service

Informality in Emerging Markets: A Cross-Country Examination 2012 The Global Fairness Initiative www.globalfairness.org
47
APPENDIX B: COUNTRY BACKGROUND
This section examines sample country characteristics related to economic performance from 2003 to 2010. Gross domestic product levels segmented sample countries into three groups based on level of development:
• More developed: Mexico, Indonesia, South Africa, Colombia, Peru, Ukraine • Mid developed: Uruguay, Ecuador, Costa Rica, Panama, Kenya6 • Less developed: Uganda, Honduras, Nicaragua, Kyrgyzstan
In addition to low overall GDP levels, key indicators for demonstrating underdevelopment among the sample countries include:
• High levels of production and employment in the agricultural sector • High lending interest rates and consumer price index (CPI) values • Labor participation rates above or below the percentage of the population of working age
and high unemployment rates • Lower completion rates for secondary and tertiary education • Low overall population coupled with high annual population growth rates and low
urbanization • Age distribution of the population more than one third to one half 0-14 years of age and
50 percent to 60 percent 15-64 years of age Conversely, sample countries with higher levels of development have:
• Large production and employment levels attributable to the industrial sector • Low lending interest rates, CPI values, and unemployment rates (especially among
workers with secondary and tertiary education) • Higher completion rates for secondary and tertiary education • High total population in addition to low, stable annual rates of population growth and
higher rates of urbanization • Age distribution of the population approximately one third 0-14 years of age, two thirds
15-64 years of age, and less than 10 percent 65+ years of age Primary findings include: • In Uganda and Peru, total and female labor force participation exceeded 70 percent and
65 percent of the total and female populations 15-64 years of age, respectively. Total labor force participation fell below 60 percent in Ukraine and South Africa. On a regional basis, total labor force participation was generally highest in South America, followed by Asia and Central America. In contrast to trends in overall labor force participation, Central American sample countries exhibited the lowest levels of female labor force participation.
6 For the purposes of this analysis, Kenya is considered a “borderline” less-‐developed country, as its GDP increased from less than $15 billion to barely $20 million over the reference period.

Informality in Emerging Markets: A Cross-Country Examination 2012 The Global Fairness Initiative www.globalfairness.org
48
• Total, female, and youth unemployment rates decreased in most sample countries over the reference period. Overall unemployment was lowest compared with the other two rates, with youth unemployment exceeding female unemployment. Unemployment rates were by far the highest in South Africa, where total and female unemployment decreased from roughly one-third to one-quarter of the total and female labor forces, respectively. Youth unemployment (ages 15-24 years) also decreased from roughly 60 percent to 50 percent in South Africa. On a regional basis, high unemployment rates were concentrated in South American sample countries, while select Central American sample countries experienced the lowest unemployment rates.
• Completion rates at the primary education level were highest in select Central American sample countries, comprising nearly 60 percent of the labor force. Conversely, Kyrgyzstan and Ukraine exhibit the lowest primary education completion rates, despite reporting adult literacy rates of 99 percent and 100 percent, respectively. Secondary and tertiary education completion levels were highest in Peru and Ukraine but lowest in Indonesia.
• On a regional basis, child employment was most prevalent in Central American sample countries. The respective portions of the population ages 7-14 years working in the agricultural, services, and manufacturing sectors exceeded 60 percent, 40 percent, and 10 percent in varying select Central American sample countries.
• Total population was by far the highest in Indonesia and Mexico, increasing from 222 million to 240 million and 104 million to 113 million, respectively. More-developed countries generally had the highest population totals (except Peru) while less-developed countries (except Uganda) exhibited the lowest population levels.
• Annual population growth rates were highest in Kenya (a borderline less-developed country) and Uganda (a less-developed country), remaining at 3 percent. More-developed countries maintained annual population growth rates of 1 percent through the reference period, except Colombia and Ukraine.
• Population density was less than 91 people per square kilometer in every sample country except Uganda (133 to 167 people per square kilometer) and Indonesia (122 to 132 people per square kilometer). On a regional basis, population densities were highest in Central America and lowest in South America.
• The urban population comprised between 50 percent and 80 percent of the total population in most sample countries. Urban population comprised just over 90 percent of Uruguay's total population, but less than 50 percent in the less-developed countries of Honduras, Kyrgyzstan, and Uganda, as well as Kenya.
• The 0-14 years age group accounted for between 25 percent and 35 percent of total population in most sample countries, generally decreasing. However, this age group comprised more than one third to one half of the population of every less-developed country in addition to Kenya.
• The 15-64 years age group comprised the largest portion of most sample countries' populations, ranging from 60 percent to 70 percent, increasing modestly. However, this age group accounted for only 50 percent to 60 percent of the populations of most of the less-developed countries as well as Kenya.
• The 64+ years age group comprised the smallest portion of the population, between 3 percent and 7 percent, in most sample countries, except Ukraine and Uruguay.

Informality in Emerging Markets: A Cross-Country Examination 2012 The Global Fairness Initiative www.globalfairness.org
49
Population Indonesia's population was largest compared with other sample countries from 2003 to 2010, increasing from about 222 million people to 240 million people. Mexico's population was second largest, ranging from 104 million people in 2003 to 113 million people in 2010. Uganda's population experienced the largest percentage increase over the reference period of about 26 percent. Annual population growth rates remained relatively constant among the sample countries, changing by just 1 percent if at all from 2003 to 2010. Kenya and Uganda exhibited the highest growth rates of 3 percent each, while Ukraine and Uruguay had the lowest growth rates of -1 and 0, respectively. Ukraine was the only sample country to experience an increase in its annual population growth rate during the reference period; however, the increase was from -1 percent to 0 percent. Conversely, Colombia, Costa Rica, and Ecuador each experienced decreases in their respective growth rates from 2 percent to 1 percent.

Informality in Emerging Markets: A Cross-Country Examination 2012 The Global Fairness Initiative www.globalfairness.org
50
Population density remained below 100 people per square mile in every sample country except Uganda and Indonesia. Uganda's population density was by far the highest among the sample countries, increasing from 133 people per square kilometer in 2003 to 167 people per square kilometer in 2010. Uganda's population also experienced the largest percentage increase of 26 percent. Most percentage increases in population densities ranged between 8 and 12 percent over the reference period, with the exceptions of Honduras (15 percent) and Kenya (20 percent). Ukraine was the only country to experience a decrease in population density of 5 percent, while Uruguay's population density remained constant from 2003 to 2010. Gender ratios were generally evenly split from 2003 to 2010, with eight of the fifteen sample countries exhibiting a female population rate of exactly 50 percent. The only sample country with a female population rate below 50 percent was Costa Rica, averaging 49 percent throughout the reference period. Females averaged 51 percent of the population in Colombia, Kyrgyzstan, Mexico, and South Africa from 2003 to 2010. In Uruguay and Ukraine, the female population averaged 52 and 54 percent of the total, respectively. The portion of the population less than 15 years of age generally ranged between 25 and 35 percent in most sample countries from 2003 to 2010, decreasing slightly. The 0-14 years age range comprised the highest portion of the population in Uganda and Kenya during the reference period, decreasing from 49 percent to 48 percent and 43 percent to 42 percent, respectively. This age group also comprised a large portion of the population in Honduras and Nicaragua from 2003 to 2010, decreasing from 41 percent to 37 percent and 39 percent to 34 percent, respectively. The 0-14 age group accounted for the lowest portion of the population in Ukraine, decreasing from 16 percent to 14 percent from 2003 to 2010. Congruently, the portion of the population between 15-64 years of age was largest in Ukraine, increasing from 67 to 70 percent from 2003 to 2010. This age group generally comprised between 60 and 70 percent of the population in most sample countries during the reference period. The 15-64 years age group accounted for the smallest percentage of the population in Uganda, remaining at 49 percent for the duration of the reference period. Notably, this age group's portion of the population was relatively small in both Nicaragua and Honduras yet increased from 57 to 61 percent and 55 to 59 percent from 2003 to 2010, respectively. The 65+ years age group accounted for the lowest portion of the population among the sample countries, ranging between 3 and 7 percent over the reference period. This group comprised the largest portions of the population relative to other sample countries in Ukraine and Uruguay, averaging about 15 percent and 14 percent, respectively.

Informality in Emerging Markets: A Cross-Country Examination 2012 The Global Fairness Initiative www.globalfairness.org
51
!"!#$%$&'$()$)*+,-./'0.1$23$!""45$6$7778/90:*9;*-<.=++80</$6$>=9$!"!8?@?8@"!!$6$AB*-9C$-.;0D/90:*9;*-<.=++80</$ !"
!""# !""$ !""% !""& !""' !""( !"") !"*""
!"
$"
&"
("
*""
*!"
*$"
*&"
!"#$%&'(")*+),('-
.#+"#%+/#+0/,1$&0+/2(%"3+'+04
+,-,./01 +,23145061 76819,: ;,<98:12 =<9,<>201
?><@1 ?@:A@B231< C>D06, E061:1A81 F1<1.1
F>:8 G,83H4IJ:061 KA1<91 KL:10<> K:8A81@

Informality in Emerging Markets: A Cross-Country Examination 2012 The Global Fairness Initiative www.globalfairness.org
52
!"#$%&'()&*$&+$("#$%&%,-.()&*$-#//$(".*$01$2#.'/$&+$.3#$3#*#'.--2$'.*3#4$5#(6##*$71$.*4$81$%#'9#*($)*$:&/($/.:%-#$9&,*(')#/$+'&:$7;;8$(&$7;0;<$4#9'#./)*3$/-)3"(-2=$!"#$;>0?$2#.'/$.3#$'.*3#$9&:%')/#4$("#$")3"#/($%&'()&*$&+$("#$%&%,-.()&*$)*$@3.*4.$.*4$A#*2.$4,')*3$("#$'#+#'#*9#$%#')&4<$4#9'#./)*3$+'&:$?B$%#'9#*($(&$?C$%#'9#*($.*4$?8$%#'9#*($(&$?7$%#'9#*(<$'#/%#9()D#-2=!")/$.3#$3'&,%$.-/&$9&:%')/#4$.$-.'3#$%&'()&*$&+$("#$%&%,-.()&*$)*$E&*4,'./$.*4$F)9.'.3,.$+'&:$7;;8$(&$7;0;<$4#9'#./)*3$+'&:$?0$%#'9#*($(&$8G$%#'9#*($.*4$8B$%#'9#*($(&$8?$%#'9#*(<$'#/%#9()D#-2=$!"#$;>0?$.3#$3'&,%$.99&,*(#4$+&'$("#$-&6#/($%&'()&*$&+$("#$%&%,-.()&*$)*$@H'.)*#<$4#9'#./)*3$+'&:$0I$%#'9#*($(&$0?$%#'9#*($+'&:$7;;8$(&$7;0;=$
!"!#$%$&'$()$)*+,-./'0.1$23$!""45$6$7778/90:*9;*-<.=++80</$6$>=9$!"!8?@?8@"!!$6$AB*-9C$-.;0D/90:*9;*-<.=++80</$ !"
7;;8 7;;? 7;;1 7;;I 7;;G 7;;C 7;;B 7;0;0;
7;
8;
?;
1;
!"#$%&'(")*+,-.*/012*3-&4.
56*'"'&%*#"#$%&'(")7
J&-&:5). J&/(.$K)9. L9,.4&' E&*4,'./ M*4&*#/).
A#*2. A2'32N/(.* O#P)9& F)9.'.3,. Q.*.:.
Q#', R&,("$S+')9. @3.*4. @H'.)*# @',3,.2

Informality in Emerging Markets: A Cross-Country Examination 2012 The Global Fairness Initiative www.globalfairness.org
53
!"#$%&'#()*+,(-',."%(/"#,"0,(-',.".&)1(/"#,2'(3''#,45678,*'1%9,"0,1$',319,)1%$'9(,/#,:;%1/#'+,/#<%'19/#$,0%"=,7>,(",>?,.'%<'#(,0%"=,@??A,(",@?4?B,C-/9,1$',$%"&.,$'#'%1))*,<"=.%/9'D,2'(3''#,7?,1#D,>?,.'%<'#(,"0,(-',.".&)1(/"#,/#,="9(,91=.)',<"&#(%/'9,D&%/#$,(-',%'0'%'#<',.'%/"DB,C-',45678,*'1%9,1$',$%"&.,1<<"&#('D,0"%,(-',9=1))'9(,.'%<'#(1$',"0,(-',.".&)1(/"#,/#,:$1#D1+,%'=1/#/#$,1(,8E,.'%<'#(,0"%,(-',D&%1(/"#,"0,(-',%'0'%'#<',.'%/"DB,F"(12)*+,(-/9,1$',$%"&.G9,."%(/"#,"0,(-',.".&)1(/"#,319,%')1(/H')*,9=1)),/#,2"(-,F/<1%1$&1,1#D,I"#D&%19+,*'(,/#<%'19'D,0%"=,5>,(",74,.'%<'#(,1#D,55,(",5E,.'%<'#(,0%"=,@??A,(",@?4?+,%'9.'<(/H')*B
!"!#$%$&'$()$)*+,-./'0.1$23$!""45$6$7778/90:*9;*-<.=++80</$6$>=9$!"!8?@?8@"!!$6$AB*-9C$-.;0D/90:*9;*-<.=++80</$ !"
@??A @??8 @??5 @??7 @??> @??J @??E @?4?85
5?
55
7?
75
>?
!"#$%&'(")*+,-.*/0123*4-&5.
67*'"'&%*#"#$%&'(")8
!")"=2/1 !"9(1,K/<1 L<&1D"% I"#D&%19 M#D"#'9/1
N'#*1 N*%$*O9(1# P'Q/<" F/<1%1$&1 R1#1=1
R'%& S"&(-,T0%/<1 :$1#D1 :;%1/#' :%&$&1*

Informality in Emerging Markets: A Cross-Country Examination 2012 The Global Fairness Initiative www.globalfairness.org
54
Among the sample countries, urban population was generally highest in Central and South American countries over the reference period. In Uruguay, the urban population accounted for about 92 percent of total population, the highest relative to other sample countries. Urban population was generally lowest in African countries, particularly Kenya and Uganda. In these two countries, the urban population accounted for roughly 21 percent and 13 percent of the total population, respectively, from 2003 to 2010.

Informality in Emerging Markets: A Cross-Country Examination 2012 The Global Fairness Initiative www.globalfairness.org
55
!"!#$%$&'$()$)*+,-./'0.1$23$!""45$6$7778/90:*9;*-<.=++80</$6$>=9$!"!8?@?8@"!!$6$AB*-9C$-.;0D/90:*9;*-<.=++80</$ !"
!""# !""$ !""% !""& !""' !""( !"") !"*"
*"
#"
%"
'"
)"
!"#$%&'()*+$,-(%./&,(,$+&)()*+$,-(%0
+,-,./01 +,23145061 76819,: ;,<98:12 =<9,<>201
?><@1 ?@:A@B231< C>D06, E061:1A81 F1<1.1
F>:8 G,83H4IJ:061 KA1<91 KL:10<> K:8A81@
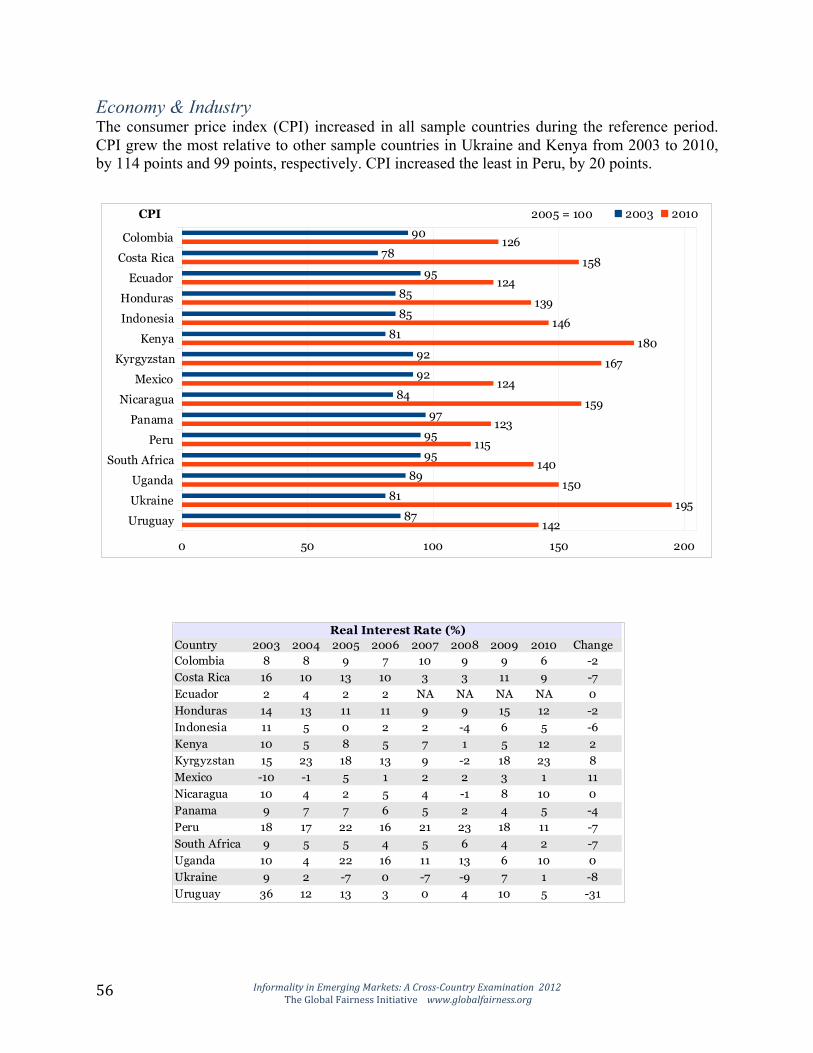
Informality in Emerging Markets: A Cross-Country Examination 2012 The Global Fairness Initiative www.globalfairness.org
56
Economy & Industry The consumer price index (CPI) increased in all sample countries during the reference period. CPI grew the most relative to other sample countries in Ukraine and Kenya from 2003 to 2010, by 114 points and 99 points, respectively. CPI increased the least in Peru, by 20 points.

Informality in Emerging Markets: A Cross-Country Examination 2012 The Global Fairness Initiative www.globalfairness.org
57
The real interest rate, or the lending interest rate adjusted for inflation as measured by the GDP deflator,lxxiii decreased in most of the sample countries from 2003 to 2010. The interest rate remained constant in Ecuador, Nicaragua, and Uganda but increased in Kenya, Kyrgyzstan, and Mexico. Notably, Kyrgyzstan generally exhibited the highest and most volatile interest rates over the reference period, ranging from -2 percent to 23 percent. Conversely, Mexico's interest rates were often the lowest, increasing from -10 percent in 2003 to 1 percent in 2010. Uruguay's interest rate decreased the most relative to other sample countries, from 36 percent in 2003 to 5 percent in 2010. The agricultural sector's contribution to GDP was less than 30 percent for every sample country except Kyrgyzstan from 2003 to 2007 and less than 20 percent for the majority of the sample countries. This percentage share decreased or remained constant from 2003 to 2010 in every sample country except Nicaragua, which experienced an increase from 18 percent to 21 percent. As the sample country with the highest portion of GDP attributable to agriculture for much of the reference period, Kyrgyzstan experienced the largest decrease in this percentage, from 37 percent to 21 percent. Agriculture accounted for roughly one third of GDP in less-developed nations, such as Kenya and Uganda, and a much smaller portion (2 percent to 4 percent) in more-developed countries, including South Africa and Mexico.
!"!#$%$&'$()$)*+,-./'0.1$23$!""45$6$7778/90:*9;*-<.=++80</$6$>=9$!"!8?@?8@"!!$6$AB*-9C$-.;0D/90:*9;*-<.=++80</$ !"
!"#$%&'(")"*(%!#("%+,-
!"#$%&' ())* ())+ ()), ())- ()). ())/ ())0 ()1) !23$45
!"6"7893 / / 0 . 1) 0 0 - :(
!";%3<=9>3 1- 1) 1* 1) * * 11 0 :.
?>#3@"& ( + ( ( AB AB AB AB )
C"$@#&3; 1+ 1* 11 11 0 0 1, 1( :(
D$@"$5;93 11 , ) ( ( :+ - , :-
E5$'3 1) , / , . 1 , 1( (
E'&4'F;%3$ 1, (* 1/ 1* 0 :( 1/ (* /
G5H9>" :1) :1 , 1 ( ( * 1 11
A9>3&34#3 1) + ( , + :1 / 1) )
I3$373 0 . . - , ( + , :+
I5&# 1/ 1. (( 1- (1 (* 1/ 11 :.
J"#%2<BK&9>3 0 , , + , - + ( :.
L43$@3 1) + (( 1- 11 1* - 1) )
LM&39$5 0 ( :. ) :. :0 . 1 :/
L#3' *- 1( 1* * ) + 1) , :*1
())* ())+ ()), ())- ()). ())/ ())0 ()1))
1)
()
*)
+)./)012$(2)"3%4#$2"%#55"5%+,%678-
!"6"7893 !";%3<=9>3 ?>#3@"& C"$@#&3; D$@"$5;93
E5$'3 E'&4'F;%3$ G5H9>" A9>3&34#3 I3$373
I5&# J"#%2<BK&9>3 L43$@3 LM&39$5 L#3'

Informality in Emerging Markets: A Cross-Country Examination 2012 The Global Fairness Initiative www.globalfairness.org
58
In contrast, the industrial sector's contribution to the sample countries' GDPs generally increased over the reference period. This sector accounted for between 20 percent and 40 percent of GDP in most sample countries throughout the reference period. Industry comprised the largest portion of GDP relative to other sample countries in Indonesia, ranging between 44 percent and 47 percent. In 2003 the industrial sector accounted for 31 percent of GDP in Ecuador, Peru, and Colombia, with each country experiencing an increase in this percentage share of 7 percent, 3 percent, and 5 percent, respectively, by 2010. The industrial sector also comprised about one third of GDP in Costa Rica, Honduras, and Nicaragua in 2003, but this percentage decreased by 3 percent in both Costa Rica and Honduras by 2010. In Nicaragua the industrial sector's percentage share of GDP increased by 1 percent by 2010. The industrial sector accounted for less than 20 percent of GDP throughout the reference period in both Panama and Kenya.
!"#$%"&'()&*#&+,#-"./)&'-(0#),$&%'1)#$%"&'-2/&-%"#&%#&+,#)(340,#$%/"&'-,)1#567)#8,",'(009#-"$',(),.#%:,'#&+,#',;,',"$,#4,'-%.<#=+-)#),$&%'#($$%/"&,.#;%'#2,&>,,"#?@#4,'$,"&#(".#A@#4,'$,"&#%;#567#-"#3%)&#)(340,#$%/"&'-,)#&+'%/8+%/&#&+,#',;,',"$,#4,'-%.<#!"./)&'9#$%34'-),.#&+,#0('8,)%'&-%"#%;#567#',0(&-:,#&%#%&+,'#)(340,#$%/"&'-,)#-"#!".%",)-(*#'("8-"8#2,&>,,"#AA#4,'$,"&#(".#AB#4,'$,"&<#C%&(209*#-"#?@@D#&+,#-"./)&'-(0#),$&%'#($$%/"&,.#;%'#DE#4,'$,"&#%;#567#-"#F$/(.%'*#7,'/*#(".#G%0%32-(*#>-&+#,($+#$%/"&'9#,H4,'-,"$-"8#("#-"$',(),#-"#&+-)#4,'$,"&(8,#)+(',#%;#B#4,'$,"&*#D#4,'$,"&*#(".#I#4,'$,"&*#',)4,$&-:,09*#29#?@E@<#=+,#-"./)&'-(0#),$&%'#(0)%#$%34'-),.#(2%/&#%",J&+-'.#%;#567#-"#G%)&(#K-$(*#L%"./'()*#(".#C-$('(8/(#-"#?@@D*#&+%/8+#&+-)#4,'$,"&(8,#.,$',(),.#29#D#4,'$,"&#-"#2%&+#G%)&(#K-$(#(".#L%"./'()#29#?@E@<#!"#C-$('(8/(*#&+,#-"./)&'-(0#),$&%'1)#4,'$,"&(8,#)+(',#%;#567#-"$',(),.#29#E#4,'$,"#?@E@<#=+,#-"./)&'-(0#),$&%'#($$%/"&,.#;%'#0,))#&+("#?@#4,'$,"&#%;#567#&+'%/8+%/&#&+,#',;,',"$,#4,'-%.#-"#2%&+#7("(3(#(".#M,"9(<
!"!#$%$&'$()$)*+,-./'0.1$23$!""45$6$7778/90:*9;*-<.=++80</$6$>=9$!"!8?@?8@"!!$6$AB*-9C$-.;0D/90:*9;*-<.=++80</$ !"
?@@D ?@@A ?@@I ?@@N ?@@B ?@@O ?@@P ?@E@E@
?@
D@
A@
I@
!"#$%&'()*+,-$.*,##.#*/0*1234
G%0%32-( G%)&(#K-$( F$/(.%' L%"./'() !".%",)-(
M,"9( M9'89Q)&(" R,H-$% C-$('(8/( 7("(3(
7,'/ S%/&+#T;'-$( U8(".( UV'(-", U'/8/(9

Informality in Emerging Markets: A Cross-Country Examination 2012 The Global Fairness Initiative www.globalfairness.org
59
Trends in the service sector during the reference period were almost evenly split among the sample countries: six countries experienced an increase in this percentage share, seven observed a decrease, and two remained constant. This sector accounted for between 50 percent and 70 percent of most sample countries' GDPs throughout the reference period. Relative to other sample countries, Panama’s service sector comprised the largest portion of GDP throughout the reference period, nearly 80 percent. This sector accounted for the smallest portion of GDP in Indonesia, decreasing from 41 percent to 38 percent. As with the industrial sector, Mexico, Costa Rica, and Honduras exhibit similar percentage-shares attributable to services, as do Ecuador and Colombia.
!"#$%&'($')*#'&#"+(,#'&#,)-"'%."($/')*#'"#0#"#$,#'1#"(-%'2#"#'345-&)'#+#$46'&14()'35-$/')*#'&3514#',-.$)"(#&7'&(8',-.$)"(#&'#81#"(#$,#%'3$'($,"#3&#'($')*(&'1#",#$)3/#'&*3"#9'&#+#$'-:&#"+#%'3'%#,"#3	'3$%')2-'"#53($#%',-$&)3$);'!*(&'&#,)-"'3,,-.$)#%'0-"':#)2##$'<='1#",#$)'3$%'>='1#",#$)'-0'5-&)'&3514#',-.$)"(#&?'@AB&')*"-./*-.)')*#'"#0#"#$,#'1#"(-%;'C#43)(+#')-'-)*#"'&3514#',-.$)"(#&9')*#'&#"+(,#'&#,)-"',-51"(&#%')*#'43"/#&)'1-")(-$'-0'@AB'($'B3$353')*"-./*-.)')*#'"#0#"#$,#'1#"(-%9'$#3"46'D='1#",#$);'!*(&'&#,)-"'3,,-.$)#%'0-"')*#'&5344#&)'1-")(-$'-0'@AB'($'E$%-$#&(39'%#,"#3&($/'0"-5'FG'1#",#$)')-'HD'1#",#$);'I(5(43"')-')*#'($%.&)"(34'&#,)-"9'J#8(,-9'K-&)3'C(,39'3$%'L-$%."3&'#8*(:()'&(5(43"'1#",#$)3/#M&*3"#&'3))"(:.)3:4#')-'&#"+(,#&9'3&'%-'N,.3%-"'3$%'K-4-5:(3;'
!"!#$%$&'$()$)*+,-./'0.1$23$!""45$6$7778/90:*9;*-<.=++80</$6$>=9$!"!8?@?8@"!!$6$AB*-9C$-.;0D/90:*9;*-<.=++80</$ !!
O==H O==F O==< O==P O==> O==D O==Q O=G=H<
F<
<<
P<
><
D<
!"#$%&"'()$*+,")*--"-)./)0123
K-4-5:(3 K-&)3'C(,3 N,.3%-" L-$%."3& E$%-$#&(3
R#$63 R6"/6S&)3$ J#8(,- T(,3"3/.3 B3$353
B#". I-.)*'U0"(,3 V/3$%3 VW"3($# V"./.36

Informality in Emerging Markets: A Cross-Country Examination 2012 The Global Fairness Initiative www.globalfairness.org
60
Labor Demographics Labor force participation rates increased modestly in most sample countries over the reference period and were roughly clustered by region among the sample countries, with the exception of Africa. Uganda exhibited the highest labor participation rates, decreasing from 81 percent to 78 percent while South Africa experienced the lowest, also decreasing from 53 percent to 52 percent from 2003 to 2010. South American countries, including Colombia Ecuador, and Peru, observed the highest labor participation rates, between 69 percent and 76 percent.
!"#$%&'()$*%"+,-./
!"#$%&'$%()&*"%+,(,*"+,$-&%"+).&,-(%)".)/&0$/).+12&,-&0$.+&."0*1)&($3-+%,).&$4)%&+5)&%)')%)-()&*)%,$/6&7"%+,(,*"+,$-&%"+).&8)%)&%$39512&(13.+)%)/&%)9,$-&"0$-9&+5)&."0*1)&($3-+%,).:&8,+5&+5)&);()*+,$-&$'&<'%,("6&=9"-/"&);5,#,+)/&+5)&5,95).+&1"#$%&*"%+,(,*"+,$-&%"+).:&/)(%)".,-9&'%$0&>?&*)%()-+&+$&@>&*)%()-+:&85,1)&A$3+5&<'%,("&);*)%,)-()/&+5)&1$8).+:&"1.$&/)(%)".,-9&'%$0&BC&*)%()-+&+$&BD&*)%()-+&'%$0&DEEC&+$&DE?E6&A$3+5&<0)%,("-&($3-+%,).:&,-(13/,-9&F$1$0#,"&G(3"/$%:&"-/&7)%3&$#.)%4)/&+5)&5,95).+&1"#$%&*"%+,(,*"+,$-&%"+).&#)+8))-&HI&*)%()-+&"-/&@H&*)%()-+6
!"!#$%$&'$()$)*+,-./'0.1$23$!""45$6$7778/90:*9;*-<.=++80</$6$>=9$!"!8?@?8@"!!$6$AB*-9C$-.;0D/90:*9;*-<.=++80</$ !"
DEEC DEEJ DEEB DEEH DEE@ DEE> DEEI DE?EBD
HD
@D
>D
!"#$%&'"%()*)+"()$,&-"(.&/0&($("1&
+$+21"()$,&"3.4&5678
F$1$0#," F$.+"&K,(" G(3"/$% L$-/3%". M-/$-).,"
N)-2" N2%92O.+"- P);,($ Q,("%"93" 7"-"0"
7)%3 A$3+5&<'%,(" =9"-/" =R%",-) =%393"2

Informality in Emerging Markets: A Cross-Country Examination 2012 The Global Fairness Initiative www.globalfairness.org
61
Consistent with overall labor participation rates, female participation rates were generally clustered by region with Africa being the exception. Female labor force participation was highest in Uganda, decreasing from 80 percent to 76 percent from 2003 to 2010. Although South Africa exhibited relatively low female participation rates of about 45 percent during the reference period, the female labor participation rates of the Central American countries – Costa Rica, Honduras, Mexico, Nicaragua, and Panama – were lower.
!"#$%$&'#&()%&*("+',-..(.-/",(0-,&%1%0-&%"#(,-&'$2(3'4-.'(0-,&%1%0-&%"#(,-&'$()','(5'#',-..6(1.7$&','8(/6(&*'($-40.'(1"7#&,%'$9(,'5%"#$2()%&*(&*'(':1'0&%"#("3(;3,%1-<(='4-.'(.-/",(3",1'(0-,&%1%0-&%"#()-$(*%5*'$&(%#(>5-#8-2(8'1,'-$%#5(3,"4(?@(0',1'#&(&"(AB(0',1'#&(3,"4(C@@D(&"(C@E@<(;.&*"75*(F"7&*(;3,%1-(':*%/%&'8(,'.-&%+'.6(.")(3'4-.'(0-,&%1%0-&%"#(,-&'$("3(-/"7&(GH(0',1'#&(87,%#5(&*'(,'3','#1'(0',%"82(&*'(3'4-.'(.-/",(0-,&%1%0-&%"#(,-&'$("3(&*'(!'#&,-.(;4',%1-#(1"7#&,%'$(I(!"$&-(J%1-2(K"#87,-$2(L':%1"2(M%1-,-57-2(-#8(N-#-4-(I()','(.")',<(
!"!#$%$&'$()$)*+,-./'0.1$23$!""45$6$7778/90:*9;*-<.=++80</$6$>=9$!"!8?@?8@"!!$6$AB*-9C$-.;0D/90:*9;*-<.=++80</$ !"
C@@D C@@G C@@H C@@B C@@A C@@? C@@O C@E@DH
GH
HH
BH
AH
!"#$%"&'$()*&+$*,-.-/$,-)0&1$,"
23&4"#$%"&/)/5%$,-)0&$6"7&89:;
!"."4/%- !"$&-(J%1- P17-8", K"#87,-$ Q#8"#'$%-
R'#6- R6,56S$&-# L':%1" M%1-,-57- N-#-4-
N',7 F"7&*(;3,%1- >5-#8- >T,-%#' >,757-6

Informality in Emerging Markets: A Cross-Country Examination 2012 The Global Fairness Initiative www.globalfairness.org
62
Agricultural employment's percentage share of total employment decreased over the reference period in all but three sample countries. This sector accounted for less than 50 percent of the labor force in every sample country except Uganda and Kenya. Although agriculture accounted for only 25 percent of GDP in Uganda and Kenya, roughly 70 percent and 60 percent of employment was attributable to agriculture over the reference period, respectively. Indonesia and Kyrgyzstan also exhibited high levels of agricultural employment, decreasing from 46 percent to 38 percent and 43 percent to 34 percent, respectively. Agriculture accounted for roughly 15 percent of GDP in Indonesia, while this percentage share decreased from 37 percent to 21 percent from 2003 to 2010 in Kyrgyzstan.
!"#$%&'(&#)'*+,-'./,+0(12*-+#%+0()"+*23)#+*.4*(.()'*+,-'./,+0(*5+%#+)2+5*.6+#*(3+*#+4+#+0%+*-+#$.5*$0*)''*7&(*(3#++*2),-'+*%.&0(#$+28*93$2*2+%(.#*)%%.&0(+5*4.#*'+22*(3)0*:;*-+#%+0(*.4*(3+*')7.#*4.#%+*$0*+6+#/*2),-'+*%.&0(#/*+<%+-(*=")05)*)05*>+0/)8*?+2-$(+*)"#$%&'(&#+*)%%.&0($0"*4.#*.0'/*@:*-+#%+0(*.4*A?B*$0*=")05)*)05*>+0/)C*#.&"3'/*D;*-+#%+0(*)05*E;*-+#%+0(*.4*+,-'./,+0(*F)2*)((#$7&()7'+*(.*)"#$%&'(&#+*.6+#*(3+*#+4+#+0%+*-+#$.5C*#+2-+%($6+'/8*G05.0+2$)*)05*>/#"/H2()0*)'2.*+<3$7$(+5*3$"3*'+6+'2*.4*)"#$%&'(&#)'*+,-'./,+0(C*5+%#+)2$0"*4#.,*IE*-+#%+0(*(.*JK*-+#%+0(*)05*IJ*-+#%+0(*(.*JI*-+#%+0(C*#+2-+%($6+'/8*!"#$%&'(&#+*)%%.&0(+5*4.#*#.&"3'/*L:*-+#%+0(*.4*A?B*$0*G05.0+2$)C*F3$'+*(3$2*-+#%+0()"+*23)#+*5+%#+)2+5*4#.,*JD*-+#%+0(*(.*@L*-+#%+0(*4#.,*@;;J*(.*@;L;*$0*>/#"/H2()08
!"!#$%$&'$()$)*+,-./'0.1$23$!""45$6$7778/90:*9;*-<.=++80</$6$>=9$!"!8?@?8@"!!$6$AB*-9C$-.;0D/90:*9;*-<.=++80</$ !"
@;;J @;;I @;;: @;;E @;;D @;;K @;;M @;L;;
@:
:;
D:
!"#$%&'(&#)'*+,-'./,01(
*23*(.()'*0,-'./,01(4
N.'.,7$) N.2()*O$%) P%&)5.# Q.05&#)2 G05.0+2$)
>+0/) >/#"/H2()0 R+<$%. S$%)#)"&) B)0),)
B+#& T.&(3*!4#$%) =")05) =U#)$0+ =#&"&)/

Informality in Emerging Markets: A Cross-Country Examination 2012 The Global Fairness Initiative www.globalfairness.org
63
Industrial employment's percentage share of total employment generally increased among the sample countries from 2003 to 2010. This sector accounted for between 15 and 30 percent of total employment in most sample countries, except for Kenya and Uganda. The industrial sector comprised between 4 percent and 8 percent of employment in these countries, respectively, and these low percentages are likely attributable to lower levels of development. The percentage share of industrial employment was highest in the more developed countries of South Africa and Mexico, accounting for 26 percent of total employment. Notably, employment attributable to the industrial sector was relatively low in Indonesia and Kyrgyzstan relative to other sample countries, increasing from 18 percent to 19 percent and 15 percent to 21 percent, respectively. The industrial sector accounted for about 45 percent of Indonesia's GDP during the reference period.
The percentage share of total employment attributable to the service sector increased slightly in most sample countries, accounting for between 30 percent and 80 percent of total employment in every country except Uganda. This sector's percentage share of total employment increased from 24 percent to 28 percent in Uganda during the reference period. Service-sector employment was
!"#$%&'()*+,-.*/0-,"&1%+.,'2,"&)3,+%4)',+/5+&/&)*+,-.*/0-,"&+3,",')**0+("2',)%,#+)-/"3+&4,+%)-.*,+2/$"&'(,%+5'/-+6778+&/+6797:+;4(%+%,2&/'+)22/$"&,#+5/'+<,&=,,"+9>+)"#+87+.,'2,"&+/5+&/&)*+,-.*/0-,"&+("+-/%&+%)-.*,+2/$"&'(,%?+,@2,.&+5/'+A,"0)+)"#+B3)"#):+C(D,*0+)&&'(<$&)<*,+&/+*/=,'+*,E,*%+/5+#,E,*/.-,"&?+&4,+("#$%&'()*+%,2&/'+2/-.'(%,#+<,&=,,"+F+.,'2,"&+)"#+G+.,'2,"&+/5+,-.*/0-,"&+("+&4,%,+2/$"&'(,%?+',%.,2&(E,*0:+H/"3'$,"&*0?+&4,+.,'2,"&)3,+%4)',+/5+("#$%&'()*+,-.*/0-,"&+=)%+4(34,%&+("+&4,+-/',I#,E,*/.,#+2/$"&'(,%+/5+J/$&4+K5'(2)+)"#+L,@(2/?+)22/$"&("3+5/'+6M+.,'2,"&+/5+&/&)*+,-.*/0-,"&:+N/&)<*0?+,-.*/0-,"&+)&&'(<$&)<*,+&/+&4,+("#$%&'()*+%,2&/'+=)%+',*)&(E,*0+*/=+("+!"#/",%()+)"#+A0'30O%&)"+',*)&(E,+&/+/&4,'+%)-.*,+2/$"&'(,%?+("2',)%("3+5'/-+9G+.,'2,"&+&/+9P+.,'2,"&+)"#+9>+.,'2,"&+&/+69+.,'2,"&?+',%.,2&(E,*0:+;4,+("#$%&'()*+%,2&/'+)22/$"&,#+5/'+)</$&+F>+.,'2,"&+/5+!"#/",%()1%+QRS+#$'("3+&4,+',5,',"2,+.,'(/#:
!"!#$%$&'$()$)*+,-./'0.1$23$!""45$6$7778/90:*9;*-<.=++80</$6$>=9$!"!8?@?8@"!!$6$AB*-9C$-.;0D/90:*9;*-<.=++80</$ !"
6778 677F 677> 677M 677T 677G 677P 6797F
G
96
9M
67
6F
6G
!"#$%&'()*+,-./+01.2"&,
34,&0&*+,2./+01.2"&5
H/*/-<() H/%&)+U(2) V2$)#/' W/"#$')% !"#/",%()
A,"0) A0'30O%&)" L,@(2/ N(2)')3$) S)")-)
S,'$ J/$&4+K5'(2) B3)"#) BD')(", B'$3$)0

Informality in Emerging Markets: A Cross-Country Examination 2012 The Global Fairness Initiative www.globalfairness.org
64
highest in Peru, decreasing from 79 percent in 2003 to 75 percent in 2009, as well as in Uruguay, where this percentage share also decreased from 74 percent to 67 percent. The service sector also accounted for a large portion of total employment in South Africa, increasing from 64 percent to 70 percent.
Though data are sparse, children between 7 and 14 years of age contributed to employment in the sample countries during the reference period. Child employment was most prevalent in the agricultural sector, exceeding 60 percent of the population for the 7-14 years age group in several countries, including Ecuador, Honduras, Kyrgyzstan, Nicaragua, Panama, Peru, and Uganda. Agricultural child employment was highest in Kyrgyzstan and Uganda, accounting for 98 percent and 95 percent of the 7-14 years age group in 2007 and 2006, respectively. Notably, child employment in agriculture exceeded 40 percent in Colombia and Costa Rica. The service sector also accounts for a significant portion of child employment, exceeding 40 percent of the 7-14 years age group in Colombia, Costa Rica, Mexico, and Uruguay. Service-sector child employment exceeded 20 percent of the 7-14 years age group in Ecuador, Honduras,
!"#$%#&'#()*+#$,"*&#$-.$)-)*/$#0%/-10#()$*))&234)*3/#$)-$)"#$,#&52'#$,#')-&$2('&#*,#6$,/2+")/1$2($0-,)$,*0%/#$'-4()&2#,7$*''-4()2(+$.-&$3#)8##($9:$%#&'#()$*(6$;:$%#&'#()$-.$)-)*/$#0%/-10#()$2($#5#&1$'-4()&1$#<'#%)$=+*(6*>$!"2,$,#')-&?,$%#&'#()*+#$,"*&#$-.$)-)*/$#0%/-10#()$2('&#*,#6$.&-0$@A$%#&'#()$)-$@;$%#&'#()$2($=+*(6*$64&2(+$)"#$&#.#&#('#$%#&2-6>$B#&52'#C,#')-&$#0%/-10#()$8*,$"2+"#,)$2($D#&47$6#'&#*,2(+$.&-0$EF$%#&'#()$2($@::9$)-$EG$%#&'#()$2($@::F7$*,$8#//$*,$=&4+4*17$8"#&#$)"2,$%#&'#()*+#$,"*&#$*/,-$6#'&#*,#6$.&-0$EA$%#&'#()$)-$HE$%#&'#()>$!"#$,#&52'#$,#')-&$*/,-$*''-4()#6$.-&$*$/*&+#$%-&)2-($-.$)-)*/$#0%/-10#()$2($B-4)"$I.&2'*7$2('&#*,2(+$.&-0$HA$%#&'#()$)-$E:$%#&'#()>
!"!#$%$&'$()$)*+,-./'0.1$23$!""45$6$7778/90:*9;*-<.=++80</$6$>=9$!"!8?@?8@"!!$6$AB*-9C$-.;0D/90:*9;*-<.=++80</$ !"
@::9 @::A @::G @::H @::E @::; @::F @:J:@:
9:
A:
G:
H:
E:
;:
!"#$%&"'()*+,("-.
/01.+.2*1"()*+,("-.3
K-/-032* K-,)*$L2'* M'4*6-& N-(64&*, O(6-(#,2*
P#(1* P1&+1Q,)*( R#<2'- S2'*&*+4* D*(*0*
D#&4 B-4)"$I.&2'* =+*(6* =T&*2(# =&4+4*1

Informality in Emerging Markets: A Cross-Country Examination 2012 The Global Fairness Initiative www.globalfairness.org
65
Indonesia, Panama, and Peru. Child employment in the service sector was highest in Uruguay in 2009, accounting for 59 percent of children ages 7-14 years. Manufacturing accounts for the lowest portion of child employment, typically less than 10 percent. The manufacturing sector did, however, employ 12 percent and 11 percent of children ages 7-14 years in Mexico in 2009 and 2007.
Literacy rates ranged between 78 percent and 100 percent of the labor force among sample countries. Ecuador and Nicaragua had the lowest literacy rates during the reference period of 84 percent in 2007 and 2009 and 78 percent in 2005, respectively. Conversely, Ukraine and Kyrgyzstan exhibited the highest literacy rates of 100 percent and 99 percent in 2009. Of the sample countries, eight had literacy rates above 90 percent of the labor force during the reference period. Labor force educational attainment data illustrate a number of cross-country trends. Kyrgyzstan and South Africa both exhibited relatively low primary education completion rates, increasing from 8 percent of the labor force to 24 percent, and decreasing from 34 percent to 16 percent, respectively. Both countries, however, observed high secondary education completion levels, decreasing from 76 percent to 55 percent in Kyrgyzstan and increasing from 48 percent to 74 percent in South Africa. Tertiary education attainment levels were also low for both countries, decreasing from 16 percent to 3 percent in Kyrgyzstan and from 13 percent to 5 percent in South Africa. However, Costa Rica, Mexico, and Indonesia all exhibit comparatively high primary education attainment rates coupled with low completion rates for secondary and tertiary education.
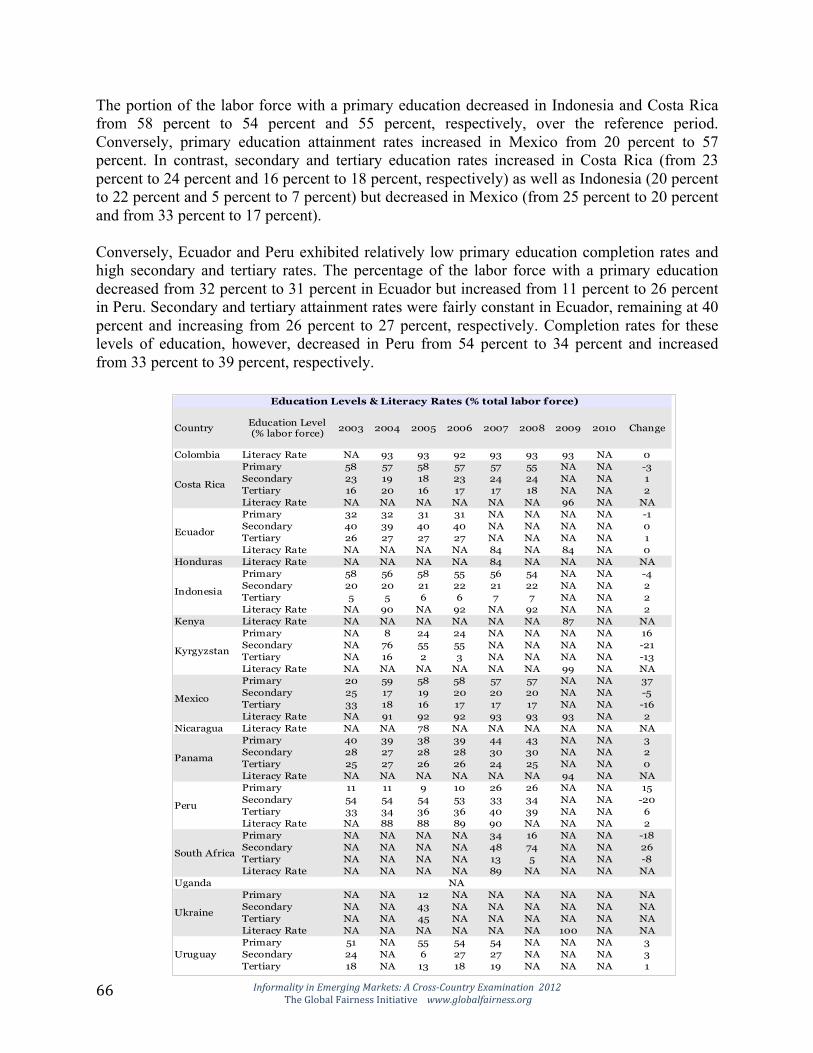
Informality in Emerging Markets: A Cross-Country Examination 2012 The Global Fairness Initiative www.globalfairness.org
66
The portion of the labor force with a primary education decreased in Indonesia and Costa Rica from 58 percent to 54 percent and 55 percent, respectively, over the reference period. Conversely, primary education attainment rates increased in Mexico from 20 percent to 57 percent. In contrast, secondary and tertiary education rates increased in Costa Rica (from 23 percent to 24 percent and 16 percent to 18 percent, respectively) as well as Indonesia (20 percent to 22 percent and 5 percent to 7 percent) but decreased in Mexico (from 25 percent to 20 percent and from 33 percent to 17 percent). Conversely, Ecuador and Peru exhibited relatively low primary education completion rates and high secondary and tertiary rates. The percentage of the labor force with a primary education decreased from 32 percent to 31 percent in Ecuador but increased from 11 percent to 26 percent in Peru. Secondary and tertiary attainment rates were fairly constant in Ecuador, remaining at 40 percent and increasing from 26 percent to 27 percent, respectively. Completion rates for these levels of education, however, decreased in Peru from 54 percent to 34 percent and increased from 33 percent to 39 percent, respectively.
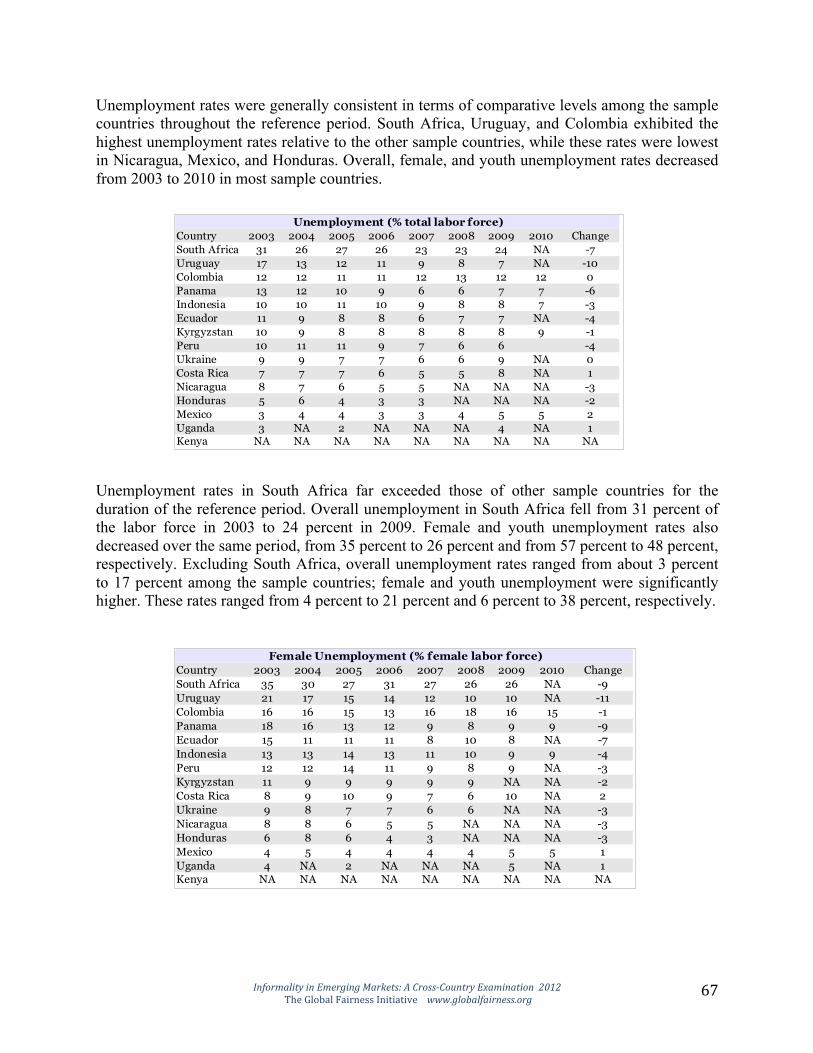
Informality in Emerging Markets: A Cross-Country Examination 2012 The Global Fairness Initiative www.globalfairness.org
67
Unemployment rates were generally consistent in terms of comparative levels among the sample countries throughout the reference period. South Africa, Uruguay, and Colombia exhibited the highest unemployment rates relative to the other sample countries, while these rates were lowest in Nicaragua, Mexico, and Honduras. Overall, female, and youth unemployment rates decreased from 2003 to 2010 in most sample countries. Unemployment rates in South Africa far exceeded those of other sample countries for the duration of the reference period. Overall unemployment in South Africa fell from 31 percent of the labor force in 2003 to 24 percent in 2009. Female and youth unemployment rates also decreased over the same period, from 35 percent to 26 percent and from 57 percent to 48 percent, respectively. Excluding South Africa, overall unemployment rates ranged from about 3 percent to 17 percent among the sample countries; female and youth unemployment were significantly higher. These rates ranged from 4 percent to 21 percent and 6 percent to 38 percent, respectively.

Informality in Emerging Markets: A Cross-Country Examination 2012 The Global Fairness Initiative www.globalfairness.org
68
Uruguay experienced the largest percentage decrease in all three unemployment rates during the reference period. Overall, female, and youth unemployment fell by 10 percent, 11 percent, and 18 percent, respectively, over the reference period. Compared to other sample countries, all three rates in Uruguay were second only to South Africa. Notably, four Central American countries consistently experienced the lowest unemployment rates during the reference period: Costa Rica, Nicaragua, Honduras, and Mexico. The remaining Central American country in the sample – Panama – exhibited the third- or fourth-highest unemployment rates relative to other sample countries. In addition, all three rates increased in Mexico over the reference period. Unemployment by education level indicates that workers with secondary education as the highest level attained comprise the majority of the unemployed in most of the sample countries, including Colombia, Ecuador, Kyrgyzstan, Nicaragua, Panama, South Africa, and Ukraine. Workers with a secondary education accounted for the largest share of unemployment in Kyrgyzstan, decreasing from 79 percent to 77 percent over the reference period. Notably, the portion of Kyrgyzstan's total labor force with a secondary education level was comparatively high, decreasing from 77 percent to 55 percent during the reference period. The portion of unemployment attributable to laborers with a secondary education did not fall below 21 percent in any country where workers with a secondary education level accounted for the largest portion of unemployment. Workers who had attained only a primary education accounted for the largest portion of unemployment in Costa Rica, Mexico, and Uruguay. Workers with a primary education comprised a relatively large portion of the labor force in each of these three countries, exceeding 50 percent. Of these countries, laborers with a secondary education accounted for the largest portion of unemployment in Costa Rica, decreasing from 68 percent to 67 percent. Notably, the percentage share of unemployment attributable to primary- and secondary-education workers was roughly even in Indonesia. This percentage share decreased from 50

Informality in Emerging Markets: A Cross-Country Examination 2012 The Global Fairness Initiative www.globalfairness.org
69
percent to 43 percent of unemployment for workers with a primary education but increased from 35 percent to 41 percent for workers with a secondary education. More than half of Indonesia's labor force was attributable to primary-education workers during the reference period. Unemployment in Peru is roughly equally split among workers with primary, secondary, and tertiary education levels, with tertiary-education workers accounting for the largest portion (nearly 40 percent). About 75 percent of Peru's labor force consisted of secondary- and tertiary-education workers during the reference period.
Informality in Emerging Markets: A Cross-Country Examination 2012 The Global Fairness Initiative www.globalfairness.org
70
ENDNOTES
i United Nations General Assembly, 64th Session Report of the Secretary General. “Legal Empowerment of the Poor and Eradication of Poverty,” July 13, 2009. Doc. Num. A/64/133, 10. ii Key Indicators of the Labor Market, 7th edition. International Labor Organization, 2011. http://kilm.ilo.org/kilmnet/ iii UN, “Legal Empowerment.” iv ILO, Key Indicators. v ILO, Key Indicators. vi ILO, Key Indicators. vii Hernando DeSoto, The Other Path: The Economic Answer to Terrorism (New York: Basic Books, 1989). viii Roberta Gatti, Diego F. Angel-‐Urdinola, Joan Silva, and Andras Bodor, “Striving for Better Jobs: The Challenge of Informality in the Middle East and North Africa Region,” The World Bank, September 2011. http://awi.worldbank.org/content/dam/awi/pdf/informality_report_MENA_overview.pdf ix UN, “Legal Empowerment.” x ILO, Key Indicators. xi Gatti et al., “Striving for Better Jobs.” xii Ibrahim Elbadawi and Norman Loayza, “Informality, Employment and Economic Development in the Arab World,” Journal of Development and Economic Policies, Vol. 10, No. 2, July 2008, 25-‐75. xiii Gatti et al., “Striving for Better Jobs.” xiv Gatti et al., “Striving for Better Jobs.” Guillermo E. Perry, William F. Maloney, Omar S. Arias, Pablo Fajnzylber, Andrew D. Mason, and Jaime Saavedra-‐Chanduvi, Informality: Exit and Exclusion (Washington, DC: World Bank, 2007).

Informality in Emerging Markets: A Cross-Country Examination 2012 The Global Fairness Initiative www.globalfairness.org
71
xv Gatti et al., “Striving for Better Jobs.” xvi Shaid Javed Burki and Guillermo E. Perry, Beyond the Washington Consensus: Institutions Matter. (Washington, DC: The World Bank, 1998), 141. xvii Perry et al., Informality . . . xviii Gatti et al., “Striving for Better Jobs.” xix Gatti et al., “Striving for Better Jobs.” xx ILO Key Indicators. xxi UN, “Legal Empowerment” xxii UN, “Legal Empowerment” xxiii Catherine Kuchta-‐Helbling, “Barriers to Participation: The Informal Sector in Emerging Democracies,” Background Paper for the Center for International Private Enterprise, November 13, 2000. xxiv UN, “Legal Empowerment.” xxv Gatti et al., “Striving for Better Jobs.” xxvi Kuchta-‐Helbling, “Barriers to Participation.” xxvii UN, “Legal Empowerment.” xxviii De Soto, The Other Path. xxix Hernando De Soto, The Mystery of Capital: Why Capitalism Triumphs in the West and Fails Everywhere Else (New York: Basic Books, 2000), 35-‐36. xxx Kuchta-‐Helbling, “Barriers to Participation,” 13. xxxi Jaime Saavedra and Alberto Chong, “Structural Reform, Institutions, and Earnings: Evidence from the Formal and Informal Sectors in Urban Peru,” The Journal of Development Studies, 35, 4, 1999. xxxii ILO, Key Indicators. xxxiii Gatti et al., “Striving for Better Jobs.” xxxiv Gatti et al., “Striving for Better Jobs.”

Informality in Emerging Markets: A Cross-Country Examination 2012 The Global Fairness Initiative www.globalfairness.org
72
xxxv Gatti et al., “Striving for Better Jobs.” xxxvi Gatti et al., “Striving for Better Jobs.” xxxvii Laura Addati and Naomi Cassirer, Expanding Women’s Employment Opportunities: Informal Economy Workers and the Need for Childcare, International Labor Organization, Conditions of Work and Employment Programme, 2007. xxxviii Pat Richardson, Rhona Howarth, and Gerry Finnegan, The Challenges of Growing Small Businesses; Insights from Women Entrepreneurs in Africa, InFocus Programme on Boosting Employment through Small Enterprise Development, Job Creation and Enterprise Department. ILO SEED Working Papers: Series on Women’s Entrepreneurship Development and Gender in Enterprises, WEDGE, No. 47, Geneva, 2004. xxxix Richardson et al., Challenges of Growing Small Businesses. xl Richardson et al., Challenges of Growing Small Businesses. xli Gatti et al., “Striving for Better Jobs.” xlii W.F. Maloney, “Does Informality Imply Segmentation in Urban Labor Markets? Evidence from Sectoral Transitions in Mexico,” The World Bank Economic Review Vol. 13 (2), 1999, 275-‐302. xliii Kuchta-‐Helbling, “Barriers to Participation.” xliv Gatti et al., “Striving for Better Jobs.” xlv Gatti et al., “Striving for Better Jobs.” xlvi Gatti et al., “Striving for Better Jobs.” xlvii Kuchta-‐Helbling, “Barriers to Participation.” xlviii World Bank, From Privilege to Competition: Unlocking Private-Led Growth in Middle East and North Africa, (Washington, DC: World Bank, 2009). xlix Kuchta-‐Helbling, “Barriers to Participation.” l Kuchta-‐Helbling, “Barriers to Participation.” li Dominik Enste and Friedrich Schneider, “Increasing Shadow Economies all over the World – Fiction or Reality? A survey of the global evidence of their size and of their impact

Informality in Emerging Markets: A Cross-Country Examination 2012 The Global Fairness Initiative www.globalfairness.org
73
from 1970 to 1995,” The Institute for the Study of Labor (IZA) Discussion Paper 26, December (Bonn, Germany: IZA, 1998). Simon Johnson, Daniel Kaufmann, and Andrei Shleifer, “The Unofficial Economy in Transition,” Brookings Papers on Economic Activity 2, 1997, 159-‐239. lii Gatti et al., “Striving for Better Jobs.” liii Gatti et al., “Striving for Better Jobs.” liv Gatti et al., “Striving for Better Jobs.” lv World Bank Development Indicators. http://data.worldbank.org/data-‐catalog/world-‐development-‐indicators lvi Gatti et al., “Striving for Better Jobs.” lvii Gatti et al., “Striving for Better Jobs.” lviii Gatti et al., “Striving for Better Jobs.” lix Gatti et al., “Striving for Better Jobs.” lx World Bank Development Indicators. lxi World Bank Development Indicators. lxii World Bank Development Indicators. lxiii Gatti et al., “Striving for Better Jobs.” lxiv Alberto Chong and Cesar Calderon, “Institutional Efficiency and Income Inequality: Cross Country Empirical Evidence.” (Washington, DC: The World Bank, 1998) Typescript Manuscript. lxv World Bank Development Indicators. lxvi Chong and Calderon, “Institutional Efficiency.” lxvii Gatti et al., “Striving for Better Jobs.” lxviii ILO, Key Indicators. lxix ILO, Key Indicators.

Informality in Emerging Markets: A Cross-Country Examination 2012 The Global Fairness Initiative www.globalfairness.org
74
lxx ILO, Key Indicators. lxxi ILO, Key Indicators. lxxii ILO, Key Indicators. lxxiii World Bank Development Indicators.