informatiom flow simulation in supply chain process …
TRANSCRIPT

Academy of Strategic Management Journal Volume 20, Issue 6, 2021
1 1939-6104-20-6-884
Citation Information: Khalifa, N., Elghany, M.A., & Elghany, M.A. (2021). Information flow simulation in supply chain process
for developing countries. Academy of Strategic Management Journal, 20(6), 1-19.
INFORMATIOM FLOW SIMULATION IN SUPPLY
CHAIN PROCESS FOR DEVELOPING COUNTRIES
Nermin Khalifa, College of Management & Technology, Arab
Academy for Science & Technology
Mona Abd Elghany, College of Management & Technology, Arab
Academy for Science & Technology
Marwa Abd Elghany, College of Management & Technology, Arab
Academy for Science & Technology
ABSTRACT
Today’s global environment is a very competitive one. Egypt as well is trying to drive its
economic growth to attain success in supply chains globally. Therefore, most of industrial zones
there are seeking how to optimize the performance of their firms and accelerate their success.
Sterman developed a Beer Game which presented a symbolic supply chain and illustrated the
effect of bullwhip effect and information delay along its performance. This paper describes the
Beer Game simulation which incorporates more variables that address existing deficiencies
facing industries especially in developing countries. It focuses on a mass customization strategy
to deliver tailored products to the international and local markets. The proposed design of beer
game is based on empirical studies conducted in developing countries to indicate barriers facing
these industrial zones for participating in global supply chain.
Keywords: Global Supply Chain, Supply Chain Deficiency, System Dynamic, Beer Game.
INTRODUCTION
A simulation, according to Merriam-Webster.com (2014), is "the imitative portrayal of
the functioning of one system or process by means of the functioning of another." It is a model of
a real-world system (Crookall et al., 1987). The majority of SD games are decision- making tools
where participants assume the position of a decision maker. Abt (1970) refers to this kind of
games in his well-known book on serious games, stating, "Reduced to its formal essence, a game
acts an activity among two or more autonomous decision-makers attempting to fulfil their
objectives."
Ellington et al. (1982) address the definition's potential flaw in circumstances when
single players compete against the "game system" by including the game system's creator as one
of the decision makers. Decisions take place depending on the information about the state of the
system that is available to the decision maker. The decisions will have an impact on the system
state, and when the decision maker receives information about the new system state, he or she
will take a new decision that will affect the state of the system once more. In its most basic
form, this creates a feedback loop, where a decision has an effect that is amplified by another
decision.

Academy of Strategic Management Journal Volume 20, Issue 6, 2021
2 1939-6104-20-6-884
Citation Information: Khalifa, N., Elghany, M.A., & Elghany, M.A. (2021). Information flow simulation in supply chain process
for developing countries. Academy of Strategic Management Journal, 20(6), 1-19.
By cutting the loop and showing the influence to the user, who will then input a decision
from which the influence can be estimated, a System Dynamic model with information feedback
can simply be made interactive. Some researchers like Kopainsky & Sawicka (2011), and Maier
& Größler (2000) regard an interactive simulation to be a simulation game. For example,
Klabbers (2003) describes games as containing actors, resources, and rules, while simulations
simply contain resources and rules. An interactive simulation represents a game according to this
definition.
The preceding description is aimed to demonstrate the relationship between information
feedback in System Dynamics and game decision-making rounds. The goal of a SD-based game
is frequently to communicate dynamic insights founded on feedback thinking. Even though the
modeller gained these dynamic insights when developing the model; that does not entail that the
same model is appropriate for communicating this understanding to others. For reaching the
objective, an entirely different model might be better appropriate (Andersen et al., 1990).
The structure of the paper is summarised in the following. The Literature review will
demonstrate the beer game as a system dynamic SD simulating tool and then the proposed model
is exhibited, followed by the discussion of its impact ending up with a conclusion and a
recommendation of its generalisation to be applied as a decision making model for supply chain
process in developing countries.
LITERATURE REVIEW
The Beer Game is a tool that simulates material flows and information from a factory to a
store along a supply chain. The ever-changing inter-organizational combinations are putting a
strain on the traditional supply chain model. To exemplify scenarios wherein manufacturers act
as nodes in a network of competitive or cooperative suppliers, customers, and other specialised
service activities, additional "market-oriented" concepts are required. The goal of this work is to
develop and test a novel simulating based on the Beer Game's principles.
The main purpose of this business game is to demonstrate the existence of the "Bullwhip
effect" and its characteristics (Lee et al., 1997). Retailer, wholesaler, distributor, and factory are
the four players in the Beer Game. These players are spread out along a single supply chain,
collaborating about the orders that each player directs to the player closest to them. The
exception is the order of the retailer, which is represented by the ultimate customer's
requirements and is established in advance and unknown to other parties.
Kimbrough et al. (2002) outline how participants behave when they connect to the supply
chain. Players, in their opinion, are not motivated to share knowledge; their decisions are made
in settings of bounded reasonableness, and their rational individual behaviour occasionally
contradicts the group's objectives. Ming (2001); Beamon (1998), and Anderson (1994)
demonstrate how the supply chain evolves into network solutions dependant on communicative
and collaborative interactions between two or more firms and aimed at the coordination of
various operations. As a result of these new trends in interorganizational configurations, the term
"Networked Enterprise" has been coined to describe the worldwide supply chain of a single
product in an environment consisting of dynamic networks between enterprises involved in a
variety of complicated partnerships (Martinez et al., 2001). Manufacturers no longer develop full
items in isolated facilities in a Networked Enterprise. They connect a network of suppliers,
customers, and other specialised service operations. Transaction costs are a critical factor to
consider in such situations (Lajili & Mahoney 2006, Williamson 1981), and some formal

Academy of Strategic Management Journal Volume 20, Issue 6, 2021
3 1939-6104-20-6-884
Citation Information: Khalifa, N., Elghany, M.A., & Elghany, M.A. (2021). Information flow simulation in supply chain process
for developing countries. Academy of Strategic Management Journal, 20(6), 1-19.
representations for modelling concerns like transaction costs and risks in virtual firms have been
presented in the literature (D'Atri & Motro, 2009).
Sterman's Beer Game was developed by the System Dynamic Group at the MIT in the
1960s and it had the following assumptions as documented in Perera et al. (2020); Mohaghegh
& Größler (2020); Yang et al. (2000); Forrester (2009); and Joshi (2000):
One inventory stock is held at each level of the supply chain. The Beer Game had not brought in raw
inventories in the level producers and took into consideration merely the warehousing of final product.
This postulation is unrealistic while simulating the manufacturing activities and the role of the
producer;
The capacity of production is presumed to be unlimited; accordingly time restrictions are not reflected.
Because the time of production depends on the capacity of the machine and the skills of labour that
subsequently identify the rate of error. These factors must take into account in order to simulating the
actual activities of the production;
It involves four separate components. The traditional beer game focused on the distribution cycle and
omitted the level of the supplier. Since the key objective of the beer game is the simulation of the cycle
of manufacturing-distribution, the time of delivery and the raw buffer pattern refilling must be encompassed in order to simulating more reasonable activities of production;
Events that could occur randomly such as breakdown of machines or transport problems are not
included. Nevertheless, these problems can interrupt activities of production and accordingly have an
obvious effect on the lead time of the product.
Each component in the supply chain operates individually. There exists no information
share on forecasting information or levels of inventory. In original beer game, communication
between these components is restricted to receiving/sending orders to the customer (Joshi, 2000).
Figure 1 below exemplifies the traditional beer game of Sterman.
The Proposed SD Game
Though the above simulated traditional supply chain is much simpler than the actual
supply chain of life in reality, the model has been adapted to be even more realistic. The paper
constitutes with essential design that imitate scenario of supply chain activities in developing
countries. The design of the proposed beer game considers most of barriers and obstacles that
face industrial zone such as: planning, production, distributions and logistics issues. The
presented design can be easily extended to simulate individual case of industrial sector and offer
customized design. The suggested Game focuses on mass customization strategy to deliver
tailored products to the international and local marketplace.
The re-design process of the proposed Beer Game is based on empirical study that had
conducted in Egyptian industries. This empirical study indicates number of issues lead to
existing supply chain deficiency in the industries in Egypt. The outcome of the cross-industry
study was published in (Khalifa et al., 2008). The result of the empirical study was adapted in
furthermore publication to re-design Sterman game and imitate the case of global export of
tailored fabrics and propose optimized scenarios there (Khalifa et al., 2009). The experiments
simulated the case of producing home-textile fabrics that had been made of Egyptian cotton due
to its popularity in the global market (EgyTex, 2009). This paper extends the work achieved so
far to replicate a more realistic design of beer game and simulate the production of customized
product in developing countries considering deficiencies exist there (logistics infrastructure,
cultural barriers and production capabilities). Therefore, the main contribution of this research
paper is to propose a realistic Beer game design that demonstrates case of supplying customized
product domestically and globally. Running simulation experiments using proposed game design

Academy of Strategic Management Journal Volume 20, Issue 6, 2021
4 1939-6104-20-6-884
Citation Information: Khalifa, N., Elghany, M.A., & Elghany, M.A. (2021). Information flow simulation in supply chain process
for developing countries. Academy of Strategic Management Journal, 20(6), 1-19.
will provide fundamental pillars for supply chain beneficiaries and researcher to propose
solutions that might diminish current deficiencies in any sector under investigation.
Source: Joshi, 2000
FIGURE 1
STERMAN BEER GAME

Academy of Strategic Management Journal Volume 20, Issue 6, 2021
5 1939-6104-20-6-884
Citation Information: Khalifa, N., Elghany, M.A., & Elghany, M.A. (2021). Information flow simulation in supply chain process
for developing countries. Academy of Strategic Management Journal, 20(6), 1-19.
Table 1
EMPIRICAL STUDY FINDINGS
Issues Key Findings
Forecasting and Planning
Activities
There exist no pre-
defined design for the Supply chain
Despite the fact that the view of the supply chain concept is unclear to the respondents, individual decision patterns are exercised by every partner and the Ad-
hoc pattern is used. Decisions and its pre-settled strategies pursued for refilling and capacities of inventories demonstrate inconsistent objectives.
Non- Integrating platform for the Supply
Chain
Manually denoted in the consecutive pattern of pass order. Lack of visibility along the chain and order processing delays indicates the existence of a fragmented
platform.
Unreliable and
inaccurate forecasting of demand
Each partner depends on amplified demand data because of a sequential supply chain. Additionally, the level of safety is encompassed in every placed order by the
following partner. No real-time supply of actual set for demand of customer is delivered. Every single partner is dependent on this enlarged forecasting data.
Volume of
procurement & material price fluctuations
Supplies are placed to order to meet the needs of each incoming customer, regardless of the huge amounts held in the inventory. The level of safety of each producer shall
be included in the order for procurement. Issues of price are excepted as they relate to the economic factor more than to the modelled deficiencies internally in the
investigation of simulation.
Procurement &
the Activities of Inventory
Delivery Long-term 1-8 weeks for overseas supplies and 1-2 weeks for domestic supplies. Random
function adoption represents logistics conditions and unstable delivery.
Large volume of inventory & cost
(finished products and raw materials)
Inventory remained big to prevail over delays in delivery and dependence on supplier. The completion of order is intertwined with replenishment of inventory of
the same amount although the buffer is big enough to meet that order. The strategy of replacement has been adopted consciously.
Production
Operations
Cost increase of
production and time
Whereas costs and time are related, the long duration of the operation negatively impacts costs. Timing of production is indicated by the limitations of capacity of
production.
Marketing &
Distribution Activities
Limit of Share of
Market Actual data set on real feeds of demand into the simulation.
(Internationally
& locally)
Features of
Technology
Poorness of the infrastructure of IT or
limited competence
The Consecutive Supply Chain deploys techniques that are manual for delay pass.
Unjustified investment of IT
Leads to inadequate advantages of automation within the organisation.
Source: Khalifa et al. (2008)
The cross-industry findings indicated number of issues that had been imposed in supply
chain behavior; these issues have been discussed in Khalifa et al. (2008). Most of these
issues/deficiencies have been symbolized in proposed game design as follows in Table 1:
For model’s calibration, Beer Game’s equations are using variables rather than simple
assumption and constants. The values of such variables should be driven from a real dataset of
simulated case study. This dataset includes values for: customer demand pattern, the needed
time for perception of order, level of safety in procurement of order, the buffer of safety of
inventories’ raw material, the primary quantity of lines of supply, the loss rate of production, the
needed time to production adjustment, the capacity of production of each producer, the time
of delivery of international and domestic procurement and the needed time for the delivery of the
overseas finished product. Software Vensim is applied in simulating and modelling supply chain.

Academy of Strategic Management Journal Volume 20, Issue 6, 2021
6 1939-6104-20-6-884
Citation Information: Khalifa, N., Elghany, M.A., & Elghany, M.A. (2021). Information flow simulation in supply chain process
for developing countries. Academy of Strategic Management Journal, 20(6), 1-19.
Design of Proposed Beer Game
This paper proposes two beer games; the first one represents the case of the supply of
customized products to local markets (Proposed Beer Game 1) while the second one represents
case of the fulfillment of global markets (Proposed Beer Game 2).
For Proposed Beer Game 1, the game started with placing order by a customer. The
customer demand is actually measured in the proposed game using various distribution
functions. Real data set regarding actual demand is being fed into proposed simulation
experiment as discussed in Table 1 - Distribution & Marketing Activities .This will overcome
issue related to fixed demand assumption as proposed in traditional Beer Game. Fixed demand
assumption in Sterman beer Game could not reflect unstable demand forecasting as a major issue
face planning and forecasting activities in Table 1. As real dataset is used in this beer game,
Distribution of demand signals has been tested and appropriate selection of distribution function
was defined accordingly. In our case, the demand is normally distributed and indicated using
RANDOM NORMAL function of weekly demand rates:
ORDER=RANDOM NORMAL (1095, 23824, 12905, 6291, 0) …. (1)
Other distribution functions such as: RANDOM BINOMIAL, RANDOM BETA,
RANDOM EXPONENTIAL, RANDOM LOOKUP, RANDOM GAMMA are available as
well for other data distribution. Vensim Manual explains more alternatives for distribution
function (Vensim Documentation, n.d.). The sample case study used in the simulation
experiment indicates a normally-distributed demand where the order is placed at the site of the
retailer per unit O, at certain t time, equations are as follows:
O(t) = maximum coordinat (0, IO(t))
IO(t) = rate of order indicated, that is calculated depending on the three following factors:
- The stock (L) loss expected
- The discrepancy between the stock actual and the desired
- The discrepancy between the supply line actual and the desired
Therefore the equation will be:
IO(t) = Forecast of Demand + gap of stock actual + gap of supply line actual
IO(t) = Forecast of Demand + A•(Safety_level_of_Inventory – (Inv-Backlog(t)) –
B•Supplylinegap(t)
The inventory buffer used in the case study is 10000 units which are stored as finished
products by the producer. The vendor keeps a stock about 10 tonne. The order is handed from the
retailer in the downstream of supply chain to the upstream of producer, wholesaler, and the
distributor. There is a delay in time between shipments and orders from one level to the
following, which is approximately a week depending on the sample case and denoted by the
FIXED DELAY function.
Ordered= DELAY FIXED (placed, 1, 200) …. (2)

Academy of Strategic Management Journal Volume 20, Issue 6, 2021
7 1939-6104-20-6-884
Citation Information: Khalifa, N., Elghany, M.A., & Elghany, M.A. (2021). Information flow simulation in supply chain process
for developing countries. Academy of Strategic Management Journal, 20(6), 1-19.
Other discrete DELAY function can be used according to applied case (DELAY
INFORMATION function, SMOOTH function, SMOOTH3 function and SMOOTH N
function). In the case study, the decision makers used to include a margin of safety in each order
located to overcome material misuse during the production cycle. Most of industrial zones in
developing countries used to order safety margin to avoid price fluctuation and production
deficiencies as discussed in Table 1 - Procurement & Inventory replenishment issues.
Therefore, a margin of safety is indicated in the order of material by each player and conversion
of unit is being used while ordering supplies. The order amount of finished product is converted
into supplies while a producer placing an order to the vendor’ factory. In turn, the amount of
modules/components is translated as well into raw materials supplies to that shall be commanded
from its suppliers.
For reality imitation in production cycle, the SD game has been modified to exemplify 2
levels of the cycle of production. The first is the conversion of raw materials to semi- finished
components. The second shows the conversion of the semi-finished components to finished
products. In order for each producer to overcome production losses, a margin of safety is
indicated. Units utilized in order equations were transformed to supplies once the order is made
by the producer to the supplier. The order amount thus shows the material units demanded and
located on the site of the following partner. Large inventory volume is one of key obvious issue
while partner estimate its maximum level. Industrial zones used to keep large size of inventory to
overcome the delay in delivery and suppliers’ dependence. Therefore, it is obvious that players
hold much more quantity rather than needed as discussed in Table 1 - Procurement & inventory
Activities.
Placed = MAXIMUM (0, SMOOTH (ordered 1, TIME of SMOOTH) + A * (10000 - (Inventory
of Finished Textile - Textile Backlog) – B * Supply Line 2)) ..................(3)
Supplies are being ordered to replenish inventory buffer. Most of industrial sector of
developing countries under exploration ignore the delay in material which may happen at
delivery (Khalifa et al., 2008). From decision maker perspective’s, a large buffer of safety can
overcome any delay as deliberated in Table 1 - Procurement & Inventory replenishment issues.
For the sample case study used, the delivery of materials may differ from (7 - 14 days)
one week to two. It relies on the stock available in the warehouse of the vendor. Supply
movements are shown quantitatively as the flow linking the 2 stocks, a stock of semi-finished at
every single supplier location and a stock of raw material at the customer location. The rate of
supply is denoted by MATERIAL DELAY, that keeps the material back in time when the time
of delay varies. It is a discreet function of delay that is having the characteristic of conserving the
quantity (Vensim documentation, n.d.).
Supplies = DELAY MATERIAL (ordered 2, Procurement Time, 10, 0) …. (4)
The delivery duration affects the supply rate. Durations of delivery were tested and they
were uniformly distributed at random.
Time of Procurement= RANDOM UNIFORM (1, 2, 0.05) …… (5)
The new design of beer game imposes raw material stock in each production cycle
because of its significance. Furthermore, the process of production is a conversion of raw
materials; therefore, the stock of raw material must be existent in order to articulate the process

Academy of Strategic Management Journal Volume 20, Issue 6, 2021
8 1939-6104-20-6-884
Citation Information: Khalifa, N., Elghany, M.A., & Elghany, M.A. (2021). Information flow simulation in supply chain process
for developing countries. Academy of Strategic Management Journal, 20(6), 1-19.
of production. Since the process of production embodies a conversion from the stock of raw
material to the stock of final product, the process of manufacturing is demonstrated by the flow
linking the 2 stocks (inventory of final products and inventory of raw material) at every stage of
manufacturing. Production entry is identified by the variance between the demand (backlog in
total/unmet orders and orders of customers with the margin of safety) and the obtainable
quantity of inventory (orders delivered and obtainable quantity of inventory). An IF THEN
ELSE statement is utilised to make this comparison.
Production in 2= IF ELSE THEN (Inventory of Finished Textile < (order 1 + Backlog of Textile
+ (order 1 * level of safety level)), ((order 1 + Backlog of Textile + (order 1 * level of safety)) –
Inventory of Finished Textile)\ *0.001, 0) …. (6)
Most of equations used to indicate production cycle specifies unit transformation to final
or semi-final products. The time of production is not presumed to be permanent stationary one as
in the traditional game. Time estimated in the proposed beer game depends on production
capacity of each producer and considers limited labour skills. Consequently, a long operation has
a negative effect on the cost and led to deficiency of production that had been discussed in Table
1.
Time of Production = Size of Production/Capacity of Production …. (7)
Furthermore, the size of production is decremented with the loss of material during the cycle of
production at both levels.
Production size= (Prod in - Production Loss) / 0.001 …. (8)
Concerning the manufacturing, a DELAY FIXED is used to denote the time interval of
production at each stage.
Prod = DELAY FIXED (SMOOTH (Size of Production, Adjusted Time to Production),
(Production in / Capacity of Production), SMOOTH (Size of Production, Adjusted Time to
Production))…. (9)
The needed time for machinery adjustment and production is taken into consideration in
the production equation. The function SMOOTH is applied to demonstrate that the production of
the factory is deferred from the one anticipated with a time of adjustment, which is hindered by
the limitation of labour skills. Mostly, the margin of safety is generated additionally to the
ordered quantity to prevent the misuse of material during the production (Khalifa et al., 2008).
The units of raw material are converted into the units of semi- product/finished product units for
the representation of the transformation and production process. The finished product delivery in
downstream is denoted with a one week delay DELAY FIXED function according to the sample
case study.
Inflow = DELAY FIXED (sold 0, 1, 200) …. (10)
Equations used for incoming flow and the accumulation of the supply line accumulation
mimic the traditional beer game.
Supply_Flow = placed -in …. (11)
The same is applied to the backlog stock of the partner (unmet order accumulation) and
its incoming flow (Figure 2).
Academy of Strategic Management Journal Volume 20, Issue 6, 2021
9 1939-6104-20-6-884
Citation Information: Khalifa, N., Elghany, M.A., & Elghany, M.A. (2021). Information flow simulation in supply chain process
for developing countries. Academy of Strategic Management Journal, 20(6), 1-19.
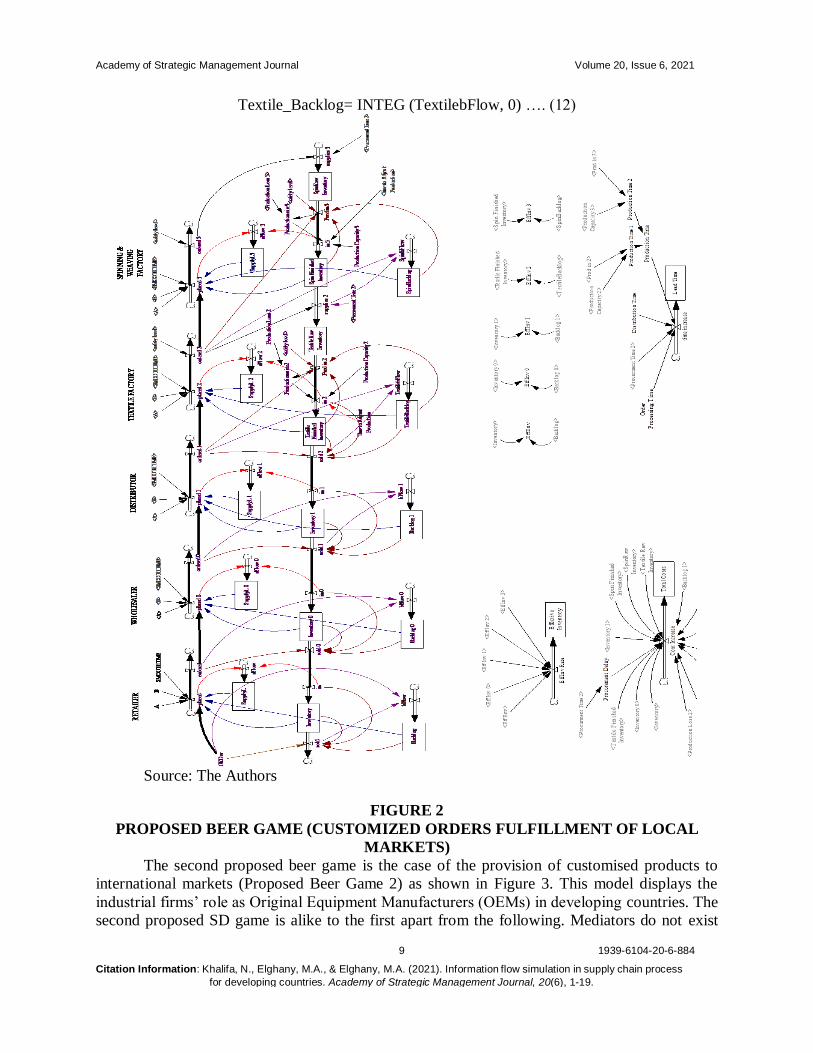
Textile_Backlog= INTEG (TextilebFlow, 0) …. (12)
Source: The Authors
FIGURE 2
PROPOSED BEER GAME (CUSTOMIZED ORDERS FULFILLMENT OF LOCAL
MARKETS)
The second proposed beer game is the case of the provision of customised products to
international markets (Proposed Beer Game 2) as shown in Figure 3. This model displays the
industrial firms’ role as Original Equipment Manufacturers (OEMs) in developing countries. The
second proposed SD game is alike to the first apart from the following. Mediators do not exist

Academy of Strategic Management Journal Volume 20, Issue 6, 2021
10 1939-6104-20-6-884
Citation Information: Khalifa, N., Elghany, M.A., & Elghany, M.A. (2021). Information flow simulation in supply chain process
for developing countries. Academy of Strategic Management Journal, 20(6), 1-19.
between producers and international retailers; in this case, direct marketing is used to access
international markets. As a result, wholesalers and distributors are excluded from the SD game.
The game makes a simulation to the producers’ role in meeting an international retailer’s
demands, irrespective of the retailer’s role.
For the simulated case, the order of the retailer is distributed normally so that the
RANDOM NORMAL function is deployed.
ORDER of Retailer = RANDOM NORMAL (5718, 272878, 100017, 75667, 0) …. (13)
The producer takes more time in estimating the production’s feasibility of such order in
accordance to the availability of resources. The delay in the retailer order’s receipt and its
placement to production units is estimated with five weeks. A planning phase would take place
to estimate the feasibility of producing customized product insight of supplies required ,
machinery available, quality constrains pre-defined and cost estimated linked to the cycle of
production. The producer locates an order in regards to the factory pre-stating certain constraints
for the production cycle.
Placement 3= MAXIMUM (0, SMOOTH (order 2, TIME of SMOOTH) + A * (10 - (Spin
Inventory Finished – Backlog of Spin) – B * Supply Line3)) .….(14)
Because of the quality constraints pre-defined and imposed by the international retailers
and the issue that alot of supplies come from importing, producers are being faced with long
delivery time.
Time of Procurement= RANDOM UNIFORM (1, 8, 2) ….(15)
The factory supplies the manufacturers with materials semi-finished. Delivery of
procurement is amongst one to two weeks depending on the stock available and the delays in
production of the simulated case.
Time of Procurement 2= RANDOM UNIFORM (1, 2, 0.5) …(16)
The producer fabricates the requested order and stores it for delivery. Delivery duration is
subjective to chosen method for overseas shipment. For our case, it is estimated to be 1- 8 weeks
based on final destination.
Sold= DELAY MATERIAL (ORDER of Retailer, Time of Delivery, 500, 0) …(17)
The production cycle of each producer is represented as follows:
Production in 3= IF ELSE THEN (Spin Inventory Finished < (ordered 2 + Spin Backlog +
(order 2 * Level of Safety)), ((order 2 + Spin Backlog + (order 2 * Level of Safety)) - Spin
Inventory Finished), 0) …(18)
in 3= DELAY FIXED (SMOOTH (Size of Production 3, Adjusted Time to Production),
(Production in 3/ Capacity of Production 3), SMOOTH (Production Size 3, Adjusted Time to
Production))..(19)
For Supply line and backlog equations, equations are illustrated as follows:
Supply L 2= INTEG (sFlow2, 200) …(20) sFlow3= placed 3 -in 3 ….(21)
From the above discussion of the proposed design, it is obvious that the individual
decision-making patterns are practised by every partner for ordering and replenishment
(pattern Ad-hoc). Strategies and decisions trailed for replacement and size of inventory
sometimes signify conflicting objectives and this emphasize more on the non-existence of the
Academy of Strategic Management Journal Volume 20, Issue 6, 2021
11 1939-6104-20-6-884
Citation Information: Khalifa, N., Elghany, M.A., & Elghany, M.A. (2021). Information flow simulation in supply chain process
for developing countries. Academy of Strategic Management Journal, 20(6), 1-19.
pre-defined design of the supply chain and the integrated platform of the supply chain that was
discussed in Table 1. Manual techniques are being used for passing orders to next partner, which
cause more order delay- Table 1 - Technological aspects. Limited automation technique and IT
capabilities are being used which contribute positively to order delay. Lack of information
visibility along the chain led to decentralized pattern of decision making for forecasting,
procurement and inventory replenishment. Most of these aspects, which have been listed in
Table 1, are considered in the proposed Beer Game design to reflect current deficiencies of
supply chain activities.
To conclude, the proposed Beer Game contribution takes into account:
1. Constraint on production capacity at the level of production;
2. Loss of material along the processes of production;
3. Two inventories (raw material & final product stocks) at every level of manufacturing;
4. Delays in the delivery of procurement at production level;
5. The time needed to adjust for the production of customised products;
6. Margin of safety for input production to prevent loss of material;
7. Sales opportunities that are lost and triggered by the delay in material and consequently delay in
production;
8. Conversion of unit from final product to raw material.
The proposed SD game includes added factors of supply chain to indicate a customised
approach. The adapted SD game reflected more measurements of performance other than the
traditional one did as below:
Total Cost of Supply Chain
A measure of cost was applied by Sterman's game in order to designate the performance
of the supply chain. The main goal of the classic beer game is to reduce the costs of the supply
chain while preserving a reasonable inventory that enables incoming orders to be fulfilled. The
proposed beer game includes a cost measure as well but with different type of measurement. The
total cost comprises inventories holding costs (inventories of final products and raw material),
cost of stock-out; loss of material cost and opportunities lost for sales, which are assessed in the
modified SD game on the basis of postponement in procurement. Any material delay after
estimated duration of delivery for local supplies and outsourced one would be considered in the
estimation of cost as sales opportunity that was lost. Therefore, IF THEN ELSE equation is used
to check if the delivery time exceeds estimated values. The cost of holding is thought of to be
equal to half the stock-out’s cost as presumed in the model of Sterman (Kirkwood, 2016;
Sterman, 1989).
Effective Inventory
It denotes the most inventories obtainable for each partner. These are the variances
between the backlog (accumulated unmet orders) and the amount of inventory at every level of
supply chain. Effective inventory measure is deployed for the control of the responsiveness level
to the orders of customers. Effective inventory is measured at each supply chain stage and
accumulative effective inventory along the chain is specified as another measure for the
performance of the supply chain.

Academy of Strategic Management Journal Volume 20, Issue 6, 2021
12 1939-6104-20-6-884
Citation Information: Khalifa, N., Elghany, M.A., & Elghany, M.A. (2021). Information flow simulation in supply chain process
for developing countries. Academy of Strategic Management Journal, 20(6), 1-19.
Source: The Authors
FIGURE 3
PROPOSED BEER GAME 2 MEETING THE TAILORED ORDERS OF
INTERNATIONAL MARKETS

Academy of Strategic Management Journal Volume 20, Issue 6, 2021
13 1939-6104-20-6-884
Citation Information: Khalifa, N., Elghany, M.A., & Elghany, M.A. (2021). Information flow simulation in supply chain process
for developing countries. Academy of Strategic Management Journal, 20(6), 1-19.
Time of Lead
The time of lead of Order-to-Delivery is the elapsed time between the order placed by the
customer and its delivery. It contains supplier’s time of lead, producer’s time of lead, distributor
time of lead, and managed order time of lead. The time of lead is used as an indicator of
performance in the modified beer games because of its effect on the supply chain performance.
The time of lead is a crucial aspect in make-to-order supply chains. The time of lead is
interrelated with the levels of inventory, customers’ service, and costs. The decline in time of
lead will boost a decision-maker to maintain a slight buffer whereas the enterprise is capable of
meeting a wide range of customers’ requirements (Hwarng & Xie, 2006). This shall result in the
improvement of the order responsiveness that is obligatory in the adoption of the customisation
of mass. Time of lead is utilised to predict the needed time for the receipt of an order allocated
by the retailer.
Simulation System Dynamic Game Outcomes
Simulation remained for thirty six weeks, which is the exact time interval applied in
Sterman’s game. The outcome verifies that the order of the customer/retailer is being augmented
while going forward along the supply chain.
Source: The Authors
FIGURE 4
ORDER PATTERN
Figure 4 shows the output of the experiments. This demand pattern’s augmentation is
clear especially in the experiment of the first proposed beer game. The reason behind that is the
effect of bullwhip that makes demand signals’ distortion when passing across the chain causing

Academy of Strategic Management Journal Volume 20, Issue 6, 2021
14 1939-6104-20-6-884
Citation Information: Khalifa, N., Elghany, M.A., & Elghany, M.A. (2021). Information flow simulation in supply chain process
for developing countries. Academy of Strategic Management Journal, 20(6), 1-19.
such augmentations. Many studies have referred back the effect of bullwhip to the lack of
information visibility and the long lead times through the supply chain (Größler, 2020; Hwarng
& Xie, 2008). Orders allocated by the producers to the vendors showed the same increased
pattern. The cause for this is the conversion of order units into supplies demanded from the
vendor to control the cycle of production.
In accordance to measures of expenditure, the chain total cost increases exponentially
over the course of 36 weeks in both experiments. The outcome of the experiment of the Proposed
Beer Game 1 was demonstrated in Figures 5 & 6.
Source: The Authors
FIGURE 5
COST MEASURE IN PROPOSED BEER GAME 1

Academy of Strategic Management Journal Volume 20, Issue 6, 2021
15 1939-6104-20-6-884
Citation Information: Khalifa, N., Elghany, M.A., & Elghany, M.A. (2021). Information flow simulation in supply chain process
for developing countries. Academy of Strategic Management Journal, 20(6), 1-19.
It indicates that the cost rate increases rapidly till week 9, the increase in the rate is
justified by the clear fall in operational inventory along the chain. The effective fall in
inventories refers to the big backlog of inventories of textiles and raw materials throughout the
same time interval, intertwined with a high loss in production. By the seventeenth week, the
rate of cost will steadily decline, accompanied with a small rise by week thirty two. The pattern
above is coupled concurrently with operational reduction in inventory. The cause for this is due
to backlog of textile and rates of loss in production occur at lowest levels and indicate an
increase in the simulation over the latest number of weeks. In addition to the textile inventory,
buffer of raw material at every level of production is sufficient to meet the needs of the partner
until week 32, when they demonstrate a further fall.
Source: The Authors
FIGURE 6
EFFECTIVE INVENTORY MEASURE IN PROPOSED BEER GAME 1

Academy of Strategic Management Journal Volume 20, Issue 6, 2021
16 1939-6104-20-6-884
Citation Information: Khalifa, N., Elghany, M.A., & Elghany, M.A. (2021). Information flow simulation in supply chain process
for developing countries. Academy of Strategic Management Journal, 20(6), 1-19.
Source: The Authors
FIGURE 7
COST MEASURE IN PROPOSED BEER GAME 2
For the experiment of the second Proposed Beer Game 2, Figures 7 & 8, exhibit the
system behavior and the performance measure. The cost measure oscillates over the time of the
experiment. The above pattern is in conjunction with a changeable rate of operational inventory
over the course of the investigation. Oscillations in inventories of textile and backlogs of fabrics
textile represent the principal reason of fluctuating production losses and varying delays of

Academy of Strategic Management Journal Volume 20, Issue 6, 2021
17 1939-6104-20-6-884
Citation Information: Khalifa, N., Elghany, M.A., & Elghany, M.A. (2021). Information flow simulation in supply chain process
for developing countries. Academy of Strategic Management Journal, 20(6), 1-19.
delivery for local and overseas supplies. Delays for supplies outsourced might be up to 4 weeks,
while restricted to local supplies.
Source: The Authors
FIGURE 8
EFFECTIVE INVENTORY MEASURE IN PROPOSED BEER GAME 2

Academy of Strategic Management Journal Volume 20, Issue 6, 2021
18 1939-6104-20-6-884
Citation Information: Khalifa, N., Elghany, M.A., & Elghany, M.A. (2021). Information flow simulation in supply chain process for
developing countries. Academy of Strategic Management Journal, 20(6), 1-18.
CONCLUSION
The study results constitute with a generic design of a SD game which considers the
deficiencies of supply chain in developing countries. Re-designing process of beer game was
based on a cross-industry field study and did not rely on simple assumption that could not imitate
the real situation of OEM industrial firms. The proposed design of beer game overcomes
constrains assumed by Sterman’s design and represent real difficulties face supply chain
activities. Since there exist a number of factors influencing the performance of the supply chain
leading to non-linearity in the system, the new design of proposed beer game consider most of
these factors that are linked to the external environment for instance delivery issues and country
infrastructure which cannot be considered as controlled factors by industrial zones in developing
countries, other factor related have been considered in the proposed beer game design such as:
limited production capabilities, labour skills, material loss during production cycle, machinery
adjustment time to produce customized products and order safety margin to avoid material loss.
Proposed Beer Game considers as well the unit conversion from finished products to raw
materials in ordering and stocking equations. For measuring supply chain performance, cost
cannot be the only measure to rely on, a combination of lead time, effective inventory and cost
measures are being adapted in the proposed beer game to indicate a comprehensive performance
measurement. The design of Proposed Beer Game presents a generic one which can be used in
simulating any industrial sector in developing countries. Running a simulation model driven
from real dataset will impose more realistic simulation experiments in order to propose
appropriate solutions.
REFERENCES
Abt, C.C. (1970). Serious games. New York: Viking.
Andersen, D.F., Chung, I.J., Richardson, G.P., & Stewart, T.R. (1990). Issues in designing interactive games based
on system dynamics models. In Proceedings of the 1990 International System Dynamics Conference (Vol.
1, pp. 31-45). Chestnut Hill.
Anderson, J.C., Håkansson, H., & Johanson, J. (1994). Dyadic business relationships within a business network context. Journal of Marketing, 58(4), 1-15.
Beamon, B.M. (1998). Supply chain design and analysis:: Models and methods. International Journal of
Production Economics, 55(3), 281-294.
Crooltall, D., Oxford, R., & Saunders, D. (1987). Towards a reconceptualization of simulation: From representation
to reality. Simulation/Games for learning, 17(4), 147-71.
D’Atri, A., & Motro, A. (2009). Virtual enterprise transactions: a cost model. In Information systems: People,
organizations, institutions, and technologies (pp. 165-174). Physica-Verlag HD.
EgyTex. (2009). Official portal of Egyptian textile industry, “Egyptian Cotton Dilemma Still Unresolved”.
Retrieved from http://www.egytex.com/researches/industryreports
Ellington, H., Addinall, E., & Percival, F. (1982). A handbook of game design. Kogan Page.
Forrester, J.W. (2005). System dynamics and the lessons of 35 years-a chapter for the systemic basis of policy making in the 1990s-Massachusetts Institute of Technology–Abr. 1991.
Forrester, J.W. (2009). System dynamics: The classroom experience: Quotations from K-12 teachers.
Unpublished manuscript, Massachusetts Institute of Technology (MIT), Cambridge, MA.
Größler, A. (2020). System dynamics and operations management. System Dynamics: Theory and Applications,
273-284.
Hwarng, H.B., & Xie, N. (2008). Understanding supply chain dynamics: A chaos perspective. European Journal of
Operational Research, 184(3), 1163-1178.
Joshi, Y.V. (2000). Information visibility and its effect on supply chain dynamics. Unpublished doctoral dissertation,
Massachusetts Institute of Technology.

Academy of Strategic Management Journal Volume 20, Issue 6, 2021
19 1939-6104-20-6-884
Citation Information: Khalifa, N., Elghany, M.A., & Elghany, M.A. (2021). Information flow simulation in supply chain process for
developing countries. Academy of Strategic Management Journal, 20(6), 1-18.
Khalifa N., White A., & El Sayed A. (2009). Supply chain difficulties facing Egyptian fabrics reaching global
markets: A beer game simulation. The third International Conference on Operations and Supply Chain
Management, Wuhan.
Khalifa, N., White, A., & EI Sayed A., (2008). Supply chain challenges in developing countries: Cross industry case
studies, cybernetic intelligent systems. Proceedings of 7th IEEE International Conference- Pages: 145-152,
Middlesx-UK. Kimbrough, S.O., Wu, D.J., & Zhong, F. (2002). Computers play the beer game: can artificial agents manage
supply chains?. Decision Support Systems, 33(3), 323-333.
Kirkwood, C.W. (1998). Business process analysis workshops: System Dynamics Models. Chapter 4: The Beer
Game. Arizona State University.
Klabbers, J.H. (2003). The gaming landscape: A taxonomy for classifying games and simulations. In DIGRA
conference (pp. 4-6).
Kopainsky, B., & Sawicka, A. (2011). Simulator‐supported descriptions of complex dynamic problems:
experimental results on task performance and system understanding. System Dynamics Review, 27(2), 142-
172.
Lajili, K., & Mahoney, J.T. (2006). Revisiting agency and transaction costs theory predictions on vertical financial
ownership and contracting: Electronic integration as an organizational form choice. Managerial
and Decision Economics, 27(7), 573-586. Lee, H.L., Padmanabhan, V., & Whang, S. (1997). The bullwhip effect in supply chains. Sloan management review,
38, 93-102.
Maier, F.H., & Größler, A. (2000). What are we talking about?-A taxonomy of computer simulations to support
learning. System Dynamics Review: The Journal of the System Dynamics Society, 16(2), 135- 148.
Martinez, M.T., Fouletier, P., Park, K.H., & Favrel, J. (2001). Virtual enterprise–organisation, evolution and control.
International Journal of Production Economics, 74(1-3), 225-238.
Ming, D. (2001). Performance analysis and configuration simulation in integrated supply chain network design.
Mohaghegh, M., & Größler, A. (2020). The dynamics of operational problem-solving: A dual-process approach.
Systemic Practice and Action Research, 33(1), 27-54.
Perera, H.N., Fahimnia, B., & Tokar, T. (2020). Inventory and ordering decisions: a systematic review on research
driven through behavioral experiments. International Journal of Operations & Production Management. Sterman, J.D. (1989). Modeling managerial behavior: Misperceptions of feedback in a dynamic decision making
experiment. Management science, 35(3), 321-339.
Vensim Documentation. (n.d.). Retrieved from http://www.vensim.com/documentation/
Williamson, O.E. (1981). The economics of organization: The transaction cost approach. American Journal of
Sociology, 87(3), 548-577.
Yang, F., Huang, J., Feng, X., & Yang, M.M. (2020). Decision-making in a dynamic task: Effects of goal
orientation on stocks and flows performance. Chinese Management Studies, 14, 695-713.