information arcology and data explorations: scientific content for multiple learning styles and...
TRANSCRIPT
Information Arcology and Data Explorations: Scientific Content for Multiple Learning Stylesand EnvironmentsAuthor(s): Ted Habermann, Nancy Burton and Kevin FrenderSource: Journal of Science Education and Technology, Vol. 7, No. 3 (Sep., 1998), pp. 235-247Published by: SpringerStable URL: http://www.jstor.org/stable/40186467 .
Accessed: 12/06/2014 21:14
Your use of the JSTOR archive indicates your acceptance of the Terms & Conditions of Use, available at .http://www.jstor.org/page/info/about/policies/terms.jsp
.JSTOR is a not-for-profit service that helps scholars, researchers, and students discover, use, and build upon a wide range ofcontent in a trusted digital archive. We use information technology and tools to increase productivity and facilitate new formsof scholarship. For more information about JSTOR, please contact [email protected].
.
Springer is collaborating with JSTOR to digitize, preserve and extend access to Journal of Science Educationand Technology.
http://www.jstor.org
This content downloaded from 195.78.108.199 on Thu, 12 Jun 2014 21:14:44 PMAll use subject to JSTOR Terms and Conditions

Journal of Science Education and Technology, Vol 7, No. 3, 1998
Information Arcology and Data Explorations: Scientific Content for Multiple Learning Styles and Environments
Tted Habermann,1 Nancy Burton,2 and Kevin Render3
The World Wide Web presents unprecedented challenges for educators and information providers. Educators are faced with an unprecedented amount of information and data providers are faced with unprecedented diversity of audience. In order to address these chal- lenges, we must develop dynamic systems for structuring data to create information and for allowing users to incorporate that information into their own knowledge base. These systems must combine the classic discipline of Information Architecture with organic and interactive users, fusing Information Architecture and Interactive Systems to form a new discipline termed Information Arcology. We describe such a system built on a simple yet powerful content model that includes groups of pictures and descriptions. We then describe a number of presentations that can be derived from that model. These presentations can be used to support a wide variety of learning styles and environments. Functional examples are pre- sented along with insights gained from using those examples in a Montessori classroom.
KEY WORDS: World Wide Web; education; science data; information architecture.
INTRODUCTION
The World Wide Web provides an unprece- dented environment for interactions between scien- tists and the general public. The environment is
unique both in the amount of content which is avail- able to the public, and in the diversity of the audi- ence which is available to the scientists. These
aspects of the World Wide Web provide challenges to data users and to data providers. The Web pro- vides incredible potential for addressing these chal-
lenges in innovative ways.
THERE IS SO MUCH AND THERE ARE SO MANY
Many authors have addressed the explosion of information which has occurred over the last decade (Wurman, 1990). The intensity of this explosion has increased dramatically since the emergence of the World Wide Web several years ago. The number of
pages on the Web may actually reach a billion by the
year 2000 (Kelly and Wolf, 1997). This explosion has caused considerable problems for educators trying to use information from the Web in their classrooms. There is so much!
The data providers see the other side of this coin.
During 1993, the last year before the Web, NOAAs National Geophysical Data Center had roughly 25,000 user interactions, mostly phone calls and let- ters. We launched our web site (www.ngdc.noaa.gov) during late December, 1993. During 1996 we had over 500,000 unique hosts access that site. This twenty fold increase in the number of contacts with the public has been accompanied by a concurrent increase in the di-
versity of the user community. It has expanded from
'NOAA National Geophysical Data Center (E/GC1), 325 Broad-
way, Boulder, Colorado 80303. e-mail:[email protected] Cooperative Institute for Research in Environmental Sciences, University of Colorado, Boulder, Colorado, and The Dwight School, New York, New York.
JCooperative Institute for Research in Environmental Sciences,
University of Colorado, Boulder, Colorado.
235
1059-0145/9809004235$ 15.00A) O 1998 Plenum Publishing Corporation
This content downloaded from 195.78.108.199 on Thu, 12 Jun 2014 21:14:44 PMAll use subject to JSTOR Terms and Conditions

236
a small and relatively sophisticated subset of the sci- entific community to include school children all over the world, teachers at all levels, and people from all walks of life. There are so many\
Before the Web, scientific data providers could satisfy their user's needs by providing files full of numbers and other essentially unstructured informa- tion, what we term "data" in the discussion below. That is no longer enough. Data providers and scien- tists involved in the educational process must convert that data into information in order to satisfy the needs of the new, larger user community. Data providers are caught in the squeeze of facing this un- precedented opportunity to reach this broad audi- ence in times of fewer resources. How can this be done?
The Web is an important medium for bridging the gap between content and users. It is a new me- dium for both groups and presents a number of chal- lenges. This paper has three sections. First we explore some implications of the Web from the point of view of information providers and educators. We then present a simple content model and explore a wide variety of presentation formats that that model supports. This section is somewhat technical and de- tailed in order to be complete. Readers more inter- ested in applications of these presentations in a real-world classroom may find the last two sections more relevant. There, we discuss real-world applica- tions and consider possible inputs from scientists, teachers, and students and interactions that may re- sult from those inputs.
INFORMATION ARCOLOGY
The "Continuum of Understanding" (Shedroff, 1994) presents a helpful framework in which to un- derstand educational challenges and potential solu- tions to them. Shedroff explains his view of this continuum in terms of four stages: Data, Informa- tion, Knowledge, and Wisdom. We define his nomen- clature here as it is what we use in this paper. Data is the massive content which the scientific community needs to share with themselves and with the public. The problem of converting those data to information is generally approached by adding structure. In the past, this structure has primarily taken the form of articles and reports. The diversity of the audience for that content was addressed using a range of forums for these items, from popular magazines such as Dis-
Habennann, Burton, and Frender
cover or Earth, through Scientific American, to very esoteric scientific journals focused on narrow special- ties. In the educational Web environment, the diver- sity of the audience expands to include children of all ages and all over the world. How can we use the Web to help us convert data to information for this incredibly broad audience?
The step from information to knowledge differs fundamentally from the data to information step be- cause it requires personal experience: knowledge is personal. In the cases we are interested in here, the necessary experience involves manipulation of infor- mation. Reorganizing data through manipulation forms new information which is more coherent or relevant to the knowledge being created by the indi- vidual. Shedroff expresses this point quite well:
It is precisely the ability to see the same set of things in different organizations that allows people to un- cover the patterns in the relationships between these things. If possible people should be able to rear- range the organizations themselves or be provided with different arrangements so they can begin to un- derstand these patterns for themselves.
This manipulation of information to create per- sonal knowledge is the excitement which keeps scien- tists interested and motivated. This process of making meaning is the real science that we are hop- ing to transfer from those scientists to the general audience. It is not some collection of facts or proc- esses or procedures. In addition to enabling teachers and students to experience the magic of discovering knowledge, we must make it possible for them to cre- ate it and to share it with others. The process of shar- ing not only clarifies their understanding, but may make it possible for others to follow the same path from information to knowledge.
The interactive environment of the Web is ide- ally suited to this goal. The tools we describe extend this interactivity beyond the capability of selecting one's own path through content to include the capa- bility of creating a path for others to follow. We also envision having the capability of placing signposts along the way to help others understand the motiva- tion for the path. The importance of "Co-creativity" in the educational process is well understood by teachers everywhere and is expressed well by She- droff (1994):
Co-creative (a term coined by Abbe Don) technolo-
gies are those that offer assistance in the creation
process. People are naturally creative and are almost
always more interested in experiences that allow
This content downloaded from 195.78.108.199 on Thu, 12 Jun 2014 21:14:44 PMAll use subject to JSTOR Terms and Conditions

Science Content for Different Learning Styles and Environments 237
them to create instead of merely participate. While
many situations can create anxiety if people are not accustomed to performing with the tools or tech-
niques, if this anxiety can be lessened, through the careful design of the experience or offered assis- tance, people express their creativity. This could take the form of recommendations, guidelines, advice, or
actually performing operations for users.
Another attribute of these experiences is the capa- bility of adding content or tools to a predefined set, resulting in a "living" product, toolset, or database. Few products are designed to grow or become more valuable over time with participation from the audi- ence. Yet, products that help users structure their
experiences and share their knowledge can only be- come more valuable than those which do not.
The process of structuring data into information has been extensively discussed by numerous authors. Wurman coined the term "Information Architecture" during 1977 to describe this process. He brought im- portant concepts from architecture to information and has made many insights possible (Wurman, 1996). Paulo Soleri (1977) is another visionary architect who created the concept of arcology as a merger of archi- tecture (structure) and ecology (living systems). The parallels between cities or arcologies (the word can also be used as a noun to describe a structure) as en- visioned by Soleri and information systems that are required to support interactive education are broad and striking. The "urban sprawl" that Soleri addresses is not different from the information sprawl we expe- rience on the World Wide Web. Shedroff describes co-creative environments as "living" products, making a connection between creativity and life. Morris and Herndon (1997) define arcology as:
The word arcology describes an evolution in inter-
action, a condensation of opportunity, a way of pro- viding better access so individuals can have a more actualized life. The implementation of this solution can be varied, and no one implementation meets
everyone's needs.
This definition involves "interaction", "access", and "individuality", the same terms we have discussed above in the context of information and education. The concepts of information architecture and co- creativity can clearly be blended to form a more pow- erful concept of "information arcology". The difference between "information architecture" and "information arcology" is similar to the difference between a book and a hypertext document or be- tween a traditional museum and the Exploratorium. In the context of the Continuum of Understanding,
Information Architecture converts data to informa- tion. Information Arcology covers a broader span by converting data to knowledge through interactive and creative experiences.
DATA LITERACY
The World Wide Web brings teachers and stu- dents a vast amount of material to explore, but in a variety of unfamiliar formats. Most students haven't encountered these raw data before, they don't un- derstand how to "read" them. They need to master the process of converting numbers to understanding like they master the process of converting the alpha- bet into words and then into understanding. Teachers and students have had daily rehearsals with interpret- ing text, but tables of measurements, graphs, and photographs are often very unclear. The educational process has focused on one kind of literacy, making meaning with words. Students and teachers are less certain what they are seeing when they look at a graph. How do they distinguish between errors and anomalies, between noise and trends?. We term the skill of understanding data and of making these dis- tinctions "data literacy".
McClintock (1994) at Columbia University's In- stitute for learning Technology foresees that:
The new technologies (will have) greatly extended the power of multiple representation in the culture, and multiple representation (will have) had its most
significant effect, not only on how people (have) re- ceived ideas, but on how they found them, activated them, and then apprehended them. Pictures, icons, sounds, and gestures (will come) to rival written ex-
pressions as means of accessing ideas. With that
change, the resources routinely usable in the curricu- lum (will have) blossomed- pictures, films, perform- ances, recitations, diagrams, graphs, animations, simulations, maps (will lose) their merely "illustra- tive*1 character. People (will have begun) to make
arguments with them, to explain things through them, discovering how to give images apodictic, dec-
larative, prepositional power.
The idea that visuals are not "illustrative" but "substantive" has significant implications for instruc- tion. The technology we describe in this paper inte- grates presentation of data, graphs, and photographs with descriptive text in several ways. Students can re- view and organize the data using different presenta- tions and quiz themselves, developing an error matrix during the quiz that illustrates specific points of con-
This content downloaded from 195.78.108.199 on Thu, 12 Jun 2014 21:14:44 PMAll use subject to JSTOR Terms and Conditions
238 Habermann, Burton, and Frender
fusion. They are able to create their own descriptions and analyses of the material, as well as question an expert about the meaning of what the expert has written or about the student's own personal interpre- tation of the material. This sequence supports the student's rehearsal with data in order to understand it as information and then transform it to knowledge. It is a sequence that develops data literacy.
CONTENT AND PRESENTATION
The approach we describe here makes a clear distinction between content and presentation. Content is the actual data included in the system. Presenta- tion describes the specific arrangement of content into information. Presentations are structures which are used to organize the content.
In this section we describe a very general model of content and a number of presentations which can be created from that content. A unique and impor- tant aspect of the technology we describe here is that the number of presentations is maximized while the
amount of content is minimized. The simplicity of the content model is an important feature which allows this important goal to be achieved.
The Content Model
Pictures and Descriptions. The fundamental content which we are interested in exploring is made up of pictures and descriptions. This combi- nation is used throughout the scientific and educa- tional communities and provides a foundation for a wide variety of educational experiences in every discipline.
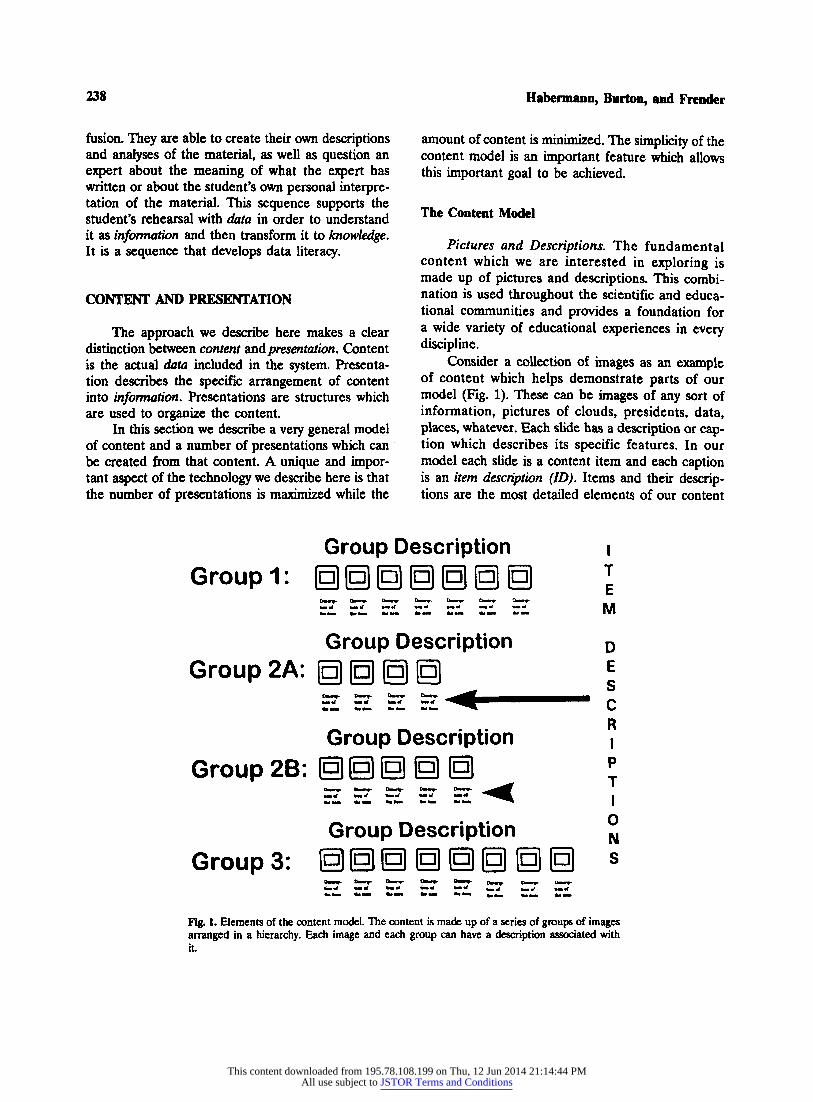
Consider a collection of images as an example of content which helps demonstrate parts of our model (Fig. 1). These can be images of any sort of information, pictures of clouds, presidents, data, places, whatever. Each slide has a description or cap- tion which describes its specific features. In our model each slide is a content item and each caption is an item description (ID). Items and their descrip- tions are the most detailed elements of our content
Fig. 1. Elements of the content model. The content is made up of a series of groups of images arranged in a hierarchy. Each image and each group can have a description associated with it.
oroup uescnpuon i
Broupi: (gKglSSSSB JE to«V- Dmtt P"«* Dm** Dm * Dm*- Dm*-
Group Description D Broup 2A: ()()()() E
^ S Dm*- Dm*- Dm*- Dm*- ^^^^^_^^__^____--
__- - M«f •- w karf m«t ^^^^^^m^»^m^mm^»^mm ^ **M, «MM. *«> ftMM, ^"4 \a
Group Description ,
Sroup 2B: (g) (g) (g) (g) g p
^Tm. «T«a «Mta. »>•- •-•- ^^^^ |
Group Description \ 3roup3: @@@@@(g)(g)(g) £
Dm*- Dm*- Dm*- Om*- Dm*- Omm^ q.^. o.^. Maf mW ft««f M«W feA«f ^^«/ ^_-s ,
This content downloaded from 195.78.108.199 on Thu, 12 Jun 2014 21:14:44 PMAll use subject to JSTOR Terms and Conditions

Science Content for Different Learning Styles and Environments 239
model. They are generally considered to be indivis- ible.
Hierarchies. Most content collections can be or- ganized into lists or hierarchies, which are important elements of our content model. The images in Fig. 1 are sorted into three groups. Group 2 includes two subgroups (A and B). We describe these hierarchies as views of, or paths through the content that are created to help users understand some aspect of the content. The groups could be types of clouds, presi- dents with and without beards, different types of data, or places on different continents. The groups could also be different tasks to be accomplished by students with each image describing a step to be fol- lowed.
There are many hierarchies possible for any col- lection of content. These hierarchies help users class- ify and understand the relationships in the content. The content collection shown in Fig. 1 can be sorted into many different hierarchies. Subject hierarchies lead to organizations which might be used to learn about a particular subject. Time hierarchies can be used to create time series which relate the images to other historical events. Spatial hierarchies can be used to create sets of content related to a particular region.
Descriptions at Multiple Levels. Descriptions can exist at any level in this content model. There are descriptions of groups in the hierarchies, Group De- scriptions (GD), as well as descriptions of particular items in the hierarchy. The group descriptions list characteristics which all members of the group share. They help users understand the rationale for the clas- sification.
PRESENTATIONS
Now that we understand the content that we are dealing with, we can consider different presentations. It is important that we consider the full range of presentations that are required in the classroom and the full range of technologies that are available in classrooms. We represent that range using three tech- nology levels. The characteristics of those levels are listed in Thble I. All of these presentations involve display of a series of "pages." This metaphor crosses all technological levels we are considering. At the no technology end, the pages are printed on paper. In the low and high tech instances, the pages are com- puter screens presented locally or over a network.
Figs. 2-5 present schematic samples of the series of pages which make up each presentation.
Descriptions in the Presentations. All of the pres- entations described below allow selection of the de- scriptions included in the presentation. In the general case, the group description for the group including an item and the item description are displayed. This allows presentation of general and specific informa- tion.
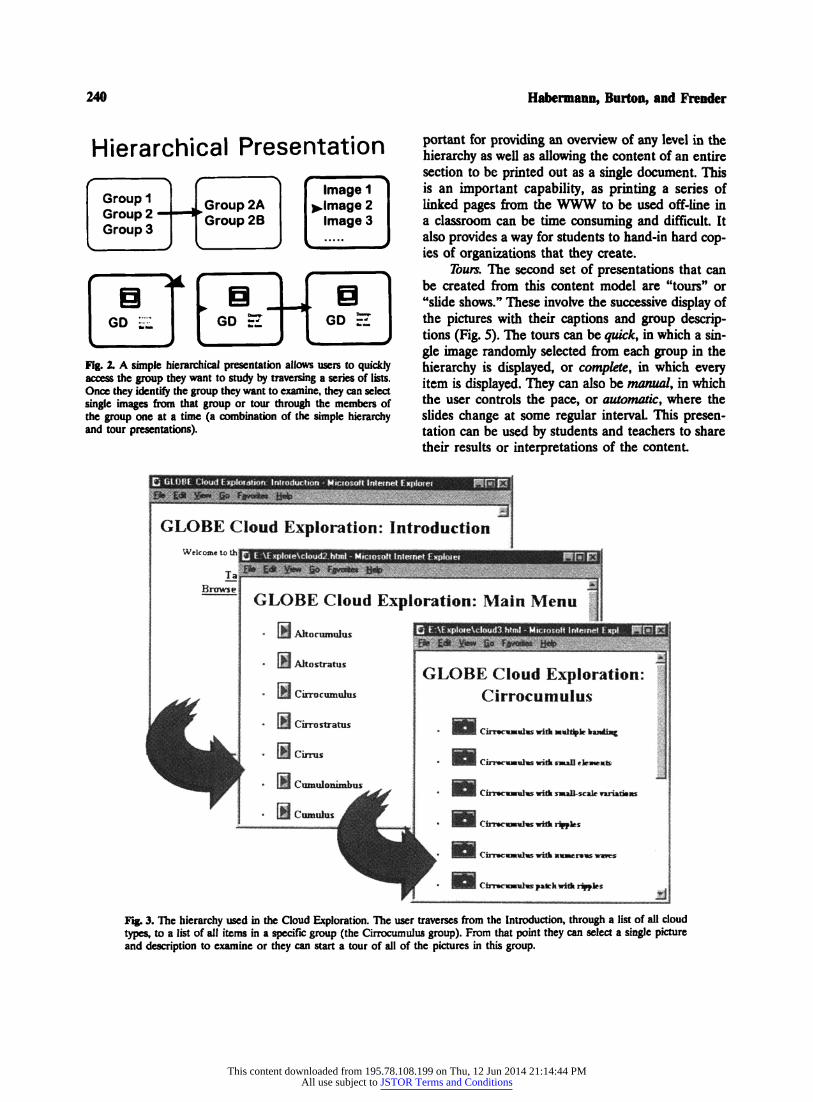
Hierarchical Presentations. The simplest presen- tation available for a hierarchical collection of data is a hierarchical presentation. This presentation al- lows the user to find the information by traversing levels of the hierarchy represented as text. Each suc- cessive page displays another level of the hierarchy (Fig. 2). We term this the simple hierarchical presen- tation. Figure 3 shows the actual hierarchy used in the Cloud Exploration described below to find Cir- rocumulus clouds. The final frame shows titles of the items in the Cirrocumulus group.
The user eventually reaches the group they are interested in, where closely related items are dis- played. At this point several embellishments of be- come available. The hierarchy tour allows the user to move back and forth through the items in the level. In the example illustrated in Fig. 2, the group de- scriptions (GD) and the item descriptions are dis- played along with each item. The arrangement of the image and the descriptions on the page is completely flexible. When the end of the group is reached, the user is returned to the simple hierarchical presenta- tion.
The final presentation in the hierarchical family is the report (Fig. 4). A report displays all the items in a particular level along with the group description and the item descriptions. This presentation is im-
Table 1. Representations of Pages at Different Technology
Levels
Level Technology Available Pages
No Technology Paper is the primary Paper with pictures delivery mechanism, and descriptions,
flashcards Low Technology Computers exist, but HyperCard stacks,
are generally not Power Point connected to the presentations WWW
High Technology Computers with Web pages WWW connections.
This content downloaded from 195.78.108.199 on Thu, 12 Jun 2014 21:14:44 PMAll use subject to JSTOR Terms and Conditions
240 Habennann, Burton, and Frender
Fig. 2. A simple hierarchical presentation allows users to quickly access the group they want to study by traversing a series of lists. Once they identify the group they want to examine, they can select single images from that group or tour through the members of the group one at a time (a combination of the simple hierarchy and tour presentations).
Hierarchical Presentation
/+ a I f 1 Image 1 Group /+ 1 a
1 Group 2A Image 2 Group 2 1
-0 K 2Q image M 3 Group 3 K image M
b f L e 44 B GD «£ GD rl GD £
portant for providing an overview of any level in the hierarchy as well as allowing the content of an entire section to be printed out as a single document. This is an important capability, as printing a series of linked pages from the WWW to be used off-line in a classroom can be time consuming and difficult. It also provides a way for students to hand-in hard cop- ies of organizations that they create.
Tours. The second set of presentations that can be created from this content model are "tours" or "slide shows/' These involve the successive display of the pictures with their captions and group descrip- tions (Fig. S). The tours can be quick, in which a sin- gle image randomly selected from each group in the hierarchy is displayed, or complete, in which every item is displayed. They can also be manual, in which the user controls the pace, or automatic, where the slides change at some regular interval. This presen- tation can be used by students and teachers to share their results or interpretations of the content.
Fig. 3. The hierarchy used in the Cloud Exploration. The user traverses from the Introduction, through a list of all cloud types, to a list of all items in a specific group (the Cirrocumulus group). From that point they can select a single picture and description to examine or they can start a tour of all of the pictures in this group.
This content downloaded from 195.78.108.199 on Thu, 12 Jun 2014 21:14:44 PMAll use subject to JSTOR Terms and Conditions

Science Content for Different Learning Styles and Environments 241
Fig. 4. The report presentation brings together all items in a group for an overview or for printing. This presentation alleviates the difficulties of printing a linked series of web pages and allows students to hand in hard copies of their organizations of the data.
tepore rreseniaiioi
Group Description
() (5| () Dm^ D>t O*-**- »>«r *m* M«r •»•_ *.a_ *••_
ftmtt *m« taa«T toia *.*• tefea
V J
Quiz. The third set of presentations which can be created from this content model is the "quiz" presentations. In this case, items are displayed with- out descriptions. The simplest quiz presentation is the classification quiz. In this quiz items are randomly selected from the entire collection and users are asked which group they belong to. The results are tallied as a running percentage, or as a matrix show- ing the correct and incorrect answers.
An important part of the quiz presentation is the ability to provide feedback to the users as they take the quiz. This feedback (indicated by FB in Fig. 6)
Fig. 6. The quiz presentation allows users to test their knowledge and provides flexible feedback (FB).
Quiz Presentation
FB ? FB ?
b f [ m JJ b FB ? FB ?
Fig. 5. Tour presentations provide flexibility in image selection as well as pace of display (manual or automatic). Thus they can run in the background or be used to support scientist, teacher, or student presentations.
Tour Presentation
|5| _ ^ (n) ^ (] GO rZ GD 5L GD rZ
()()() GD rZ GD £L GD rZ
can be done in a number of ways from simple per- centages of correct answers to detailed error matrices which show which areas the student has gained pro- ficiency in and which areas might need more work.
Postcards. The final presentation is really an op- tion available for all presentations. It allows the user to send a picture along with its description and an additional message in an e-mail message. The mes- sage includes a location on the WWW at which the user can view the picture. This mechanism can be used to enable communication of pictures and asso- ciated words between all participants in a project. It is a mechanism for sharing questions, answers, ob- servations, and interpretations which fits perfectly into the content model we have described.
THE WEB AS AN EDUCATIONAL WORKSPACE
Educators have long wrestled with the realization that delivery of information to passive students is not an effective way to develop or foster the habits of in- tellectual inquiry that make learning a life-long, rather than a school-based, activity. It leaves the student only at the second step of Shedroff 's four phase continuum. The student simply has no opportunity, or infrequent opportunity, to convert information to knowledge, much less knowledge to wisdom. In order to take that step, the student must be personally involved.
The historically and currently most dominant form of instruction is the lecture. This, in spite of the fact that the lecture format arose in the Middle
This content downloaded from 195.78.108.199 on Thu, 12 Jun 2014 21:14:44 PMAll use subject to JSTOR Terms and Conditions
242
Ages when there were only hand-transcribed manu- scripts, expensive and rare. At that time it was a sen- sible means of sharing information. With public libraries and the Web available today, we must be able to do better, but how? Many Web sites are still modeled after reference books. The sites provided only the content and the information architecture in which it is presented with little opportunity for in- teraction or for creative reorganization of the con- tent.
Goodlad (1984) wrote:
Students in the classrooms we observed made
scarcely any decisions about their learning- We ob- served that, on the average, about 75% of class time was spent on instruction and nearly 70% of this was "talk"- usually teacher to students- We do not see in our descriptions, then, much opportunity for stu- dents to become engaged with knowledge so as to
employ their full range of intellectual abilities.
This classroom reality is characterized by Rexford Brown (1991) as "talkinbout" or by others as "chalk- talk." Brown suggests instead that:
If you want young people to think, you ask them hard questions and let them wrestle with the an- swers. If you want them to analyze or interpret it or evaluate it, you ask them to do so and show them how to do so with increasing skill. If you want them to approach interesting or difficult problems, you give them interesting or difficult problems and help them develop a conscious repertoire of problem- solving strategies. If you want them to think the way scientists or historians or mathematicians do, you show them how scientists and historians and mathe- maticians think, and you provide opportunities for them to practice and compare those ways of think-
ing.
Brown characterizes this as "a literacy of thought- fulness." He is suggesting that students need:
• Authentic questions • Demonstration of ways to analyze • Development of strategies for problem-solv-
ing • Ways to see how professionals think
Clearly, access to up-to-the-minute scientific re- search and data on the Web allows students to look at authentic questions. The Web also allows students to see the data gathered to answer current scientific questions. Students on the Web even participate in
gathering the data needed to solve, or to help define those questions. The content/presentation model we discuss allows students and teachers to demonstrate
Habennann, Burton, and Frender
to each other the ways they analyze and problem- solve. But there is "so much". Students and teachers can hardly bring the needed background knowledge to participate in all these possibilities.
Most research has not addressed the need to master specific content or skills as a precursor to ask- ing the thoughtful questions that then allow students to construct their own knowledge. The approach we describe is an attempt to provide a mechanism for mastering specific content. The information set is ac- cessible in multiple formats and can be re-arranged and edited. Therefore it lends itself both to collabo- ration and to personal construction.
Traditionally, the paths presented to students have been determined by scientists, teachers, infor- mation architects, textbook authors and curriculum developers. Students and teachers have been con- strained by this approach that limits their autonomy. What if teachers and students were instead able to refine the text, question the text, and have a dialogue with the author to make meaning from it? What if students could read the text and leave their own syn- opses on the page for others to read and respond to? The text would no longer be an arbitrary con- struct of the author/editors. It would become a living document, to be refined, re-interpreted, and re-con- structed by the individual learner.
Our content model and the supporting technol- ogy begins to provide some of these capabilities on a small scale by providing a forum where students can ask questions, revisit material, and present it in a meaningful way by creating and sharing their own paths. In this case, the content and the system for presenting it is active rather than passive. This evo- lutionary approach adds interactivity to the static ar- chitecture of many Web sites derived from traditional textbook models. This interactivity differentiates the Information Arcology approach we envision from less dynamic Information Architecture.
PRESENTATIONS IN THE CLASSROOM
We are experimenting with this approach in a classroom at Jarrow Montessori School in Boulder, Colorado. The classroom is a multi-age, self-con- tained group of nine to twelve year olds and one of the authors (NB) is the teacher. There are seven computers in the room, one of which is connected to the World Wide Web most of the day. Students use the Web to do research and as participants in
This content downloaded from 195.78.108.199 on Thu, 12 Jun 2014 21:14:44 PMAll use subject to JSTOR Terms and Conditions

Science Content for Different Learning Styles and Environments 243
various on-line educational programs like the GLOBE program.
The technology we describe here was used as an adjunct to GLOBE, www.globe.gov. In GLOBE, as in all science education projects, interactions be- tween teachers, students, and scientists are critical. It would be ideal for GLOBE students to go into the field with cloud physicists, work with Landsat teams at USGS, or sit down with experts in data analysis at NOAA to learn what are good questions to ask about data. Unfortunately, the constraints of time, budget, and organization of the current American school day and calendar do not permit that. We be- lieve that some degree of the same mentoring can be achieved using the approach we describe and the World Wide Web. The content model provided here can help develop that larger "community of practice" including educators, scientists and technology ex- perts, described by Lave and Wenger (1991). We dis- cuss the use of three content/model presentations: a collection of clouds, a collection of Landsat images, and a collection describing an analysis of some stu- dent data. We focus on the reasons students choose different pathways to these collections and how they were used in the classroom.
GLOBE Students make measurements in a number of disciplines, including clouds. The class- room teacher noticed, during an unusually rainy week, that no one making cloud observations had re- corded Stratus which had clearly been the predomi- nant cloud type that week. Students in Boulder clearly needed practice to become proficient ob- servers. How could students get the expert mentoring and adequate practice with a scientist to master iden- tification of ten cloud types?
This need for a simple classification exercise mo- tivated the development of the first implementation of the technology described here. We term these im- plementations "Explorations". The Cloud Explora- tion (Frender and Holle, 1996) was developed by the authors with Dr. Ron Holle from NOAAs National Severe Storm Laboratory providing expert content. The Cloud Exploration provides a rich way for stu- dents to practice proficiency, make connections and ask questions. This is because of the large number of pictures it offers, because it allows students to ask questions of the scientist about classification, and be- cause it allows students to choose their own tech- nique for mastering the material and to assess their knowledge.
One problem with the limited set of pictures that might be cut out of books is that students learn the details of the particular photograph, not the gen- eralizations. The student remembers that the photo with palm trees is a Cirrostratus, not really what a Cirrostratus is. The Cloud Exploration includes over 150 pictures with captions in ten groups with group descriptions. The existence of the Exploration on the Web allows for a constant infusion of new pictures, provided by the students, the teachers, or the science content expert.
The Cloud Exploration includes all of the pres- entations described above. The simple hierarchy presentations are used to sample the similarities and differences between clouds in the same group. Mul- tiple pictures in each group allow students to expe- rience the diversity of the groups and the difficulties that can be faced when classifying real world clouds. The hierarchy for the cloud Exploration is shown in Fig. 2. The Cirrocumulus group is reached after two selections. The automatic slide show presentation ran for a couple of days when the computer was free and attracted discussion and interest. Students started quizzing each other about what they knew, and whether or not they agreed about the identification of the photographs.
When we ask students to be observers, to meas- ure and report, they need to be able to recall knowl- edge specific to the observational situation. Students were eager to practice and test their knowledge. They most often chose to explore in groups of two's or three's. This generated a great deal of thoughtful dialogue. There was discussion about which path to follow. Some wanted a quick overview to refresh their cloud recognition skills (Quick lour). Some felt they wanted practice with all possible pictures in or- der to be successful (Simple Hierarchy). Others wanted to test themselves immediately to see what they knew (Quiz). In each case, even before begin- ning the task, the students had to assess what their goal was and what they knew about their current knowledge of the topic. Students who took the quiz first usually wanted the quiz to provide them with information about what they knew and about what they didn't know. Others wanted to completely re- hearse before testing. Some wanted a quick review.
The quiz mode generated the most debate. Stu- dents had to justify their choices. If students incor- rectly identified a cloud the feedback included the correct answer, an explanation of the correct classi-
This content downloaded from 195.78.108.199 on Thu, 12 Jun 2014 21:14:44 PMAll use subject to JSTOR Terms and Conditions

244
fication, and a hypertext link to a complete descrip- tion of that particular photograph.
It became clear that students would like a mechanism for discussion about their observations or questions with the expert. This capability can be im- plemented in a number of ways depending on the technology level of the school and the availability of the expert content provider. If implemented using the postcard feature described above, students can send an electronic postcard of any item in the con- tent collection to the expert content provider along with a question. The expert content provider has a number of options for the response, from a straight- forward e-mail response to posting the question and the response on the item for viewing by future users.
The students also wanted to add their own pic- tures and descriptions to the quiz. Implementing this important step also depends critically on the tech- nology available to the school and the level of ex- pertise in using that technology. For example, File Transfer Protocol (FTP) is the easiest way to transfer multiple digital images across the net. FTP clients are generally more difficult to use than WWW browsers and may not be appropriate for some tech- nology levels. One can always fall back on mailing photographs if the content creator is capable of scan- ning those photographs.
The feedback mechanism used in the Cloud Ex- ploration quiz includes an error matrix that allows students to see their point of error. Are they consis- tently having trouble with Alto clouds? Are they clearly comfortable with everything but different kinds of Stratus? If so, they can choose to go back and pick only pictures of Stratus clouds to review.
A similar Exploration of Landsat images (Habermann et al., 1997) was used not to develop a specific skill, but to acquaint students with views from above, and to help them develop a schema for what one would look for in trying to understand the earth from a satellite's perspective.
Students again had the automatic slide show op- tion running in the classroom for several days to help generate some questions and interest before engag- ing with the Exploration. The "slides" offered views of major urban areas, mountainous sites, deserts, ag- ricultural areas, and coastlines. Students, in viewing the set and in doing the quiz (which was again the most popular way to view and study the material, see Fig. 7), gained familiarity with the details revealed by Landsat images; essentially learned to "read" them. Studying, interpreting and ground-truthing an
Habermann, Burton, and Frender
image of their school locality is a part of the GLOBE Program. Again, collaborative learning was fostered by both the automatic slide show where students would debate with each other correct answers, give reasons for the guesses or predictions they were mak- ing, and in doing the quiz in small groups. This work also generated additional research into places fea- tured in the exploration.
The Landsat images were more easily mastered than the cloud information. Students were able to make clear association of what they saw with their prior knowledge of locations and landscapes. The cloud information was more difficult. It was not just labeling but categorizing a vast set.
These two Explorations were designed to help students practice proficiency in the observations they were making for the GLOBE program (www. globe.gov). They were designed to rehearse a com- mon body of information needed to participate in
Fig. 7. The Quiz Presentation from the Landsat Exploration requires students to identify the location shown in the picture.
This content downloaded from 195.78.108.199 on Thu, 12 Jun 2014 21:14:44 PMAll use subject to JSTOR Terms and Conditions

Science Content for Different Learning Styles and Environments 245
data collection for GLOBE. They allowed to students to enter and practice in the mode they felt most com- fortable and useful. They worked best with groups, discussing choices, and examining reasons for making the identifications they did.
Collecting data for someone else's experiment is often not intrinsically interesting. Students need to examine their own data, and other students' data, and begin to ask questions about what they might learn from it This is not an easy task. As researchers at Northwestern University's Collaborative Visualiza- tion Project (CoVis, 1997) point out:
It may be difficult for students to think of a reason- able question worth investigating. We usually need to know something about a topic before we have
questions to ask about it Students new to a scientific field may be stuck in a conundrum if they do not know enough about the field to have any questions. Even if they do have some instinctive questions, they may be too simplistic to be worth researching or either too vague or complex to be reasonably inves-
tigated. They will need help knowing where to start to find questions, as well as guidance that will enable their questions to be of a size and scope that allows for meaningful research.
It is difficult for students and teachers to design the kinds of good scientific questions the Co Vis re- searchers describe above. Therefore, a scientist was needed to share how to inquire and reflect about data. As literacy research suggests we need to make "visible the invisible" the questioning and evaluating we do in our minds as readers and writers. The same goes for science. The wondering out loud, rather than the finished research paper is what the student needs "to see" to be scaffolded in his/her develop- ment as an analyst and researcher.
The Wisconsin Hypothesis Exploration (Haber- mann, 1997) demonstrates a method of taking the student who is familiar with data and the information it contains and transforming it to Shedroff's third level, knowledge. This Exploration can be accessed from a hierarchical menu which lists the discrete
components or as a complete tour, following the sci- entific hypothesis though with the supporting graphs.
The Hypothesis Exploration not only provides a
sequential model for scientific "wondering" on-line, it is also easily used as printed text. With only one computer available in the Boulder classroom and 24 students, the hypothesis exploration was used both ways. First, a group of 3 students who had already expressed interest, and designed some data investi- gations viewed the Hypothesis Exploration on-line.
They were to be the mentors to the rest of the class. They then developed three hypotheses they wanted to explore with GLOBE student data and shared their ideas with the class.
The teacher then printed out each page of the tour, some in the report format shown in Fig. 8. One page a day was given to the whole class and discussed in a group, focusing on how the scientist was devel- oping the hypothesis, whether they agreed or dis- agreed, and where they might find additional data to support the hypothesis. Again, there was a broad range of abilities and interests. The students who were proficient with spreadsheets didn't attend the group explanation of using a spreadsheet to make plots. They gathered their data and went to the Hy- pothesis Hierarchy for the mentoring they needed in preparing several different views of their data and understanding standard deviation. They didn't go through the entire scientist's development of his hy- pothesis, but accessed the pieces of his "wondering" they needed from the simple hierarchy presentation.
Fig. 8. The Report Presentation allows teachers and students to view and print out all items in a group.
This content downloaded from 195.78.108.199 on Thu, 12 Jun 2014 21:14:44 PMAll use subject to JSTOR Terms and Conditions
246
The Exploration also allowed students to begin to share their thinking on-line. If they disagreed with a statement on a page, were confused by it, or had a different idea about it, they could click on a link and send a message to the scientist. The scientist could respond directly via e-mail or post the stu- dents' observations or wonderings directly on the page for others to learn from. The Exploration Hy- pothesis then became not just an example of the sci- entist's thinking but contained examples of students9 thinking as well. What started as scientific mentoring evolved through use into a collaboration between student and scientist
With the pace of new scientific research and the "so much" data and information, teachers will have to form themselves the kind of "communities of prac- tice" Lave and Wenger (1991) describe. The teacher will not be the sole sources of information. They will need to interact with scientists, technicians, and other educators in order to sort though, structure, and access the burgeoning "so much." Our experi- ence with the tools we describe in the classroom sug- gests that we are on the right track.
ROLES IN THE WORKSPACE
Implementing the Web Workspace we are trying to describe and develop requires all participants to function in roles which differ significantly from their historic roles. Scientists have communicated in small and sometimes esoteric communities of other special- ists. They must realize the importance of extending their understanding to the broad audience that is now exposed to scientific information. Teachers have many times functioned in isolated classroom units. They must reach out and form communities with scientists and other teachers. Students have been passive and have not been required to take responsibility for their educations. They must become active and responsible learners. There is too much information available on the Web for any of these groups to face alone. Alvin Toffler (Kelly and Toffler, 1996) realized this in the context of the effect of the Web on government:
I don't care how smart anyone on the Net is- no-
body has all of the answers. What we're talking about is such a tremendous leap in the history of
governance [education] that there's no single archi-
tect, there's no brain that knows the answers to how to do it We need to take advantage of millions of brains. We need the distributed intelligence in the
system for this.
Habennann, Burton, and Frender
The system we describe involves creating visual and descriptive content, formulating questions about that content, and creating paths through the content to answer those questions. All of these tasks can be accomplished by scientists, teachers, and students. The general case could begin with the scientist and teacher working together to collect and classify con- tent. With time, students enter the process, first in- creasing their expertise with the content, then reorganizing it to support their own interpretations and hypotheses. At this stage, the students take on some of the teacher's roles, mentoring others along the paths they have created. At the same time, the teachers and scientists have an opportunity to view familiar content through fresh eyes, potentially tak- ing on some of the traditional roles of the students.
CONCLUSIONS
We are at an important crossroads in the history of information creation and dissemination. The amount of data available to be structured into infor- mation and the audience for that information are larger than ever before and expanding rapidly. The World Wide Web provides an exciting environment for addressing the challenges associated with moving away from this crossroads. It provides an environ- ment where users can interact with the information and mold it to create individual knowledge.
Having the interactive capability of the Web does not ensure its use. Many teachers and students are faced with Web pages that are modeled after reference or text books. This model must evolve if we are going to realize the potential of the Web for enhancing edu- cational experiences. We must design systems that fuse static information architectures with dynamic user in- puts and controls to form evolving collections of in- formation created by the communities that are using them. This fusion of information architecture and evolving systems is termed Information Arcology. It is the information paradigm for the World Wide Web.
We describe a step towards this paradigm that begins by moving back to a simple model of content which is consistent with the Web. The fundamental elements in the model are pictures and descriptions. These can be collected into groups which can also have descriptions. We have developed the technology that enables a number of presentations to be created from this content model and presented on the World
This content downloaded from 195.78.108.199 on Thu, 12 Jun 2014 21:14:44 PMAll use subject to JSTOR Terms and Conditions

Science Content for Different Learning Styles and Environments 247
Wide Web. Those presentations are designed to sup- port a wide variety of learning environments and styles and provide a mechanism for rehearsing con- tent in a number of ways.
The technology we describe also offers a rich en- vironment for communication between scientists, teachers, and students, providing the capability for mentored inquiry and guided question and problem construction. It provides an environment in which traditional roles can blur as communities of learners are formed.
Future developments of this technology will fo- cus on improved techniques for creating and organ- izing content. It is critical that all participants in a project have these capabilities, however, barriers pre- vent us from accomplishing this ideal at present. Some of these barriers are technological: It is diffi- cult to create fully interactive environments on the Web because of the simplicity of Web interactions (only mouse clicks) and bandwidth limitations. These constraints will be overcome as technologies evolve and techniques improve. Other barriers are related to the problem of information overload described above. Tfeachers are overwhelmed even without the massive amount of new information available to them. It will take time to evolve the systems to the point where they can be used reliably and integrated easily into existing classroom practices. Finally, there are the barriers described by the Co Vis project above. The existence of all of this information does not make it easier to teach kids science!
The set of presentations we describe here is il- lustrative and certainly not exhaustive. We welcome suggestions for extending this set.
ACKNOWLEDGEMENTS
Much of the work described in this paper has been carried out in the context of the GLOBE Pro-
gram and has benefited substantially from influences of the broad group of scientists, teachers, and tech- nologists involved in that program. Particular thanks go to Ralph Coppola, John Schmidt, and to the GLOBE Tfeacher Trainers who helped shape the edu- cational foundations for our thoughts and technolo- gies.
REFERENCES
Brown, R. (1991). Schools of Thought: How the Politics of Literacy Shape Thinking in the Classroom, Jossey-Bass Publishers, San Francisco, California.
Co Vis. (1997). Project Pedagogy in Co Vis. http://www.covis. nwu.edu/Geosdences/philosophy/projects.html.
Frender, K., and Holle, R.. (September, 1996). The GLOBE Cloud Exploration, http://globe.ngdc.noaa.gov/cgi-bin/m2h? gl/douds.men.
Goodlad, J. (1984). A Place Called School Prospects for the Future, McGraw-Hill, New York, pp. 229-231.
Habermann, T (1997). Wisconsin Hypothesis Exploration, http:// globel.ngdc.noaa.gov/cgi-bin/globe/m2h?gl/wisconsin.men.
Habermann, T, Frender, K., and Brown, D. (1997). The GLOBE Landsat Exploration, http://globe.ngdc.noaa.gov/cgi-bin/ m2h?gl/landcover.men.
Kelly, K., and Tbffler, A. (1996). Anticipatory Democracy. Wired, 4(07): 45.
Kelly, K., and Wolf, G. (1997). Kill Your Browser. Wired, 5(03): Cover.
Lave, J., and Wenger, E. (1991). Situated Learning: Legitimate Pe- ripheral Participation. Cambridge University Press, Cambridge, MA.
McClintock, R., (1994). Power and Pedagogy, http^/www.ilt.colum- bia.edu/academic/texts/mcclintock/pp/chapterl .html.
Morris, S. and Herndon, R. (January, 1997). Arcology Info Site. http://www.sfo.com/~morriss/Arcology/arcmain.html.
Shedroff, N. (1994). Information Interaction Design: A Unified Field Theory Of Design, http://www.vivid.com/form/uni- fiedAinified.html.
Soleri, P (1977). Earth's Answer, Lindsifarne Books. Wurman, R. S. (1990). Information Anxiety: What to Do When In-
formation Doesn't Tell You What You Need to Know, Bantam Books.
Wurman, R. S., and Bradford, P (Eds.). (1996). Information Ar- chitects, Graphis Press, New York.
This content downloaded from 195.78.108.199 on Thu, 12 Jun 2014 21:14:44 PMAll use subject to JSTOR Terms and Conditions