information fusion in undersea warfare -...
TRANSCRIPT
M. J. Larkin FUSION99 7/6/99 [email protected] 1
INFORMATION FUSION IN UNDERSEA WARFARE
Presented at:The International Conference on Information Fusion
Sunnyvale, CA
Michael J. LarkinNaval Undersea Warfare Center
Newport, RI [email protected]
6 July 1999
INFORMATION FUSION IN UNDERSEA WARFARE
Presented at:The International Conference on Information Fusion
Sunnyvale, CA
Michael J. LarkinNaval Undersea Warfare Center
Newport, RI [email protected]
6 July 1999
M. J. Larkin FUSION99 7/6/99 [email protected] 2
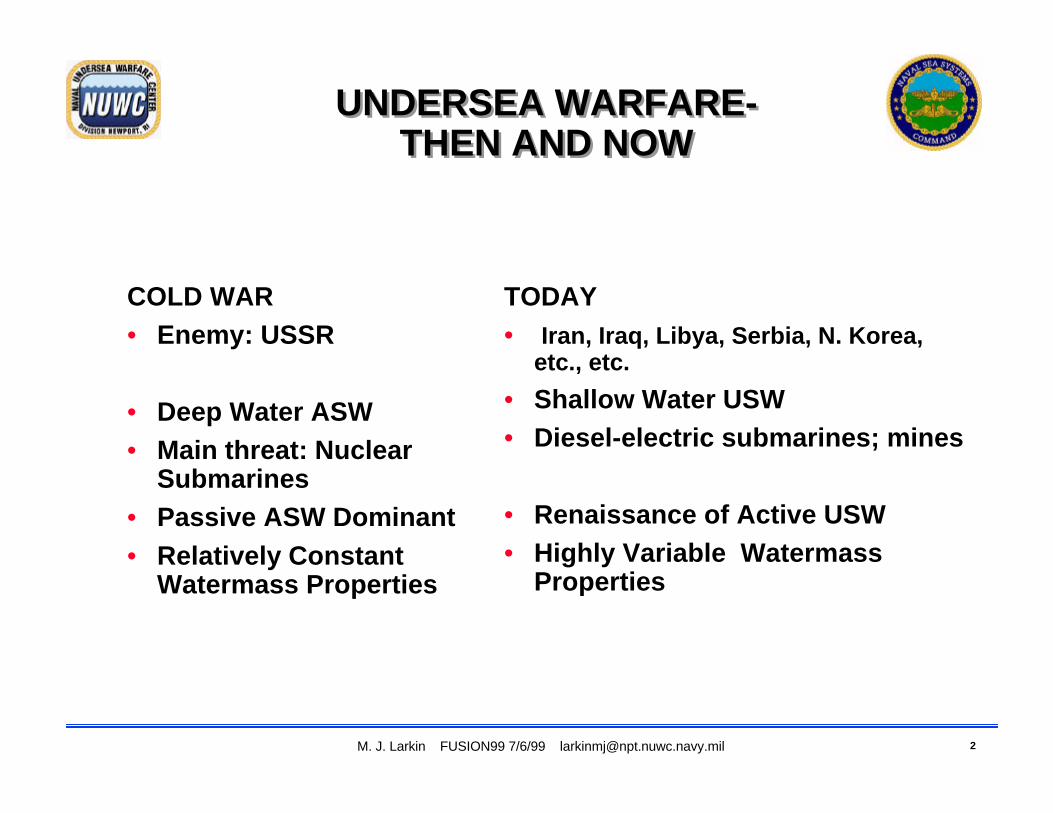
COLD WAR• Enemy: USSR
• Deep Water ASW• Main threat: Nuclear
Submarines• Passive ASW Dominant• Relatively Constant
Watermass Properties
UNDERSEA WARFARE-THEN AND NOW
UNDERSEA WARFARE-THEN AND NOW
TODAY• Iran, Iraq, Libya, Serbia, N. Korea,
etc., etc.
• Shallow Water USW• Diesel-electric submarines; mines
• Renaissance of Active USW• Highly Variable Watermass
Properties
M. J. Larkin FUSION99 7/6/99 [email protected] 3
M. J. Larkin FUSION99 7/6/99 [email protected] 4
DD-21 Operational RequirementsDD-21 Operational Requirements
• Submarine detection/engagement;• Torpedo defense;• On-board (in-stride) mine detection/avoidance;• Off-board mine reconnaissance;• Survivability;• Signature reduction;• Aviation mission support;• Interoperability with off-board USW sensors, models, and
databases.
M. J. Larkin FUSION99 7/6/99 [email protected] 5
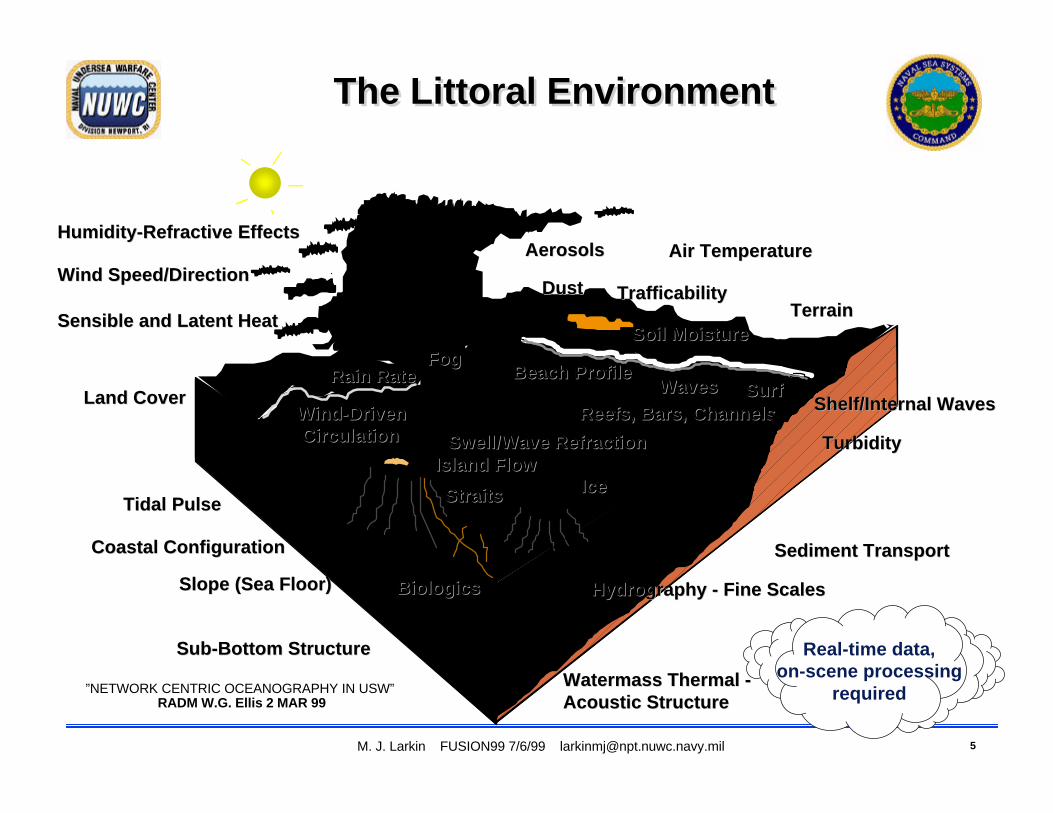
The Littoral EnvironmentThe Littoral Environment
Humidity-Refractive EffectsHumidity-Refractive Effects
Wind Speed/DirectionWind Speed/Direction
Sensible and Latent HeatSensible and Latent Heat
Land CoverLand CoverWind-DrivenWind-Driven Circulation Circulation
Tidal PulseTidal Pulse
Coastal ConfigurationCoastal Configuration
Slope (Sea Floor)Slope (Sea Floor) BiologicsBiologics
Air TemperatureAir Temperature
TrafficabilityTrafficability
Sediment TransportSediment Transport
TerrainTerrain
AerosolsAerosols
Swell/Wave RefractionSwell/Wave RefractionIsland FlowIsland Flow
StraitsStraits IceIce
WavesWaves SurfSurfRain RateRain Rate
FogFog
Reefs, Bars, ChannelsReefs, Bars, Channels
Beach ProfileBeach Profile
DustDust
Soil MoistureSoil Moisture
Shelf/Internal WavesShelf/Internal Waves
TurbidityTurbidity
Hydrography - Fine ScalesHydrography - Fine Scales
Watermass Thermal - Watermass Thermal - Acoustic StructureAcoustic Structure
Sub-Bottom Structure Sub-Bottom Structure Real-time data,on-scene processing
required”NETWORK CENTRIC OCEANOGRAPHY IN USW” RADM W.G. Ellis 2 MAR 99
M. J. Larkin FUSION99 7/6/99 [email protected] 6
IUSW FocusIUSW Focus
• Improve USW performance in shallow water bydemonstrating a lightweight variable-depth transmitter andbroadband signal processing.
• Reduce USW manning by developing technology forbroadband signal processing, automated detection-classification-localization, data fusion, and environmentaladaptation.
• Provide in-stride mine detection and avoidance capabilitiesthrough the use of organic (on-board) sensors.
• Develop concepts to minimize impact on the DD-21preliminary hull design by studies focused on, for example,variable-depth sonar, multiple towed bodies, and conformal-array technology.
M. J. Larkin FUSION99 7/6/99 [email protected] 7
Platform Acoustic Warfare DataFusion (PAWDF)
Platform Acoustic Warfare DataFusion (PAWDF)
Program goals:
• Improve operator ability to detect, track and classifytargets in a highly cluttered environment
• Reduce quantity of data that must be processed by thesonar operator
• Reduce false alarm rate
• Improve quality of data
• Reduce number of sonar operators required
These goals are to be accomplished through development ofautomated, real-time data fusion algorithms and techniquesemploying Bayesian inference networks (BINs) and probabilisticreasoning to automate the fusion of all acoustic and non-acousticdata on a surface ship or a submarine at the sonar operator level.
M. J. Larkin FUSION99 7/6/99 [email protected] 8
Overview of Data Fusion AlgorithmOverview of Data Fusion Algorithm
• Historically, automatic acoustic contact fusion problem solvedusing strictly geometric measures (e.g., Mahalanobis distance)-these measures tend to be bias-limited and underutilize the data.
• This algorithm mitigates problem by including sonar operatorclues in similarity assessment process
• Three steps in process• Evidence extraction- geometric and non-geometric clues used by
operators are extracted from contact pair data and converted toevidence.
• Belief generation- for each contact pair, extracted evidenceprocessed through a Bayesian influence network to produce anestimate (belief) of the probability of association.
• Cluster formation and management- uses positive and negativeinformation to produce a clustering of contacts based on beliefsobtained in the previous step.
M. J. Larkin FUSION99 7/6/99 [email protected] 9
Information Exploited by Human OperatorsInformation Exploited by Human Operators
• Common frequency dynamics• common SNR dynamics• common detection times• common classification clues• a priori knowledge
M. J. Larkin FUSION99 7/6/99 [email protected] 10
Data AssociationData Association
1. Form “current clusters” based on the mostrecent belief estimates
2. Calculate fuzzy comparison values betweencurrent and reference clusters
3. Calculate optimal current cluster- referencecluster matching
4. Determine contact-to-reference clusterassignments
M. J. Larkin FUSION99 7/6/99 [email protected] 11
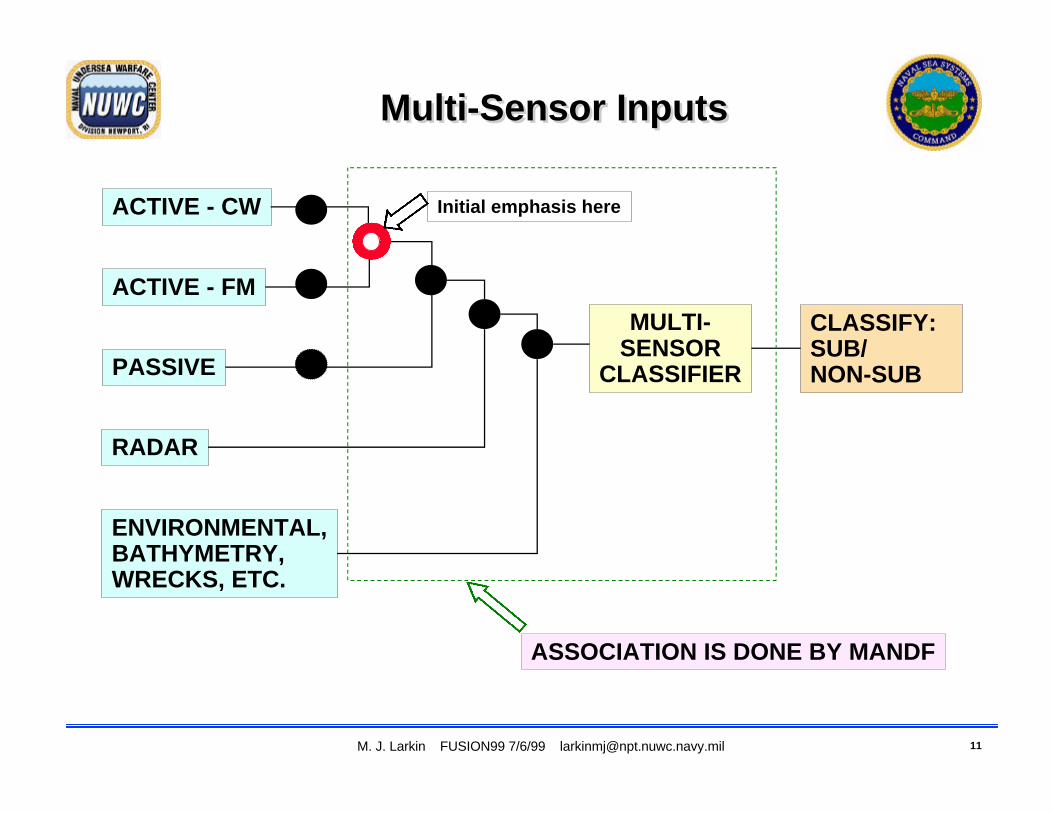
Multi-Sensor InputsMulti-Sensor Inputs
ACTIVE - CW
ACTIVE - FM
PASSIVE
RADAR
ENVIRONMENTAL,BATHYMETRY,WRECKS, ETC.
CLASSIFY:SUB/NON-SUB
MULTI-SENSOR
CLASSIFIER
ASSOCIATION IS DONE BY MANDF
Initial emphasis here
M. J. Larkin FUSION99 7/6/99 [email protected] 12
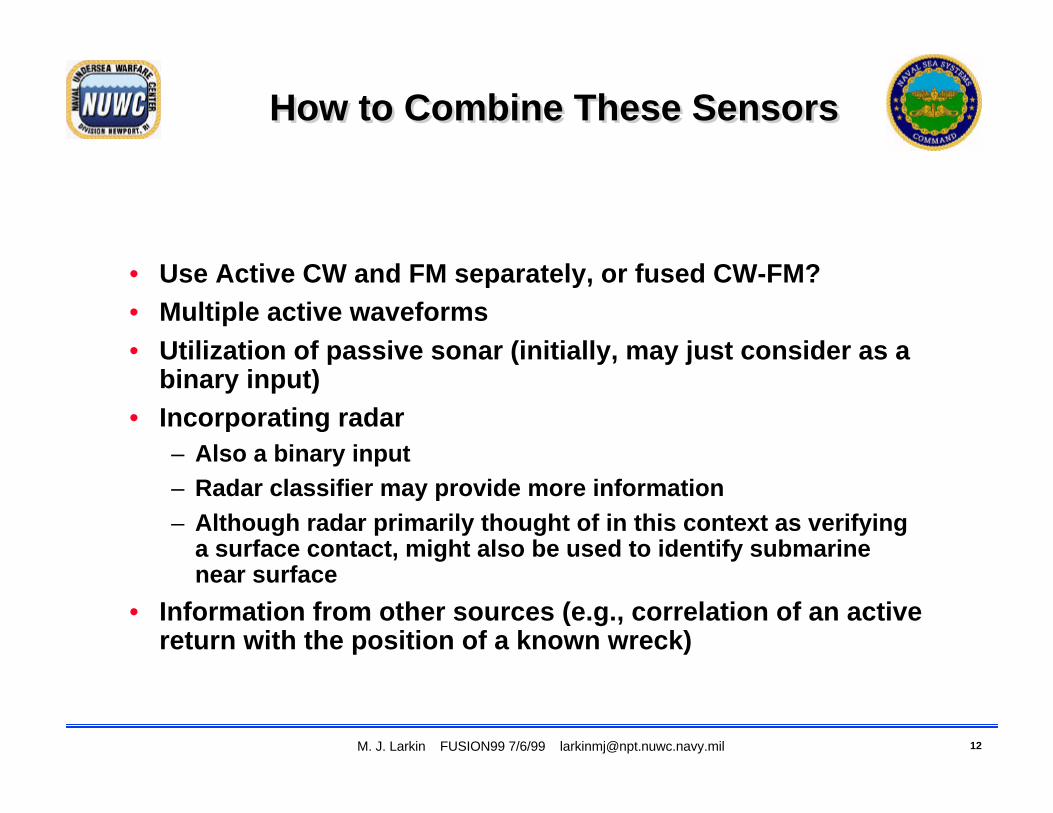
How to Combine These SensorsHow to Combine These Sensors
• Use Active CW and FM separately, or fused CW-FM?• Multiple active waveforms• Utilization of passive sonar (initially, may just consider as a
binary input)• Incorporating radar
– Also a binary input– Radar classifier may provide more information– Although radar primarily thought of in this context as verifying
a surface contact, might also be used to identify submarinenear surface
• Information from other sources (e.g., correlation of an activereturn with the position of a known wreck)
M. J. Larkin FUSION99 7/6/99 [email protected] 13
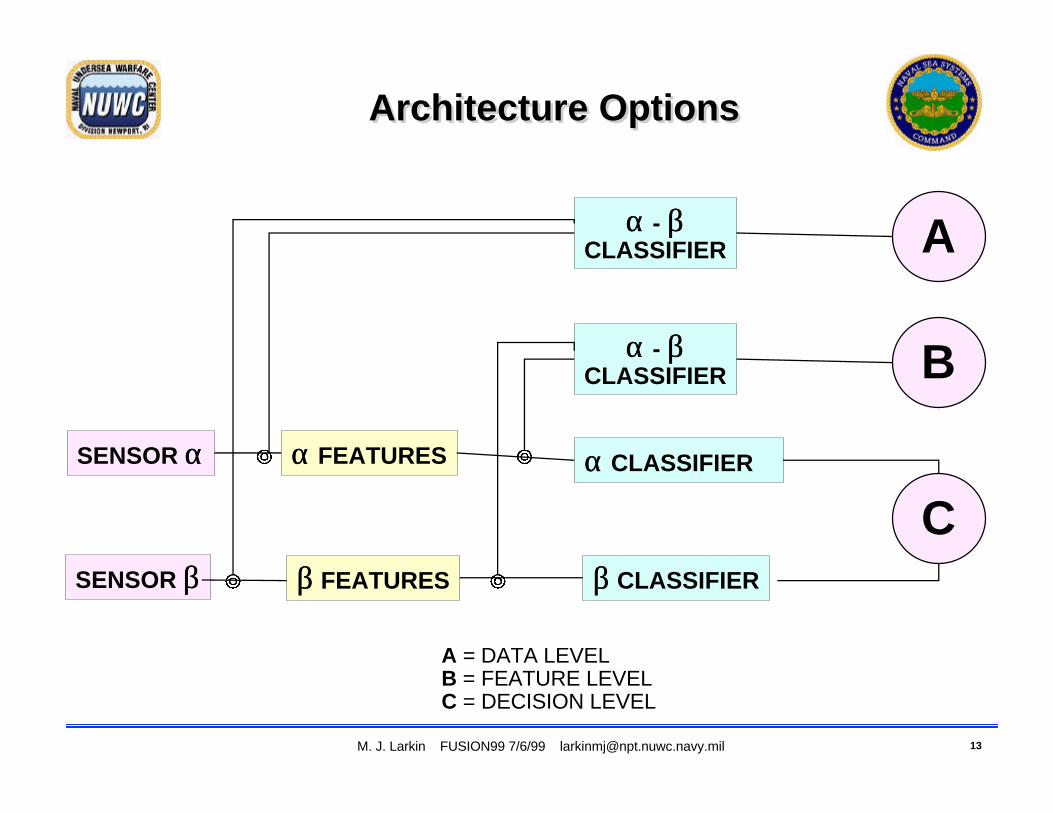
Architecture OptionsArchitecture Options
αα FEATURES
ββ FEATURES
αα CLASSIFIER
ββ CLASSIFIER
αα - ββCLASSIFIER
C
B
A = DATA LEVEL B = FEATURE LEVEL C = DECISION LEVEL
αα - ββCLASSIFIER A
SENSOR αα
SENSOR ββ
M. J. Larkin FUSION99 7/6/99 [email protected] 14
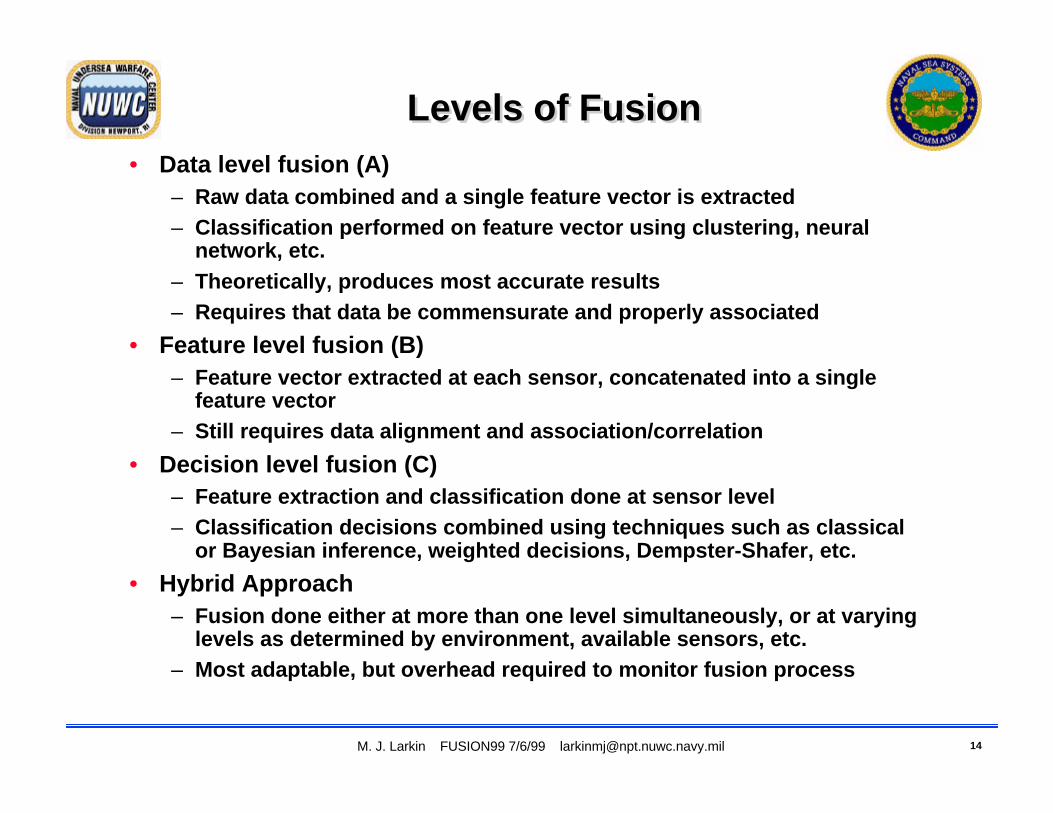
Levels of FusionLevels of Fusion• Data level fusion (A)
– Raw data combined and a single feature vector is extracted– Classification performed on feature vector using clustering, neural
network, etc.– Theoretically, produces most accurate results– Requires that data be commensurate and properly associated
• Feature level fusion (B)– Feature vector extracted at each sensor, concatenated into a single
feature vector– Still requires data alignment and association/correlation
• Decision level fusion (C)– Feature extraction and classification done at sensor level– Classification decisions combined using techniques such as classical
or Bayesian inference, weighted decisions, Dempster-Shafer, etc.
• Hybrid Approach– Fusion done either at more than one level simultaneously, or at varying
levels as determined by environment, available sensors, etc.– Most adaptable, but overhead required to monitor fusion process
M. J. Larkin FUSION99 7/6/99 [email protected] 15
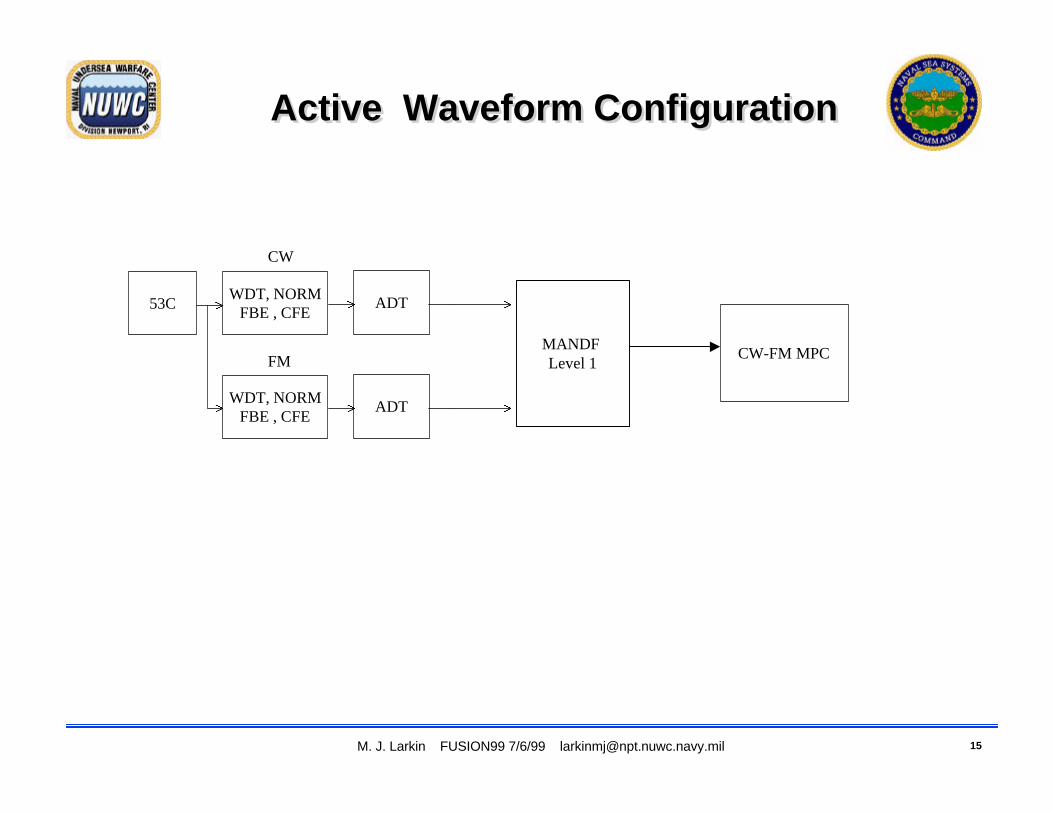
Active Waveform ConfigurationActive Waveform Configuration
53CWDT, NORM
FBE , CFEADT
WDT, NORMFBE , CFE
ADT
CW
FMMANDF Level 1
CW-FM MPC
M. J. Larkin FUSION99 7/6/99 [email protected] 16
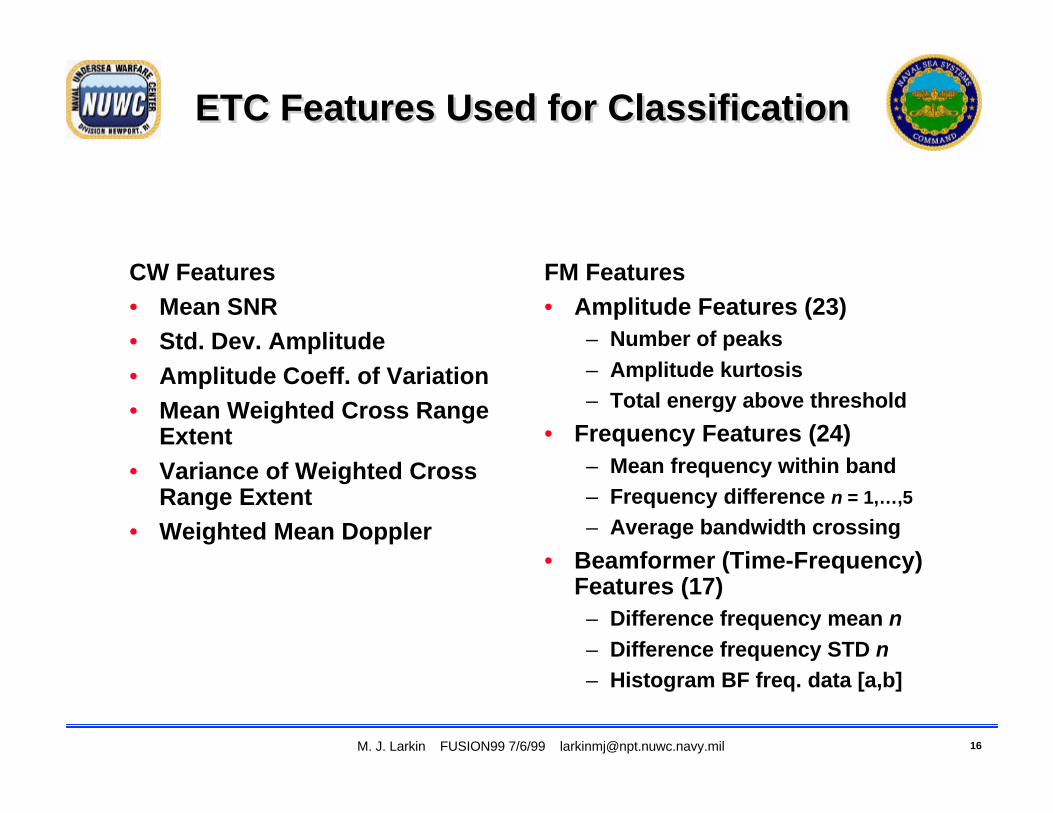
ETC Features Used for ClassificationETC Features Used for Classification
CW Features• Mean SNR• Std. Dev. Amplitude• Amplitude Coeff. of Variation• Mean Weighted Cross Range
Extent• Variance of Weighted Cross
Range Extent• Weighted Mean Doppler
FM Features• Amplitude Features (23)
– Number of peaks– Amplitude kurtosis– Total energy above threshold
• Frequency Features (24)– Mean frequency within band– Frequency difference n = 1,…,5
– Average bandwidth crossing
• Beamformer (Time-Frequency)Features (17)– Difference frequency mean n– Difference frequency STD n– Histogram BF freq. data [a,b]
M. J. Larkin FUSION99 7/6/99 [email protected] 17
Feature-Based Sequential ClassifierFeature-Based Sequential Classifier
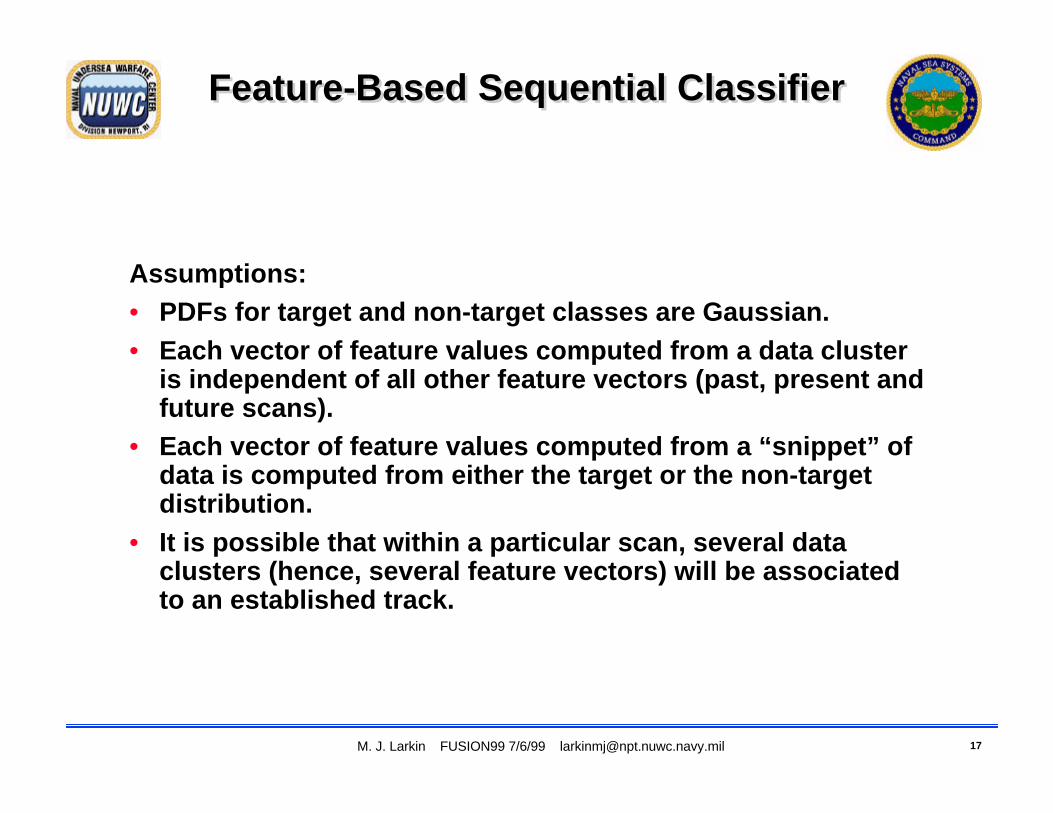
Assumptions:• PDFs for target and non-target classes are Gaussian.• Each vector of feature values computed from a data cluster
is independent of all other feature vectors (past, present andfuture scans).
• Each vector of feature values computed from a “snippet” ofdata is computed from either the target or the non-targetdistribution.
• It is possible that within a particular scan, several dataclusters (hence, several feature vectors) will be associatedto an established track.
M. J. Larkin FUSION99 7/6/99 [email protected] 18
Feature-Based Sequential ClassifierFeature-Based Sequential Classifier
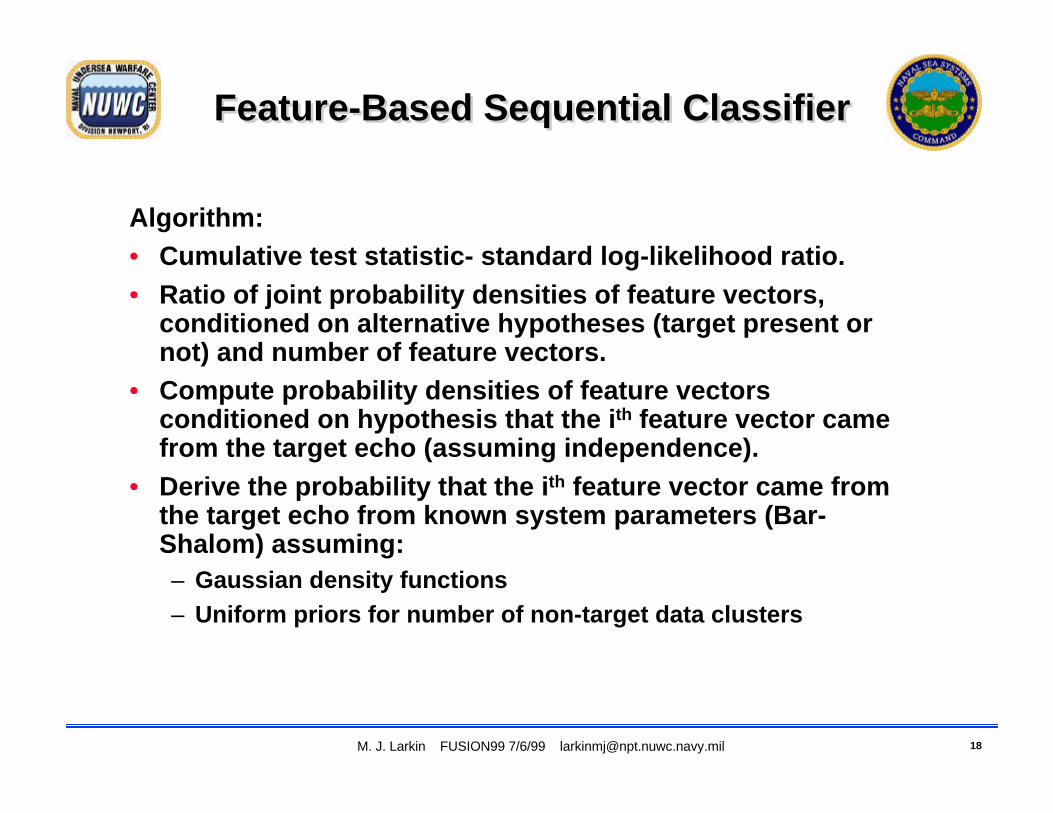
Algorithm:• Cumulative test statistic- standard log-likelihood ratio.• Ratio of joint probability densities of feature vectors,
conditioned on alternative hypotheses (target present ornot) and number of feature vectors.
• Compute probability densities of feature vectorsconditioned on hypothesis that the ith feature vector camefrom the target echo (assuming independence).
• Derive the probability that the ith feature vector came fromthe target echo from known system parameters (Bar-Shalom) assuming:– Gaussian density functions– Uniform priors for number of non-target data clusters
M. J. Larkin FUSION99 7/6/99 [email protected] 19
Feature-Based SequentialClassifier - Algorithm (cont.)Feature-Based Sequential
Classifier - Algorithm (cont.)
∏
∏
∏
∑
∑
=
=
≠
=
=
=
=
=
=Θ
Θ
ΘΘ=
=
=
)(
1
00
)(
1
0
01
1
1
)(
0
11
1 0
1
0
1
)(1
)|)(())(,|)((
0for )|)((
)(,,1for )|)(()|)((
)),(,|)((
echo. target thefrom computed s vector wafeature th that thehypothesis thedenotes where
))(,|()),(,|)(())(,|)((
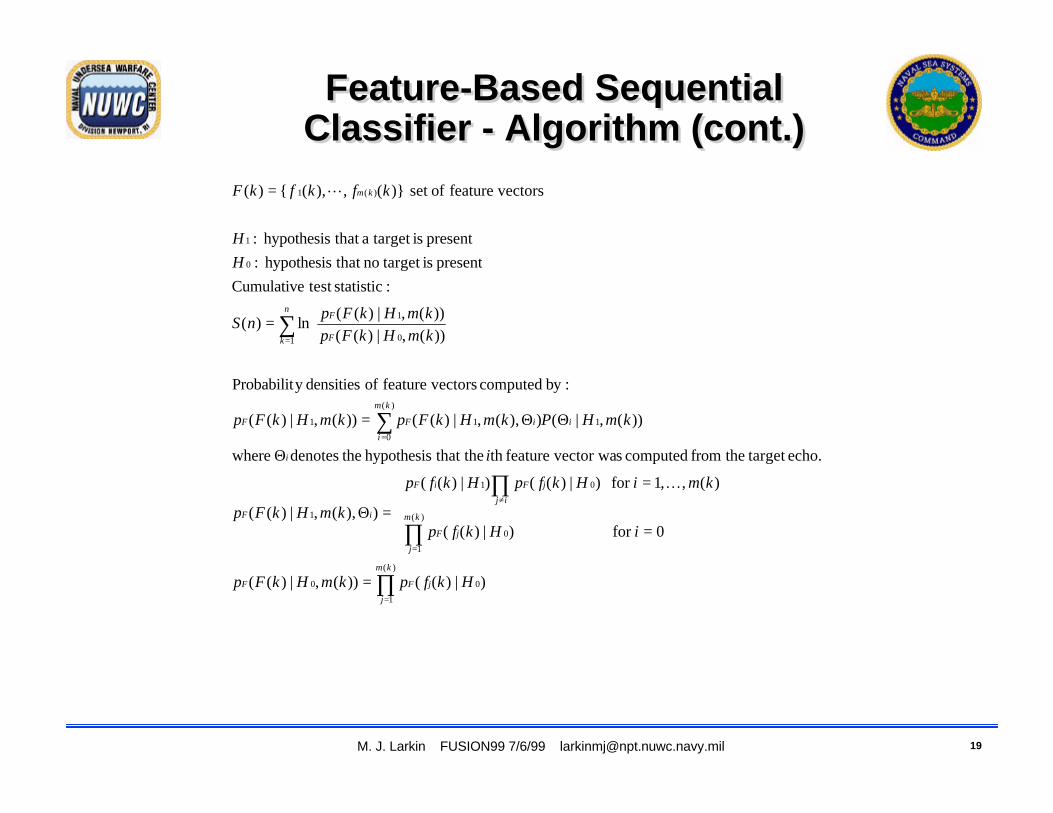
:by computed vectorsfeature of densitiesy Probabilit
))(,|)((
))(,|)((ln)(
:statistic test Cumulative
present is target no that hypothesis :
present isa target that hypothesis :
vectorsfeature ofset )}(,),({)(
km
j
jFF
km
j
jF
ij
jFiF
iF
i
i
km
i
iFF
n
k F
F
km
HkfpkmHkFp
iHkfp
kmiHkfpHkfp
kmHkFp
i
kmHPkmHkFpkmHkFp
kmHkFp
kmHkFpnS
H
H
kfkfkF
K
L
M. J. Larkin FUSION99 7/6/99 [email protected] 20
Feature-Based SequentialClassifier - Algorithm (cont.)Feature-Based Sequential
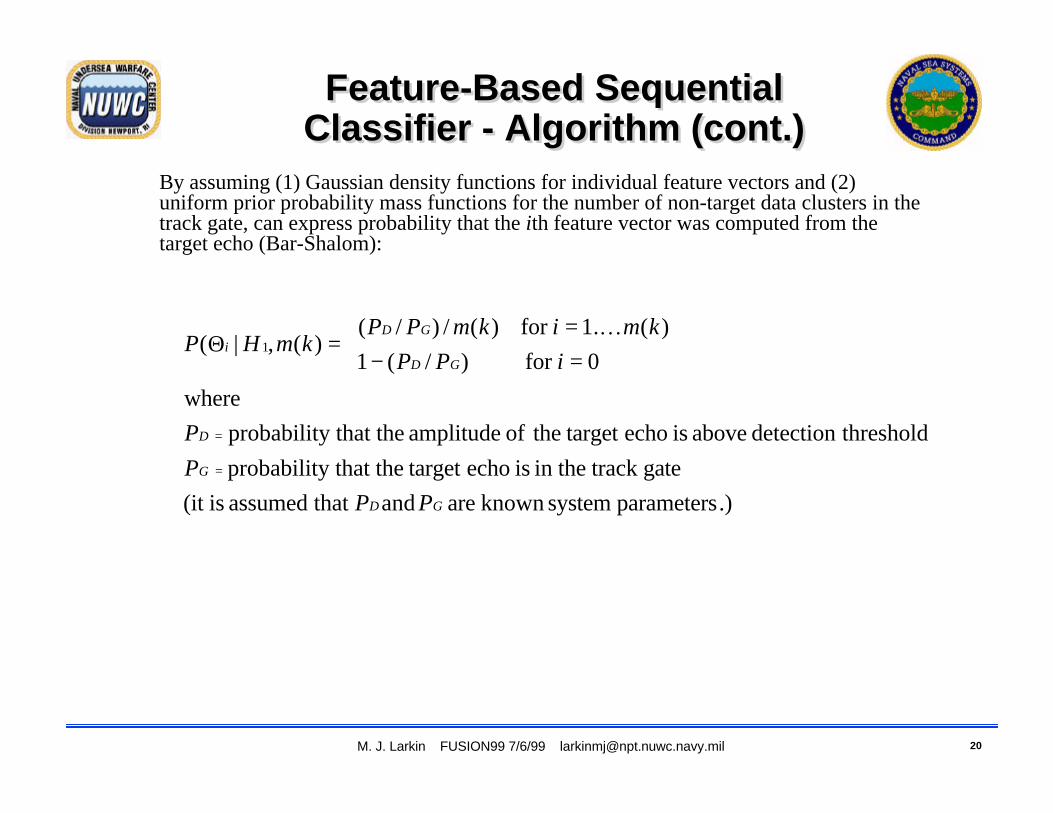
Classifier - Algorithm (cont.)• By assuming (1) Gaussian density functions for individual feature vectors and (2)
uniform prior probability mass functions for the number of non-target data clusters in thetrack gate, can express probability that the ith feature vector was computed from thetarget echo (Bar-Shalom):
.)parameters system known are and that assumed is(it
gate track thein is echo target y that theprobabilit
thresholddetection above is echo target theof amplitude y that theprobabilit
where
0for )/(1
)(.1for )(/)/()(,|(
1
GD
G
D
GD
GDi
PP
P
P
iPP
kmikmPPkmHP
=
=
=−=
=ΘK
M. J. Larkin FUSION99 7/6/99 [email protected] 21
Feature-Based SequentialClassifier - Algorithm (cont.)Feature-Based Sequential
Classifier - Algorithm (cont.)
+−
+−=
+
=
=
∏
∏ ∑ ∏
∑
∑
=
= = ≠
−
=
=
)(
1
0
)(
1
)(
1
010
0
11
1 0
1
1 0
1
)|)((
)|)(()|)(()(/()|)(()1(
ln)1(
))(,|)((
))(,|)((ln
))(,|)((
))(,|)((ln
))(,|)((
))(,|)((ln)(
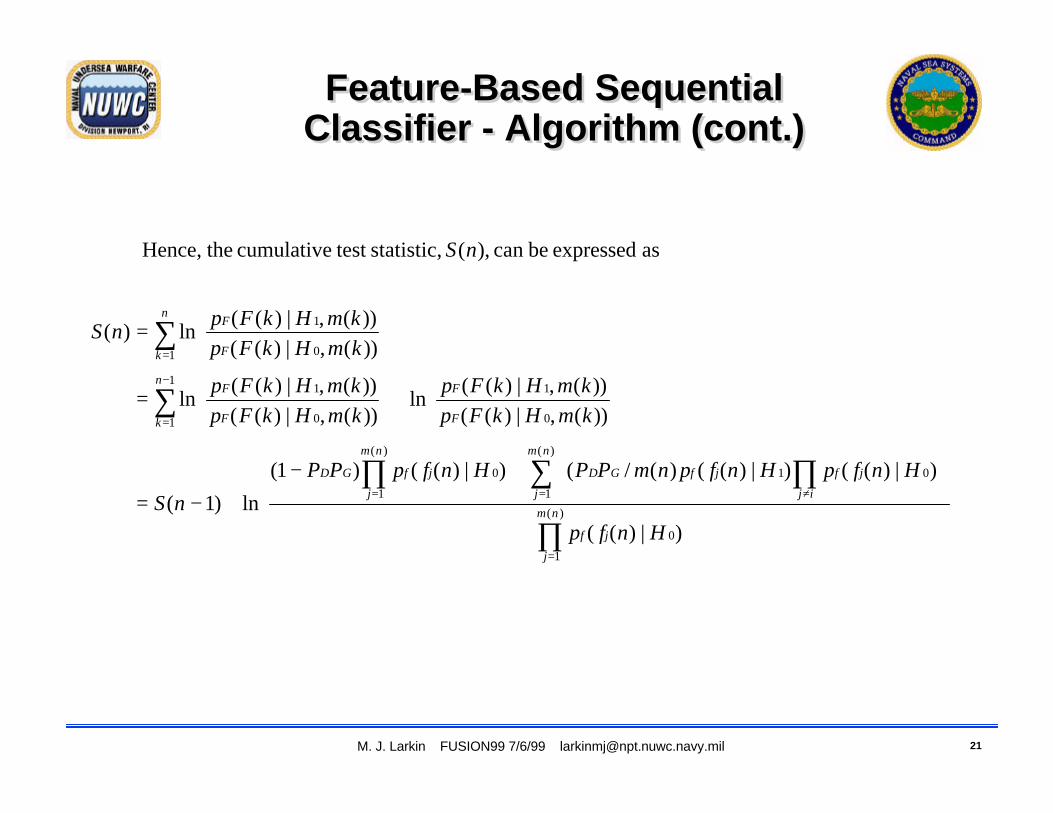
as expressed be can ,)( statistic, test cumulative theHence,
nm
j
jf
nm
j
nm
j ij
jfjfGDjfGD
F
Fn
k F
F
n
k F
F
Hnfp
HnfpHnfpnmPPHnfpPP
nS
kmHkFp
kmHkFp
kmHkFp
kmHkFp
kmHkFp
kmHkFpnS
nS
M. J. Larkin FUSION99 7/6/99 [email protected] 22
Extension of Sequential Classifier toMultiple Waveform Classification
Extension of Sequential Classifier toMultiple Waveform Classification
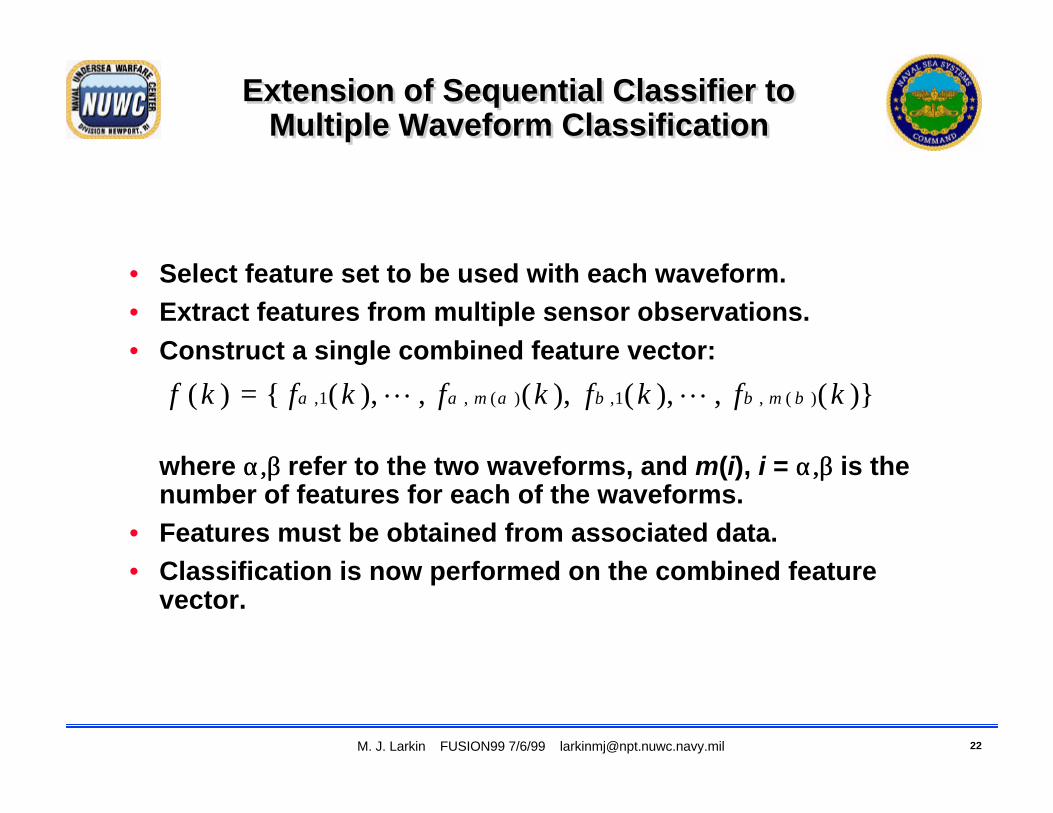
• Select feature set to be used with each waveform.• Extract features from multiple sensor observations.• Construct a single combined feature vector:
where α,β α,β refer to the two waveforms, and m(i), i = α,β α,β is thenumber of features for each of the waveforms.
• Features must be obtained from associated data.• Classification is now performed on the combined feature
vector.
)}(,),(),(,),({)( )(,1,)(,1, kfkfkfkfkf mm βββααα LL=
M. J. Larkin FUSION99 7/6/99 [email protected] 23
Multi-Sensor Classifier - Current ResultsMulti-Sensor Classifier - Current Results
• Implemented with simulated data to demonstrate efficacy ofapproach.
• Joint probability density functions of feature vectorsestimated from sample means/covariances of SWADC data.
• Testing on real data will be initiated this FY.• Multiple waveform data is presently available, and data will
be associated by MANDF.
M. J. Larkin FUSION99 7/6/99 [email protected] 24
Multi-Sensor Classifier - Future DirectionsMulti-Sensor Classifier - Future Directions
• Assess sensitivity of classification probability and false alarmrate to threshold setting.
• Finalize feature selection.
• Evaluate classifier with real data.
• Measure performance.
• Determine the value added by implementation of the multiplewaveform classifier.