information package design - balanced · pdf fileinformation package design an excerpt from...
TRANSCRIPT

Information Package Design an excerpt from the book – Data Warehousing on the Internet: Accessing the Corporate Knowledgebase ISBN #1-8250-32857-9 by Tom Hammergren

2
The following excerpt is provided to assist you in better understanding the concepts behind Balanced Insight’s Approach (Information Packaging). The Information Packaging Method has been developed starting in 1989 and this continues to evolve through various customer engagements. For additional information, contact us directly or purchase a copy of one of our publications:
Data Warehousing: Building the Corporate Knowledgebase by Tom Hammergren ISBN: 1-850-32856-0
Data Warehousing on the Internet: Accessing the Corporate Knowledgebase by Tom Hammergren ISBN: 1-850-32857-9

3Balanced Insight, Inc. - Confidential
3 - INFORMATION MODELING A majority of data warehouses today are working with dimensional data; business data by nature is dimensional. The information packaging methodology comprises techniques that greatly assist you in understanding how to model and package this dimensional business data for your data warehouse implementations, because it focuses on the dimensional nature of business data. For example, if you were a sales manager for cola products within the Midwest, you might want to understand key measurement data about your area. Figure 3.1 breaks out the information package, often referred to as a data cube, for the following business dimensions:
The time period dimension, which is isolated on the month of January The product dimension, which is isolated on the Cola Drink product family
The geography dimension, which is isolated on the Cincinnati area
Figure 3.1: A view of product sales information across three distinct dimensions–time, product, and geography. Based on these slices of the overall data, the user can evaluate the units sold and associate revenue for cola products sold in Cincinnati for the month of January.
This data cube allows the user to better understand how well cola drinks sold in the Cincinnati territory during the month of January. As you can see, three dimensions are associated with this data--time, product, and geography—hence, the statement that business data tends to be dimensional. The information packaging methodology offers techniques that are open to many technical architecture implementations of data warehouses and decision support databases. As you will see in the sections that follow, the information package methodology offers a uniform and complete method that covers the complete development life cycle, from data gathering techniques through to data delivery.

4Balanced Insight, Inc. - Confidential
An information model is typically a representation of the data structure that is used in some segment of a business. Information models become part of the overall information architecture in a company. These models are particularly useful in documenting the data resources in the organization. The models provide a basis for planning and designing new information systems, or in the case of a data warehouse, subject-oriented data warehouses. The ultimate benefits derived from the information packaging methodology include as follows:
Data consistency and availability. A stable, integrated data structure results in consistent data that can support any user need. Because the data definitions are shared by all users, it can be easily accessed. Though your enterprise may go through organizational changes or experience employee turnover, the data remains stable. The result is data documentation for the entire data warehouse.
Cost-effective systems development and maintenance. Perhaps the most significant benefit is cost-effective systems development and maintenance. Information models act as a neutral buffer between applications and the databases that are developed. When properly built, the models are independent enough that changes to the design through the model can expedite a revamping of internal interfaces. This process results in better systems design, because the systems are based on a stable data structure.
Level of Refinement The information packaging methodology focuses on several different levels or cuts of the information models that are derived during the process of building a data warehousing system. As shown in Figure 3.2, each level is essentially a refinement or more detailed version of the previously developed data model.
Figure 3.2: The information packaging methodology (IPM) focuses on several diverse cuts of the overall information model managed in a data warehousing system, including a conceptual layer that is more in line with the user’s view of information packages, all the way to a detailed technical mapping of this model.

5Balanced Insight, Inc. - Confidential
By working through multiple levels of detail during design of a data warehousing system, your project team builds in quality and delivers subject-oriented data warehouses that more closely align with what the users have requested. Some of the other benefits of the information packaging methodology include the following:
A more precise representation of data. The refinement of data models continually provides a more precise representation of the data that is involved in delivering a data warehouse.
Planning for project deliverables. As the process unfolds, enough analysis will be completed to plan complete implementation and deployment schedules. These models will verify, and in many ways guarantee, that the data models and their associated subject-oriented data warehouses will be successfully integrated and reused.
Discovery and validation. The refinement of data models also is the beginning of work on an overall integration of an enterprise data warehouse. The greater the detail is, the better is the understanding of that which the future environment will consist. This process will also assist in the discovery and validation of previously developed work breakdown structures and activity plans.
The Information Package Diagram The first and most generalized level of an information model is its information package diagram. This model focuses on the data gathering activities for the users’ information packaging requirements. An information package diagram defines the relationships between subject matter and key performance measures. The information package diagram has a highly targeted purpose, providing a focused scope for user requirements. Because information package diagrams target what the users want, they are effective in facilitating communication between the technical staff and the users, indicating any inconsistencies between the requirements and what the data warehouse will deliver. Figure 3.3 presents an information package diagram that captures the relevant information model, allowing users to evaluate and analyze sales performance. We will further investigate this information package diagram later in this chapter in the section “Data Gathering through Information Package Diagrams.”

6Balanced Insight, Inc. - Confidential
Figure 3.3: This information package diagram depicts user requirements for performing sales analysis. It allows users to evaluate sales metrics by time, product, location, and customer demographics.
The Star Schema Data Model with IPM Notation The second level of an information model is a star schema with the information packaging methodology (IPM) notation set, which adds refinement to the structure of the data. Entities are defined and characterized with specific purposes to assist users. These entities are characterized as follows: measure entities with fact-based content, dimension entities with navigational content, and category detail entities with subject-descriptive content. Also, a star schema begins to define attributes, or columns, that are contained in each of the major entities and the relationships among those entities. A star schema data model provides more depth in preparation of fully defining the physical data entities. Again, this design is validated with the user community to clarify the process of decision-oriented data and the requirements for additional supporting data, further detailing the original information package diagram. The star schema representing the information contained in Figure 3.3’s information package diagram is presented in Figure 3.4. We will further investigate the star schema data model later in this chapter.

7Balanced Insight, Inc. - Confidential
Figure 3.4: This star schema presented with the information packaging methodology notation set depicts the logical model for the information package diagram in Figure 3.3. The information packaging methodology notation set applies a common set of colors and shapes to entities, allowing the design team to better communicate the purpose of individual entities in the information model.
The Physical Data Model The third level of a data model is a fully attributed data model, which becomes part of an enterprise’s information architecture. The star schema data model should be used as a foundation for physical database design and implementation, because it specifies what data should be included and the relationships among these entities. This data model represents an information

8Balanced Insight, Inc. - Confidential
package in the greatest amount of depth and detail. The physical data model representing the information contained in Figure 3.3’s information package diagram is presented in Figure 3.5. We will further investigate how to finalize the physical data model later in this chapter in the section titled “Building the Physical Model”.
Figure 3.5: This physical data model depicts the physical model for the information package diagram in Figure 3.3. The transformation that occurs between the logical data model and physical data model follows a fairly traditional normalization process. Many of the unique modeling transformations within a data warehouse include the denormalization of entities such as dimensions. My experience has been that de-normalization of the operational

9Balanced Insight, Inc. - Confidential
tables provides useful data warehouse objects without requiring a lot of manipulation from the client application. While de-normalization can be at times controversial with database purists, the price of disk is quickly becoming an insignificant cost, and the results of de-normilzation include a more useful product for the user. Not to mention the performance savings you will experience by avoiding dynamic or user defined joins! This final model will optimize the data warehousing system’s ability to perform queries to fulfill the user requirements.
Data Gathering Through Information Package Diagrams Data gathering within the information packaging methodology is performed with an information package diagram. This tool assists an analyst in gathering the user requirements for an information package. An information package diagram provides a common, consistent, and coherent design and communication tool. This diagram conveys the right information at the right time to those who understand its purpose. It models a user’s required information package. The information package diagramming technique is a productive way to define and communicate user business query requirements, or information package requirements. The information package diagram assists in performing the following tasks:
Defining the common dimensions utilized in a business, such as time, customer, geography, and product
Designing key business measures that can be tracked to determine how a business is performing and operating
Deciding how data should be presented to the user of a warehouse
Determining how the user aggregates, or rolls up, data along common hierarchies
Deciding how much data is involved in a user’s analysis or query
Defining how data will be accessed, what its entry points are, where the user wants to go, and how the data will be navigated
Establishing data granularity
Estimating the size of a warehouse
Determining the frequency of refreshing the data in a data warehouse
Formulating how information should be packaged for distribution to the user
An information package diagram presents the conceptual definition of the users’ required information package. A blank information package diagram is shown in Figure 3.6. Note the line at the top of the information package diagram is used to write a unique information package description. You may choose to augment this description with a summary description, detail description, or both to identify what the information package diagram describes. From there, you work with users to further define and describe the proper packaging of data warehouse information.

10Balanced Insight, Inc. - Confidential
Figure 3.6: An information package diagram for gathering user requirements in the conceptual data modeling phase of the information packaging methodology. In the remaining sections of this chapter, we will analyze, dissect, and formulate an information package for the following user requirement:
Users of a data warehouse need to see product revenues detailed by demographic information about their customers; these demographics include age, gender, and economic class. This information should be presented by the users’ store locations and present product sales information for the last five years. The product sales information should include revenues presented in budget, forecast, and actual figures.
Defining Key Performance Measures A measure (also referred to as a key performance measure, a fact, a key business measure, or an indication) is a piece of data that measures business information along dimensions. Measures are typically quantities, capacities, or money that are ascertained by comparison with a standard. These data points are used for the quantitative comparison of business performance. For example, product revenues in dollars, wasted raw materials in pounds, new minority hires as a count, or plant up time in hours are measures. In the user requirement described above, the measures included:
Budget revenue from product sales
Forecast revenue from product sales
11Balanced Insight, Inc. - Confidential
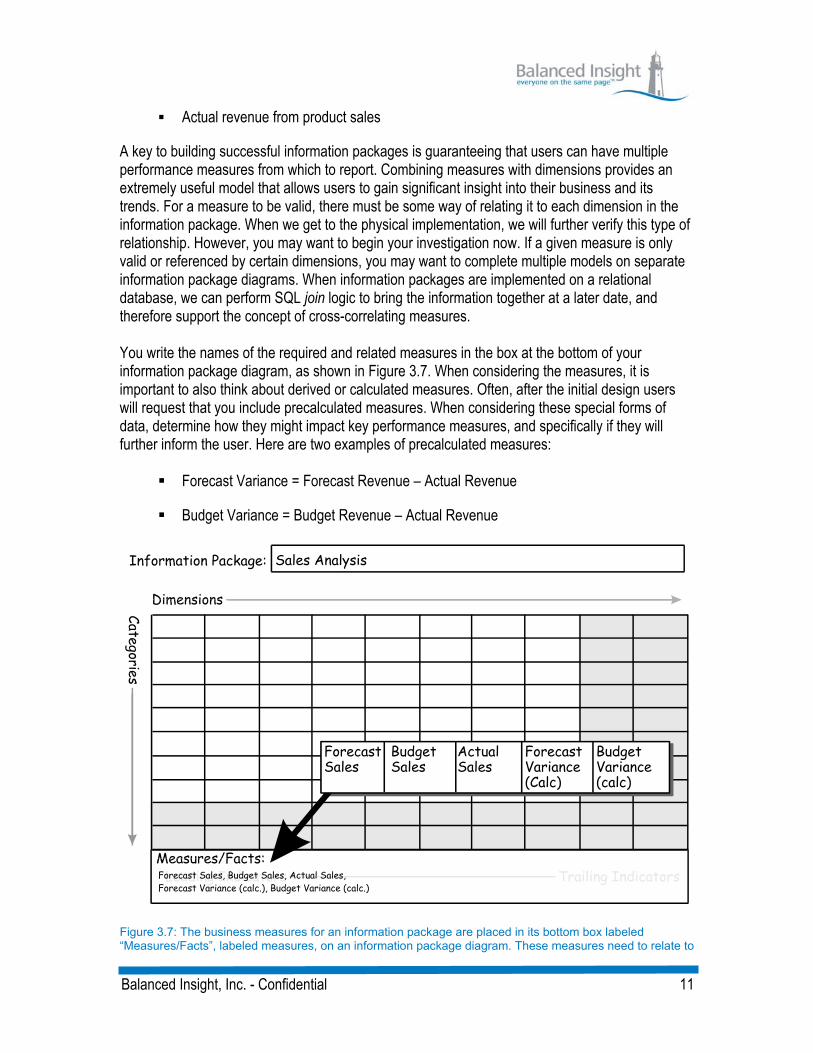
Actual revenue from product sales
A key to building successful information packages is guaranteeing that users can have multiple performance measures from which to report. Combining measures with dimensions provides an extremely useful model that allows users to gain significant insight into their business and its trends. For a measure to be valid, there must be some way of relating it to each dimension in the information package. When we get to the physical implementation, we will further verify this type of relationship. However, you may want to begin your investigation now. If a given measure is only valid or referenced by certain dimensions, you may want to complete multiple models on separate information package diagrams. When information packages are implemented on a relational database, we can perform SQL join logic to bring the information together at a later date, and therefore support the concept of cross-correlating measures. You write the names of the required and related measures in the box at the bottom of your information package diagram, as shown in Figure 3.7. When considering the measures, it is important to also think about derived or calculated measures. Often, after the initial design users will request that you include precalculated measures. When considering these special forms of data, determine how they might impact key performance measures, and specifically if they will further inform the user. Here are two examples of precalculated measures:
Forecast Variance = Forecast Revenue – Actual Revenue
Budget Variance = Budget Revenue – Actual Revenue
Figure 3.7: The business measures for an information package are placed in its bottom box labeled “Measures/Facts”, labeled measures, on an information package diagram. These measures need to relate to
12Balanced Insight, Inc. - Confidential
all of the dimensions, or access paths, defined in the user requirements.
Defining Dimensions A dimension is a physical property, such as time, location, or product, that is regarded as a fundamental way of accessing and presenting business information. Consider two examples:
The time dimension comprises all days of the year, the weeks of the year, the months of the year, and possibly multiple years.
The location dimension comprises all cities in which your company has offices, the districts that contain those cities, the regions that contain those districts, and the countries that contain those regions.
A dimension typically acts as an index for identifying quantitative and qualitative data. We commonly think of standard reports that present rows and columns as two dimensional. A manager who is evaluating a budget may look at a two-dimensional spreadsheet containing accounts in the rows and cost centers in the columns. The intersecting point between the rows and columns, or a cell, contains relevant numeric information about the specific cost center and account, such as product development’s salary budget. It logically follows that multidimensional refers to information that is defined as, or accessed by, more than two dimensions. In a geometric world, the easiest description of a multidimensional entity is a cube. The cube has three dimensions: width, height, and depth. Surprisingly, most business models are actually represented in a multidimensional view. The budgetary example described above contains two dimensions, cost center and accounts. In reality, this example is missing a very important dimension, time. Most financial analysts evaluate their data with a minimum of these three dimensions. Pick up a publicly traded company’s annual report. Turn to the pages that give the overview of performance and you will see information about how the company has performed over time, typically three to five years. You will see graphs and charts representing important business measures, such as sales revenues, expenses, profit, stock performance, and earnings per share, tracked over multiple dimensions, such as time, product, and division. An information package diagram provides a technique for modeling user information in a multidimensional space. This design provides a visual representation of a business analyst’s mental model of an information package. This diagram provides a solid design that is both simple and fast. If you think of a Rubik’s Cube, solving the puzzle is similar to the way a business analyst moves through multidimensional data. Each analyst has a different way to twist and turn the cube until the desired result is found, much in the way that different people have different ways to solve the puzzle. In the user requirement described earlier, the measures included:
Products that are sold

13Balanced Insight, Inc. - Confidential
Age group of the customer
Gender of the customer
Economic class of the customer
Location of the sale to the customer
Time periods for the last five years
The dimensions can now be placed on an information package diagram, as shown in Figure 3.8. Remember, the dimensions are the high-level paths that the user requires to gain access to the measurement data. Each dimension presents a uniform access path into the information contained in the data warehouse. These dimensions also typically define a complete subject classification, or grouping of data, that will be used as reference material to support the key business measures. When defining dimensions, be careful to cover only the primary paths for the information; do not try to cover all of the possibilities.
Figure 3.8: The dimensions are placed in the top row of an information package diagram. The dimensions indicate how users traverse the data to understand the meaning contained in the measures of an information package. Each of the dimensions is written in a column of the first row of an information package diagram. To designate that this row contains the high-level dimension definition, utilize the word ALL. Example: ALL Time Periods and ALL Locations.

14Balanced Insight, Inc. - Confidential
Tip: When working with an information package diagram, try to minimize your access paths, or dimensions. This helps the user by simplifying the manner in which the data is obtained. Keep the number of dimensions within a reasonable number, such as under 10. This is not a fixed limit, and many information models require a larger number of dimensions. However, usability is hampered when you exceed this number. Usability should be the number one focus of your warehouse project. The shaded columns on an information package diagram remind you of this usability tip
Defining Categories Categories provide detail information for a given dimension. Often, these details are referred to as the aggregation levels or the hierarchy of the dimension because the information that comprises a dimension is typically hierarchical data that summarizes, or aggregates, upward. A category is a division specifically defined in a dimensional hierarchy that provides a detailed classification system. This discrete member of a dimension is used to identify and isolate specific data. For example, San Francisco and Western Region are categories in a location dimension. Similarly, December and Quarter 4 are categories in a time dimension. Following the definition of your key dimensions, you need to further define how the user will navigate to the detail information, or how the data will be aggregated. On an information package diagram, categories are contained in the cells of the dimension’s column. As shown in Figure 3.9, you should place the category’s name and an estimate for the number of data points represented by that category in the cell of your information package diagram. These numbers assist in many areas, including usability and data sizing.
Figure 3.9: Categories provide the detail required to build a complete dimension. The category levels define a hierarchy that will be important for assisting the user in filtering, aggregating, and visualizing key performance measures. This figure defines the categories for a time dimension.
You should keep the ratio of categories between levels reasonable. If the numbers becomes too high, you may want to insert an artificial level in the dimension hierarchy to refine navigation for the
15Balanced Insight, Inc. - Confidential
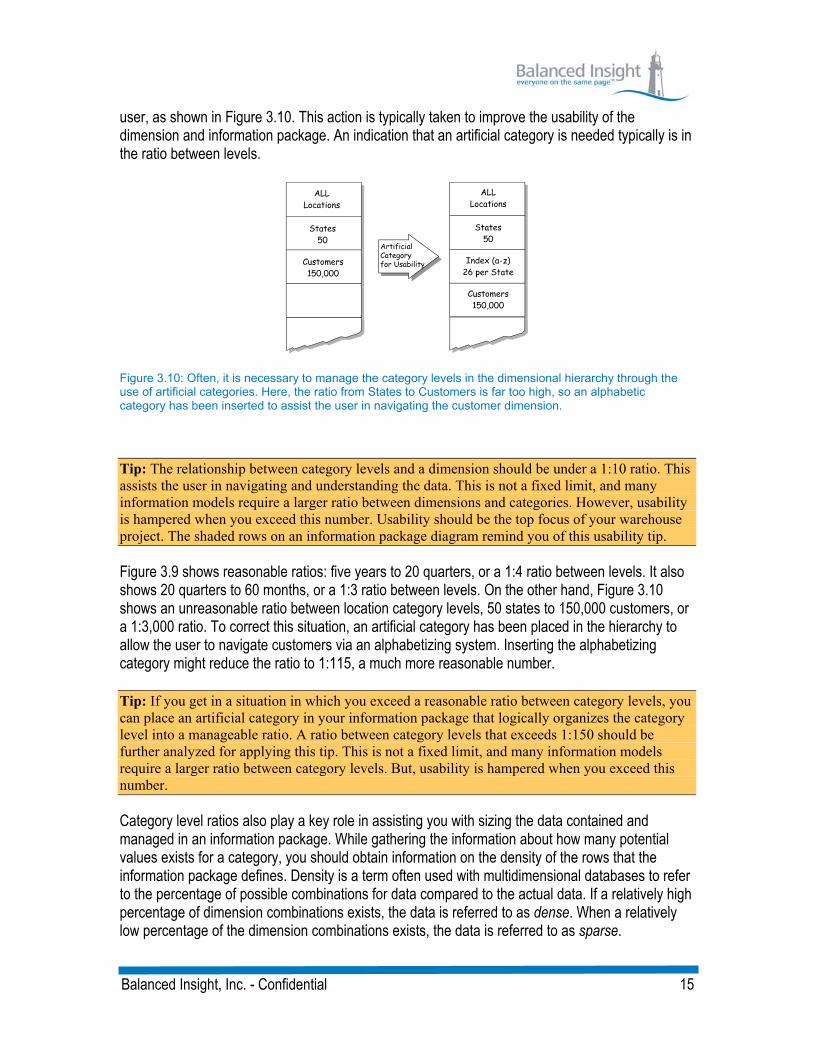
user, as shown in Figure 3.10. This action is typically taken to improve the usability of the dimension and information package. An indication that an artificial category is needed typically is in the ratio between levels.
Figure 3.10: Often, it is necessary to manage the category levels in the dimensional hierarchy through the use of artificial categories. Here, the ratio from States to Customers is far too high, so an alphabetic category has been inserted to assist the user in navigating the customer dimension.
Tip: The relationship between category levels and a dimension should be under a 1:10 ratio. This assists the user in navigating and understanding the data. This is not a fixed limit, and many information models require a larger ratio between dimensions and categories. However, usability is hampered when you exceed this number. Usability should be the top focus of your warehouse project. The shaded rows on an information package diagram remind you of this usability tip.
Figure 3.9 shows reasonable ratios: five years to 20 quarters, or a 1:4 ratio between levels. It also shows 20 quarters to 60 months, or a 1:3 ratio between levels. On the other hand, Figure 3.10 shows an unreasonable ratio between location category levels, 50 states to 150,000 customers, or a 1:3,000 ratio. To correct this situation, an artificial category has been placed in the hierarchy to allow the user to navigate customers via an alphabetizing system. Inserting the alphabetizing category might reduce the ratio to 1:115, a much more reasonable number. Tip: If you get in a situation in which you exceed a reasonable ratio between category levels, you can place an artificial category in your information package that logically organizes the category level into a manageable ratio. A ratio between category levels that exceeds 1:150 should be further analyzed for applying this tip. This is not a fixed limit, and many information models require a larger ratio between category levels. But, usability is hampered when you exceed this number.
Category level ratios also play a key role in assisting you with sizing the data contained and managed in an information package. While gathering the information about how many potential values exists for a category, you should obtain information on the density of the rows that the information package defines. Density is a term often used with multidimensional databases to refer to the percentage of possible combinations for data compared to the actual data. If a relatively high percentage of dimension combinations exists, the data is referred to as dense. When a relatively low percentage of the dimension combinations exists, the data is referred to as sparse.

16Balanced Insight, Inc. - Confidential
For example, an antique shop that contains products such as chairs, tables, books, pictures, artwork, and other rare collectibles is unlikely to sell all products in a given month. It follows that the intersection of time and product dimensions will be sparse, because many products in the inventory will not be sold each month. On the other hand, a grocery store with food products such as bread, vegetables, fruits, and snacks is likely to sell all products in a given month, turning over its inventory. The grocery store will therefore have a dense relationship between time and product dimensions, because each product will be sold in a month. Performance is greatly impacted by the size of an information package, because the size is a direct reflection of the number of data rows that must be read or scanned to obtain a result. Depending on how dense the data is that your information package diagram represents, you may choose to take action to minimize performance implications. These actions occur during the physical implementation of the data warehouse and include either utilizing software (indexing technology) or hardware (parallel processing) to minimize performance impact. Tip: Try to insert the numbers that represent the unique occurrences of a category value in your category cells. These numbers assist you in understanding the volume of potential data and the relationships on types of data that could greatly impact the size of your warehouse. This data assists you if you need to split an information package in the future.
Figure 3.11 demonstrates an information package diagram through the category definition phase. Each dimension is listed in the column headings. The cells that comprise a column are filled with their associated category title and the number of unique occurrences that will potentially exist in the information package. At the bottom of the information package diagram, the key measures or facts that are important to the user are also listed. This information package, as stated early in this chapter, represents business data in a dimensional--or more specifically, multidimensional--fashion. Someone who desires to analyze the data can now look across six dimensions (time, location, product, age group, economic class, and gender) and evaluate business measures (forecast sales, budget sales, actual sales, and their associated variances).

17Balanced Insight, Inc. - Confidential
Figure 3.11: After you have a clear understanding of the categories and levels of a dimensional hierarchy, you place them in the cells underneath the dimension on an information package diagram.
The detail required by users for proper analysis and reporting of data determines how many categories you define. It isn’t necessary that the levels in each dimension be perfectly balanced. Balanced means that every dimension is represented with even hierarchies that provide the same level of detail. For example, a time period dimension that is represented by a hierarchy made up of year, quarter, and month would be balanced if each measurement was represented down to the month. This is often not the case. In fact, it is quite typical that the data is unbalanced. For example, the business may desire the measurement data to be represented to the month for two trailing years and to the quarter for the prior three years. Make sure to capture the potential levels required and make sure to document any anomalies along the way. They may become more important as you near physical implementation of your data warehouse.
Defining Multiple Hierarchies or Access Paths Often, users request relative categories. These are categories that change in definition relative to the moment that the information is queried. Again, the best example involves time periods. The definitions that we have shown for time comprise a clean hierarchy of year to quarter to month. Now, let’s say that your user desires to see multiple hierarchy definitions pointing to the data, such as day of the week (Monday through Sunday), holiday business (Easter, Christmas, Fourth of July), month to date, quarter to date, year to date, or last 90 days. When you gather the information, you want to document these special definitions in a chart, as shown in Figure 3.12. In your information package diagram, clearly document the primary access path; this is the access path that will be predominately used. However, other access paths should

18Balanced Insight, Inc. - Confidential
be defined on the dimensional access path diagram, as shown in Figure 3.12. These multiple access paths will be important during physical data definition.
Figure 3.12: Often, a dimension contains multiple hierarchies, or access paths, allowing the user to slice or aggregate the data in different ways. This dimensional access path diagram demonstrates the multiple access paths supported in the time dimension.
Another multiple access path example, which often occurs in sales analysis, is redefining the location dimension by physical geography as well as by management structures. In this situation, it may not initially be clear whether this will be two separate dimensions or the same dimension with multiple access paths. Document this and move on. Research from other information packages may resolve the issue. If, after you complete all of your information package diagrams, this has not been resolved, experiment with giving the data separate dimensions versus multiple access paths. Let the user be the ultimate judge through the user interface.
Define Category Details In an information package diagram, each cell in a dimension is a category and represents an isolated level that might require more detail information to fulfill a user’s information package requirements. The detail information required by a user typically includes textual matter that supports the measurement data and provides more detail or qualitative information to assist in the decision making process. In an information package diagram, those categories that require more detail data should be indicated by shading the designated cell, highlighting it for further analysis in the information modeling refinement process, as shown in Figure 3.13.

19Balanced Insight, Inc. - Confidential
Figure 3.13 Often, a category points to measurement data, a level in a dimension hierarchy and additional textual, or qualitative data. This type of category should be clearly indicated as a category detail entity. This figure demonstrates such a category--a client category detail entity in the ALL Clients dimension.
Logical Data Modeling: Star Schema Design with IPM Notation Data warehouses are best modeled with a technique known as star schema modeling. The star schema is optimized for query-based activities versus traditional database modeling techniques such as normalized schema models. Normalized schema models contain natural entities and their associated relationships. However, they provide an irregular structure for query processing and user comprehension. By contrast, star schema models define data entities in a way that supports the decision makers’ view of the business as well as the data entities that reflect the important operational aspects of a business. This is because a star schema contains three logical entities: dimension, measure, and category detail entities. A star schema is optimized to queries, therefore providing a database design that is focused on rapid response to the users of a system. Also, the design that is built from a star schema is not as complicated as traditional database designs. Hence, the model also is more understandable by users of a system. Users can better understand the navigation paths available to them through interpreting a star schema. This logical database design’s name hails from a visual representation derived from the data model: It forms a star, as shown in Figure 3.4. In the information packaging methodology, the information package diagrams provide the conceptual basis for a logical star schema and allow for the star schema to be easily generated. The star schema defines the join paths for how users access the facts about their business or the information packages defined in information package diagrams.
Entities in a Star Schema A star schema, like the data warehouse it models, contains three types of logical entities: measures, dimensions, and category details. Each of these entities performs a specialized function. When modeling an information package, it is important to graphically represent each

20Balanced Insight, Inc. - Confidential
entity in your logical data model. Traditional data models do not utilize the power of a graphical model to depict anything; they simply organize the information into entities (boxes) and relationships (arrows). No significance is placed on how the entities are drawn graphically and what functionality the entity provides to the overall model. When detailing a data model in the information packaging methodology, we utilize the graphical symbols and colors depicted in Figure 3.14 for each mentioned entity.
Figure 3.14: Symbols and colors for graphically representing data warehouse logical entities is a unique feature of the information packaging methodology. The star schema with IPM notation allows developers and sophisticated users to clearly understand the purpose and functionality provided by each entity within any information package modeled. A measure entity should be depicted in blue, a dimension entity in yellow, and a category detail entity in red.
These symbols show common characteristics for the entities that they represent. You will find in modeling a star schema that a business has many common dimensions, measures, and category details. As a result, the stars begin to collide and overlap. This problem makes it difficult to present a star schema at the enterprise level. However, with an information package diagram, a conceptual model of user requirements, the star schema model for logically depicting the data models, and common entity characteristics, you can simplify your data models for analysis purposes with the information packaging methodology notation set (IPM notation) shown in Figure 3.14. With these graphical representations, your project team and sophisticated users can visually understand the information package managed by a data warehouse, its associated entities, and the functions of each entity.
Measure Entities The information package diagram represented in Figure 3.11 is a good starting point for understanding a measure entity. This information package diagram defines a sales analysis information package. In a star schema, the center of the star--and often the focus of users’ query activity--is the measure entity, the low-level contents of an information package modeled in an information package diagram. The data contained in a measure entity is factual information from which users derive business intelligence. This data is therefore often given synonymous names to measure, such as key business measures, facts, metrics, performance measures, and indicators. The measurement data provides users with quantitative data about a business. As stated earlier, this data is numerical information that the users desire to monitor, such as dollars, pounds,

21Balanced Insight, Inc. - Confidential
degrees, counts, and quantities. These key indicators allow users to look into their corporate knowledge base and understand the good, the bad, and the ugly of the business processes being measured. The data contained in measure entities grows large over time and therefore is typically of greatest concern to your technical support personnel, database administrators, and system administrators. As an example of data’s potential for growth, imagine the largest retail store’s cash register receipts in one of these entities--that is a lot of data! A measure entity is where this type of data will be managed in a data warehouse. Within IPM notation, a measure entity is represented by a rectangle shaded in blue, and placed in the center of a star schema diagram, as shown in Figure 3.15. The placement in the center of the star is due to this entity’s focus; the measurement data will be contained in a majority of the user’s query activity. Though the transformation from an information package diagram to a star schema presents a logical data model, these entities will typically become physical entities in a data warehouse as we refine the information model.
Figure 3.15: In the information packaging methodology, the measure entity is placed in the center of a star schema and utilizes a blue rectangle in IPM notation
A measure entity represents a set of related facts, and often corresponds to a real-world transaction or an event such as a shipment or sale. The measure entity typically represents a summary level of a real-world transaction and is related to just one point in every associated dimension. Characteristics of a measure entity include the following:
Provides a primary focus for quantitative data, business measure data, or factual data
Contains numerous access paths, dimensions, or pointers into measurement data
Encompasses relatively normalized data

22Balanced Insight, Inc. - Confidential
Comprises the lowest categories in each dimension and the measures from an information package diagram
Can grow to become very large tables
Will be the heart and soul of analytical activity
Dimension Entities Dimension entities are much smaller entities than measure entities. The dimensions and their associated categories, or hierarchies, allow users of a data warehouse to browse measurement data with ease and familiarity. These entities assist users in minimizing the rows of data returned during queries from within a measure entity, and the dimension entity also assists users in aggregating key measurement data. Both of these tasks are required to fulfill a user’s information request. In that sense, these entities filter data or force the server to aggregate data so that fewer rows are returned from measure entities. In IPM notation, the dimension entities are represented as the points of a star schema. Dimension entities are utilized by users of a data warehouse as navigational aides to filter and aggregate data in measure entities. In IPM notation, a dimension entity is graphically represented by the traditional flow chart symbol for filtering, shaded in yellow. In Figure 3.16, the time, location, product, age group, gender, and economic class dimensions demonstrate the proper notation. This visual representation of the dimension entity correlates to the entity’s major function of restricting the result set rows returned from user query activity. But, as will be demonstrated later, dimension entities also form a common link between entities of a data warehouse, including measure-to-measure relationships and measure-to-category detail relationships.

23Balanced Insight, Inc. - Confidential
Figure 3.16: A dimension entity is placed at the points of a star in the information packaging methodology and utilizes a yellow diamond, or filter symbol, in IPM notation.
Characteristics of a dimension entity include the following:
Represents the dimensional hierarchy
Has primary foci of navigation and filtering measure entities
Encompasses relatively denormalized entities
Contain codes, or keywords, and their related description for an entire dimensional hierarchy
Maps to the columns of an information package diagram
Are typically small tables when physically implemented
Provides the gateway to a data warehouse
Is often used to fill pick lists, such as list combo boxes, in front-end graphical applications
Category Detail Entities In an information package diagram, each cell in a dimension is a category and represents an isolated level in a dimension that might require more detail information to fulfill a user’s information package requirements. Those categories that require more detail data are managed in category detail entities. These entities have textual matter that supports the measurement data and provides more detail or qualitative information to assist in the decision making process. Category detail entities, such as measure entities, typically translate into a physical database table. These entities map relatively cleanly to transaction database structures and may in fact be mapped that way to a data warehouse in situations where the transaction database can support query loads. (This circumstance is infrequent.) A category detail entity corresponds to a real-world entity or object, such as a customer, store, or market. These entities contain data that provides more qualitative information to users and assists in supporting the decision making process. The stop sign symbol, shaded in red, graphically depicts these entities, as show in Figure 3.17. This visualization tool has been chosen because users typically flow through the dimension entities to get the measure entity data, then stop their investigation with supporting category detail data.

24Balanced Insight, Inc. - Confidential
Figure 3.17: A category detail entity is placed on the perimeter of a star schema, outside the dimension entities. This entity is represented by a red stop sign symbol in IPM notation.
Some common attributes of a category detail entity are as follows:
Contains data for reference and support information to complete the intelligence of measurement data
Provides data that is more qualitative
Maps closely to transaction structures
Typically contains normalized data structures
Is represented by an individual cell, or a category, on an information package diagram
Typically contains a medium amount of data rows--less than measure entities and more than dimension entities
Contains descriptive, or qualitative data--not merely numbers

25Balanced Insight, Inc. - Confidential
Defining the Star Schema Logical Attributes Optimization originates from an information package diagram, or conceptual understanding of a user’s requirements. When defining information requirements through an information package diagram, we focus on manageable information packages and usability. The true power of a star schema design is to model a data structure that allows filtering, or reduction in result size, of the massive measure entities during user queries and searches. A star schema also provides a usable and understandable data structure, because the points of the star, or dimension entities, provide a mechanism by which a user can filter, aggregate, drill down, and slice and dice the measurement data in the center of the star. Now, we will demonstrate how to translate an information package diagram into a star schema. Each star represents an information package diagram and its associated information package. The measure entity is placed in the middle of the star. To define the logical measure entity, you take the lowest category, or cell, in each dimension of an information package diagram, along with each of the measures and make them attributes in a logical data entity, as illustrated by Figure 3.18.
Figure 3.18: The measure entity is logically mapped to each dimension of an information package diagram by its lowest level category. The measure entity also contains references to all measures listed on the information package diagram. The resultant entity is placed in the middle of the star schema.
Tip: Measure entities are composed of the keys to the detail, or lowest level, category in each dimension of an information package diagram. Each column must relate to all measures on the information package diagram. At this point, determine whether you will store calculated measurements. It is wise to estimate the overhead of users calculating the measurement data each time they access an information package versus the additional storage space and processing time required to precalculate the measurement data.
26Balanced Insight, Inc. - Confidential
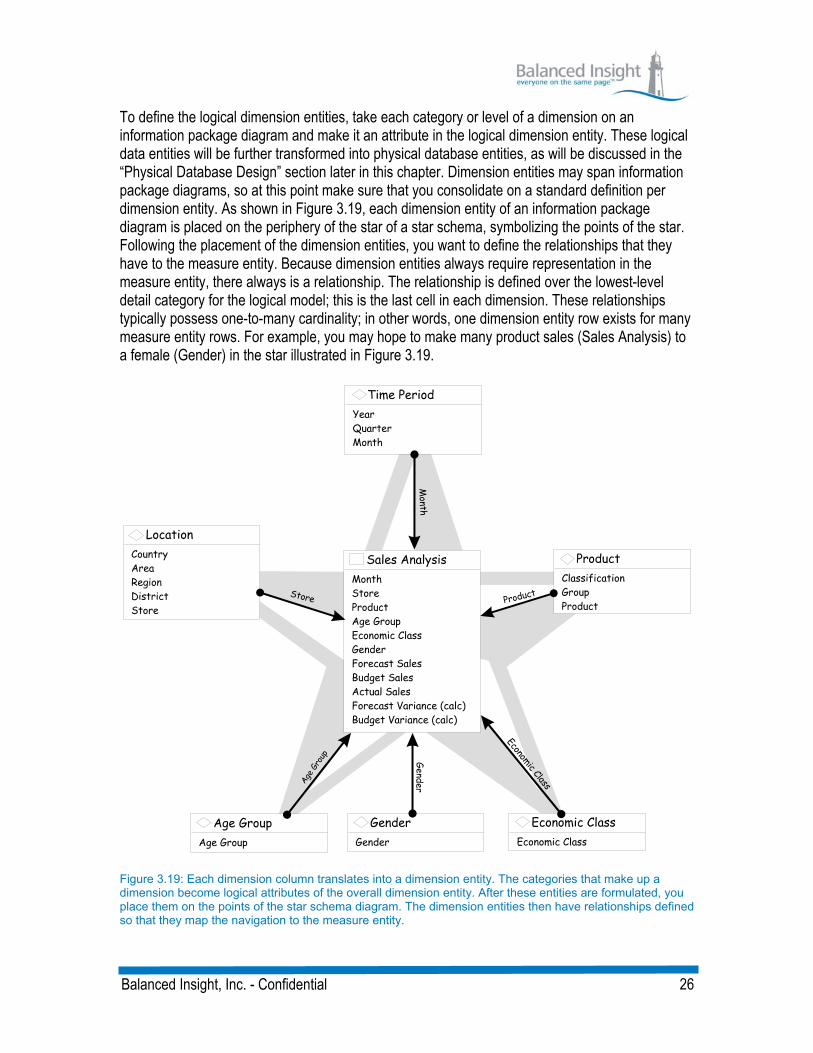
To define the logical dimension entities, take each category or level of a dimension on an information package diagram and make it an attribute in the logical dimension entity. These logical data entities will be further transformed into physical database entities, as will be discussed in the “Physical Database Design” section later in this chapter. Dimension entities may span information package diagrams, so at this point make sure that you consolidate on a standard definition per dimension entity. As shown in Figure 3.19, each dimension entity of an information package diagram is placed on the periphery of the star of a star schema, symbolizing the points of the star. Following the placement of the dimension entities, you want to define the relationships that they have to the measure entity. Because dimension entities always require representation in the measure entity, there always is a relationship. The relationship is defined over the lowest-level detail category for the logical model; this is the last cell in each dimension. These relationships typically possess one-to-many cardinality; in other words, one dimension entity row exists for many measure entity rows. For example, you may hope to make many product sales (Sales Analysis) to a female (Gender) in the star illustrated in Figure 3.19.
Figure 3.19: Each dimension column translates into a dimension entity. The categories that make up a dimension become logical attributes of the overall dimension entity. After these entities are formulated, you place them on the points of the star schema diagram. The dimension entities then have relationships defined so that they map the navigation to the measure entity.

27Balanced Insight, Inc. - Confidential
Tip: Dimension entities are placed on the points of a star schema and have a relationship that projects inward to the center of the star. The relationships between dimension and measure entities is one to many; one dimension row instance relates to many measure entity rows. Dimension entities are logical in nature and are the most denormalized of the three major data warehouse entity structures.
A star schema model simplifies a logical data model by organizing data entities in a more optimal fashion for analytical processing. In a simple star schema, a central entity--the measure entity--is surrounded by dimension entities for navigation. However, it is more likely that you will have additional relationships extending off the points of the star. This extended schema begins to take the appearance of a snowflake, and is therefore often referred to as a snowflake schema. The final step in defining a logical model transforms a star schema into one of these snowflake schemas. Each individual cell of an information package diagram must be evaluated and researched to determine if it qualifies as a category detail entity. If the user has a requirement for additional information about a category, this formulates the requirement for a category detail entity. These entities become extensions of dimension entities, as suggested by Figure 3.20.
Figure 3.20: Categories which require additional detail beyond the navigational purposes of a dimension will be translated into Category Detail Entities.
In our information package diagram, we have a requirement to see more detail information about data, such as store, product, and customer categories. These entities, when added into the current star schema, appear as shown in Figure 3.21. Notice how it has acquired a snowflake look. Notice too how easy it is to determine the meaning of each entity and its relationship to the other entities contained in the information package. This unique offering of the information packaging methodology allows you to clearly define and communicate the purpose and role played by each entity in a data warehouse. Tip: Category detail entity definitions contain information that enhances and adds qualitative data

28Balanced Insight, Inc. - Confidential
to the measurement, or quantitative data. The category details transform your star schema diagram into a snowflake schema because of the branching effect that the category details deliver to the star schema. (Note: Some industry gurus have different meanings for snowflake schemas. The type we discuss here is controlled and is not a detriment to your implementation.)
Figure 3.21: Upon completion, the translation of an information package diagram acquires the appearance of a snow flake schema. This star schema utilizes IPM notation to logically model the user’s requested information package.
Tip: Uniquely and clearly define all entities in your data warehouse: What is a Customer? Product? Region? You should realize that it is okay for different measure entities to require the same dimension entity to provide relationships at differing levels of category detail: A Time Period relates to Measure Entity 1 at the month level, while Measure Entity 2 relates at a day

29Balanced Insight, Inc. - Confidential
level. Remember, a relational database, which you typically utilize to implement a data warehouse, allows you to join tables with various entity columns. Therefore, you can take the Month column and join it from the Time Period dimension entity to the Month column in Measure Entity 1. You can also join the Date column from the Time Period dimension entity to the Date column in Measure Entity 2. Month and Date are both time periods and are contained in the same entity even though they provide different levels of detail.
Building a Physical Model The following sections describe the translation of a star schema into a physical data model. Though we primarily cover this information in summary fashion, this is the most traditional part of the data development process.
Defining Data Standards Prior to defining your first physical entity, relationship, or column, you should clearly define naming conventions that provide meaningful and descriptive information about represented components. In general, your standards should adhere to the following guidelines.
Complete words. Because data is accessed by users, you should attempt to use complete words wherever possible. When abbreviations are required, try to utilize standard and well-known abbreviations. Example: OrdNo is better represented as OrderNumber or ORDER_NUMBER.
Character case. Lowercase? Uppercase? Some database management system vendors recommend a specified case standard. But whatever you do, be consistent. If you introduce the concept of mixed case, you may provide a more readable name, but one that is technically difficult to enforce. Example: Which do you find more readable: order_number, ORDER_NUMBER, or OrderNumber?
Underscores versus hyphens. Underscores improve the readability of any component name and should be the standard. If you utilize a data source that does not support underscores as a valid character, a hyphen is the next best thing. However, consistency is again an overriding factor; Use one of these characters to improve the readability of component names, not both. Example: first_name, first-name, or firstname.
Domains. When possible, create a list of common data definitions for components that represent similar data. Examples: Dates, Time, Time Stamps, Elapsed Time, Codes, Names, Descriptions, Pounds, Currency (Cost, Revenues, and so forth).
It is important to publish and enforce these guidelines throughout a data warehouse. The enforcement should be placed in the hands of those who oversee object management, such as the database administrator or object administrator. Tip: Standards should be defined for each of the components or pieces of a data warehouse, including the following: columns constraints databases devices

30Balanced Insight, Inc. - Confidential
datatypes defaults security groups indexes logins rules segments servers stored procedures tables triggers information packages views standard reports users catalogs domains relationships
Defining Entities The star schema has us well on the road to defining the common entities for any given subject-oriented data warehouse. When defining the entities, you want to verify them and completely define their properties. This allows you to physically implement the entities in your chosen database management system.
Verifying Entities When you transfer entities from a star schema to a physical model, you need to ask questions to verify if the entity is part of another entity or one that can stand on its own. Here are some typical questions you need to ask:
Can the entity be described?
Does the entity have columns, or attributes, relevant to the user requirements?
Are there several instances of this entity? (If there is only one instance of an entity, it may need to collapse into another entity or multiple entities.)
Can one entity instance be separated or identified from another? (If not, they may be the same entity.)
Does the entity refer to or describe something else, such as another entity? (In this case, it might be a column in that entity versus an entity that can stand on its own.)
Defining Physical Entities During the physical modeling of your database, you make key decisions about which entities will be transformed from the logical definitions to the physical database. When you physically implement the data structures, you must take reasonable precautions in the area of performance: Don’t overly analyze the data, just be reasonable. An example of such a transformation is contained in the demographic tables shown in the logical model we have used in this chapter. In looking at these tables, there are only approximately three genders (male, female, and unknown), 10 economic classes, and 10 age groups. These tables, though valuable to the overall system, are too costly to maintain as individual tables. The cost is not in maintenance; it is the cost to users, who would be required to perform three additional joins to retrieve the demographic information. The resolution to this issue is to merge the entities and populate all permutations into one demographic table. The number of rows that will be contained can be calculated by figuring the overall permutations for the three entities.

31Balanced Insight, Inc. - Confidential
3 genders * 10 economic classes * 10 age groups = 300 rows
A table with 300 rows, though still small, is much more maintainable as we now incur only one join versus the previous three. This is a frequent example of the denormalization that occurs in the physical implementation of a data warehouse. This denormalization greatly assists the performance of the overall system by reducing the server-based overhead required to obtain all of the relevant detail information that users require. However, when contemplating these denormalizations, be sure to consider the domain of information that will be managed in these entities. Our collapsed entity contains demographic information, and therefore manages related information. Denormalizing unrelated domains into the same entity isn’t recommended. This confuses those who must maintain and manage these entities. Another consideration on denormalized entities is the potential need for splitting them in the future. Should these entities not belong to the same domain of information and need to be separated in the future, you may incur numerous problems.
Entity Properties Now that we have defined the fundamental building blocks of a data model--including the entities, the relationships, and some of the columns--we need to examine refinement of these items more specifically. Let’s identify and define the properties of the data by looking at key and nonkey columns, and at data characteristics.
Key and Nonkey Columns Data columns may provide key information about a row in a given data entity. If the data associated with this column uniquely identifies the row or is a common access path for users, the column may qualify to become a key. In query-oriented systems, keys and indexes assist in retrieval of data. However, they also introduce overhead to most database management systems, so use care when defining such attributes.
Primary key. A primary key is a column or set of columns whose values can be used to uniquely identify instances of an entity. For example, the key to an order is typically an ORDER_NUMBER, which uniquely defines all of the associated data that is managed by that order.
Alternate key. An alternate key is a column or set of columns that is designated as a preferred or common means of accessing the instances of a given entity. For example, the primary key to a customer table might be CUSTOMER_NUMBER, while an alternate key might be CUSTOMER_NAME. CUSTOMER_NAME does not guarantee uniqueness of the instance of a customer; therefore, a number is typically generated by the operational system to uniquely represent the customer. However, users of the system are more likely to remember the name of a customer, so we should provide them with that way to access the data.
Foreign key. A foreign key is any column or group of columns in an entity whose values exist as primary key values in a parent entity. When verifying an entity instance’s relationship at the key level, the value of the primary key must be present in the instance of the foreign key and vice versa. Example: In an order entry system, the order is

32Balanced Insight, Inc. - Confidential
typically represented by ORDER_HEADER and ORDER_LINE entities. ORDER_HEADER is typically referred to as the parent entity and ORDER_LINE as the child entity. ORDER_NUMBER is a primary key within ORDER_HEADER, because it defines a unique occurrence of an order. ORDER_NUMBER is considered a foreign key in the ORDER_LINE entity, because it defines the relationship between ORDER_LINE and ORDER_HEADER. Each ORDER_LINE must contain an ORDER_NUMBER, because without an ORDER_HEADER instance, an ORDER_LINE instance should never exist.
Nonkey data. A column that is not part of a primary or alternate key is referred to as nonkey data. This data is primarily used to further describe an instance of an entity. Example: On an order, you would typically not provide a key for a line item’s units sold. However, this data gives further explanation to what a customer ordered.
Null values. If a column of data is contained in either a primary or alternate key, it may not contain a null value. Null refers to a column that has no value and is therefore unknown by the system. A null value allows you to distinguish between a deliberate entry of zero, or blank, and a nonentry.
Data Volumetrics and Update Frequency Each entity in a data warehouse must be evaluated with regard to its volume of information processed and its frequency of update. This information becomes valuable during the transformation process. You should build a chart, as shown in Table 3.1, that for each entity clearly defines the volumetrics, including the number of expected rows and growth patterns; and the update frequency of the entity. Accurate figures may not always be available for these characteristics, so you should model the figures based on existing systems. Table 3.1: Entity volumetric and update frequency chart
Entity Volumetrics Update Frequency STORE Low volume; multiple of COUNTRY,
AREA, REGION, and DISTRICT; approximately 200,000 rows
Monthly, though tied to the other territory information; stores are added periodically, so to avoid missing a store, we will refresh monthly
LOCATION Low volume; dimension entity that is impacted any time COUNTRY, AREA, REGION, DISTRICT, or STORE changes
Monthly; see note on STORE
TIME_PERIOD Low volume; contains the calendar of approximately 100 rows
Annually load the new calendar
PRODUCT Low volume; approximately 200 rows; dependent on PRODUCT_DETAIL
Monthly; see note on PRODUCT_DETAIL
PRODUCT_DETAIL Low volume; approximately 200 rows Monthly; in this example, we show a potential specialty store that manages only about 200

33Balanced Insight, Inc. - Confidential
Entity Volumetrics Update Frequency products; however, because some new items could be added monthly, we load at that frequency
ECONOMIC_CLASS Approximately 10 rows: < $20,000 $20,000 to 30,000 $30,000 to 40,000 $40,000 to 50,000 $50,000 to 60,000 $60,000 to 70,000 $70,000 to 80,000 $80,000 to 90,000 $90,000 to 100,000 > $100,000
Static data
GENDER 3 rows: male; female; unknown Static data AGE_GROUP Approximately 10 rows:
< 18 18 to 22 23 to 30 30 to 35 36 to 40 41 to 55 56 to 70 > 70
Static data
CUSTOMER Each STORE has approximately 100 regularly monitored customers
Monthly, because the volume of data is relatively low and changes are periodically made, we load at that frequency
SALES_ANALYSIS High volume; will contain all transactions for purchases at the store level; if the database were 100% dense, the potential is for 576 billion total rows with a monthly transaction volume of 9.6 billion. This dense number would assume that, every month, every store sold every product to every age group for every economic class and gender. The odds of this are low, but this upper limit assists in planning.
Daily; though data is rolled up to the monthly level, transactions are stored to the daily level to avoid a large batch job at the end of the month, a time period that is volatile in an operational system environment

34Balanced Insight, Inc. - Confidential
Entity Characteristics It is important to fully identify the characteristics of each individual entity in a data warehouse. These characteristics are important for final implementation and deployment of the actual data model, including the concepts of fragmentation and data access. Entity characteristics include the following:
Individual columns of distinct data items
Key attributes
Valid range of data values
Integrity constraints placed on the data
Type and size of the data
These characteristics can be mapped to each entity utilizing a table like the one in Table 3.2, which is associated with the SALES_ANALYSIS entry in Table 3.1. Table 3.2: Entity characteristics for the SALES_ANALYSIS entity in Table 3.1
Column Key Attributes
Valid Range of Values
Integrity Constraints
Type and Size
TIME_PERIOD_KEY Primary key; foreign key
Month for last 5 years from TIME_PERIOD entity
A row can’t exist char (6); without time period key
YYYYMM format
STORE_KEY Primary key; foreign key
Valid store key from STORE entity
A row can’t exist without a store key
char(6)
PRODUCT_KEY Primary key; foreign key
Valid product key from PRODUCT entity
A row can’t exist without a product key
char (6)
AGE_GROUP_KEY Primary key; foreign key
Valid age group key from AGE_GROUP entity
A row can’t exist without an age group key
char(6)
ECON_CLASS_KEY Primary key; foreign key
Valid economic class key from ECON_CLASS entity
A row can’t exist without an economic class key
char (6)
GENDER_KEY Primary key; foreign key
Valid gender key from GENDER entity
A row can’t exist without a gender key
char (6)
FORECAST_SALES Positive dollar amount
money (float)

35Balanced Insight, Inc. - Confidential
Column Key Attributes
Valid Range of Values
Integrity Constraints
Type and Size
BUDGET_SALES Positive dollar amount
money (float)
ACTUAL_SALES Positive dollar amount
money (float)
FORECAST_VARIANCE Positive or negative dollar amount
money (float)
BUDGET_VARIANCE Positive or negative dollar amount
money (float)
A Closer Look at a Physical Data Warehouse Now that a physical data model is present, let’s take a closer look at what would be populated for the information package example utilized throughout this chapter. As shown in Figure 3.5, the data model includes entities that were derived from the information package diagram. While you may have an information package diagram that is nearly identical to the one in this book, the physical data model may be totally different. (We hope that yours will be more robust and complete.)
Dimension Entities. Dimension entities illustrate the denormalization concepts that in The Physical Model section of this chapter. Each level in the hierarchy has an associated key and description. This allows us to retrieve all of the data for the complete hierarchy without requiring a relational join and its associated overhead. With dimension entities, a data warehouse access tool can navigate and filter the measure entity by presenting users with dimension and category descriptions, while behind the scenes the tool utilizes the dimension and category keys to perform the actual filters and joins. The keys reduce the overhead and therefore offer a physical optimization that is native to a database. The descriptions are also isolated outside the measure and category detail entities, which allows easier maintenance if a description requires modification. If we look closely at the LOCATION dimension entity, we see that it possesses the following physical columns.
COUNTRY_KEY COUNTRY AREA_KEY AREA REGION_KEY REGION DISTRICT_KEY DISTRICT STORE_KEY STORE
Measure Entity. The columns that we further define in the measure entity include the foreign keys for relationships to the demographic entities. Decisions that are made with regard to the dimension entities will be incorporated in the measure entity. In taking a

36Balanced Insight, Inc. - Confidential
closer look at the SALES_ANALYSIS measure entity, the following are the foreign keys that were added.
TIME_PERIOD_KEY STORE_KEY PRODUCT_KEY GENDER_KEY ECON_CLASS_KEY AGE_GROUP_KEY
Category Detail Entities. Category detail entities have a similar appearance to their transaction-oriented counterparts in operational systems. Often, people will advise to collapse dimension entities into category detail entities. I advise against this for the following reasons: We want to map as closely as possible to the star schema model; we want the model to be easy to understand and navigate; and we want to provide a facility for optimizing data quality in description or label maintenance. In our sample model, STORE, CUSTOMER, and PRODUCT_DETAILS all exemplify category detail entities.
Relationships. Each of the relationships primarily stems from dimension entities and extends to measure and category detail entities. In category detail and measure entities, you will create foreign keys that relate to associated dimension entities. The following are the relationships that are contained in our sample information package among the measure and dimension entities. We represent them here as SQL join logic.
WHERE TIME_PERIOD.TIME_PERIOD_KEY = SALES_ANALYSIS.TIME_PERIOD_KEY WHERE LOCATION.STORE_KEY = SALES_ANALYSIS.STORE_KEY WHERE PRODUCT.PRODUCT_KEY = SALES_ANALYSIS.PRODUCT_KEY WHERE DEMOGRAPHICS.GENDER_KEY = SALES ANALYSIS.GENDER_KEY AND DEMOGRAPHICS.ECON_CLASS_KEY = SALES_ANALYSIS.ECON_CLASS_KEY AND DEMOGRAPHICS.AGE_GROUP_KEY = SALES_ANALYSIS.AGE_GROUP_KEY
Tip: Data warehouse entities should be driven by users’ query behavior. To this end, dimension entities assist users in navigating and filtering measure entities, and allow them to focus on data in category detail entities.
Summary The level of refinement that produces a final data warehouse physical database design has us building three separate models that provide greater detail each step of the way. We start with an information package diagram, which gives us a definition that is highly understood by users, yet is relatively incomplete for a database administrator. Through our research, analysis, and design, we transform this information package into a star schema, and finally produce a database management system’s specific physical data model.

37Balanced Insight, Inc. - Confidential
You should proceed with your projects utilizing this set of refinements to your data model. You will discover many areas where improvements can be made to the data model along the way, such as the demographic dimension entity merger we discussed in our refinements. These techniques are important and will assist your team in becoming better information packagers—a requirement for the architects and designers of a data warehouse. Too often, designers try to take the short route to the final deliverable and lose much value-added information along the way. Though entity relationship modeling has played a part in this process, it should not be the first and only part. The concepts of the information packaging methodology build the required data architecture and functionality for your data warehouse. The information packaging diagram technique of data gathering and star schema modeling design technique provide consistency in design as well as a set of standardized communication tools that will make your warehouse more cost effective and easier to develop and maintain. Remember, this is the users’ system, not yours. To cut directly to design techniques that have been developed over the years for transaction processing systems rather than data warehousing systems will not benefit anyone--your development team or users. There is no simple way to transform an entity relationship model into a multidimensional model or design. Decision support systems and traditional business analysis require the multidimensional aspects found in such a model. Therefore, remember the steps of refinement for the information packaging methodology listed here. Build a conceptual model of your information packages with information package diagrams.
These diagrams are completed based on your interview sessions with users and the executives overseeing the business area covered by your subject-oriented data warehouse.
From the information package diagrams, begin to unify your three major warehouse entities--the measure, dimension, and category detail entities. You should guarantee in this step that you clearly distinguish entities and do not deliver overlapping information. The delivery vehicle for these logical data models is the star schema design. Clearly build each star on a graphical entity map utilizing symbols to define and distinguish the entities and their operational characteristics. A rectangle defines a measure, a filter symbol defines a dimension entity, and a stop sign defines a category detail entity.
From your star schema design, transform your multidimensional model into a physical database model. It is wise to pick one of the many standard data modeling tools available in today’s marketplace to assist in automating this process. It is key that you work from a data modeling tool that natively supports your data warehouse architecture and delivers productivity for ongoing maintenance of an enterprise data model.
Now that we have a data model in place for your data warehouse, let us proceed with the transformation and movement process. The following chapter discusses the data flow diagramming technique utilizing IPM notation. This component of the information packaging methodology assists

38Balanced Insight, Inc. - Confidential
you in clearly defining the requirements and specifications for your development teams to implement an efficient back-end transformation process.