information propagation between equity markets: the case ... · the case of brict harald...
TRANSCRIPT

INFORMATION PROPAGATION
BETWEEN EQUITY MARKETS:
THE CASE OF BRICT
Harald Schmidbauer∗/ Angi Rosch†/ Erhan Uluceviz‡
c© 2013 Harald Schmidbauer / Angi Rosch / Erhan Uluceviz
(Preliminary version; last compiled: May 13, 2013)
Abstract
The overall degree of international equity market connectedness has gradually increased
over the past two decades. Reflecting the shift in global economic power, it has been recently
suggested to pay more attention to the BRICT (Brazil, Russia, India, China, and Turkey)
countries. Building on, and methodologically adding to, an established approach to mar-
ket connectedness, this study makes an effort to assess the connectedness of these markets,
together with developed equity markets. Our methodological contributions consist of the
analysis of information propagation, based on Markov chains and information entropy. We
find that the BRICT countries’ degree of equity market connectedness has increased sub-
stantially since the early 2000s, with Brazil and China being the most and least connected
equity market, respectively. Furthermore, we find an “informational divide” among BRICT
markets insofar as the magnitude of market repercussions of a hypothetical shock within
BRICT still depends on the origin of the shock, which is in contrast to western developed
markets. We also find that the amount of news produced by the BRICT markets is getting
more uniform and approaches the level of developed markets.
Key words: Connectedness of equity markets; spillovers; information propagation; market
entropy; BRICT countries
1 Introduction
In the wake of his step in to the head of economic research post at Goldman Sachs in 2001, Jim
O’Neill coined the acronym BRIC to refer to the emerging economies (Brazil, Russia, India and
China) with high potential to shift the global competitive advantage away from the developed
G7 economies towards the developing world in the coming decades (see O‘Neill [6], Mpoyi [5]).
Even though the “catchy name”1 BRIC was first formulated on paper by an investment banker
mostly as a marketing tool to point out lesser-known markets to investors, the BRIC group has
became a political reality and those countries have started cooperating.
BRIC countries do not act as a political alliance, but BRIC foreign ministers have met
annually since 2006. The four countries had their first formal summit at the presidential level
in 2009, and they meet annually since then. In 2010, South Africa joined the BRIC countries
converting the group to BRICS. Together, BRICS represent 43% of the world’s population and
∗Istanbul Bilgi University, Istanbul, Turkey; e-mail: [email protected]†FOM University of Applied Sciences, Munich, Germany; e-mail: [email protected]‡Istanbul Bilgi University, Istanbul, Turkey; e-mail: [email protected]@Wharton, [4].
1

17% of trade with the infrastructure needs amounting to $4.5tn over the next five years2. At the
end of the 2013 summit, the BRICS countries declared to have agreed to set up a $100-billion
currency crisis fund and a new development bank3. Though the details are not finalized yet, the
new development bank is perceived “. . . as an alternative to the World Bank, although it’s still
a long way from meeting that challenge”4.
It has been argued that the BRIC does not constitute a homogeneous block, neither with
respect to political systems (democratic in India and Brazil, authoritarian in Russia and China)5
nor with respect to economic structure (with China and India among the world’s dominant
suppliers of manufactured goods and services, respectively, and Brazil and Russia as similarly
dominant suppliers of raw materials). Nevertheless, it is not only because of their their potential
for a somewhat “symbiotic relationship”6 — higher demand for raw materials in India and China
boosting the GDP of Russia and Brazil — that it seems reasonable to expect an increasing level
of connectedness among BRIC equity markets and also with equity markets in the developed
world. For example, to assess the return and volatility spillovers of BRIC countries, Bhar and
Nikolova [1] study the level of integration and the dynamic relationship between the BRIC
countries and the world, and they find that India showed the highest level of regional and global
integration among the BRIC countries, followed by Brazil and Russia and lastly by China.
The present investigation uses the daily stock market data for the BRICs and Turkey, the
latter representing the N-11 economies.7 We use the MSCI World stock market index to represent
the developed markets in the world.
Our approach to measuring equity market connectedness is based on forecast error variance
decomposition, see Diebold and Yilmaz [2, 3], and extensions of this approach to assess the
propagation of information across markets, see Schmidbauer, Rosch and Uluceviz [8]. The
purpose of the present paper is to investigate whether evidence can be found for the following
hypotheses:
H1: In view of more regular BRICT member contacts on a political level since 2006 and the
prospect of the establishment of a joint development bank, we hypothesize that levels of
connectedness among BRICT markets and the developed markets have been increasing
since 2006, and so have levels of spillovers from and to those markets.
H2: We also hypothesize that elevated levels of connectedness make the origin of hypothetical
shocks, or news, irrelevant for further repercussions of these shocks in the system of BRICT
markets — in spite of their heterogeneity.
H3: With BRICT markets becoming more and more attractive to a wider range of investors,
these markets become more institutionalized, enabling them to process upcoming infor-
mation more efficiently; therefore we hypothesize that the level of day-to-day information
gain observed in these markets will gradually approach that of developed equity markets.
Section 2 casts a glance at the data used in the present investigation. Section 3 briefly
outlines the theory behind assessing connectedness and information propagation. Empirical
findings are presented in Section 4; Section 5 concludes.
2Guardian.co.uk, 2013-03-28.3Bloomberg, 2013-03-28.4Foreignpolicy.com, 2013-04-09.5Nouriel Roubini, see livemint.com, 2013-04-25.6Economist, 2008-04-21.7In 2005, Goldman Sachs identified the “Next 11” (N-11) after BRIC, which — owing to their economic and
political conditions — could greatly impact the global economy. The N-11 countries include Bangladesh, Egypt,
Indonesia, Iran, Korea, Mexico, Nigeria, Pakistan, Philippines, Turkey and Vietnam; see Goldmansachs.com,
accessed on 2013-05-10.
2
2000 2005 2010
−2
−1
01
23
bvsprtsbsesnssecxu100msciworld
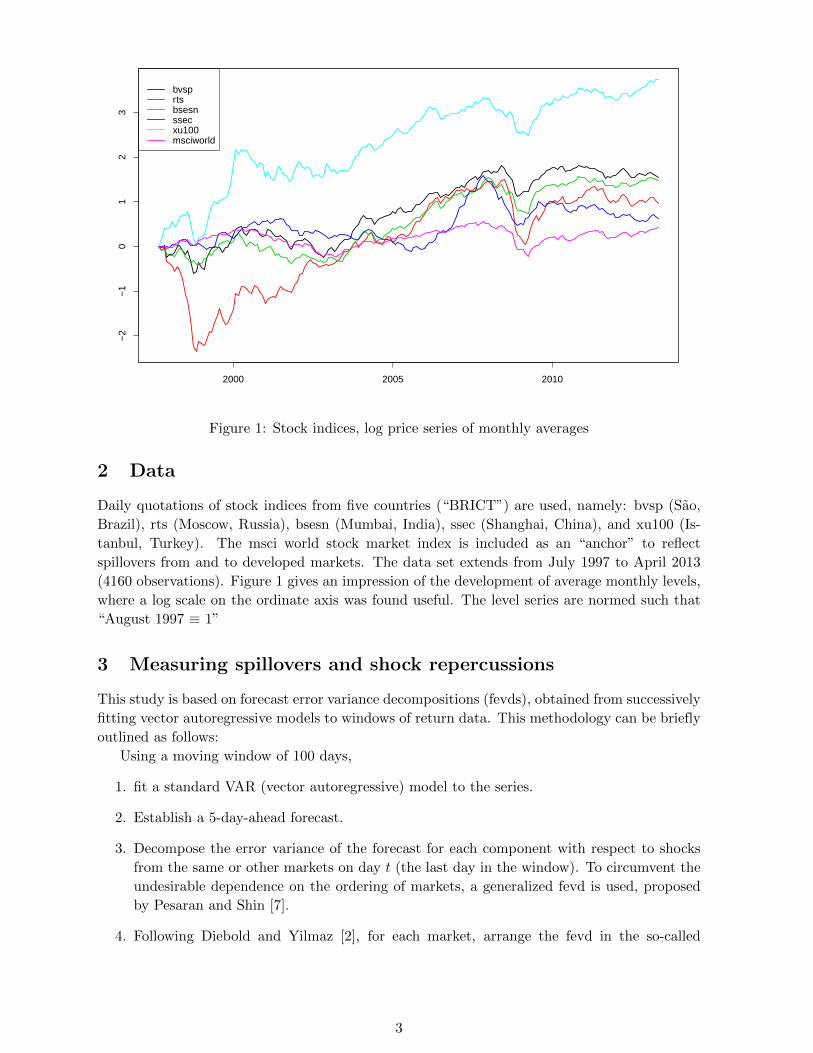
Figure 1: Stock indices, log price series of monthly averages
2 Data
Daily quotations of stock indices from five countries (“BRICT”) are used, namely: bvsp (Sao,
Brazil), rts (Moscow, Russia), bsesn (Mumbai, India), ssec (Shanghai, China), and xu100 (Is-
tanbul, Turkey). The msci world stock market index is included as an “anchor” to reflect
spillovers from and to developed markets. The data set extends from July 1997 to April 2013
(4160 observations). Figure 1 gives an impression of the development of average monthly levels,
where a log scale on the ordinate axis was found useful. The level series are normed such that
“August 1997 ≡ 1”
3 Measuring spillovers and shock repercussions
This study is based on forecast error variance decompositions (fevds), obtained from successively
fitting vector autoregressive models to windows of return data. This methodology can be briefly
outlined as follows:
Using a moving window of 100 days,
1. fit a standard VAR (vector autoregressive) model to the series.
2. Establish a 5-day-ahead forecast.
3. Decompose the error variance of the forecast for each component with respect to shocks
from the same or other markets on day t (the last day in the window). To circumvent the
undesirable dependence on the ordering of markets, a generalized fevd is used, proposed
by Pesaran and Shin [7].
4. Following Diebold and Yilmaz [2], for each market, arrange the fevd in the so-called
3

spillover matrix:
from (day t)
bvsp rts bsesn ssec xu100 msciworld
bvsp � � � � � �rts � � � � � �
to (day t+ 5) bsesn � � � � � �ssec � � � � � �xu100 � � � � � �msciworld � � � � � �
(1)
Each row thus sums up to 1 (or 100%) and provides a breakdown of the forecast error
variance of the corresponding stock index return with respect to shock origins in terms of
percentages. Each entry in the spillover table is called a directional spillover. Schemati-
cally, the spillover index is then obtained as∑�∑
� +∑
�. (2)
The network structure of the spillover matrix with respect to the propagation of shocks
lends itself to a broader perspective, using concepts borrowed from population and Markov
chain theory, as well as from information theory. Again, we give only a very short outline of
the concepts used below; for a more comprehensive presentation, see Schmidbauer, Rosch and
Uluceviz [8]:
1. Let Mt denote the spillover matrix for day t. A hypothetical shock (“news”, “information”)
of unit size to market i on day t can be denoted as n0 = (0, . . . , 0, 1, 0, . . . , 0)′, where 1
is in the i-th component of n0. We assume that the propagation of this shock across the
markets within day t will take place in short time intervals of unspecified length according
to
ns+1 = Mt · ns, s = 0, 1, 2, . . . (3)
(where step s = 0 initializes the recursion). The index s in equation (3) therefore denotes
a hypothetical step in information flow. Moreover, assuming that information flow across
markets can proceed instantly, with spillover conditions persisting throughout day t, it
makes sense to investigate steady-state properties (as s → ∞) of the model defined by
equation (3), which can be discussed in terms of the eigenvalue structure of the matrix
Mt. The corresponding left eigenvector vt, satisfying
v′t = v′t ·Mt, (4)
permits a discussion of “propagation values” of markets: The propagation value of a market
renders the value of a shock which comes from the market as seed for future shock impact
variability. A higher propagation value of a market on day t means that news originating
from this market will have stronger repercussions across the system of markets considered.
2. Apart from measuring the strength of market repercussions of a shock, propagation values
can also be interpreted as stationary distribution of a Markov chain defined on the basis of
a spillover matrix. As given, a spillover matrix is not a suitable transition matrix, because
its rows (the to part), and not its columns (the from part) sum up to 1, to the effect
that such a Markov chain would be running backward in time. Time can be reversed by
applying the transformation
Pt = V−1t ·M′t ·Vt (5)
4

(see Tuljapurkar [9]), where the diagonal matrix Vt contains the left eigenvector vt (cor-
responding to eigenvalue 1) of Mt, and after re-scaling:
π′s =n′s ·Vt
n′0 · vt,
the Markov chain equation
π′s+1 = π′s ·Pt, s = 0, 1, 2, . . . , (6)
emerges. This Markov chain can be interpreted as follows: On day t, the initial location
of a shock in the system is given by π0 (a unit vector). The shock moves through the
system according to equation (6). It can be shown that the stationary distribution of
shock location is given by the vector of propagation values, which in this sense represents
the “information equilibrium” or “news balance” among markets on that day.
3. How much information is produced by the system of markets from day to day? The
question of “information gain” from today’s to tomorrow’s news balance among markets
can be answered by applying the concept of Kullback-Leibler divergence (also known as
Kullback-Leibler information criterion, KLIC), which measures the entropy of day t with
respect to day t−1, of the propagation values belonging to day t and day t+1. For details,
see Schmidbauer, Rosch and Uluceviz [8].
4 Empirical findings
An assessment of market connectedness can now be obtained by applying the methodology
outlined in Section 3.
4.1 Overall and directional spillovers
Overall spillovers (that is, the daily time series of spillover index values) is displayed in Figure 2,
together with a smoothed version. The latter hit the lowest mark in the period considered in
December 1999 and was almost equally low again in March 2003. Its subsequent increase gained
momentum in early 2005, increasing steadily to about 50% in September 2007. It currently
(early May 2013) stands at about 27%.
For the purpose of comparison, it may be helpful to consider spillover levels in a system
of four developed equity markets, namely dji (New York, USA), fchi (Paris, France), gdaxi
(Frankfurt, Germany) and n225 (Tokyo, Japan), for the same period of time. The (similarly
smoothed) spillover series reached its lowest level of 36% in February 2000, and its highest level
of more than 60% in November 2008.
Directional spillovers, as shown in Figures 3 (spillovers from a given market to others, that
is: off-diagonal column sums of matrix (1)) and 4 (spillovers to a given market from others,
that is: off-diagonal row sums of matrix (1)) provide more insight into the way spillovers have
increased. China remains secluded in the sense that very little spillover is coming from China; it
is a net receiver in the sense that spillovers going to China outweigh those coming from China,
and the gap between incoming and outgoing spillovers has even been widening from 2005 to
2012. The other net receivers are India and Turkey; Brazil is a net sender. Russia has been a
net sender since about mid-2010. As was to be expected, msci-world is also a net sender. — In
summary, it can be said that hypothesis H1 is confirmed.
5

2000 2005 2010
2030
4050
60spillover index
Figure 2: Spillovers index, the case of BRICT
2000 2005 2010
020
4060
8010
012
0 from ... to othersbvsprtsbsesnssecxu100msciworld
spillovers to others
Figure 3: Spillovers from a market to others, the case of BRICT
6

2000 2005 2010
020
4060
8010
012
0 coming to ... from othersbvsprtsbsesnssecxu100msciworld
spillovers from others
Figure 4: Spillovers to a market from others, the case of BRICT
4.2 Propagation values
Propagation values quantify the strength of repercussions in the system of markets when a
hypothetical shock originates from one of the markets. Figure 6 shows that propagation values
of dji, fchi, and gdaxi have been in a narrow corridor since about 2001 when considering again the
system of four markets (together with n225): market repercussions will be more or less equally
strong, irrespective of the origin of the shock (the US, French, or German equity market).
A similar phenomenon has not occurred among the BRICT countries, as is obvious from
Figure 5: throughout the period considered, bvsp has the highest propagation value, recently
approached by rts, and surpassing Turkey in spite of the latter’s soaring stock market. The
situation, however, appears to be far from being as settled as in the case of the four developed
markets. Our hypothesis H2 is thus not confirmed: The origin of a shock, when considering the
BRIC economies, does matter for the further propagation of information, with different weight
attached to markets at different points in time, and no sign of convergence in sight as yet. This
observation can be described as an “informational divide” between the BRICT countries. In
contrast, Figure 6 shows that no informational divide exists between France and Germany.
4.3 Day-by-day information production
As shown in Figure 7, the time series of KLIC values (the relative market entropy on a daily
basis) has evolved such that (i) KLIC spikes have gradually become shorter, (ii) the density of
points for a given KLIC level has decreased. Indeed, the BRICT KLIC series has become more
similar to the KLIC series characterizing developed markets (Figure 8), providing evidence in
favor of our third hypothesis H3.
5 Summary and conclusions
The present study investigates the amount of connectedness of equity markets in BRICT coun-
tries with daily closing quotes of their most important stock index values as empirical basis, and
7

2000 2005 2010
0.0
0.1
0.2
0.3
0.4
0.5
0.6
0.7
bvsprtsbsesnssecxu100msciworld
propagation values
Figure 5: Propagation values, the case of BRICT
2000 2005 2010
0.0
0.1
0.2
0.3
0.4
0.5
0.6
0.7
djifchigdaxin225
propagation values
Figure 6: Propagation values, the case of dji, fchi, gdaxi, n225
8

2000 2005 2010
0.00
0.02
0.04
0.06
0.08
0.10
0.12
KL.statKLIC
Figure 7: KL distance, daily stationary distributions, the case of BRICT
2000 2005 2010
0.00
0.02
0.04
0.06
0.08
0.10
0.12
KL.statKLIC
Figure 8: KL distance, daily stationary distributions, the case of dji, fchi, gdaxi, n225
9

a summary index to represent stock markets of developed markets. Building on an established
methodology to assess return spillovers, we proceed to investigate the spread of information
(hypothetical shocks to a market on a given day) through the network of markets.
We find that BRICT markets have become more connected over the past 15 years, with a
significant rise beginning in 2005. Throughout the period considered, Brazil has the highest and
China the lowest connectedness. We find evidence for an “informational divide” in the sense
that the origin of a shock (a sudden drop or rise in a stock index) matters — in contrast to
western developed equity markets. The level of information produced from day to day in the
system of BRICT markets is approaching that of developed markets.
It may well be that convergence, to the effect of a reduced “informational divide” among
BRICT markets, will be observed in the future. The present paper provides the methodology
to track the future interplay of markets.
References
[1] Bhar R., and Nikolova B., 2009. Return, volatility spillovers and dynamic correlation in the
BRIC equity markets: An analysis using a bivariate EGARCH framework. Global Finance
Journal 19, 203–218.
[2] Diebold F.X., and Yilmaz K., 2009. Measuring financial asset return and volatility
spillovers with application to global equity markets. Economic Journal 119, 158–171.
[3] Diebold F.X., and Yilmaz K., 2011. On the network topology of variance decompositions:
measuring the connectedness of financial firms. NBER Working Paper 17490, National
Bureau of Economic Research.
[4] Knowledge@Wharton, 2011. The new BRICS on the block: which emerging markets are up
and coming? http://knowledge.wharton.upenn.edu/article.cfm?articleid=2679. Accessed
on 2013-05-10.
[5] Mpoyi R.T., 2012. The impact of the “BRIC thesis” and the rise of emerging economies on
global competitive advantage: will there be a shift from west to east? Journal of Applied
Business and Economics 13(3), 36-47.
[6] O’Neill, J., 2001. Building Better Global Economic BRICs. Goldman Sachs Global Eco-
nomics,Paper No 66.
[7] Pesaran H.H., and Shin Y., 1998. Generalized impulse response analysis in linear multi-
variate models. Economics Letters 58, 17–29.
[8] Schmidbauer H., Rosch A., and Uluceviz E., 2012. Understanding market connected-
ness: a Markov chain approach. Research report, available online at http://www.hs-
stat.com/projects/papers/schmidbauer roesch uluceviz connectedness mc approach.pdf.
[9] Tuljapurkar S.D., 1982. Why use population entropy? It determines the rate of conver-
gence. J. Math. Biology 13, 325–337.
10