information technology and the world economy … information technology and the world economy dale...
TRANSCRIPT

1
Information Technology and the World Economy
Dale W. Jorgenson
Samuel W. Morris Harvard University Professor
Leon Koźmiński Academy of Entrepreneurship and Management (WSPiZ) and TIGER
Distinguished Lectures Series n. 14
Warsaw, 14 May 2004
Andrzej K. Ko źmiński: Ladies and gentlemen, I am very happy to open the conference on
“Information and Communication Technologies as Drivers of Development in Transition
Economies” organized by our TIGER economic think-tank. We are extremely fortunate to be
able to start this conference with a special lecture within the framework of “WSPiZ and
TIGER Distinguished Lectures Series” by one of the leading economists in this field in the
world, Professor Dale W. Jorgenson, Director of the Program on Technology and Economic
Policy at Kennedy School of Government, and Samuel W. Morris Harvard University
Professor. Professor Jorgenson used to be the Chairman of the Department of Economics at
the Harvard University. He is also one of the founders of the modern theory of economic
growth. Professor Jorgenson is also a recipient of a great number of very prestigious awards,
including the John Bates Clark Medal awarded to him in 1971. Professor Jorgenson’s lecture
today is entitled “Information Technology and the World Economy”. It will be subsequently
published in the “Distinguished Lectures Series”. We are very lucky and very honoured to
host such an eminent scholar and leading figure in this field. Professor Jorgenson, the floor is
yours.
Dale W. Jorgenson: It is a great honour for me to initiate this conference at the Koźmiński
Academy with this lecture on “Information Technology and the World Economy”. I want to
give you some idea about the role this topic will play in the conference. Information
technology is something that we are all aware of in our daily lives. Its relationship to the
world economy is something that needs to be established. In the course of this conference you
are going to have an opportunity to see precisely what that role is, because we have here, at
the conference, the leading scholars in the field. This includes the leading people in the study
of the impact of information technology in transition economies here at the Koźmiński
Academy. I want to provide an overview of the impact of information technology in the world

2
economy. I am not going to be able to cover every aspect of this topic. This has a huge
research community; people are investigating this around the world. I am going to try to focus
on the important features of information technology and then, secondly, to give you an idea of
the impact on industrialised economies.
In my lecture I will present international comparisons of economic growth among the
G7 nations – Canada, France, Germany, Italy, Japan, the U.K., and the U.S. These
comparisons focus on the impact of investment in information technology (IT) equipment and
software over the period 1980-2001. In 1998 the G7 nations accounted for nearly sixty
percent of world output1 and a much larger proportion of world investment in IT. Economic
growth in the G7 has experienced a strong revival since 1995, driven by a powerful surge in
IT investment.
The resurgence of economic growth in the United States during the 1990’s and the
crucial role of IT investment has been thoroughly documented and widely discussed.2 Similar
trends in the other G7 economies have been more difficult to detect, partly because of
discrepancies among official price indexes for IT equipment and software identified by
Andrew Wyckoff.3 Paul Schreyer has constructed “internationally harmonized” IT prices that
eliminate many of these discrepancies.4
Using internationally harmonized prices, I have analyzed the role of investment and
productivity as sources of growth in the G7 countries over the period 1980-2001. I have
subdivided the period in 1989 and 1995 in order to focus on the most recent experience. I
have decomposed growth of output for each country between growth of input and
productivity. Finally, I have allocated the growth of input between investments in tangible
assets, especially information technology and software, and human capital.
Growth in IT capital input per capita jumped to double-digit levels in the G7 nations
after 1995. This can be traced to acceleration in the rate of decline of IT prices, analyzed in
my Presidential Address to the American Economic Association.5 The powerful surge in
investment was most pronounced in Canada, but capital input growth in Japan, the U.S., and
the U.K. was only slightly lower. France, Germany, and Italy also experienced double-digit
growth, but lagged considerably behind the leaders.
1See Angus Maddison (2001) for 1998 data for world GDP and the GDP of each of the G7 countries.2See Dale Jorgenson and Kevin Stiroh (2000) and Stephen Oliner and Daniel Sichel (2000).3See Wyckoff (1995)4See Schreyer (2000). Alessandra Colecchia and Schreyer (2002) have employed these internationallyharmonized prices in measuring the impact of IT investment.5See Jorgenson (2001).

3
During the 1980’s productivity played a minor role as a source of growth for the G7
countries except Japan, where productivity accounted for thirty percent of economic growth.
Productivity accounted for only sixteen percent of growth in the U.S., thirteen percent in
France, twelve percent in the U.K., and eleven percent in Germany; only two percent of
growth in Canada was due to productivity, while the decline of productivity retarded growth
by fourteen percent in Italy. Between 1989 and 1995 productivity growth declined further in
the G7 nations, except for Italy and Germany. Productivity declined for France and the U.K.
but remained positive for the U.S., Canada, and Japan.
Productivity growth revived in all the G7 countries after 1995, again with the
exception of Germany and Italy. The resurgence was most dramatic in Canada, The U.K., and
France, partly offsetting years of dismal productivity growth. Japan exhibited the highest
growth in output per capita among the G7 nations from 1980 to 1995. Japan's level of output
per capita rose from the lowest in the G7 to the middle of the group. Although this advance
owed more to input per capita than productivity, Japan’s productivity growth far outstripped
the other members of the G7. Nonetheless, Japan's productivity remained the lowest among
the G7 nations.
The U.S. led the G7 in output per capita for the period 1989-2000. Canada’s edge in
output per capita in 1980 had disappeared by 1989. The U.S. led the G7 countries in input per
capita during 1980-2000, but U.S. productivity languished below the levels of Canada,
France, and Italy.
In the second section of my speech I outline the methodology for this study, based on
my Presidential Address. I have revised and updated the U.S. data presented there through
2001. Comparable data on investment in information technology have been constructed for
Canada by Statistics Canada.6 Data on IT for France, Germany, Italy, and the U.K. have been
developed for the European Commission by Bart Van Ark, et al.7 Finally, data for Japan have
been assembled by myself and Kazuyuki Motohashi for the Research Institute on Economy,
Trade, and Industry.8 I have linked these data by means of the OECD’s purchasing power
parities for 1999.9
In the next part of my lecture I consider the impact of IT investment and the relative
importance of investment and productivity in accounting for economic growth among the G7
6See John Baldwin and Tarek Harchaoui (2002).7See Van Ark, Johanna Melka, Nanno Mulder, Marcel Timmer, and Gerard Ypma (2002).8See Jorgenson and Motohashi (2003)9See OECD (2002). Current data on purchasing power parities are available from the OECD website:http://www.sourceoecd.org.

4
nations. Investments in human capital and tangible assets, especially IT equipment and
software, account for the overwhelming proportion of growth. Differences in the composition
of capital and labor inputs are essential for identifying persistent international differences in
output and accounting for the impact of IT investment.
I then go on to describe the emergence of the new consensus on economic
measurement, a process that is still underway. The new framework for productivity
measurement is embodied in the official U.S. statistics, published by the Bureau of Labor
Statistics (1994). International “best practice” is described in the United Nations (1993b)
System of National Accounts 1993 and two recent OECD manuals – Measuring Productivity
by Schreyer (2001) and Measuring Capital by Derek Blades (2001).
After three decades the traditional framework for economic measurement employed,
for example, by Simon Kuznets (1971) and Robert Solow (1970), has collapsed under the
weight of massive new empirical evidence on economic growth, followed by a torrent of
novel theoretical insights. Until recently, the disparity of views among economists has been
greater on growth than most other topics. However, it is important to bear in mind that the
consensus of the early 1970's materialized from a similar period of fractious contention
among competing schools of thought.
2. Investment and Productivity
My papers with Laurits Christensen and Dianne Cummings (1980, 1981) developed
growth accounts for the United States and its major trading partners -- Canada, France,
Germany, Italy, Japan, Korea, The Netherlands, and the United Kingdom for 1947-1973. We
employed GNP as a measure of output and incorporated constant quality indices of capital
and labor input for each country. Our 1981 paper compared levels of output, inputs, and
productivity for all nine nations.
I have updated the estimates for the G7 - Canada, France, Germany, Italy, Japan, the
United Kingdom, and the United States - through 1995 in earlier work. The updated estimates
are presented in my papers with Chrys Dougherty (1996, 1997) and Eric Yip (2000). We have
shown that productivity accounted for only eleven percent of economic growth in Canada and
the United States over the period 1960-1995.
My paper with Yip (2000) attributed forty-seven percent of Japanese economic growth
during the period 1960-1995 to productivity growth. The proportion attributable to
productivity approximated forty percent of growth for the four European countries – France

5
(38), Germany (42), Italy (43), and the United Kingdom (36). Input growth predominated
over productivity growth for all the G7 nations.
I have now incorporated new data on investment in information technology equipment
and software for the G7. I have also employed internationally harmonized prices like those
constructed by Schreyer (2000). As a consequence, I have been able to separate the
contribution of capital input to economic growth into IT and Non-IT components. While IT
investment follows similar patterns in all the G7 nations, Non-IT investment varies
considerably and helps to explain important differences in growth rates among the G7.
2.1. Comparisons of Output, Input, and Productivity
My first objective is to extend my estimates for the G7 nations with Christensen,
Cummings, Dougherty, and Yip to the year 2001. Following the methodology of my
Presidential Address, I have chosen GDP as a measure of output. I have included imputations
for the services of consumers' durables as well as land, buildings, and equipment owned by
nonprofit institutions. I have also distinguished between investments in information
technology equipment and software and investments in other forms of tangible assets.
A constant quality index of capital input is based on weights that reflect differences in
capital consumption, tax treatment, and the rate of decline of asset prices. I have derived
estimates of capital input and property income from national accounting data. Similarly, a
constant quality index of labor input is based on weights by age, sex, educational attainment,
and employment status. I have constructed estimates of hours worked and labor compensation
from labor force surveys for each country.
In Table 1 I present output per capita for the G7 nations from 1980 to 2001, taking the
U.S. as 100.0 in 2000. Output and population are given separately in Tables 2 and 3. I use
1999 purchasing power parities from the OECD to convert output from domestic prices for
each country into U.S. dollars. The U.S. gained the lead among the G7 countries in output per
capita after 1995. Canada led the U.S. in 1980, but fell behind during the 1995. The U.S.-
Canada gap widened considerably during the 1990’s.
The four major European nations – the U.K., France, Germany, and Italy - had similar
levels of output per capita throughout the period 1980-2001. Japan rose from last place in
1980 to fourth among the G7 in 2001, lagging considerably behind the U.S. and Canada, but
only slightly behind the U.K. in 2001. Japan led the G7 in the growth of output per capita
from 1980-1995, but fell behind the U.S., Canada, the U.K., France, and Italy after 1995.

6
In Table 1 I present input per capita for the G7 over the period 1980-2000, taking the
U.S. as 100.0 in 2000. I express input per capita in U.S. dollars, using purchasing power
parities constructed for this study.10 The U.S. was the leader among the G7 in input per capita
throughout the period. In 2001 Canada ranked next to the U.S. with Japan third and Germany
fourth. France and Italy started at the bottom of the ranking and remained there throughout the
period.
In Table 1 I also present productivity levels for the G7 over the period 1980-2001.
Productivity is defined as the ratio of output to input, including both capital and labor inputs.
Italy led in 1980 and Canada was the productivity leader throughout the period 1989-2001
with France close behind. Japan made substantial gains in productivity during the period,
while there were more modest increases in the U.S., Canada, the U.K., France, and Germany,
and a decline in Italy.
I summarize growth in output and input per capita and productivity for the G7 nations
in Table 4. I present growth rates of output and population for the period 1980-2001 in Tables
2 and 3. Output growth slowed in the G7 after 1989, but revived for all nations except Japan
and Germany after 1995. Output per capita followed a similar pattern with Canada barely
expanding during the period 1990-1995.
Japan led in growth of output and output per capita through 1995, but fell to the lower
echelon of the G7 after 1995. Japan also led in productivity growth throughout the period
1980-2001. For all countries and all time periods, except for Germany during the period 1989-
1995 and Japan after 1995, the growth of input per capita exceeded growth of productivity by
a substantial margin. Productivity growth in the G7 slowed during the period 1989-1995,
except for Germany and Italy, where productivity slumped after 1995.
Italy led the G7 in growth of input per capita for the periods 1980-1989 and 1995-
2001, but relinquished leadership to the U.K. for the period 1989-1995. Differences among
input growth rates are smaller than differences among output growth rates, but there was a
slowdown in input growth during 1989-1995 throughout the G7. After 1995 growth of input
per capita increased in every G7 nation except Japan.
10The purchasing power parities for outputs are based on OECD (2002). Purchasing power parities for inputsfollow the methodology described in detail by Jorgenson and Yip (2001).

7
2.2. Comparisons of Capital and Labor Quality
A constant quality index of capital input weights capital inputs by property
compensation per unit of capital. By contrast an index of capital stock weights different types
of capital by asset prices. The ratio of capital input to capital stock measures the average
quality of a unit of capital. This represents the difference between the constant quality index
of capital input and the index of capital stock employed, for example, by Kuznets (1971) and
Robert Solow (1970).
In Table 5 I present capital input per capita for the G7 countries over the period 1980-
2001 relative to the U.S. in 2000. The U.S. was the leader in capital input per capita
throughout the period, while the U.K. was the laggard. Canada led the remaining six countries
in 1980, but was overtaken by Germany and Italy in 1995. Italy led the rest of the G7 through
2001, but lagged considerably behind the United States.
The picture for capital stock per capita has some similarities to capital input, but there
are important differences. Capital stock levels do not accurately reflect the substitutions
among capital inputs that accompany investments in tangible assets, especially investments in
IT equipment and software. The U.S. led the G7 in capital stock per capita as well as capital
input after 1989, while Japan led in 1980 and was second to the U.S. after 1989. The U.K.
lagged the remaining countries of the G7 throughout the period.
The behavior of capital quality highlights the differences between the constant quality
index of capital input and capital stock. There are important changes in capital quality over
time and persistent differences among countries, so that heterogeneity in capital input must be
taken into account in international comparisons of economic performance. Canada was the
international leader in capital quality throughout the period 1980-2001, while Japan ranked at
the bottom of the G7.
I summarize growth in capital input and capital stock per capita, as well as capital
quality for the G7 nations in Table 8. Italy was the international leader in capital input growth
from 1980-1989, while Canada was the laggard. The U.K. led from 1989-1995, while Canada
lagged considerably behind the rest of the G7. The U.S. took the lead after 1995. There was a
slowdown in capital input growth throughout the G7 after 1989, except for the U.K., and a
revival after 1995 in the U.S., Canada, France, and Italy.
A constant quality index of labor input weights hours worked for different categories
by labor compensation per hour. An index of hours worked fails to take quality differences
into account. The ratio of labor input to hours worked measures the average quality of an hour

8
of labor, as reflected in its marginal product. This represents the difference between the
constant quality index of labor input and the index of hours worked employed, for example,
by Kuznets (1971) and Solow (1970).
In Table 11 I present labor input per capita for the G7 nations for the period 1980-
2001 relative to the U.S. in 2000. Japan was the international leader throughout the period and
France and Italy the laggards. Labor input in Japan was nearly double that of Italy. The U.S.
led the remaining G7 nations throughout the period. The U.K. ranked third among the G7
through 1995. Italy and France lagged behind the rest of the G7 for the entire period.
The picture for hours worked per capita has some similarities to labor input, but there
are important differences. Japan was the international leader in hours worked per capita. The
U.S., Canada, and the U.K. moved roughly in parallel. The U.K. ranked second in 1980 and
1989, while the U.S. ranked second in 1995 and 2001. France and Italy lagged the rest of the
G7 from 1980-2001.
The behavior of labor quality highlights the differences between labor input and hours
worked. Germany was the leader in labor quality throughout the period 1980-2001 with the
U.S. close behind. Canada, the U.K., France, and Japan had similar levels of labor quality
throughout the period, but fell short of German and U.S. levels. Italy was the laggard among
the G7 in labor quality.
I summarize growth in labor input and hours worked per capita, as well as labor
quality for the period 1980-2001 in Table 12. Canada and Japan led the G7 nations in labor
input growth during the 1980’s, France led from 1989-1995 but relinquished its leadership to
Italy after 1995. Labor input growth was negative for France during the 1980’s, for the U.K.,
Germany, Italy, and Japan during the period 1989-1995, and for Japan after 1995.
Hours worked per capita fell continuously throughout the period 1980-2001 for Japan
and declined for all the G7 nations during the period 1989-1995. Growth in labor quality was
positive for the G7 nations in all time periods. Japan was the leader during the 1980’s,
relinquishing its lead to France during the early 1990’s and Italy in the late 1990’s. Growth in
labor quality and hours worked are equally important as sources of growth in labor input for
the G7.
3. Investment in Information Technology
Using data from Tables 1 and 2, I can assess the relative importance of investment and
productivity as sources of economic growth for the G7 nations. Investments in tangible assets

9
and human capital greatly predominated over productivity during the period 1980-2001.
While productivity fell in Italy during this period, the remaining G7 countries had positive
productivity growth for the period as a whole.
Similarly, using data from Table 5 I can assess the relative importance of growth in
capital stock and capital quality. Capital input growth was positive for all countries for the
period 1980-2001 and all three sub-periods. Capital quality growth was positive for the period
as a whole for all G7 countries. Although capital stock predominated in capital input growth,
capital quality was also quantitatively significant, especially after 1995.
Finally, using data from Table 11 I can assess the relative importance of growth in
hours worked and labor quality. Hours worked per capita declined for France, Germany, and
Japan, while labor quality rose in these nations during the period 1980-2001. For the U.S.,
Canada, the U.K., and Italy, both hours worked per capita and labor quality rose. I conclude
that labor quality growth is essential to the analysis of growth in labor input.
3.1. Investment in IT Equipment and Software
The final step in the comparison of patterns of economic growth among the G7 nations
is to analyze the impact of investment in information technology equipment and software. In
Table 6 I present levels of IT capital input per capita for the G7 for the period 1980-2001,
relative to the U.S. in 2000. The U.S. overtook Germany in 1989 and remained the leader
through 2001. Canada and Japan lagged behind the rest of the G7 through 1995, but France
fell into last place in 2001.
Table 6 reveals substantial differences between IT capital stock and IT capital input.
The G7 nations began with very modest stocks of IT equipment and software per capita in
1980. These stocks expanded rapidly during the period 1980-2001. The U.S. led in IT capital
stock throughout the period, while Japan moved from the third lowest level in 1980 to the
second highest in 2001.
IT capital quality reflects differences in the composition of IT capital input, relative to
IT capital stock. A rising level of capital quality indicates a shift toward short-lived assets,
such as computers and software. This shift is particularly dramatic for the U.S., Canada, and
Japan, while the composition of IT capital stock changed relatively less for the U.K., France,
Germany, and Italy. Patterns for Non-IT capital input, capital stock, and capital quality given
in Table 7 largely reflect those for capital as a whole, presented in Table 5.

10
I give growth rates for IT capital input per capita, capital stock per capita, and capital
quality in Table 9. The G7 nations have exhibited double-digit growth in IT capital input per
capita since 1995. Canada was the international leader during this period with Japan close
behind. Japan was the leader in growth of IT capital input during the 1980’s, another period
of double-digit growth in the G7. However, Japanese IT growth slowed substantially during
1989-1995 and Canada gained the lead.
Patterns of growth for IT capital stock per capita are similar to those for IT capital
input for the four European countries. Changes in the composition of IT capital stock per
capita were important sources of growth of IT capital input per capita for the U.S., Canada,
and Japan. IT capital stock also followed the pattern of IT capital input with substantial
growth during the 1980’s, followed by a pronounced lull during the period 1989-1995. After
1995 the growth rates of IT capital stock surged in all the G7 countries, except Germany, but
exceeded the rates of the 1980’s only for the U.S. and Japan.
Finally, growth rates for IT capital quality reflect the rates at which shorter-lived IT
assets are substituted for longer-lived assets. Japan led in the growth of capital quality during
the 1980’s, but relinquished its lead to Canada in 1989. IT capital quality growth for the
Canada substantially outstripped that of the remaining G7 countries for the period 1989-2001.
Patterns of growth in Non-IT capital input per capita, Non-IT capital stock per capita, and
Non-IT capital quality given in Table 10 largely reflect those for capital as a whole presented
in Table 8.
Table 13 and Figure 1 present the contribution of capital input to economic growth for
the G7 nations, divided between IT and Non-IT. The powerful surge of IT investment in the
U.S. after 1995 is mirrored in similar jumps in growth rates of the contribution of IT capital
through the G7. The contribution of IT capital input was similar during the 1980’s and the
period 1989-1995 for all the G7 nations, despite the dip in rates of economic growth after
1989. Japan is an exception to this general pattern with a contribution of IT capital
comparable to that of the U.S. during the 1980’s, followed by a decline in this contribution
from 1989-1995, reflecting the sharp downturn in Japanese economic growth.
The contribution of Non-IT capital input to economic growth after 1995 exceeded that
for IT capital input for four of the G7 nations; the exceptions were Canada, the U.K., and
Japan. The U.S. stands out in the magnitude of the contribution of capital input after 1995.
Both IT and Non-IT capital input contributed to the U.S. economic resurgence of the last half
of the 1990’s. Despite the strong performance of IT investment in Japan after 1995, the

11
contribution of capital input declined substantially; this contribution also declined for the
U.K. and Germany.
3.2. The Relative Importance of Investment and Productivity
Table 14 and Figure 2 present contributions to economic growth from productivity,
divided between the IT-producing and Non-IT-producing industries. The methodology for this
division follows Triplett (1996). The contribution of IT-producing industries is positive
throughout the period 1980-2001 and jumps substantially after 1995. Since the level of
productivity in Italy is higher in 1980 than in 2001, it is not surprising that the contribution of
productivity growth in the Non-IT industries was negative throughout the period. Productivity
in these industries also declined during 1989-1995 in Canada, the U.K., and France and after
1989 in Germany as well as Italy.
Table 15 and Figure 3 give a comprehensive view of the sources of economic growth
for the G7. The contribution of capital input alone exceeds that of productivity for most
nations and most time periods. The contribution of Non-IT capital input predominates over IT
capital input for most countries and most time periods with Canada in 1989-2001, and the
U.K. and Japan after 1995 as exceptions. This can be attributed to the unusual weakness in the
growth of aggregate demand in these countries. The contribution of labor input varies
considerably among the G7 nations with negative contributions after 1995 in Japan, during
the 1980’s in France, and during the period 1989-1995 in the U.K. and Germany.
Finally, Table 16 and Figure 4 translate sources of growth into sources of growth in
average labor productivity (ALP). ALP, defined as output per hour worked, must be carefully
distinguished from overall productivity, defined as output per unit of both capital and labor
inputs. Output growth is the sum of growth in hours worked and growth in ALP. ALP growth
depends on the contribution of capital deepening, the contribution of growth in labor quality,
and productivity growth.
Capital deepening is the contribution of growth in capital input per hour worked and
predominates over productivity as a source of ALP growth for the G7 nations. IT capital
deepening predominates over Non-IT capital deepening in the U.S. throughout the period
1980-2001 and in Canada after 1989, the U.K., France, and Japan after 1995. Finally, the
contribution of labor quality is positive for all the G7 nations through the period.

12
4. Demise of Traditional Growth Accounting
The early 1970's marked the emergence of a rare professional consensus on economic
growth, articulated in two strikingly dissimilar books. Kuznets summarized his decades of
empirical research in Economic Growth of Nations (1971). "11 Solow's book Economic
Growth (1970), modestly subtitled "An Exposition", contained his 1969 Radcliffe Lectures at
the University of Warwick. In these lectures Solow also summarized decades of theoretical
research, initiated by the work of Roy Harrod (1939) and Domar (1946).12
Let me first consider the indubitable strengths of the perspective on growth that
emerged victorious over its many competitors in the early 1970's. Solow's neo-classical theory
of economic growth, especially his analysis of steady states with constant rates of growth,
provided conceptual clarity and sophistication. Kuznets generated persuasive empirical
support by quantifying the long sweep of historical experience of the United States and
thirteen other
developed economies. He combined this with quantitative comparisons among developed and
developing economies during the postwar period.
With the benefit of hindsight the most obvious deficiency of the traditional framework
of Kuznets and Solow was the lack of a clear connection between the theoretical and the
empirical components. This lacuna can be seen most starkly in the total absence of cross
references between the key works of these two great economists. Yet they were working on
the same topic, within the same framework, at virtually the same time, and in the very same
geographical location --Cambridge, Massachusetts!
Searching for analogies to describe this remarkable coincidence of views on growth,
we can think of two celestial bodies on different orbits, momentarily coinciding from our
earth-bound perspective at a single point in the sky and glowing with dazzling but transitory
luminosity. The indelible image of this extraordinary event has been burned into the collective
memory of economists, even if the details have long been forgotten. The resulting
11The enormous impact of this research was recognized in the same year by the Royal Swedish Academy ofSciences in awarding the third Bank of Sweden Prize in Economic Sciences in Memory of Alfred Nobel toKuznets "for his empirically founded interpretation of economic growth which has led to new and deepenedinsight into the economic and social structure and process of development.” See Assar Lindbeck (1992), p. 79.12Solow's seminal role in this research, beginning with his brilliant and pathbreaking essay of 1956, "AContribution to the Theory of Economic Growth", was recognized, simply and elegantly, by the Royal SwedishAcademy of Sciences in awarding Solow the Nobel Prize in Economics in 1987 "for his contributions to thetheory of economic growth." See Karl-Goran Maler (1992), p. 191. Solow (1999) presents an updated version ofhis exposition of growth theory.

13
professional consensus, now obsolete, remained the guiding star for subsequent conceptual
development and empirical observation for decades.
4.1. Human Capital
The initial challenge to the framework of Kuznets and Solow was posed by Denison's
magisterial study, Why Growth Rates Differ (1967). Denison retained NNP as a measure of
national product and capital stock as a measure of capital input, adhering to the conventions
employed by Kuznets and Solow. Denison's comparisons among nine industrialized
economies over the period 1950-1962 were cited extensively by both Kuznets and Solow.
However, Denison departed from the identification of labor input with hours worked
by Kuznets and Solow. He followed his earlier study of U.S. economic growth, The Sources
of Economic Growth in the United States and the Alternatives Before Us, published in 1962.
In this study he had constructed constant quality measures of labor input, taking into account
differences in the quality of hours worked due to the age, sex, and educational attainment of
workers.
Kuznets (1971), recognizing the challenge implicit in Denison's approach to
measuring labor input, presented his own version of Denison's findings.13 He carefully purged
Denison's measure of labor input of the effects of changes in educational attainment. Solow,
for his part, made extensive references to Denison's findings on the growth of output and
capital stock, but avoided a detailed reference to Denison's measure of labor input. Solow
adhered instead to hours worked (or "man-hours" in the terminology of the early 1970's) as a
measure of labor input.14
Kuznets showed that "... with one or two exceptions, the contribution of the factor
inputs per capita was a minor fraction of the growth rate of per capita product."15 For the
United States during the period 1929 to 1957, the growth rate of productivity or output per
unit of input exceeded the growth rate of output per capita. According to Kuznets’ estimates,
the contribution of increases in capital input per capita over this extensive period was
negative!
13Kuznets (1971), Table 9, part B, pp. 74-75.14Solow (1970), pp. 2-7. However, Solow (1988), pp. 313-314, adopted Denison's perspective on labor input inhis Nobel Prize address.

14
4.2. Solow’s Surprise
The starting point for our discussion of the demise of traditional growth accounting is
a notable but neglected article by the great Dutch economist Jan Tinbergen (1942), published
in German during World War II. Tinbergen analyzed the sources of U.S. economic growth
over the period 1870-1914. He found that efficiency accounted only a little more than a
quarter of growth in output, while growth in capital and labor inputs accounted for the
remainder. This was precisely the opposite of the conclusion that Kuznets (1971) and Solow
(1970) reached almost three decades later!
The notion of efficiency or "total factor productivity" was introduced independently
by George Stigler (1947) and became the starting point for a major research program at the
National Bureau of Economic Research. This program employed data on output of the U.S.
economy from earlier studies by the National Bureau, especially the pioneering estimates of
the national product by Kuznets (1961). The input side employed data on capital from
Raymond Goldsmith's (1962) system of national wealth accounts. However, much of the data
was generated by John Kendrick (1956, 1961), who employed an explicit system of national
production accounts, including measures of output, input, and productivity for national
aggregates and individual industries.16
The econometric models of Paul Douglas (1948) and Tinbergen were integrated with
data from the aggregate production accounts generated by Abramovitz (1956) and Kendrick
(1956) in Solow's justly celebrated 1957 article, "Technical Change and the Aggregate
Production Function". Solow identified "technical change" with shifts in the production
function. Like Abramovitz, Kendrick, and Kuznets, he attributed almost all of U.S. economic
growth to "residual" growth in productivity.17
Kuznets' (1971) international comparisons strongly reinforced the findings of
Abramovitz (1956), Kendrick (1956), and Solow (1957), which were limited to the United
States.18 According to Kuznets, economic growth was largely attributable to the Solow
residual between the growth of output and the growth of capital and labor inputs, although he
15Kuznets (1971), p. 73.16Updated estimates based on Kendrick’s framework are presented by Kendrick (1973) and Kendrick andGrossman (1980).
17This finding is called “Solow’s Surprise” by William Easterly (2001) and is listed as one of the “stylized facts”about economic growth by Robert King and Sergio Rebelo (1999).18A survey of international comparisons, including Tinbergen (1942)and Kuznets (1971), is given in my paperwith Christensen and Cummings (1980), presented at the forty-fourth meeting of the Conference on Researchand Wealth, held at Williamsburg, Virginia, in 1975.

15
did not use this terminology. Kuznets' assessment of the significance of his empirical
conclusions was unequivocal:
(G)iven the assumptions of the accepted national economic accounting framework,
and the basic demographic and institutional processes that control labor supply, capital
accumulation, and initial capital-output ratios, this major conclusion -- that the
distinctive feature of modern economic growth, the high rate of growth of per capita
product is for the most part attributable to a high rate of growth in productivity -- is
inevitable.19
The empirical findings summarized by Kuznets have been repeatedly corroborated in
investigations that employ the traditional approach to growth accounting. This approach
identifies output with real NNP, labor input with hours worked, and capital input with real
capital stock.20 Kuznets (1979) interpreted the Solow residual as due to exogenous
technological innovation. This is consistent with Solow's (1957) identification of the residual
with technical change. Successful attempts to provide a more convincing explanation of the
Solow residual have led, ultimately, to the demise of the traditional framework.21
4.3. Radical Departure
The most serious challenge to the traditional approach growth accounting was
presented in my 1967 paper with Zvi Griliches, "The Explanation of Productivity Change".
Griliches and I departed far more radically than Denison from the measurement conventions
of Kuznets and Solow. We replaced NNP with GNP as a measure of output and introduced
constant quality indexes for both capital and labor inputs.
The key idea underlying our constant quality index of labor input, like Denison's, was
to distinguish among different types of labor inputs. We combined hours worked for each type
into a constant quality index of labor input, using the index number methodology Griliches
(1960) had developed for U.S. agriculture. This considerably broadened the concept of
substitution employed by Solow (1957). While he had modeled substitution between capital
and labor inputs, Denison, Griliches and I extended the concept of substitution to include
19Kuznets (1971), p. 73; see also, pp. 306-309.20For recent examples, see Michael Dertouzos, Solow, and Richard Lester (1989) and Hall (1988, 1990).
21A detailed survey of research on sources of economic growth is given in my 1990 article, "Productivity andEconomic Growth", presented at the The Jubilee of the Conference on Research in Income and Wealth, held inWashington, D.C., in 1988, commemorating the fiftieth anniversary of the founding of the Conference by

16
different types of labor inputs as well. This altered, irrevocably, the allocation of economic
growth between substitution and technical change.22
Griliches and I introduced a constant quality index of capital input by distinguishing
among types of capital inputs. To combine different types of capital into a constant quality
index, we identified the prices of these inputs with rental prices, rather than the asset prices
used in measuring capital stock. For this purpose we used a model of capital as a factor of
production I had introduced in my 1963 article, "Capital Theory and Investment Behavior".
This made it possible to incorporate differences among depreciation rates on different assets,
as well as variations in returns due to the tax treatment of different types of capital income,
into our constant quality index of capital input.23
Finally, Griliches and I replaced the aggregate production function employed by
Denison, Kuznets, and Solow with the production possibility frontier introduced in my 1966
paper, "The Embodiment Hypothesis" and employed in Section 2 above. This allowed for
joint production of consumption and investment goods from capital and labor inputs. I had
used this approach to generalize Solow's (1960) concept of embodied technical change,
showing that economic growth could be interpreted, equivalently, as "embodied" in
investment or "disembodied" in productivity growth. My 1967 paper with Griliches removed
this indeterminacy by introducing constant quality price indexes for investment goods.24
Griliches and I showed that changes in the quality of capital and labor inputs and the
quality of investment goods explained most of the Solow residual. We estimated that capital
and labor inputs accounted for eighty-five percent of growth during the period 1945-1965,
while only fifteen percent could be attributed to productivity growth. Changes in labor quality
explained thirteen percent of growth, while changes in capital quality another eleven
percent.25 Improvements in the quality of investment goods enhanced the growth of both
Kuznets. More recent surveys are presented in Griliches’ (2000) posthumous book, R&D, Education, andProductivity, and Charles Hulten’s (2001) article, “Total Factor Productivity: A Short Biography”.22Constant quality indexes of labor input are discussed detail by Jorgenson, Gollop, and Fraumeni (1987),Chapters 3 and 8, pp. 69-108 and 261-300, and Jorgenson, Ho, and Stiroh (2004).23I have presented a detailed survey of empirical research on the measurement of capital input in my 1989 paper,"Capital as a Factor of Production". Earlier surveys were given in my 1973 and 1980 papers and Diewert's(1980) contribution to the forty-fifth meeting of the Conference on Income and Wealth, held at Toronto, Ontario,in 1976. Hulten (1990) surveyed conceptual aspects of capital measurement in his contribution to the Jubilee ofthe Conference on Research in Income and Wealth in 1988.24As a natural extension of Solow's (1956) one-sector neo-classical model of economic growth, his 1960 modelof embodiment had only a single output and did not allow for the introduction of a separate price index forinvestment goods. Recent research on Solow’s model of embodiment is surveyed by Greenwood and BoyanJovanovic (2001) and discussed by Solow (2001).25See Jorgenson and Griliches (1967), Table IX, p. 272. We also attributed thirteen percent of growth to therelative utilization of capital, measured by energy consumption as a proportion of capacity; however, this is

17
investment goods output and capital input; the net contribution was only two percent of
growth.26
4.4. The Rees Report
The demise of the traditional framework for productivity measurement gained
momentum with the Panel to Review Productivity Statistics of the National Research Council,
chaired by Albert Rees. The Rees Report of 1979, Measurement and Interpretation of
Productivity, became the cornerstone of a new measurement framework for the official
productivity statistics. This was implemented by the Bureau of Labor Statistics (BLS), the
U.S. government agency responsible for these statistics.
Under the leadership of Jerome Mark and Edwin Dean the BLS Office of Productivity
and Technology undertook the construction of a production account for the U.S. economy
with measures of capital and labor inputs and total factor productivity, renamed multifactor
productivity.27 The BLS (1983) framework was based on GNP rather than NNP and included
a constant quality index of capital input, displacing two of the key conventions of the
traditional framework of Kuznets and Solow.28
However, BLS retained hours worked as a measure of labor input until July 11, 1994,
when it released a new multifactor productivity measure including a constant quality index of
labor input as well. Meanwhile, BEA (1986) had incorporated a constant quality price index
for computers into the national accounts -- over the strenuous objections of Denison (1989).
This index was incorporated into the BLS measure of output, completing the displacement of
the traditional framework of economic measurement by the conventions employed in my
papers with Griliches.29
The official BLS (1994) estimates of multifactor productivity have over-turned the
findings of Abramovitz (1956) and Kendrick (1956), as well as those of Kuznets (1971) and
Solow (1970). The official statistics have corroborated the findings summarized in my 1990
survey paper, "Productivity and Economic Growth". These statistics are now consistent with
inappropriate at the aggregate level, as Denison (1974), p. 56, pointed out. For additional details, see Jorgenson,Gollop, and Fraumeni (1987), especially pp. 179-181.26Using Gordon's (1990) estimates of improvements in the quality of producers' durables, Hulten (1992)estimated this proportion as 8.5 percent of the growth of U.S. manufacturing output for the period 1949-1983.27A detailed history of the BLS productivity measurement program is presented by Dean and Harper (2001).28The constant quality index of capital input became the international standard for measuring productivity inBlades’ (2001) OECD manual, Measuring Capital.29The constant quality index of labor input became the international standard in the United Nations (1993)System of National Accounts.

18
the original findings of Tinbergen (1942), as well as my paper with Griliches (1967), and the
results I have presented in Section 3.2.
The approach to growth accounting presented in my 1987 book with Gollop and
Fraumeni and the official statistics on multifactor productivity published by the BLS in 1994
has now been recognized as the international standard. The new framework for productivity
measurement is presented in Measuring Productivity, a Manual published by the Organisation
for Economic Co-Operation and Development (OECD) and written by Schreyer (2001). The
expert advisory group for this manual was chaired by Dean, former Associate Commissioner
for Productivity at the BLS, and leader of the successful effort to implement the Rees Report
(1979).
5. Conclusions
I conclude that a powerful surge in investment in information technology and
equipment after 1995 characterizes all of the G7 economies. This accounts for a large portion
of the resurgence in U.S. economic growth, but contributes substantially to economic growth
in the remaining G7 economies as well. Another significant source of the G7 growth
resurgence after 1995 is a jump in productivity growth in IT-producing industries.
For Japan the dramatic upward leap in the impact of IT investment after 1995 was
insufficient to overcome downward pressures from deficient growth of aggregate demand.
This manifests itself in declining contributions of Non-IT capital and labor inputs. Similar
downturns are visible in Non-IT capital input in France, Germany, and especially the U.K.
after 1995.
These findings are based on new data and new methodology for analyzing the sources
of economic growth. Internationally harmonized prices for information technology equipment
and software are essential for capturing differences among the G7 nations. Constant quality
indices of capital and labor inputs are necessary to incorporate the impacts of investments in
information technology and human capital.
Exploiting the new data and methodology, I have been able to show that investment in
tangible assets is the most important source of economic growth in the G7 nations. The
contribution of capital input exceeds that of productivity for all countries for all periods. The
relative importance of productivity growth is far less than suggested by the traditional
methodology of Kuznets (1971) and Solow (1970), which is now obsolete.

19
Andrzej K. Ko źmiński: Thank you professor Jorgenson for your fascinating lecture. You
have shown us some new frontiers in economic research and economic development. We still
have some time for questions and a discussion.
Andrzej Kuklinski, Warsaw University: It was a very charming and charismatic lecture. I
would like to invite you to a discussion on four comments. The first comment is that we are
recognising turning points in history with some delay. This applies to the year 1995, a delay
that is probably shortening. The same was with the recognition of the industrial revolution
taking place in England – this was probably also recognised with some delay of perhaps 50
years or so. That is the first comment. The second one is that the revolution in information
technology is a revolution of nanotechnology. It is seldom mentioned that nanotechnology has
given a new big push to information technology. The third question is that the United States
have a very privileged position in global history. It was able to build into the system of
national accounts and into the system of statistics - this new phenomenon. Therefore the
social sciences in the United States are in a privileged position, because they have the
empirical evidence. In this field, for example, the European Union is trying to follow in the
same direction, yet is still far behind. The last comment is: if you were to apply your thinking
to China and India – when would you find in these countries the turning point of 1995?
Dale W. Jorgenson: First of all, remember that a turning point is a turning point in a world
technology. The technologies that I have described here are in fact pervasive throughout the
world. Semi-conductor technology is developed just as far in Europe and in Asia as it is in the
United States. But I agree completely with your observation that the US is in a very privileged
position in that the data that I described here are built into our national accounts and further
developments are built into national accounts as they occur. Why is that important? That is
important, because people rely on these national accounting systems. You, as students, also
have to rely on the official statistics. You can not think beyond the official statistics, beyond
the research frontier. This is something that has to be obvious when you pick up the official
statistics or when you open the newspaper. That, being the case, is a very important program
here to bring national accounting systems into alignment with this set of new developments.
That is the role that European Union has taken on and I am happy to say that the OECD is
taking on – these are both organisations now that Poland is fully involved in and that, I think,
is a very, very optimistic development.

20
That relates to your second point and that is that the speed at which these
developments can diffuse around the world is now accelerated precisely by information
technology. You can find a lot of this information on the internet, you can pick up the latest
information on it from the EU and the OECD. So, you are absolutely right: time has
contracted. Of course, a development like this, which is fundamental to the world economy,
has been totally dissociated from any kind of political event. There was no fall of a Berlin
Wall, there was no dissolution of the Soviet Union. There was only the International Road
Map for Semiconductors! A few engineers, now about 1200 engineers, knew about this, but
this was something that was totally concealed from view until people begun to pick up their
national accounts and say: “Something has changed”.
And now the final point – nanotechnology. Here is an analogy – Moore’s Law.
Moore’s Law looks very smooth, geometric increase in the number of transitors on a chip.
Here is the story that people often tell about Moore’s Law. Suppose that you are going to
view Moore’s Law as a trip in an automobile, like the Rolls-Royce that you are going to
throw away at the end of the trip. Then every 100 miles the automobile would fall apart, and
you have to rebuild it from scratch. Therefore, as you proceed, from 200 miles to 400 miles,
say, you are re-building the technology and that comes to your point of nanotechnology. The
challenges ahead, in terms of miniaturisation, involve new frontiers of physics and
engineering. Every new device requires a whole new configuration of technology, a whole
new configuration of the factories that produces the devices. All of this that has to be rebuilt
from scratch every two years. The stress is enormous at every level – from the researcher at
the lab bench all the way down to the worker at the factory. And it is something that has
commanded, of course, enormous and increasing resources. So, I agree completely with all of
your four comments.
Piotr Błoński, student - Science Club “Little Tigers”: I have a short question: will the IT
revolution last?
Dale W. Jorgenson: This is a very interesting question. This is now going on, as you see in
the history of computer prices since 1959, and it is accelerating, getting to be faster. Will all
this come to an end? Well, obviously we do not know. There are no fixed answers to this that
we could rely on at the moment. We have the semi-conductor road map. We know that
engineers and technologists can foresee the future developments in this area. They can not
very well forecast the speed (which is accelerating) and whether that will continue. It has
21
continued up to 2003, last year, but the next generation of technology is due in 2005 or maybe
2006. There is a big dispute going on in the industry about which one is likely to prevail.
Conservative technologists take the position that the nest generation of technology has to be at
the three-year pace, whereas business people in the industry say “no”, competition is going to
drive this to continue the two-year pace with all the challenges that that will entail.
So, the answer is “we do not know”. We do not have any idea, but we are just
beginning to understand some of the implications. Let me give you an example. The example
that I would like to think about here is telecom. Telecom is the original information
technology. And so, of course, we have all been amazed at the development of cell phones
and all the rest of it, but the biggest development is still to come. The whole of our telecom
network for voice is based on an analogue system – it is not based on digital technology at all.
We are about to replace this analogue system, which has been with us since the invention of
the telephone, by a network in which everything is going to be digitised, just the way it is on
the computer. That process is going to be Voice-Over-Internet-Protocol (VoIP) and that is
going to replace the whole of the telecommunications technology that we use for voice
communication. Not in your lifetime, but probably before some of you leave this very
distinguished school. That will be taking place in a way that essentially replaces existing
technologies by a digitised semi-conductor driven technology.
So the idea that we are running out of things to do in this area -- that we are running
out of areas to digitise -- is very, very far from the truth. We have momentous opportunities
lying ahead of us. Therefore the forces that are driving the speed of the developments that you
have seen here are extremely powerful and involve trillions, literally trillions of dollars and
that being the case, this is going to be part of the world economy for a long time to come.
Wojciech Gasparski, Leon Koźmiński Academy of Entrepreneurship and Management:
As a person who is involved in design methodology and studies related to the designing
process, I would like to add a very important factor to the list of factors that you mentioned as
responsible for the growth. During the period of the development of information technology,
the so-called “design methodological toolbox” profoundly changed, first of all,
modularisation. It was a new device used by designers, to design new technology – computers
in particular – and the second and a very important detail is that we may say now that the
closer the time of the story you told us is to our time, the more computer software is involved
in the process of designing computer technology. Originally it was only designers, humans,
equipped with old, traditional devices, so the toolbox was very primitive, very poor.

22
Gradually, they started using information technology in the process of design activities. So,
these two factors are also very important. Hence, I would suggest you add both of them to
show that not only physics, not only physical discoveries are responsible for growth but also
design methodology. Dimension is also very important, because it is human and it is still very
important for the future.
Dale W. Jorgenson: Exactly. Let me underline what you have just said, which is to say that
the acceleration that took place in 1995 could never have been done without changes in the
principles of design. In other words, this acceleration itself would never have been visible in
the early days of a semi-conductor technology when everything was done according to the old
style. So, at first, semi-conductor technology was known to physicists. The transistor was
invented in Bell Labs by people who thought they were doing physics. And they were. The
integrated circuit was invented by an engineer who got a Nobel Prize in physics for his
invention. This became the basis for the engineering phase. And then, in business schools
throughout the world, obviously including this one, people begun to absorb the importance of
these developments for business practice, for the way in which products are designed, for the
way in which products are moved from their design into the factory. Finally, people began to
consider the implications for the service industries, the major area for application.
What I am here to ask you to do, as economists, is to begin to build this into your
thinking. This is no longer something which should be limited to physicists, engineers and
business applications, but needs to be absorbed into the toolkit of every economist. and
therefore you need to learn how to construct these prices. You need to think about how you
are going to absorb the new information as it begins to emerge from the research that you are
going to hear about at this conference. You need to develop a picture of the way in which this
affects the world economy.
I did not talk about the impact on India and China, but I want to come back to that
now. India and China are relatively minor players in this arena at the moment, but
technologies developed mainly in other countries are moving very quickly into both of these
countries and they are going to be major players in the future. That is the topic for a future
lecture, but the important thing is that the world history for them, as well as for us, changed in
1995, because of design principles that you have just described.
Karol Kuczwalski, student - Science Club “Little Tigers”: Professor Jorgenson, I would
like to ask you why is the European Union still lagging behind the US in the use of IT?

23
Dale W. Jorgenson: Well, it is a mixed picture. Looking at the developments in Europe, the
European Union has many countries that are just as advanced in the use of IT as the US. I
mentioned Britain, Ireland, Finland, and Sweden. It is a long list actually and so there is
nothing intrinsic to the European Union, but we have to include countries that are not so
progressive - Spain, Greece, and others. I think this is an important research topic that I hope
you will pursue. We need to understand the way in which the market responds to information
technology.
I have told you that the implications of this acceleration of the information technology
are that our capital markets failed. Now you can say this sounds like Karl Marx. No, that is
not what I am talking about. What I am saying is that the way in which people priced out the
economic opportunities in this new technology era, which started in 1995, turned out to be
totally wrong. They were wildly overoptimistic in some respects and wildly pessimistic in
others. Capital markets in the US are still the most sophisticated in the world and the capital
markets in Europe, which are not that well developed, made many of the same mistakes, but
not on the same scale. So that we can say there is a great deal to be done in terms of rectifying
the errors that occurred and trying to understand what happened. This is still work very much
in progress, as is very much of the research that is going on today.
The second thing is, and this is an answer to your question very directly, the big
difference between the countries that have been successful in information technology and
those that have not, is in the labour markets. The labour markets in the US are well known to
be extremely flexible – we learnt about this in the energy crisis for the first time – and that is
not accidental. This is something that is the result of decades of institutional change. The
labour markets in Europe had in the meantime been going in the opposite direction – and that,
essentially, is the answer to your question.
So, we need to do research to understand the full implication of what you have asked,
but it is clear just from the facts that I have described that the broad outlines focus on these
factor markets – the markets for capital and labor.
Let me just say that I very much appreciated your questions. This has been a terrific
discussion, I wish we could go on, but I invite you to stay for the rest of the conference, where
we are going to debate all of the issues that you have raised for the rest of the day. I am
personally very much looking forward to this. I am very grateful to the school for organising
this conference and of course to Marcin Piątkowski, who was the driving force in bringing us
all together here to debate this issue. So, thank you very much for your attention.

24
Andrzej K. Ko źmiński: Thank you professor Jorgenson and I would like also to thank your
wife, Linda, who is clearly supporting you here in the audience and we listening very vividly
to what you say, so thank you once again.
Dale W. Jorgenson: That was a fantastic audience. They were terrific, they were absolutely
wonderful.
25
References
Abramovitz, Moses (1956), "Resources and Output Trends in the United States since
1870, American Economic Review, Vol. 46, No. 1, March, pp. 5-23.
Baldwin, John R., and Tarek M. Harchaoui (2002), Productivity Growth in Canada –
2002, Ottawa, Statistics Canada.
Berndt, Ernst R., and Jack Triplett (2000), eds., Fifty Years of Economic
Measurement, Chicago, University of Chicago Press.
Blades, Derek (2001), Measuring Capital: A Manual on the Measurement of Capital
Stocks, Consumption of Fixed Capital, and Capital Services, Paris, Organisation for
Economic Co-operation and Development, April.
Bureau of Economic Analysis (1986), “Improved Deflation of Purchase of
Computers”, Survey of Current Business, Vol. 66, No. 3, March, pp. 7-9.
Bureau of Labor Statistics (1983), Trends in Multifactor Productivity, 1948-1981,
Washington, U.S. Government Printing Office.
_____ (1994), “Multifactor Productivity Measures, 1991 and 1992,” News Release
USDL 94-327, July 11.
Christensen, Laurits R., Dianne Cummings, and Dale W. Jorgenson (1980),
"Economic Growth, 1947-1973: An International Comparison", in John W. Kendrick and
Beatrice Vaccara, eds., New Developments in Productivity Measurement and Analysis,
Chicago, University of Chicago Press, pp. 595-698.
_____, _____ and _____ (1981), "Relative Productivity Levels", 1947-1973",
European Economic Review, Vol. 16, No. 1, May, pp. 61-94.
Colecchia, Alessandra, and Paul Schreyer (2002), “ICT Investment and Economic
Growth in the 1990s: Is the United States a Unique Case? A Comparative Study of Nine
OECD Countries”, Review of Economic Dynamics, Vol. 5, No. 2, April 2002, pp. 408-442.
Dean, Edwin R., and Michael J. Harper (2001), “The BLS Productivity Measurement
Program,” in Dean, Harper, and Hulten, eds., pp. 55-84.
Denison, Edward F. (1962), The Sources of Economic Growth in the United States and
the Alternatives Before Us, New York, Committee on Economic Development.
_____ (1967), Why Growth Rates Differ, Washington, The Brookings Institution.
_____ (1974), Accounting for United States Economic Growth, Washington, The
Brookings Institution.
26
_____ (1989), Estimates of Productivity Change by Industry, Washington, Brookings
Institution.
Dertouzos, Michael, Robert M. Solow and Richard K. Lester (1989), Made in
American: Regaining the Productive Edge, Cambridge, The MIT Press.
Diewert, W. Erwin (1980), “Aggregation Problems in the Measurement of Capital”, in
Daniel Usher, ed., The Measurement of Capital, Chicago, University of Chicago Press, pp.
433-528.
Domar, Evsey (1946), “Capital Expansion, Rate of Growth and Employment”,
Econometrica, Vol. 14, No. 2, April, pp. 137-147.
Dougherty, Chrys, and Dale W. Jorgenson (1996), "International Comparisons of the
Sources of Economic Growth", American Economic Review, Vol. 86, No. 2, May, pp. 25-29.
_____ and _____ (1997), "There Is No Silver Bullet: Investment and Growth in the
G7", National Institute Economic Review, No. 162, October, pp. 57-74.
Douglas, Paul H. (1948), "Are There Laws of Production?" American Economic
Review, Vol. 38, No. 1, March, pp. 1-41.
Easterly, William (2001), The Elusive Quest for Growth, Cambridge, The MIT Press.
Gordon, Robert J. (1990), The Measurement of Durable Goods Prices, Chicago,
University of Chicago Press.
Greenwood, Jeremy and Boyan Jovanovic (2001), “Accounting for Growth”, in
Hulten, Dean, and Harper, eds., pp. 179-222.
Griliches, Zvi (1960), "Measuring Inputs in Agriculture: A Critical Survey", Journal
of Farm Economics, Vol. 40, No. 5, December, pp. 1398-1427.
_____ (2000), R&D, Education, and Productivity, Cambridge, Harvard University
Press.
Hall, Robert E. (1988), “The Relation between Price and Marginal cost in U.S.
Industry”, Journal of Political Economy, Vol. 96, No. 5, October, pp. 921-947.
_____ (1990), “Invariance Properties of Solow’s Productivity Residual”, in Peter
Diamond, ed., Growth/Productivity/Employment, Cambridge, The MIT Press.
Harrod, Roy (1939), “An Essay in Dynamic Theory”, Economic Journal, Vol. 49, No.
194, March, pp. 14-33.
Hulten, Charles R. (1990), “The Measurement of Capital”, in Berndt and Triplett, eds.,
pp. 119-152.
_____ (1992), “Growth Accounting when Technical Change is Embodied in Capital,”
American Economic Review, Vol. 82, NO. 4, September, pp. 964-980.

27
_____ (2001), "Total Factor Productivity: A Short Biography", in Hulten, Dean, and
Harper, eds., pp. 1-47.
Hulten, Charles R., Edwin R. Dean, and Michael J. Harper (2001), eds., New
Developments in Productivity Analysis, Chicago, University of Chicago Press.
Jorgenson, Dale W. (1963), "Capital Theory and Investment Behavior", American
Economic Review, Vol. 53, No. 2, May, pp. 247-259.
_____ (1966), "The Embodiment Hypothesis", Journal of Political Economy, Vol. 74,
No. 1, February, pp. 1-17.
_____ (1989), “Capital as a Factor of Production,” in Dale W. Jorgenson and Ralph
Landau, eds., Technology and Capital Formation, Cambridge, The MIT Press, pp. 1-35.
_____ (1990), "Productivity and Economic Growth", in Berndt and Triplett, eds., pp.
19-118.
_____ (2001), “Information Technology and the U.S. Economy”, American Economic
Review, Vol. 91, No. 1, March, 1-32.
Jorgenson, Dale W., Frank M. Gollop, and Barbara M. Fraumeni (1987), Productivity
and U.S. Economic Growth, Cambridge, Harvard University Press.
Jorgenson, Dale W., and Zvi Griliches (1967), "The Explanation of Productivity
Change," Review of Economic Studies, Vol. 34, No. 99, July, pp. 249-280.
Jorgenson, Dale W., Mun S. Ho, and Kevin J. Stiroh (2004), “Growth of U.S.
Industries and Investments in Information Technology and Higher Education”, in Carol
Corrado, John Haltiwanger, and Daniel Sichel, eds., Measuring Capital in a New Economy,
Chicago, University of Chicago Press, forthcoming.
Jorgenson, Dale W., and Kazuyuki Motohashi (2003), “Economic Growth of Japan
and the U.S. in the Information Age”, Tokyo, Research Institute of Economy, Trade, and
Industry, July.
Jorgenson, Dale W., and Kevin J. Stiroh (2000), "Raising the Speed Limit: U.S.
Economic Growth in the Information Age", Brookings Papers on Economic Activity, 1, pp.
125-211.
Jorgenson, Dale W., and Eric Yip (2000), “Whatever Happened to Productivity
Growth?” in Charles R. Hulten, Edwin R. Dean, and Michael J. Harper, eds., New
Developments in Productivity Analysis, Chicago, University of Chicago Press, pp. 509-540.
Kendrick, John W. (1956), “Productivity Trends: Capital and Labor”, Review of
Economics and Statistics, Vol. 38, No. 3, August, pp. 248-257.

28
_____ (1961), Productivity Trends in the United States, Princeton, Princeton
University Press.
_____ (1973), Postwar Productivity Trends in the United States, New York, National
Bureau of Economic Research.
Kendrick, John W., and Eliot Grossman (1980), Productivity in the United States:
Trends and Cycles, Baltimore, Johns Hopkins Press.
King, Robert G., and Sergio Rebelo (1999), “Resuscitating Real Business Cycles”, in
Taylor and Woodford, eds., Vol. 1B, pp. 927-1008.
Kuznets, Simon (1971), Economic Growth of Nations, Cambridge, Harvard University
Press.
_____ (1979), Growth, Population, and Income Distribution, New York, W. W.
Norton.
Lindbeck, Assar (1992), ed., Nobel Lectures in Economic Sciences, 1969-1980, River
Edge, New Jersey, World Scientific Publishing Co.
Maddison, Angus (2001), The World Economy: A Millenial Perspective, Paris,
Organisation for Economic Co-operation and Development.
Maler, Karl-Goran (1992), ed., Nobel Lectures in Economic Sciences, 1981-1990,
River Edge, New Jersey, World Scientifc Publishing Co.
Organization for Economic Co-operation and Development (2002), Purchasing Power
Parities and Real Expenditures, 1999 Benchmark Year, Paris, Organization for Economic Co-
operation and Development.
Oliner, Stephen D., and Daniel J. Sichel (2000), "The Resurgence of Growth in the
Late 1990's: Is Information Technology the Story?" Journal of Economic Perspectives, Vol.
14, No. 4, Fall, pp. 3-22.
Rees, Albert (1979), ed., Measurement and Interpretation of Productivity,
Washington, National Academy Press.
Schreyer, Paul (2000), "The Contribution of Information and Communication
Technology to Output Growth: A Study of the G7 Countries", Paris, Organisation for
Economic Co-operation and Development, May 23.
Solow, Robert M. (1956), "A Contribution to the Theory of Economic Growth",
Quarterly Journal of Economics, Vol. 70, No. 1, February, pp. 65-94.
_____ (1957), "Technical Change and the Aggregate Production Function", Review of
Economics and Statistics, Vol. 39, No. 3, August, pp. 312-20.

29
_____ (1960), "Investment and Technical Progress", in Kenneth J. Arrow, Samuel
Karlin, and Patrick Suppes, eds., Mathematical Methods in the Social Sciences, 1959,
Stanford, Stanford University Press, pp. 89-104.
_____ (1970), Growth Theory: An Exposition, New York, Oxford University Press.
_____ (1988), “Growth Theory and After”, American Economic Review, Vol. 78, No.
3, June, pp. 307-317.
_____ (1999), “Neoclassical Growth Theory,” in Taylor and Woodford, eds., Vol. 1A,
pp. 637-668.
_____ (2001), “After ‘Technical Progress and the Aggregate Production Function’”, in
Hulten, Dean, and Harper, eds., pp. 173-178.
Stigler, George J. (1947), Trends in Output and Employment, New York: National
Bureau of Economic Research.
Taylor, John B., and Michael Woodford (1999), eds., Handbook of Macroeconomics,
3 vols., Amsterdam, North-Holland.
Tinbergen, Jan (1942), "On the Theory of Trend Movements", in Jan Tinbergen,
Selected Papers, Amsterdam, North-Holland, 1959, pp. 182-221 (translated from "Zur
Theorie der Langfristigen Wirtschaftsentwicklung", Weltwirtschaftliches Archiv, Band 55,
Nu. 1, pp. 511-549).
Triplett, Jack (1996), “High-Tech Industry Productivity and Hedonic Price Indices”, in
Organization for Economic Co-operation and Development, Industry Productivity, Paris,
Organization for Economic Co-operation and Development, pp. 119-142.
United Nations (1993), System of National Accounts 1993, New York, United Nations.
Van Ark, Bart, Johanna Melka, Nanno Mulder, Marcel Timmer, and Gerard Ypma
(2002), ICT Investment and Growth Accounts for the European Union, 1980-2000, Brussels,
European Commission, June.
Wyckoff, Andrew W. (1995), "The Impact of Computer Prices on International
Comparisons of Productivity," Economics of Innovation and New Technology, Vol. 3 Nos. 3-
4, pp. 277-93.

30
Table 1. Levels of Output and Input Per Capita and Productivity
Year U.S. Canada U.K. France Germany Italy Japan
Output Per Capita1980 63.9 67.6 45.0 45.9 49.3 45.9 39.61989 79.7 78.8 56.5 54.1 58.6 57.3 56.01995 85.6 79.6 61.4 57.0 65.0 62.1 64.02001 100.3 91.8 71.3 64.0 69.2 68.8 70.6
Input Per Capita1980 70.5 64.2 50.2 46.5 61.0 43.1 57.71989 83.9 74.4 61.2 53.3 71.1 55.5 72.01995 88.8 75.2 67.0 57.0 73.7 58.8 77.82001 100.8 83.7 73.6 61.7 79.0 67.2 80.9
Productivity1980 90.6 105.4 89.5 98.6 80.8 106.6 68.71989 94.9 105.9 92.3 101.5 82.4 103.2 77.71995 96.4 105.9 91.7 99.9 88.1 105.6 82.32001 99.5 109.7 96.9 103.6 87.6 102.5 87.2
Note: U.S. = 100.0 in 2000, Canada data begins in 1981Source: author’s own.
Table 2. Growth Rate and Level in Output
Year U.S. Canada U.K. France Germany Italy JapanGrowth Rate (percentage)
1980-1989 3.38 3.10 2.69 2.38 1.99 2.51 4.421989-1995 2.43 1.39 1.62 1.30 2.34 1.52 2.561995-2001 3.76 3.34 2.74 2.34 1.18 1.90 1.85
Level (billions of 2000 U.S. Dollars)1980 5361.2 618.4 934.0 932.0 1421.7 955.7 1706.31989 7264.2 792.6 1190.3 1154.3 1700.2 1197.4 2539.31995 8403.3 861.4 1311.8 1247.8 1956.3 1311.5 2961.12001 10530.5 1052.3 1545.9 1436.0 2099.8 1470.1 3309.2
Level (U.S. = 100.0 in 2000)1980 51.6 5.9 9.0 9.0 13.7 9.2 16.41989 69.9 7.6 11.4 11.1 16.3 11.5 24.41995 80.8 8.3 12.6 12.0 18.8 12.6 28.52001 101.3 10.1 14.9 13.8 20.2 14.1 31.8
Note: Canada data begins in 1981Source: author’s own.

31
Table 3. Growth Rate and Level in Population
Year U.S. Canada U.K. France Germany Italy JapanGrowth Rate
1980-1989 0.92 1.18 0.16 0.54 0.05 0.05 0.591989-1995 1.23 1.22 0.24 0.45 0.62 0.18 0.331995-2001 1.12 0.95 0.24 0.41 0.14 0.18 0.22
Level (millions)1980 227.7 24.8 56.3 55.1 78.3 56.4 116.81989 247.4 27.3 57.1 57.9 78.7 56.7 123.11995 266.3 29.4 58.0 59.4 81.7 57.3 125.62001 284.8 31.1 58.8 60.9 82.3 57.9 127.2
Level (U.S. = 100.0 in 2000)1980 80.7 8.8 20.0 19.5 27.8 20.0 41.41989 87.7 9.7 20.3 20.5 27.9 20.1 43.61995 94.4 10.4 20.5 21.1 28.9 20.3 44.52001 101.0 11.0 20.8 21.6 29.2 20.5 45.1
Note: Percentage, Canada data begins in 1981 Source: author’s own.
Table 4. Growth in Output and Input Per Capita and Productivity
Year U.S. Canada U.K. France Germany Italy JapanOutput per capita
1980-1989 2.46 1.92 2.54 1.84 1.93 2.46 3.831989-1995 1.20 0.17 1.38 0.85 1.72 1.33 2.231995-2001 2.64 2.38 2.50 1.93 1.04 1.72 1.64
Input Per Capita1980-1989 1.94 1.86 2.20 1.52 1.71 2.82 2.461989-1995 0.94 0.17 1.49 1.11 0.60 0.96 1.291995-2001 2.10 1.80 1.59 1.33 1.14 2.21 0.66
Productivity1980-1989 0.52 0.06 0.34 0.32 0.23 -0.36 1.371989-1995 0.26 0.00 -0.11 -0.26 1.12 0.37 0.941995-2001 0.54 0.58 0.91 0.60 -0.10 -0.49 0.98
Note: Percentage, Canada data begins in 1981

32
Table 5. Levels of Capital Input and Capital Stock per capita and capital quality
Year U.S. Canada U.K. France Germany Italy JapanCapital Input Per Capita
1980 57.7 56.0 25.8 36.3 44.6 35.6 29.81989 73.7 67.1 37.9 48.3 62.1 62.4 42.11995 81.6 68.3 50.0 52.7 72.3 73.1 50.82001 103.9 78.0 56.1 58.1 83.5 89.4 58.9
Capital Stock Per Capita1980 76.8 42.3 24.1 36.2 60.2 36.0 77.01989 88.4 47.9 31.2 42.4 67.9 52.4 82.81995 92.2 49.1 35.9 47.0 77.0 62.3 88.32001 101.7 55.1 44.5 52.0 85.5 72.3 93.5
Capital Quality1980 75.1 132.3 107.0 100.1 74.0 98.8 38.61989 83.4 139.9 121.7 114.0 91.5 119.1 50.81995 88.5 139.1 139.3 112.2 94.0 117.4 57.52001 102.2 141.5 126.1 111.9 97.7 123.6 63.0
Note: U.S. = 100.0 in 2000, Canada data begins in 1981
Table 6. Levels of IT Capital Input and Capital Stock per capita and capital quality
Year U.S. Canada U.K. France Germany Italy JapanIT Capital Input Per Capita
1980 4.5 1.0 3.0 4.2 7.1 6.7 0.71989 19.3 3.9 10.9 11.9 18.7 18.8 5.51995 38.1 11.2 20.9 19.1 31.1 31.2 11.12001 115.3 45.6 53.6 38.1 59.7 60.3 39.2
IT Capital Stock Per Capita1980 9.8 5.5 2.5 3.5 6.1 4.6 3.61989 27.4 10.3 9.6 9.9 15.5 13.1 11.21995 46.8 14.4 19.2 18.0 28.2 23.8 19.92001 110.7 21.6 44.9 33.4 49.7 44.1 71.0
Capital Quality1980 46.4 17.4 118.5 117.5 117.4 146.8 19.81989 70.4 38.2 112.7 119.7 120.4 143.2 49.31995 81.3 77.9 108.9 106.2 110.1 131.0 55.72001 104.1 210.8 119.3 114.1 120.2 136.6 55.3
Note: U.S. = 100.0 in 2000, Canada data begins in 1981

33
Table 7. Levels of Non-IT Capital Input and Capital Stock per capita and capital quality
Year U.S. Canada U.K. France Germany Italy JapanNon-IT Capital Input Per Capita
1980 73.8 73.1 30.7 41.3 51.9 41.6 39.11989 87.0 83.1 43.4 53.9 70.3 71.3 51.31995 90.7 79.9 55.9 57.9 79.7 81.2 59.82001 102.2 84.0 56.4 62.6 87.3 94.7 60.9
Non-IT Capital Stock Per Capita1980 82.5 44.4 25.7 38.0 63.4 38.2 82.81989 92.5 49.8 32.6 44.0 70.6 54.8 88.01995 94.8 50.7 36.9 48.3 79.3 64.4 93.12001 101.4 57.4 44.5 54.1 87.2 75.1 89.6
Capital Quality1980 89.5 164.6 119.2 108.5 81.9 109.2 47.31989 94.1 166.8 133.2 122.6 99.5 130.0 58.31995 95.6 157.5 151.5 119.9 100.5 126.0 64.32001 100.8 146.4 126.7 115.8 100.1 126.1 67.9
Note: U.S. = 100.0 in 2000, Canada data begins in 1981
Table 8. Growth in Capital Input and Capital Stock Per Capita and CapitalQuality
Year U.S. Canada U.K. France Germany Italy JapanCapital Input Per Capita
1980-1989 2.72 2.26 4.28 3.19 3.70 6.25 3.861989-1995 1.70 0.31 4.61 1.46 2.53 2.63 3.131995-2001 4.03 2.20 1.92 1.63 2.40 3.35 2.46
Capital Stock Per Capita1980-1989 1.56 1.57 2.85 1.74 1.34 4.18 0.811989-1995 0.70 0.60 2.36 1.74 2.09 2.87 1.061995-2001 1.63 1.91 3.57 1.67 1.75 2.49 0.95
Capital Quality1980-1989 1.17 0.69 1.43 1.45 2.36 2.07 3.051989-1995 0.99 -0.29 2.25 -0.27 0.44 -0.24 2.071995-2001 2.40 0.29 -1.65 -0.04 0.65 0.86 1.51
Note: Percentage, Canada data begins in 1981

34
Table 9. Growth in IT Capital Input and Capital Stock Per Capita and CapitalQuality
Year U.S. Canada U.K. France Germany Italy JapanIT Capital Input Per Capita
1980-1989 16.09 17.66 14.43 11.66 10.71 11.44 22.741989-1995 11.35 17.42 10.91 7.92 8.47 8.44 11.571995-2001 18.47 23.42 15.69 11.55 10.87 10.98 21.08
IT Capital Stock Per Capita1980-1989 11.47 7.83 14.98 11.46 10.43 11.72 12.611989-1995 8.94 5.53 11.50 9.91 9.97 9.94 9.521995-2001 14.34 6.82 14.16 10.35 9.40 10.28 21.22
Capital Quality1980-1989 4.63 9.83 -0.56 0.20 0.28 -0.27 10.131989-1995 2.41 11.89 -0.58 -1.99 -1.50 -1.49 2.051995-2001 4.12 16.60 1.53 1.20 1.47 0.70 -0.14
Note: Percentage, Canada data begins in 1981
Table 10. Growth in Non-IT Capital Input and Capital Stock Per Capita and CapitalQuality
Year U.S. Canada U.K. France Germany Italy JapanNon-IT Capital Input Per Capita
1980-1989 1.83 1.60 3.85 2.97 3.36 5.97 3.001989-1995 0.68 -0.66 4.22 1.20 2.09 2.17 2.581995-2001 2.00 0.85 0.15 1.30 1.52 2.57 0.29
Non-IT Capital Stock Per Capita1980-1989 1.27 1.43 2.62 1.61 1.20 4.03 0.681989-1995 0.41 0.29 2.07 1.58 1.92 2.68 0.941995-2001 1.11 2.07 3.12 1.87 1.59 2.56 -0.63
Capital Quality1980-1989 0.56 0.17 1.23 1.36 2.16 1.94 2.321989-1995 0.27 -0.95 2.15 -0.38 0.17 -0.51 1.641995-2001 0.88 -1.22 -2.97 -0.57 -0.06 0.01 0.92
Note: Percentage, Canada data begins in 1981
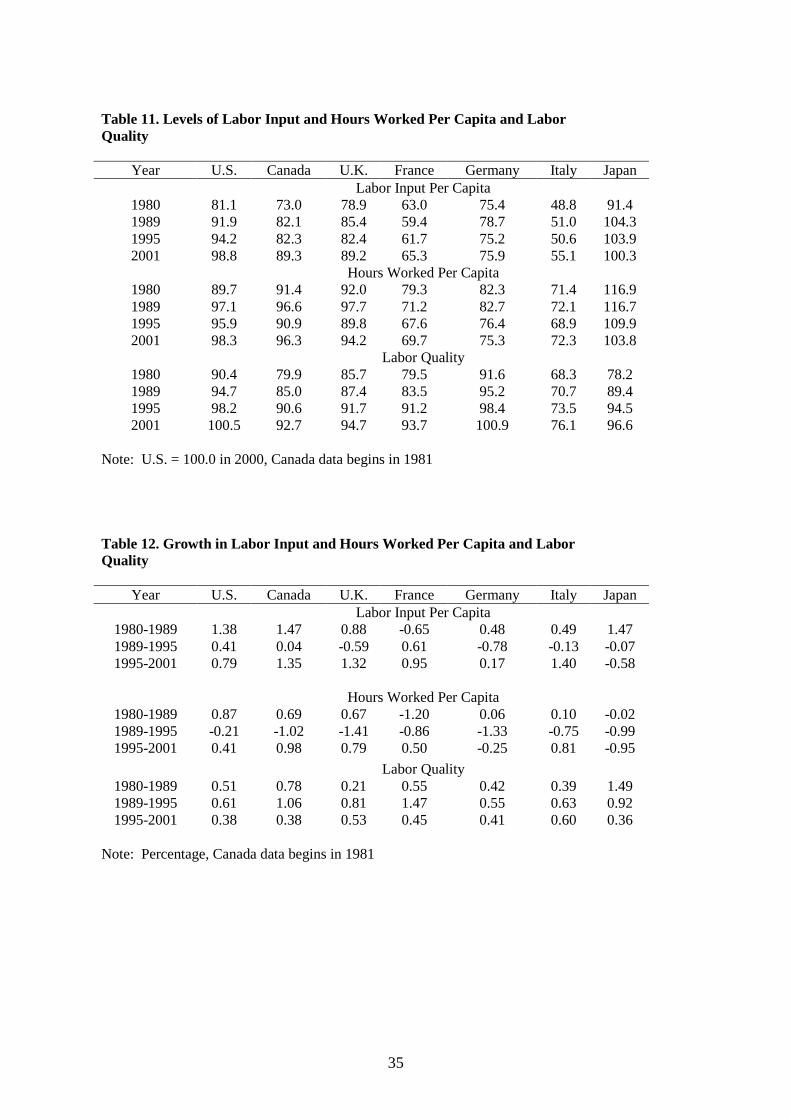
35
Table 11. Levels of Labor Input and Hours Worked Per Capita and LaborQuality
Year U.S. Canada U.K. France Germany Italy JapanLabor Input Per Capita
1980 81.1 73.0 78.9 63.0 75.4 48.8 91.41989 91.9 82.1 85.4 59.4 78.7 51.0 104.31995 94.2 82.3 82.4 61.7 75.2 50.6 103.92001 98.8 89.3 89.2 65.3 75.9 55.1 100.3
Hours Worked Per Capita1980 89.7 91.4 92.0 79.3 82.3 71.4 116.91989 97.1 96.6 97.7 71.2 82.7 72.1 116.71995 95.9 90.9 89.8 67.6 76.4 68.9 109.92001 98.3 96.3 94.2 69.7 75.3 72.3 103.8
Labor Quality1980 90.4 79.9 85.7 79.5 91.6 68.3 78.21989 94.7 85.0 87.4 83.5 95.2 70.7 89.41995 98.2 90.6 91.7 91.2 98.4 73.5 94.52001 100.5 92.7 94.7 93.7 100.9 76.1 96.6
Note: U.S. = 100.0 in 2000, Canada data begins in 1981
Table 12. Growth in Labor Input and Hours Worked Per Capita and LaborQuality
Year U.S. Canada U.K. France Germany Italy JapanLabor Input Per Capita
1980-1989 1.38 1.47 0.88 -0.65 0.48 0.49 1.471989-1995 0.41 0.04 -0.59 0.61 -0.78 -0.13 -0.071995-2001 0.79 1.35 1.32 0.95 0.17 1.40 -0.58
Hours Worked Per Capita1980-1989 0.87 0.69 0.67 -1.20 0.06 0.10 -0.021989-1995 -0.21 -1.02 -1.41 -0.86 -1.33 -0.75 -0.991995-2001 0.41 0.98 0.79 0.50 -0.25 0.81 -0.95
Labor Quality1980-1989 0.51 0.78 0.21 0.55 0.42 0.39 1.491989-1995 0.61 1.06 0.81 1.47 0.55 0.63 0.921995-2001 0.38 0.38 0.53 0.45 0.41 0.60 0.36
Note: Percentage, Canada data begins in 1981

36
Table 13. Contribution of Total Capital, IT Capital and Non-IT Capital to Out putGrowth
Year U.S. Canada U.K. France Germany Italy JapanTotal Capital
1980-1989 1.53 1.71 1.80 2.12 1.44 2.55 1.851989-1995 1.19 0.76 1.96 1.12 1.31 1.12 1.471995-2001 2.10 1.67 0.94 1.15 1.11 1.47 1.10
IT Capital1980-1989 0.45 0.39 0.24 0.18 0.19 0.24 0.431989-1995 0.49 0.49 0.27 0.19 0.26 0.26 0.311995-2001 0.99 0.86 0.76 0.42 0.46 0.49 0.75
Non-IT Capital1980-1989 1.08 1.32 1.56 1.94 1.25 2.31 1.421989-1995 0.70 0.27 1.69 0.93 1.05 0.86 1.161995-2001 1.11 0.81 0.18 0.73 0.65 0.98 0.35
Note: Percentage. Contribution is growth rate times value share. Canada data begins in1981
Table 14. Contributions of Productivity from IT and Non-IT Production to OutputGrowth
Year U.S. Canada U.K. France Germany Italy JapanProductivity
1980-1989 0.52 0.06 0.34 0.32 0.23 -0.36 1.371989-1995 0.26 0.00 -0.11 -0.26 1.12 0.37 0.941995-2001 0.54 0.58 0.91 0.60 -0.10 -0.49 0.98
Productivity from IT Production1980-1989 0.23 0.14 0.23 0.29 0.28 0.32 0.231989-1995 0.23 0.14 0.32 0.29 0.43 0.38 0.291995-2001 0.48 0.17 0.82 0.56 0.65 0.68 0.57
Productivity from Non-IT Production1980-1989 0.29 -0.08 0.11 0.03 -0.05 -0.68 1.141989-1995 0.03 -0.14 -0.43 -0.55 0.69 -0.01 0.651995-2001 0.06 0.41 0.09 0.04 -0.75 -1.17 0.41
Note: Percentage. Canada data begins in 1981

37
Table 15. Sources of Output Growth
Year U.S. Canada U.K. France Germany Italy JapanOutput
1980-1989 3.38 3.10 2.69 2.38 1.99 2.51 4.421989-1995 2.43 1.39 1.62 1.30 2.34 1.52 2.561995-2001 3.76 3.34 2.74 2.34 1.18 1.90 1.85
Labor1980-1989 1.33 1.33 0.56 -0.06 0.32 0.32 1.201989-1995 0.98 0.62 -0.24 0.44 -0.09 0.03 0.151995-2001 1.12 1.08 0.88 0.59 0.17 0.93 -0.22
IT Capital1980-1989 0.45 0.39 0.24 0.18 0.19 0.24 0.431989-1995 0.49 0.49 0.27 0.19 0.26 0.26 0.311995-2001 0.99 0.86 0.76 0.42 0.46 0.49 0.75
Non-IT Capital1980-1989 1.08 1.32 1.56 1.94 1.25 2.31 1.421989-1995 0.70 0.27 1.69 0.93 1.05 0.86 1.161995-2001 1.11 0.81 0.18 0.73 0.65 0.98 0.35
Productivity from IT Production1980-1989 0.23 0.14 0.23 0.29 0.28 0.32 0.231989-1995 0.23 0.14 0.32 0.29 0.43 0.38 0.291995-2001 0.48 0.17 0.82 0.56 0.65 0.68 0.57
Productivity from Non-IT Production1980-1989 0.29 -0.08 0.11 0.03 -0.05 -0.68 1.141989-1995 0.03 -0.14 -0.43 -0.55 0.69 -0.01 0.651995-2001 0.06 0.41 0.09 0.04 -0.75 -1.17 0.41
Note: Percentage. Contributions. Canada data begins in 1981
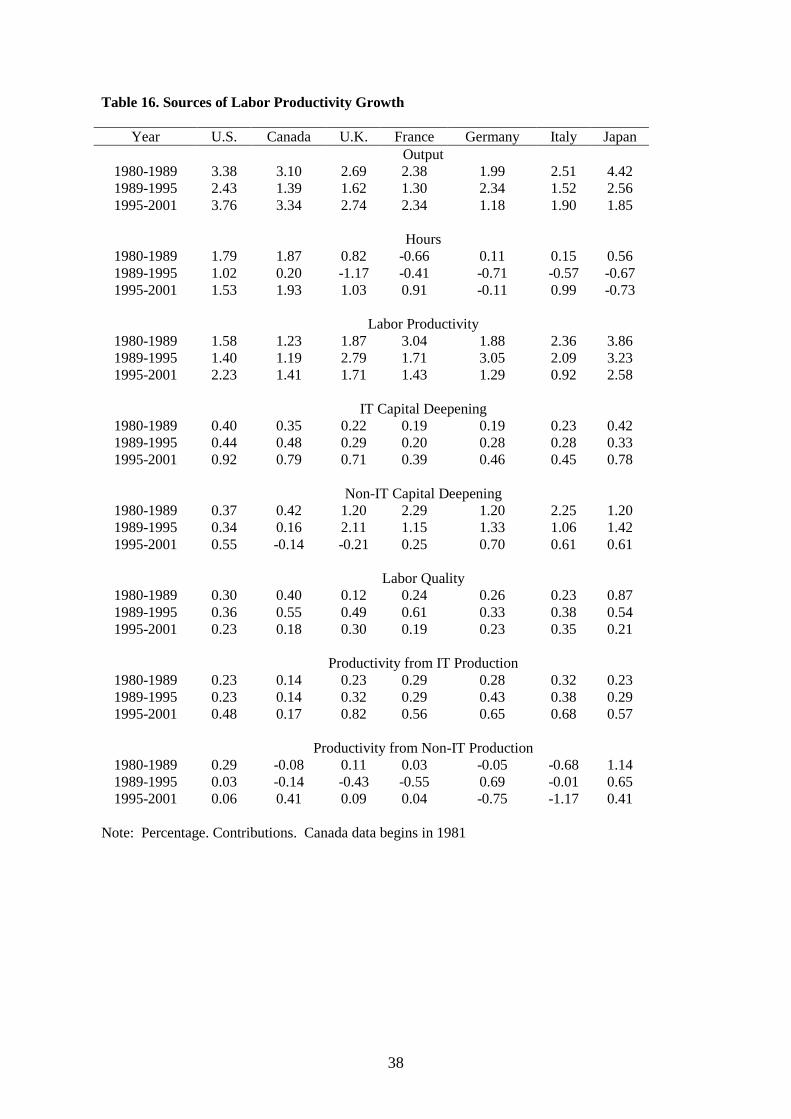
38
Table 16. Sources of Labor Productivity Growth
Year U.S. Canada U.K. France Germany Italy JapanOutput
1980-1989 3.38 3.10 2.69 2.38 1.99 2.51 4.421989-1995 2.43 1.39 1.62 1.30 2.34 1.52 2.561995-2001 3.76 3.34 2.74 2.34 1.18 1.90 1.85
Hours1980-1989 1.79 1.87 0.82 -0.66 0.11 0.15 0.561989-1995 1.02 0.20 -1.17 -0.41 -0.71 -0.57 -0.671995-2001 1.53 1.93 1.03 0.91 -0.11 0.99 -0.73
Labor Productivity1980-1989 1.58 1.23 1.87 3.04 1.88 2.36 3.861989-1995 1.40 1.19 2.79 1.71 3.05 2.09 3.231995-2001 2.23 1.41 1.71 1.43 1.29 0.92 2.58
IT Capital Deepening1980-1989 0.40 0.35 0.22 0.19 0.19 0.23 0.421989-1995 0.44 0.48 0.29 0.20 0.28 0.28 0.331995-2001 0.92 0.79 0.71 0.39 0.46 0.45 0.78
Non-IT Capital Deepening1980-1989 0.37 0.42 1.20 2.29 1.20 2.25 1.201989-1995 0.34 0.16 2.11 1.15 1.33 1.06 1.421995-2001 0.55 -0.14 -0.21 0.25 0.70 0.61 0.61
Labor Quality1980-1989 0.30 0.40 0.12 0.24 0.26 0.23 0.871989-1995 0.36 0.55 0.49 0.61 0.33 0.38 0.541995-2001 0.23 0.18 0.30 0.19 0.23 0.35 0.21
Productivity from IT Production1980-1989 0.23 0.14 0.23 0.29 0.28 0.32 0.231989-1995 0.23 0.14 0.32 0.29 0.43 0.38 0.291995-2001 0.48 0.17 0.82 0.56 0.65 0.68 0.57
Productivity from Non-IT Production1980-1989 0.29 -0.08 0.11 0.03 -0.05 -0.68 1.141989-1995 0.03 -0.14 -0.43 -0.55 0.69 -0.01 0.651995-2001 0.06 0.41 0.09 0.04 -0.75 -1.17 0.41
Note: Percentage. Contributions. Canada data begins in 1981
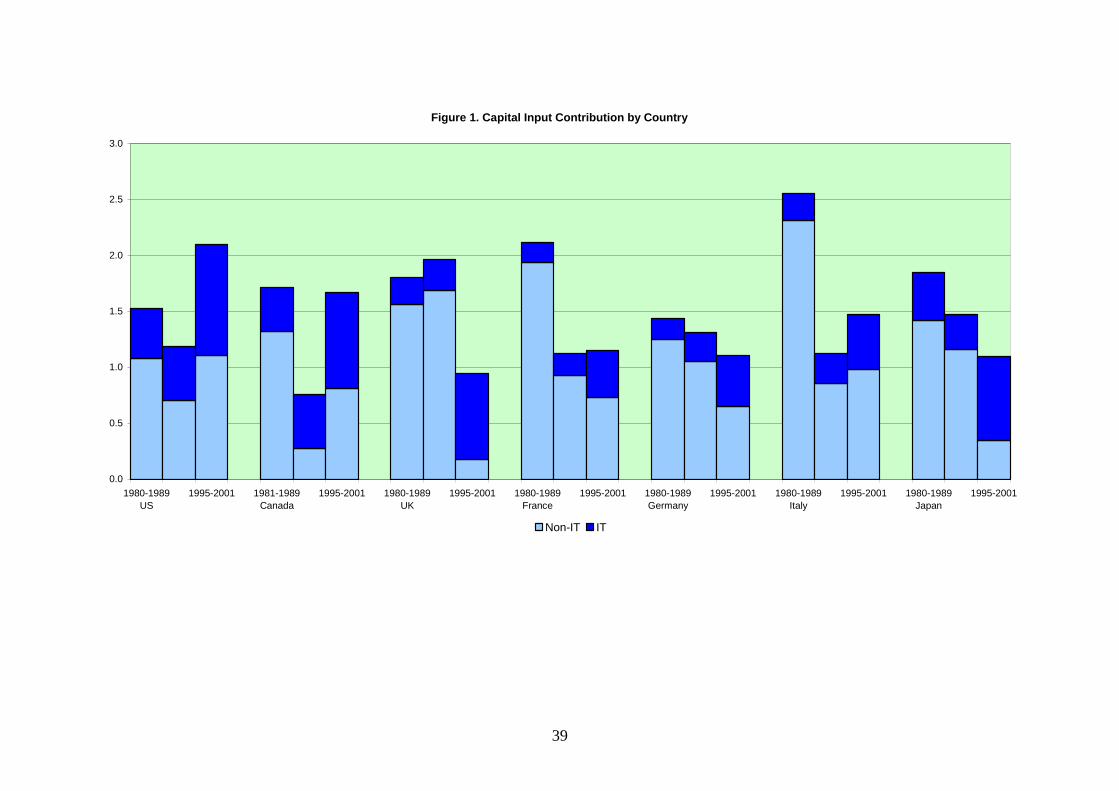
39
Figure 1. Capital Input Contribution by Country
0.0
0.5
1.0
1.5
2.0
2.5
3.0
1980-1989US
1995-2001 1981-1989Canada
1995-2001 1980-1989UK
1995-2001 1980-1989France
1995-2001 1980-1989Germany
1995-2001 1980-1989Italy
1995-2001 1980-1989Japan
1995-2001
Non-IT IT
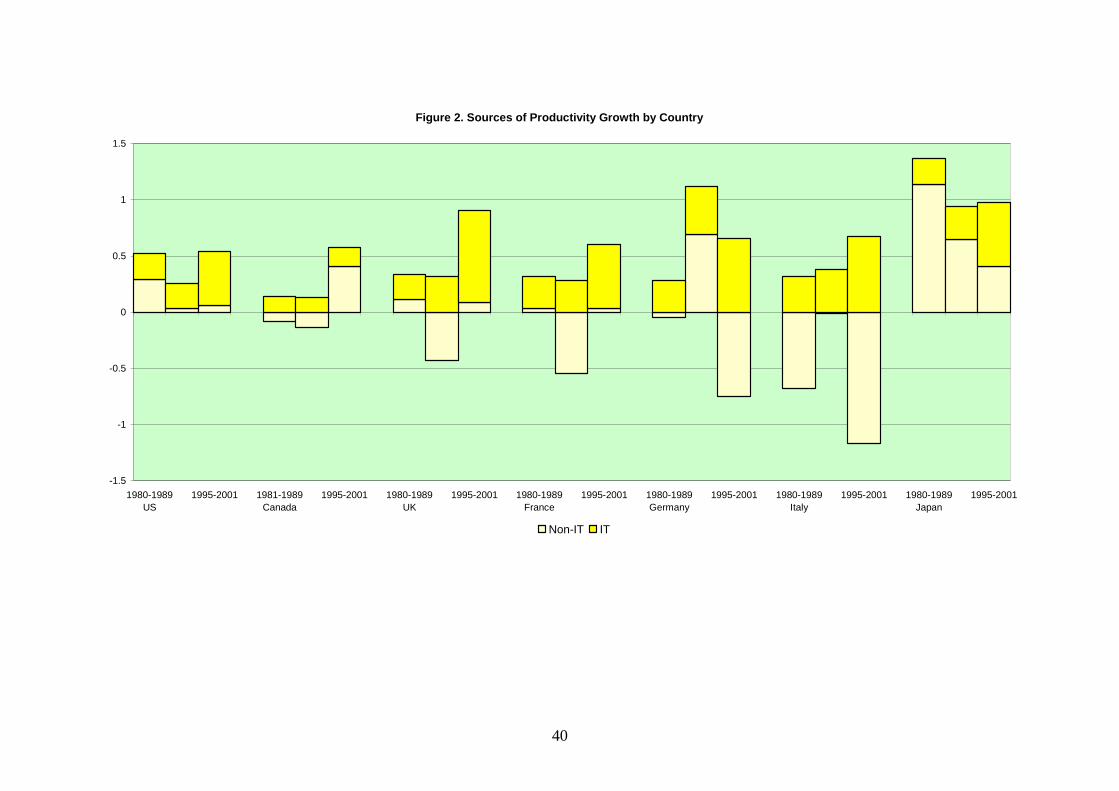
40
Figure 2. Sources of Productivity Growth by Country
-1.5
-1
-0.5
0
0.5
1
1.5
1980-1989US
1995-2001 1981-1989Canada
1995-2001 1980-1989UK
1995-2001 1980-1989France
1995-2001 1980-1989Germany
1995-2001 1980-1989Italy
1995-2001 1980-1989Japan
1995-2001
Non-IT IT

41
Figure 3 Sources of Economic Growth by Country
-2.0
-1.0
0.0
1.0
2.0
3.0
4.0
5.0
1980-1989US
1995-2001 1981-1989Canada
1995-2001 1980-1989UK
1995-2001 1980-1989France
1995-2001 1980-1989Germany
1995-2001 1980-1989Italy
1995-2001 1980-1989Japan
1995-2001
Labor Non-IT Capital IT Capital Non-IT Productivity IT Productivity

42
Figure 4. Sources of Labor Productivity Growth by Country
-2
-1
0
1
2
3
4
5
1980-1989US
1995-2001 1981-1989Canada
1995-2001 1980-1989UK
1995-2001 1980-1989France
1995-2001 1980-1989Germany
1995-2001 1980-1989Italy
1995-2001 1980-1989Japan
1995-2001
An
nu
al C
on
trib
uti
on
(%
)
Labor Quality Non IT Capital Deepening IT Capital Deepening Non-IT Productivity IT Productivity