information visualization on large, high-resolution...
TRANSCRIPT

Information Visualization on Large, High-Resolution Displays: Issues, Challenges, and Opportunities
Christopher Andrews, Alex Endert, Beth Yost*, and Chris North
Center for Human-Computer Interaction Department of Computer Science
Virginia Polytechnic Institute and State University Blacksburg, VA 24061
{cpa, aendert, beyost, north}@vt.edu http://infovis.cs.vt.edu
* currently at Mitre
Keywords: Information Visualization; Large, High-Resolution Displays; Visualization Design Guidelines; Interaction

Abstract Larger, higher-resolution displays are becoming accessible to a greater number of users as display technologies decrease in cost and software for the displays improves. The additional pixels are especially useful for information visualization where scalability has typically been limited by number of pixels available on a display. But how will visualizations for larger displays need to fundamentally differ from visualizations on desktop displays? Are the basic visualization design principles different? With this potentially new design paradigm comes questions such as whether the relative effectiveness of various graphical encodings are different on large displays, which visualizations and datasets benefit the most, and how interaction with visualizations on large, high-resolution displays will need to change. As we explore these possibilities, we shift away from the technical limitations of scalability imposed by traditional displays (e.g., number of pixels, etc.), to studying the human abilities that emerge when these limitations are removed. There is much potential for information visualizations to benefit from large, high-resolution displays, but this potential will only be realized through understanding the interaction between visualization design, perception, interaction techniques, and the display technology. In this paper we present critical design issues and outline some of the challenges and future opportunities for designing visualizations for large, high-resolution displays. We hope that these issues, challenges, and opportunities will provide guidance for future research in this area.

1. Introduction Information visualization is regularly confronted with the challenge of providing visual representations of large datasets. Traditional displays have a low number of pixels, placing a fundamental upper bound on the amount of information that can be simultaneously visible in a visualization. Most current visualizations can only handle around 10,000 items when shown on a 1600×1200 desktop monitor1. According to Huber’s taxonomy of large datasets2, 10,000 bytes of information is classified as a small dataset. To cope with increasingly large datasets, a number of techniques have been developed which use a mixture of aggregation, elimination, and some form of virtual navigation technique (e.g., zooming, panning). While these techniques all have their uses, we would suggest that they are frequently applied prematurely in response to the purely technical limitations of the display. Replacing the conventional monitor with a large, high-resolution display creates a fundamentally different environment that is no longer defined purely in terms of the technical limitations of the display, creating a new collection of design opportunities, issues, and challenges. The term “large, high-resolution display” can be defined a number of ways. First, it can be defined in terms of the technology being used (i.e., “larger than a traditional display”). This definition is subjective, as it implies that one’s perception of the display itself is what defines it. As technology advances over time, and a “traditional display” changes, displays that were once considered large (and high-resolution) by this definition may no longer be. A second way to define the term is in terms of quantity of data that it can visually represent, or perhaps more importantly, the ability to represent multiple views, scales, and “units” of data (e.g., documents, web-pages, etc.). However, this definition requires that we define what a unit of data is, which changes for each application or dataset. While both of these definitions can be useful, we prefer to define the term “large, high-resolution display” as being a display that is human scale. By human scale, we mean that the display’s size and resolution are closely matched to the sphere of perception and influence of the human body. In a practical sense, we use the label to describe displays whose combined size and resolution approach or exceed the visual acuity of the user. Displays at this scale afford the user the opportunity to trade virtual navigation for physical navigation (turning, leaning, moving around), thus allowing the user to exploit embodied human abilities such as spatial awareness, proprioception, and spatial memory. This tipping point is important because it heralds a change in user behavior, requiring new design considerations for information visualization that are based on the extents of human abilities rather than the technological limitations of the display medium. Numerous studies have shown how the use of large, high-resolution displays can positively affect user performance for visualization tasks 3-7. In addition, large, high-resolution displays have been shown to have a cognitive impact on their users 5, 8-10, changing the way the users perceived and worked with their information. These results demonstrate a wide range of basic advantages provided by these displays, suggesting benefits of their use for all aspect of information visualization, barring practical issues such as cost, mobility, and space. To take full advantage of these benefits, designers need to understand and embrace the fundamental differences between small and large displays, and the corresponding design considerations. In

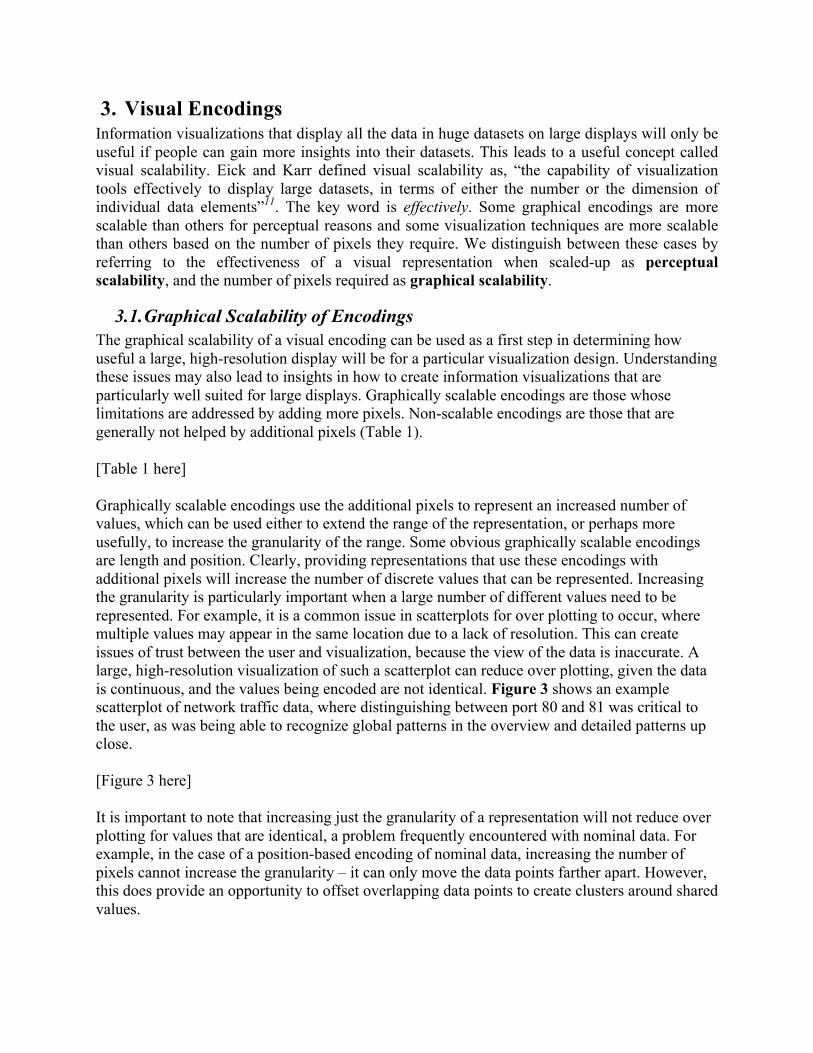
this paper, we illustrate how adopting a human-centric perspective on large displays fundamentally changes visualization design guidelines. Our goal is to inform research that will lead to a new generation of effective information visualization applications for large, high-resolution displays. Addressing all of the possible uses of large, high-resolution displays is well beyond the scope of this paper. Our focus here is primarily on the challenges and opportunities presented by the display for information visualization, with an emphasis on basic design considerations and the impact of human perceptions and abilities in conjunction with this different environment. Shifting emphasis to explicitly address human abilities impacts many points in the visualization design process. In this paper, we start by addressing the physical display and how it affects the perceptions of the user. Then we discuss visual encodings, and the questions that a visualization designer should consider when designing a visualization for a large, high-resolution display. We follow this with a breakdown of the various ways the available space can be used for visualization. Finally, we examine various visualization interaction techniques that are appropriate for large, high-resolution displays. Throughout, with the aim of fostering large, high-resolution display use and motivating future research, we provide a collection of design guidelines we have developed through our use of these displays, and highlight a number of key research questions that remain to be answered. [Figure 1 here]
2. Physical Display When discussing large, high-resolution displays, it is important to first clarify what we mean by “display”. We will use display to mean the aggregate visual output intended to be treated as a single contiguous space. This distinction is important because the display can be (and usually is) composed of multiple tiled physical units, which could be projectors or monitors.
2.1. Technology From a technological standpoint, there are a number of key attributes of displays that we must take into consideration: Size: measured in inches of the diagonal viewing area (e.g., 17 inch); Pixel Density: measured in the amount of pixels per inch (e.g., 96 DPI); Resolution: measured in a horizontal multiplied by a vertical pixel count (e.g., 1600x1200 px); Brightness: measures the amount of light emitted by the display (in candelas per square meter); Contrast: measured as the luminance ratio between the brightest and darkest color (e.g., 700:1); Viewing Angle: measured as the angle (horizontal and vertical) from which a display can be viewed with acceptable performance (e.g., +/- 178 degrees); Bezels: the frames that surround conventional monitors; Display technology: the technology used to create the display, typically tiled LCD monitors or projectors (rear or front projected); Form factor: the physical arrangement and form of the display; The chosen display technology is clearly important. In general, projectors-driven displays (front or rear) are only capable of fairly low pixel density, so while they can easily scale up in size, the resulting display is typically of low resolution. Projectors, however, do have the advantage of not

having bezels and can be adjusted to minimize seams when tiled. LCD monitors, on the other hand, provide much higher pixel density, but come at the cost of obvious bezels that create distinct breaks when tiled. The use of tiling also makes it important to consider the effect of brightness and color uniformity across the individual tiles. Modern LCD monitors offer few problems in this regard, but projector calibration can be a difficult problem. A full survey of display technologies is outside of the scope of this paper, and can be found in Ni et al12. We are also particularly interested in the quantity of available pixels and the displays DPI. The number of pixels determines how much information can be displayed, while the DPI is of particular importance to the usability of the visualization. A higher DPI means a greater number of pixels (per inch), implying a greater amount of detail can be shown. To access this detail, users can physically navigate towards the visualization, as well as move away from the display to gain an overview. However, a higher DPI allows for the distance users move to transition between detail and overview to become shorter. In contrast, a lower DPI display with the same number of pixels will be much larger. Hence, users must move a greater distance to gain the same range of information.
2.2. Visual Acuity and Physical Navigation One might assume that display size should be limited by visual acuity, and larger displays would lead to “wasted pixels”. Visual acuity for distinguishing two dots is about 1/60 of a degree of visual angle13, and by some calculations approximately 6.5 million pixels are perceivable11. Ware instead suggests that a 4kx4k display is the ultimate display, because it is most efficient at matching screen pixels to the “brain pixels” that interpret the signals sent by photoreceptors in our eyes13. He claims that a display with that many pixels is adequate for any visual task. This leads to the question: Can a single user take advantage of higher DPI’s at greater distances 14 or are pixels wasted when using high DPI’s on large displays? These calculations, which consider perceivable pixels from a given distance from the display, are confounded by the fact that people can physically move to the location of interest to bring different parts of the display into the high acuity area at the center of the visual field. We have demonstrated that indeed, the scalability of visualizations is not limited by visual acuity 4. Instead of asking if these pixels are wasted with a single user, a better question may be: Does physical navigation provide advantages over current navigation techniques like zooming + panning, focus + context, and overview + detail? It appears that physical navigation and embodied interaction do offer performance benefits5. By moving physically to navigate around the visualization, users can take advantage of their spatial memory and embodied cognition to maintain references to information in the visualization. Ball et al. showed that physical navigation outperformed virtual navigation (e.g., panning, zooming) for route tracing tasks on large displays 3. Users of the large display rapidly moved around the display to acquire targets, while small display users took longer virtually navigating the map. Other research on the use of large high resolution displays has shown that when finding small dots that match a pattern, a nine monitor tiled display with physical movement is faster than panning and zooming15. One study has shown that larger displays and the corresponding increase in physical navigation can be beneficial for map navigation16. Beyond these there are also

advantages on a variety of tasks with even larger displays 5, 17. These advantages are likely a result of rapid/natural eye/head movement, proprioception, and embodiment. These results have also been shown for information-rich virtual environments, where having additional abstract information visible simultaneously improves user performance on search and comparison tasks18 and the increased physical field of view afforded on the large display allows users to form spatial knowledge without as much dependency on external way finding aids6. We may want to ask: Does using a large, high-resolution display overwhelm the user? At times there may be so much information that it becomes stressful and overwhelming for users confronted with so much information at once. However, numerous studies 8, 10, 19, 20 have observed users adjusting quickly after initial exposure to the additional information and display size for their various tasks. Another question to be asked is: Will the increase in physical navigation lead to fatigue during longer duration tasks? In studies that examined longitudinal use of large, high-resolution displays, there was little evidence of increased fatigue except for some mild neck strain related to the ergonomics of the display 10, 21. The potential impacts of increased physical navigation and ergonomic considerations should certainly not be overlooked, however. [Figure 2 here]
2.3. Display Form Factor Beyond ergonomics, it is important not to overlook other potential effects of display form factor. The form factor of the display will impact the type of available physical navigation, which leads us to ask: What impact does the form factor of the display have on how it is used? For example, due to the relatively low pixel density offered by projectors, projection-based large, high-resolution displays will provide little benefit for up close use, which may bias the use of the display towards collaborative or presentations applications. In contrast, the high pixel density of tiled LCD display walls (Figure 1), support a very active form of physical navigation, requiring a lot of walking and bending. So, they are likely to be used for short, focused applications, whereas a desk-based display (Figure 2) will support more long-term, multi-faceted work. Shupp et al. provide a more specific example of the potential impact of form factor in their demonstration that curving the display around the user (as shown in Figure 2) impacted both performance and behavior 5. The curve changed the physical movement of the user from horizontal (walking along the display) to the more efficient rotational (turning in place), providing a positive performance boost to the users. More interesting, however, is that the form factor and the associated change in physical movement changed the perceptions of the visualization, removing a bias to the left side of the display and focusing the user more on local features of the visualization. It is clear that the target application and the anticipated use should dictate the form-factor of the display.
3. Visual Encodings Information visualizations that display all the data in huge datasets on large displays will only be useful if people can gain more insights into their datasets. This leads to a useful concept called visual scalability. Eick and Karr defined visual scalability as, “the capability of visualization tools effectively to display large datasets, in terms of either the number or the dimension of individual data elements”11. The key word is effectively. Some graphical encodings are more scalable than others for perceptual reasons and some visualization techniques are more scalable than others based on the number of pixels they require. We distinguish between these cases by referring to the effectiveness of a visual representation when scaled-up as perceptual scalability, and the number of pixels required as graphical scalability.
3.1. Graphical Scalability of Encodings The graphical scalability of a visual encoding can be used as a first step in determining how useful a large, high-resolution display will be for a particular visualization design. Understanding these issues may also lead to insights in how to create information visualizations that are particularly well suited for large displays. Graphically scalable encodings are those whose limitations are addressed by adding more pixels. Non-scalable encodings are those that are generally not helped by additional pixels (Table 1). [Table 1 here] Graphically scalable encodings use the additional pixels to represent an increased number of values, which can be used either to extend the range of the representation, or perhaps more usefully, to increase the granularity of the range. Some obvious graphically scalable encodings are length and position. Clearly, providing representations that use these encodings with additional pixels will increase the number of discrete values that can be represented. Increasing the granularity is particularly important when a large number of different values need to be represented. For example, it is a common issue in scatterplots for over plotting to occur, where multiple values may appear in the same location due to a lack of resolution. This can create issues of trust between the user and visualization, because the view of the data is inaccurate. A large, high-resolution visualization of such a scatterplot can reduce over plotting, given the data is continuous, and the values being encoded are not identical. Figure 3 shows an example scatterplot of network traffic data, where distinguishing between port 80 and 81 was critical to the user, as was being able to recognize global patterns in the overview and detailed patterns up close. [Figure 3 here] It is important to note that increasing just the granularity of a representation will not reduce over plotting for values that are identical, a problem frequently encountered with nominal data. For example, in the case of a position-based encoding of nominal data, increasing the number of pixels cannot increase the granularity – it can only move the data points farther apart. However, this does provide an opportunity to offset overlapping data points to create clusters around shared values.

Color, on the other hand, is an obvious example of an encoding that cannot use additional pixels to represent additional values. Node-link diagrams provide an interesting fringe example that illustrates some of the potential complexity of reasoning about graphical scalability. Increasing the number of pixels allows us to increase the number of nodes and links or increase the distance between nodes. However, it will not alter the number of edge crossings in the diagram, so a complex graph with a high number of crossings (i.e., a “hairball”), will not automatically become significantly more manageable with additional space. As a result, while the number of nodes and links may be scalable, because of the attendant increase in edge crossings, the resulting diagram may be unusable. So graphical scalability of an encodings is not the sole predictor of the effectiveness of a visualization on a large display.
3.2. Perceptual Scalability of Encodings As the number of pixels available increases, it is likely that limitations shift away from the display technology and toward perceptual abilities. Therefore, when developing a visualization for a large, high-resolution display it is increasingly important to consider human abilities and also to consider the interaction between display characteristics and visual representations. In this section we discuss the perceptual implications of different display characteristics with respect to information visualization. Psychophysical requirements for tiled displays, including issues with the brightness, differences in color, and misalignments of images, have been discussed by others22, 23. In this section we explore a different issue related to perception at the heart of information visualization. In Table 2 we summarize some of the challenges brought about by large, high-resolution displays for the common encodings: spatial position, size, color, and orientation. [Table 2 here] Of the attributes listed in Table 2 distance (from the user to the glyph) and viewing angle can be controlled by the user through physical navigation. Due to the physical footprint of large displays, areas of a visualization will be distant from the user. At times, this can also result in extreme viewing angles to those areas. Aside from the technical issues created by these viewing angles (the limitations of the LCDs distorting the visualization), encodings such as orientation are more difficult to interpret. Viewing angles can also distort the perception of the graphical encodings, especially ones for which shape is important 24. Additionally, the regions of the visualization in the users’ peripheral vision will suffer for tasks such as comparisons and notifications (attention). When comparing two distant glyphs, physical navigation gives users the ability to move to a location in front of the display where both glyphs are within their field of view (not in the periphery) and the viewing angles are less severe. However, this emphasizes the importance of the encoding’s ability to be accurately perceived from a distance (assuming standard viewing angles). For example, orientation (or slope) is not as easily perceived from a distance due to the limits of visual acuity, whereas the color of the glyph is still properly perceived 25. Of course, the stability of color does have some limits, and small-field color blindness can make it difficult to distinguish between colors when the representation is particularly small (e.g., thin lines or small, very distant objects) 26. In addition to the ability for a single glyph to be perceived from a distance, another important aspect is the ability of the

visualization to be perceived as a whole from a distance, creating an effective overview (i.e., the encoding’s ability to visually aggregate). The DPI and presence of bezels are attributes that cannot be controlled by physical navigation. Some techniques for addressing this have been presented27-29 and include alternative methods of aligning images and visualizations that provide a representation of the information that is hidden behind the bezels. However, as display technologies continue to advance, bezels will decrease in size. Also, generally choosing a higher DPI display will give the designer more flexibility in terms of level of detail (glyphs/detail can always be enlarged, while lower DPI displays cannot become more detailed). A well known tool for visualization researchers and designers is the rank ordering of the effectiveness of graphical encodings30, 31. Given the perceptual impact on encodings caused by large, high-resolution displays, it is not unreasonable to ask: Does the ordering of effectiveness of various graphical encodings change on large, high-resolution displays? This idea is suggested by the results that orderings may be different for secondary-tasks32 that appear in peripheral vision. However, recent results indicate that the relative ordering of encodings may in fact be maintained 25. This may be due to effects caused by the way in which different encodings visually aggregate.
3.3. Visual Aggregation and Overviews It is important to note that overview techniques will still be needed on large, high-resolution displays, because large enough datasets may still require more pixels than available to the user. Furthermore, highly aggregated overviews designed for small displays may still prove to be useful on large displays. As previously mentioned there may be cognitive or perceptual problems with trying to get an overview of a dataset as larger amounts of data are shown on larger, higher-resolution displays. With large displays, will embedding more details into large overviews hinder users’ ability to see the higher-level overview? However, perhaps more important for large, high-resolution displays is the role of physical navigation to get an overview. This requires us to make the distinction between computational aggregation and visual aggregation. Computational aggregation is when an algorithm groups data to compute a new, smaller dataset, and occurs in the graphical representation stage. Visual aggregation is when the human visual system lumps small visual stimuli together, and occurs at the visual perception stage. With large displays, users can physically navigate (step back) to gain a visually aggregated overview. As the user moves away from the display, details are lost and patterns (if the appropriate visual encodings have been chosen) can emerge. Yost et al. have demonstrated the effectiveness of visual aggregation for visualization tasks on large, high-resolution displays 4. Physical navigation combined with visual aggregation has a somewhat similar effect as geometric zooming in computational aggregation. However, semantic zooming in computational aggregation can offer an entirely different effect, in which the representation changes at different levels of detail. Further, how will visualization representations need to be modified to account for the physical navigation around the display?

An important consideration in designing a visualization for a visual aggregation is the effect that it will have on various graphical encodings. The designer needs to consider not just the effect of distance, and thus scaling, on individual glyphs, but also the overall effect as the encodings interact with their neighbors. Endert et al. demonstrated that color made a particularly effective encoding because of the way that it visually aggregates to provide the user with distinctive patterns (as seen in Figure 1) 25. Other encodings such as length were also somewhat effective since they would generally aggregate as brightness. Slope glyphs aggregated with their neighbors to form visible fields and patterns, but the effect on the individual glyphs was such that the values of the fields could not be determined. Interestingly, the different encodings motivated different behavioral responses based on the effectiveness of the overview. The more effective encodings allowed users to stand well back from the display, while the least effective ones required the users to remain close in to the display and employ “lawn mower” tactics, which completely removed their ability to get an overview and focus on particular regions of interest.
3.4. Adaptive Visualizations Relying on pure visual aggregation limits the degree with which a visualization can dynamically adjust based on physical navigation. A related technique would be to use adaptive visualizations, which can produce effects similar to semantic zooming. Adaptive visualizations take advantage of the DPI of large, high-resolution displays and corresponding issues with visual acuity and perception. Visual representations can be designed that create the illusion of changing appearance when viewed from different distances. For example, by building in light colored grid lines or labels which nearly match the background of the texture they are on, details can be embedded into visualizations which can only be seen when a user is physically close to the display but do not interfere with getting an overview when the user is standing further back (Figure 4). This technique will work even in multi-user scenarios, since each user will perceive the visualization appropriately regardless of their relative positions.
[Figure 4 here] Alternatively, semantic zooming concepts can be made more explicit by tracking the user’s physical position with respect to the display, and automatically adjusting the visual representation accordingly. An example might be to enlarge the font of the most important labels as the user steps back. This can be further customized to the perceptual resolution of human focal and peripheral vision. By tracking the user’s visual focus (e.g., eye, head tracking), visual information in the focal area can be made more detailed while semantic zooming techniques operate in the periphery.
4. Visualization Design For visualizations on large, high-resolution displays, considering how well the design of the visualization scales as a whole also becomes important. As the visualization will function on many scales (from many distances), the designer must take into account all the different methods which visualizations can be structured for such multiscale analysis.
4.1. Displaying More Data Larger, higher-resolution displays can be used to increase the amount of data being displayed. In terms of Furnas & Bederson’s Space-Scale concept33, a display with more pixels can show a

greater amount of data space (more overview) or greater depth in scale (more detail) . While this is a strict tradeoff, a display with sufficient pixels can relieve this tension by increasing both to a reasonable, task-dependent point. One could approximate the amount of additional data using a simple calculation such as: number of visible glyphs = display size in pixels / glyph size in pixels. However, the calculation is actually more complex, because it must take into account a variety of other factors including the nature of the data, labeling, appropriate whitespace, and the actual use of the available space. In general, there are several ways that we can potentially apply additional pixels to scale up the amount of information represented in a visualization:
• More data entities: Larger displays can easily make more data entities simultaneously visible reducing the need for aggregation and improving over-plotting issues.
• Greater data dimensionality: This option may be more difficult since screen dimensionality is still limited to 2D, but some spatial representations such as parallel coordinates34 can use additional screen space for increased data dimensionality.
• More data details: In current systems, data details such as textual labels and precise values are typically hidden and displayed only on demand for small numbers of data items. Increased display resolution can enable the continuous or simultaneous display of rich, detailed information.
• Multi-scale data: Very large data can have a multi-scale nature. High resolution can enable the broad view of multiple levels of scale, such as both state and county level demographic data.
• More data complexity or heterogeneity: Greater screen space can support the simultaneous display of more complex data containing diverse data types and structures, and reveal many inter-relationships between them.
• Space for process: The space could be used to visualize the history of views comprising an analytic process in addition to the current view20.
• Space for sensemaking: A visualization workspace on a large display can provide extra space for spatially organized findings, using spatial organization as a form of metadata about the data – clustering or forming timelines. The detailed data and this extra semantic layer can coexist 8.
• Enable collaboration: The size of large, high-resolution displays can support collaboration purely through the increased viewing area. The increase in data could promote potential collaboration if tasks are parallelizable, allowing each user to work within a region of the display. However, additional data could also be used for explicit collaborative support, such as providing each user individual controls (e.g., on-screen keyboards, menus, etc.), or it could be used enable private and shared spaces 35.
These points should not be interpreted as complete list, but rather should provide a number of possibilities, leaving open the question: Are there additional ways of making use of the additional display space available with large, high-resolution displays? The choice of how to deploy additional pixels will clearly depend on the task and the nature of the data. For example, route tracing through geospatial data is likely to benefit from an approach based on increasing the data entities (i.e., increasing the viewed space, or the overview) while maintaining a reasonable level of detail for completing the task. As indicated earlier, the switch to physical navigation should help the user to relate to the space better and thus perform better16.

4.2. Scaling Visual Representations We begin with the question: How do we use the additional pixels to create more insightful visual representations, representations that were not possible with limits of a single monitor desktop display? There are clear benefits in some situations to just increasing the size of the visualization. Our geospatial example above is an instance of this. However, this does not address many of the techniques we identified for increasing the quantity of displayed data. Aside from merely making visualizations larger, there are two over-arching visual representation design approaches that can be used to exploit additional pixels:
• Multiple views: Additional pixels can be used to separate out more data into more views. Tiled displays are particularly well suited to multiple view representations because the tiles provide a natural visual framework for managing and organizing the views into a grid (e.g., Sandstrom et al.36). For example, increasing the number of choropleth map views can support increased dimensionality of demographics data. Similarly, the simultaneous display of multiple heterogeneous, coordinated views can help uncover links in relationships in complex data sets 37.
• Embedded visualization: In contrast, additional pixels can be used to directly visually embed more data into a single larger view. The view can be stretched physically larger on the display, causing each data glyph to encompass more pixels. More visual information can then be encoded into each glyph, such as detailed labels, or even miniature visualizations of embedded data in multi-scale datasets. For example, instead of showing an overview with only small dots with full detail available on demand, large display visualizations such as Figure 5 can embed the detail into the overview.
[Figure 5 here] Initial research results indicate that, for larger displays, the embedded visualization approach may be more advantageous due to the spatially-relevant grouping of information38. The embedded visualization approach is often not possible on a standard desktop display due to the lower resolution. However, on large displays, this technique graphically scales better because proportionally less of the display is needed per attribute. This makes embedded visualizations ideal for displays with more pixels. Embedded visualization can take many forms. We have already mentioned the possibility of embedding high-level details or using sub-visualizations to visualize multi-scale dataset. Another approach is to create a hybrid between multiple views and embedded visualizations in which the multiple views coexist in a single shared space. By allowing the space to support multiple mixed spatial metaphors 39, we can create a flexible, freeform workspace well suited to exploration and incremental formalism 40.
5. User Interaction So far we have covered challenges and opportunities related to display technology, visual encodings, and visualization design when using large, high-resolution displays. This leads us to

ask the question: How will user interaction with visualizations need to change when using large, high-resolution displays? In this section we focus on interaction issues specific to information visualization, including navigation techniques, brushing and linking, and interaction with separate controls or widgets. For general large display user interface challenges such as reaching distant objects, tracking the cursor, managing space layout, and alternative input devices, see Ni et al.12. Many innovative ideas for dealing with general pointing and interaction problems have been implemented41-43. These techniques include both software and hardware implementations. For collaboration, many of these same interaction techniques apply. Specifically, the larger physical footprint allows for passive collaboration where a single user presents the information while a group can observe the information and comment. In contrast, multiple users can participate synchronously in a co-located space, given the space and display is setup with appropriate input devices, user interface, and an open physical layout where the users can move freely. Specialized interactions to support the collaborative process are also important, such as handing off information objects and management of private and shared spaces 44.
5.1. Navigation Techniques The most basic difference appears to occur within navigation techniques: there is a trade-off between virtual navigation and physical navigation. While physical navigation (moving eyes, head, and body) has advantages in speed and maintaining context, virtual navigation (panning, zooming) may require less strenuous effort from users. While smaller displays emphasize virtual navigation, larger displays offer users the choice of both. Studies indicated that users prefer physical navigation, thus reducing the amount of virtual navigation used 3. An important impact is that the design of other interactions must then afford or even exploit physical navigation. For example, an interaction design principle for visualization on large displays is localized interaction, in which interaction effects are localized based on the user’s position and focus. How is the design of basic virtual navigation techniques typically used in information visualization (such as overview+detail, focus+context, and pan+zoom) affected by physical navigation on large, high-resolution displays? The Pan+zoom strategy should account for the user’s position when centering the zoom, and account for the user’s distance from the display when calculating the pan scrolling rate 45. Arranging the views for the overview+detail strategy is problematic. For example, in large scale visualizations, “details on demand” should be displayed in context. When users request the details from a specific data point in the large Spotfire scatterplot visualization in Figure 3, the details are displayed in a tiled view on the far right (using the overview+detail method) where the user cannot see them and must physically navigate back-and-forth between the data points and details. Instead, the details should be embedded within the overview as in Figure 5, or popup nearby the selected point. Thus, focus+context is likely to be the most effective strategy, by exploiting the large display space to maintain context and localizing temporary display of details to within the user’s current area of high visual acuity. Large displays also ameliorate the primary problem of focus+context, namely its lack of scalability to large zoom factors, and affords multiple foci for multiple users.

The available display space should also be used to enable the display of multiple detail popups or foci (Figure 5), thus enabling the user to make comparisons or keep useful detail information persistent on the screen during long analyses. For example, in the network security example in Figure 3, analysts need to keep details (IP addresses) of suspicious points (packets) visible, marking their locations and enabling rapid re-consultation. Additional background whitespace available on large displays can be used as drop targets for displaying and managing multiple detail popups, as well as targets for other types of interaction.
5.2. Brushing and Linking Familiar techniques, such as brushing and linking, are more critical to the usability of large display visualizations for the following reasons. First, more data can be displayed over more coordinated views, each of which are simultaneously visible. When analyzing data in multiple coordinated views, the ability to select data in one view and quickly see where that information is in the other views is important to users. Additionally, in the case of a single large view that occupies the entire display, the ability to brush and link is useful for comparisons or highlighting correlated data. Endert et al. have shown how making these comparisons where there are large physical distances between points being compared is difficult for users due to difficulties such as keeping track of the two values to be compared, and the difficulty of accurately perceiving the represented values of two distant glyphs 25. A challenge for designers is drawing the users’ attention towards the linked points in the views. It is likely that change blindness46 will become a major problem on large displays, and users may not see the linked highlights in the periphery. Scanning very large complex visualizations for highlighted elements is cumbersome and identifying differences from previous selections will be difficult to remember. Some potential solutions are to use motion47 (which may become too distracting) or temporary flashing, or to update views based on eye movement and when a user looks at a view, or to simply change the speed that views update either to a slower speed or to varying speeds based on the distance between the user and the view. Another possibility is to use some form of afterglow effects48 for showing change.
5.3. Selecting and Marking Interactively selecting data glyphs, as needed in brushing and linking, may require new solutions on large high-resolution displays. These techniques include wands for pointing, touch screens, aware spaces for gestures, and others. A thorough review of existing techniques49 is beyond the scope of this paper, but it is likely that techniques currently proposed in the literature will need to be adapted for visualization specific tasks. In general, the challenge with techniques for selecting data on a large display is an issue of scale. Users must be able to select information at the individual and overview level. Hence, interaction techniques must accommodate for multi-scale selection. New input devices and techniques50 proposed for large displays may not work well for both extremes. For example, gestures or touch screens may be too coarse for small selections without special interaction techniques51. On the other hand, stylus/touch sensitive displays may cause difficulty making large selections, especially in the presence of display tile bezels. Special adaptations such as virtually extending the hand of the user, bringing objects closer52, or having a small overview of data from which to

select a region can help with these issues53. One challenge is providing interaction to users from dynamic locations. Hence, one might ask: How can visualizations and interactions adjust based on the user’s physical navigation behaviors and location? One such approach is multi-scale interaction, where different types of operations such as coarse and fine modes of input are automatically selected based on the users’ distance from the display 45. For example, users are provided a large coarse selection region when distant from the display where more global selections are desired. When moving closer, the selection area becomes smaller and finer, as selection is needed at the detail level (Figure 6). This approach links the scale of interaction to the scale of visualization, based on the user’s distance from the display, giving users new kinds of multi-scale interactive operations that respond to physical navigation and are useful for grouping and clustering tasks. This can be accompanied with corresponding changes to the visual representation based on distance, such as giving legends applicable to the overview when far away, and legends applicable to the detail when closer. [Figure 6 here] Large displays also present users with the opportunity to select and mark information physically. That is, users are able to physically point and select information (when using touch displays), or simply use their finger to mark their place for reference. This is a direct result of moving beyond the technical limitations and further enabling the human abilities. Results have shown users doing so, likely due to the immediacy of the action, as well as the current inability to brush and link over disconnected tools. For example, a study found users physically pointing to one glyph and using their other hand to scan another view (residing in another tool) on the display 20. This strategy becomes problematic when the two targets being physically selected are further apart than the users’ arms can reach. In fact, two users were observed to collaboratively point to distant targets for comparison, with one user pointing to each target. Similarly, in a study where a single, large visualization was displayed to users (without any interaction techniques provided other than physical navigation), users were observed stepping away from the display while attempting to maintain a heading towards the two targets by pointing. A user would find a point of interest, point to it while stepping back, approach another point of interest, all along attempting to maintain the heading of the previous location. Often, this resulted in being able to rapidly reacquire the original target 25. This leads to the open question: How can users mark points of interest in a very salient and physical way without compromising the visual representation or other interactions?
5.4. Control Panels An important design element in information visualization is the control panel, such as dynamic query sliders, that operate on other visual representations. Large displays afford ample space for scaling up to larger numbers of controls or more advanced controls. However, the standard approach used in small displays (docking the panels around the edges of the display) is problematic on large displays. Controls can become physically distant from the user making them hard to access54, and distant from the visual elements they operate on making it hard to see effects (e.g., dynamic query filtering). For example, in the large scale Spotfire visualization in Figure 3, the controls for the X and Y axes are frequently used together, yet reside on opposite

corners of the large scatterplot, creating poor performance due to Fitts’ Law. Potential solutions for co-locating control location and user attention are:
• Moveable controls: users move the control panel to where they are currently working on the large display55. Optionally, controls could automatically follow the user or cursor54.
• Pop-up controls: a gesture causes controls to appear at the user’s location, at the correct scale, and disappear when done. Context-sensitive controls can appear based on current focus of interaction. For example, in Figure 5, a search box appears below the currently selected document to enable quick access to search functionality while reading the document.
• Hand-held controls: controls are off-loaded onto a separate mobile display device, such as a palm or tablet that users carry with them 56. This takes better advantage of embodiment principles57, but requires users to carry a separate device. The hand-held should be non-tethered to preserve mobility for physical navigation5.
• Gestures: visual controls are replaced by gestures, such as a pinch gesture 58 or two-handed lateral gesture to specify a dynamic query filter bounds.
In general, controls should be consolidated onto a small number of control panels so that controls do not become scattered and lost on a large display. In collaborative multi-user scenarios, localized controls such as lenses may be more appropriate than global controls. Touch interfaces also create an opportunity for allowing users to interact with the visualization from any location on the display without requiring a cursor or other single point of interaction. By removing the need for a cursor or other input techniques, multi-touch displays enable users to access information at any region of the display on demand. Additionally, the on-demand control panels can be located near the users for easy access.
5.5. Spatial Interaction Large displays emphasize the meaning of space in visualization and sensemaking, for example clustering implying relationships based on proximity 8. While clustering is useful on small displays, large displays extend this to multi-scale levels including clustering of views and their contents. Thus, spatial interaction can offer deeper analytic functionality, such as arranging information and controlling confidence levels of evidence by interactively adjusting spatial proximities (Figure 5). Large displays shift interaction emphasis onto spatial interaction, such as drag and drop, spatial arranging, linking, grouping and clustering. For instance, users in a spatial workspace can take advantage of arranging, and more importantly re-arranging, information to create a layout of the information that matches their mental model. Larger displays provide the opportunity to show more detailed views (e.g., multiple document views) rather than a single view where the fully detailed information is shown, and a separate view for spatially interacting with the information at an aggregated level (e.g., dots representing documents). Building on this, what new types of spatial interactions can be designed for large display visualization? For example, multi-touch interaction combined with large display visualizations can enable more explicit user control when grouping many small visual entities 59, such as using two handed gestures to interactively surround and manipulate groups of related entities.
6. Conclusion Large, high-resolution displays are fundamentally different from conventional displays. Rather than being small portals in which the user must fit their work, they are human-scale

environments that are defined more by the abilities and limitations of the user than by the technology. Designing for these displays is thus not simply a matter of scaling up existing visualizations or displaying more data, instead designers must adopt a more human-centric perspective. In this work, we have taken this human-centric approach to provide an overview of the different design issues, challenges and research opportunities that designers encounter when designing information visualizations for large, high-resolution displays. In particular, we have highlighted the importance of physical navigation in how the user will approach, perceive, and engage with visualizations on these displays, and thus how it should shape design. Throughout this discussion, we highlighted other key themes, raising critical open research questions and providing a number of design guidelines (summarized in Table 3). We hope that these guidelines will aid designers in creating effective information visualization applications for large, high-resolution displays, and that the issues discussed throughout this paper will motivate future research. Acknowledgements This research is partially supported by the National Science Foundation grants #CNS-0423611-001 and #IIS-0617975. This study was also supported and monitored by the Advanced Research and Development Activity (ARDA) and the National Geospatial-Intelligence Agency (NGA) under Contract Number HM1582-05-1-2001. The views, opinions, and findings contained in this report are those of the authors and should not be construed as an official US Department of Defense position, policy, or decision, unless so designated by other official documentation. References 1 Fekete JD and Plaisant C. Interactive Information Visualization of a Million Items. IEEE
Symposium on Information Visualization (InfoVis) 2002 (Boston, Massachusetts, USA); 117-124.
2 Huber P. Huge Data Sets. Compstat '94 1994 (Vienna, Austria), Physica; 3-13. 3 Ball R, North C, and A. Bowman D, Move to improve: promoting physical navigation to
increase user performance with large displays, in CHI 2007. 2007, ACM: San Jose, California, USA.
4 Yost B, Haciahmetoglu Y, and North C, Beyond visual acuity: the perceptual scalability of information visualizations for large displays, in CHI 2007. 2007, ACM: San Jose, California, USA. p. 101-110.
5 Shupp L, et al. Shaping the Display of the Future: The Effects of Display Size and Curvature on User Performance and Insights. Human–Computer Interaction 2009; 24(1): 230 - 272.
6 Ni T, Bowman D, and Chen J. Increased Display Size and Resolution Improve Task Performance in Information-Rich Virtual Environments. Graphics Interface 2006 (Quebec City, Canada); 139-146.
7 Czerwinski M, Tan D, and Robertson G. Women Take a Wider View. CHI '02 2002 (Minneapolis, MN), ACM; 195-202.
8 Andrews C, Endert A, and North C, Space to Think: Large, High-Resolution Displays for Sensemaking, in CHI. 2010. p. 55-64.

9 Tan DS, et al. Physically large displays improve performance on spatial tasks. ACM Trans. Comput.-Hum. Interact. 2006; 13(1): 71-99.
10 Bi X and Balakrishnan R, Comparing usage of a large high-resolution display to single or dual desktop displays for daily work, in Proceedings of the 27th international conference on Human factors in computing systems. 2009, ACM: Boston, MA, USA. p. 1005-1014.
11 Eick SG and Karr AF. Visual Scalability. Journal of Computational & Graphical Statistics 2002; 11(1): 22-43.
12 Ni T, et al. A Survey of Large High-Resolution Display Technologies, Techniques, and Applications. IEEE Virtual Reality 2006 (Alexandria, VA, USA); 223-234.
13 Ware C, Information Visualization: Perception for Design. Morgan Kaufmann, 2000pp. 14 Swaminathan K and Sato S. Interaction Design for Large Displays. Interactions 1997;
4(1): 15-24. 15 Ball R and North C. Effects of Tiled High-Resolution Displays on Basic Visualization
and Navigation Tasks. Extended abstracts of Human Factors in Computing Systems (CHI '05) 2005 (Portland, OR, USA), ACM; 1196-1199.
16 Ball R, et al. Evaluating the Benefits of Tiled Displays for Navigating Maps. IASTED-HCI '05 2005 (Phoenix, AZ), ACTA Press; 66-71.
17 Yost B and North C. The Perceptual Scalability of Visualization. IEEE Transactions on Visualization and Computer Graphics 2006; 12(5): 837-844.
18 Polys N, Kim S, and Bowman D. Effects of Information Layout, Screen Size, and Field of View on User Performance in Information-Rich Virtual Environments. Virtual Reality Software and Technology 2005 (Monetery, CA, USA), ACM; 46-55.
19 Endert A, Fink GA, and North C. Visual Analytics for Cyber Security: Observations and Opportunities for Large Display Workspaces. Information Visualization to appear.
20 Fink G, et al. Visualizing Cyber Security: Usable Workspaces. VizSec 2009. 21 Ball R and North C. An Analysis of User Behavior on High-Resolution Tiled Displays.
Tenth IFIP International Conference on Human-Computer Interaction (INTERACT 2005) 2005: 14.
22 Alphonse GA and Lubin J. Psychophysical Requirements for Tiled Large Screen Displays. High-Resolution Displays and Projection Systems 1992 (San Jose, CA), SPIE; 230-240.
23 Sawant AP and Healey CG, A Survey of Display Device Properties and Visual Acuity for Visualization. 2005, Department of Computer Science, North Carolina State University.
24 Wigdor D, et al., Perception of elementary graphical elements in tabletop and multi-surface environments, in CHI 2007. 2007, ACM: San Jose, California, USA. p. 473-482.
25 Endert A, Andrews C, and North C, Visual Encodings that Support Physical Navigation on Large Displays. 2010, Technical Report VT-TR201002: Virginia Tech.
26 Ware C, Information visualization : perception for design. The Morgan Kaufmann series in interactive technologies. Morgan Kaufman: San Francisco, CA, 2000pp.
27 Mackinlay JD and Heer J. Wideband Displays: Mitigating Multiple Monitor Seams. Extended Abstracts of Human Factors in Computing Systems (CHI) 2004 (Vienna, Austria), ACM; 1521-1524.
28 Mackinlay JD, et al. City Lights: Contextual Views in Minimal Space. Extended Abstracts of Human Factors in Computing Systems (CHI) 2003 (Ft. Lauderdale, FL); 838-839.

29 Ebert A, et al. Tiled++: An Enhanced Tiled Hi-Res Display Wall. IEEE Transactions on Visualization and Computer Graphics 2010; 16(1): 120-132.
30 Cleveland WS and McGill R. Graphical Perception: Theory, Experimentation and Application to the Development of Graphical Methods. Journal of the American Statistical Association 1984; 79(387): 531-554.
31 Mackinlay JD. Automating the Design of Graphical Presentations. ACM Transactions on Graphics (TOG) 1986; 5(2): 110-141.
32 Tessendorf D, et al. An Ordering of Secondary Task Display Attributes. Human Factors in Computing Systems (CHI) 2002 (Minneapolis, MN, USA), ACM; 600-601.
33 Furnas GW and Bederson BB. Space-scale Diagrams: Understanding Multiscale Interfaces. Human Factors in Computing Systems (CHI '95) 1995, ACM; 234-241.
34 Inselberg A. The Plane with Parallel Coordinates. Visual Computer 1985; 1: 69-91. 35 Vogt K, et al., Co-located Collaborative Sensemaking on a Large, High-Resolution
Display with Multiple Input Devices, in INTERACT. 2011. 36 Sandstrom TA, Henze C, and Levit C, The Hyperwall, in Coordinated and Multiple
Views in Exploratory Visualization (CMV). 2003, IEEE: London, England. p. 124-133. 37 Stasko J, et al. Jigsaw: supporting investigative analysis through interactive visualization.
Information Visualization 2008; 7(2): 118-132. 38 Yost B and North C. The Perceptual Scalability of Visualization. IEEE Transactions on
Visualization and Computer Graphics (Proceedings Visualization/Information Visualization 2006) 2006; 12(5).
39 Robinson AC, Design for Synthesis in Geovisualization. 2008, Pennsylvannia State University: University Park, PA.
40 Shipman F, et al. Emergent Structure in Analytic Workspaces: Design and Use of the Visual Knowledge Builder. Proceedings of IFIP INTERACT'01: Human-Computer Interaction 2001; 132-139.
41 Robertson G, et al. The Large-Display User Experience. IEEE Computer Graphics and Applications 2005; 25(4): 44-51.
42 Guimbretiere F, Stone M, and Winograd T. Fluid Interaction with High-Resolution Wall Size Displays. ACM Symposium on User Interface Software and Technology 2001 (Orlando, Florida), ACM; 11-14.
43 Baudisch P. Interacting with Large Displays. IEEE Computer 2006; 39(3): 96-97. 44 Isenberg P and Carpendale S. Interactive Tree Comparison for Co-located Collaborative
Information Visualization. Visualization and Computer Graphics, IEEE Transactions on 2007; 13(6): 1232-1239.
45 Peck SM, North C, and Bowman D, A multiscale interaction technique for large, high-resolution displays, in Proceedings of the 2009 IEEE Symposium on 3D User Interfaces. 2009, IEEE Computer Society. p. 31-38.
46 Nowell L, Netzler E, and Tanasse T. Change Blindness in Information Visualization: A Case Study. IEEE Symposium on Information Visualization 2001, IEEE; 15-22.
47 Bartram L, Ware C, and Calvert T. Filtering and Integrating Visual Information with Motion. Information Visualization 2002; 1(1): 66-79.
48 Baudisch P, et al. Phosphor: Explaining Transitions in the User Interface Using Afterglow Effects. User Interface Software and Technology (UIST) 2006 (Montreux, Switzerland).

49 Myers B, et al. Interacting at a Distance: Measuring the Performance of Laser Pointers and Other Devices. Human Factors in Computing Systems (CHI) 2002, ACM; 33-40.
50 Cheng K and Pulo K. Direct Interaction with Large-Scale Display Systems Using Infrared Laser Tracking Devices. Asia-Pacific Symposium on Information Visualization 2003 (Adelaide, Australia), Australian Computer Society; 67-74.
51 Benko H, Wilson A, and Baudisch P. Precise Selection Techniques for Multi-Touch Screens. Human Factors in Computing Systems (CHI) 2006 (Montreal, Canada), ACM; 1263-1272.
52 Bezerianos A and Balakrishnan R. The Vacuum: Facilitating the Manipulation of Distant Objects. Human Factors in Computing Systems (CHI) 2005 (Portland, OR), ACM; 361-370.
53 Collomb M, et al. Improving Drag-and-Drop on Wall-Size Displays. Graphics Interface (GI) 2005 (Victoria, BC); 25-32.
54 Sabri A, et al. High-Resolution Gaming: Interfaces, Notifications and the User Experience. Interacting with Computers Journal 2006: (To appear).
55 Buennemeyer T, et al. Intelligence Analysis Using High Resolution Displays. IEEE International Conference on Intelligence and Security Informatics (ISI) 2006 (San Diego, CA, USA); 652-653.
56 Andrews C, et al., Cardtable: An embodied tool for analysis of historical information, in IEEE Tabletop2007. 2007.
57 Dourish P, Where the Action Is: The Foundations of Embodied Interaction. MIT Press: Cambridge, 2001pp.
58 Vogel D and Balakrishnan R, Distant freehand pointing and clicking on very large, high resolution displays, in Proceedings of the 18th annual ACM symposium on User interface software and technology. 2005, ACM: Seattle, WA, USA. p. 33-42.
59 North C, et al., Understanding Multi-touch Manipulation for Surface Computing, in Proceedings of the 12th IFIP TC 13 International Conference on Human-Computer Interaction: Part II. 2009, Springer-Verlag: Uppsala, Sweden. p. 236-249.

Figure Legend Figure 1: A 50-display tiled large, high-resolution display. Figure 2: An alternate form factor (curved) large, high-resolution display functioning as an
everyday workstation. Figure 3: Large Display network traffic visualization. Multiple levels of scale are available via
physical navigation. Figure 4: Adaptive Visualizations have detail elements that can be seen close up but not from a
distance. This allows users to access details when physically close and creates the visual illusion of the details disappearing from a distance.
Figure 5: A large display intelligence analysis prototype, LightSpire, showing a clustered view of
textual documents (shown as small rectangles containing only titles of documents). The embedded details (full textual documents shown as large rectangles) are accessible in context of this clustered overview.
Figure 6: Using a wand to select at different scales based on distance from the display. Table Legend Table 1: Examples of Graphically Scalable and Non-scalable Representations Table 2: Perceptual Challenges Large Displays Pose for Graphical Encodings. The impact of
each display attribute (column) has on each graphical encoding (row). Table 3: Visualization Design Guidelines for Large, High-Resolution Displays ---------------------------------- Figures -------------------------------------------
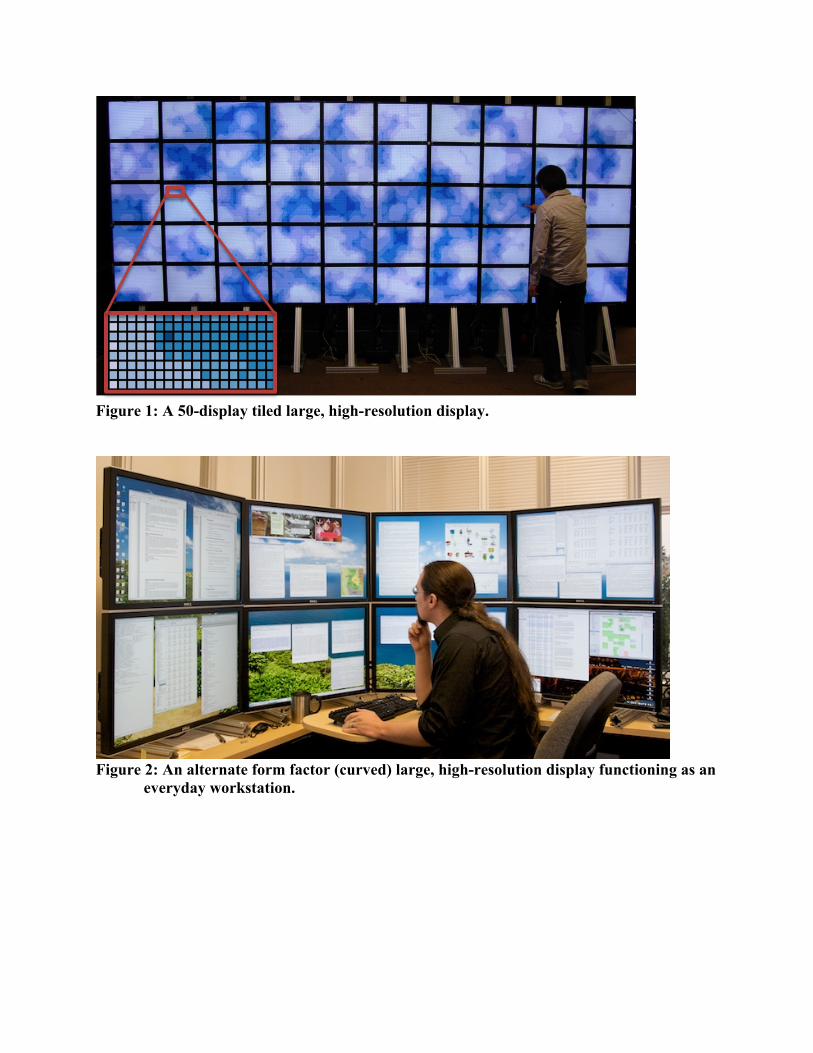
Figure 1: A 50-display tiled large, high-resolution display.
Figure 2: An alternate form factor (curved) large, high-resolution display functioning as an
everyday workstation.

Figure 3: Large Display network traffic visualization. Multiple levels of scale are available
via physical navigation.
Figure 4: Adaptive Visualizations have detail elements that can be seen close up but not
from a distance. This allows users to access details when physically close and creates the visual illusion of the details disappearing from a distance.
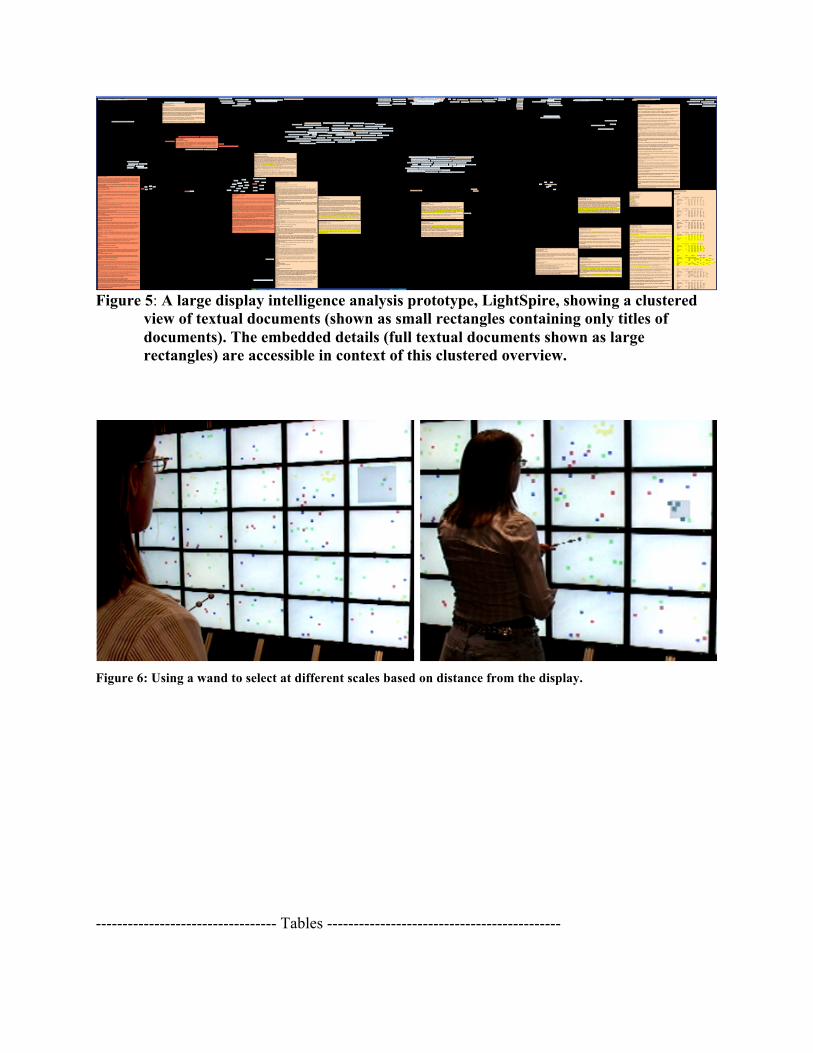
Figure 5: A large display intelligence analysis prototype, LightSpire, showing a clustered
view of textual documents (shown as small rectangles containing only titles of documents). The embedded details (full textual documents shown as large rectangles) are accessible in context of this clustered overview.
Figure 6: Using a wand to select at different scales based on distance from the display.
---------------------------------- Tables --------------------------------------------

Table 1: Examples of Graphically Scalable and Non-scalable Representations
Scalable Not Scalable • Number of glyphs • Glyph size, length, area • Spatial position , Over plotting • Motion • Textual content of labels • Glyph complexity
• Number of perceivable colors • Glyph orientation • 3D occlusion • Network connectivity edge crossing • Symbols
Table 2: Perceptual Challenges Large Displays Pose for Graphical Encodings. The impact of each display attribute (column) has on each graphical encoding (row).
Display Attribute
Graphical Encoding
Distance Viewing Angle DPI Bezels
Spatial Position
· Outer spatial locations are in peripheral vision · Comparisons occur over long distances
· Masks information at edges of display when close
· Presses limits of visual acuity
· Can cause spatial distortion · Information may be hidden behind bezels
Glyph Size · Hard to compare when far apart
· Extreme angles can distort aspect ratios
· If based on number of pixels, higher DPIs lead to less perceptible differences
· Could cause a spanning object to look either bigger or smaller
Color Encoding · Not many color photoreceptors in peripheral vision
· Low quality display viewing angle can affect the color encoding
Orientation · Individual glyphs (e.g., slope) not well perceived from distance
· The visual angle can change the apparent orientation
· Glyphs crossing bezels may appear distorted
Table 3: Visualization Design Guidelines for Large, High-Resolution Displays
• Display a large amount of information when available. Take advantage of the wide field of view and high-resolution (§ 4.1).
• Use multi-scale visualizations that exploit the space to display details directly within the overview on a continuous basis (§ 4.1).
• Use embedded visualizations instead of visual segregation or multiple views. Embedded visualizations reduce the amount of physical navigation and visually aggregate better than multiple views (§ 4.2).

• Use visual encodings and designs that visually aggregate. Visual aggregation can act as an aid to visual acuity, support physical zooming, and increase the clarity of patterns (§ 3).
• Use adaptive visualizations to enable physical semantic zooming, by creating designs that take advantage of the limits of human perception. Create the visual illusion that distracting details disappear as a user moves away from the display, or that overview structures blend in to details when moving closer. Use transparency and color to blend overview and details (§ 3.4).
• Choose representations based on the graphical scalability of the visual encodings. Spatial and size encodings are graphically scalable. Network encodings are least scalable (§ 3.1).
• Choose representations based on the perceptual scalability of the visual encodings. Consider how various encodings will be affected by viewing distance and angle. Use color encodings as a dual encoding to support size encoding (§ 3.2).
• Have both local and global legends to aid in multi-scale analysis (§ 5.3). • Place labels at multiple strategic locations and sizes to aid users in maintaining
physical context (§ 3.4). • Localize dynamic notifications to user’s area of focus when critical (§ 3.2). • Use whitespace for contextual or task meta-information. Use background space for
additional interaction and organization, such as dragging and dropping documents into the space (§ 5.1).
• If display tile bezels are present, avoid placing data points and labels on or directly adjacent to bezels (§3.2).
• Emphasize the use of space as the primary interaction mechanism for sensemaking, often replacing other forms of interaction such as dialog boxes. Offer a semantic layer that allows users to organize in space and offload mental constructs into the space (§ 4.1).
• Enable users to spawn many document views, rather than reuse a single view (§ 5.1).