informing online and mobile map design with the...
TRANSCRIPT
Informing Online and Mobile Map Design with the Collective Wisdom of Cartographers
Johannes Schöning Expertise Ctr. for Digital Media
Hasselt University – tUL - iMinds [email protected]
Brent Hecht Dept. of Comp. Sci and Engineering
University of Minnesota [email protected]
Werner Kuhn Department of Geography
UC Santa Barbara [email protected]
ABSTRACT Despite the large and growing prominence of online and mobile maps, they have not been broadly and systematically examined with a lens informed by traditional cartography. Using an approach rooted in cartographic theory and a unique dataset of 382 publicly-displayed local maps, we identify the “collective wisdom” of hundreds of cartographers with respect to a number of cartographic design decisions. We compare our findings to the approaches taken in popular online and mobile map platforms and develop suggestions for incorporating the collective wisdom of cartographers into these systems. Our suggestions include the adoption of location-aware cartography, in which cartographic approaches are intelligently varied based on the type of location being viewed. We provide mockup designs of online and mobile maps that implement our suggestions and discuss means by which the surprising gap between online and mobile maps and traditional cartography may be bridged.
Author Keywords Mobile maps; online maps; cartography; geography; local maps; map design
ACM Classification Keywords H.5.m. Information interfaces and presentation (e.g., HCI): Miscellaneous.
INTRODUCTION Online and mobile maps are an essential part of the modern computing experience. These maps have been described as having the “potential to be as important a means of human computer interaction as our current GUI paradigm” [13] and mobile maps specifically have been labeled as the area
in which “mobile matters most” [27]. The latter assertion is supported by recent statistics that suggest that the Google Maps app is the most popular app in the world [8].
The rapid increase in the popularity of online and mobile maps means that cartography now plays a more prominent role in many people’s daily lives than ever before. Despite this newfound prominence, however, online and mobile maps have not been systematically examined with a traditional cartographic lens. Indeed, a surprisingly large gap exists between traditional cartography and well-known online and mobile maps [11,36]. For instance, Google Maps has been developed almost exclusively by non-cartographers, although this has been changing recently [24]. Along the same lines, Apple Maps’ cartographic approaches have been the subject of heavy criticism by professional mapmakers [4,15].
The high-level goal of this paper is to begin the process of better integrating traditional cartography and modern online/mobile maps. Our approach for doing is so is rooted in cartographic theory and allows us to infer the collective wisdom of cartographers, present in a corpus of maps using a qualitative coding methodology. We apply this approach to a unique dataset of 382 publicly-displayed local maps, resulting in the first study of a large corpus of these maps. We then compare the findings of our study to the cartographic design decisions made in popular online and mobile map systems. Through this comparison, we are able to make suggestions for incorporating the collective wisdom of cartographers into these systems.
The most significant of our design suggestions introduces the notion of location-aware cartography. In our analyses, we found that maps of different types of locations use different cartographic approaches. These differences occur along a variety of design dimensions, ranging from map orientation to the selection of visible map layers (i.e. the data that are shown on the map). While the principle that no map design can be optimal for all areas is strongly ingrained in traditional cartography [21,31], cartographers’ location-aware approach stands in contrast to that of well-known online and mobile map systems. These systems all implement a one-size-fits-all strategy, depicting every type of location using the same cartographic grammar.
We also make a number of more targeted suggestions for maps of specific types of locations. For instance, we find
Permission to make digital or hard copies of all or part of this work for personal or classroom use is granted without fee provided that copies are not made or distributed for profit or commercial advantage and that copies bear this notice and the full citation on the first page. Copyrights for components of this work owned by others than the author(s) must be honored. Abstracting with credit is permitted. To copy otherwise, or republish, to post on servers or to redistribute to lists, requires prior specific permission and/or a fee. Request permissions from [email protected]. DIS '14, June 21 - 25 2014, Vancouver, BC, Canada Copyright is held by the owner/author(s). Publication rights licensed to ACM. ACM 978-1-4503-2902-6/14/06…$15.00. http://dx.doi.org/10.1145/2598510.2598543
that many maps of rural areas in our dataset communicate the usage rules of the depicted space. Examples of these rules, which can be communicated via text or icons, include “stay on the trail”, “no campfires”, and “avalanche area, stay out”. Despite the commonness of these rules in our map corpus, no popular online or mobile map system currently supports them. This is an omission that potentially has implications for personal safety and the conservation of protected areas.
To summarize, this paper makes the following five contributions to the literature on online and mobile maps:
1. We perform the first study of cartographic design decisions made in a large corpus of publicly displayed local maps. This study contributes to the cartographic body of knowledge in addition to helping to inform the design of online/mobile maps.
2. We show that the design decisions made by the cartographers of local maps suggests that online and mobile map systems should consider a location-aware cartography approach, in which the design of a map intelligently adapts to the type of location.
3. We identify a large set of more targeted design suggestions for online and mobile maps.
4. We demonstrate how our design guidelines might be implemented in the short-term by presenting two mockups.
5. Lastly, this paper also makes a dataset contribution. To aid other researchers in the study of local maps and their application to modern online and mobile maps, the 382 local maps considered here are available for research purposes upon request1.
RELATED WORK Online and mobile maps have attracted substantial interest in human-computer interaction (HCI) and related areas over the past 10 to 15 years. One topic of significant recent activity involves exploring the effect of novel map modalities on navigation performance (e.g. [18]). Other examples include helping users perform map-based tasks such as route selection [20] and geospatial refinding [37], using online maps to visualize patterns in unstructured text (e.g. [1, 16]), and helping users improve their spatial thinking skills (e.g. [29]). However, none of this work has turned to traditional cartography or the collective wisdom of cartographers to provide general design guidelines for online and mobile maps as is done here.
Our research is not the first in the HCI domain to consider publicly displayed local maps. Recent work has focused on using “magic lens” approaches from augmented reality to add digital layers on top of these maps (e.g. [23,28]). Most relevant to this research is Schöning et al.’s PhotoMap system [28], which allows people to take a picture of a local
1 Please contact the first author for access to the dataset.
map, georeference it on their mobile phone, and use it for navigation. Although Schöning et al.’s work was focused on system development, as part of this process, a small group of local maps were briefly analyzed and the rates of “you-are-here” dots and north-up orientations was reported. These are two of the many cartographic attributes we consider below, although we consider them in the context of a much larger corpus.
Outside the research community, practitioners in industry have experimented with ideas relevant to those presented here. Bing Maps supports an optional mode in which the base map is changed as the user zooms in/out of certain map scales. This is roughly analogous to a basic implementation of our base map suggestions below, but varied over scale rather than space (and varied in a more limited fashion). In this research, we focus on a large number of cartographic attributes in addition to base maps and ground our design suggestions in the collective wisdom of cartographers evidenced in local maps.
Geographers and cartographers have increasingly examined HCI-related topics [12] ranging from the role of gender in online communities [32] to indoor navigation [33]. The most relevant activity in this space, however, is the recent push to help geographers and cartographers incorporate best practices from user experience design into their work (e.g. [26, 30]). This is effectively the complementary inverse of the process that we initiate in this paper.
Finally, it is important to note that humanities-oriented geographers and cartographers in the area known as critical cartography [5] have been active in critiquing online and mobile map systems. “Critical cartographers” have raised important concerns about these systems with regard to culturally biased representations of space [9] and the power of corporations to define local and global geographies [33], among other issues. However, all of this work almost exclusively operates at the level of critical theory.
DATASET When selecting a dataset for our analysis, we identified two possible options: (1) downloading a large number of maps from the Web, and (2) locating a suitable corpus of offline maps. We selected the latter option for two reasons.
First, it is well known in traditional cartography that maps are designed for a specific purpose. A general-reference map [31] of a city neighborhood will make different design choices than a map of crime in that neighborhood, a map of that neighborhood’s property values, and so on. As such, we needed to make sure that the purpose of the maps in our traditional cartography corpus was aligned with the primary high-level purpose of online and mobile maps: orientation and navigation (or in the less cartographically formal words of MapQuest’s motto, “knowing where to go and how to
get there”2). Effectively, this means that we were interested in general-reference maps but not thematic maps, the broad category of maps that displays the “spatial pattern of a theme or attribute” [31] (e.g. crime, property values). Executing a number of queries comprised of place names followed by “map” in an image search engine, we found both types of maps interspersed, with manual separation being the only straightforward solution to this problem.
Second, some of our analyses below required that the maps we consider be publicly displayed. For instance, our conclusions about the presence/absence of “you-are-here” dots would be invalidated if we failed to control for a map not being produced for public display at a single, specific location. There is no straightforward way to control for this issue with downloaded maps, even using manual approaches.
Due to the issues associated with using maps downloaded from the Internet, we sought out an offline solution. Specifically, we needed a corpus of general-reference maps that are publicly displayed. We were able obtain a unique map corpus that meets both of these criteria. This corpus contains 382 photos of publicly-displayed local general-reference maps taken in-situ by a single cartographer over a period of six years. It consists of photos of all local maps the cartographer encountered in her/his daily life and in her/his domestic and international travel during this six-year period. The maps in the dataset come from 17 countries on three continents, with the most maps coming from Germany (149), the cartographer’s home country, followed by Japan (65), USA (39), UK (31), and Canada (24). All analyses below are executed on this corpus.
METHODOLOGY Traditional cartography is both an art and a science [6,25]. While there are established best practices for certain design dimensions, most of these involve a mapmaker choosing from a large number of possible options. To capture the actual design decisions made by cartographers, we developed a formal, data-driven methodology based on a cartography theory-informed iterative coding process.
Because a primary goal of this research is to identify common cartographic approaches taken in maps of specific types of locations, the first coding exercise was targeted at developing a bottom-up typology of location types. The final set of location types and numbers of maps that depict each type can be found in Table 1. For simplicity, we refer to a collection of maps that depict the same type of location as a map category.
Next, consulting the literature on cartographic best practices (e.g. [21,31]), we identified a set of cartographic attributes that would form the main dimensions of analysis in our comparisons across map categories and in our comparisons 2 http://advertising.aol.com/brands/mapquest
between local maps and online/mobile map systems. These dimensions include the presence/absence of map elements like north arrows, scales, and legends; map orientation; the type of “you-are-here” dot used; and the map layers depicted. The full list of cartographic attributes considered can be found in the results section. The last portion of our coding process was dedicated specifically to certain cartographic attributes such as map layers, which required an additional round of coding. We intentionally focused on high-level cartographic attributes in this research, leaving lower-level attributes (e.g. the specific visual variables [2] used to encode each type of layer) to future work, for which we are developing semi-automated approaches to make such a detailed coding exercise more feasible.
The majority of coding exercises followed a common strict procedure. When developing a coding scheme was necessary (e.g. for map categories), two coders made a single pass through all the maps, identifying a preliminary set of codes as they went. The coders then worked to merge their individual coding schemes to develop a final, overall coding scheme. Once this final scheme was established, each map was coded independently by two coders. A third coder resolved disagreements. For this and all other coding exercises, we ensured that at least one of the coders was trained in cartography, which we defined as having taken two or more courses in cartography at the university level. Occasionally, it was necessary to adapt the above default approach to fit the needs of a particular coding exercise. Where this occurred, we describe the coding process in context in the results section.
The final step in our approach was to compare the results of our coding process to the design choices made in five different online and mobile map systems: (1) standard web-based Google Maps, (2) mobile Google Maps, (3) Apple Maps, (4) Bing Maps, and (5) OpenStreetMap (using the default cartographic style at the time of analysis). When making these comparisons, the online and mobile maps were examined at scales and extents analogous to those of the corresponding maps in our corpus.
RESULTS
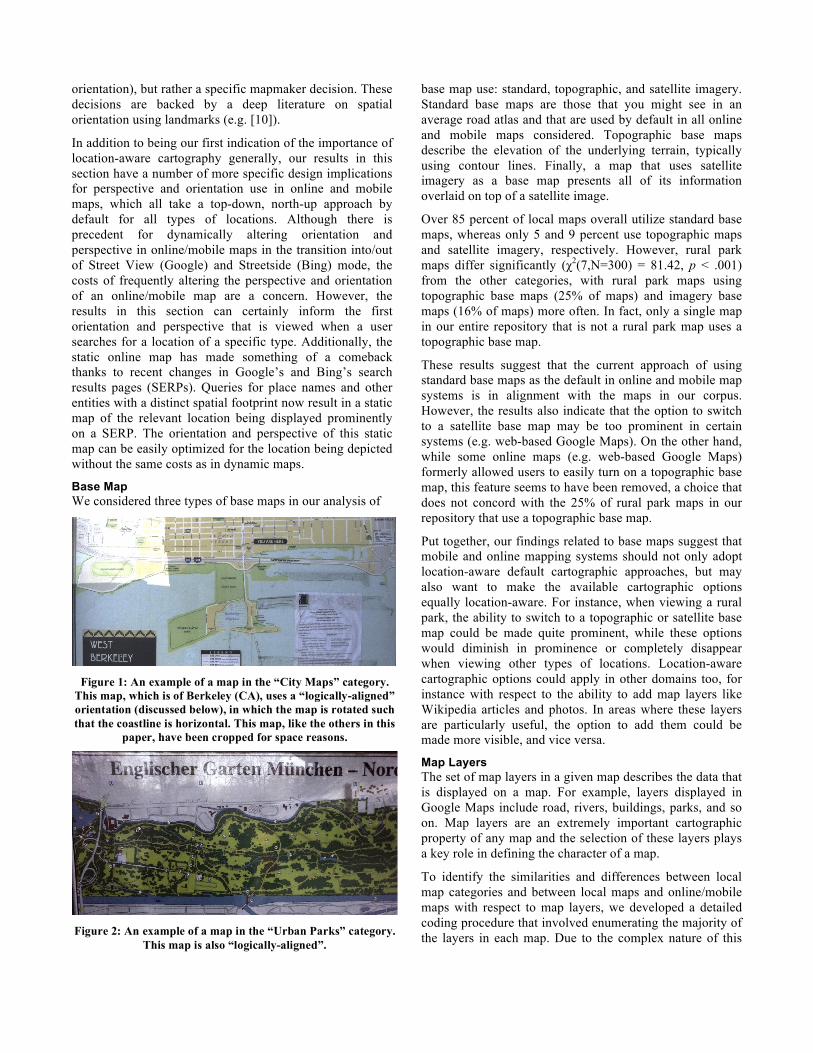
Map Categories The final typology of locations developed using the coding scheme described above resulted in each map being assigned to one or more of ten map categories. These categories and the number of maps assigned to each of them can be found in Table 1. The largest category of maps in the corpus is city maps, which depict general areas of cities (e.g. the map of West Berkeley, California in Figure 1). Other large categories include rural park maps, which depict areas like national and regional parks, and tourist site maps. Eighty-one (21%) maps were assigned to more than one category. The two map categories with fewer than 10 maps (event-related maps and sports venue maps) were excluded from further analysis due to small sample size.
Map Perspective and Orientation Once all maps had been assigned to one or more categories, we could begin analyzing the maps according to our set of map attributes derived from traditional cartography. The first attributes we considered were map perspective and map orientation. Decisions related to perspective and orientation are important considerations in traditional cartography. A map’s perspective defines the angle at which the map viewer sees the depicted area (e.g. “top-down”, “bird’s eye view”). Map orientation describes “how directions on the map align to directions on the ground” [19] (e.g. “north-up”).
We identified four different types of map perspectives in our dataset: top-down (327 maps), bird’s eye (45 maps), section (5 maps), and fish-eye (1 map). The top-down perspective represents the “typical” approach in modern cartography in which the map viewer looks straight down at the surface of the Earth. The bird’s eye perspective is similar to top-down, but the map viewer’s gaze direction and the surface of the Earth are not perfectly perpendicular. Section perspectives, more common in architecture and geology than in general-reference maps, generally show a 3D object (e.g. a building) as if it were sliced in a direction perpendicular to the surface of the Earth [3] (as in a dollhouse). Finally, the fisheye perspective is a cartographic analogue to fisheye views [7]. Due to their small number, section and fisheye perspectives were not considered in the quantitative analysis in this section.
We detected a significant difference in the use of map perspectives across map categories (χ2(7,N=295) = 18.25, p < 0.05). While there is a strong bias towards top-down perspectives in all map categories, tourist site, rural park, and campus maps utilize bird’s eye views approximately 20 percent of the time. Examining these bird’s eye view maps, a clear trend emerges: in places where topography (i.e. mountains) are prominent, bird’s eye view maps are more common. This is particularly true for maps of ski areas. All ski maps in our corpus use a bird’s eye perspective, allowing map readers to see ski trails in the context of their relative elevation and trajectory down the mountain.
Before continuing, it is important to reflect on the large chi-squared value above. This large value, the first of many that will follow, demonstrates in a statistically significant fashion the importance of location-aware cartography. It indicates that the collective wisdom of cartographers is in favor cartographic approaches that vary with the type of location being depicted, an approach not taken by any major online or mobile mapping system. While we also rely on qualitative methods for identifying smaller scale cartographic trends across map categories, the results of our chi-squared tests provide a confirmation that these differences occur at broad scales as well.
With regard to map orientation, each map in our corpus was coded as having a “north-up” orientation or an “other” orientation. North-up maps are those in which the top of the map represents the northernmost extent of the depicted area. Maps with an orientation categorized as “other” displayed any non-north-up orientation.
As was the case with map perspective, a significant difference across map categories could be detected in map orientation choice (χ2(7,N=300) = 54.76, p < .001). Seventy percent of rural park maps and 63% of city maps are oriented in the north-up direction. On the other hand, campus maps, mall maps, tourist site maps and urban park maps all displayed a strong opposite trend. Only 6% of indoor maps are oriented north-up, and the equivalent numbers for tourist site and urban park maps are 22% and 29% respectively.
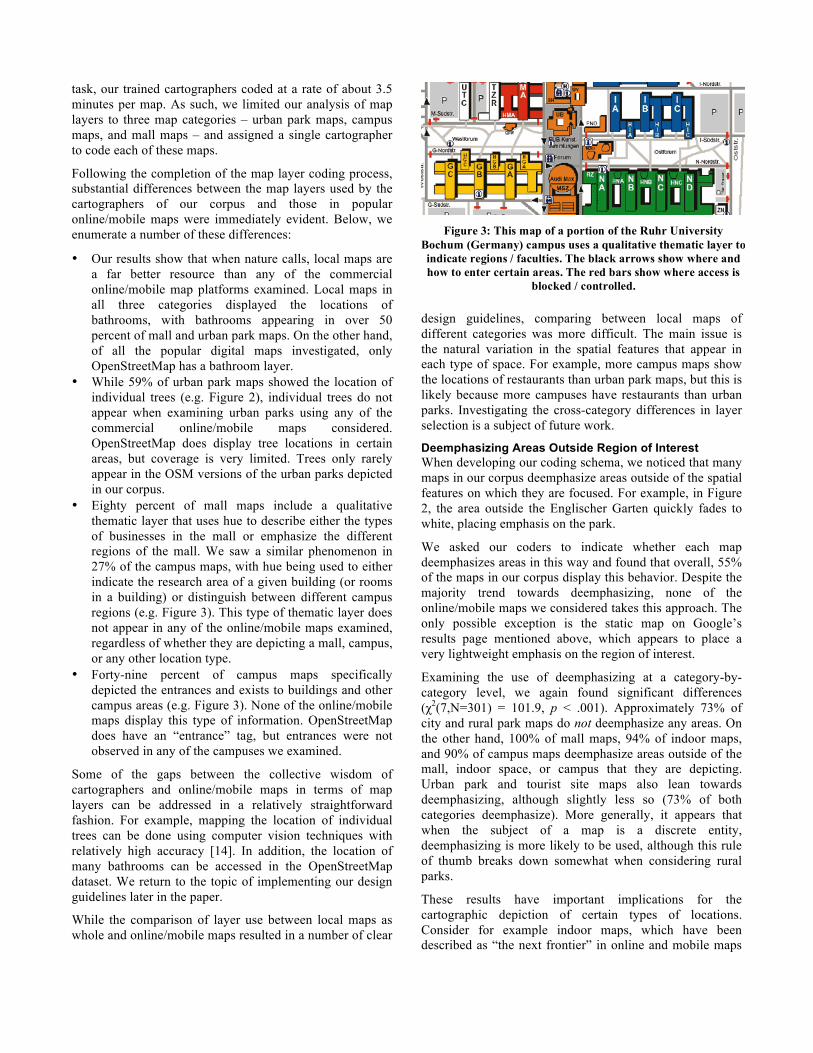
Examining maps with an “other” orientation in detail, we identified a number of cases in which a map is oriented such that a water body or a key feature in the map is aligned in a near-perfectly horizontal or vertical fashion. For example, in the map of Berkeley in Figure 1, the coast of the San Francisco Bay is completely parallel with the top and bottom of the map even though the coast runs roughly north-south. The same is true of the Isar River in Figure 2, which is shown horizontally even though it runs roughly southwest-northeast. We also saw similar phenomena with respect to non-water features such as prominent train lines in transportation maps. Consulting with the photographer of our corpus, we were able to establish that many of these logically-aligned orientations are not the result of the orientation and position of the public map (i.e. a “track-up”
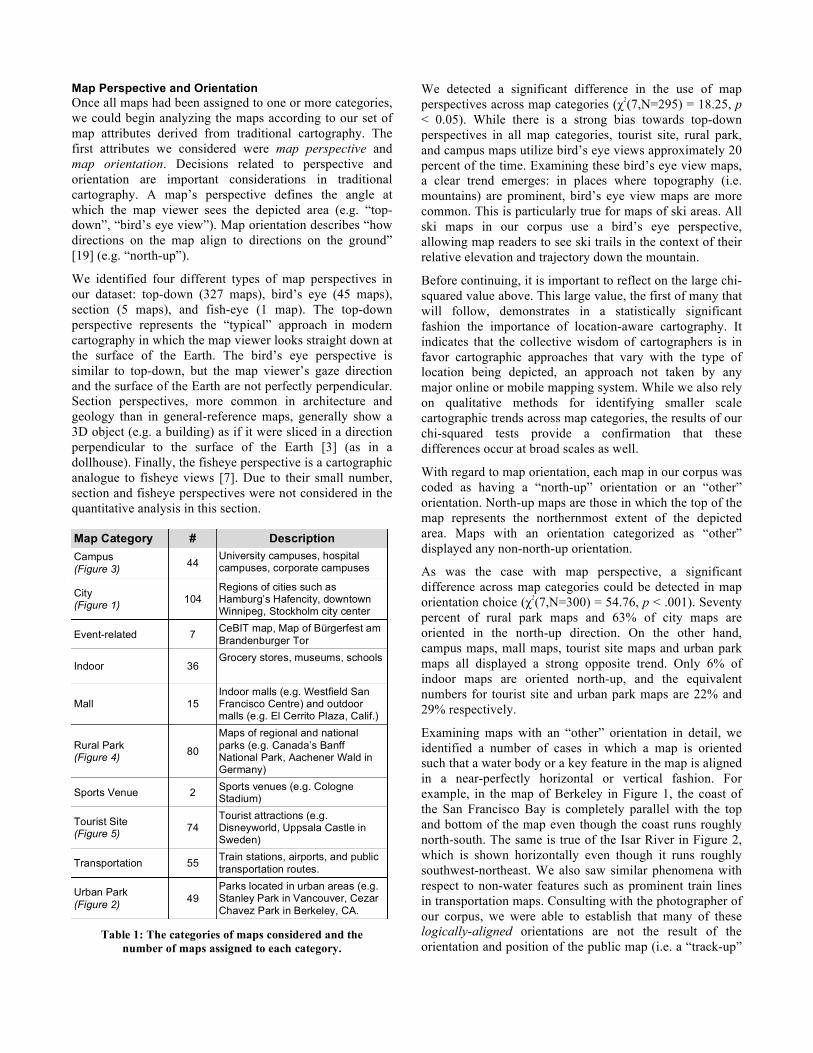
Map Category # Description Campus (Figure 3) 44
University campuses, hospital campuses, corporate campuses
City (Figure 1) 104
Regions of cities such as Hamburg’s Hafencity, downtown Winnipeg, Stockholm city center
Event-related 7 CeBIT map, Map of Bürgerfest am Brandenburger Tor
Indoor 36 Grocery stores, museums, schools
Mall 15 Indoor malls (e.g. Westfield San Francisco Centre) and outdoor malls (e.g. El Cerrito Plaza, Calif.)
Rural Park (Figure 4) 80
Maps of regional and national parks (e.g. Canada’s Banff National Park, Aachener Wald in Germany)
Sports Venue 2 Sports venues (e.g. Cologne Stadium)
Tourist Site (Figure 5) 74
Tourist attractions (e.g. Disneyworld, Uppsala Castle in Sweden)
Transportation 55 Train stations, airports, and public transportation routes.
Urban Park (Figure 2) 49
Parks located in urban areas (e.g. Stanley Park in Vancouver, Cezar Chavez Park in Berkeley, CA.
Table 1: The categories of maps considered and the number of maps assigned to each category.
orientation), but rather a specific mapmaker decision. These decisions are backed by a deep literature on spatial orientation using landmarks (e.g. [10]).
In addition to being our first indication of the importance of location-aware cartography generally, our results in this section have a number of more specific design implications for perspective and orientation use in online and mobile maps, which all take a top-down, north-up approach by default for all types of locations. Although there is precedent for dynamically altering orientation and perspective in online/mobile maps in the transition into/out of Street View (Google) and Streetside (Bing) mode, the costs of frequently altering the perspective and orientation of an online/mobile map are a concern. However, the results in this section can certainly inform the first orientation and perspective that is viewed when a user searches for a location of a specific type. Additionally, the static online map has made something of a comeback thanks to recent changes in Google’s and Bing’s search results pages (SERPs). Queries for place names and other entities with a distinct spatial footprint now result in a static map of the relevant location being displayed prominently on a SERP. The orientation and perspective of this static map can be easily optimized for the location being depicted without the same costs as in dynamic maps.
Base Map We considered three types of base maps in our analysis of
base map use: standard, topographic, and satellite imagery. Standard base maps are those that you might see in an average road atlas and that are used by default in all online and mobile maps considered. Topographic base maps describe the elevation of the underlying terrain, typically using contour lines. Finally, a map that uses satellite imagery as a base map presents all of its information overlaid on top of a satellite image.
Over 85 percent of local maps overall utilize standard base maps, whereas only 5 and 9 percent use topographic maps and satellite imagery, respectively. However, rural park maps differ significantly (χ2(7,N=300) = 81.42, p < .001) from the other categories, with rural park maps using topographic base maps (25% of maps) and imagery base maps (16% of maps) more often. In fact, only a single map in our entire repository that is not a rural park map uses a topographic base map.
These results suggest that the current approach of using standard base maps as the default in online and mobile map systems is in alignment with the maps in our corpus. However, the results also indicate that the option to switch to a satellite base map may be too prominent in certain systems (e.g. web-based Google Maps). On the other hand, while some online maps (e.g. web-based Google Maps) formerly allowed users to easily turn on a topographic base map, this feature seems to have been removed, a choice that does not concord with the 25% of rural park maps in our repository that use a topographic base map.
Put together, our findings related to base maps suggest that mobile and online mapping systems should not only adopt location-aware default cartographic approaches, but may also want to make the available cartographic options equally location-aware. For instance, when viewing a rural park, the ability to switch to a topographic or satellite base map could be made quite prominent, while these options would diminish in prominence or completely disappear when viewing other types of locations. Location-aware cartographic options could apply in other domains too, for instance with respect to the ability to add map layers like Wikipedia articles and photos. In areas where these layers are particularly useful, the option to add them could be made more visible, and vice versa.
Map Layers The set of map layers in a given map describes the data that is displayed on a map. For example, layers displayed in Google Maps include road, rivers, buildings, parks, and so on. Map layers are an extremely important cartographic property of any map and the selection of these layers plays a key role in defining the character of a map.
To identify the similarities and differences between local map categories and between local maps and online/mobile maps with respect to map layers, we developed a detailed coding procedure that involved enumerating the majority of the layers in each map. Due to the complex nature of this
Figure 1: An example of a map in the “City Maps” category.
This map, which is of Berkeley (CA), uses a “logically-aligned” orientation (discussed below), in which the map is rotated such that the coastline is horizontal. This map, like the others in this
paper, have been cropped for space reasons.
Figure 2: An example of a map in the “Urban Parks” category.
This map is also “logically-aligned”.
task, our trained cartographers coded at a rate of about 3.5 minutes per map. As such, we limited our analysis of map layers to three map categories – urban park maps, campus maps, and mall maps – and assigned a single cartographer to code each of these maps.
Following the completion of the map layer coding process, substantial differences between the map layers used by the cartographers of our corpus and those in popular online/mobile maps were immediately evident. Below, we enumerate a number of these differences:
• Our results show that when nature calls, local maps are a far better resource than any of the commercial online/mobile map platforms examined. Local maps in all three categories displayed the locations of bathrooms, with bathrooms appearing in over 50 percent of mall and urban park maps. On the other hand, of all the popular digital maps investigated, only OpenStreetMap has a bathroom layer.
• While 59% of urban park maps showed the location of individual trees (e.g. Figure 2), individual trees do not appear when examining urban parks using any of the commercial online/mobile maps considered. OpenStreetMap does display tree locations in certain areas, but coverage is very limited. Trees only rarely appear in the OSM versions of the urban parks depicted in our corpus.
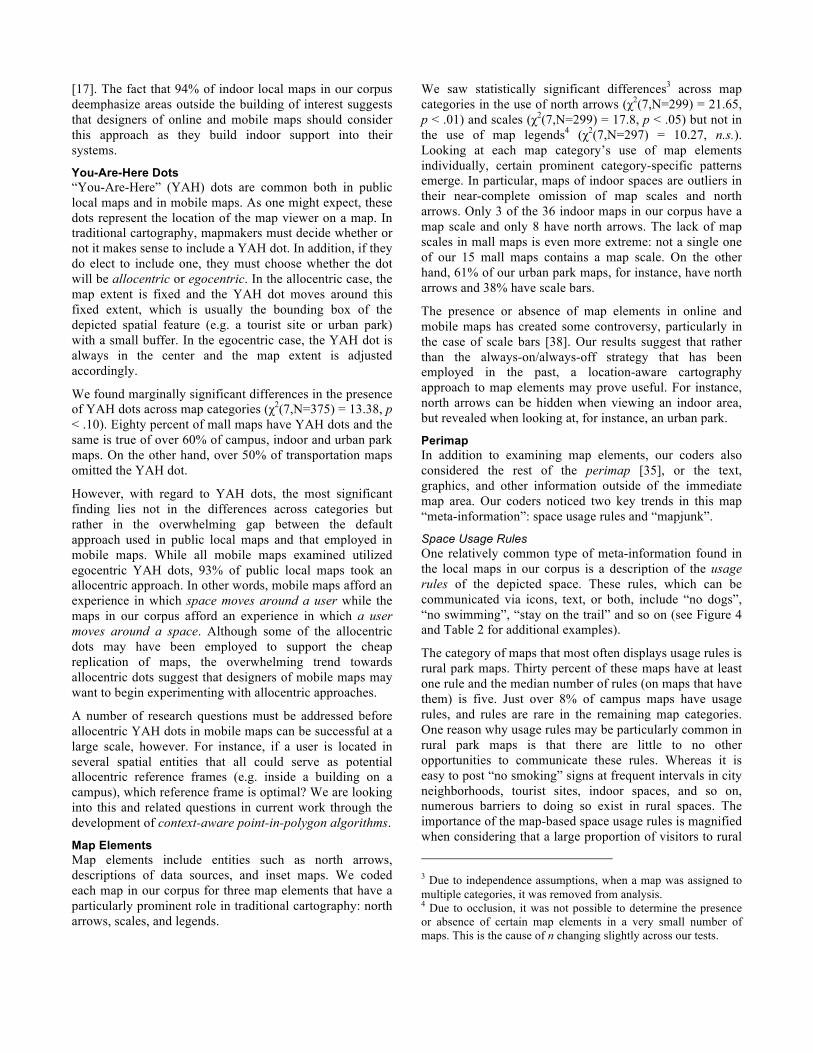
• Eighty percent of mall maps include a qualitative thematic layer that uses hue to describe either the types of businesses in the mall or emphasize the different regions of the mall. We saw a similar phenomenon in 27% of the campus maps, with hue being used to either indicate the research area of a given building (or rooms in a building) or distinguish between different campus regions (e.g. Figure 3). This type of thematic layer does not appear in any of the online/mobile maps examined, regardless of whether they are depicting a mall, campus, or any other location type.
• Forty-nine percent of campus maps specifically depicted the entrances and exists to buildings and other campus areas (e.g. Figure 3). None of the online/mobile maps display this type of information. OpenStreetMap does have an “entrance” tag, but entrances were not observed in any of the campuses we examined.
Some of the gaps between the collective wisdom of cartographers and online/mobile maps in terms of map layers can be addressed in a relatively straightforward fashion. For example, mapping the location of individual trees can be done using computer vision techniques with relatively high accuracy [14]. In addition, the location of many bathrooms can be accessed in the OpenStreetMap dataset. We return to the topic of implementing our design guidelines later in the paper.
While the comparison of layer use between local maps as whole and online/mobile maps resulted in a number of clear
design guidelines, comparing between local maps of different categories was more difficult. The main issue is the natural variation in the spatial features that appear in each type of space. For example, more campus maps show the locations of restaurants than urban park maps, but this is likely because more campuses have restaurants than urban parks. Investigating the cross-category differences in layer selection is a subject of future work.
Deemphasizing Areas Outside Region of Interest When developing our coding schema, we noticed that many maps in our corpus deemphasize areas outside of the spatial features on which they are focused. For example, in Figure 2, the area outside the Englischer Garten quickly fades to white, placing emphasis on the park.
We asked our coders to indicate whether each map deemphasizes areas in this way and found that overall, 55% of the maps in our corpus display this behavior. Despite the majority trend towards deemphasizing, none of the online/mobile maps we considered takes this approach. The only possible exception is the static map on Google’s results page mentioned above, which appears to place a very lightweight emphasis on the region of interest.
Examining the use of deemphasizing at a category-by-category level, we again found significant differences (χ2(7,N=301) = 101.9, p < .001). Approximately 73% of city and rural park maps do not deemphasize any areas. On the other hand, 100% of mall maps, 94% of indoor maps, and 90% of campus maps deemphasize areas outside of the mall, indoor space, or campus that they are depicting. Urban park and tourist site maps also lean towards deemphasizing, although slightly less so (73% of both categories deemphasize). More generally, it appears that when the subject of a map is a discrete entity, deemphasizing is more likely to be used, although this rule of thumb breaks down somewhat when considering rural parks.
These results have important implications for the cartographic depiction of certain types of locations. Consider for example indoor maps, which have been described as “the next frontier” in online and mobile maps
Figure 3: This map of a portion of the Ruhr University
Bochum (Germany) campus uses a qualitative thematic layer to indicate regions / faculties. The black arrows show where and how to enter certain areas. The red bars show where access is
blocked / controlled.
[17]. The fact that 94% of indoor local maps in our corpus deemphasize areas outside the building of interest suggests that designers of online and mobile maps should consider this approach as they build indoor support into their systems.
You-Are-Here Dots “You-Are-Here” (YAH) dots are common both in public local maps and in mobile maps. As one might expect, these dots represent the location of the map viewer on a map. In traditional cartography, mapmakers must decide whether or not it makes sense to include a YAH dot. In addition, if they do elect to include one, they must choose whether the dot will be allocentric or egocentric. In the allocentric case, the map extent is fixed and the YAH dot moves around this fixed extent, which is usually the bounding box of the depicted spatial feature (e.g. a tourist site or urban park) with a small buffer. In the egocentric case, the YAH dot is always in the center and the map extent is adjusted accordingly.
We found marginally significant differences in the presence of YAH dots across map categories (χ2(7,N=375) = 13.38, p < .10). Eighty percent of mall maps have YAH dots and the same is true of over 60% of campus, indoor and urban park maps. On the other hand, over 50% of transportation maps omitted the YAH dot.
However, with regard to YAH dots, the most significant finding lies not in the differences across categories but rather in the overwhelming gap between the default approach used in public local maps and that employed in mobile maps. While all mobile maps examined utilized egocentric YAH dots, 93% of public local maps took an allocentric approach. In other words, mobile maps afford an experience in which space moves around a user while the maps in our corpus afford an experience in which a user moves around a space. Although some of the allocentric dots may have been employed to support the cheap replication of maps, the overwhelming trend towards allocentric dots suggest that designers of mobile maps may want to begin experimenting with allocentric approaches.
A number of research questions must be addressed before allocentric YAH dots in mobile maps can be successful at a large scale, however. For instance, if a user is located in several spatial entities that all could serve as potential allocentric reference frames (e.g. inside a building on a campus), which reference frame is optimal? We are looking into this and related questions in current work through the development of context-aware point-in-polygon algorithms.
Map Elements Map elements include entities such as north arrows, descriptions of data sources, and inset maps. We coded each map in our corpus for three map elements that have a particularly prominent role in traditional cartography: north arrows, scales, and legends.
We saw statistically significant differences3 across map categories in the use of north arrows (χ2(7,N=299) = 21.65, p < .01) and scales (χ2(7,N=299) = 17.8, p < .05) but not in the use of map legends4 (χ2(7,N=297) = 10.27, n.s.). Looking at each map category’s use of map elements individually, certain prominent category-specific patterns emerge. In particular, maps of indoor spaces are outliers in their near-complete omission of map scales and north arrows. Only 3 of the 36 indoor maps in our corpus have a map scale and only 8 have north arrows. The lack of map scales in mall maps is even more extreme: not a single one of our 15 mall maps contains a map scale. On the other hand, 61% of our urban park maps, for instance, have north arrows and 38% have scale bars.
The presence or absence of map elements in online and mobile maps has created some controversy, particularly in the case of scale bars [38]. Our results suggest that rather than the always-on/always-off strategy that has been employed in the past, a location-aware cartography approach to map elements may prove useful. For instance, north arrows can be hidden when viewing an indoor area, but revealed when looking at, for instance, an urban park.
Perimap In addition to examining map elements, our coders also considered the rest of the perimap [35], or the text, graphics, and other information outside of the immediate map area. Our coders noticed two key trends in this map “meta-information”: space usage rules and “mapjunk”.
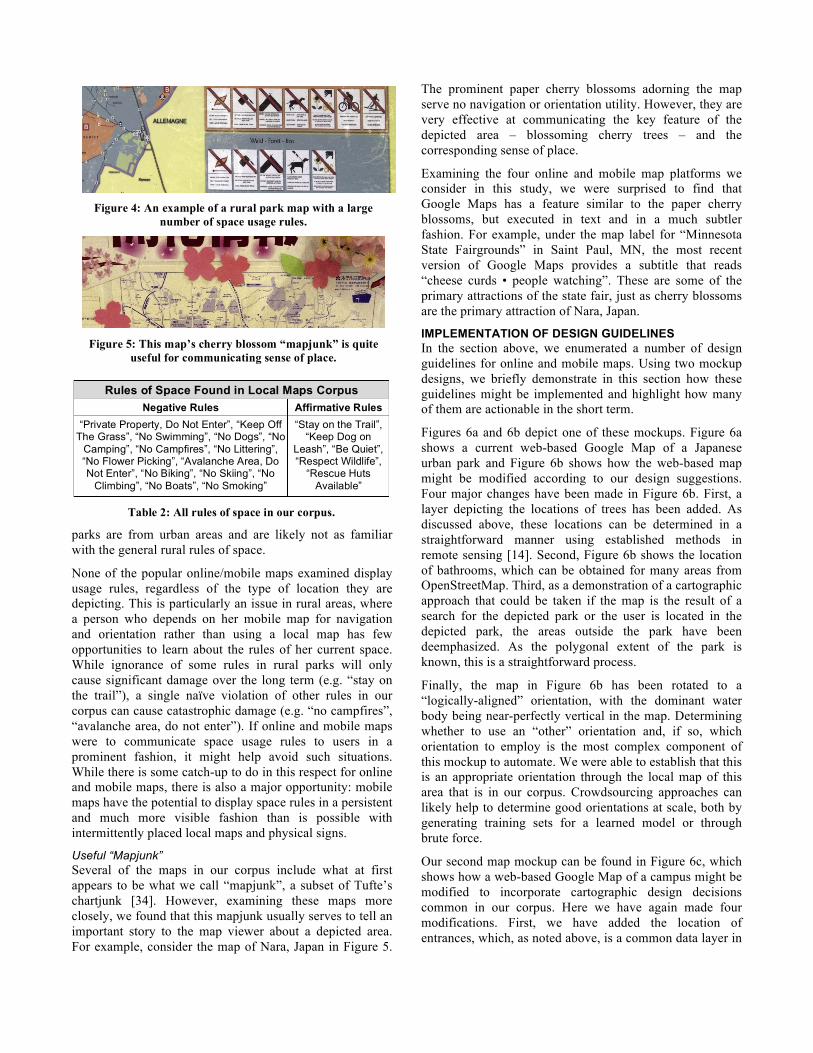
Space Usage Rules One relatively common type of meta-information found in the local maps in our corpus is a description of the usage rules of the depicted space. These rules, which can be communicated via icons, text, or both, include “no dogs”, “no swimming”, “stay on the trail” and so on (see Figure 4 and Table 2 for additional examples).
The category of maps that most often displays usage rules is rural park maps. Thirty percent of these maps have at least one rule and the median number of rules (on maps that have them) is five. Just over 8% of campus maps have usage rules, and rules are rare in the remaining map categories. One reason why usage rules may be particularly common in rural park maps is that there are little to no other opportunities to communicate these rules. Whereas it is easy to post “no smoking” signs at frequent intervals in city neighborhoods, tourist sites, indoor spaces, and so on, numerous barriers to doing so exist in rural spaces. The importance of the map-based space usage rules is magnified when considering that a large proportion of visitors to rural 3 Due to independence assumptions, when a map was assigned to multiple categories, it was removed from analysis. 4 Due to occlusion, it was not possible to determine the presence or absence of certain map elements in a very small number of maps. This is the cause of n changing slightly across our tests.
parks are from urban areas and are likely not as familiar with the general rural rules of space.
None of the popular online/mobile maps examined display usage rules, regardless of the type of location they are depicting. This is particularly an issue in rural areas, where a person who depends on her mobile map for navigation and orientation rather than using a local map has few opportunities to learn about the rules of her current space. While ignorance of some rules in rural parks will only cause significant damage over the long term (e.g. “stay on the trail”), a single naïve violation of other rules in our corpus can cause catastrophic damage (e.g. “no campfires”, “avalanche area, do not enter”). If online and mobile maps were to communicate space usage rules to users in a prominent fashion, it might help avoid such situations. While there is some catch-up to do in this respect for online and mobile maps, there is also a major opportunity: mobile maps have the potential to display space rules in a persistent and much more visible fashion than is possible with intermittently placed local maps and physical signs.
Useful “Mapjunk” Several of the maps in our corpus include what at first appears to be what we call “mapjunk”, a subset of Tufte’s chartjunk [34]. However, examining these maps more closely, we found that this mapjunk usually serves to tell an important story to the map viewer about a depicted area. For example, consider the map of Nara, Japan in Figure 5.
The prominent paper cherry blossoms adorning the map serve no navigation or orientation utility. However, they are very effective at communicating the key feature of the depicted area – blossoming cherry trees – and the corresponding sense of place.
Examining the four online and mobile map platforms we consider in this study, we were surprised to find that Google Maps has a feature similar to the paper cherry blossoms, but executed in text and in a much subtler fashion. For example, under the map label for “Minnesota State Fairgrounds” in Saint Paul, MN, the most recent version of Google Maps provides a subtitle that reads “cheese curds • people watching”. These are some of the primary attractions of the state fair, just as cherry blossoms are the primary attraction of Nara, Japan.
IMPLEMENTATION OF DESIGN GUIDELINES In the section above, we enumerated a number of design guidelines for online and mobile maps. Using two mockup designs, we briefly demonstrate in this section how these guidelines might be implemented and highlight how many of them are actionable in the short term.
Figures 6a and 6b depict one of these mockups. Figure 6a shows a current web-based Google Map of a Japanese urban park and Figure 6b shows how the web-based map might be modified according to our design suggestions. Four major changes have been made in Figure 6b. First, a layer depicting the locations of trees has been added. As discussed above, these locations can be determined in a straightforward manner using established methods in remote sensing [14]. Second, Figure 6b shows the location of bathrooms, which can be obtained for many areas from OpenStreetMap. Third, as a demonstration of a cartographic approach that could be taken if the map is the result of a search for the depicted park or the user is located in the depicted park, the areas outside the park have been deemphasized. As the polygonal extent of the park is known, this is a straightforward process.
Finally, the map in Figure 6b has been rotated to a “logically-aligned” orientation, with the dominant water body being near-perfectly vertical in the map. Determining whether to use an “other” orientation and, if so, which orientation to employ is the most complex component of this mockup to automate. We were able to establish that this is an appropriate orientation through the local map of this area that is in our corpus. Crowdsourcing approaches can likely help to determine good orientations at scale, both by generating training sets for a learned model or through brute force.
Our second map mockup can be found in Figure 6c, which shows how a web-based Google Map of a campus might be modified to incorporate cartographic design decisions common in our corpus. Here we have again made four modifications. First, we have added the location of entrances, which, as noted above, is a common data layer in
Figure 4: An example of a rural park map with a large
number of space usage rules.
Figure 5: This map’s cherry blossom “mapjunk” is quite
useful for communicating sense of place.
Rules of Space Found in Local Maps Corpus Negative Rules Affirmative Rules
“Private Property, Do Not Enter”, “Keep Off The Grass”, “No Swimming”, “No Dogs”, “No
Camping”, “No Campfires”, “No Littering”, “No Flower Picking”, “Avalanche Area, Do Not Enter”, “No Biking”, “No Skiing”, “No
Climbing”, “No Boats”, “No Smoking”
“Stay on the Trail”, “Keep Dog on
Leash”, “Be Quiet”, “Respect Wildlife”,
“Rescue Huts Available”
Table 2: All rules of space in our corpus.
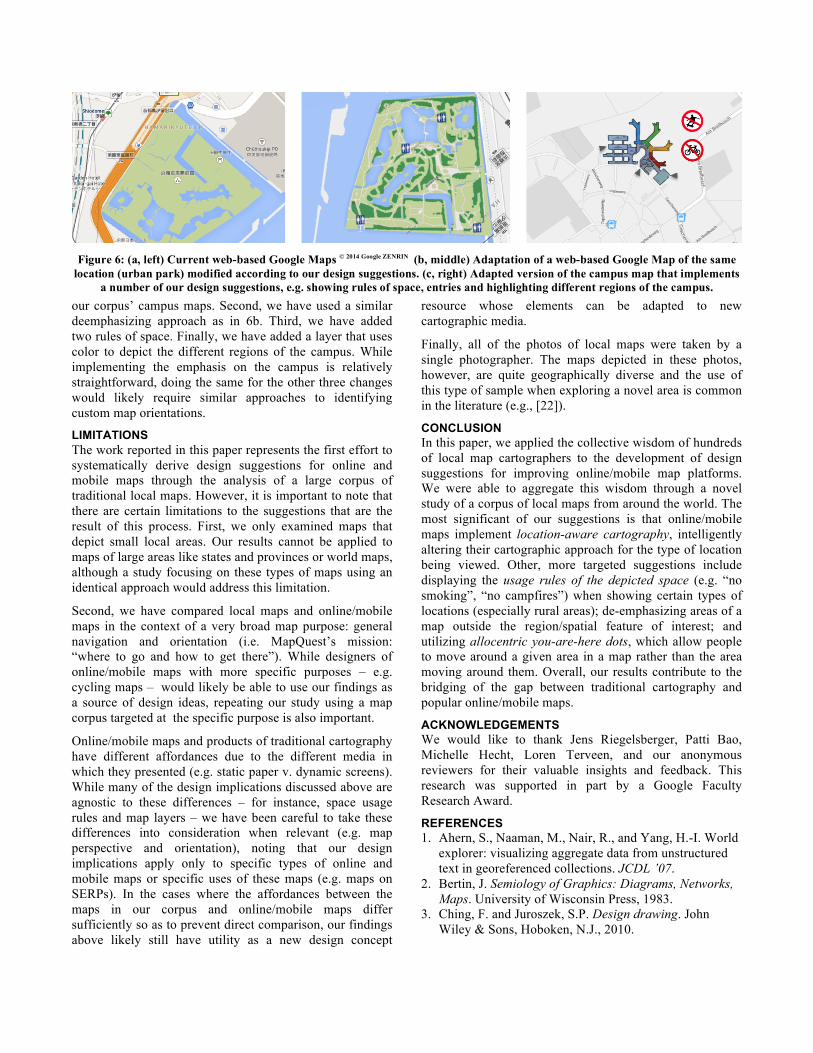
our corpus’ campus maps. Second, we have used a similar deemphasizing approach as in 6b. Third, we have added two rules of space. Finally, we have added a layer that uses color to depict the different regions of the campus. While implementing the emphasis on the campus is relatively straightforward, doing the same for the other three changes would likely require similar approaches to identifying custom map orientations.
LIMITATIONS The work reported in this paper represents the first effort to systematically derive design suggestions for online and mobile maps through the analysis of a large corpus of traditional local maps. However, it is important to note that there are certain limitations to the suggestions that are the result of this process. First, we only examined maps that depict small local areas. Our results cannot be applied to maps of large areas like states and provinces or world maps, although a study focusing on these types of maps using an identical approach would address this limitation.
Second, we have compared local maps and online/mobile maps in the context of a very broad map purpose: general navigation and orientation (i.e. MapQuest’s mission: “where to go and how to get there”). While designers of online/mobile maps with more specific purposes – e.g. cycling maps – would likely be able to use our findings as a source of design ideas, repeating our study using a map corpus targeted at the specific purpose is also important.
Online/mobile maps and products of traditional cartography have different affordances due to the different media in which they presented (e.g. static paper v. dynamic screens). While many of the design implications discussed above are agnostic to these differences – for instance, space usage rules and map layers – we have been careful to take these differences into consideration when relevant (e.g. map perspective and orientation), noting that our design implications apply only to specific types of online and mobile maps or specific uses of these maps (e.g. maps on SERPs). In the cases where the affordances between the maps in our corpus and online/mobile maps differ sufficiently so as to prevent direct comparison, our findings above likely still have utility as a new design concept
resource whose elements can be adapted to new cartographic media.
Finally, all of the photos of local maps were taken by a single photographer. The maps depicted in these photos, however, are quite geographically diverse and the use of this type of sample when exploring a novel area is common in the literature (e.g., [22]).
CONCLUSION In this paper, we applied the collective wisdom of hundreds of local map cartographers to the development of design suggestions for improving online/mobile map platforms. We were able to aggregate this wisdom through a novel study of a corpus of local maps from around the world. The most significant of our suggestions is that online/mobile maps implement location-aware cartography, intelligently altering their cartographic approach for the type of location being viewed. Other, more targeted suggestions include displaying the usage rules of the depicted space (e.g. “no smoking”, “no campfires”) when showing certain types of locations (especially rural areas); de-emphasizing areas of a map outside the region/spatial feature of interest; and utilizing allocentric you-are-here dots, which allow people to move around a given area in a map rather than the area moving around them. Overall, our results contribute to the bridging of the gap between traditional cartography and popular online/mobile maps.
ACKNOWLEDGEMENTS We would like to thank Jens Riegelsberger, Patti Bao, Michelle Hecht, Loren Terveen, and our anonymous reviewers for their valuable insights and feedback. This research was supported in part by a Google Faculty Research Award.
REFERENCES 1. Ahern, S., Naaman, M., Nair, R., and Yang, H.-I. World
explorer: visualizing aggregate data from unstructured text in georeferenced collections. JCDL ’07.
2. Bertin, J. Semiology of Graphics: Diagrams, Networks, Maps. University of Wisconsin Press, 1983.
3. Ching, F. and Juroszek, S.P. Design drawing. John Wiley & Sons, Hoboken, N.J., 2010.
Figure 6: (a, left) Current web-based Google Maps © 2014 Google ZENRIN (b, middle) Adaptation of a web-based Google Map of the same
location (urban park) modified according to our design suggestions. (c, right) Adapted version of the campus map that implements a number of our design suggestions, e.g. showing rules of space, entries and highlighting different regions of the campus.
4. Cook, T. A letter from Tim Cook on maps. 2012. http://www.apple.com/ letter-from-tim-cook-on-maps/.
5. Crampton, J.W. Mapping: A Critical Introduction to Cartography and GIS. John Wiley & Sons, 2009.
6. Dodge, M., Kitchin, R., and Perkins, C. Introduction to The Map Reader. In The Map Reader: Theories of Mapping Practice and Cartographic Representation. Wiley, 2011.
7. Furnas, G.W. Generalized fisheye views. CHI ’86. 8. GlobalWebIndex. Top global smartphone apps, who’s in
the top 10. GlobalWebIndex Blog, 2013. www.globalwebindex.net/Top-global-smartphone-apps.
9. Graham, M. and Zook, M. Augmented realities and uneven geographies: exploring the geolinguistic contours of the web. Environment and Planning A 45, 1 (2013), 77 – 99.
10. Haugen, E. The Semantics of Icelandic Orientation. Word XIII, (1957), 447–59.
11. Hecht, B., Hofmann, P., Lee, M., and Simpson, M. The Extinction of Cartography? Mapping for Today’s Audience. NACIS ’11.
12. Hecht, B., Schöning, J., Capra, L., Mashhadi, A., Terveen, L., and Kwan, M.-P. 2013 Workshop on Geographic Human-Computer Interaction. CHI ’13 EA.
13. Hecht, B., Schöning, J., Erickson, T., and Priedhorsky, R. Geographic human-computer interaction. CHI ’11 EA.
14. Hirschmugl, M., Ofner, M., Raggam, J., and Schardt, M. Single tree detection in very high resolution remote sensing data. Remote Sensing of Environment 110, 4 (2007), 533–544.
15. Hobson, M. Google Maps announces a 400 year advantage over Apple Maps. Exploring Local: Mike Dobson of TeleMapics on Local Search and All Things Geospatial, 2012. http://blog.telemapics.com/?p=399.
16. Hullman, J., Diakopoulos, N., and Adar, E. Contextifier: automatic generation of annotated stock visualizations. CHI ’13.
17. Kadous, W. and Peterson, S. Google I/O 2013: The Next Frontier: Indoor Maps. https://developers.google.com/ events/io/sessions/328283671.
18. Kaufmann, B. and Ahlström, D. Studying spatial memory and map navigation performance on projector phones with peephole interaction. CHI ’13.
19. Kimerling, A.J. Map use: reading, analysis, interpretation. Esri Press, Redlands, Calif., 2012.
20. Ludwig, M., Priedhorsky, R., and Terveen, L. Path selection: a novel interaction technique for mapping applications. CHI ‘09.
21. MacEachren, A.M. How Maps Work: Representation, Visualization, and Design. Guilford Press, 2004.
22. Morris, M.R., Teevan, J., and Panovich, K. What do people ask their social networks, and why?: a survey study of status message Q&A behavior. CHI ’10.
23. Morrison, A., Oulasvirta, A., Peltonen, P., et al. Like bees around the hive: a comparative study of a mobile augmented reality map. CHI ‘09.
24. Riegelsberger, J., Hecht, B., Simpson, M., and Lee, M. The Extinction of Cartography? Citizen cartographers: Tools, Challenges, Opportunities. AAG ’12.
25. Robinson, A.H. The look of maps: an examination of cartographic design. ESRI Press, 2010.
26. Roth, R.E., Finch, B.G., Blanford, J.I., Klippel, A., Robinson, A.C., and MacEachren, A.M. Card Sorting For Cartographic Research and Practice. CAGIS 38, 2 (2011), 89–99.
27. Schadler, T. Why Apple Had To Do Maps: A Mobile Engagement Analysis. Forrestor Research: Ted Schadler’s Blog, 2012. http://blogs.forrester.com/ ted_schadler/12-09-21-why_apple_had_to_do_maps_a_ mobile_engagement_analysis.
28. Schöning, J., Cheverst, K., Löchtefeld, M., Krüger, A., Rohs, M., and Taher, F. PhotoMap: Using Spontaneously taken Images of Public Maps for Pedestrian Navigation Tasks on Mobile Devices. Mobile HCI ’09.
29. Schöning, J., Hecht, B., Raubal, M., Krüger, A., Marsh, M., and Rohs, M. Improving Interaction with Virtual Globes through Spatial Thinking: Helping Users Ask “Why?” IUI ’08.
30. Slocum, T.A., Blok, C., Jiang, B., et al. Cognitive and Usability Issues in Geovisualization. CAGIS 28, 1 (2001), 61–75.
31. Slocum, T.A., McMaster, R.B., Kessler, F.C., and Howard, H.H. Thematic Cartography and Geovisualization. Prentice Hall.
32. Stephens, M. Gender and the GeoWeb: divisions in the production of user-generated cartographic information. GeoJournal, August 2013, 1–16.
33. Swobodzinski, M. and Raubal, M. An Indoor Routing Algorithm for the Blind: Development and Comparison to a Routing Algorithm for the Sighted. IJGIS 23, 10 (2009), 1315–1343.
34. Tufte, E.R. The visual display of quantitative information. Graphics Press, Cheshire, Conn, 1999.
35. Wood, D. and Fels, J. The Natures of Maps: Cartographic Constructions of the Natural World. Cartographica 43, 3 (2008), 189–202.
36. Woodruff, A. The Aesthetician and the Cartographer. Axis Maps Blog, 2012. http://www.axismaps.com/ blog/2012/10/the-aesthetician-and-the-cartographer/.
37. Zhao, J., Wigdor, D., and Balakrishnan, R. TrailMap: facilitating information seeking in a multi-scale digital map via implicit bookmarking. CHI ‘13.
38.Martonik, A. Google Maps update brings back the scale bar. Android Central, 2013. http://www.androidcentral.com/google-maps-update-brings-back-scale-bar