infosys limited and subsidiaries · 2020-01-06 · infosys limited and subsidiaries (dollars in...
TRANSCRIPT
Page No
Condensed Consolidated Balance Sheet ……………………………………………………………………………………………..1
Condensed Consolidated Statements of Comprehensive Income…………………………………………………..……………..2
Condensed Consolidated Statements of Changes in Equity………………………………………………………..……………..3
Condensed Consolidated Statements of Cash Flows………………………………………………………………………………..5
Overview and notes to the financial statements
1. Overview
1.1 Company Overview………………………………………………………………………………………………………………..6
1.2 Basis of preparation of financial statements………………………………………………………………………………..6
1.3 Basis of consolidation………………………..…………………………………………………………………………………..6
1.4 Use of estimates and judgments………………………………………………………………………………………………..6
1.5 Critical accounting estimates and judgements……………………………………………………………………………………………………..6
1.6 Recent Accounting pronouncements…………………………………………………………………………………………..7
2. Notes to the Condensed Consolidated Financial Statements
2.1 Cash and cash equivalents ………………………………………………………………………………………………………..8
2.2 Investments ………………………………………………………………………………………………………..……………..8
2.3 Financial instruments …………………………………………………………………………………………………………..10
2.4 Prepayments and other assets……………………………………………………………………………………..……………..14
2.5 Other liabilities………………………………………………………………………………………………….……………..15
2.6 Provisions …………………………………………………………………………………………………………..……………..16
2.7 Property, plant and equipment………………………………………………………………………………….……………..17
2.8 Leases ………………………………………………………………………………………………………….19
2.9 Goodwill…………………………………………………………………………………………………………….…………………………………22
2.10 Business combination………………………….…………………………………………………..……………..23
2.11 Employees' Stock Option Plans (ESOP) ……………………………………………………………………….……………..25
2.12 Income taxes…………………………………………………………………………………………………………………..26
2.13 Reconciliation of basic and diluted shares used in computing earnings per share………………………………………..27
2.14 Related party transactions ……………………………………………………………………………………………………..28
2.15 Segment Reporting………………………………………………………………………………………………………………..28
2.16 Revenue from Operations……………………………………………………………………………………………………..30
2.17 Unbilled revenue……………………………………………………………………………………………………..32
2.18 Break-up of expenses and other income, net…………………………………………………………………………………..33
2.19 Equity………………………………………………………………………………………………………..34
INFOSYS LIMITED AND SUBSIDIARIES
Condensed Consolidated Financial Statements under
International Financial Reporting Standards (IFRS) in US
Dollars for three months and six months ended
September 30, 2019
Index
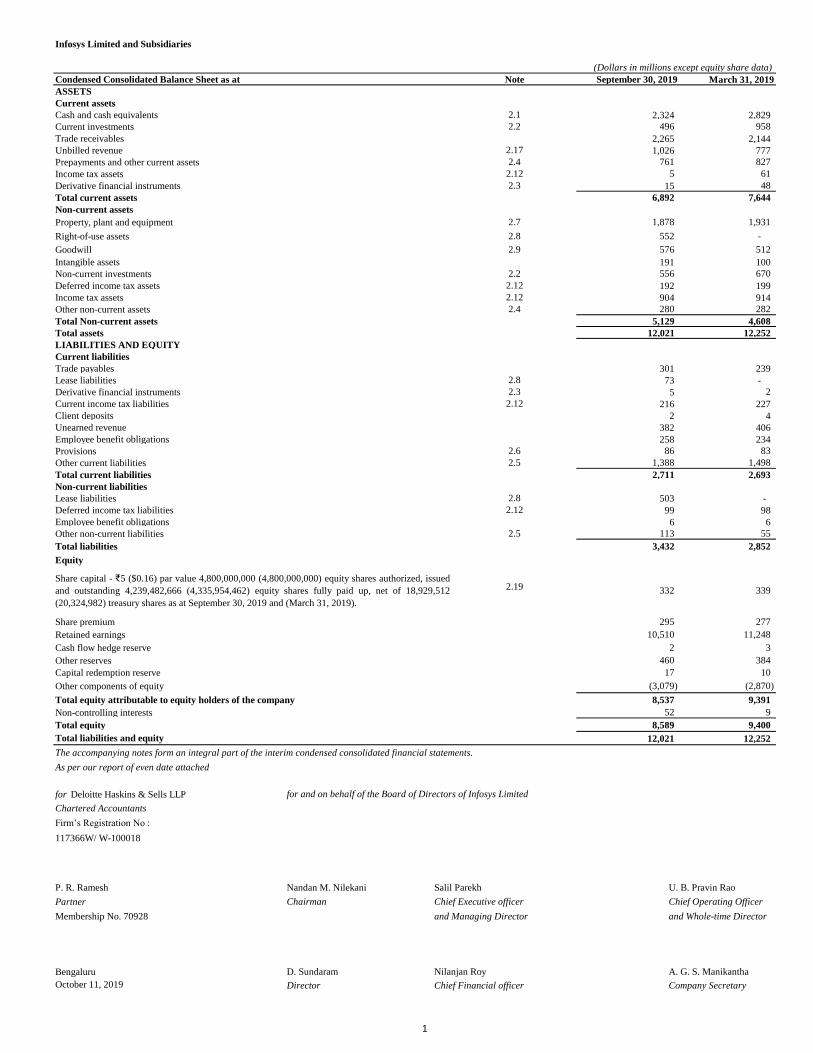
Infosys Limited and Subsidiaries
(Dollars in millions except equity share data)
Condensed Consolidated Balance Sheet as at Note September 30, 2019 March 31, 2019
ASSETS
Current assets
Cash and cash equivalents 2.1 2,324 2,829
Current investments 2.2 496 958
Trade receivables 2,265 2,144
Unbilled revenue 2.17 1,026 777
Prepayments and other current assets 2.4 761 827
Income tax assets 2.12 5 61
Derivative financial instruments 2.3 15 48
Total current assets 6,892 7,644
Non-current assets
Property, plant and equipment 2.7 1,878 1,931
Right-of-use assets 2.8 552 -
Goodwill 2.9 576 512
Intangible assets 191 100
Non-current investments 2.2 556 670
Deferred income tax assets 2.12 192 199
Income tax assets 2.12 904 914
Other non-current assets 2.4 280 282
Total Non-current assets 5,129 4,608
Total assets 12,021 12,252
LIABILITIES AND EQUITY
Current liabilities
Trade payables 301 239
Lease liabilities 2.8 73 -
Derivative financial instruments 2.3 5 2
Current income tax liabilities 2.12 216 227
Client deposits 2 4
Unearned revenue 382 406
Employee benefit obligations 258 234
Provisions 2.6 86 83
Other current liabilities 2.5 1,388 1,498
Total current liabilities 2,711 2,693
Non-current liabilities
Lease liabilities 2.8 503 -
Deferred income tax liabilities 2.12 99 98
Employee benefit obligations 6 6
Other non-current liabilities 2.5 113 55
Total liabilities 3,432 2,852
Equity
2.19
Share premium 295 277
Retained earnings 10,510 11,248
Cash flow hedge reserve 2 3
Other reserves 460 384
Capital redemption reserve 17 10
Other components of equity (3,079) (2,870)
Total equity attributable to equity holders of the company 8,537 9,391
Non-controlling interests 52 9
Total equity 8,589 9,400
Total liabilities and equity 12,021 12,252
The accompanying notes form an integral part of the interim condensed consolidated financial statements.
As per our report of even date attached
for Deloitte Haskins & Sells LLP for and on behalf of the Board of Directors of Infosys Limited
Chartered Accountants
Firm’s Registration No :
117366W/ W-100018
P. R. Ramesh Nandan M. Nilekani Salil Parekh U. B. Pravin Rao
Partner Chairman Chief Executive officer Chief Operating Officer
Membership No. 70928 and Managing Director and Whole-time Director
Bengaluru D. Sundaram Nilanjan Roy A. G. S. Manikantha
October 11, 2019 Director Chief Financial officer Company Secretary
Share capital - ₹5 ($0.16) par value 4,800,000,000 (4,800,000,000) equity shares authorized, issued
and outstanding 4,239,482,666 (4,335,954,462) equity shares fully paid up, net of 18,929,512
(20,324,982) treasury shares as at September 30, 2019 and (March 31, 2019).
332 339
1
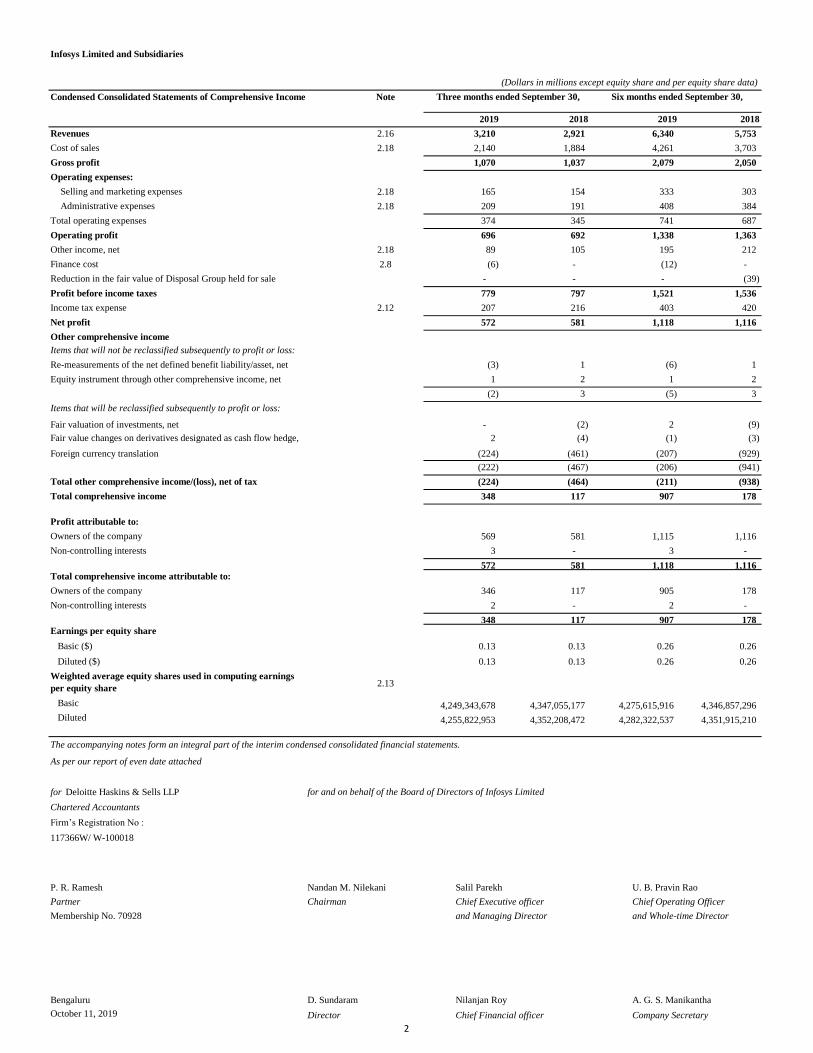
Infosys Limited and Subsidiaries
(Dollars in millions except equity share and per equity share data)
Condensed Consolidated Statements of Comprehensive Income Note
2019 2018 2019 2018
Revenues 2.16 3,210 2,921 6,340 5,753
Cost of sales 2.18 2,140 1,884 4,261 3,703
Gross profit 1,070 1,037 2,079 2,050
Operating expenses:
Selling and marketing expenses 2.18 165 154 333 303
Administrative expenses 2.18 209 191 408 384
Total operating expenses 374 345 741 687
Operating profit 696 692 1,338 1,363
Other income, net 2.18 89 105 195 212
Finance cost 2.8 (6) - (12) -
Reduction in the fair value of Disposal Group held for sale - - - (39)
Profit before income taxes 779 797 1,521 1,536
Income tax expense 2.12 207 216 403 420
Net profit 572 581 1,118 1,116
Other comprehensive income
Items that will not be reclassified subsequently to profit or loss:
Re-measurements of the net defined benefit liability/asset, net (3) 1 (6) 1
Equity instrument through other comprehensive income, net 1 2 1 2
(2) 3 (5) 3
Items that will be reclassified subsequently to profit or loss:
Fair valuation of investments, net - (2) 2 (9)
Fair value changes on derivatives designated as cash flow hedge,
net
2 (4) (1) (3)
Foreign currency translation (224) (461) (207) (929)
(222) (467) (206) (941)
Total other comprehensive income/(loss), net of tax (224) (464) (211) (938)
Total comprehensive income 348 117 907 178
Profit attributable to:
Owners of the company 569 581 1,115 1,116
Non-controlling interests 3 - 3 -
572 581 1,118 1,116
Total comprehensive income attributable to:
Owners of the company 346 117 905 178
Non-controlling interests 2 - 2 -
348 117 907 178
Earnings per equity share
Basic ($) 0.13 0.13 0.26 0.26
Diluted ($) 0.13 0.13 0.26 0.26
Weighted average equity shares used in computing earnings
per equity share2.13
Basic 4,249,343,678 4,347,055,177 4,275,615,916 4,346,857,296
Diluted 4,255,822,953 4,352,208,472 4,282,322,537 4,351,915,210
The accompanying notes form an integral part of the interim condensed consolidated financial statements.
As per our report of even date attached
for Deloitte Haskins & Sells LLP for and on behalf of the Board of Directors of Infosys Limited
Chartered Accountants
Firm’s Registration No :
117366W/ W-100018
P. R. Ramesh Nandan M. Nilekani Salil Parekh U. B. Pravin Rao
Partner Chairman Chief Executive officer Chief Operating Officer
Membership No. 70928 and Managing Director and Whole-time Director
Bengaluru D. Sundaram Nilanjan Roy A. G. S. Manikantha
October 11, 2019 Director Chief Financial officer Company Secretary
Six months ended September 30, Three months ended September 30,
2
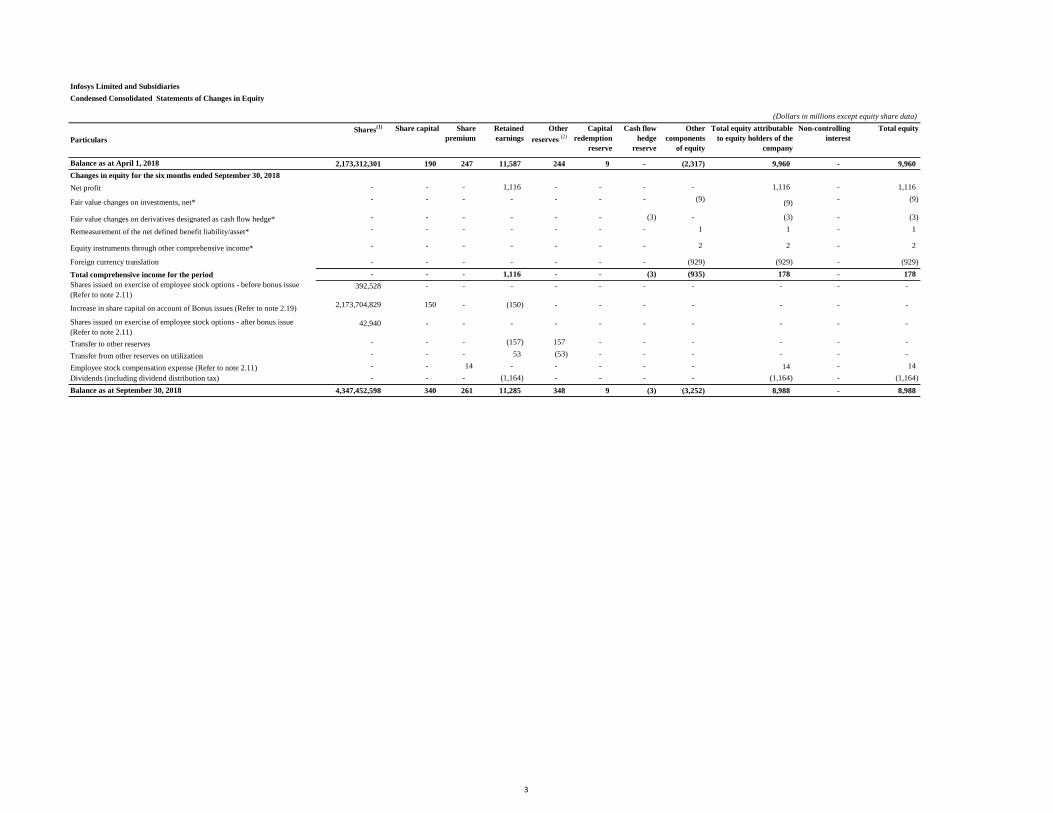
Infosys Limited and Subsidiaries
Condensed Consolidated Statements of Changes in Equity
Shares(1) Share capital Share
premium
Retained
earnings
Other
reserves (2)
Capital
redemption
reserve
Cash flow
hedge
reserve
Other
components
of equity
Total equity attributable
to equity holders of the
company
Non-controlling
interest
Total equity
2,173,312,301 190 247 11,587 244 9 - (2,317) 9,960 - 9,960
Net profit - - - 1,116 - - - - 1,116 - 1,116
- - - - - - - (9) (9)
- (9)
- - - - - - (3) - (3) - (3)
- - - - - - - 1 1 - 1
- - - - - - - 2 2 - 2
- - - - - - - (929) (929) - (929)
Total comprehensive income for the period - - - 1,116 - - (3) (935) 178 - 178
392,528 - - - - - - - - - -
2,173,704,829 150 - (150) - - - - - - -
42,940 - - - - - - - - - -
Transfer to other reserves - - - (157) 157 - - - - - -
Transfer from other reserves on utilization - - - 53 (53) - - - - - -
Employee stock compensation expense (Refer to note 2.11) - - 14 - - - - - 14 - 14
- - - (1,164) - - - - (1,164) - (1,164)
4,347,452,598 340 261 11,285 348 9 (3) (3,252) 8,988 - 8,988
Changes in equity for the six months ended September 30, 2018
Remeasurement of the net defined benefit liability/asset*
Dividends (including dividend distribution tax)
Balance as at April 1, 2018
Fair value changes on investments, net*
Fair value changes on derivatives designated as cash flow hedge*
Shares issued on exercise of employee stock options - before bonus issue
(Refer to note 2.11)
Foreign currency translation
(Dollars in millions except equity share data)
Particulars
Equity instruments through other comprehensive income*
Increase in share capital on account of Bonus issues (Refer to note 2.19)
Shares issued on exercise of employee stock options - after bonus issue
(Refer to note 2.11)
Balance as at September 30, 2018
3
Shares(1) Share capital Share
premium
Retained
earnings
Other
reserves (2)
Capital
redemption
reserve
Cash flow
hedge
reserve
Other
components
of equity
Total equity attributable
to equity holders of the
company
Non-controlling
interest
Total equity
(Dollars in millions except equity share data)
Particulars
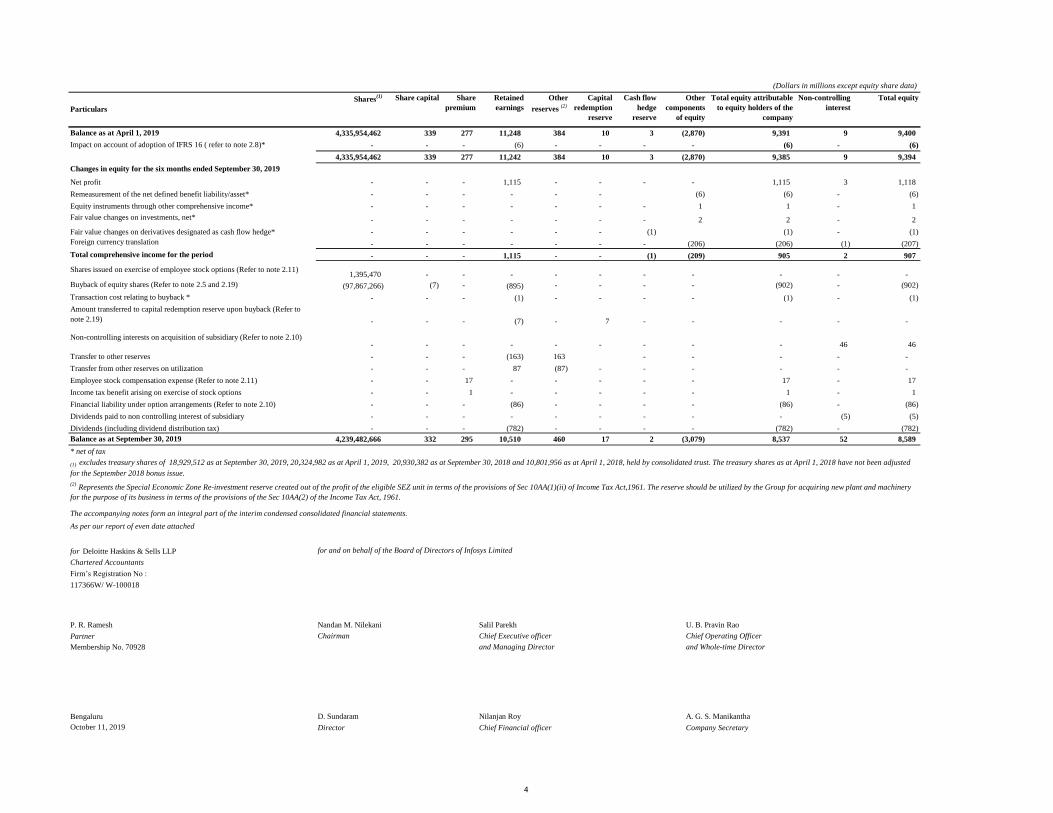
4,335,954,462 339 277 11,248 384 10 3 (2,870) 9,391 9 9,400
- - - (6) - - - - (6) - (6)
4,335,954,462 339 277 11,242 384 10 3 (2,870) 9,385 9 9,394
Net profit - - - 1,115 - - - - 1,115 3 1,118
- - - - - - (6) (6) - (6)
- - - - - - - 1 1 - 1
- - - - - - - 2 2 - 2
- - - - - - (1) (1) - (1)
- - - - - - - (206) (206) (1) (207)
Total comprehensive income for the period - - - 1,115 - - (1) (209) 905 2 907
1,395,470 - - - - - - - - - -
(97,867,266) (7) - (895) - - - - (902) - (902)
Transaction cost relating to buyback * - - - (1) - - - - (1) - (1)
- - - (7) - 7 - - - - -
- - - - - - - - - 46 46
Transfer to other reserves - - - (163) 163 - - - - -
Transfer from other reserves on utilization - - - 87 (87) - - - - - -
Employee stock compensation expense (Refer to note 2.11) - - 17 - - - - - 17 - 17
Income tax benefit arising on exercise of stock options - - 1 - - - - - 1 - 1
Financial liability under option arrangements (Refer to note 2.10) - - - (86) - - - - (86) - (86)
Dividends paid to non controlling interest of subsidiary - - - - - - - - - (5) (5)
- - - (782) - - - - (782) - (782)
4,239,482,666 332 295 10,510 460 17 2 (3,079) 8,537 52 8,589
* net of tax
As per our report of even date attached
for Deloitte Haskins & Sells LLP
Chartered Accountants
Firm’s Registration No :
117366W/ W-100018
P. R. Ramesh Nandan M. Nilekani Salil Parekh U. B. Pravin Rao
Partner Chairman Chief Executive officer Chief Operating Officer
Membership No. 70928 and Managing Director and Whole-time Director
Bengaluru D. Sundaram Nilanjan Roy A. G. S. Manikantha
October 11, 2019 Director Chief Financial officer Company Secretary
for and on behalf of the Board of Directors of Infosys Limited
(1) excludes treasury shares of 18,929,512 as at September 30, 2019, 20,324,982 as at April 1, 2019, 20,930,382 as at September 30, 2018 and 10,801,956 as at April 1, 2018, held by consolidated trust. The treasury shares as at April 1, 2018 have not been adjusted
for the September 2018 bonus issue.
Amount transferred to capital redemption reserve upon buyback (Refer to
note 2.19)
(2) Represents the Special Economic Zone Re-investment reserve created out of the profit of the eligible SEZ unit in terms of the provisions of Sec 10AA(1)(ii) of Income Tax Act,1961. The reserve should be utilized by the Group for acquiring new plant and machinery
for the purpose of its business in terms of the provisions of the Sec 10AA(2) of the Income Tax Act, 1961.
Balance as at September 30, 2019
Remeasurement of the net defined benefit liability/asset*
The accompanying notes form an integral part of the interim condensed consolidated financial statements.
Changes in equity for the six months ended September 30, 2019
Dividends (including dividend distribution tax)
Foreign currency translation
Shares issued on exercise of employee stock options (Refer to note 2.11)
Fair value changes on derivatives designated as cash flow hedge*
Equity instruments through other comprehensive income*
Fair value changes on investments, net*
Non-controlling interests on acquisition of subsidiary (Refer to note 2.10)
Buyback of equity shares (Refer to note 2.5 and 2.19)
Balance as at April 1, 2019
Impact on account of adoption of IFRS 16 ( refer to note 2.8)*
4
Infosys Limited and Subsidiaries
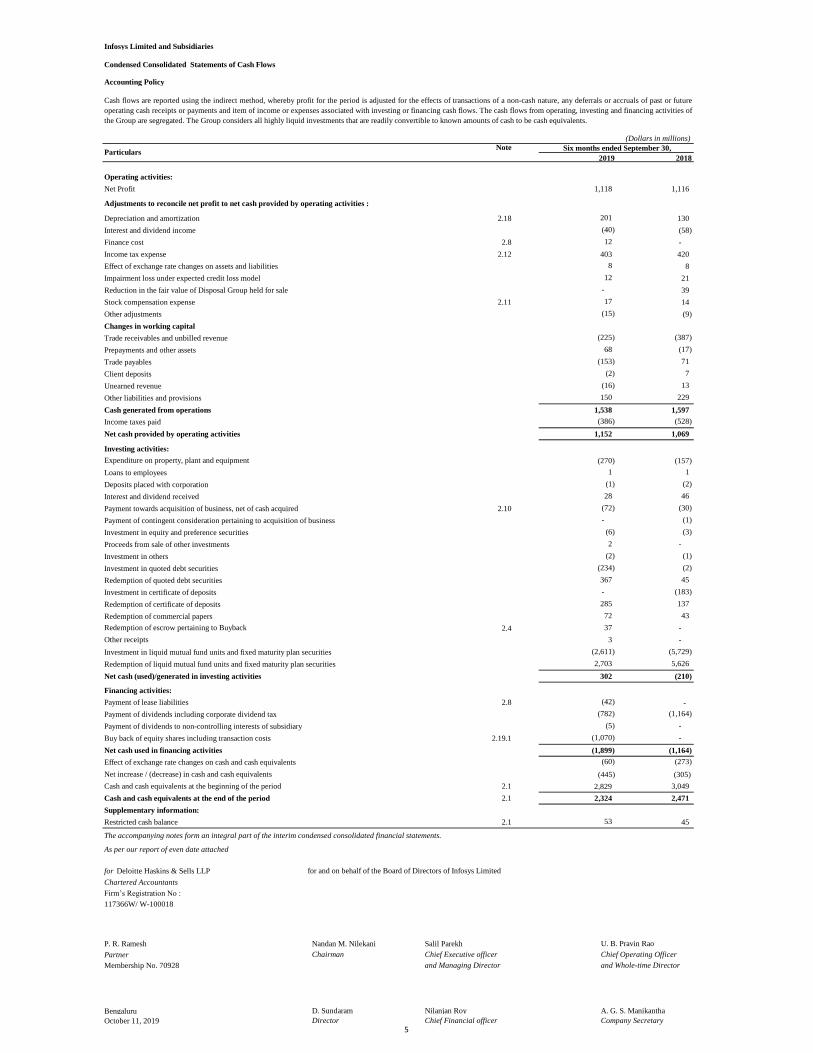
Condensed Consolidated Statements of Cash Flows
Accounting Policy
(Dollars in millions)
Note
2019 2018
Operating activities:
Net Profit 1,118 1,116
Depreciation and amortization 2.18 201 130
Interest and dividend income (40) (58)
Finance cost 2.8 12 -
Income tax expense 2.12 403 420
Effect of exchange rate changes on assets and liabilities 8 8
Impairment loss under expected credit loss model 12 21
Reduction in the fair value of Disposal Group held for sale - 39
Stock compensation expense 2.11 17 14
Other adjustments (15) (9)
Changes in working capital
Trade receivables and unbilled revenue (225) (387)
Prepayments and other assets 68 (17)
Trade payables (153) 71
Client deposits (2) 7
Unearned revenue (16) 13
Other liabilities and provisions 150 229
Cash generated from operations 1,538 1,597
Income taxes paid (386) (528)
Net cash provided by operating activities 1,152 1,069
Investing activities:
(270) (157)
Loans to employees 1 1
Deposits placed with corporation (1) (2)
Interest and dividend received 28 46
Payment towards acquisition of business, net of cash acquired 2.10 (72) (30)
Payment of contingent consideration pertaining to acquisition of business - (1)
Investment in equity and preference securities (6) (3)
Proceeds from sale of other investments 2 -
Investment in others (2) (1)
Investment in quoted debt securities (234) (2)
Redemption of quoted debt securities 367 45
Investment in certificate of deposits - (183)
Redemption of certificate of deposits 285 137
Redemption of commercial papers 72 43
Redemption of escrow pertaining to Buyback 2.4 37 -
Other receipts 3 -
Investment in liquid mutual fund units and fixed maturity plan securities (2,611) (5,729)
Redemption of liquid mutual fund units and fixed maturity plan securities 2,703 5,626
Net cash (used)/generated in investing activities 302 (210)
Financing activities:
Payment of lease liabilities 2.8 (42) -
Payment of dividends including corporate dividend tax (782) (1,164)
Payment of dividends to non-controlling interests of subsidiary (5) -
Buy back of equity shares including transaction costs 2.19.1 (1,070) -
Net cash used in financing activities (1,899) (1,164)
Effect of exchange rate changes on cash and cash equivalents (60) (273)
Net increase / (decrease) in cash and cash equivalents (445) (305)
Cash and cash equivalents at the beginning of the period 2.1 2,829 3,049
Cash and cash equivalents at the end of the period 2.1 2,324 2,471
Supplementary information:
Restricted cash balance 2.1 53 45
The accompanying notes form an integral part of the interim condensed consolidated financial statements.
As per our report of even date attached
for Deloitte Haskins & Sells LLP for and on behalf of the Board of Directors of Infosys Limited
Chartered Accountants
Firm’s Registration No :
117366W/ W-100018
P. R. Ramesh Nandan M. Nilekani Salil Parekh U. B. Pravin Rao
Partner Chairman Chief Executive officer Chief Operating Officer
Membership No. 70928 and Managing Director and Whole-time Director
Bengaluru D. Sundaram Nilanjan Roy A. G. S. Manikantha
October 11, 2019 Director Chief Financial officer Company Secretary
Cash flows are reported using the indirect method, whereby profit for the period is adjusted for the effects of transactions of a non-cash nature, any deferrals or accruals of past or future
operating cash receipts or payments and item of income or expenses associated with investing or financing cash flows. The cash flows from operating, investing and financing activities of
the Group are segregated. The Group considers all highly liquid investments that are readily convertible to known amounts of cash to be cash equivalents.
Particulars Six months ended September 30,
Adjustments to reconcile net profit to net cash provided by operating activities :
Expenditure on property, plant and equipment
5
Notes to the interim condensed consolidated financial statements
1. Overview
1.1 Company overview
Infosys Limited ('the Company' or Infosys) is a leading provider of consulting, technology, outsourcing and next-generation digital services, enabling clients to execute
strategies for their digital transformation. Infosys strategic objective is to build a sustainable organization that remains relevant to the agenda of clients, while creating
growth opportunities for employees and generating profitable returns for investors. Infosys strategy is to be a navigator for our clients as they ideate, plan and execute on
their journey to a digital future.
Infosys together with its subsidiaries and controlled trusts is herein after referred to as the "Group".
The company is a public limited company incorporated and domiciled in India and has its registered office at Bengaluru, Karnataka, India. The company has its primary
listings on the BSE Ltd. and National Stock Exchange of India Limited. The company’s American Depositary Shares (ADS) representing equity shares are listed on the
New York Stock Exchange (NYSE).
The Group's interim condensed consolidated financial statements are authorized for issue by the company's Board of Directors on October 11, 2019.
1.2 Basis of preparation of financial statements
These interim condensed consolidated financial statements have been prepared in compliance with IAS 34, Interim Financial Reporting as issued by International
Accounting Standards Board, under the historical cost convention on the accrual basis except for certain financial instruments which have been measured at fair values.
Accordingly, these interim condensed consolidated financial statements do not include all the information required for a complete set of financial statements. These
interim condensed consolidated financial statements should be read in conjunction with the consolidated financial statements and related notes included in the company’s
Annual Report on Form 20-F for the year ended March 31, 2019. Accounting policies have been consistently applied except where a newly issued accounting standard is
initially adopted or a revision to an existing accounting standard requires a change in the accounting policy hitherto in use.
As the quarter and year-to-date figures are taken from the source and rounded to the nearest digits, the quarter figures in this statement added up to the figures reported
for the previous quarters might not always add up to the year-to-date figures reported in this statement.
1.3 Basis of consolidation
Infosys consolidates entities which it owns or controls. The interim condensed consolidated financial statements comprise the financial statements of the company, its
controlled trusts and its subsidiaries. Control exists when the parent has power over the entity, is exposed, or has rights, to variable returns from its involvement with the
entity and has the ability to affect those returns by using its power over the entity. Power is demonstrated through existing rights that give the ability to direct relevant
activities, those which significantly affect the entity's returns. Subsidiaries are consolidated from the date control commences until the date control ceases.
The financial statements of the Group companies are consolidated on a line-by-line basis and intra-group balances and transactions including unrealized gain / loss from
such transactions are eliminated upon consolidation. These financial statements are prepared by applying uniform accounting policies in use at the Group. Non-
controlling interests which represent part of the net profit or loss and net assets of subsidiaries that are not, directly or indirectly, owned or controlled by the company, are
excluded.
1.4 Use of estimates and judgments
The preparation of the financial statements in conformity with IFRS requires management to make estimates, judgments and assumptions. These estimates, judgments
and assumptions affect the application of accounting policies and the reported amounts of assets and liabilities, the disclosures of contingent assets and liabilities at the
date of the financial statements and reported amounts of revenues and expenses during the period. Application of accounting policies that require critical accounting
estimates involving complex and subjective judgments and the use of assumptions in these financial statements have been disclosed in Note 1.5. Accounting estimates
could change from period to period. Actual results could differ from those estimates. Appropriate changes in estimates are made as management becomes aware of
changes in circumstances surrounding the estimates. Changes in estimates are reflected in the financial statements in the period in which changes are made and, if
material, their effects are disclosed in the notes to the condensed consolidated financial statements.
1.5 Critical accounting estimates and judgements
a. Revenue recognition
The group uses the percentage-of-completion method in accounting for its fixed-price contracts. Use of the percentage-of-completion method requires the group to
estimate the efforts or costs expended to date as a proportion of the total efforts or costs to be expended. Efforts or costs expended have been used to measure progress
towards completion as there is a direct relationship between input and productivity.
Further, the Group uses significant judgements while determining the transaction price allocated to performance obligations using the expected cost plus margin
approach.
Provisions for estimated losses, if any, on uncompleted contracts are recorded in the period in which such losses become probable based on the expected contract
estimates at the reporting date.
6
b. Income taxes
The company's two major tax jurisdictions are India and the U.S., though the company also files tax returns in other overseas jurisdictions. Significant judgments are
involved in determining the provision for income taxes, including amount expected to be paid/recovered for uncertain tax positions.
In assessing the realizability of deferred income tax assets, management considers whether some portion or all of the deferred income tax assets will not be realized. The
ultimate realization of deferred income tax assets is dependent upon the generation of future taxable income during the periods in which the temporary differences
become deductible. Management considers the scheduled reversals of deferred income tax liabilities, projected future taxable income and tax planning strategies in
making this assessment. Based on the level of historical taxable income and projections for future taxable income over the periods in which the deferred income tax assets
are deductible, management believes that the group will realize the benefits of those deductible differences. The amount of the deferred income tax assets considered
realizable, however, could be reduced in the near term if estimates of future taxable income during the carry forward period are reduced (also refer to note 2.12).
c. Business combinations and intangible assets
Business combinations are accounted for using IFRS 3 (Revised), Business Combinations. IFRS 3 requires the identifiable intangible assets and contingent consideration
to be fair valued in order to ascertain the net fair value of identifiable assets, liabilities and contingent liabilities of the acquiree. Significant estimates are required to be
made in determining the value of contingent consideration, value of option arrangements and intangible assets. These valuations are conducted by external valuation
experts (Refer to note 2.10)
d. Property, plant and equipment
Property, plant and equipment represent a significant proportion of the asset base of the Group. The charge in respect of periodic depreciation is derived after determining
an estimate of an asset’s expected useful life and the expected residual value at the end of its life. The useful lives and residual values of Group's assets are determined by
management at the time the asset is acquired and reviewed periodically, including at each financial year end. The lives are based on historical experience with similar
assets as well as anticipation of future events, which may impact their life, such as changes in technology (Refer to note 2.7).
e. Impairment of Goodwill
Goodwill is tested for impairment on an annual basis and whenever there is an indication that the recoverable amount of a cash generating unit is less than its carrying
amount based on a number of factors including operating results, business plans, future cash flows and economic conditions. The recoverable amount of cash generating
units is determined based on higher of value-in-use and fair value less cost to sell. The goodwill impairment test is performed at the level of the cash-generating unit or
groups of cash-generating units which are benefitting from the synergies of the acquisition and which represents the lowest level at which goodwill is monitored for
internal management purposes.
Market related information and estimates are used to determine the recoverable amount. Key assumptions on which management has based its determination of
recoverable amount include estimated long term growth rates, weighted average cost of capital and estimated operating margins. Cash flow projections take into account
past experience and represent management’s best estimate about future developments
f. Leases
IFRS 16 requires lessees to determine the lease term as the non-cancellable period of a lease adjusted with any option to extend or terminate the lease, if the use of such
option is reasonably certain. The Group makes an assessment on the expected lease term on a lease-by-lease basis and thereby assesses whether it is reasonably certain
that any options to extend or terminate the contract will be exercised. In evaluating the lease term, the Company considers factors such as any significant leasehold
improvements undertaken over the lease term, costs relating to the termination of the lease and the importance of the underlying asset to Infosys’s operations taking into
account the location of the underlying asset and the availability of suitable alternatives. The lease term in future periods is reassessed to ensure that the lease term reflects
the current economic circumstances.
1.6 Recent accounting pronouncements
Standards issued but not yet effective
Amendment to IFRS 3 Business Combinations - On October 22, 2018, the IASB issued amendments to the definition of a business in IFRS 3 Business Combinations.
The amendments clarify the definition of a business, with the objective of assisting entities to determine whether a transaction should be accounted for as a business
combination or as an asset acquisition. The amendment also introduces an optional concentration test that permits a simplified assessment of whether an acquired set of
activities and assets is not a business.
The effective date for adoption of this amendment is annual periods beginning on or after January 1, 2020, although early adoption is permitted. The Group is currently
evaluating the effect of this amendment on the consolidated financial statements.
7
2. Notes to the interim Condensed Consolidated Financial Statements
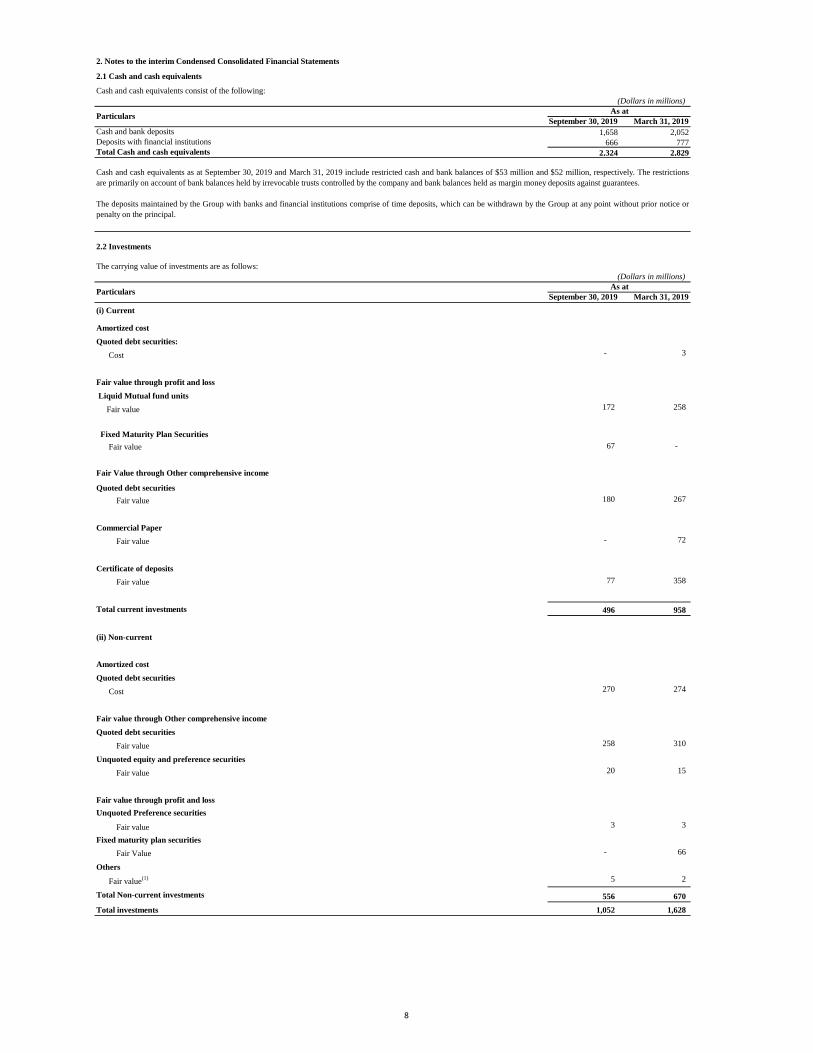
2.1 Cash and cash equivalents
Cash and cash equivalents consist of the following:
(Dollars in millions)
September 30, 2019 March 31, 2019
Cash and bank deposits 1,658 2,052 Deposits with financial institutions 666 777 Total Cash and cash equivalents 2,324 2,829
2.2 Investments
(Dollars in millions)
September 30, 2019 March 31, 2019
(i) Current
Amortized cost
Quoted debt securities:
Cost - 3
Fair value through profit and loss
Liquid Mutual fund units
Fair value 172 258
Fixed Maturity Plan Securities
Fair value 67 -
Quoted debt securities
Fair value 180 267
Commercial Paper
Fair value - 72
Certificate of deposits
Fair value 77 358
Total current investments 496 958
(ii) Non-current
Amortized cost
Quoted debt securities
Cost 270 274
Fair value through Other comprehensive income
Quoted debt securities
Fair value 258 310
Unquoted equity and preference securities
Fair value 20 15
Fair value through profit and loss
Unquoted Preference securities
Fair value 3 3
Fixed maturity plan securities
Fair Value - 66
Others
Fair value(1) 5 2
Total Non-current investments 556 670
Total investments 1,052 1,628
Fair Value through Other comprehensive income
As at
Cash and cash equivalents as at September 30, 2019 and March 31, 2019 include restricted cash and bank balances of $53 million and $52 million, respectively. The restrictions
are primarily on account of bank balances held by irrevocable trusts controlled by the company and bank balances held as margin money deposits against guarantees.
The deposits maintained by the Group with banks and financial institutions comprise of time deposits, which can be withdrawn by the Group at any point without prior notice or
penalty on the principal.
As at
The carrying value of investments are as follows:
Particulars
Particulars
8
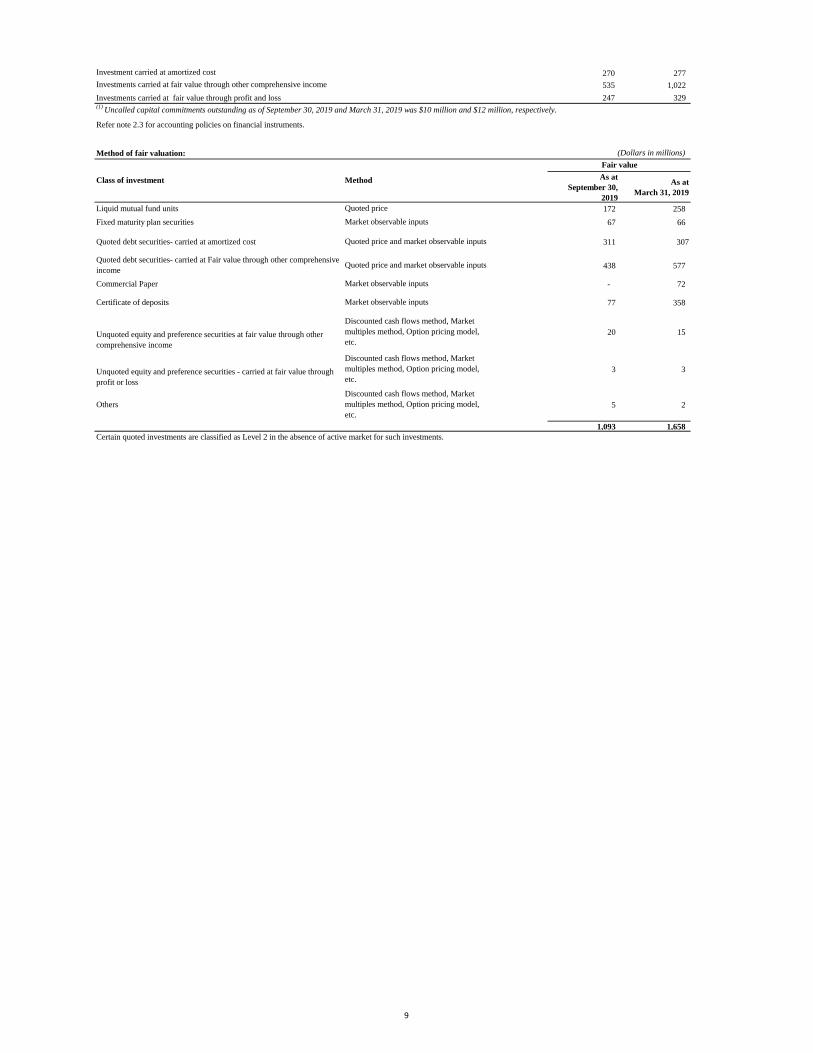
270 277
Investments carried at fair value through other comprehensive income 535 1,022
Investments carried at fair value through profit and loss 247 329 (1)
Uncalled capital commitments outstanding as of September 30, 2019 and March 31, 2019 was $10 million and $12 million, respectively.
Method of fair valuation: (Dollars in millions)
As at
September 30,
2019
As at
March 31, 2019
Liquid mutual fund units 172 258
Fixed maturity plan securities 67 66
Quoted debt securities- carried at amortized cost 311 307
438 577
Commercial Paper - 72
Certificate of deposits 77 358
20 15
3 3
Others 5 2
1,093 1,658
Certain quoted investments are classified as Level 2 in the absence of active market for such investments.
Investment carried at amortized cost
Quoted price
Method
Market observable inputs
Quoted price and market observable inputs
Fair value
Class of investment
Discounted cash flows method, Market
multiples method, Option pricing model,
etc.
Discounted cash flows method, Market
multiples method, Option pricing model,
etc.
Market observable inputs
Quoted debt securities- carried at Fair value through other comprehensive
income
Refer note 2.3 for accounting policies on financial instruments.
Discounted cash flows method, Market
multiples method, Option pricing model,
etc.
Quoted price and market observable inputs
Market observable inputs
Unquoted equity and preference securities at fair value through other
comprehensive income
Unquoted equity and preference securities - carried at fair value through
profit or loss
9
2.3 Financial instruments
Accounting Policy
2.3.1 Initial recognition
(i) Financial assets or financial liabilities, at fair value through profit or loss.
This category has derivative financial assets or liabilities which are not designated as hedges.
Although the group believes that these derivatives constitute hedges from an economic perspective, they may not qualify for hedge accounting under
IFRS 9, Financial Instruments. Any derivative that is either not designated as hedge, or is so designated but is ineffective as per IFRS 9, is categorized
as a financial asset or financial liability, at fair value through profit or loss.
(ii) Financial assets at fair value through other comprehensive income (FVOCI)
A financial asset is subsequently measured at fair value through other comprehensive income if it is held within a business model whose objective is
achieved by both collecting contractual cash flows and selling financial assets and the contractual terms of the financial asset give rise on specified
dates to cash flows that are solely payments of principal and interest on the principal amount outstanding. The Group has made an irrevocable election
for its investments which are classified as equity instruments to present the subsequent changes in fair value in other comprehensive income based on
its business model.
The group recognizes financial assets and financial liabilities when it becomes a party to the contractual provisions of the instrument. All financial
assets and liabilities are recognized at fair value on initial recognition, except for trade receivables which are initially measured at transaction price.
Transaction costs that are directly attributable to the acquisition or issue of financial assets and financial liabilities, that are not at fair value through
profit or loss, are added to the fair value on initial recognition. Regular way purchase and sale of financial assets are accounted for at trade date.
2.3.2 Subsequent measurement
a. Non-derivative financial instruments
(i) Financial assets carried at amortized cost
b. Derivative financial instruments
(iii) Financial assets at fair value through profit or loss (FVTPL)
A financial asset which is not classified in any of the above categories is subsequently fair valued through profit or loss.
(iv) Financial liabilities
Financial liabilities are subsequently carried at amortized cost using the effective interest method, except for contingent consideration and financial
liability under option arrangements recognized in a business combination which is subsequently measured at fair value through profit and loss. For
trade and other payables maturing within one year from the balance sheet date, the carrying amounts approximate fair value due to the short maturity of
these instruments.
The group holds derivative financial instruments such as foreign exchange forward and option contracts to mitigate the risk of changes in exchange
rates on foreign currency exposures. The counterparty for these contracts is generally a bank.
Derivatives not designated as hedges are recognized initially at fair value and attributable transaction costs are recognized in net profit in the statement
of comprehensive income when incurred. Subsequent to initial recognition, these derivatives are measured at fair value through profit or loss and the
resulting exchange gains or losses are included in other income. Assets/ liabilities in this category are presented as current assets/current liabilities if
they are either held for trading or are expected to be realized within 12 months after the balance sheet date.
A financial asset is subsequently measured at amortized cost if it is held within a business model whose objective is to hold the asset in order to collect
contractual cash flows and the contractual terms of the financial asset give rise on specified dates to cash flows that are solely payments of principal
and interest on the principal amount outstanding.
10
The Group recognizes loss allowances using the expected credit loss (ECL) model for the financial assets and unbilled revenue which are not fair
valued through profit or loss. Loss allowance for trade receivables and unbilled revenues with no significant financing component is measured at an
amount equal to lifetime ECL. For all other financial assets, expected credit losses are measured at an amount equal to the 12-month ECL, unless there
has been a significant increase in credit risk from initial recognition in which case those are measured at lifetime ECL. The amount of expected credit
losses (or reversal) that is required to adjust the loss allowance at the reporting date to the amount that is required to be recognized is recognized as an
impairment gain or loss in statement of comprehensive income.
2.3.5 Impairment
In determining the fair value of its financial instruments, the group uses a variety of methods and assumptions that are based on market conditions and
risks existing at each reporting date. The methods used to determine fair value include discounted cash flow analysis, available quoted market prices
and dealer quotes. All methods of assessing fair value result in general approximation of value, and such value may never actually be realized.
(ii) Cash flow hedge
The group derecognizes a financial asset when the contractual rights to the cash flows from the financial asset expire or it transfers the financial asset
and the transfer qualifies for derecognition under IFRS 9. A financial liability (or a part of a financial liability) is derecognized from the group's balance
sheet when the obligation specified in the contract is discharged or cancelled or expires.
The group designates certain foreign exchange forward and options contracts as cash flow hedges to mitigate the risk of foreign exchange exposure on
highly probable forecast cash transactions.
When a derivative is designated as a cash flow hedging instrument, the effective portion of changes in the fair value of the derivative is recognized in
other comprehensive income and accumulated in the cash flow hedging reserve. Any ineffective portion of changes in the fair value of the derivative is
recognized immediately in the net profit in the statement of comprehensive income. If the hedging instrument no longer meets the criteria for hedge
accounting, then hedge accounting is discontinued prospectively. If the hedging instrument expires or is sold, terminated or exercised, the cumulative
gain or loss on the hedging instrument recognized in cash flow hedging reserve till the period the hedge was effective remains in cash flow hedging
reserve until the forecasted transaction occurs. The cumulative gain or loss previously recognized in the cash flow hedging reserve is transferred to the
net profit in the statement of comprehensive income upon the occurrence of the related forecasted transaction. If the forecasted transaction is no longer
expected to occur, then the amount accumulated in cash flow hedging reserve is reclassified to net profit in the statement of comprehensive income.
Refer to table ‘Financial instruments by category’ below for the disclosure on carrying value and fair value of financial assets and liabilities. For
financial assets and liabilities maturing within one year from the Balance Sheet date and which are not carried at fair value, the carrying amounts
approximate fair value due to the short maturity of those instruments.
2.3.3 Derecognition of financial instruments
2.3.4 Fair value of financial instruments
11
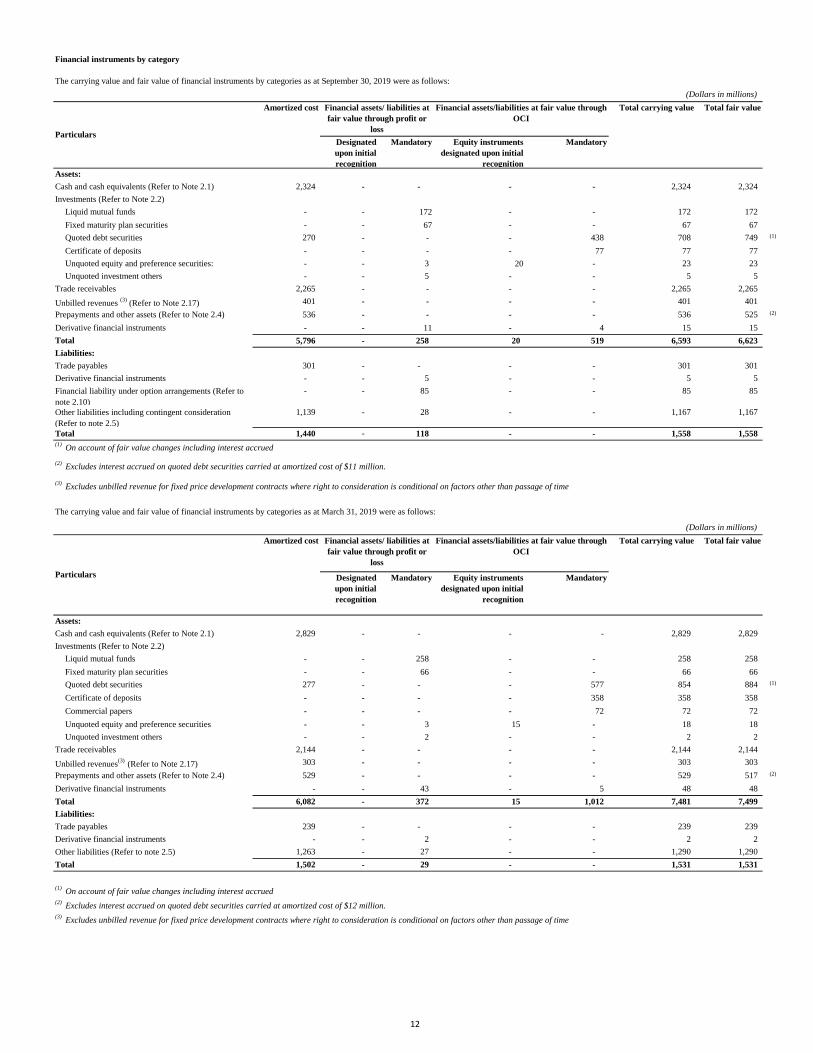
(Dollars in millions)
Amortized cost Total carrying value Total fair value
Designated
upon initial
recognition
Mandatory Equity instruments
designated upon initial
recognition
Mandatory
Assets:
Cash and cash equivalents (Refer to Note 2.1) 2,324 - - - - 2,324 2,324
Investments (Refer to Note 2.2)
Liquid mutual funds - - 172 - - 172 172
Fixed maturity plan securities - - 67 - - 67 67
Quoted debt securities 270 - - - 438 708 749 (1)
Certificate of deposits - - - - 77 77 77
Unquoted equity and preference securities: - - 3 20 - 23 23
Unquoted investment others - - 5 - - 5 5
Trade receivables 2,265 - - - - 2,265 2,265
Unbilled revenues (3)
(Refer to Note 2.17) 401 - - - - 401 401
Prepayments and other assets (Refer to Note 2.4) 536 - - - - 536 525 (2)
Derivative financial instruments - - 11 - 4 15 15
Total 5,796 - 258 20 519 6,593 6,623
Liabilities:
Trade payables 301 - - - - 301 301
Derivative financial instruments - - 5 - - 5 5
Financial liability under option arrangements (Refer to
note 2.10)
- - 85 - - 85 85
Other liabilities including contingent consideration
(Refer to note 2.5)
1,139 - 28 - - 1,167 1,167
Total 1,440 - 118 - - 1,558 1,558
(1) On account of fair value changes including interest accrued
(2) Excludes interest accrued on quoted debt securities carried at amortized cost of $11 million.
(3) Excludes unbilled revenue for fixed price development contracts where right to consideration is conditional on factors other than passage of time
(Dollars in millions)
Amortized cost Total carrying value Total fair value
Designated
upon initial
recognition
Mandatory Equity instruments
designated upon initial
recognition
Mandatory
Assets:
Cash and cash equivalents (Refer to Note 2.1) 2,829 - - - - 2,829 2,829
Investments (Refer to Note 2.2)
Liquid mutual funds - - 258 - - 258 258
Fixed maturity plan securities - - 66 - - 66 66
Quoted debt securities 277 - - - 577 854 884 (1)
Certificate of deposits - - - - 358 358 358
Commercial papers - - - - 72 72 72
Unquoted equity and preference securities - - 3 15 - 18 18
Unquoted investment others - - 2 - - 2 2
Trade receivables 2,144 - - - - 2,144 2,144
Unbilled revenues(3)
(Refer to Note 2.17) 303 - - - - 303 303
Prepayments and other assets (Refer to Note 2.4) 529 - - - - 529 517 (2)
Derivative financial instruments - - 43 - 5 48 48
Total 6,082 - 372 15 1,012 7,481 7,499
Liabilities:
Trade payables 239 - - - - 239 239
Derivative financial instruments - - 2 - - 2 2
Other liabilities (Refer to note 2.5) 1,263 - 27 - - 1,290 1,290
Total 1,502 - 29 - - 1,531 1,531
(1) On account of fair value changes including interest accrued
(2) Excludes interest accrued on quoted debt securities carried at amortized cost of $12 million.
(3) Excludes unbilled revenue for fixed price development contracts where right to consideration is conditional on factors other than passage of time
The carrying value and fair value of financial instruments by categories as at March 31, 2019 were as follows:
Financial assets/ liabilities at
fair value through profit or
loss
Financial assets/liabilities at fair value through
OCI
Financial instruments by category
The carrying value and fair value of financial instruments by categories as at September 30, 2019 were as follows:
Financial assets/ liabilities at
fair value through profit or
loss
Financial assets/liabilities at fair value through
OCI
Particulars
Particulars
12
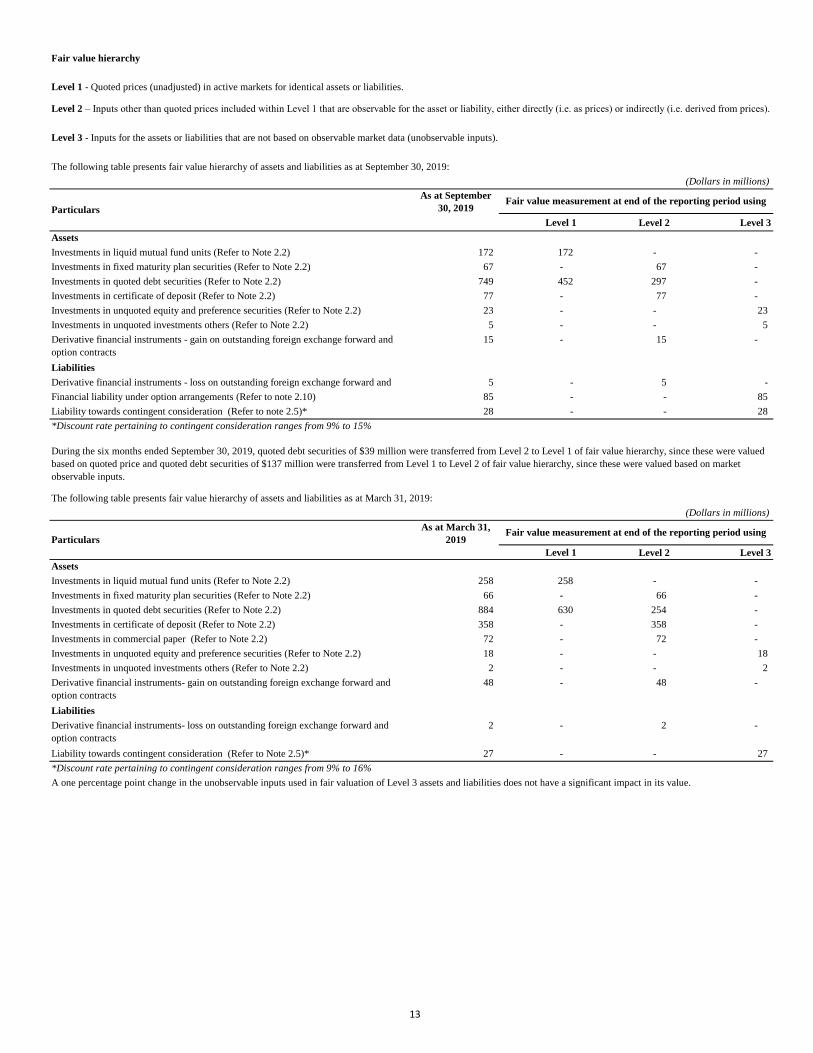
(Dollars in millions)
As at September
30, 2019
Level 1 Level 2 Level 3
Assets
172 172 - -
67 - 67 -
749 452 297 -
77 - 77 -
23 - - 23
5 - - 5
15 - 15 -
Liabilities
5 - 5 -
85 - - 85
28 - - 28
(Dollars in millions)
As at March 31,
2019
Level 1 Level 2 Level 3
Assets
258 258 - -
66 - 66 -
884 630 254 -
358 - 358 -
Investments in commercial paper (Refer to Note 2.2) 72 - 72 -
18 - - 18
2 - - 2
48 - 48 -
Liabilities
2 - 2 -
27 - - 27
A one percentage point change in the unobservable inputs used in fair valuation of Level 3 assets and liabilities does not have a significant impact in its value.
Investments in unquoted investments others (Refer to Note 2.2)
Liability towards contingent consideration (Refer to Note 2.5)*
Investments in quoted debt securities (Refer to Note 2.2)
Derivative financial instruments- loss on outstanding foreign exchange forward and
option contracts
Investments in unquoted equity and preference securities (Refer to Note 2.2)
Derivative financial instruments- gain on outstanding foreign exchange forward and
option contracts
Fair value hierarchy
Investments in fixed maturity plan securities (Refer to Note 2.2)
Investments in certificate of deposit (Refer to Note 2.2)
Investments in liquid mutual fund units (Refer to Note 2.2)
The following table presents fair value hierarchy of assets and liabilities as at March 31, 2019:
Fair value measurement at end of the reporting period using
Level 1 - Quoted prices (unadjusted) in active markets for identical assets or liabilities.
Derivative financial instruments - loss on outstanding foreign exchange forward and
option contracts
Liability towards contingent consideration (Refer to note 2.5)*
Investments in unquoted equity and preference securities (Refer to Note 2.2)
Financial liability under option arrangements (Refer to note 2.10)
Particulars
Level 3 - Inputs for the assets or liabilities that are not based on observable market data (unobservable inputs).
Level 2 – Inputs other than quoted prices included within Level 1 that are observable for the asset or liability, either directly (i.e. as prices) or indirectly (i.e. derived from prices).
*Discount rate pertaining to contingent consideration ranges from 9% to 16%
The following table presents fair value hierarchy of assets and liabilities as at September 30, 2019:
*Discount rate pertaining to contingent consideration ranges from 9% to 15%
Derivative financial instruments - gain on outstanding foreign exchange forward and
option contracts
During the six months ended September 30, 2019, quoted debt securities of $39 million were transferred from Level 2 to Level 1 of fair value hierarchy, since these were valued
based on quoted price and quoted debt securities of $137 million were transferred from Level 1 to Level 2 of fair value hierarchy, since these were valued based on market
observable inputs.
Investments in liquid mutual fund units (Refer to Note 2.2)
Investments in quoted debt securities (Refer to Note 2.2)
Fair value measurement at end of the reporting period using
Investments in fixed maturity plan securities (Refer to Note 2.2)
Investments in certificate of deposit (Refer to Note 2.2)
Particulars
Investments in unquoted investments others (Refer to Note 2.2)
13
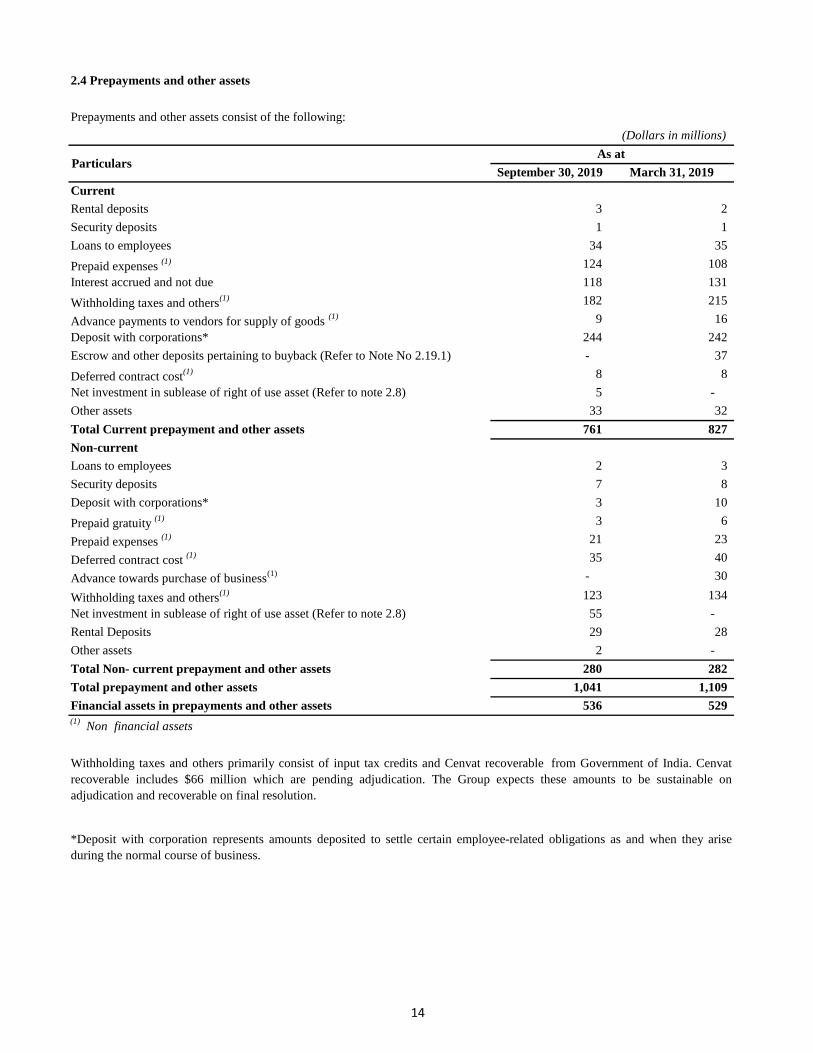
2.4 Prepayments and other assets
Prepayments and other assets consist of the following:
(Dollars in millions)
September 30, 2019 March 31, 2019
Current
Rental deposits 3 2
Security deposits 1 1
Loans to employees 34 35
Prepaid expenses (1) 124 108
Interest accrued and not due 118 131
Withholding taxes and others(1) 182 215
Advance payments to vendors for supply of goods (1) 9 16
Deposit with corporations* 244 242
Escrow and other deposits pertaining to buyback (Refer to Note No 2.19.1) - 37
Deferred contract cost(1) 8 8
Net investment in sublease of right of use asset (Refer to note 2.8) 5 -
Other assets 33 32
761 827
Non-current
Loans to employees 2 3
Security deposits 7 8
Deposit with corporations* 3 10
Prepaid gratuity (1) 3 6
Prepaid expenses (1) 21 23
Deferred contract cost (1) 35 40
Advance towards purchase of business(1) - 30
Withholding taxes and others(1) 123 134
Net investment in sublease of right of use asset (Refer to note 2.8) 55 -
Rental Deposits 29 28
Other assets 2 -
Total Non- current prepayment and other assets 280 282
Total prepayment and other assets 1,041 1,109
Financial assets in prepayments and other assets 536 529
(1) Non
financial assets
As at
Withholding taxes and others primarily consist of input tax credits and Cenvat recoverable from Government of India. Cenvat
recoverable includes $66 million which are pending adjudication. The Group expects these amounts to be sustainable on
adjudication and recoverable on final resolution.
Total Current prepayment and other assets
*Deposit with corporation represents amounts deposited to settle certain employee-related obligations as and when they arise
during the normal course of business.
Particulars
14
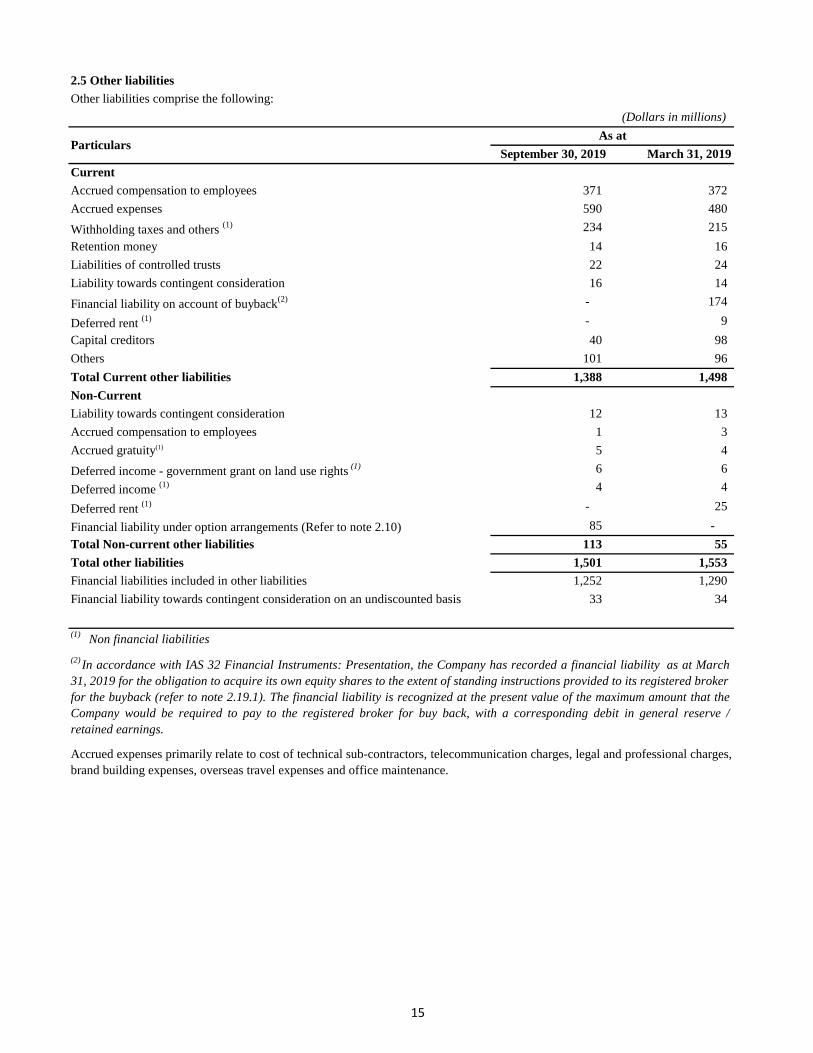
2.5 Other liabilities
Other liabilities comprise the following:
(Dollars in millions)
September 30, 2019 March 31, 2019
Current
Accrued compensation to employees 371 372
Accrued expenses 590 480
Withholding taxes and others (1) 234 215
Retention money 14 16
Liabilities of controlled trusts 22 24
Liability towards contingent consideration 16 14
Financial liability on account of buyback(2) - 174
Deferred rent (1) - 9
Capital creditors 40 98
Others 101 96
Total Current other liabilities 1,388 1,498
Non-Current
Liability towards contingent consideration 12 13
Accrued compensation to employees 1 3
Accrued gratuity(1) 5 4
Deferred income - government grant on land use rights (1) 6 6
Deferred income (1) 4 4
Deferred rent (1) - 25
Financial liability under option arrangements (Refer to note 2.10) 85 -
Total Non-current other liabilities 113 55
Total other liabilities 1,501 1,553
1,252 1,290
33 34
Financial liabilities included in other liabilities
As atParticulars
(1) Non financial liabilities
Accrued expenses primarily relate to cost of technical sub-contractors, telecommunication charges, legal and professional charges,
brand building expenses, overseas travel expenses and office maintenance.
(2)In accordance with IAS 32 Financial Instruments: Presentation, the Company has recorded a financial liability as at March
31, 2019 for the obligation to acquire its own equity shares to the extent of standing instructions provided to its registered broker
for the buyback (refer to note 2.19.1). The financial liability is recognized at the present value of the maximum amount that the
Company would be required to pay to the registered broker for buy back, with a corresponding debit in general reserve /
retained earnings.
Financial liability towards contingent consideration on an undiscounted basis
15
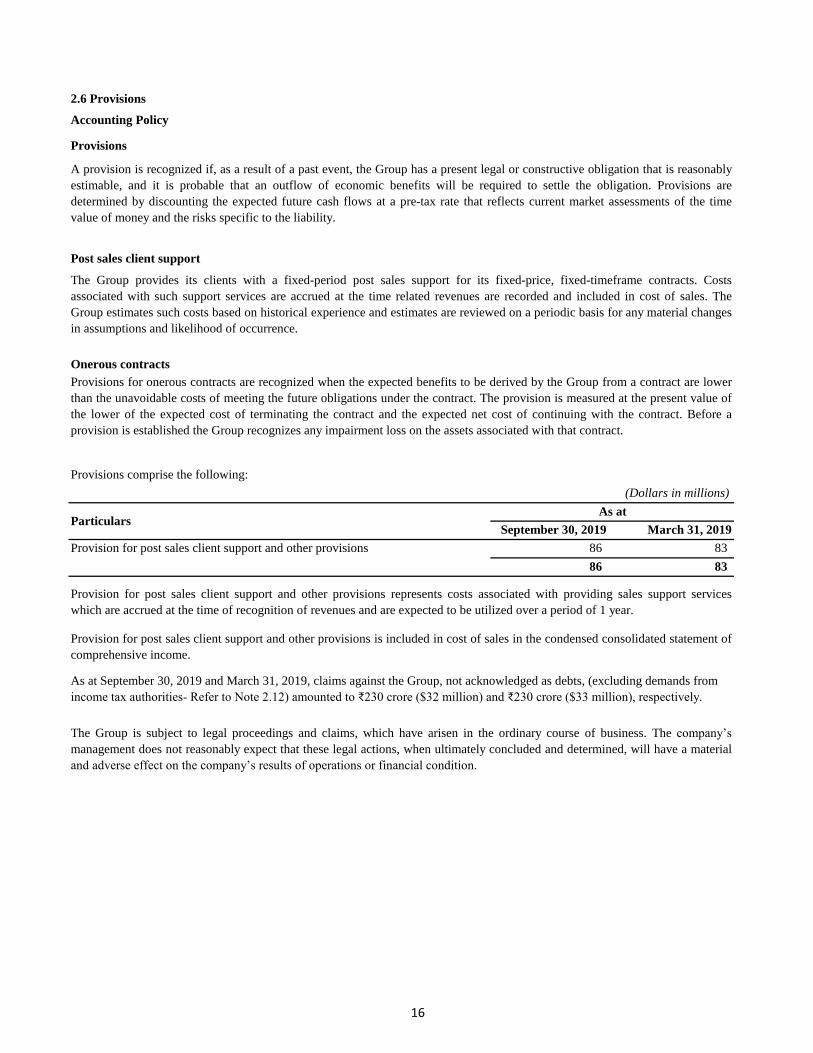
2.6 Provisions
Accounting Policy
Provisions
Post sales client support
Provisions comprise the following:
(Dollars in millions)
September 30, 2019 March 31, 2019
Provision for post sales client support and other provisions 86 83
86 83
The Group is subject to legal proceedings and claims, which have arisen in the ordinary course of business. The company’s
management does not reasonably expect that these legal actions, when ultimately concluded and determined, will have a material
and adverse effect on the company’s results of operations or financial condition.
As at September 30, 2019 and March 31, 2019, claims against the Group, not acknowledged as debts, (excluding demands from
income tax authorities- Refer to Note 2.12) amounted to ₹230 crore ($32 million) and ₹230 crore ($33 million), respectively.
Provision for post sales client support and other provisions is included in cost of sales in the condensed consolidated statement of
comprehensive income.
Provision for post sales client support and other provisions represents costs associated with providing sales support services
which are accrued at the time of recognition of revenues and are expected to be utilized over a period of 1 year.
As at
Provisions for onerous contracts are recognized when the expected benefits to be derived by the Group from a contract are lower
than the unavoidable costs of meeting the future obligations under the contract. The provision is measured at the present value of
the lower of the expected cost of terminating the contract and the expected net cost of continuing with the contract. Before a
provision is established the Group recognizes any impairment loss on the assets associated with that contract.
A provision is recognized if, as a result of a past event, the Group has a present legal or constructive obligation that is reasonably
estimable, and it is probable that an outflow of economic benefits will be required to settle the obligation. Provisions are
determined by discounting the expected future cash flows at a pre-tax rate that reflects current market assessments of the time
value of money and the risks specific to the liability.
The Group provides its clients with a fixed-period post sales support for its fixed-price, fixed-timeframe contracts. Costs
associated with such support services are accrued at the time related revenues are recorded and included in cost of sales. The
Group estimates such costs based on historical experience and estimates are reviewed on a periodic basis for any material changes
in assumptions and likelihood of occurrence.
Onerous contracts
Particulars
16
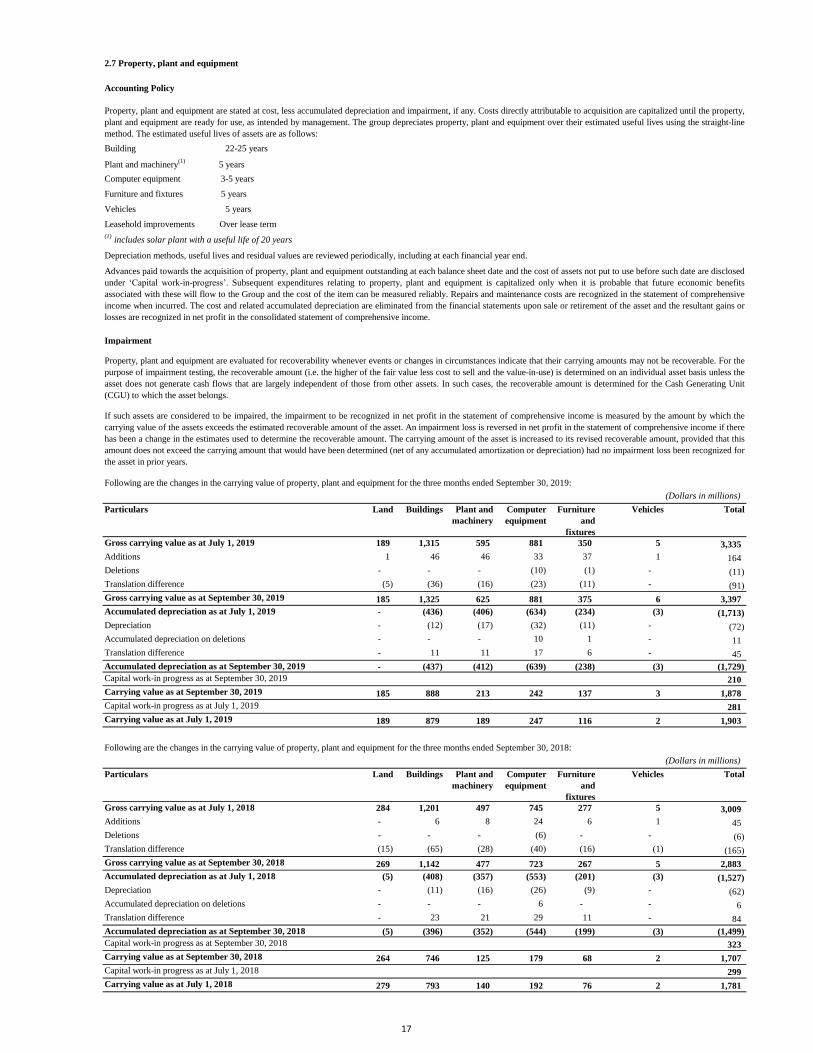
2.7 Property, plant and equipment
Accounting Policy
Building 22-25 years
Plant and machinery(1)
5 years
Computer equipment 3-5 years
Furniture and fixtures 5 years
Vehicles 5 years
Leasehold improvements Over lease term
Following are the changes in the carrying value of property, plant and equipment for the three months ended September 30, 2019:
(Dollars in millions)
Particulars Land Buildings Plant and
machinery
Computer
equipment
Furniture
and
fixtures
Vehicles Total
Gross carrying value as at July 1, 2019 189 1,315 595 881 350 5 3,335
Additions 1 46 46 33 37 1 164
Deletions - - - (10) (1) - (11)
Translation difference (5) (36) (16) (23) (11) - (91)
Gross carrying value as at September 30, 2019 185 1,325 625 881 375 6 3,397
Accumulated depreciation as at July 1, 2019 - (436) (406) (634) (234) (3) (1,713)
Depreciation - (12) (17) (32) (11) - (72)
Accumulated depreciation on deletions - - - 10 1 - 11
Translation difference - 11 11 17 6 - 45
Accumulated depreciation as at September 30, 2019 - (437) (412) (639) (238) (3) (1,729)
Capital work-in progress as at September 30, 2019 210
Carrying value as at September 30, 2019 185 888 213 242 137 3 1,878
Capital work-in progress as at July 1, 2019 281
Carrying value as at July 1, 2019 189 879 189 247 116 2 1,903
Following are the changes in the carrying value of property, plant and equipment for the three months ended September 30, 2018:
(Dollars in millions)
Particulars Land Buildings Plant and
machinery
Computer
equipment
Furniture
and
fixtures
Vehicles Total
Gross carrying value as at July 1, 2018 284 1,201 497 745 277 5 3,009
Additions - 6 8 24 6 1 45
Deletions - - - (6) - - (6)
Translation difference (15) (65) (28) (40) (16) (1) (165)
Gross carrying value as at September 30, 2018 269 1,142 477 723 267 5 2,883
Accumulated depreciation as at July 1, 2018 (5) (408) (357) (553) (201) (3) (1,527)
Depreciation - (11) (16) (26) (9) - (62)
Accumulated depreciation on deletions - - - 6 - - 6
Translation difference - 23 21 29 11 - 84
Accumulated depreciation as at September 30, 2018 (5) (396) (352) (544) (199) (3) (1,499)
Capital work-in progress as at September 30, 2018 323
Carrying value as at September 30, 2018 264 746 125 179 68 2 1,707
Capital work-in progress as at July 1, 2018 299
Carrying value as at July 1, 2018 279 793 140 192 76 2 1,781
If such assets are considered to be impaired, the impairment to be recognized in net profit in the statement of comprehensive income is measured by the amount by which the
carrying value of the assets exceeds the estimated recoverable amount of the asset. An impairment loss is reversed in net profit in the statement of comprehensive income if there
has been a change in the estimates used to determine the recoverable amount. The carrying amount of the asset is increased to its revised recoverable amount, provided that this
amount does not exceed the carrying amount that would have been determined (net of any accumulated amortization or depreciation) had no impairment loss been recognized for
the asset in prior years.
(1) includes solar plant with a useful life of 20 years
Property, plant and equipment are stated at cost, less accumulated depreciation and impairment, if any. Costs directly attributable to acquisition are capitalized until the property,
plant and equipment are ready for use, as intended by management. The group depreciates property, plant and equipment over their estimated useful lives using the straight-line
method. The estimated useful lives of assets are as follows:
Depreciation methods, useful lives and residual values are reviewed periodically, including at each financial year end.
Advances paid towards the acquisition of property, plant and equipment outstanding at each balance sheet date and the cost of assets not put to use before such date are disclosed
under ‘Capital work-in-progress’. Subsequent expenditures relating to property, plant and equipment is capitalized only when it is probable that future economic benefits
associated with these will flow to the Group and the cost of the item can be measured reliably. Repairs and maintenance costs are recognized in the statement of comprehensive
income when incurred. The cost and related accumulated depreciation are eliminated from the financial statements upon sale or retirement of the asset and the resultant gains or
losses are recognized in net profit in the consolidated statement of comprehensive income.
Impairment
Property, plant and equipment are evaluated for recoverability whenever events or changes in circumstances indicate that their carrying amounts may not be recoverable. For the
purpose of impairment testing, the recoverable amount (i.e. the higher of the fair value less cost to sell and the value-in-use) is determined on an individual asset basis unless the
asset does not generate cash flows that are largely independent of those from other assets. In such cases, the recoverable amount is determined for the Cash Generating Unit
(CGU) to which the asset belongs.
17
Following are the changes in the carrying value of property, plant and equipment for six months ended September 30, 2019:
(Dollars in millions)
Particulars Land Buildings Plant and
machinery
Computer
equipment
Furniture
and
fixtures
Vehicles Total
Gross carrying value as at April 1, 2019 276 1,291 572 845 321 5 3,310
Additions 1 70 69 63 64 1 268
Additions- Business Combinations (Refer note 2.10) - - - 9 1 - 10
Deletions - - (1) (14) (2) - (17)
Reclassified on account of adoption of IFRS 16 (Refer
note 2.8)
(87) - - - - - (87)
Translation difference (5) (36) (15) (22) (9) - (87)
Gross carrying value as at September 30, 2019 185 1,325 625 881 375 6 3,397
Accumulated depreciation as at April 1, 2019 (5) (423) (390) (606) (223) (3) (1,650)
Depreciation - (25) (33) (63) (22) - (143)
Accumulated depreciation on deletions - - 1 14 2 - 17
Reclassified on account of adoption of IFRS 16 (Refer
note 2.8)
5 - - - - - 5
Translation difference - 11 10 16 5 - 42
Accumulated depreciation as at September 30, 2019 - (437) (412) (639) (238) (3) (1,729)
Capital work-in progress as at September 30, 2019210
Carrying value as at September 30, 2019185 888 213 242 137 3 1,878
Capital work-in progress as at April 1, 2019 271
Carrying value as at April 1, 2019 271 868 182 239 98 2 1,931
Following are the changes in the carrying value of property, plant and equipment for six months ended September 30, 2018:
(Dollars in millions)
Particulars Land Buildings Plant and
machinery
Computer
equipment
Furniture
and
fixtures
Vehicles Total
Gross carrying value as at April 1, 2018 292 1,247 518 749 285 5 3,096
Additions 10 19 13 58 11 1 112
Additions- Business Combinations (Refer note 2.10) - - - - 1 - 1
Deletions (3) - (1) (8) (1) - (13)
Translation difference (30) (124) (53) (76) (29) (1) (313)
Gross carrying value as at September 30, 2018 269 1,142 477 723 267 5 2,883
Accumulated depreciation as at April 1, 2018 (5) (417) (359) (557) (203) (3) (1,544)
Depreciation - (22) (32) (52) (18) - (124)
Accumulated depreciation on deletions - - 1 8 1 - 10
Translation difference - 43 38 57 21 - 159
Accumulated depreciation as at September 30, 2018 (5) (396) (352) (544) (199) (3) (1,499)
Capital work-in progress as at September 30, 2018323
Carrying value as at September 30, 2018 264 746 125 179 68 2 1,707
Capital work-in progress as at April 1, 2018 311
Carrying value as at April 1, 2018 287 830 159 192 82 2 1,863
The contractual commitments for capital expenditure were $176 million and $249 million as at September 30, 2019 and March 31, 2019, respectively.
The aggregate depreciation expense is included in cost of sales in the statement of comprehensive income.
18
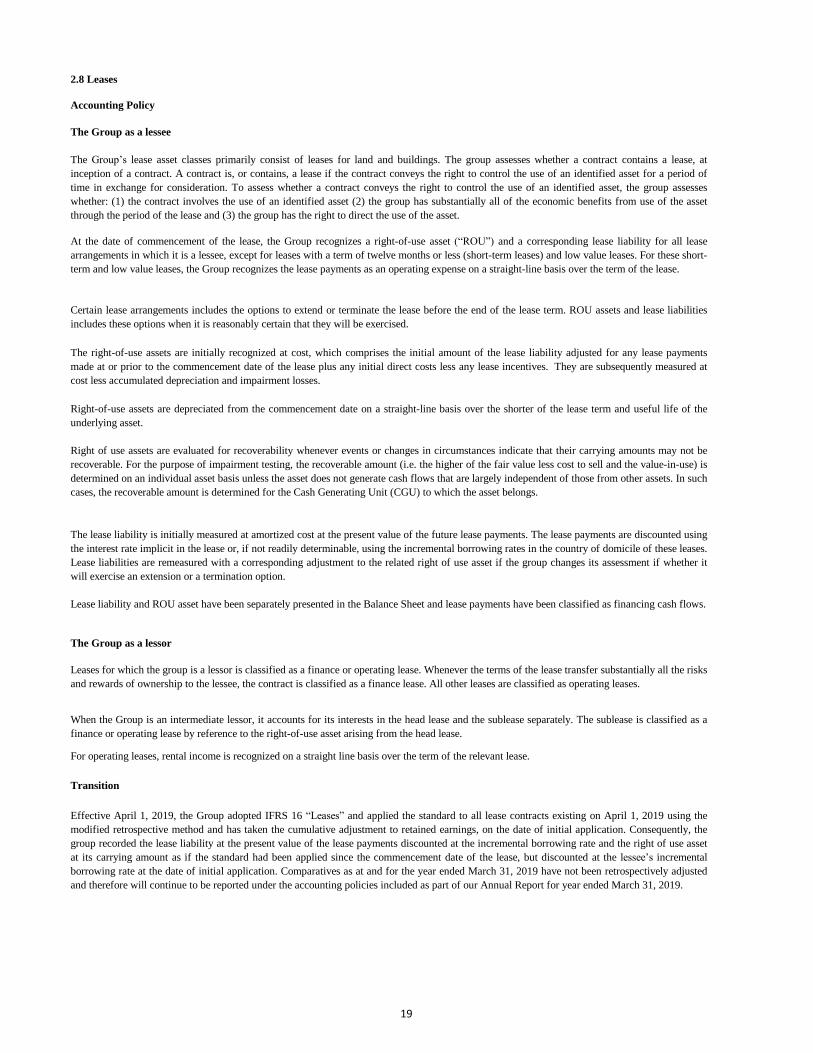
2.8 Leases
Transition
Effective April 1, 2019, the Group adopted IFRS 16 “Leases” and applied the standard to all lease contracts existing on April 1, 2019 using the
modified retrospective method and has taken the cumulative adjustment to retained earnings, on the date of initial application. Consequently, the
group recorded the lease liability at the present value of the lease payments discounted at the incremental borrowing rate and the right of use asset
at its carrying amount as if the standard had been applied since the commencement date of the lease, but discounted at the lessee’s incremental
borrowing rate at the date of initial application. Comparatives as at and for the year ended March 31, 2019 have not been retrospectively adjusted
and therefore will continue to be reported under the accounting policies included as part of our Annual Report for year ended March 31, 2019.
For operating leases, rental income is recognized on a straight line basis over the term of the relevant lease.
Accounting Policy
The Group as a lessee
The Group’s lease asset classes primarily consist of leases for land and buildings. The group assesses whether a contract contains a lease, at
inception of a contract. A contract is, or contains, a lease if the contract conveys the right to control the use of an identified asset for a period of
time in exchange for consideration. To assess whether a contract conveys the right to control the use of an identified asset, the group assesses
whether: (1) the contract involves the use of an identified asset (2) the group has substantially all of the economic benefits from use of the asset
through the period of the lease and (3) the group has the right to direct the use of the asset.
At the date of commencement of the lease, the Group recognizes a right-of-use asset (“ROU”) and a corresponding lease liability for all lease
arrangements in which it is a lessee, except for leases with a term of twelve months or less (short-term leases) and low value leases. For these short-
term and low value leases, the Group recognizes the lease payments as an operating expense on a straight-line basis over the term of the lease.
Certain lease arrangements includes the options to extend or terminate the lease before the end of the lease term. ROU assets and lease liabilities
includes these options when it is reasonably certain that they will be exercised.
The right-of-use assets are initially recognized at cost, which comprises the initial amount of the lease liability adjusted for any lease payments
made at or prior to the commencement date of the lease plus any initial direct costs less any lease incentives. They are subsequently measured at
cost less accumulated depreciation and impairment losses.
Right-of-use assets are depreciated from the commencement date on a straight-line basis over the shorter of the lease term and useful life of the
underlying asset.
Right of use assets are evaluated for recoverability whenever events or changes in circumstances indicate that their carrying amounts may not be
recoverable. For the purpose of impairment testing, the recoverable amount (i.e. the higher of the fair value less cost to sell and the value-in-use) is
determined on an individual asset basis unless the asset does not generate cash flows that are largely independent of those from other assets. In such
cases, the recoverable amount is determined for the Cash Generating Unit (CGU) to which the asset belongs.
The lease liability is initially measured at amortized cost at the present value of the future lease payments. The lease payments are discounted using
the interest rate implicit in the lease or, if not readily determinable, using the incremental borrowing rates in the country of domicile of these leases.
Lease liabilities are remeasured with a corresponding adjustment to the related right of use asset if the group changes its assessment if whether it
will exercise an extension or a termination option.
Lease liability and ROU asset have been separately presented in the Balance Sheet and lease payments have been classified as financing cash flows.
The Group as a lessor
Leases for which the group is a lessor is classified as a finance or operating lease. Whenever the terms of the lease transfer substantially all the risks
and rewards of ownership to the lessee, the contract is classified as a finance lease. All other leases are classified as operating leases.
When the Group is an intermediate lessor, it accounts for its interests in the head lease and the sublease separately. The sublease is classified as a
finance or operating lease by reference to the right-of-use asset arising from the head lease.
19
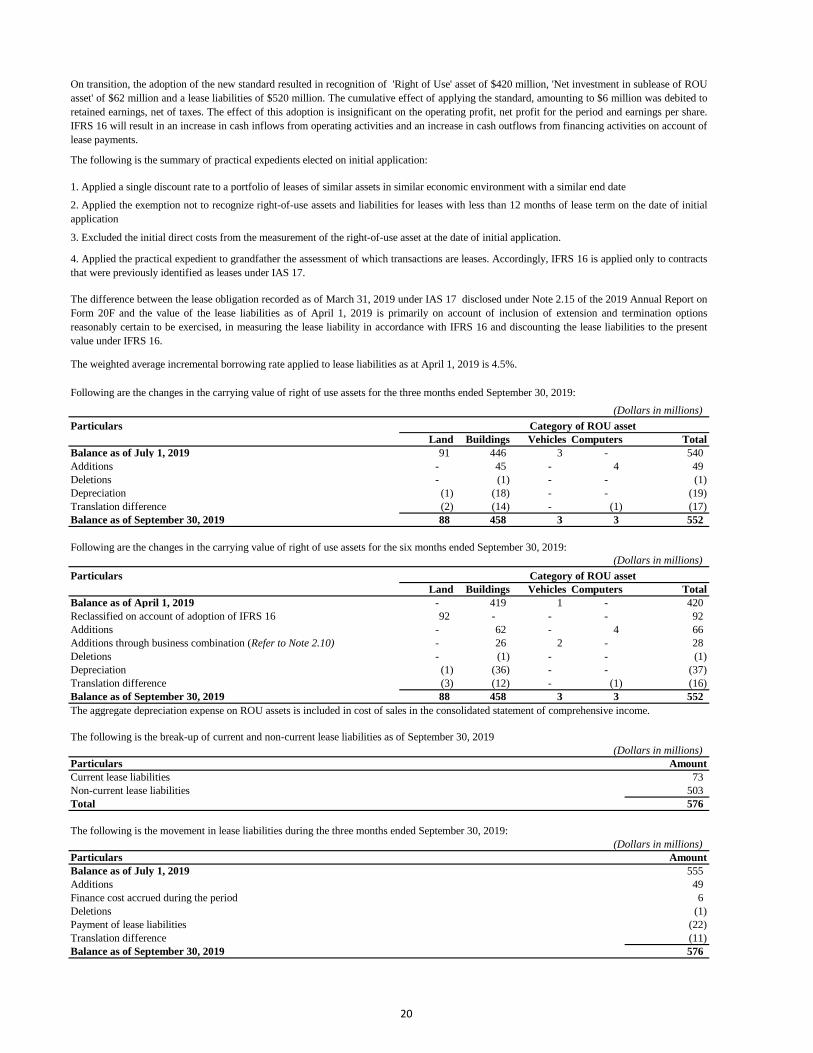
(Dollars in millions)
Particulars
Land Buildings Vehicles Computers Total
Balance as of July 1, 2019 91 446 3 - 540
Additions - 45 - 4 49
Deletions - (1) - - (1)
Depreciation (1) (18) - - (19)
Translation difference (2) (14) - (1) (17)
Balance as of September 30, 2019 88 458 3 3 552
(Dollars in millions)
Particulars
Land Buildings Vehicles Computers Total
Balance as of April 1, 2019 - 419 1 - 420
Reclassified on account of adoption of IFRS 16 92 - - - 92
Additions - 62 - 4 66
Additions through business combination (Refer to Note 2.10) - 26 2 - 28
Deletions - (1) - - (1)
Depreciation (1) (36) - - (37)
Translation difference (3) (12) - (1) (16)
Balance as of September 30, 2019 88 458 3 3 552
The following is the break-up of current and non-current lease liabilities as of September 30, 2019
(Dollars in millions)
Particulars Amount
Current lease liabilities 73
Non-current lease liabilities 503
Total 576
The following is the movement in lease liabilities during the three months ended September 30, 2019:
(Dollars in millions)
Particulars Amount
Balance as of July 1, 2019 555
Additions 49
Finance cost accrued during the period 6
Deletions (1)
Payment of lease liabilities (22)
Translation difference (11)
Balance as of September 30, 2019 576
On transition, the adoption of the new standard resulted in recognition of 'Right of Use' asset of $420 million, 'Net investment in sublease of ROU
asset' of $62 million and a lease liabilities of $520 million. The cumulative effect of applying the standard, amounting to $6 million was debited to
retained earnings, net of taxes. The effect of this adoption is insignificant on the operating profit, net profit for the period and earnings per share.
IFRS 16 will result in an increase in cash inflows from operating activities and an increase in cash outflows from financing activities on account of
lease payments.
The following is the summary of practical expedients elected on initial application:
1. Applied a single discount rate to a portfolio of leases of similar assets in similar economic environment with a similar end date
2. Applied the exemption not to recognize right-of-use assets and liabilities for leases with less than 12 months of lease term on the date of initial
application
3. Excluded the initial direct costs from the measurement of the right-of-use asset at the date of initial application.
4. Applied the practical expedient to grandfather the assessment of which transactions are leases. Accordingly, IFRS 16 is applied only to contracts
that were previously identified as leases under IAS 17.
The difference between the lease obligation recorded as of March 31, 2019 under IAS 17 disclosed under Note 2.15 of the 2019 Annual Report on
Form 20F and the value of the lease liabilities as of April 1, 2019 is primarily on account of inclusion of extension and termination options
reasonably certain to be exercised, in measuring the lease liability in accordance with IFRS 16 and discounting the lease liabilities to the present
value under IFRS 16.
The weighted average incremental borrowing rate applied to lease liabilities as at April 1, 2019 is 4.5%.
Following are the changes in the carrying value of right of use assets for the three months ended September 30, 2019:
Category of ROU asset
The aggregate depreciation expense on ROU assets is included in cost of sales in the consolidated statement of comprehensive income.
Following are the changes in the carrying value of right of use assets for the six months ended September 30, 2019:
Category of ROU asset
20
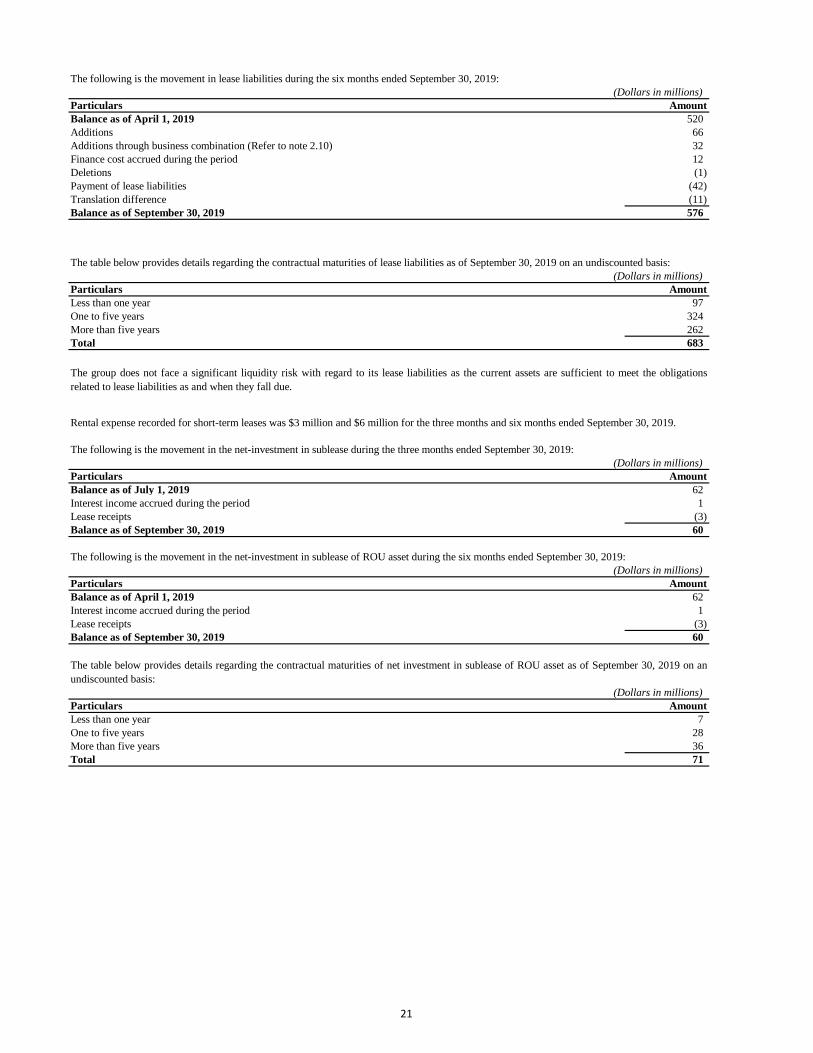
The following is the movement in lease liabilities during the six months ended September 30, 2019:
(Dollars in millions)
Particulars Amount
Balance as of April 1, 2019 520
Additions 66
Additions through business combination (Refer to note 2.10) 32
Finance cost accrued during the period 12
Deletions (1)
Payment of lease liabilities (42)
Translation difference (11)
Balance as of September 30, 2019 576
(Dollars in millions)
Particulars Amount
Less than one year 97
One to five years 324
More than five years 262
Total 683
(Dollars in millions)
Particulars Amount
Balance as of July 1, 2019 62
Interest income accrued during the period 1
Lease receipts (3)
Balance as of September 30, 2019 60
(Dollars in millions)
Particulars Amount
Balance as of April 1, 2019 62
Interest income accrued during the period 1
Lease receipts (3)
Balance as of September 30, 2019 60
(Dollars in millions)
Particulars Amount
Less than one year 7
One to five years 28
More than five years 36
Total 71
The following is the movement in the net-investment in sublease of ROU asset during the six months ended September 30, 2019:
The following is the movement in the net-investment in sublease during the three months ended September 30, 2019:
Rental expense recorded for short-term leases was $3 million and $6 million for the three months and six months ended September 30, 2019.
The table below provides details regarding the contractual maturities of net investment in sublease of ROU asset as of September 30, 2019 on an
undiscounted basis:
The group does not face a significant liquidity risk with regard to its lease liabilities as the current assets are sufficient to meet the obligations
related to lease liabilities as and when they fall due.
The table below provides details regarding the contractual maturities of lease liabilities as of September 30, 2019 on an undiscounted basis:
21
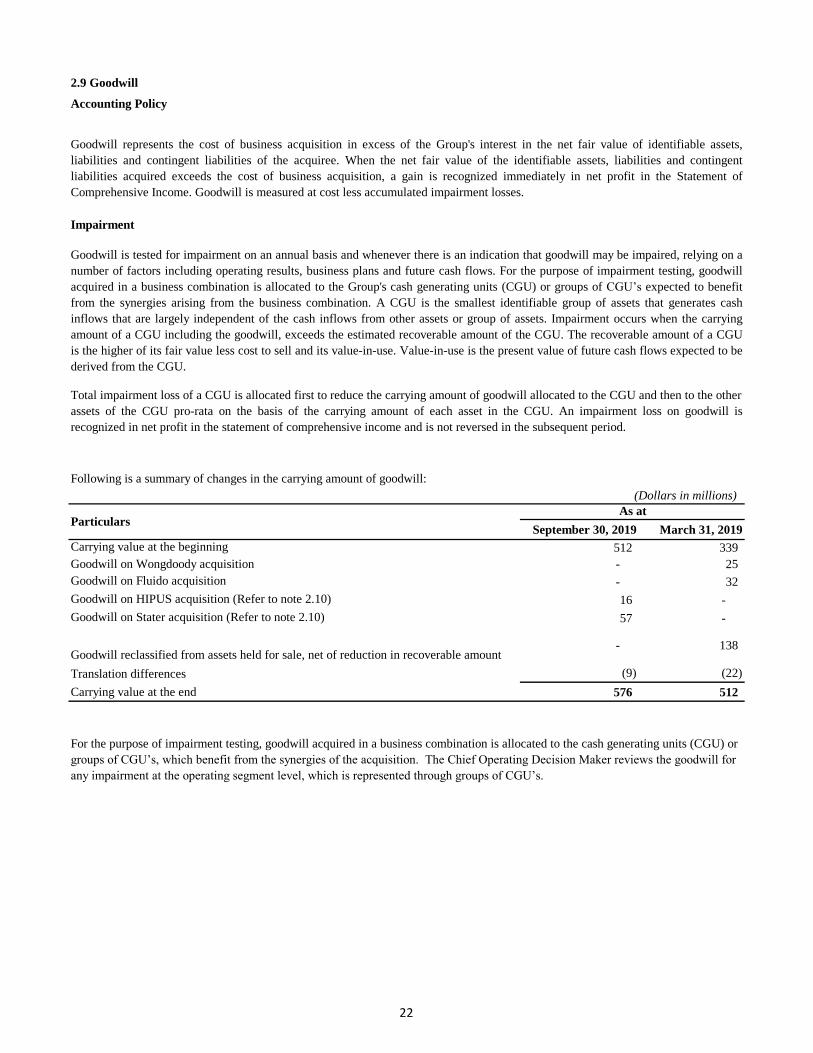
2.9 Goodwill
Accounting Policy
Following is a summary of changes in the carrying amount of goodwill:
(Dollars in millions)
September 30, 2019 March 31, 2019
Carrying value at the beginning 512 339
Goodwill on Wongdoody acquisition - 25
Goodwill on Fluido acquisition - 32
Goodwill on HIPUS acquisition (Refer to note 2.10) 16 -
Goodwill on Stater acquisition (Refer to note 2.10) 57 -
- 138
Translation differences (9) (22)
Carrying value at the end 576 512
For the purpose of impairment testing, goodwill acquired in a business combination is allocated to the cash generating units (CGU) or
groups of CGU’s, which benefit from the synergies of the acquisition. The Chief Operating Decision Maker reviews the goodwill for
any impairment at the operating segment level, which is represented through groups of CGU’s.
Goodwill represents the cost of business acquisition in excess of the Group's interest in the net fair value of identifiable assets,
liabilities and contingent liabilities of the acquiree. When the net fair value of the identifiable assets, liabilities and contingent
liabilities acquired exceeds the cost of business acquisition, a gain is recognized immediately in net profit in the Statement of
Comprehensive Income. Goodwill is measured at cost less accumulated impairment losses.
Impairment
Goodwill is tested for impairment on an annual basis and whenever there is an indication that goodwill may be impaired, relying on a
number of factors including operating results, business plans and future cash flows. For the purpose of impairment testing, goodwill
acquired in a business combination is allocated to the Group's cash generating units (CGU) or groups of CGU’s expected to benefit
from the synergies arising from the business combination. A CGU is the smallest identifiable group of assets that generates cash
inflows that are largely independent of the cash inflows from other assets or group of assets. Impairment occurs when the carrying
amount of a CGU including the goodwill, exceeds the estimated recoverable amount of the CGU. The recoverable amount of a CGU
is the higher of its fair value less cost to sell and its value-in-use. Value-in-use is the present value of future cash flows expected to be
derived from the CGU.
Total impairment loss of a CGU is allocated first to reduce the carrying amount of goodwill allocated to the CGU and then to the other
assets of the CGU pro-rata on the basis of the carrying amount of each asset in the CGU. An impairment loss on goodwill is
recognized in net profit in the statement of comprehensive income and is not reversed in the subsequent period.
ParticularsAs at
Goodwill reclassified from assets held for sale, net of reduction in recoverable amount
22
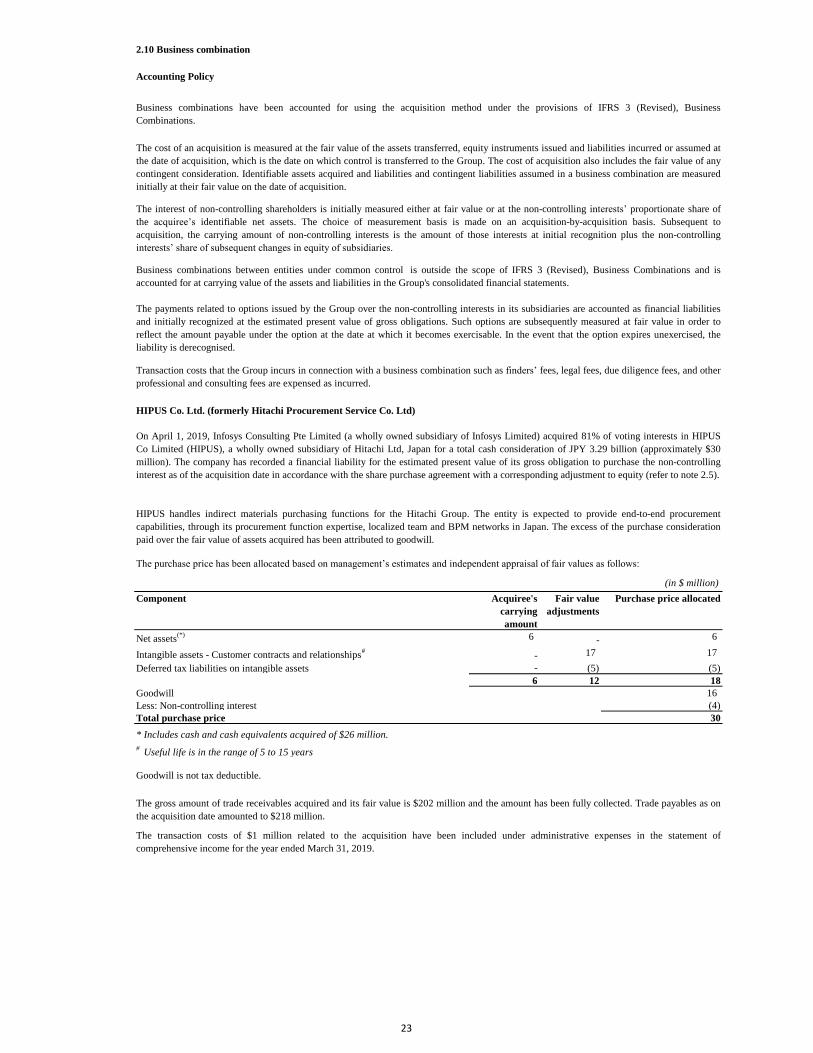
2.10 Business combination
Accounting Policy
HIPUS Co. Ltd. (formerly Hitachi Procurement Service Co. Ltd)
(in $ million)
Net assets(*) 6 - 6
Intangible assets - Customer contracts and relationships#
- 17 17
Deferred tax liabilities on intangible assets - (5) (5)
6 12 18
Goodwill 16
Less: Non-controlling interest (4)
Total purchase price 30
* Includes cash and cash equivalents acquired of $26 million.
# Useful life is in the range of 5 to 15 years
The transaction costs of $1 million related to the acquisition have been included under administrative expenses in the statement of
comprehensive income for the year ended March 31, 2019.
Transaction costs that the Group incurs in connection with a business combination such as finders’ fees, legal fees, due diligence fees, and other
professional and consulting fees are expensed as incurred.
HIPUS handles indirect materials purchasing functions for the Hitachi Group. The entity is expected to provide end-to-end procurement
capabilities, through its procurement function expertise, localized team and BPM networks in Japan. The excess of the purchase consideration
paid over the fair value of assets acquired has been attributed to goodwill.
The purchase price has been allocated based on management’s estimates and independent appraisal of fair values as follows:
Component Acquiree's
carrying
amount
Fair value
adjustments
Purchase price allocated
Goodwill is not tax deductible.
The gross amount of trade receivables acquired and its fair value is $202 million and the amount has been fully collected. Trade payables as on
the acquisition date amounted to $218 million.
Business combinations have been accounted for using the acquisition method under the provisions of IFRS 3 (Revised), Business
Combinations.
The cost of an acquisition is measured at the fair value of the assets transferred, equity instruments issued and liabilities incurred or assumed at
the date of acquisition, which is the date on which control is transferred to the Group. The cost of acquisition also includes the fair value of any
contingent consideration. Identifiable assets acquired and liabilities and contingent liabilities assumed in a business combination are measured
initially at their fair value on the date of acquisition.
Business combinations between entities under common control is outside the scope of IFRS 3 (Revised), Business Combinations and is
accounted for at carrying value of the assets and liabilities in the Group's consolidated financial statements.
The payments related to options issued by the Group over the non-controlling interests in its subsidiaries are accounted as financial liabilities
and initially recognized at the estimated present value of gross obligations. Such options are subsequently measured at fair value in order to
reflect the amount payable under the option at the date at which it becomes exercisable. In the event that the option expires unexercised, the
liability is derecognised.
The interest of non-controlling shareholders is initially measured either at fair value or at the non-controlling interests’ proportionate share of
the acquiree’s identifiable net assets. The choice of measurement basis is made on an acquisition-by-acquisition basis. Subsequent to
acquisition, the carrying amount of non-controlling interests is the amount of those interests at initial recognition plus the non-controlling
interests’ share of subsequent changes in equity of subsidiaries.
On April 1, 2019, Infosys Consulting Pte Limited (a wholly owned subsidiary of Infosys Limited) acquired 81% of voting interests in HIPUS
Co Limited (HIPUS), a wholly owned subsidiary of Hitachi Ltd, Japan for a total cash consideration of JPY 3.29 billion (approximately $30
million). The company has recorded a financial liability for the estimated present value of its gross obligation to purchase the non-controlling
interest as of the acquisition date in accordance with the share purchase agreement with a corresponding adjustment to equity (refer to note 2.5).
23
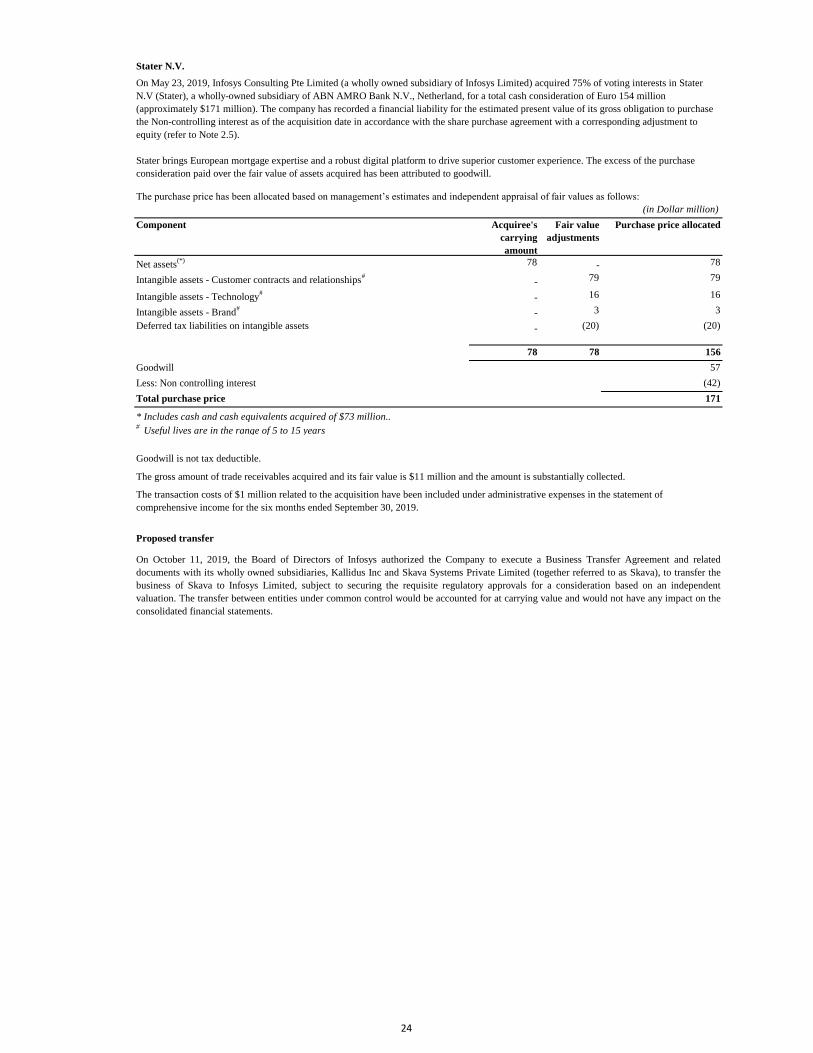
Stater N.V.
(in Dollar million)
Net assets(*) 78 - 78
Intangible assets - Customer contracts and relationships#
- 79 79
Intangible assets - Technology#
- 16 16
Intangible assets - Brand#
- 3 3
Deferred tax liabilities on intangible assets - (20) (20)
78 78 156
Goodwill 57
Less: Non controlling interest (42)
Total purchase price 171
* Includes cash and cash equivalents acquired of $73 million..#
Useful lives are in the range of 5 to 15 years
Proposed transfer
On May 23, 2019, Infosys Consulting Pte Limited (a wholly owned subsidiary of Infosys Limited) acquired 75% of voting interests in Stater
N.V (Stater), a wholly-owned subsidiary of ABN AMRO Bank N.V., Netherland, for a total cash consideration of Euro 154 million
(approximately $171 million). The company has recorded a financial liability for the estimated present value of its gross obligation to purchase
the Non-controlling interest as of the acquisition date in accordance with the share purchase agreement with a corresponding adjustment to
equity (refer to Note 2.5).
Stater brings European mortgage expertise and a robust digital platform to drive superior customer experience. The excess of the purchase
consideration paid over the fair value of assets acquired has been attributed to goodwill.
On October 11, 2019, the Board of Directors of Infosys authorized the Company to execute a Business Transfer Agreement and related
documents with its wholly owned subsidiaries, Kallidus Inc and Skava Systems Private Limited (together referred to as Skava), to transfer the
business of Skava to Infosys Limited, subject to securing the requisite regulatory approvals for a consideration based on an independent
valuation. The transfer between entities under common control would be accounted for at carrying value and would not have any impact on the
consolidated financial statements.
The transaction costs of $1 million related to the acquisition have been included under administrative expenses in the statement of
comprehensive income for the six months ended September 30, 2019.
Goodwill is not tax deductible.
The gross amount of trade receivables acquired and its fair value is $11 million and the amount is substantially collected.
The purchase price has been allocated based on management’s estimates and independent appraisal of fair values as follows:
Component Acquiree's
carrying
amount
Fair value
adjustments
Purchase price allocated
24
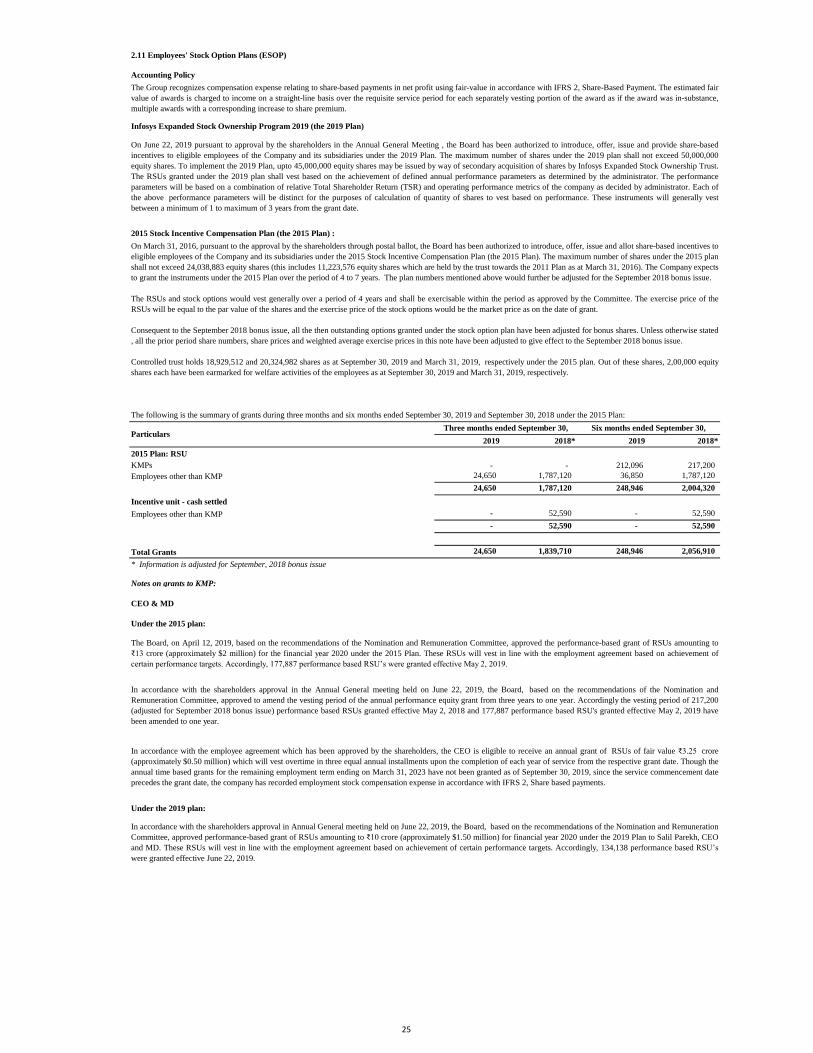
2.11 Employees' Stock Option Plans (ESOP)
Accounting Policy
2019 2018* 2019 2018*
2015 Plan: RSU
KMPs - - 212,096 217,200
Employees other than KMP 24,650 1,787,120 36,850 1,787,120
24,650 1,787,120 248,946 2,004,320
Incentive unit - cash settled
Employees other than KMP - 52,590 - 52,590
- 52,590 - 52,590
Total Grants 24,650 1,839,710 248,946 2,056,910
* Information is adjusted for September, 2018 bonus issue
Notes on grants to KMP:
CEO & MD
Under the 2015 plan:
In accordance with the shareholders approval in the Annual General meeting held on June 22, 2019, the Board, based on the recommendations of the Nomination and
Remuneration Committee, approved to amend the vesting period of the annual performance equity grant from three years to one year. Accordingly the vesting period of 217,200
(adjusted for September 2018 bonus issue) performance based RSUs granted effective May 2, 2018 and 177,887 performance based RSU's granted effective May 2, 2019 have
been amended to one year.
In accordance with the employee agreement which has been approved by the shareholders, the CEO is eligible to receive an annual grant of RSUs of fair value ₹3.25 crore
(approximately $0.50 million) which will vest overtime in three equal annual installments upon the completion of each year of service from the respective grant date. Though the
annual time based grants for the remaining employment term ending on March 31, 2023 have not been granted as of September 30, 2019, since the service commencement date
precedes the grant date, the company has recorded employment stock compensation expense in accordance with IFRS 2, Share based payments.
The Group recognizes compensation expense relating to share-based payments in net profit using fair-value in accordance with IFRS 2, Share-Based Payment. The estimated fair
value of awards is charged to income on a straight-line basis over the requisite service period for each separately vesting portion of the award as if the award was in-substance,
multiple awards with a corresponding increase to share premium.
Infosys Expanded Stock Ownership Program 2019 (the 2019 Plan)
On June 22, 2019 pursuant to approval by the shareholders in the Annual General Meeting , the Board has been authorized to introduce, offer, issue and provide share-based
incentives to eligible employees of the Company and its subsidiaries under the 2019 Plan. The maximum number of shares under the 2019 plan shall not exceed 50,000,000
equity shares. To implement the 2019 Plan, upto 45,000,000 equity shares may be issued by way of secondary acquisition of shares by Infosys Expanded Stock Ownership Trust.
The RSUs granted under the 2019 plan shall vest based on the achievement of defined annual performance parameters as determined by the administrator. The performance
parameters will be based on a combination of relative Total Shareholder Return (TSR) and operating performance metrics of the company as decided by administrator. Each of
the above performance parameters will be distinct for the purposes of calculation of quantity of shares to vest based on performance. These instruments will generally vest
between a minimum of 1 to maximum of 3 years from the grant date.
Six months ended September 30,
2015 Stock Incentive Compensation Plan (the 2015 Plan) :
On March 31, 2016, pursuant to the approval by the shareholders through postal ballot, the Board has been authorized to introduce, offer, issue and allot share-based incentives to
eligible employees of the Company and its subsidiaries under the 2015 Stock Incentive Compensation Plan (the 2015 Plan). The maximum number of shares under the 2015 plan
shall not exceed 24,038,883 equity shares (this includes 11,223,576 equity shares which are held by the trust towards the 2011 Plan as at March 31, 2016). The Company expects
to grant the instruments under the 2015 Plan over the period of 4 to 7 years. The plan numbers mentioned above would further be adjusted for the September 2018 bonus issue.
The RSUs and stock options would vest generally over a period of 4 years and shall be exercisable within the period as approved by the Committee. The exercise price of the
RSUs will be equal to the par value of the shares and the exercise price of the stock options would be the market price as on the date of grant.
Consequent to the September 2018 bonus issue, all the then outstanding options granted under the stock option plan have been adjusted for bonus shares. Unless otherwise stated
, all the prior period share numbers, share prices and weighted average exercise prices in this note have been adjusted to give effect to the September 2018 bonus issue.
Controlled trust holds 18,929,512 and 20,324,982 shares as at September 30, 2019 and March 31, 2019, respectively under the 2015 plan. Out of these shares, 2,00,000 equity
shares each have been earmarked for welfare activities of the employees as at September 30, 2019 and March 31, 2019, respectively.
The following is the summary of grants during three months and six months ended September 30, 2019 and September 30, 2018 under the 2015 Plan:
ParticularsThree months ended September 30,
Under the 2019 plan:
In accordance with the shareholders approval in Annual General meeting held on June 22, 2019, the Board, based on the recommendations of the Nomination and Remuneration
Committee, approved performance-based grant of RSUs amounting to ₹10 crore (approximately $1.50 million) for financial year 2020 under the 2019 Plan to Salil Parekh, CEO
and MD. These RSUs will vest in line with the employment agreement based on achievement of certain performance targets. Accordingly, 134,138 performance based RSU’s
were granted effective June 22, 2019.
The Board, on April 12, 2019, based on the recommendations of the Nomination and Remuneration Committee, approved the performance-based grant of RSUs amounting to
₹13 crore (approximately $2 million) for the financial year 2020 under the 2015 Plan. These RSUs will vest in line with the employment agreement based on achievement of
certain performance targets. Accordingly, 177,887 performance based RSU’s were granted effective May 2, 2019.
25
(Dollars in millions)
2019 2018 2019 2018
Granted to:
KMP 2 2 4 3
Employees other than KMP 6 6 13 11
Total (1) 8 8 17 14
- - - -
The fair value of each equity settled award is estimated on the date of grant using the Black-Scholes-Merton model with the following assumptions:
Fiscal 2020-
Equity Shares-
RSU
Fiscal 2020-
ADS-RSU
Fiscal 2019-
Equity Shares-
RSU
Fiscal 2019-
ADS-RSU
Weighted average share price (₹) / ($ ADS)(1) 732 11.00 696 10.77
Exercise price (₹)/ ($ADS)(1) 5.00 0.07 3.31 0.06
Expected volatility (%) 22-24 22-26 21-25 22-26
Expected life of the option (years) 1-4 1-4 1-4 1-4
Expected dividends (%) 2-3 2-3 2.65 2.65
Risk-free interest rate (%) 6-7 1-3 7-8 2-3
Weighted average fair value as on grant date (₹) / ($ADS)(1) 676 10.43 648 10.03
(1)Fiscal 2019 values are adjusted for September 2018 bonus issue wherever applicable
2.12 Income taxes
Accounting policy
(Dollars in millions)
2019 2018 2019 2018
Current taxes
Domestic taxes 151 172 309 338
Foreign taxes 60 56 112 104
211 228 421 442
Deferred taxes
Domestic taxes 5 (5) 4 (4)
Foreign taxes (9) (7) (22) (18)
(4) (12) (18) (22)
Income tax expense 207 216 403 420
Particulars
COO and Whole time director
Six months ended September 30,
For options granted in
Three months ended September 30,
(1) Cash settled stock compensation expense included in the above
Break-up of employee stock compensation expense
Three months ended September 30,
In accordance with the shareholders approval in Annual General meeting held on June 22, 2019, the Board, based on the recommendations of the Nomination and Remuneration
Committee, approved performance-based grant of RSUs amounting to ₹4 crore (approximately $0.50 million) for financial year 2020 under the 2019 Plan to U. B. Pravin Rao,
COO and WTD. These RSUs will vest in line with the employment agreement based on achievement of certain performance targets. Accordingly, 53,655 performance based
RSU’s were granted effective June 22, 2019
Other KMP
Based on the recommendations of the Nomination and Remuneration Committee, the Board , approved performance-based grant of 10,263 RSUs and time based grant of 23,946
RSUs to other KMP under the 2015 Plan during the six months ended September 30, 2019.The grants were made effective May 2, 2019. These RSUs will vest generally over
three to four years and additionally the performance based RSUs will vest based on achievement of certain performance targets.
Deferred income tax assets and liabilities are measured using tax rates and tax laws that have been enacted or substantively enacted by the Balance Sheet date and are expected to
apply to taxable income in the years in which those temporary differences are expected to be recovered or settled. The effect of changes in tax rates on deferred income tax assets
and liabilities is recognized as income or expense in the period that includes the enactment or the substantive enactment date. A deferred income tax asset is recognized to the
extent that it is probable that future taxable profit will be available against which the deductible temporary differences and tax losses can be utilized. Deferred income taxes are
not provided on the undistributed earnings of subsidiaries and branches where it is expected that the earnings of the subsidiary or branch will not be distributed in the foreseeable
future.
The Group offsets current tax assets and current tax liabilities, where it has a legally enforceable right to set off the recognized amounts and where it intends either to settle on a
net basis, or to realize the asset and settle the liability simultaneously. The income tax provision for the interim period is made based on the best estimate of the annual average
tax rate expected to be applicable for the full financial year. Tax benefits of deductions earned on exercise of employee share options in excess of compensation charged to
income are credited to share premium.
Particulars
Particulars
Income tax expense in the consolidated statement of comprehensive income comprises:
Six months ended September 30,
The expected life of the RSU / ESOP is estimated based on the vesting term and contractual term of the RSU / ESOP, as well as expected exercise behavior of the employee who
receives the RSU / ESOP. Expected volatility during the expected term of the RSU / ESOP is based on historical volatility of the observed market prices of the Company's
publicly traded equity shares during a period equivalent to the expected term of the RSU / ESOP.
Income tax expense comprises current and deferred income tax. Income tax expense is recognized in net profit in the consolidated statement of comprehensive income except to
the extent that it relates to items recognized directly in equity, in which case it is recognized in other comprehensive income. Current income tax for current and prior periods is
recognized at the amount expected to be paid to or recovered from the tax authorities, using the tax rates and tax laws that have been enacted or substantively enacted by the
Balance Sheet date. Deferred income tax assets and liabilities are recognized for all temporary differences arising between the tax bases of assets and liabilities and their carrying
amounts in the financial statements except when the deferred income tax arises from the initial recognition of goodwill or an asset or liability in a transaction that is not a business
combination and affects neither accounting nor taxable profit or loss at the time of the transaction. Deferred tax assets are reviewed at each reporting date and are reduced to the
extent that it is no longer probable that the related tax benefit will be realized.
26
(Dollars in millions)
2019 2018 2019 2018
Profit before income taxes 779 797 1,521 1,536
Enacted tax rates in India 34.94% 34.94% 34.94% 34.94%
Computed expected tax expense 273 279 532 537
Tax effect due to non-taxable income for Indian tax purposes (86) (94) (168) (184)
Overseas taxes 31 32 58 62
Tax provision (reversals) (11) - (17) (9)
Effect of differential overseas tax rates (2) 1 (3) (1)
Effect of exempt non operating income (1) (1) (3) (5)
Effect of unrecognized deferred tax assets 5 3 7 8
Effect of non-deductible expenses 3 (2) 6 17
Branch profit tax (net of credits) (4) (4) (8) (8)
Others (1) 2 (1) 3
Income tax expense 207 216 403 420
2.13 Reconciliation of basic and diluted shares used in computing earnings per share
Accounting Policy
Income tax expense for the three months ended September 30, 2019 and September 30, 2018 includes reversal (net of provisions) of $11 million and reversal (net of provisions)
of less than $1 million , respectively. Income tax expense for the six months ended September 30, 2019 and September 30, 2018 includes reversal (net of provisions) of $17
million and reversal (net of provisions) of $9 million respectively. These reversal (net of provisions) pertain to prior periods on account of adjudication of certain disputed matters
in favor of the Group across various jurisdictions.
The applicable Indian corporate statutory tax rate for the three months and six months ended September 30, 2019 and September 30, 2018 is 34.94% each.
A reconciliation of the income tax provision to the amount computed by applying the statutory income tax rate to the income before income taxes is summarized below:
As at September 30, 2019, claims against the Group not acknowledged as debts from the Indian Income tax authorities amounted to ₹2,866 crore ($404 million). Amount paid to
statutory authorities against this amounted to ₹5,909 crore ($834 million).
As at March 31, 2019, claims against the Group not acknowledged as debts from the Income tax authorities amounted to ₹2,851 crore ($412 million). Amount paid to statutory
authorities against the above tax claims amounted to ₹5,924 crore ($857 million).
These matters are pending before various Appellate Authorities and the management including its tax advisors expect that its position will likely be upheld on ultimate resolution
and will not have a material adverse effect on the Group's financial position and results of operations.
Basic earnings per equity share is computed by dividing the net profit attributable to the equity holders of the company by the weighted average number of equity shares
outstanding during the period. Diluted earnings per equity share is computed by dividing the net profit attributable to the equity holders of the company by the weighted average
number of equity shares considered for deriving basic earnings per equity share and also the weighted average number of equity shares that could have been issued upon
conversion of all dilutive potential equity shares. The dilutive potential equity shares are adjusted for the proceeds receivable had the equity shares been actually issued at fair
value (i.e. the average market value of the outstanding equity shares). Dilutive potential equity shares are deemed converted as of the beginning of the period, unless issued at a
later date. Dilutive potential equity shares are determined independently for each period presented.
The number of equity shares and potentially dilutive equity shares are adjusted retrospectively for all periods presented for any share splits and bonus shares issues including for
changes effected prior to the approval of the financial statements by the Board of Directors.
Deferred income tax for the three months and six months ended September 30, 2019 and September 30, 2018 substantially relates to origination and reversal of temporary
differences.
Six months ended September 30,Particulars
Three months ended September 30,
27
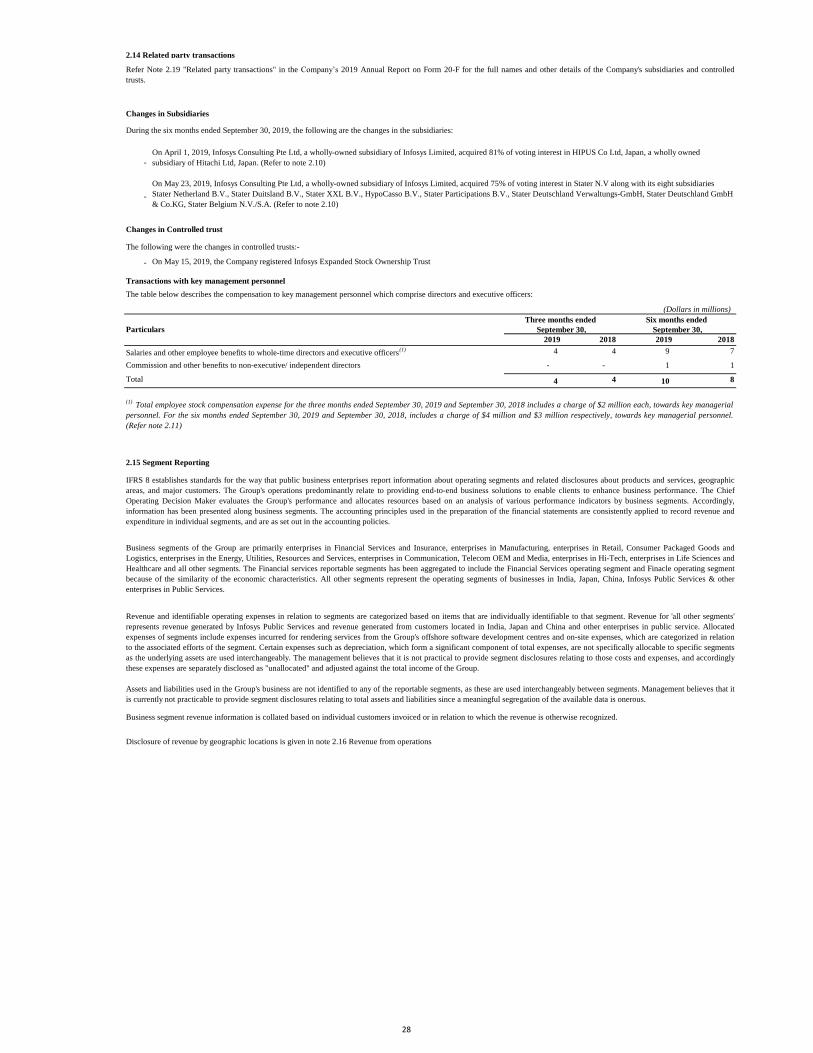
2.14 Related party transactions
Changes in Subsidiaries
During the six months ended September 30, 2019, the following are the changes in the subsidiaries:
-
-
Changes in Controlled trust
-
Transactions with key management personnel
(Dollars in millions)
2019 2018 2019 2018
4 4 9 7
Commission and other benefits to non-executive/ independent directors - - 1 1
Total 4 4 10 8
2.15 Segment Reporting
Disclosure of revenue by geographic locations is given in note 2.16 Revenue from operations
Refer Note 2.19 "Related party transactions" in the Company’s 2019 Annual Report on Form 20-F for the full names and other details of the Company's subsidiaries and controlled
trusts.
The following were the changes in controlled trusts:-
On May 23, 2019, Infosys Consulting Pte Ltd, a wholly-owned subsidiary of Infosys Limited, acquired 75% of voting interest in Stater N.V along with its eight subsidiaries
Stater Netherland B.V., Stater Duitsland B.V., Stater XXL B.V., HypoCasso B.V., Stater Participations B.V., Stater Deutschland Verwaltungs-GmbH, Stater Deutschland GmbH
& Co.KG, Stater Belgium N.V./S.A. (Refer to note 2.10)
On April 1, 2019, Infosys Consulting Pte Ltd, a wholly-owned subsidiary of Infosys Limited, acquired 81% of voting interest in HIPUS Co Ltd, Japan, a wholly owned
subsidiary of Hitachi Ltd, Japan. (Refer to note 2.10)
Business segment revenue information is collated based on individual customers invoiced or in relation to which the revenue is otherwise recognized.
IFRS 8 establishes standards for the way that public business enterprises report information about operating segments and related disclosures about products and services, geographic
areas, and major customers. The Group's operations predominantly relate to providing end-to-end business solutions to enable clients to enhance business performance. The Chief
Operating Decision Maker evaluates the Group's performance and allocates resources based on an analysis of various performance indicators by business segments. Accordingly,
information has been presented along business segments. The accounting principles used in the preparation of the financial statements are consistently applied to record revenue and
expenditure in individual segments, and are as set out in the accounting policies.
Salaries and other employee benefits to whole-time directors and executive officers(1)
The table below describes the compensation to key management personnel which comprise directors and executive officers:
(1)Total employee stock compensation expense for the three months ended September 30, 2019 and September 30, 2018 includes a charge of $2 million each, towards key managerial
personnel. For the six months ended September 30, 2019 and September 30, 2018, includes a charge of $4 million and $3 million respectively, towards key managerial personnel.
(Refer note 2.11)
Particulars
Six months ended
On May 15, 2019, the Company registered Infosys Expanded Stock Ownership Trust
Three months ended
September 30, September 30,
Business segments of the Group are primarily enterprises in Financial Services and Insurance, enterprises in Manufacturing, enterprises in Retail, Consumer Packaged Goods and
Logistics, enterprises in the Energy, Utilities, Resources and Services, enterprises in Communication, Telecom OEM and Media, enterprises in Hi-Tech, enterprises in Life Sciences and
Healthcare and all other segments. The Financial services reportable segments has been aggregated to include the Financial Services operating segment and Finacle operating segment
because of the similarity of the economic characteristics. All other segments represent the operating segments of businesses in India, Japan, China, Infosys Public Services & other
enterprises in Public Services.
Assets and liabilities used in the Group's business are not identified to any of the reportable segments, as these are used interchangeably between segments. Management believes that it
is currently not practicable to provide segment disclosures relating to total assets and liabilities since a meaningful segregation of the available data is onerous.
Revenue and identifiable operating expenses in relation to segments are categorized based on items that are individually identifiable to that segment. Revenue for 'all other segments'
represents revenue generated by Infosys Public Services and revenue generated from customers located in India, Japan and China and other enterprises in public service. Allocated
expenses of segments include expenses incurred for rendering services from the Group's offshore software development centres and on-site expenses, which are categorized in relation
to the associated efforts of the segment. Certain expenses such as depreciation, which form a significant component of total expenses, are not specifically allocable to specific segments
as the underlying assets are used interchangeably. The management believes that it is not practical to provide segment disclosures relating to those costs and expenses, and accordingly
these expenses are separately disclosed as "unallocated" and adjusted against the total income of the Group.
28
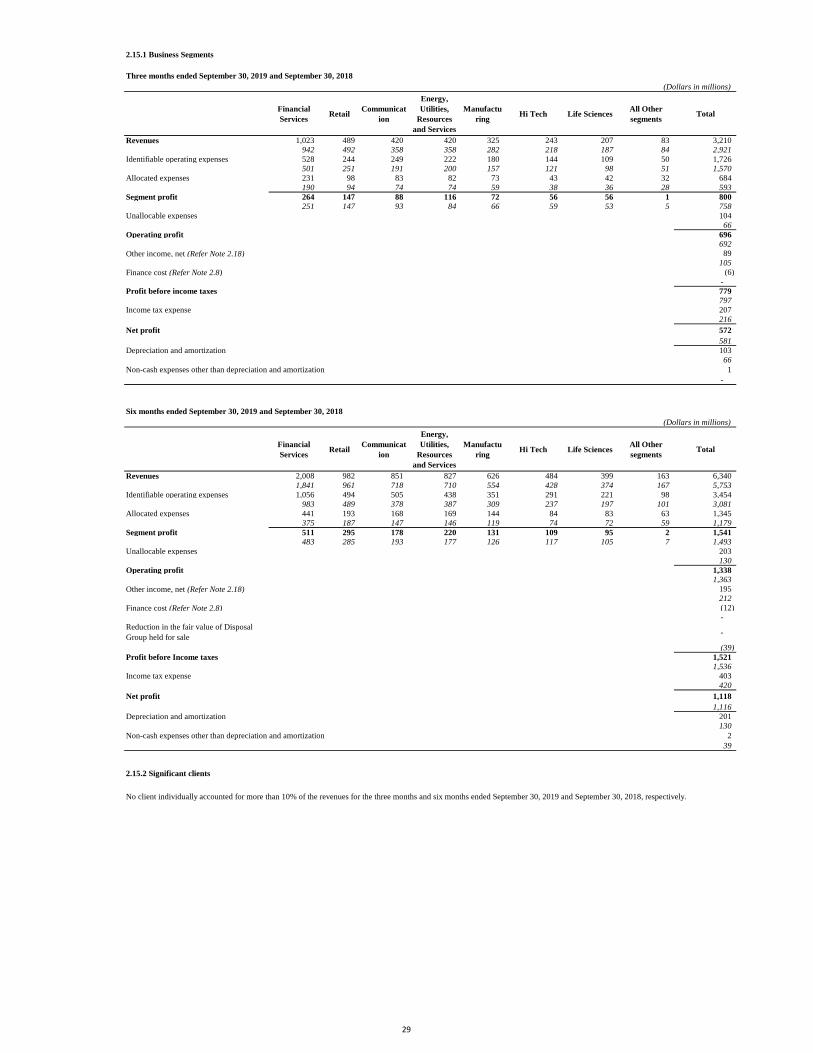
2.15.1 Business Segments
Three months ended September 30, 2019 and September 30, 2018
(Dollars in millions)
Financial
ServicesRetail
Communicat
ion
Energy,
Utilities,
Resources
and Services
Manufactu
ringHi Tech Life Sciences
All Other
segmentsTotal
Revenues 1,023 489 420 420 325 243 207 83 3,210
942 492 358 358 282 218 187 84 2,921
Identifiable operating expenses 528 244 249 222 180 144 109 50 1,726
501 251 191 200 157 121 98 51 1,570
Allocated expenses 231 98 83 82 73 43 42 32 684
190 94 74 74 59 38 36 28 593
Segment profit 264 147 88 116 72 56 56 1 800
251 147 93 84 66 59 53 5 758
Unallocable expenses 104
66
Operating profit 696
692
Other income, net (Refer Note 2.18) 89
105
Finance cost (Refer Note 2.8) (6)
-
Profit before income taxes 779
797
Income tax expense 207
216
Net profit 572
581
Depreciation and amortization 103
66
Non-cash expenses other than depreciation and amortization 1
-
Six months ended September 30, 2019 and September 30, 2018
(Dollars in millions)
Financial
ServicesRetail
Communicat
ion
Energy,
Utilities,
Resources
and Services
Manufactu
ringHi Tech Life Sciences
All Other
segmentsTotal
Revenues 2,008 982 851 827 626 484 399 163 6,340
1,841 961 718 710 554 428 374 167 5,753
Identifiable operating expenses 1,056 494 505 438 351 291 221 98 3,454
983 489 378 387 309 237 197 101 3,081
Allocated expenses 441 193 168 169 144 84 83 63 1,345
375 187 147 146 119 74 72 59 1,179
Segment profit 511 295 178 220 131 109 95 2 1,541
483 285 193 177 126 117 105 7 1,493
Unallocable expenses 203
130
Operating profit 1,338
1,363
Other income, net (Refer Note 2.18) 195
212
Finance cost (Refer Note 2.8) (12)
-
-
(39)
Profit before Income taxes 1,521
1,536
Income tax expense 403
420
Net profit 1,118
1,116
Depreciation and amortization 201
130
Non-cash expenses other than depreciation and amortization 2
39
2.15.2 Significant clients
No client individually accounted for more than 10% of the revenues for the three months and six months ended September 30, 2019 and September 30, 2018, respectively.
Reduction in the fair value of Disposal
Group held for sale
29
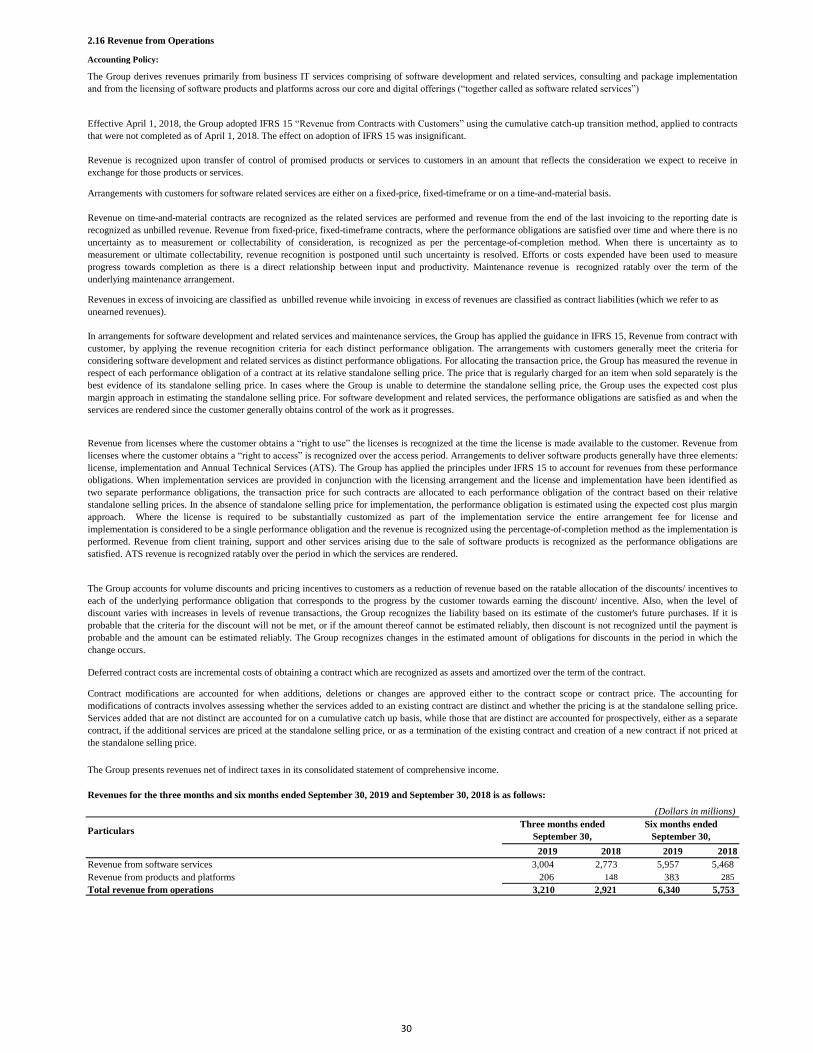
2.16 Revenue from Operations
Accounting Policy:
(Dollars in millions)
Particulars
2019 2018 2019 2018
Revenue from software services 3,004 2,773 5,957 5,468
Revenue from products and platforms 206 148 383 285
Total revenue from operations 3,210 2,921 6,340 5,753
Revenue from licenses where the customer obtains a “right to use” the licenses is recognized at the time the license is made available to the customer. Revenue from
licenses where the customer obtains a “right to access” is recognized over the access period. Arrangements to deliver software products generally have three elements:
license, implementation and Annual Technical Services (ATS). The Group has applied the principles under IFRS 15 to account for revenues from these performance
obligations. When implementation services are provided in conjunction with the licensing arrangement and the license and implementation have been identified as
two separate performance obligations, the transaction price for such contracts are allocated to each performance obligation of the contract based on their relative
standalone selling prices. In the absence of standalone selling price for implementation, the performance obligation is estimated using the expected cost plus margin
approach. Where the license is required to be substantially customized as part of the implementation service the entire arrangement fee for license and
implementation is considered to be a single performance obligation and the revenue is recognized using the percentage-of-completion method as the implementation is
performed. Revenue from client training, support and other services arising due to the sale of software products is recognized as the performance obligations are
satisfied. ATS revenue is recognized ratably over the period in which the services are rendered.
The Group accounts for volume discounts and pricing incentives to customers as a reduction of revenue based on the ratable allocation of the discounts/ incentives to
each of the underlying performance obligation that corresponds to the progress by the customer towards earning the discount/ incentive. Also, when the level of
discount varies with increases in levels of revenue transactions, the Group recognizes the liability based on its estimate of the customer's future purchases. If it is
probable that the criteria for the discount will not be met, or if the amount thereof cannot be estimated reliably, then discount is not recognized until the payment is
probable and the amount can be estimated reliably. The Group recognizes changes in the estimated amount of obligations for discounts in the period in which the
change occurs.
Contract modifications are accounted for when additions, deletions or changes are approved either to the contract scope or contract price. The accounting for
modifications of contracts involves assessing whether the services added to an existing contract are distinct and whether the pricing is at the standalone selling price.
Services added that are not distinct are accounted for on a cumulative catch up basis, while those that are distinct are accounted for prospectively, either as a separate
contract, if the additional services are priced at the standalone selling price, or as a termination of the existing contract and creation of a new contract if not priced at
the standalone selling price.
The Group presents revenues net of indirect taxes in its consolidated statement of comprehensive income.
Deferred contract costs are incremental costs of obtaining a contract which are recognized as assets and amortized over the term of the contract.
Six months ended
September 30,
Revenues for the three months and six months ended September 30, 2019 and September 30, 2018 is as follows:
Three months ended
September 30,
Effective April 1, 2018, the Group adopted IFRS 15 “Revenue from Contracts with Customers” using the cumulative catch-up transition method, applied to contracts
that were not completed as of April 1, 2018. The effect on adoption of IFRS 15 was insignificant.
The Group derives revenues primarily from business IT services comprising of software development and related services, consulting and package implementation
and from the licensing of software products and platforms across our core and digital offerings (“together called as software related services”)
Arrangements with customers for software related services are either on a fixed-price, fixed-timeframe or on a time-and-material basis.
Revenue on time-and-material contracts are recognized as the related services are performed and revenue from the end of the last invoicing to the reporting date is
recognized as unbilled revenue. Revenue from fixed-price, fixed-timeframe contracts, where the performance obligations are satisfied over time and where there is no
uncertainty as to measurement or collectability of consideration, is recognized as per the percentage-of-completion method. When there is uncertainty as to
measurement or ultimate collectability, revenue recognition is postponed until such uncertainty is resolved. Efforts or costs expended have been used to measure
progress towards completion as there is a direct relationship between input and productivity. Maintenance revenue is recognized ratably over the term of the
underlying maintenance arrangement.
In arrangements for software development and related services and maintenance services, the Group has applied the guidance in IFRS 15, Revenue from contract with
customer, by applying the revenue recognition criteria for each distinct performance obligation. The arrangements with customers generally meet the criteria for
considering software development and related services as distinct performance obligations. For allocating the transaction price, the Group has measured the revenue in
respect of each performance obligation of a contract at its relative standalone selling price. The price that is regularly charged for an item when sold separately is the
best evidence of its standalone selling price. In cases where the Group is unable to determine the standalone selling price, the Group uses the expected cost plus
margin approach in estimating the standalone selling price. For software development and related services, the performance obligations are satisfied as and when the
services are rendered since the customer generally obtains control of the work as it progresses.
Revenue is recognized upon transfer of control of promised products or services to customers in an amount that reflects the consideration we expect to receive in
exchange for those products or services.
Revenues in excess of invoicing are classified as unbilled revenue while invoicing in excess of revenues are classified as contract liabilities (which we refer to as
unearned revenues).
30
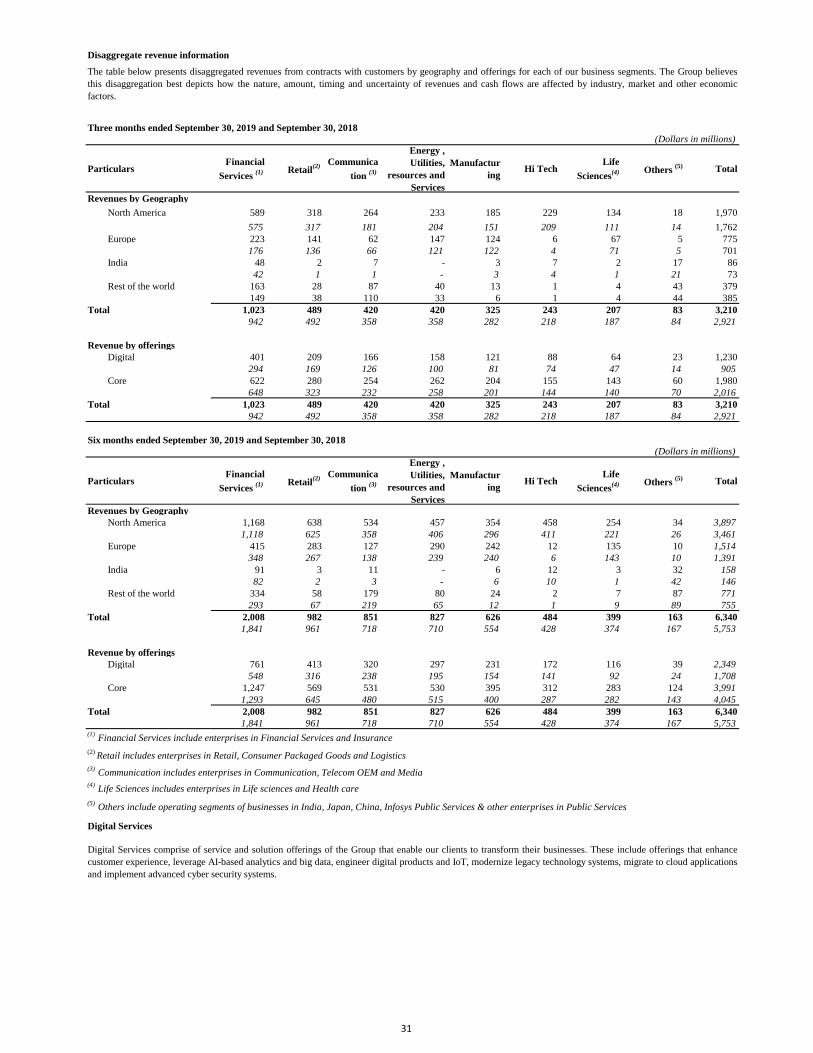
(Dollars in millions)
ParticularsFinancial
Services (1) Retail
(2)Communica
tion (3)
Energy ,
Utilities,
resources and
Services
Manufactur
ingHi Tech
Life
Sciences(4) Others
(5) Total
Revenues by Geography
North America 589 318 264 233 185 229 134 18 1,970
575 317 181 204 151 209 111 14 1,762
Europe 223 141 62 147 124 6 67 5 775
176 136 66 121 122 4 71 5 701
India 48 2 7 - 3 7 2 17 86
42 1 1 - 3 4 1 21 73
Rest of the world 163 28 87 40 13 1 4 43 379
149 38 110 33 6 1 4 44 385
Total 1,023 489 420 420 325 243 207 83 3,210
942 492 358 358 282 218 187 84 2,921
Revenue by offerings
Digital 401 209 166 158 121 88 64 23 1,230
294 169 126 100 81 74 47 14 905
Core 622 280 254 262 204 155 143 60 1,980
648 323 232 258 201 144 140 70 2,016
Total 1,023 489 420 420 325 243 207 83 3,210
942 492 358 358 282 218 187 84 2,921
(Dollars in millions)
ParticularsFinancial
Services (1) Retail
(2)Communica
tion (3)
Energy ,
Utilities,
resources and
Services
Manufactur
ingHi Tech
Life
Sciences(4) Others
(5) Total
Revenues by Geography
North America 1,168 638 534 457 354 458 254 34 3,897
1,118 625 358 406 296 411 221 26 3,461
Europe 415 283 127 290 242 12 135 10 1,514
348 267 138 239 240 6 143 10 1,391
India 91 3 11 - 6 12 3 32 158
82 2 3 - 6 10 1 42 146
Rest of the world 334 58 179 80 24 2 7 87 771
293 67 219 65 12 1 9 89 755
Total 2,008 982 851 827 626 484 399 163 6,340
1,841 961 718 710 554 428 374 167 5,753
Revenue by offerings
Digital 761 413 320 297 231 172 116 39 2,349
548 316 238 195 154 141 92 24 1,708
Core 1,247 569 531 530 395 312 283 124 3,991
1,293 645 480 515 400 287 282 143 4,045
Total 2,008 982 851 827 626 484 399 163 6,340
1,841 961 718 710 554 428 374 167 5,753
Digital Services
(1) Financial Services include enterprises in Financial Services and Insurance
(2) Retail includes enterprises in Retail, Consumer Packaged Goods and Logistics
Disaggregate revenue information
The table below presents disaggregated revenues from contracts with customers by geography and offerings for each of our business segments. The Group believes
this disaggregation best depicts how the nature, amount, timing and uncertainty of revenues and cash flows are affected by industry, market and other economic
factors.
Three months ended September 30, 2019 and September 30, 2018
Six months ended September 30, 2019 and September 30, 2018
(4) Life Sciences includes enterprises in Life sciences and Health care
(3) Communication includes enterprises in Communication, Telecom OEM and Media
(5) Others include operating segments of businesses in India, Japan, China, Infosys Public Services & other enterprises in Public Services
Digital Services comprise of service and solution offerings of the Group that enable our clients to transform their businesses. These include offerings that enhance
customer experience, leverage AI-based analytics and big data, engineer digital products and IoT, modernize legacy technology systems, migrate to cloud applications
and implement advanced cyber security systems.
31
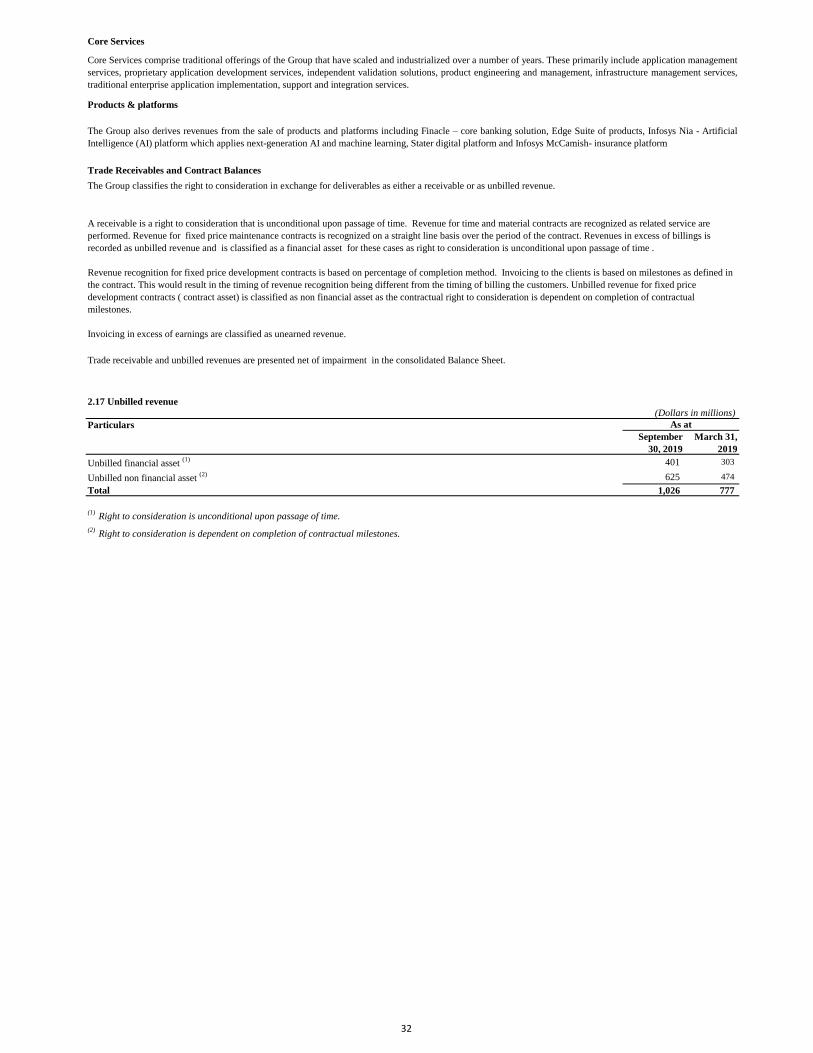
Core Services
Products & platforms
Trade Receivables and Contract Balances
(Dollars in millions)
Particulars
September
30, 2019
March 31,
2019
Unbilled financial asset (1) 401 303
Unbilled non financial asset (2) 625 474
Total 1,026 777
2.17 Unbilled revenue
As at
(1) Right to consideration is unconditional upon passage of time.
(2) Right to consideration is dependent on completion of contractual milestones.
The Group also derives revenues from the sale of products and platforms including Finacle – core banking solution, Edge Suite of products, Infosys Nia - Artificial
Intelligence (AI) platform which applies next-generation AI and machine learning, Stater digital platform and Infosys McCamish- insurance platform
The Group classifies the right to consideration in exchange for deliverables as either a receivable or as unbilled revenue.
A receivable is a right to consideration that is unconditional upon passage of time. Revenue for time and material contracts are recognized as related service are
performed. Revenue for fixed price maintenance contracts is recognized on a straight line basis over the period of the contract. Revenues in excess of billings is
recorded as unbilled revenue and is classified as a financial asset for these cases as right to consideration is unconditional upon passage of time .
Revenue recognition for fixed price development contracts is based on percentage of completion method. Invoicing to the clients is based on milestones as defined in
the contract. This would result in the timing of revenue recognition being different from the timing of billing the customers. Unbilled revenue for fixed price
development contracts ( contract asset) is classified as non financial asset as the contractual right to consideration is dependent on completion of contractual
milestones.
Invoicing in excess of earnings are classified as unearned revenue.
Trade receivable and unbilled revenues are presented net of impairment in the consolidated Balance Sheet.
Core Services comprise traditional offerings of the Group that have scaled and industrialized over a number of years. These primarily include application management
services, proprietary application development services, independent validation solutions, product engineering and management, infrastructure management services,
traditional enterprise application implementation, support and integration services.
32
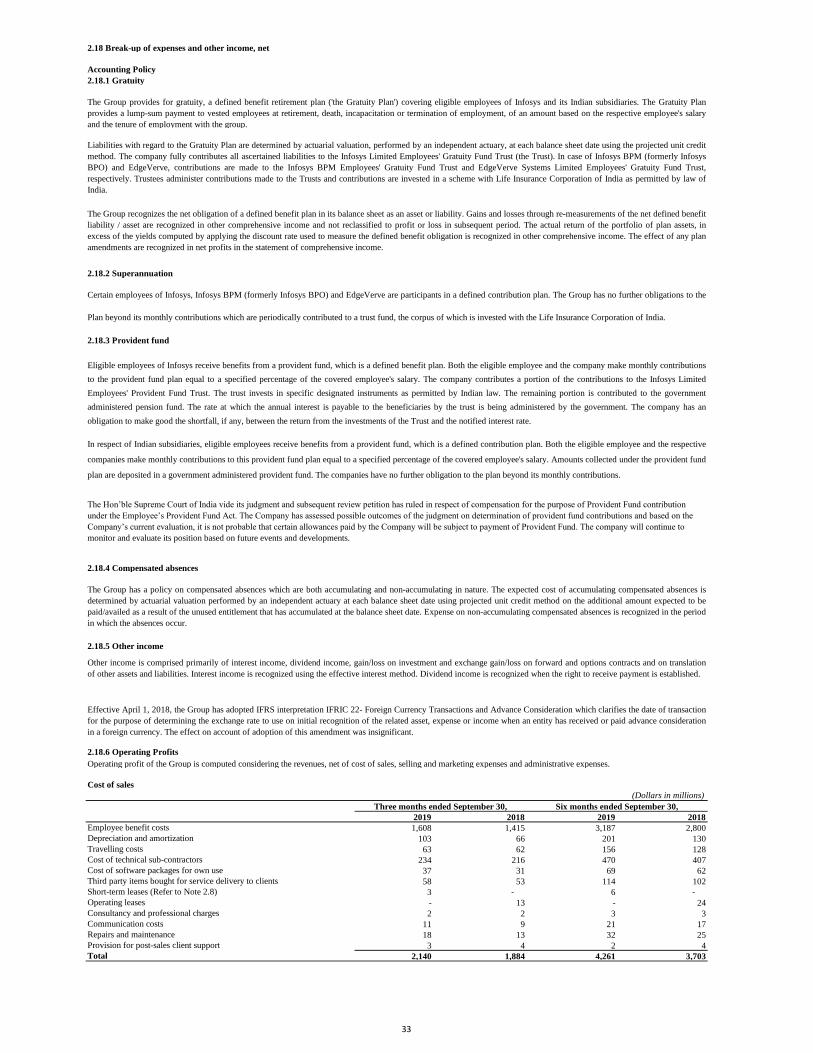
2.18 Break-up of expenses and other income, net
Accounting Policy
Cost of sales
(Dollars in millions)
2019 2018 2019 2018
Employee benefit costs 1,608 1,415 3,187 2,800
Depreciation and amortization 103 66 201 130
Travelling costs 63 62 156 128
Cost of technical sub-contractors 234 216 470 407
Cost of software packages for own use 37 31 69 62
Third party items bought for service delivery to clients 58 53 114 102
Short-term leases (Refer to Note 2.8) 3 - 6 -
Operating leases - 13 - 24
Consultancy and professional charges 2 2 3 3
Communication costs 11 9 21 17
Repairs and maintenance 18 13 32 25
Provision for post-sales client support 3 4 2 4
Total 2,140 1,884 4,261 3,703
The Group has a policy on compensated absences which are both accumulating and non-accumulating in nature. The expected cost of accumulating compensated absences is
determined by actuarial valuation performed by an independent actuary at each balance sheet date using projected unit credit method on the additional amount expected to be
paid/availed as a result of the unused entitlement that has accumulated at the balance sheet date. Expense on non-accumulating compensated absences is recognized in the period
in which the absences occur.
2.18.5 Other income
Other income is comprised primarily of interest income, dividend income, gain/loss on investment and exchange gain/loss on forward and options contracts and on translation
of other assets and liabilities. Interest income is recognized using the effective interest method. Dividend income is recognized when the right to receive payment is established.
Certain employees of Infosys, Infosys BPM (formerly Infosys BPO) and EdgeVerve are participants in a defined contribution plan. The Group has no further obligations to the
Plan beyond its monthly contributions which are periodically contributed to a trust fund, the corpus of which is invested with the Life Insurance Corporation of India.
2.18.3 Provident fund
Eligible employees of Infosys receive benefits from a provident fund, which is a defined benefit plan. Both the eligible employee and the company make monthly contributions
to the provident fund plan equal to a specified percentage of the covered employee's salary. The company contributes a portion of the contributions to the Infosys Limited
Employees' Provident Fund Trust. The trust invests in specific designated instruments as permitted by Indian law. The remaining portion is contributed to the government
administered pension fund. The rate at which the annual interest is payable to the beneficiaries by the trust is being administered by the government. The company has an
obligation to make good the shortfall, if any, between the return from the investments of the Trust and the notified interest rate.
In respect of Indian subsidiaries, eligible employees receive benefits from a provident fund, which is a defined contribution plan. Both the eligible employee and the respective
companies make monthly contributions to this provident fund plan equal to a specified percentage of the covered employee's salary. Amounts collected under the provident fund
plan are deposited in a government administered provident fund. The companies have no further obligation to the plan beyond its monthly contributions.
2.18.4 Compensated absences
The Hon’ble Supreme Court of India vide its judgment and subsequent review petition has ruled in respect of compensation for the purpose of Provident Fund contribution
under the Employee’s Provident Fund Act. The Company has assessed possible outcomes of the judgment on determination of provident fund contributions and based on the
Company’s current evaluation, it is not probable that certain allowances paid by the Company will be subject to payment of Provident Fund. The company will continue to
monitor and evaluate its position based on future events and developments.
2.18.1 Gratuity
The Group provides for gratuity, a defined benefit retirement plan ('the Gratuity Plan') covering eligible employees of Infosys and its Indian subsidiaries. The Gratuity Plan
provides a lump-sum payment to vested employees at retirement, death, incapacitation or termination of employment, of an amount based on the respective employee's salary
and the tenure of employment with the group.
Liabilities with regard to the Gratuity Plan are determined by actuarial valuation, performed by an independent actuary, at each balance sheet date using the projected unit credit
method. The company fully contributes all ascertained liabilities to the Infosys Limited Employees' Gratuity Fund Trust (the Trust). In case of Infosys BPM (formerly Infosys
BPO) and EdgeVerve, contributions are made to the Infosys BPM Employees' Gratuity Fund Trust and EdgeVerve Systems Limited Employees' Gratuity Fund Trust,
respectively. Trustees administer contributions made to the Trusts and contributions are invested in a scheme with Life Insurance Corporation of India as permitted by law of
India.
The Group recognizes the net obligation of a defined benefit plan in its balance sheet as an asset or liability. Gains and losses through re-measurements of the net defined benefit
liability / asset are recognized in other comprehensive income and not reclassified to profit or loss in subsequent period. The actual return of the portfolio of plan assets, in
excess of the yields computed by applying the discount rate used to measure the defined benefit obligation is recognized in other comprehensive income. The effect of any plan
amendments are recognized in net profits in the statement of comprehensive income.
2.18.2 Superannuation
2.18.6 Operating Profits
Operating profit of the Group is computed considering the revenues, net of cost of sales, selling and marketing expenses and administrative expenses.
Six months ended September 30,Three months ended September 30,
Effective April 1, 2018, the Group has adopted IFRS interpretation IFRIC 22- Foreign Currency Transactions and Advance Consideration which clarifies the date of transaction
for the purpose of determining the exchange rate to use on initial recognition of the related asset, expense or income when an entity has received or paid advance consideration
in a foreign currency. The effect on account of adoption of this amendment was insignificant.
33
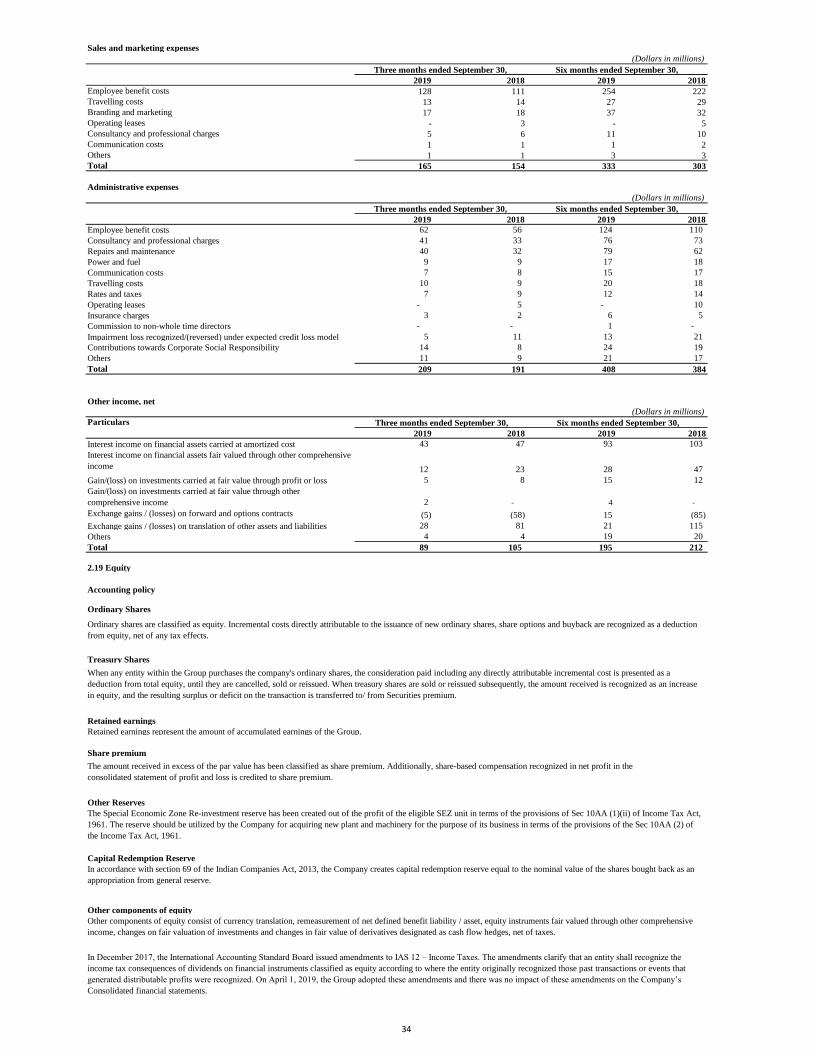
Sales and marketing expenses
(Dollars in millions)
2019 2018 2019 2018
Employee benefit costs 128 111 254 222
Travelling costs 13 14 27 29
Branding and marketing 17 18 37 32
Operating leases - 3 - 5
Consultancy and professional charges 5 6 11 10
Communication costs 1 1 1 2
Others 1 1 3 3
Total 165 154 333 303
Administrative expenses
(Dollars in millions)
2019 2018 2019 2018
Employee benefit costs 62 56 124 110
Consultancy and professional charges 41 33 76 73
Repairs and maintenance 40 32 79 62
Power and fuel 9 9 17 18
Communication costs 7 8 15 17
Travelling costs 10 9 20 18
Rates and taxes 7 9 12 14
Operating leases - 5 - 10
Insurance charges 3 2 6 5
Commission to non-whole time directors - - 1 -
Impairment loss recognized/(reversed) under expected credit loss model 5 11 13 21
Contributions towards Corporate Social Responsibility 14 8 24 19
Others 11 9 21 17
Total 209 191 408 384
Other income, net
(Dollars in millions)
2019 2018 2019 2018
43 47 93 103
12 23 28 47
5 8 15 12
2 - 4 -
(5) (58) 15 (85)
28 81 21 115
Others 4 4 19 20
Total 89 105 195 212
2.19 Equity
Accounting policy
Ordinary Shares
Treasury Shares
Retained earnings
Retained earnings represent the amount of accumulated earnings of the Group.
Share premium
Other components of equity
Exchange gains / (losses) on translation of other assets and liabilities
Interest income on financial assets carried at amortized cost
Interest income on financial assets fair valued through other comprehensive
income
Gain/(loss) on investments carried at fair value through profit or loss
Gain/(loss) on investments carried at fair value through other
comprehensive income
Exchange gains / (losses) on forward and options contracts
Three months ended September 30, Six months ended September 30, Particulars
Six months ended September 30,
Six months ended September 30,
Three months ended September 30,
Three months ended September 30,
In December 2017, the International Accounting Standard Board issued amendments to IAS 12 – Income Taxes. The amendments clarify that an entity shall recognize the
income tax consequences of dividends on financial instruments classified as equity according to where the entity originally recognized those past transactions or events that
generated distributable profits were recognized. On April 1, 2019, the Group adopted these amendments and there was no impact of these amendments on the Company’s
Consolidated financial statements.
Ordinary shares are classified as equity. Incremental costs directly attributable to the issuance of new ordinary shares, share options and buyback are recognized as a deduction
from equity, net of any tax effects.
When any entity within the Group purchases the company's ordinary shares, the consideration paid including any directly attributable incremental cost is presented as a
deduction from total equity, until they are cancelled, sold or reissued. When treasury shares are sold or reissued subsequently, the amount received is recognized as an increase
in equity, and the resulting surplus or deficit on the transaction is transferred to/ from Securities premium.
The amount received in excess of the par value has been classified as share premium. Additionally, share-based compensation recognized in net profit in the
consolidated statement of profit and loss is credited to share premium.
Other Reserves
The Special Economic Zone Re-investment reserve has been created out of the profit of the eligible SEZ unit in terms of the provisions of Sec 10AA (1)(ii) of Income Tax Act,
1961. The reserve should be utilized by the Company for acquiring new plant and machinery for the purpose of its business in terms of the provisions of the Sec 10AA (2) of
the Income Tax Act, 1961.
Capital Redemption Reserve
In accordance with section 69 of the Indian Companies Act, 2013, the Company creates capital redemption reserve equal to the nominal value of the shares bought back as an
appropriation from general reserve.
Other components of equity consist of currency translation, remeasurement of net defined benefit liability / asset, equity instruments fair valued through other comprehensive
income, changes on fair valuation of investments and changes in fair value of derivatives designated as cash flow hedges, net of taxes.
34
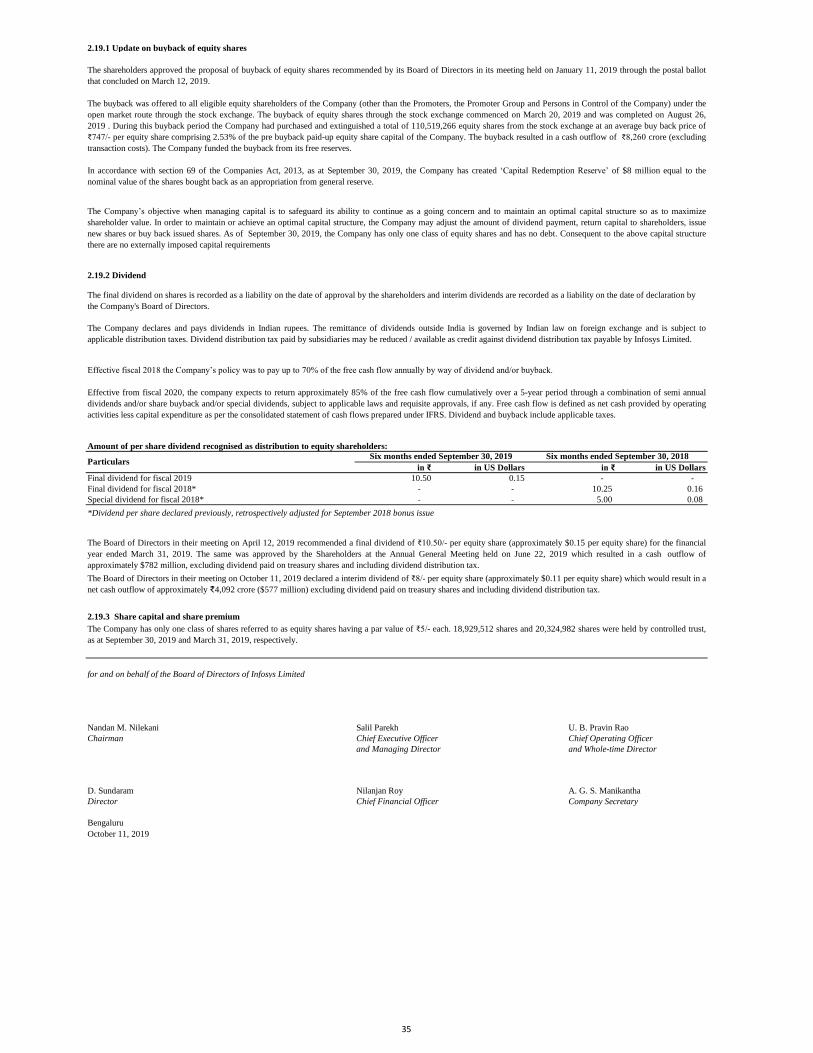
2.19.1 Update on buyback of equity shares
2.19.2 Dividend
Amount of per share dividend recognised as distribution to equity shareholders:
in ₹ in US Dollars in ₹ in US Dollars
Final dividend for fiscal 2019 10.50 0.15 - -
Final dividend for fiscal 2018* - - 10.25 0.16
Special dividend for fiscal 2018* - - 5.00 0.08
*Dividend per share declared previously, retrospectively adjusted for September 2018 bonus issue
2.19.3 Share capital and share premium
for and on behalf of the Board of Directors of Infosys Limited
Nandan M. Nilekani Salil Parekh U. B. Pravin Rao
Chairman Chief Executive Officer Chief Operating Officer
and Managing Director and Whole-time Director
D. Sundaram Nilanjan Roy A. G. S. Manikantha
Director Chief Financial Officer Company Secretary
Bengaluru
The Board of Directors in their meeting on October 11, 2019 declared a interim dividend of ₹8/- per equity share (approximately $0.11 per equity share) which would result in a
net cash outflow of approximately ₹4,092 crore ($577 million) excluding dividend paid on treasury shares and including dividend distribution tax.
Effective fiscal 2018 the Company’s policy was to pay up to 70% of the free cash flow annually by way of dividend and/or buyback.
Effective from fiscal 2020, the company expects to return approximately 85% of the free cash flow cumulatively over a 5-year period through a combination of semi annual
dividends and/or share buyback and/or special dividends, subject to applicable laws and requisite approvals, if any. Free cash flow is defined as net cash provided by operating
activities less capital expenditure as per the consolidated statement of cash flows prepared under IFRS. Dividend and buyback include applicable taxes.
The Company has only one class of shares referred to as equity shares having a par value of ₹5/- each. 18,929,512 shares and 20,324,982 shares were held by controlled trust,
as at September 30, 2019 and March 31, 2019, respectively.
Six months ended September 30, 2019 Six months ended September 30, 2018Particulars
The Company declares and pays dividends in Indian rupees. The remittance of dividends outside India is governed by Indian law on foreign exchange and is subject to
applicable distribution taxes. Dividend distribution tax paid by subsidiaries may be reduced / available as credit against dividend distribution tax payable by Infosys Limited.
The Company’s objective when managing capital is to safeguard its ability to continue as a going concern and to maintain an optimal capital structure so as to maximize
shareholder value. In order to maintain or achieve an optimal capital structure, the Company may adjust the amount of dividend payment, return capital to shareholders, issue
new shares or buy back issued shares. As of September 30, 2019, the Company has only one class of equity shares and has no debt. Consequent to the above capital structure
there are no externally imposed capital requirements
October 11, 2019
The final dividend on shares is recorded as a liability on the date of approval by the shareholders and interim dividends are recorded as a liability on the date of declaration by
the Company's Board of Directors.
The Board of Directors in their meeting on April 12, 2019 recommended a final dividend of ₹10.50/- per equity share (approximately $0.15 per equity share) for the financial
year ended March 31, 2019. The same was approved by the Shareholders at the Annual General Meeting held on June 22, 2019 which resulted in a cash outflow of
approximately $782 million, excluding dividend paid on treasury shares and including dividend distribution tax.
The shareholders approved the proposal of buyback of equity shares recommended by its Board of Directors in its meeting held on January 11, 2019 through the postal ballot
that concluded on March 12, 2019.
The buyback was offered to all eligible equity shareholders of the Company (other than the Promoters, the Promoter Group and Persons in Control of the Company) under the
open market route through the stock exchange. The buyback of equity shares through the stock exchange commenced on March 20, 2019 and was completed on August 26,
2019 . During this buyback period the Company had purchased and extinguished a total of 110,519,266 equity shares from the stock exchange at an average buy back price of
₹747/- per equity share comprising 2.53% of the pre buyback paid-up equity share capital of the Company. The buyback resulted in a cash outflow of ₹8,260 crore (excluding
transaction costs). The Company funded the buyback from its free reserves.
In accordance with section 69 of the Companies Act, 2013, as at September 30, 2019, the Company has created ‘Capital Redemption Reserve’ of $8 million equal to the
nominal value of the shares bought back as an appropriation from general reserve.
35