infosys limited and subsidiaries unaudited condensed ... of the net defined benefit liability/asset...
TRANSCRIPT
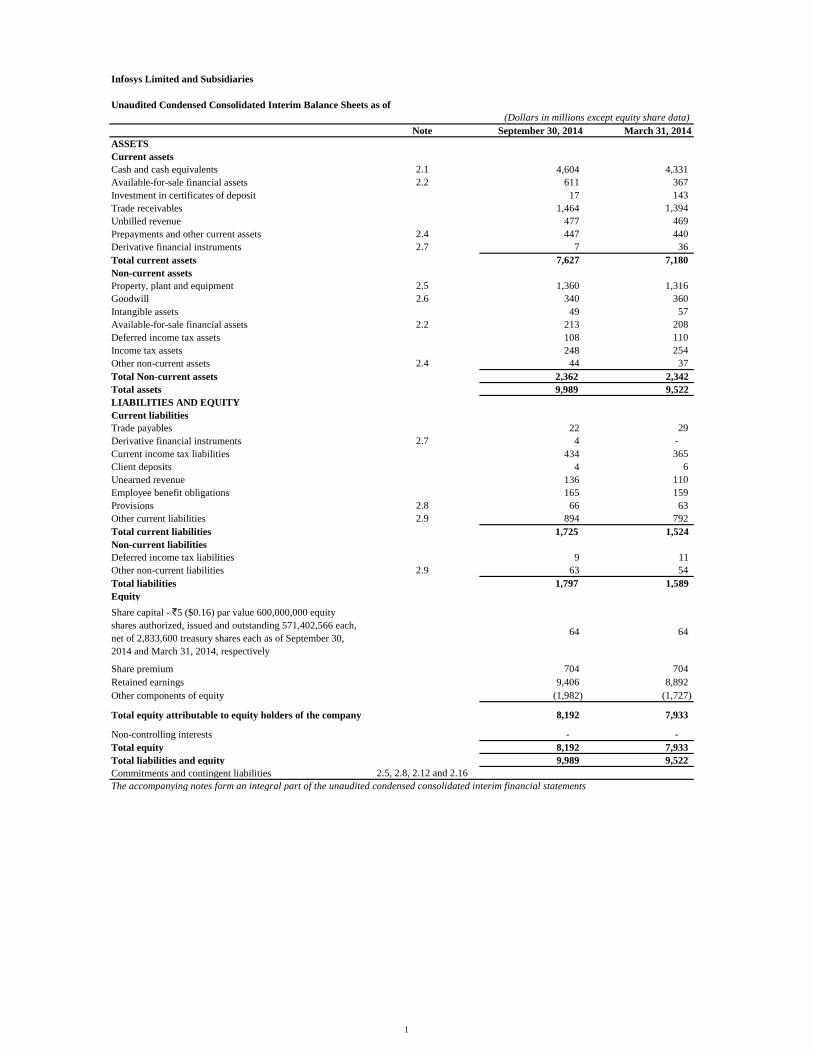
Infosys Limited and Subsidiaries
Unaudited Condensed Consolidated Interim Balance Sheets as of
(Dollars in millions except equity share data)
Note September 30, 2014 March 31, 2014
ASSETS
Current assets
Cash and cash equivalents 2.1 4,604 4,331
Available-for-sale financial assets 2.2 611 367
Investment in certificates of deposit 17 143
Trade receivables 1,464 1,394
Unbilled revenue 477 469
Prepayments and other current assets 2.4 447 440
Derivative financial instruments 2.7 7 36
Total current assets 7,627 7,180
Non-current assets
Property, plant and equipment 2.5 1,360 1,316
Goodwill 2.6 340 360
Intangible assets 49 57
Available-for-sale financial assets 2.2 213 208
Deferred income tax assets 108 110
Income tax assets 248 254
Other non-current assets 2.4 44 37
Total Non-current assets 2,362 2,342
Total assets 9,989 9,522
LIABILITIES AND EQUITY
Current liabilities
Trade payables 22 29
Derivative financial instruments 2.7 4 -
Current income tax liabilities 434 365
Client deposits 4 6
Unearned revenue 136 110
Employee benefit obligations 165 159
Provisions 2.8 66 63
Other current liabilities 2.9 894 792
Total current liabilities 1,725 1,524
Non-current liabilities
Deferred income tax liabilities 9 11
Other non-current liabilities 2.9 63 54
Total liabilities 1,797 1,589
Equity
Share premium 704 704
Retained earnings 9,406 8,892
Other components of equity (1,982) (1,727)
Total equity attributable to equity holders of the company 8,192 7,933
Non-controlling interests - -
Total equity 8,192 7,933
Total liabilities and equity 9,989 9,522
Commitments and contingent liabilities 2.5, 2.8, 2.12 and 2.16
The accompanying notes form an integral part of the unaudited condensed consolidated interim financial statements
64 64
Share capital - `5 ($0.16) par value 600,000,000 equity
shares authorized, issued and outstanding 571,402,566 each,
net of 2,833,600 treasury shares each as of September 30,
2014 and March 31, 2014, respectively
1

Infosys Limited and Subsidiaries
Unaudited Condensed Consolidated Interim Statements of Comprehensive Income
(Dollars in millions except share and per equity share data)
Note
2014 2013 2014 2013
Revenues 2,201 2,066 4,334 4,057
Cost of sales 2.18 1,353 1,337 2,697 2,633
Gross profit 848 729 1,637 1,424
Operating expenses:
Selling and marketing expenses 2.18 127 120 238 223
Administrative expenses 2.18 146 158 288 282
Total operating expenses 273 278 526 505
Operating profit 575 451 1,111 919
Other income, net 144 81 283 184
Profit before income taxes 719 532 1,394 1,103
Income tax expense 2.12 208 149 401 302
Net profit 511 383 993 801
Other comprehensive income
Items that will not be reclassified to profit or loss:
Re-measurements of the net defined benefit liability/asset (1) 5 (4) 6
(1) 5 (4) 6
Items that maybe reclassified subsequently to profit or loss:
Fair value changes on available-for-sale financial assets 2.2 5 (4) 8 (4)
Exchange differences on translation of foreign operations (223) (316) (259) (935)
(218) (320) (251) (939)
Total other comprehensive income, net of tax (219) (315) (255) (933)
Total comprehensive income 292 68 738 (132)
Profit attributable to:
Owners of the company 511 383 993 801
Non-controlling interests - - - -
511 383 993 801
Total comprehensive income attributable to:
Owners of the company 292 68 738 (132)
Non-controlling interests - - - -
292 68 738 (132)
Earnings per equity share
Basic ($) 0.89 0.67 1.74 1.40
Diluted ($) 0.89 0.67 1.74 1.40
Weighted average equity shares used in computing earnings per
equity share
Basic 2.13 571,402,566 571,402,566 571,402,566 571,402,566
Diluted 2.13 571,404,028 571,402,566 571,403,297 571,402,566
The accompanying notes form an integral part of the unaudited condensed consolidated interim financial statements
Six months ended
September 30,
Three months ended
September 30,
2

Infosys Limited and Subsidiaries
Unaudited Condensed Consolidated Interim Statements of Changes in Equity
Shares(*) Share
capital
Share
premium
Retained
earnings
Other
components of
equity
Total equity
attributable to
equity holders of
the company
571,402,566 64 704 7,666 (1,103) 7,331
- - - - 6 6
- - - (6) 9 3
- - - (302) - (302)
- - - - (4) (4)
Net profit - - - 801 - 801
- - - - (935) (935)
571,402,566 64 704 8,159 (2,027) 6,900
571,402,566 64 704 8,892 (1,727) 7,933
- - - - - -
- - - - (4)
(4)
- - - (479) - (479)
- - - - 8
8
Net profit - - - 993 - 993
- - - - (259) (259)
571,402,566 64 704 9,406 (1,982) 8,192
Exchange differences on translation of foreign operations
Balance as of September 30, 2013
Balance as of April 1, 2014
Balance as of September 30, 2014
(Dollars in millions except equity share data)
Changes in equity for the six months ended September 30,
2013
Remeasurement of the net defined benefit liability/(asset), net
of tax effect
Fair value changes on available-for-sale financial assets, net of
tax effect (Refer Note 2.2 and 2.12)
Change in accounting policy -Adoption of Revised IAS 19
Dividends (including corporate dividend tax)
Balance as of April 1, 2013
Shares issued on exercise of employee stock options
*excludes treasury shares of 2,833,600 held by consolidated trust
Remeasurement of the net defined benefit liability/(asset), net
of tax effect
The accompanying notes form an integral part of the unaudited condensed consolidated interim financial statements
Changes in equity for the six months ended September 30,
2014
Dividends (including corporate dividend tax)
Fair value changes on available-for-sale financial assets, net of
tax effect (Refer Note 2.2 and 2.12)
Exchange differences on translation of foreign operations
3

Infosys Limited and Subsidiaries
Unaudited Condensed Consolidated Interim Statements of Cash Flows
2014 2013
Operating activities:
Net Profit 993 801
Depreciation and amortisation 86 110
Income from available-for-sale financial assets and certificates of deposit (30) (19)
Income tax expense 401 302
Effect of exchange rate changes on assets and liabilities 3 12
Deferred purchase price 19 14
Provisions for doubtful trade receivable 28 13
Other non-cash item 6 (3)
Changes in Working Capital
Trade receivables (142) (224)
Prepayments and other assets 2 (16)
Unbilled revenue (23) (120)
Trade payables (3) (4)
Client deposits (3) (3)
Unearned revenue 30 3
Other liabilities and provisions 130 385
Cash generated from operations 1,497 1,251
Income taxes paid (326) (279)
Net cash provided by operating activities 1,171 972
Investing activities:
(168) (199)
Loans to employees (5) (4)
Deposits placed with corporation 1 (1)
Income from available-for-sale financial assets and certificates of deposit 30 14
Investment in quoted debt securities - (108)
Redemption of certificates of deposit 121 -
Investment in certificates of deposit - (87)
Investment in liquid mutual funds (1,999) (1,830)
Redemption of liquid mutual funds 1,741 1,657
Investment in fixed maturity plan securities (5) (5)
Redemption of fixed maturity plan securities 5 -
Net cash used in investing activities (279) (563)
Financing activities:
Payment of dividend (including corporate dividend tax) (479) (302)
Net cash used in financing activities (479) (302)
Effect of exchange rate changes on cash and cash equivalents (140) (527)
Net increase/(decrease) in cash and cash equivalents 413 107
Cash and cash equivalents at the beginning 4,331 4,021
Cash and cash equivalents at the end 4,604 3,601
Supplementary information:
Restricted cash balance 57 50
The accompanying notes form an integral part of the unaudited condensed consolidated interim financial statements
(Dollars in millions)
Six months ended September 30,
Adjustments to reconcile net profit to net cash provided by operating activities :
Expenditure on property, plant and equipment, net of sale proceeds, including changes in
retention money and capital creditors
4

Notes to the Unaudited Condensed Consolidated Interim Financial Statements
1. Company Overview and Significant Accounting Policies
1.1 Company overview
Infosys Limited (Infosys or the company) along with its controlled trusts, Infosys Limited Employees' Welfare Trust and Infosys Science Foundation, majority owned
and controlled subsidiary, Infosys BPO Limited (Infosys BPO) and its wholly owned and controlled subsidiaries, and wholly owned and controlled subsidiaries,
Infosys Technologies (Australia) Pty. Limited (Infosys Australia), Infosys Technologies (China) Co. Limited (Infosys China), Infosys Technologies S. DE R.L. de
C.V. (Infosys Mexico), Infosys Technologies (Sweden) AB (Infosys Sweden), Infosys Tecnologia do Brasil Ltda (Infosys Brasil), Infosys Public Services, Inc.,
(Infosys Public Services), Infosys Americas Inc., (Infosys Americas), Edgeverve Systems Limited (Edgeverve), Infosys Technologies (Shanghai) Company Limited
(Infosys Shanghai) and Lodestone Holding AG and its controlled subsidiaries (Infosys Lodestone) is a leading global services company. The Infosys group of
companies (the Group) provides business consulting, technology, engineering and outsourcing services. In addition, the Group offers software products and platforms.
The company is a public limited company incorporated and domiciled in India and has its registered office at Bangalore, Karnataka, India. The company has its
primary listings on the Bombay Stock Exchange and National Stock Exchange in India. The company’s American Depositary Shares representing equity shares are
also listed on the New York Stock Exchange (NYSE), NYSE Euronext London and NYSE Euronext Paris.
1.2 Basis of preparation of financial statements
These condensed consolidated interim financial statements have been prepared in compliance with International Financial Reporting Standards as issued by the
International Accounting Standards Board (IFRS) and in accordance with IAS 34, Interim Financial Reporting, under the historical cost convention on the accrual basis
except for certain financial instruments and prepaid gratuity benefits which have been measured at fair values. Accordingly, these condensed consolidated interim
financial statements do not include all the information required for a complete set of financial statements. These condensed consolidated interim financial statements
should be read in conjunction with the consolidated financial statements and related notes included in the company’s Annual Report on Form 20-F for the year ended
March 31, 2014. Accounting policies have been applied consistently to all periods presented in these unaudited condensed consolidated interim financial statements.
1.3 Basis of consolidation
Infosys consolidates entities which it owns or controls. Control exists when the parent has power over the entity, is exposed, or has rights, to variable returns from its
involvement with the entity and has the ability to affect those returns by using its power over the entity. Power is demonstrated through existing rights that give the
ability to direct relevant activities, those which significantly affect the entity's returns. Subsidiaries are consolidated from the date control commences until the date
control ceases.
The financial statements of the Group companies are consolidated on a line-by-line basis and intra-group balances and transactions including unrealized gain / loss
from such transactions are eliminated upon consolidation. These financial statements are prepared by applying uniform accounting policies in use at the Group. Non-
controlling interests which represent part of the net profit or loss and net assets of subsidiaries that are not, directly or indirectly, owned or controlled by the company,
are excluded.
1.4 Use of estimates
The preparation of the financial statements in conformity with IFRS requires management to make estimates, judgments and assumptions. These estimates, judgments
and assumptions affect the application of accounting policies and the reported amounts of assets and liabilities, the disclosures of contingent assets and liabilities at the
date of the financial statements and reported amounts of revenues and expenses during the period. Application of accounting policies that require critical accounting
estimates involving complex and subjective judgments and the use of assumptions in these financial statements have been disclosed in Note 1.5. Accounting estimates
could change from period to period. Actual results could differ from those estimates. Appropriate changes in estimates are made as management becomes aware of
changes in circumstances surrounding the estimates. Changes in estimates are reflected in the financial statements in the period in which changes are made and, if
material, their effects are disclosed in the notes to the consolidated interim financial statements.
1.5 Critical accounting estimates
a. Revenue recognition
The company uses the percentage-of-completion method in accounting for its fixed-price contracts. Use of the percentage-of-completion method requires the
company to estimate the efforts or costs expended to date as a proportion of the total efforts or costs to be expended. Efforts or costs expended have been used to
measure progress towards completion as there is a direct relationship between input and productivity. Provisions for estimated losses, if any, on uncompleted contracts
are recorded in the period in which such losses become probable based on the expected contract estimates at the reporting date.
b. Income taxes
The company's two major tax jurisdictions are India and the U.S., though the company also files tax returns in other overseas jurisdictions. Significant judgments are
involved in determining the provision for income taxes, including amount expected to be paid/recovered for uncertain tax positions.
5

c. Business combinations and intangible assets
Business combinations are accounted for using IFRS 3 (Revised), Business Combinations. IFRS 3 requires the identifiable intangible assets and contingent
consideration to be fair valued in order to ascertain the net fair value of identifiable assets, liabilities and contingent liabilities of the acquiree. Significant estimates are
required to be made in determining the value of contingent consideration and intangible assets. These valuations are conducted by independent valuation experts.
d. Property, plant and equipment
Property, plant and equipment represent a significant proportion of the asset base of the Group. The charge in respect of periodic depreciation is derived after
determining an estimate of an asset’s expected useful life and the expected residual value at the end of its life. The useful lives and residual values of Group's assets
are determined by management at the time the asset is acquired and reviewed periodically, including at each financial year end. The lives are based on historical
experience with similar assets as well as anticipation of future events, which may impact their life, such as changes in technology.
1.6 Property, plant and equipment
Property, plant and equipment are stated at cost, less accumulated depreciation and impairment, if any. Costs directly attributable to acquisition are capitalized until
the property, plant and equipment are ready for use, as intended by management. The group depreciates property, plant and equipment over their estimated useful lives
using the straight-line method. The estimated useful lives of assets are as follows:
Buildings 22-25 years
Plant and machinery 5 years
Computer equipment 3-5 years
Furniture and fixtures 5 years
Vehicles 5 years
Depreciation methods, useful lives and residual values are reviewed periodically, including at each financial year end. (Refer note 2.5)
Advances paid towards the acquisition of property, plant and equipment outstanding at each balance sheet date and the cost of assets not put to use before such date
are disclosed under ‘Capital work-in-progress’. Subsequent expenditures relating to property, plant and equipment is capitalized only when it is probable that future
economic benefits associated with these will flow to the Group and the cost of the item can be measured reliably. Repairs and maintenance costs are recognized in net
profit in the statement of comprehensive income when incurred. The cost and related accumulated depreciation are eliminated from the financial statements upon sale
or retirement of the asset and the resultant gains or losses are recognized in net profit in the statement of comprehensive income. Assets to be disposed off are reported
at the lower of the carrying value or the fair value less cost to sell.
1.7 Business combinations
Business combinations have been accounted for using the acquisition method under the provisions of IFRS 3 (Revised), Business Combinations.
The cost of an acquisition is measured at the fair value of the assets transferred, equity instruments issued and liabilities incurred or assumed at the date of acquisition,
which is the date on which control is transferred to the Group. The cost of acquisition also includes the fair value of any contingent consideration. Identifiable assets
acquired and liabilities and contingent liabilities assumed in a business combination are measured initially at their fair value on the date of acquisition.
Business combinations between entities under common control by formation of a new company is outside the scope of IFRS 3 (Revised), Business Combinations and
is accounted for at carrying value.
Transaction costs that the Group incurs in connection with a business combination such as finders’ fees, legal fees, due diligence fees, and other professional and
consulting fees are expensed as incurred.
1.8 Employee benefits
1.8.1 Gratuity
Infosys provides for gratuity, a defined benefit retirement plan (the Gratuity Plan) covering eligible employees. The Gratuity Plan provides a lump-sum payment to
vested employees at retirement, death, incapacitation or termination of employment, of an amount based on the respective employee's salary and the tenure of
employment.
Liabilities with regard to the Gratuity Plan are determined by actuarial valuation, performed by an independent actuary, at each balance sheet date using the projected
unit credit method. The company fully contributes all ascertained liabilities to the Infosys Limited Employees' Gratuity Fund Trust (the Trust). In case of Infosys BPO
and Edgeverve, contributions are made to the Infosys BPO's Employees' Gratuity Fund Trust and Edgeverve Systems Limited Employees' Gratuity Fund Trust.
Trustees administer contributions made to the Trusts and contributions are invested in a scheme with Life Insurance Corporation as permitted by law.
The group has adopted Revised IAS 19 effective April 1, 2013. Pursuant to this adoption, the Group recognizes the net obligation of a defined benefit plan in its
balance sheet as an asset or liability. The amended standard requires immediate recognition of the gains and losses through re-measurements of the net defined benefit
liability/ (asset) through other comprehensive income. Further it also requires the interest expense (income) considered in the Profit and Loss to be restricted to the
discount rate based on the Government securities yield. The actual return of the portfolio, in excess of such yields is recognized through the other comprehensive
income. The Revised IAS 19 also requires effect of any plan amendments to be recognized immediately through the net profits, in the statement of comprehensive
income.
Previously, the actuarial gains and losses were charged or credited to net profit in the statement of comprehensive income in the period in which they arose and the
expected return on plan assets computed based on market expectations were considered as part of the net gratuity cost.
The adoption of Revised IAS 19 Employee Benefits did not have a material impact on the consolidated financial statements.
6

1.8.2 Superannuation
Certain employees of Infosys are also participants in a defined contribution plan. The company has no further obligations to the Plan beyond its monthly
contributions. Certain employees of Infosys BPO are also eligible for superannuation benefit. Infosys BPO has no further obligations to the superannuation plan
beyond its monthly contribution which are periodically contributed to a trust fund, the corpus of which is invested with the Life Insurance Corporation of India.
Certain employees of Edgeverve are also participants in the Edgeverve Systems Limited Employees Superannuation Fund Trust ('the Plan') which is a defined
contribution plan. The Company has no obligations to the Plan beyond its monthly contributions.
1.8.3 Provident fund
Eligible employees of Infosys receive benefits from a provident fund, which is a defined benefit plan. Both the employee and the company make monthly
contributions to the provident fund plan equal to a specified percentage of the covered employee's salary. The company contributes a part of the contributions to the
Infosys Limited Employees' Provident Fund Trust. The trust invests in specific designated instruments as permitted by Indian law. The remaining portion is
contributed to the government administered pension fund. The rate at which the annual interest is payable to the beneficiaries by the trust is being administered by the
government. The company has an obligation to make good the shortfall, if any, between the return from the investments of the Trust and the notified interest rate.
In respect of Infosys BPO, eligible employees receive benefits from a provident fund, which is a defined contribution plan. Both the employee and Infosys BPO make
monthly contributions to this provident fund plan equal to a specified percentage of the covered employee's salary. Amounts collected under the provident fund plan
are deposited in a government administered provident fund. The company has no further obligation to the plan beyond its monthly contributions.
In respect of Edgeverve Systems Limited, eligible employees receive benefits from a provident fund, which is a defined contribution plan. Both the employee and the Company make
monthly contributions to this provident fund plan equal to a specified percentage of the covered employee's salary. Amounts collected under the provident fund plan are deposited in a
Government administered provident fund. The Company has no further obligations under the provident fund plan beyond its monthly contributions.
1.8.4 Compensated absences
The Group has a policy on compensated absences which are both accumulating and non-accumulating in nature. The expected cost of accumulating compensated
absences is determined by actuarial valuation on the additional amount expected to be paid/availed as a result of the unused entitlement that has accumulated at the
balance sheet date. Expense on non-accumulating compensated absences is recognized in the period in which the absences occur.
1.8.5 Share - based compensation
The Group recognizes compensation expense relating to share-based payments in net profit using a fair-value measurement method in accordance with IFRS 2, Share-
Based Payment. Under the fair value method, the estimated fair value of awards is charged to income on a straight-line basis over the requisite service period for each
separately vesting portion of the award as if the award was in-substance, multiple awards with a corresponding increase to securities premium.
1.9 Recent accounting pronouncements
1.9.1 Standards issued but not yet effective
IFRS 9 Financial Instruments: In November 2009, the International Accounting Standards Board issued IFRS 9, Financial Instruments: Recognition and Measurement,
to reduce the complexity of the current rules on financial instruments as mandated in IAS 39. IFRS 9 has fewer classification and measurement categories as compared
to IAS 39 and has eliminated the categories of held to maturity, available for sale and loans and receivables. Further it eliminates the rule-based requirement of
segregating embedded derivatives and tainting rules pertaining to held to maturity investments. For an investment in an equity instrument which is not held for trading,
IFRS 9 permits an irrevocable election, on initial recognition, on an individual share-by-share basis, to present all fair value changes from the investment in other
comprehensive income. No amount recognized in other comprehensive income would ever be reclassified to profit or loss. IFRS 9, was further amended in October
2010, and such amendment introduced requirements on accounting for financial liabilities. This amendment addresses the issue of volatility in the profit or loss due to
changes in the fair value of an entity’s own debt. It requires the entity, which chooses to measure a liability at fair value, to present the portion of the fair value change
attributable to the entity’s own credit risk in the other comprehensive income. The effective date for adoption of IFRS 9 is annual periods beginning on or after
January 1, 2018, though early adoption is permitted. The Group is currently evaluating the requirements of IFRS 9, and has not yet determined the impact on the
condensed consolidated interim financial statements.
IFRS 15 Revenue from Contract with Customers: In May 2014, the International Accounting Standards Board issued IFRS 15, Revenue from Contract with
Customers. The core principle of the new standard is that an entity should recognise revenue to depict the transfer of promised goods or services to customers in an
amount that reflects the consideration to which the entity expects to be entitled in exchange for those goods or services. Further the new standard requires enhanced
disclosures about the nature, amount, timing and uncertainty of revenue and cash flows arising from the entity’s contracts with customers. The standard permits the use
of either the retrospective or cumulative effect transition method. The effective date for adoption of IFRS 15 is annual periods beginning on or after January 1, 2017,
though early adoption is permitted. The Group has not yet selected a transition method and has not yet evaluated the impact of IFRS 15 on the consolidated financial
statements.
7

2. Notes to the Unaudited Condensed Consolidated Interim Financial Statements
2.1 Cash and cash equivalents
Cash and cash equivalents consist of the following:
(Dollars in millions)
September 30, 2014 March 31, 2014
Cash and bank deposits 4,020 3,729
Deposits with corporations 584 602
4,604 4,331
The table below provides details of cash and cash equivalents :
(Dollars in millions)
September 30, 2014 March 31, 2014
Current accounts
Banamex Bank, Mexico 1 -
Bank of America, Mexico 5 1
Bank of America, USA 136 119
Bank of Zachodni WBK S.A. 1 -
Barclays Bank, UK 12 19
Citibank N.A., China 5 9
CIC, France - 1
Citibank N.A., Australia 11 13
Citibank N.A., Brazil 6 6
Citibank N.A., India - 1
Citibank N.A., Japan 2 2
Citibank N.A., New Zealand 1 1
Citibank N.A., South Africa - 1
Citibank N.A., Czech Republic 1 -
Commerzbank, Germany 1 1
Deutsche Bank, Belgium 1 2
Deutsche Bank, Czech Republic (Euro account) 2 1
Deutsche Bank, Czech Republic (U.S. dollar account) 1 2
Deutsche Bank, France 3 1
Deutsche Bank, Germany 3 6
Deutsche Bank, India 5 1
Deutsche Bank, Netherlands 4 3
Deutsche Bank, Philippines 1 1
Deutsche Bank, Philippines (U.S. dollar account) 1 5
Deutsche Bank, Poland 1 -
Deutsche Bank, Russia (U.S. dollar account) - 2
Deutsche Bank, Singapore - 2
Deutsche Bank, Spain - 1
Deutsche Bank, Switzerland - 1
Deutsche Bank, United Kingdom 10 12
Deutsche Bank-EEFC, India (Australian dollar account) 14 1
Deutsche Bank-EEFC, India (Euro account) 1 1
Deutsche Bank-EEFC, India (U.S. dollar account) 34 11
Deutsche Bank-EEFC, India (U.K. Pound Sterling account) 1 2
HSBC Bank, Brazil 1 1
HSBC Bank, Hong kong 5 -
ICICI Bank, India 37 6
ICICI Bank-EEFC, India (U.S. dollar account) 1 3
ING, Belgium 1 1
Nordbanken, Sweden 1 3
Pudong Devpt Bank, China 1 -
Punjab National Bank, India 3 2
Royal Bank of Scotland, China 8 6
Royal Bank of Canada, Canada 1 4
Royal Bank of Scotland, China (U.S. dollar account) 1 1
State Bank of India, India - 1
Union Bank of Switzerland, Switzerland 2 -
Union Bank of Switzerland, Switzerland (U.S. dollar account) 2 1
Union Bank of Switzerland, Switzerland (Euro account) 1 -
Union Bank of Switzerland, Switzerland (U.K. Pound Sterling account) 1 -
Wells Fargo Bank N.A. USA 4 -
Westpac, Australia 1 1
335 259
As of
Cash and cash equivalents as of September 30, 2014 and March 31, 2014 include restricted cash and bank balances of $57 million and
$53 million, respectively. The restrictions are primarily on account of cash and bank balances held by irrevocable trusts controlled by
the company, bank balances held as margin money deposits against guarantees and balances held in unclaimed dividend bank accounts.
The deposits maintained by the Group with banks and corporations comprise of time deposits, which can be withdrawn by the Group at
any point without prior notice or penalty on the principal.
As of
8
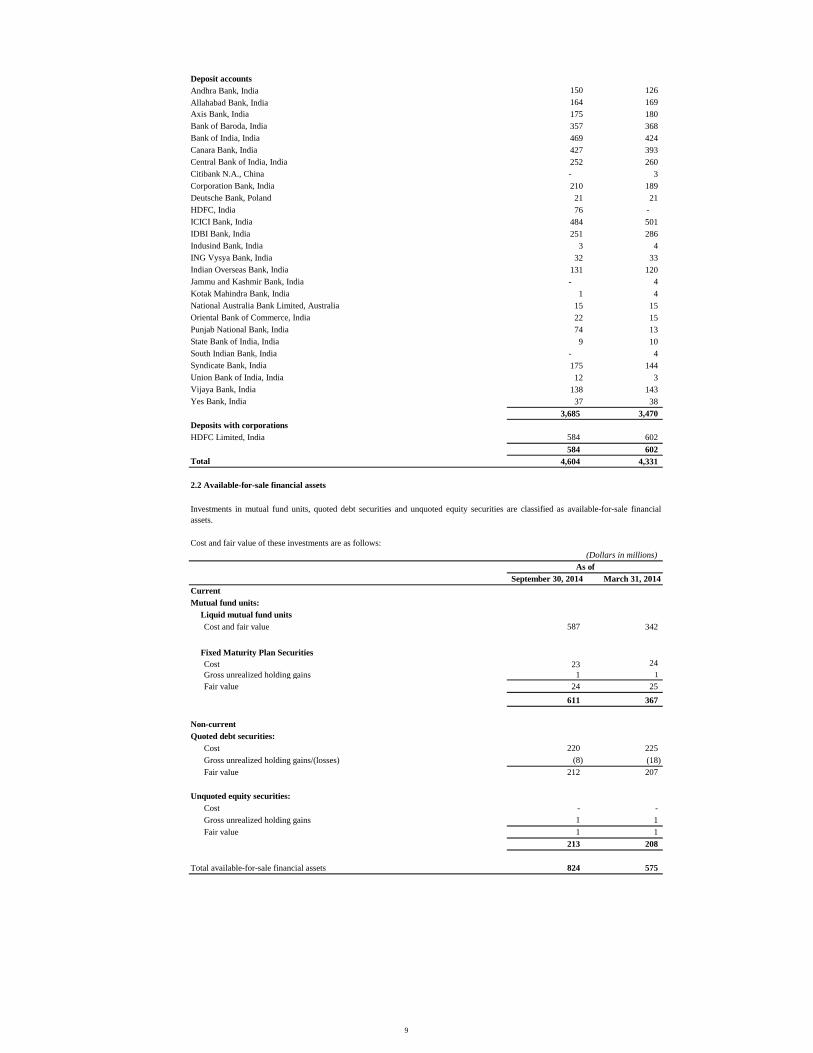
Deposit accounts
Andhra Bank, India 150 126
Allahabad Bank, India 164 169
Axis Bank, India 175 180
Bank of Baroda, India 357 368
Bank of India, India 469 424
Canara Bank, India 427 393
Central Bank of India, India 252 260
Citibank N.A., China - 3
Corporation Bank, India 210 189
Deutsche Bank, Poland 21 21
HDFC, India 76 -
ICICI Bank, India 484 501
IDBI Bank, India 251 286
Indusind Bank, India 3 4
ING Vysya Bank, India 32 33
Indian Overseas Bank, India 131 120
Jammu and Kashmir Bank, India - 4
Kotak Mahindra Bank, India 1 4
National Australia Bank Limited, Australia 15 15
Oriental Bank of Commerce, India 22 15
Punjab National Bank, India 74 13
State Bank of India, India 9 10
South Indian Bank, India - 4
Syndicate Bank, India 175 144
Union Bank of India, India 12 3
Vijaya Bank, India 138 143
Yes Bank, India 37 38
3,685 3,470
Deposits with corporations
HDFC Limited, India 584 602
584 602
Total 4,604 4,331
2.2 Available-for-sale financial assets
(Dollars in millions)
September 30, 2014 March 31, 2014
Current
Mutual fund units:
Liquid mutual fund units
Cost and fair value 587 342
Fixed Maturity Plan Securities
Cost 23 24
Gross unrealized holding gains 1 1
Fair value 24 25
611 367
Non-current
Quoted debt securities:
Cost 220 225
Gross unrealized holding gains/(losses) (8) (18)
Fair value 212 207
Unquoted equity securities:
Cost - -
Gross unrealized holding gains 1 1
Fair value 1 1
213 208
Total available-for-sale financial assets 824 575
As of
Investments in mutual fund units, quoted debt securities and unquoted equity securities are classified as available-for-sale financial
assets.
Cost and fair value of these investments are as follows:
9

Mutual fund units:
Liquid mutual funds:
Fixed maturity plan securities:
Quoted debt securities:
Unquoted equity securities:
2.3 Edgeverve
The fair value of liquid mutual funds as of September 30, 2014 and March 31, 2014 was $587 million and $342 million, respectively.
The fair value is based on quoted prices.
Edgeverve was created as a wholly owned subsidiary to focus on developing and selling products and platforms. On April 15, 2014, the
Board of Directors of Infosys has authorized the Company to execute a Business Transfer Agreement and related documents with
Edgeverve, subject to securing the requisite approval from shareholders in the Annual General Meeting. Subsequently, at the AGM held
on June 14, 2014, the shareholders have authorised the Board to enter into a Business Transfer Agreement and related documents with
Edgeverve, with effect from July 1, 2014 or such other date as may be decided by the Board of Directors. The company has undertaken
an enterprise valuation by an independent valuer and accordingly the business has been transferred for a consideration of $70 million
with effect from July 1, 2014 which is settled through the issue of fully paid up equity shares.
The transfer of assets and liabilities is accounted for at carrying values and does not have any impact on the consolidated financial
statements.
The fair value of fixed maturity plan securities as of September 30, 2014 and March 31, 2014 is $24 million and $25 million,
respectively. The net unrealized loss of less than $1 million, net of taxes, has been recognized in other comprehensive income for each
of the three months and six months ended September 30, 2014, respectively. The unrealized gain of less than $1 million, net of taxes of
less than $1 million has been recognized in other comprehensive income for the three months and six months ended September 30,
2013 (Refer to note 2.12) . The fair value is based on quotes reflected in actual transactions in similar instruments.
The fair value of quoted debt securities as of September 30, 2014 and March 31, 2014 was $212 million and $207 million, respectively.
The net unrealized gain of $5 million, net of taxes, has been recognized in other comprehensive income for the three months ended
September 30, 2014. The net unrealized gain of $8 million, net of taxes, has been recognized in other comprehensive income for the six
months ended September 30, 2014. (Refer to note 2.12)
As of September 30, 2014 and March 31, 2014, the 2,154,100 shares held in OnMobile Systems Inc, U.S.A, were fair valued at $1
million each. The fair value has been derived based on an agreed upon exchange ratio between these unquoted equity securities and
quoted prices of the underlying marketable equity securities. The unrealized loss of less than $1 million (net of taxes) has been
recognized in other comprehensive income for each of the three months and six months ended September 30, 2014, respectively.
The unrealized loss of less than $1 million, net of taxes of less than $1 million has been recognized in other comprehensive income for
each of the three months and six months ended September 30, 2013, respectively.
The net unrealized loss of $4 million, net of taxes of $1 million, has been recognized in other comprehensive income for the three
months and six months ended September 30, 2013. The fair value is based on the quoted price.
10

2.4 Prepayments and other assets
Prepayments and other assets consist of the following:
(Dollars in millions)
September 30, 2014 March 31, 2014
Current
Rental deposits 3 2
Security deposits with service providers 1 2
Loans and advances to employees 38 35
Prepaid expenses (1) 14 19
Interest accrued and not due 13 3
Withholding taxes (1) 208 176
Deposit with corporation 157 163
Advance payments to vendors for supply of goods (1) 8 15
Premiums held in trust(2) 3 23
Other assets 2 2
447 440
Non-Current
Loans and advances to employees 7 6
Security deposits with service providers 10 10
Deposit with corporation 8 7
Prepaid gratuity (1) 9 2
Prepaid expenses (1) 2 2
Rental Deposits 8 10
44 37
491 477
250 263
(1) Non
financial assets
2.5 Property, plant and equipment
Following are the changes in the carrying value of property, plant and equipment for the three months ended September 30, 2014:
(Dollars in millions)
Land Buildings Plant and
machinery
Computer
equipment
Furniture
and fixtures
Vehicles Capital work-in-
progress
Total
Gross carrying value as of July 1, 2014 216 845 288 460 169 5 319 2,302
Additions 37 41 21 27 9 - - 135
Deletions - - (1) (3) - (1) (45) (50)
Translation difference (5) (23) (7) (13) (5) 1 (8) (60)
Gross carrying value as of September 30, 2014 248 863 301 471 173 5 266 2,327
Accumulated depreciation as of July 1, 2014 - (305) (183) (339) (119) (2) - (948)
Depreciation (2) (8) (11) (15) (8) - - (44)
Accumulated depreciation on deletions - - 1 1 - - - 2
Translation difference - 8 3 10 3 (1) - 23
Accumulated depreciation as of September 30, 2014 (2) (305) (190) (343) (124) (3) - (967)
Carrying value as of September 30, 2014 246 558 111 128 49 2 266 1,360
Carrying value as of July 1, 2014 216 540 105 121 50 3 319 1,354
Proceeds on sale of property, plant and equipment during the three months ended September 30, 2014 was less than $1 million.
Following are the changes in the carrying value of property, plant and equipment for the three months ended September 30, 2013:
(Dollars in millions)
Land Buildings Plant and
machinery
Computer
equipment
Furniture
and fixtures
Vehicles Capital work-in-
progress
Total
Gross carrying value as of July 1, 2013 144 717 218 336 141 5 326 1,887
Additions 15 20 8 37 10 1 11 102
Deletions - - - - - - - -
Translation difference (8) (37) (10) (16) (5) (1) (15) (92)
Gross carrying value as of September 30, 2013 151 700 216 357 146 5 322 1,897
Accumulated depreciation as of July 1, 2013 - (264) (150) (244) (102) (3) - (763)
Depreciation - (12) (9) (26) (4) - - (51)
Accumulated depreciation on deletions - - - - - - - -
Translation difference - 14 9 11 3 - - 37
Accumulated depreciation as of September 30, 2013 - (262) (150) (259) (103) (3) - (777)
Carrying value as of September 30, 2013 151 438 66 98 43 2 322 1,120
Carrying value as of July 1, 2013 144 453 68 92 39 2 326 1,124
Proceeds on sale of property, plant and equipment during the three months ended September 30, 2013 was less than $1 million.
Deposit with corporation represents amounts deposited to settle certain employee-related obligations as and when they arise during the normal course of business.
As of
Financial assets in prepayments and other assets
(2) Represents premiums collected from policyholders and payable to insurance providers by a service provider maintaining the amounts in a fiduciary capacity (Refer to
Note 2.9).
Withholding taxes primarily consist of input tax credits. Other assets primarily represent travel advances and other recoverables. Security deposits with service providers relate principally to
leased telephone lines and electricity supplies.
11

Following are the changes in the carrying value of property, plant and equipment for the six months ended September 30, 2014:
(Dollars in millions)
Land Buildings Plant and
machinery
Computer
equipment
Furniture
and fixtures
Vehicles Capital work-in-
progress
Total
Gross carrying value as of April 1, 2014 190 839 284 444 170 6 305 2,238
Additions 64 51 28 46 11 - 14 214
Deletions - - (2) (5) (2) (1) (45) (55)
Translation difference (6) (27) (9) (14) (6) - (8) (70)
Gross carrying value as of September 30, 2014 248 863 301 471 173 5 266 2,327
Accumulated depreciation as of April 1, 2014 - (300) (175) (328) (117) (2) - (922)
Depreciation (2) (15) (22) (28) (13) - - (80)
Accumulated depreciation on deletions - - 2 3 2 - - 7
Translation difference - 10 5 10 4 (1) - 28
Accumulated depreciation as of September 30, 2014 (2) (305) (190) (343) (124) (3) - (967)
Carrying value as of September 30, 2014 246 558 111 128 49 2 266 1,360
Carrying value as of April 1, 2014 190 539 109 116 53 4 305 1,316
Proceeds on sale of property, plant and equipment during the six months ended September 30, 2014 was less than $1 million.
Following are the changes in the carrying value of property, plant and equipment for the six months ended September 30, 2013:
(Dollars in millions)
Land Buildings Plant and
machinery
Computer
equipment
Furniture
and fixtures
Vehicles Capital work-in-
progress
Total
Gross carrying value as of April 1, 2013 157 773 231 347 147 5 306 1,966
Additions 16 30 15 54 14 1 60 190
Deletions - - - (2) - - - (2)
Translation difference (22) (103) (30) (42) (15) (1) (44) (257)
Gross carrying value as of September 30, 2013 151 700 216 357 146 5 322 1,897
Accumulated depreciation as of April 1, 2013 - (275) (154) (240) (103) (3) - (775)
Depreciation - (24) (18) (51) (11) - - (104)
Accumulated depreciation on deletions - - - 2 - - - 2
Translation difference - 37 22 30 11 - - 100
Accumulated depreciation as of September 30, 2013 - (262) (150) (259) (103) (3) - (777)
Carrying value as of September 30, 2013 151 438 66 98 43 2 322 1,120
Carrying value as of April 1, 2013 157 498 77 107 44 2 306 1,191
Proceeds on sale of property, plant and equipment during the six months ended September 30, 2013 was less than $1 million.
Following are the changes in the carrying value of property, plant and equipment for the year ended March 31, 2014:
(Dollars in millions)
Land Buildings Plant and
machinery
Computer
equipment
Furniture
and fixtures
Vehicles Capital work-in-
progress
Total
Gross carrying value as of April 1, 2013 157 773 231 347 147 5 306 1,966
Additions 48 136 73 125 33 2 60 477
Deletions - - (1) (5) - (1) (30) (37)
Translation difference (15) (70) (19) (23) (10) - (31) (168)
Gross carrying value as of March 31, 2014 190 839 284 444 170 6 305 2,238
Accumulated depreciation as of April 1, 2013 - (275) (154) (240) (103) (3) - (775)
Depreciation - (49) (35) (109) (21) - - (214)
Accumulated depreciation on deletions - - - 4 - 1 - 5
Translation difference - 24 14 17 7 - - 62
Accumulated depreciation as of March 31, 2014 - (300) (175) (328) (117) (2) - (922)
Carrying value as of March 31, 2014 190 539 109 116 53 4 305 1,316
Carrying value as of April 1, 2013 157 498 77 107 44 2 306 1,191
Proceeds on sale of property, plant and equipment during the year ended March 31, 2014 was $1 million.
12

The existing and revised useful lives are as below:
Existing useful life
(Years)
Revised useful life
(Years)
15 22-25
5 5
2-5 3-5
5 5
5 5
(Dollars in millions)
Fiscal 2015 Fiscal 2016 After Fiscal 2016
(72) (24) 96
2.6 Goodwill
Following is a summary of changes in the carrying amount of goodwill:
(Dollars in millions)
September 30, 2014 March 31, 2014
Carrying value at the beginning 360 364
Translation differences (20) (4)
Carrying value at the end 340 360
(Dollars in millions)
Segment
September 30, 2014 March 31, 2014
Financial services 71 75
Insurance 49 50
Manufacturing 72 76
Energy, communication and services 33 35
Resources & utilities 15 16
Life sciences and Healthcare 20 22
Retail, consumer packaged goods and logistics 50 54
Growth markets 30 32
Total 340 360
In %
Long term growth rate 8-10
Operating margins 17-20
Discount rate 13.2
During the three months ended June 30, 2014, based on internal and external technical evaluation, management reassessed the remaining useful life of assets primarily consisting of buildings and
computers with effect from April 1, 2014. Accordingly the useful lives of certain assets required a change from the previous estimates.
The contractual commitments for capital expenditure were $275 million and $227 million as of September 30, 2014 and March 31, 2014, respectively.
As of
The above discount rate is based on the Weighted Average Cost of Capital (WACC) of the Company. These estimates are likely to differ from future actual results of operations and cash flows.
For the purpose of impairment testing, goodwill acquired in a business combination is allocated to the cash generating units (CGU) or groups of CGU’s, which are benefiting from the synergies
of the acquisition. The chief operating decision maker reviews the goodwill for any impairment at the operating segment level, which is represented through groups of CGU’s.
During the three months ended March 31, 2014, the company reorganized its business to strengthen its focus on growing existing client relationships and increasing market share through service
differentiation and operational agility. Consequent to the internal reorganization there were changes effected in the segments based on the “management approach” as defined in IFRS 8,
Operating Segments. (Refer to Note 2.15). Accordingly the goodwill has been allocated to the new operating segments as at September 30, 2014 and March 31, 2014.
The entire goodwill relating to Infosys BPO’s acquisition of McCamish has been allocated to the group of CGU’s which is represented by the 'Insurance' segment.
The goodwill relating to Infosys Lodestone and Portland acquisitions has been allocated to the groups of CGU’s which are represented by the entity’s operating segments.
The recoverable amount of a CGU is the higher of its fair value less cost to sell and its value-in-use. The fair value of a CGU is determined based on the market capitalization. The value-in-use is
determined based on specific calculations. These calculations use pre-tax cash flow projections over a period of five years, based on financial budgets approved by management and an average
of the range of each assumption mentioned below. As of March 31, 2014, the estimated recoverable amount of the CGU exceeded its carrying amount. The recoverable amount was computed
based on the fair value being higher than value-in-use and the carrying amount of the CGU was computed by allocating the net assets to operating segments for the purpose of impairment testing.
The key assumptions used for the calculations are as follows:
As of
Had the Group continued with the previously assessed useful lives, charge for depreciation and cost of sales for the three months and six months ended September 30, 2014 would have been
higher by $20 million and $43 million, respectively for assets held at April 1, 2014. The revision of the useful lives will result in the following changes in the depreciation expense as compared to
the original useful life of the assets:
Particulars
Increase /(decrease) in depreciation expense
The depreciation expense is included in cost of sales in the condensed consolidated interim statement of comprehensive income.
Carrying value of land includes $99 million and $60 million as of September 30, 2014 and March 31, 2014, respectively, towards deposits paid under certain lease-cum-sale agreements to
acquire land, including agreements where the company has an option to purchase or renew the properties on expiry of the lease period.
Vehicles
Category of assets
Building
Plant and machinery
Computer equipment
Furniture and fixtures
13

2.7 Financial instruments
Financial instruments by category
(Dollars in millions)
Loans and
receivables
Financial
assets/liabilities at
fair value through
profit and loss
Available for sale Trade and other
payables
Total carrying
value/fair value
Assets:
Cash and cash equivalents (Refer to Note 2.1) 4,604 - - - 4,604
Available-for-sale financial assets (Refer to Note 2.2) - - 824 - 824
Investment in certificates of deposit 17 - - - 17
Trade receivables 1,464 - - - 1,464
Unbilled revenue 477 - - - 477
Prepayments and other assets (Refer to Note 2.4) 250 - - - 250
Derivative financial instruments - 7 - - 7
Total 6,812 7 824 - 7,643
Liabilities:
Trade payables - - - 22 22
Derivative financial instruments - 4 - - 4
Client deposits - - - 4 4
Employee benefit obligation - - - 165 165
Other liabilities (Refer note 2.9) - - - 766 766
Total - 4 - 957 961
(Dollars in millions)
Loans and
receivables
Financial
assets/liabilities at
fair value through
profit and loss
Available for sale Trade and other
payables
Total carrying
value/fair value
Assets:
Cash and cash equivalents (Refer to Note 2.1) 4,331 - - - 4,331
- - 575 - 575
Investment in certificates of deposit 143 - - - 143
Trade receivables 1,394 - - - 1,394
Unbilled revenue 469 - - - 469
Prepayments and other assets 263 - - - 263
Derivative financial instruments - 36 - - 36
Total 6,600 36 575 - 7,211
Liabilities:
Trade payables - - - 29 29
Client deposits - - - 6 6
Employee benefit obligation - - - 159 159
Other liabilities (Refer note 2.9) - - - 687 687
Total - - - 881 881
Fair value hierarchy
Level 1 - Quoted prices (unadjusted) in active markets for identical assets or liabilities.
Level 2 – Inputs other than quoted prices included within Level 1 that are observable for the asset or liability, either directly (i.e. as prices) or indirectly (i.e. derived from prices).
Level 3 - Inputs for the assets or liabilities that are not based on observable market data (unobservable inputs).
The following table presents fair value hierarchy of assets and liabilities measured at fair value on a recurring basis as of September 30, 2014:
The carrying value and fair value of financial instruments by categories as of September 30, 2014 were as follows:
Available-for-sale financial assets (Refer to Note 2.2)
The carrying value and fair value of financial instruments by categories as of March 31, 2014 were as follows:
14

(Dollars in millions)
As of September
30, 2014
Level 1 Level 2 Level 3
Assets
587 587 - -
24 - 24 -
212 212 - -
1 - 1 -
7 - 7 -
Liabilities
4 - 4 -
(Dollars in millions)
As of March 31,
2014
Level 1 Level 2 Level 3
Assets
342 342 - -
25 - 25 -
207 207 - -
1 - 1 -
36 - 36 -
(Dollars in millions)
2014 2013 2014 2013
Interest income on deposits and certificates of deposit 106 83 209 174
Income from available-for-sale financial assets 12 10 25 18
118 93 234 192
Derivative financial instruments
(In millions)
September 30, 2014 March 31, 2014
Forward contracts
In U.S. dollars 752 751
In Euro 68 64
In United Kingdom Pound Sterling 72 77
In Australian dollars 85 75
Option contracts
In U.S. dollars - 20
The following table presents fair value hierarchy of assets and liabilities measured at fair value on a recurring basis as of March 31, 2014:
Fair value measurement at end of the reporting period
using
Fair value measurement at end of the reporting period
using
Available- for- sale financial asset- Investments in liquid mutual fund units
(Refer to Note 2.2)
Available- for- sale financial asset- Investments in fixed maturity plan securities
(Refer to Note 2.2)
Available- for- sale financial asset- Investments in quoted debt securities
(Refer to Note 2.2)
Available- for- sale financial asset- Investments in unquoted equity instruments
(Refer to Note 2.2)
Derivative financial instruments- gain on outstanding foreign exchange forward and option
contracts
Derivative financial instruments- loss on outstanding foreign exchange forward and option
contracts
Available- for- sale financial asset- Investments in unquoted equity instruments
(Refer to Note 2.2)
Income from financial assets or liabilities that are not at fair value through profit or loss is as follows:
Three months ended September 30, Six months ended September 30,
The company holds derivative financial instruments such as foreign exchange forward and option contracts to mitigate the risk of changes in exchange rates on foreign currency
exposures. The counterparty for these contracts is generally a bank or a financial institution. These derivative financial instruments are valued based on quoted prices for similar assets
and liabilities in active markets or inputs that are directly or indirectly observable in the marketplace. The following table gives details in respect of outstanding foreign exchange
forward and options contracts:
As of
The Group recognized a net gain on derivative financial instruments of $14 million and a net loss on derivative financial instruments of $57 million for the three months ended
September 30, 2014 and September 30, 2013, respectively, which is included under other income.
Derivative financial instruments- gain on outstanding foreign exchange forward and option
contracts
The Group recognized a net gain on derivative financial instruments of $27 million and a net loss on derivative financial instruments of $128 million for the six months ended September
30, 2014 and September 30, 2013, respectively, which is included under other income.
Available- for- sale financial asset- Investments in liquid mutual fund units
(Refer to Note 2.2)
Available- for- sale financial asset- Investments in fixed maturity plan securities
(Refer to Note 2.2)
Available- for- sale financial asset- Investments in quoted debt securities
(Refer to Note 2.2)
15

(Dollars in millions)
September 30, 2014 March 31, 2014
Not later than one month 199 198
Later than one month and not later than three months 471 467
Later than three months and not later than one year 357 393
1,027 1,058
Financial risk management
Financial risk factors
Market risk
(Dollars in millions)
September 30, 2014 March 31, 2014
1,027 1,058
Gain on outstanding forward and option contracts 7 36
4 -
(Dollars in millions)
U.S. dollars EuroUnited Kingdom
Pound Sterling
Australian
dollarsOther currencies Total
Cash and cash equivalents 181 16 23 40 66 326
Trade receivables 967 169 87 85 97 1,405
Unbilled revenue 277 69 22 26 37 431
Other assets 16 8 3 2 9 38
Trade payables (7) (2) (1) (1) (9) (20)
Client deposits (2) (2) - - - (4)
Accrued expenses (90) (25) (10) (4) (29) (158)
Employee benefit obligation (64) (12) (6) (22) (17) (121)
Other liabilities (117) (18) (5) (4) (69) (213)
Net assets / (liabilities) 1,161 203 113 122 85 1,684
(Dollars in millions)
U.S. dollars EuroUnited Kingdom
Pound Sterling
Australian
dollarsOther currencies Total
Cash and cash equivalents 144 17 33 30 63 287
Trade receivables 898 182 102 87 75 1,344
Unbilled revenue 271 64 22 32 41 430
Other assets 12 6 2 2 9 31
Trade payables (3) (3) (2) - (16) (24)
Client deposits (3) (3) - - - (6)
Accrued expenses (127) (26) (10) (6) (31) (200)
Employee benefit obligation (64) (12) (7) (22) (16) (121)
Other liabilities (75) (5) - (9) (50) (139)
Net assets / (liabilities) 1,053 220 140 114 75 1,602
The Group's activities expose it to a variety of financial risks - market risk, credit risk and liquidity risk. The Group's primary focus is to foresee the unpredictability of financial markets
and seek to minimize potential adverse effects on its financial performance. The primary market risk to the Group is foreign exchange risk. The Group uses derivative financial
instruments to mitigate foreign exchange related risk exposures. The Group's exposure to credit risk is influenced mainly by the individual characteristic of each customer and the
concentration of risk from the top few customers. The demographics of the customer including the default risk of the industry and country in which the customer operates also has an
influence on credit risk assessment.
The Group operates internationally and a major portion of the business is transacted in several currencies and consequently the Group is exposed to foreign exchange risk through its
sales and services in the United States and elsewhere, and purchases from overseas suppliers in various foreign currencies. The Group uses derivative financial instruments such as
foreign exchange forward and option contracts to mitigate the risk of changes in exchange rates on foreign currency exposures. The exchange rate between the rupee and foreign
currencies has changed substantially in recent years and may fluctuate substantially in the future. Consequently, the results of the Group’s operations are adversely affected as the Indian
rupee appreciates / depreciates against these currencies.
As of
The outstanding foreign exchange forward and option contracts as of September 30, 2014 and March 31, 2014, mature within twelve months.
The following table analyses foreign currency risk from financial instruments as of September 30, 2014:
The following table analyses foreign currency risk from financial instruments as of March 31, 2014:
As of
For the three months ended September 30, 2014 and September 30, 2013, every percentage point depreciation / appreciation in the exchange rate between the Indian rupee and the
U.S. dollar has affected the company's incremental operating margins by approximately 0.54% and 0.46%, respectively.
Aggregate amount of outstanding forward and option contracts
Loss on outstanding forward and option contracts
For the six months ended September 30, 2014 and September 30, 2013, every percentage point depreciation / appreciation in the exchange rate between the Indian rupee and the U.S.
dollar has affected the company's incremental operating margins by approximately 0.53% and 0.46%, respectively.
Sensitivity analysis is computed based on the changes in the income and expenses in foreign currency upon conversion into functional currency, due to exchange rate fluctuations
between the previous reporting period and the current reporting period.
The following table gives details in respect of the outstanding foreign exchange forward and option contracts:
The foreign exchange forward and option contracts mature within 12 months. The table below analyses the derivative financial instruments into relevant maturity groupings based on
the remaining period as of the balance sheet date:
16
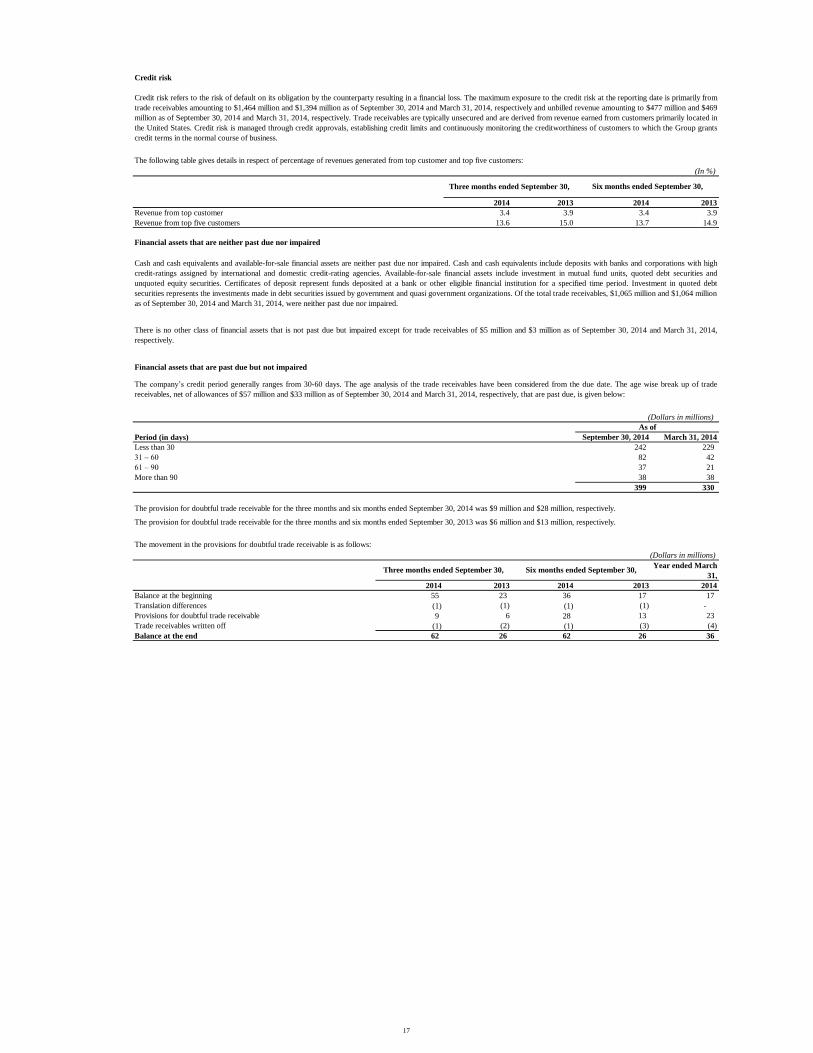
Credit risk
(In %)
2014 2013 2014 2013
Revenue from top customer 3.4 3.9 3.4 3.9
Revenue from top five customers 13.6 15.0 13.7 14.9
Financial assets that are past due but not impaired
(Dollars in millions)
Period (in days) September 30, 2014 March 31, 2014
Less than 30 242 229
31 – 60 82 42
61 – 90 37 21
More than 90 38 38
399 330
(Dollars in millions)
Year ended March
31,
2014 2013 2014 2013 2014
Balance at the beginning 55 23 36 17 17
Translation differences (1) (1) (1) (1) -
Provisions for doubtful trade receivable 9 6 28 13 23
Trade receivables written off (1) (2) (1) (3) (4)
Balance at the end 62 26 62 26 36
The provision for doubtful trade receivable for the three months and six months ended September 30, 2014 was $9 million and $28 million, respectively.
Cash and cash equivalents and available-for-sale financial assets are neither past due nor impaired. Cash and cash equivalents include deposits with banks and corporations with high
credit-ratings assigned by international and domestic credit-rating agencies. Available-for-sale financial assets include investment in mutual fund units, quoted debt securities and
unquoted equity securities. Certificates of deposit represent funds deposited at a bank or other eligible financial institution for a specified time period. Investment in quoted debt
securities represents the investments made in debt securities issued by government and quasi government organizations. Of the total trade receivables, $1,065 million and $1,064 million
as of September 30, 2014 and March 31, 2014, were neither past due nor impaired.
There is no other class of financial assets that is not past due but impaired except for trade receivables of $5 million and $3 million as of September 30, 2014 and March 31, 2014,
respectively.
The company’s credit period generally ranges from 30-60 days. The age analysis of the trade receivables have been considered from the due date. The age wise break up of trade
receivables, net of allowances of $57 million and $33 million as of September 30, 2014 and March 31, 2014, respectively, that are past due, is given below:
As of
The movement in the provisions for doubtful trade receivable is as follows:
Financial assets that are neither past due nor impaired
Three months ended September 30, Six months ended September 30,
The provision for doubtful trade receivable for the three months and six months ended September 30, 2013 was $6 million and $13 million, respectively.
The following table gives details in respect of percentage of revenues generated from top customer and top five customers:
Three months ended September 30, Six months ended September 30,
Credit risk refers to the risk of default on its obligation by the counterparty resulting in a financial loss. The maximum exposure to the credit risk at the reporting date is primarily from
trade receivables amounting to $1,464 million and $1,394 million as of September 30, 2014 and March 31, 2014, respectively and unbilled revenue amounting to $477 million and $469
million as of September 30, 2014 and March 31, 2014, respectively. Trade receivables are typically unsecured and are derived from revenue earned from customers primarily located in
the United States. Credit risk is managed through credit approvals, establishing credit limits and continuously monitoring the creditworthiness of customers to which the Group grants
credit terms in the normal course of business.
17

Liquidity risk
(Dollars in millions)
Particulars Less than 1 year 1-2 years 2-4 years 4-7 years Total
Trade payables 22 - - - 22
Client deposits 4 - - - 4
711 - - - 711
Incentive accruals on an undiscounted basis (Refer note 2.9) - - 2 - 2
- 68 - - 68
(Dollars in millions)
Particulars Less than 1 year 1-2 years 2-4 years 4-7 years Total
Trade payables 29 - - - 29
Client deposits 6 - - - 6
640 - - - 640
Incentive accruals on an undiscounted basis (Refer note 2.9) - 4 - - 4
- 55 - - 55
Offsetting of financial assets and financial liabilities:
The following table provides quantitative information about offsetting of derivative financial assets and derivative financial liabilities:
(Dollars in millions)
Derivative
financial asset
Derivative
financial liability
Derivative
financial
asset
Derivative
financial liability
Gross amount of recognised financial asset/liability 9 (6) 36 -
Amount set off (2) 2 - -
Net amount presented in balance sheet 7 (4) 36 -
2.8 Provisions
Provisions comprise the following:
(Dollars in millions)
September 30, 2014 March 31, 2014
66 63
- -
66 63
Other liabilities (excluding liabilities towards acquisition and incentive
accruals - Refer Note 2.9)
Liability towards acquisitions on an undiscounted basis (Refer Note 2.9)
Other liabilities (excluding liabilities towards acquisition and incentive
accruals - Refer Note 2.9)
Liability towards acquisitions on an undiscounted basis (Refer Note 2.9)
As of September 30, 2014 and March 31, 2014, the outstanding employee benefit obligations were $165 million and $159 million, respectively, which have been fully funded. Further,
as of September 30, 2014 and March 31, 2014, the Group had no outstanding bank borrowings. Accordingly, no liquidity risk is perceived.
As of September 30, 2014, the Group had a working capital of $5,902 million including cash and cash equivalents of $4,604 million, current available-for-sale financial assets of $611
million and investment in certificates of deposit of $17 million. As of March 31, 2014, the Group had a working capital of $5,656 million including cash and cash equivalents of $4,331
million, current available-for-sale financial assets of $367 million and investment in certificates of deposit of $143 million.
The table below provides details regarding the contractual maturities of significant financial liabilities as of September 30, 2014:
The table below provides details regarding the contractual maturities of significant financial liabilities as of March 31, 2014:
As of September 30, 2014 and March 31, 2014, the Group had outstanding financial guarantees of $7 million and $6 million, towards leased premises. These financial guarantees can
be invoked upon breach of any term of the lease agreement. To the Group’s knowledge there has been no breach of any term of the lease agreement as of September 30, 2014 and
March 31, 2014.
As of
Provision for post sales client support and other provisions represents costs associated with providing sales support services which are accrued at the time of recognition of revenues
and are expected to be utilized over a period of 6 months to 1 year. The movement in the provision for post sales client support and other provisions is as follows:
Provision for post sales client support and other provisions
Provision towards visa related matters (Refer to note 2.16)
As of As of
September 30, 2014 March 31, 2014
The group offsets a financial asset and a financial liability when it currently has a legally enforceable right to set off the recognised amounts and the group intends either to settle on a
net basis, or to realise the asset and settle the liability simultaneously.
18

(Dollars in millions)
Balance at the beginning 62 63
Translation differences (2) (2)
Provision recognized/(reversed) 8 11
Provision utilized (2) (6)
Balance at the end 66 66
Provision towards visa related matters amounting to $35 million (including legal costs) was created and paid during the year ended March 31, 2014.
2.9 Other liabilities
Other liabilities comprise the following:
(Dollars in millions)
September 30, 2014 March 31, 2014
Current
Accrued compensation to employees 378 266
Accrued expenses 280 308
Withholding taxes payable (1) 183 152
Retainage 14 14
Liabilities of controlled trusts 25 25
Premiums held in trust (2) 3 23
Accrued gratuity 1 -
Others 10 4
894 792
Non-Current
Liability towards acquisition of business 55 43
Incentive accruals - 4
Deferred income - government grant on land use rights (1) 8 7
63 54
957 846
766 687
Financial liability towards acquisitions on an undiscounted basis 68 55
Financial liability towards incentive accruals on an undiscounted basis 2 4
2.10 Employee benefits
(2) Represents premiums collected from policyholders and payable to insurance providers by a service provider maintaining the amounts in fiduciary capacity (Refer
to Note 2.4).
The Group has adopted Revised IAS 19 with effect from April 1, 2013. The impact on account of the revision in accounting policy was a reduction in retained earnings by $6 million
and an increase in other comprehensive income by $9 million. The reduction in retained earnings by $6 million includes a write back of unamortised negative past service cost of $3
million.
Financial liabilities included in other liabilities
(1) Non financial liabilities
Accrued expenses primarily relate to cost of technical sub-contractors, telecommunication charges, legal and professional charges, brand building expenses, overseas travel expenses
and office maintenance. Others include unclaimed dividend balances.
As of
Provision for post sales client support and other provisions for the three months and six months ended September 30, 2014 and September 30, 2013 is included in cost of sales in the
consolidated statement of comprehensive income.
As of September 30, 2014 and March 31, 2014, claims against the company, not acknowledged as debts, net of amounts paid (excluding demands from Indian income tax authorities-
Refer to Note 2.12) amounted to $30 million (`184 crore) and $27 million (`163 crore), respectively.
Six months ended
September 30,
2014
Three months ended
September 30, 2014
19

2.11 Employees' Stock Option Plans (ESOP)
The weighted average fair value of RSUs on grant date was approximately $55.
The fair value of each RSU is estimated on the date of grant using the Black-Scholes-Merton model with the following assumptions:
Particulars
Weighted average share price ($) 58
Exercise price ($) 0.08
Expected volatility (%) 30 - 37
Expected life of the option (years) 1 - 4
Expected dividends (%) 1.84
Risk-free interest rate (%) 8 - 9
The activity in the 2011 Plan during the three months and six months ended September 30, 2014 is set out below:
Particulars
Shares arising out
of options
Weighted average
exercise price ($)
Shares arising out
of options
Weighted average
exercise price ($)
2011 Plan:
Outstanding at the beginning - - - -
Granted 22,794 0.08 22,794 0.08
Forfeited and expired - - - -
Exercised - - - -
Outstanding at the end 22,794 0.08 22,794 0.08
Exercisable at the end - - - -
2.12 Income taxes
(Dollars in millions)
2014 2013 2014 2013
Current taxes
Domestic taxes 163 140 319 277
Foreign taxes 49 31 90 51
212 171 409 328
Deferred taxes
Domestic taxes 1 (3) (2) (7)
Foreign taxes (5) (19) (6) (19)
(4) (22) -8 (26)
Income tax expense 208 149 401 302
Entire deferred income tax for the three months and six months ended September 30, 2014 and September 30, 2013 relates to origination and reversal of temporary differences.
For the three months and six months ended September 30, 2013, a reversal of deferred tax liability of $1 million each, respectively, relating to available-for-sale financial assets has been
recognized in other comprehensive income.
Income tax expense for the three months ended September 30, 2014 and September 30, 2013 includes reversals (net of provisions) of $5 million and less than $1 million pertaining to
earlier periods.
The revision in the useful life of assets held at April 1, 2014 has resulted in a decrease in deferred tax credit by $7 million and $14 million for the three months and six months ended
September 30, 2014 and will result in a decrease in deferred tax credit by $29 million for the year ended March 31, 2015. (Refer to Note 2.5)
Income tax expense for the six months ended September 30, 2014 and September 30, 2013 includes reversals (net of provisions) of $8 million and $3 millions each pertaining to earlier
periods.
For the three months and six months ended September 30, 2014, a reversal of deferred tax asset of less than $1 million and $2 million, respectively, relating to available-for-sale financial
assets has been recognized in other comprehensive income.
2011 RSU Plan (the 2011 Plan): The Company has a 2011 RSU Plan which provides for the grant of restricted stock units (RSUs) to eligible employees of the Company. The Board of
Directors recommended establishment of the 2011 Plan to the shareholders on August 30, 2011 and the shareholders approved the recommendation of the Board of Directors October 17,
2011 through a postal ballot. The maximum aggregate number of shares that may be awarded under the Plan is 2,833,600 shares (currently held by the Infosys Limited Employees
Welfare Trust) and the plan shall continue in effect for a term of 10 years from the date of initial grant under the plan. The RSUs will be issued at par value of the equity share. The 2011
Plan is administered by the Management Development and Compensation Committee (the Committee). The Committee is comprised of independent members of the Board of
Directors.
During August 2014, the company granted 22,794 RSUs under the 2011 Plan .The RSUs will vest over a period of four years from the date of the grant in the proportions specified in the
award agreement and expire seven days from the date of vesting. The RSUs will vest subject to achievement of certain key performance indicators as set forth in the award agreement for
each applicable year of the vesting tranche and continued employment through each vesting date.
Six months ended
September 30, 2014
Three months ended
September 30, 2014
Income tax expense in the consolidated statement of comprehensive income comprises:
Six months ended September 30,
The fair value of each RSU is estimated on the date of grant using the Black-Scholes-Merton valuation model. The expected term of the RSU is estimated based on the vesting term and
contractual term of the RSU, as well as expected exercise behaviour of the employee who receives the RSU. Expected volatility during the expected term of the RSU is based on
historical volatility of the observed market prices of the company's publicly traded equity shares during a period equivalent to the expected term of the RSU.
During each of the three months and six months ended September 30, 2014, the company recorded an employee compensation expense of less than $1 million in the statement of
comprehensive income.
Three months ended September 30,
The weighted average remaining contractual life of RSUs outstanding as of September 30, 2014 under the 2011 Plan was 2.89 years.
Three months ended September 30,
2014
20

(Dollars in millions)
2014 2013 2014 2013
Profit before income taxes 719 532 1,394 1,103
Enacted tax rates in India 33.99% 33.99% 33.99% 33.99%
Computed expected tax expense 245 181 474 375
Tax effect due to non-taxable income for Indian tax purposes (69) (68) (134) (126)
Overseas taxes 34 26 64 45
Tax reversals, overseas and domestic (5) - (8) (3)
Effect of differential overseas tax rates (1) - (2) -
Effect of exempt income (4) (3) (9) (6)
Effect of unrecognized deferred tax assets - 1 3 4
Branch profit tax - (8) - (8)
Effect of non-deductible expenses 12 24 18 29
Additional deduction on research and development expense (3) (4) (5) (8)
Others (1) - - -
Income tax expense 208 149 401 302
2.13 Earnings per equity share
Three months ended September 30,
2014 2013 2014 2013
Basic earnings per equity share - weighted average number of equity shares outstanding(1) 571,402,566 571,402,566 571,402,566 571,402,566
Effect of dilutive common equivalent shares 1,462 - 731 -
571,404,028 571,402,566 571,403,297 571,402,566
(1) Excludes treasury shares
For the three months and six months ended September 30, 2014 and September 30, 2013, there were no outstanding options to purchase equity shares which had an anti-dilutive effect.
Demands from the Indian Income tax authorities include payment of additional tax of $251 million (`1,548 crore), including interest of $70 million (`430 crore) upon completion of
their tax review for fiscal 2006, fiscal 2007, fiscal 2008 and fiscal 2009. These income tax demands are mainly on account of disallowance of a portion of the deduction claimed by the
company under Section 10A of the Income Tax Act. The deductible amount is determined by the ratio of export turnover to total turnover. The disallowance arose from certain
expenses incurred in foreign currency being reduced from export turnover but not reduced from total turnover. The tax demand for fiscal 2007, fiscal 2008 and fiscal 2009 also includes
disallowance of portion of profit earned outside India from the STP units and disallowance of profits earned from SEZ units. The matter for fiscal 2006, fiscal 2007, fiscal 2008 and fiscal
2009 are pending before the Commissioner of Income tax (Appeals), Bangalore. The company is contesting the demand and the management including its tax advisors believes that its
position will likely be upheld in the appellate process. The management believes that the ultimate outcome of these proceedings will not have a material adverse effect on the Company's
financial position and results of operations.
The following is a reconciliation of the equity shares used in the computation of basic and diluted earnings per equity share:
Six months ended September 30,
As of September 30, 2014, claims against the Group not acknowledged as debts from the Indian Income tax authorities, net of amount paid to the authorities of $278 million (`1,714
crore), amounted to $1 million (`9 crore). As of March 31, 2014, claims against the Group not acknowledged as debts from the Indian Income tax authorities, net of amount paid to the
authorities of $286 million (`1,716 crore), amounted to $3 million (`19 crore).
Diluted earnings per equity share - weighted average number of equity shares and common
equivalent shares outstanding
The foreign tax expense is due to income taxes payable overseas, principally in the United States. In India, the company has benefited from certain tax incentives that the Government of
India had provided to the export of software from the units registered under the Software Technology Parks Scheme (STP) and the company continues to benefit from certain tax
incentives for the units registered under the Special Economic Zones Act, 2005 (SEZ). However, the income tax incentives provided by the Government of India for STP units have
expired, and all the STP units are now taxable. SEZ units which began providing services on or after April 1, 2005 are eligible for a deduction of 100 percent of profits or gains derived
from the export of services for the first five years from the financial year in which the unit commenced the provision of services and 50 percent of such profits or gains for a further five
years. Certain tax benefits are also available for a further period of five years subject to the unit meeting defined conditions.
A reconciliation of the income tax provision to the amount computed by applying the statutory income tax rate to the income before income taxes is summarized below:
Six months ended September 30,
The applicable Indian statutory tax rate for fiscal 2015 and fiscal 2014 is 33.99%.
During the six months ended September 30, 2014 and September 30, 2013, the company received weighted tax deduction on eligible research and development expenditures based on
the approval received from Department of Scientific and Industrial Research (DSIR) on November 23, 2011 which has been renewed up to March 31, 2017 with effect from April 1,
2014. The weighted tax deduction is equal to 200% of such expenditures incurred.
Three months ended September 30,
21

2.14 Related party transactions
Transactions with key management personnel
(Dollars in millions)
2014 2013 2014 2013
1 2 3 4
Commission and other benefits to non-executive/ independent directors - 1 - 1
Total 1 3 3 5
* Executive Council dissolved effective April 1, 2014 and Executive officers have been appointed with effect from that date.
2.15
Infosys has provided guarantee for performance of certain contracts entered into by its subsidiaries.
Six months ended September 30,
Segment Reporting
IFRS 8 establishes standards for the way that public business enterprises report information about operating segments and related disclosures about products and services,
geographic areas, and major customers. The Company's operations predominantly relate to providing end-to-end business solutions to enable clients to enhance business
performance. During the three months ended March 31, 2014, the Company reorganized its segments to strengthen its focus on growing existing client relationships and
increasing market share through service differentiation and operational agility. Consequent to the internal reorganization there were changes effected in the reportable business
segments based on the "management approach" as defined in IFRS 8, Operating Segments. The Chief Operating Decision Maker evaluates the Company's performance and
allocates resources based on an analysis of various performance indicators by business segments and geographic segments. Accordingly, information has been presented both along
business segments and geographic segments. The accounting principles used in the preparation of the financial statements are consistently applied to record revenue and
expenditure in individual segments, and are as set out in the significant accounting policies.
Business segments of the company is determined based on (i) industry class of the customers (outside of the growth markets) and; (ii) presence of customers in growth markets
across industry classes. Business segments of the Company are primarily enterprises in Financial Services and Insurance (FSI) , enterprises in Manufacturing (MFG), enterprises in
the Energy & utilities, Communication and Services (ECS), enterprises in Retail, Consumer packaged goods and Logistics (RCL), enterprises in Life Sciences and Healthcare
(LSH) and enterprises in Growth Markets (GMU) comprising enterprises in APAC (Asia Pacific) and Africa. The FSI reportable segments have been aggregated to include the
Financial Services operating segment and Insurance operating segment and the ECS reportable segment has been aggregated to include Energy, Communication and Services
operating segment and Resources & Utilities operating segments. Geographic segmentation is based on business sourced from that geographic region and delivered from both on-
site and off-shore. North America comprises the United States of America, Canada and Mexico, Europe includes continental Europe (both the east and the west), Ireland and the
United Kingdom, and the Rest of the World comprising all other places except those mentioned above and India. Consequent to the above change in the composition of reportable
business segments, the prior year comparatives have been restated.
Salaries and other employee benefits to whole-time directors and members of executive
council*
Revenue and identifiable operating expenses in relation to segments are categorized based on items that are individually identifiable to that segment. Allocated expenses of
segments include expenses incurred for rendering services from the company's offshore software development centres and on-site expenses, which are categorized in relation to the
associated turnover of the segment. Certain expenses such as depreciation, which form a significant component of total expenses, are not specifically allocable to specific segments
as the underlying assets are used interchangeably. Management believes that it is not practical to provide segment disclosures relating to those costs and expenses, and accordingly
these expenses are separately disclosed as "unallocated" and adjusted against the total income of the Company.
Assets and liabilities used in the company's business are not identified to any of the reportable segments, as these are used interchangeably between segments. Management
believes that it is currently not practicable to provide segment disclosures relating to total assets and liabilities since a meaningful segregation of the available data is onerous.
Geographical information on revenue and business segment revenue information is collated based on individual customers invoiced or in relation to which the revenue is otherwise
recognized.
The table below describes the compensation to key management personnel which comprise directors and members of the executive council:
Three months ended September 30,
22
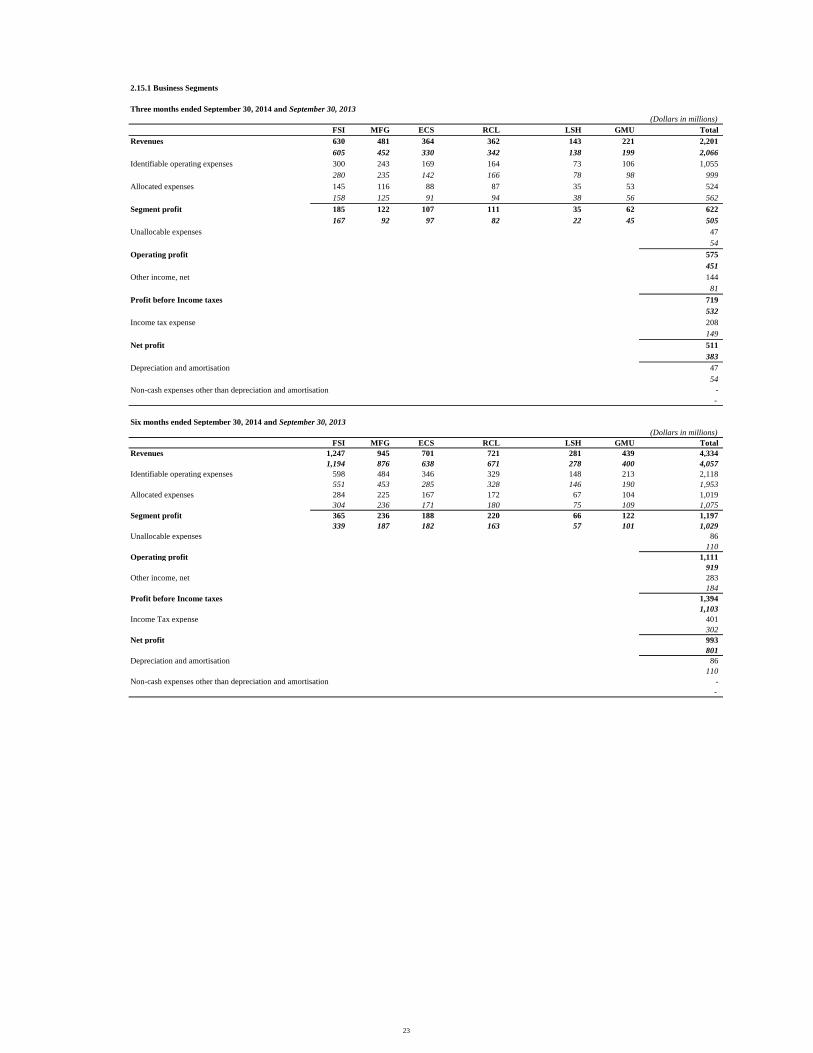
2.15.1 Business Segments
Three months ended September 30, 2014 and September 30, 2013
(Dollars in millions)
FSI MFG ECS RCL LSH GMU Total
Revenues 630 481 364 362 143 221 2,201
605 452 330 342 138 199 2,066
Identifiable operating expenses 300 243 169 164 73 106 1,055
280 235 142 166 78 98 999
Allocated expenses 145 116 88 87 35 53 524
158 125 91 94 38 56 562
Segment profit 185 122 107 111 35 62 622
167 92 97 82 22 45 505
Unallocable expenses 47
54
Operating profit 575
451
Other income, net 144
81
Profit before Income taxes 719
532
Income tax expense 208
149
Net profit 511
383
Depreciation and amortisation 47
54
Non-cash expenses other than depreciation and amortisation -
-
Six months ended September 30, 2014 and September 30, 2013
(Dollars in millions)
FSI MFG ECS RCL LSH GMU Total
Revenues 1,247 945 701 721 281 439 4,334
1,194 876 638 671 278 400 4,057
Identifiable operating expenses 598 484 346 329 148 213 2,118
551 453 285 328 146 190 1,953
Allocated expenses 284 225 167 172 67 104 1,019
304 236 171 180 75 109 1,075
Segment profit 365 236 188 220 66 122 1,197
339 187 182 163 57 101 1,029
Unallocable expenses 86
110
Operating profit 1,111
919
Other income, net 283
184
Profit before Income taxes 1,394
1,103
Income Tax expense 401
302
Net profit 993
801
Depreciation and amortisation 86
110
Non-cash expenses other than depreciation and amortisation -
-
23

2.15.2 Geographic Segments
Three months ended September 30, 2014 and September 30, 2013
(Dollars in millions)
North America Europe India Rest of the
World
Total
Revenues 1,338 543 49 271 2,201
1,271 495 50 250 2,066
646 258 26 125 1,055
623 236 20 120 999
322 130 11 61 524
365 128 11 58 562
Segment profit 370 155 12 85 622
283 131 19 72 505
47
54
Operating profit 575
451
144
81
Profit before Income taxes 719
532
208
149
Net profit 511
383
47
54
-
-
Six months ended September 30, 2014 and September 30, 2013
(Dollars in millions)
North America Europe India Rest of the
World
Total
Revenues 2,635 1,065 100 534 4,334
2,494 965 102 496 4,057
1,277 524 67 250 2,118
1,214 466 44 229 1,953
627 252 21 119 1,019
684 250 22 119 1,075
Segment profit 731 289 12 165 1,197
596 249 36 148 1,029
86
110
Operating profit 1,111
919
283
184
Profit before Income taxes 1,394
1,103
401
302
Net profit 993
801
86
110
Non-cash expenses other than depreciation and amortisation -
-
2.15.3 Significant clients
Non-cash expenses other than depreciation and amortisation
Identifiable operating expenses
Allocated expenses
Unallocable expenses
Identifiable operating expenses
Allocated expenses
Unallocable expenses
Other income, net
Income Tax expense
Other income, net
Income Tax expense
Depreciation and amortisation
No client individually accounted for more than 10% of the revenues for the three months and six months ended September 30, 2014 and September 30, 2013.
Depreciation and amortisation
24

2.16 Litigation
2.17 Corporate Social Responsibility (CSR)
2.18 Break-up of expenses
Cost of sales
(Dollars in millions)
2014 2013 2014 2013
Employee benefit costs 1,092 1,083 2,183 2,111
Deferred purchase price pertaining to acquisition 10 7 19 14
Depreciation and amortisation 47 54 86 110
Travelling costs 58 58 116 122
Cost of technical sub-contractors 84 84 159 168
Cost of software packages for own use 29 23 67 50
Third party items bought for service delivery to clients 6 6 15 13
Operating lease payments 9 8 18 17
Communication costs 6 7 13 13
Repairs and maintenance 4 4 10 9
Provision for post-sales client support 3 (1) 4 (3)
Other expenses 5 4 7 9
Total 1,353 1,337 2,697 2,633
Sales and marketing expenses
(Dollars in millions)
2014 2013 2014 2013
Employee benefit costs 103 101 196 185
Travelling costs 12 8 21 15
Branding and marketing 7 6 12 12
Operating lease payments 2 1 3 3
Consultancy and professional charges - - 1 2
Communication costs 2 1 2 2
Other expenses 1 3 3 4
Total 127 120 238 223
On May 23, 2011, the company received a subpoena from a grand jury in the United States District Court for the Eastern District of Texas. The
subpoena required that the company provide to the grand jury certain documents and records related to its sponsorships for, and uses of, B1
business visas.
In addition, the U.S. Department of Homeland Security (“DHS”) has reviewed the company’s employer eligibility verifications on Form I-9 with
respect to its employees working in the United States. In connection with this review, the company was advised that the DHS has found errors in a
significant percentage of its Forms I-9 that the DHS has reviewed, and may impose fines and penalties on the company related to such alleged
errors.
On October 30, 2013, the company settled the foregoing matters and entered into a Settlement Agreement (“Settlement Agreement”) with the U.S.
Attorney, the DHS and the United States Department of State (“State,” and collectively with the U.S. Attorney and the DHS, the “United States”).
In the Settlement Agreement, the company denied and disputed all allegations made by the United States, except for the allegation that the
company failed to maintain accurate Forms I-9 records for many of its foreign nationals in the United States in 2010 and 2011 as required by law,
and that such failure constituted civil violations of certain laws.
During the year ended March 31, 2014 the Company recorded a charge related to the settlement agreement (including legal costs) of $35 million
related to the matters that were the subject of the Settlement agreement. The said amount was paid prior to December 31, 2013.
In addition, the company is subject to legal proceedings and claims, which have arisen in the ordinary course of business. The company’s
management does not reasonably expect that these legal actions, when ultimately concluded and determined, will have a material and adverse
effect on the company’s results of operations or financial condition.
Three months ended September 30,
Three months ended September 30,
Administrative expenses for three months and six months ended September 30, 2014 includes contribution to Infosys Foundation towards CSR.
Consequent to the requirements of the Companies Act, 2013, a CSR committee has been formed by the company to formulate and monitor the
CSR policy of the company. The proposed areas for CSR activities are eradication of hunger, poverty and malnutrition and the promotion of
education and healthcare and rural development projects. The funds will be allocated to a corpus and utilised through the year on these activities
which are specified in Schedule VII of the Indian Companies Act, 2013.
Six months ended September 30,
Six months ended September 30,
25

Administrative expenses
(Dollars in millions)
2014 2013 2014 2013
Employee benefit costs 45 44 90 85
Consultancy and professional charges 14 16 21 32
Repairs and maintenance 22 18 41 36
Power and fuel 10 9 19 19
Communication costs 10 10 22 21
Travelling costs 9 5 16 12
Rates and taxes 5 4 9 8
Operating lease payments 2 3 5 6
Insurance charges 2 2 4 4
Provisions for doubtful trade receivable 9 6 28 13
13 - 21 -
Other expenses (Refer to Note 2.16) 5 41 12 46
Total 146 158 288 282
2.19 Dividends
2.20 Share capital
The Board in its meeting held on October 10, 2014 has considered and approved and recommended a bonus issue of one equity share for every
equity share held, and a bonus issue, viz., a stock dividend of one American Depositary Share (ADS) for every ADS held, respectively, as on a
record date to be determined. Consequently, the ratio of equity shares underlying the ADSs held by an American Depositary Receipt holder would
remain unchanged.
The Board approved and recommended the issuance in order to increase the liquidity of its shares and to expand the retail shareholder base.
The bonus issue of equity shares and ADSs will be subject to approval by the shareholders, through a postal ballot, and any other applicable
statutory and regulatory approvals. Accordingly, the record date for the bonus issues of equity shares and ADSs will be announced in due course.
The Board of Directors, in their meeting on October 10, 2014, declared an interim dividend of approximately $0.49 per equity share (`30 per
equity share), which would result in a cash outflow of approximately $335 million, inclusive of corporate dividend tax.
Three months ended September 30, Six months ended September 30,
Contributions to Infosys Foundation towards CSR (Refer
Note 2.17)
26