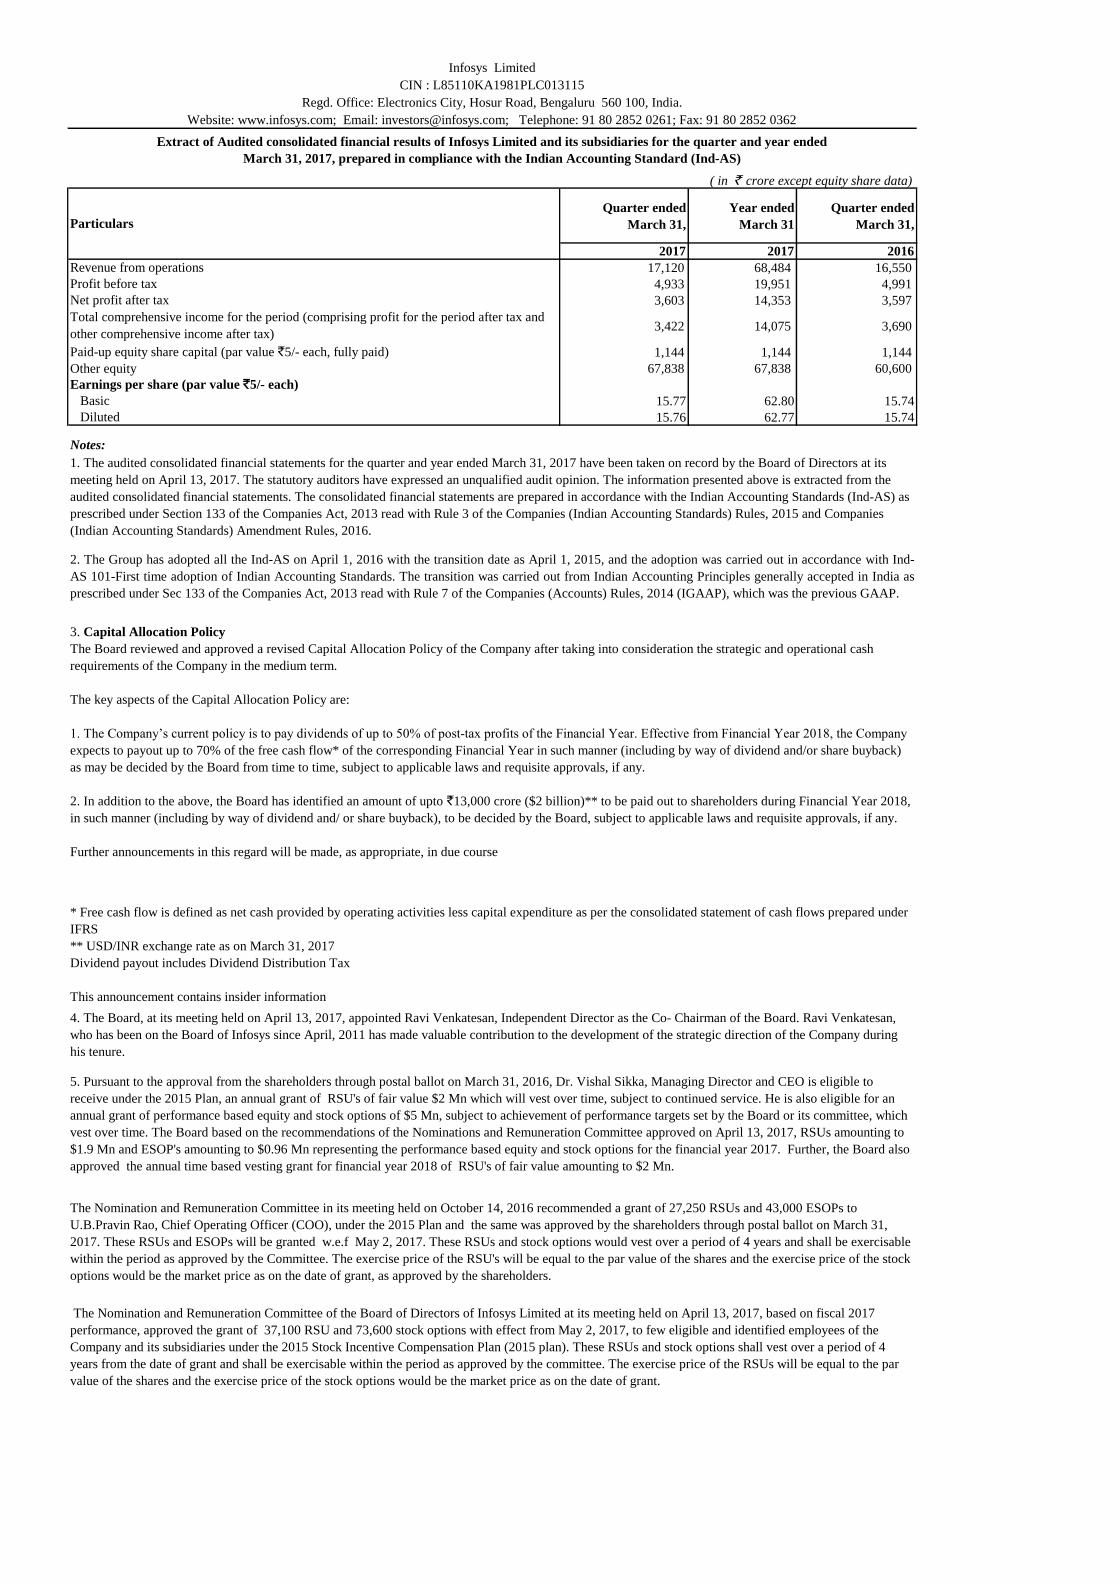
infosys limited cin : l85110ka1981plc013115 regd. office ......* free cash flow is defined as net...
TRANSCRIPT

Quarter
ended
March 31,
Quarter
ended
December 31,
Quarter
ended
March 31,
2017 2016 2016 2017 2016
Audited Audited Audited Audited Audited
Revenue from operations 17,120 17,273 16,550 68,484 62,441
Other income, net 746 820 772 3,080 3,123
Total Income 17,866 18,093 17,322 71,564 65,564
Expenses
Employee benefit expenses 9,309 9,420 9,024 37,659 34,406
Deferred consideration pertaining to acquisition - - - - 149
Cost of technical sub-contractors 1,000 975 925 3,833 3,531
Travel expenses 474 502 595 2,235 2,263
Cost of software packages and others 478 461 330 1,597 1,274
Communication expenses 149 145 117 549 449
Consultancy and professional charges 229 165 213 763 779
Depreciation and amortisation expenses 446 433 419 1,703 1,459
Other expenses 823 838 707 3,244 2,511
Total expenses 12,908 12,939 12,330 51,583 46,821
Profit before non-controlling interest / share in net profit / (loss) of
associate 4,958 5,154 4,992 19,981 18,743
Share in net profit/(loss) of associate and others (25) - (1) (30) (3)
Profit before tax 4,933 5,154 4,991 19,951 18,740
Tax expense:
Current tax 1,249 1,468 1,426 5,653 5,318
Deferred tax 81 (22) (32) (55) (67)
Profit for the period 3,603 3,708 3,597 14,353 13,489
Other comprehensive income
Items that will not be reclassified subsequently to profit or loss
Remeasurement of the net defined benefit liability/asset 20 (8) (3) (45) (12)
Equity instruments through other comprehensive income (5) - - (5) -
15 (8) (3) (50) (12)
Items that will be reclassified subsequently to profit or loss
Fair value changes on derivatives designated as cash flow hedges, net 11 26 - 39 -
Exchange differences on translation of foreign operations (197) (47) 96 (257) 303
Fair value changes on investments (10) - - (10) -
(196) (21) 96 (228) 303
Total other comprehensive income, net of tax (181) (29) 93 (278) 291
Total comprehensive income for the period 3,422 3,679 3,690 14,075 13,780
Paid up share capital (par value `5/- each, fully paid) 1,144 1,144 1,144 1,144 1,144
Other equity 67,838 60,600 60,600 67,838 60,600
Earnings per equity share (par value `5/- each)
Basic (`) 15.77 16.22 15.74 62.80 59.02
Diluted (`) 15.76 16.22 15.74 62.77 59.02
Notes:
Year ended
March 31,
Particulars
CIN : L85110KA1981PLC013115
Infosys Limited
Regd. Office: Electronics City, Hosur Road, Bengaluru 560 100, India.
(in ` crore, except per equity share data)
1. The audited consolidated financial statements for the quarter and year ended March 31, 2017 have been taken on record by the Board of Directors at its meeting held on
April 13, 2017. The statutory auditors have expressed an unqualified audit opinion. The information presented above is extracted from the audited consolidated financial
statements. The consolidated financial statements are prepared in accordance with the Indian Accounting Standards (Ind-AS) as prescribed under Section 133 of the
Companies Act, 2013 read with Rule 3 of the Companies (Indian Accounting Standards) Rules, 2015 and Companies (Indian Accounting Standards) Amendment Rules, 2016.
Audited consolidated financial results of Infosys Limited and its subsidiaries for the quarter and year ended March 31, 2017
prepared in compliance with the Indian Accounting Standard (Ind-AS)
2. The Group has adopted all the Ind-AS on April 1, 2016 with the transition date as April 1, 2015, and the adoption was carried out in accordance with Ind-AS 101-First time
adoption of Indian Accounting Standards. The transition was carried out from Indian Accounting Principles generally accepted in India as prescribed under Sec 133 of the
Companies Act, 2013 read with Rule 7 of the Companies (Accounts) Rules, 2014 (IGAAP), which was the previous GAAP.
Website: www.infosys.com; Email: [email protected]; Telephone: 91 80 2852 0261; Fax: 91 80 2852 0362

6. Information on dividends for the quarter and year ended March 31, 2017
(in ` )
Particulars
Quarter
ended
March 31,
Quarter
ended
December 31,
Quarter
ended
March 31,
2017 2016 2016 2017 2016
- - - 11.00 10.00
14.75 - 14.25 14.75 14.25
Year ended
March 31,
5. Pursuant to the approval from the shareholders through postal ballot on March 31, 2016, Dr. Vishal Sikka, Managing Director and CEO is eligible to receive under the 2015
Plan, an annual grant of RSU's of fair value $2 Mn which will vest over time, subject to continued service. He is also eligible for an annual grant of performance based equity
and stock options of $5 Mn, subject to achievement of performance targets set by the Board or its committee, which vest over time. The Board based on the recommendations
of the Nominations and Remuneration Committee approved on April 13, 2017, RSUs amounting to $1.9 Mn and ESOP's amounting to $0.96 Mn representing the performance
based equity and stock options for the financial year 2017. Further, the Board also approved the annual time based vesting grant for financial year 2018 of RSU's of fair
value amounting to $2 Mn.
Final dividend
Interim dividend
Dividend per share (par value `5/- each)
An interim dividend of `11/- per equity share was declared on October 14, 2016 and paid on October 26, 2016. The interim dividend declared in the previous year was ` 30/-
(not adjusted for bonus issues) per equity share. The Board of Directors recommended a final dividend of `14.75/- per equity share for the financial year ended March 31,
2017. The payment is subject to the approval of the shareholders in the ensuing Annual General Meeting of the Company, to be held on June 24, 2017. The book closure date
for the purpose of the Annual General Meeting and payment of final dividend is June 3, 2017. The final dividend declared in the previous year was `14.25/- per equity share.
* Free cash flow is defined as net cash provided by operating activities less capital expenditure as per the consolidated statement of cash flows prepared under IFRS
** USD/INR exchange rate as on March 31, 2017
Dividend payout includes Dividend Distribution Tax
This announcement contains insider information
3. Capital Allocation Policy
The Board reviewed and approved a revised Capital Allocation Policy of the Company after taking into consideration the strategic and operational cash requirements of the
Company in the medium term.
The key aspects of the Capital Allocation Policy are:
1. The Company’s current policy is to pay dividends of up to 50% of post-tax profits of the Financial Year. Effective from Financial Year 2018, the Company expects to
payout up to 70% of the free cash flow* of the corresponding Financial Year in such manner (including by way of dividend and/or share buyback) as may be decided by the
Board from time to time, subject to applicable laws and requisite approvals, if any.
2. In addition to the above, the Board has identified an amount of upto `13,000 crore ($2 billion)** to be paid out to shareholders during Financial Year 2018, in such manner
(including by way of dividend and/ or share buyback), to be decided by the Board, subject to applicable laws and requisite approvals, if any.
Further announcements in this regard will be made, as appropriate, in due course.
4. The Board, at its meeting held on April 13, 2017, appointed Ravi Venkatesan, Independent Director as the Co- Chairman of the Board. Ravi Venkatesan, who has been on
the Board of Infosys since April, 2011 has made valuable contribution to the development of the strategic direction of the Company during his tenure.
The Nomination and Remuneration Committee of the Board of Directors of Infosys Limited at its meeting held on April 13, 2017, based on fiscal 2017 performance,
approved the grant of 37,100 RSU and 73,600 stock options with effect from May 2, 2017, to few eligible and identified employees of the Company and its subsidiaries under
the 2015 Stock Incentive Compensation Plan (2015 plan). These RSUs and stock options shall vest over a period of 4 years from the date of grant and shall be exercisable
within the period as approved by the committee. The exercise price of the RSUs will be equal to the par value of the shares and the exercise price of the stock options would
be the market price as on the date of grant.
The Nomination and Remuneration Committee in its meeting held on October 14, 2016 recommended a grant of 27,250 RSUs and 43,000 ESOPs to U.B.Pravin Rao, Chief
Operating Officer (COO), under the 2015 Plan and the same was approved by the shareholders through postal ballot on March 31, 2017. These RSUs and ESOPs will be
granted w.e.f May 2, 2017. These RSUs and stock options would vest over a period of 4 years and shall be exercisable within the period as approved by the Committee. The
exercise price of the RSU's will be equal to the par value of the shares and the exercise price of the stock options would be the market price as on the date of grant, as
approved by the shareholders.
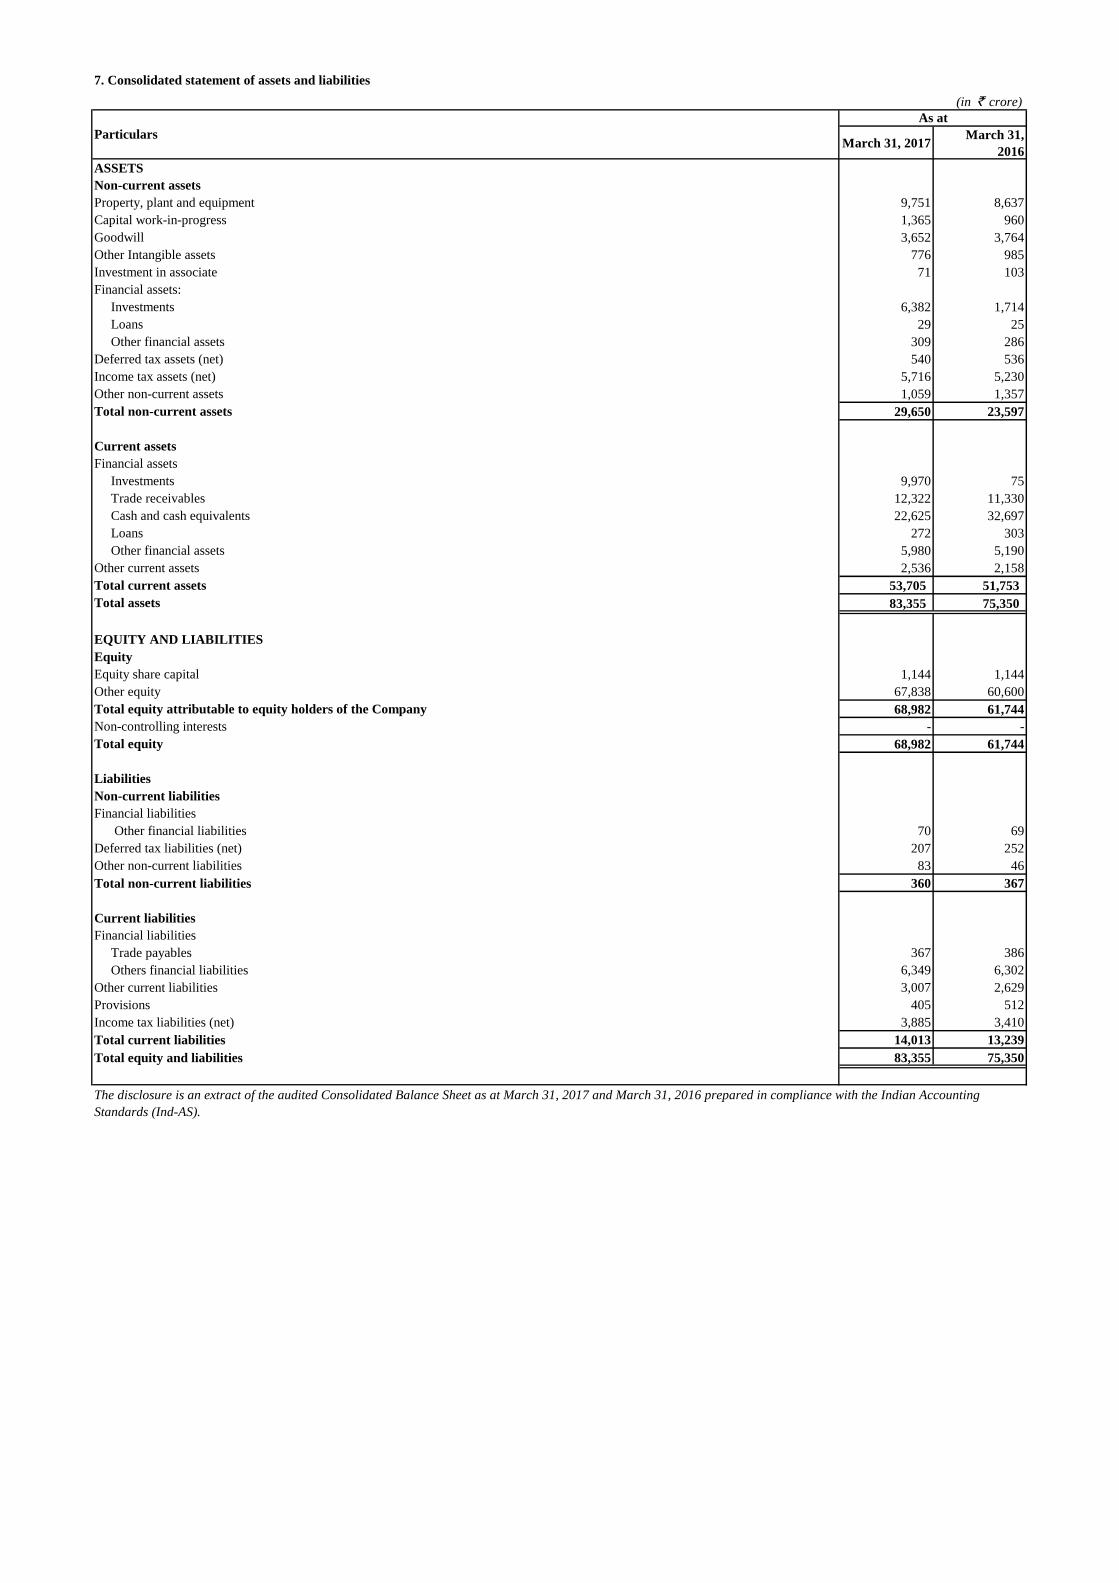
March 31, 2017March 31,
2016
ASSETS
Non-current assets
Property, plant and equipment 9,751 8,637
Capital work-in-progress 1,365 960
Goodwill 3,652 3,764
Other Intangible assets 776 985
Investment in associate 71 103
Financial assets:
Investments 6,382 1,714
Loans 29 25
Other financial assets 309 286
Deferred tax assets (net) 540 536
Income tax assets (net) 5,716 5,230
Other non-current assets 1,059 1,357
Total non-current assets 29,650 23,597
Current assets
Financial assets
Investments 9,970 75
Trade receivables 12,322 11,330
Cash and cash equivalents 22,625 32,697
Loans 272 303
Other financial assets 5,980 5,190
Other current assets 2,536 2,158
Total current assets 53,705 51,753
Total assets 83,355 75,350
EQUITY AND LIABILITIES
Equity
Equity share capital 1,144 1,144
Other equity 67,838 60,600
Total equity attributable to equity holders of the Company 68,982 61,744
Non-controlling interests - -
Total equity 68,982 61,744
Liabilities
Non-current liabilities
Financial liabilities
Other financial liabilities 70 69
Deferred tax liabilities (net) 207 252
Other non-current liabilities 83 46
Total non-current liabilities 360 367
Current liabilities
Financial liabilities
Trade payables 367 386
Others financial liabilities 6,349 6,302
Other current liabilities 3,007 2,629
Provisions 405 512
Income tax liabilities (net) 3,885 3,410
Total current liabilities 14,013 13,239
Total equity and liabilities 83,355 75,350
Particulars
The disclosure is an extract of the audited Consolidated Balance Sheet as at March 31, 2017 and March 31, 2016 prepared in compliance with the Indian Accounting
Standards (Ind-AS).
(in ` crore)
As at
7. Consolidated statement of assets and liabilities
IGAAP
Effects of
transition to Ind-
AS
Ind-AS
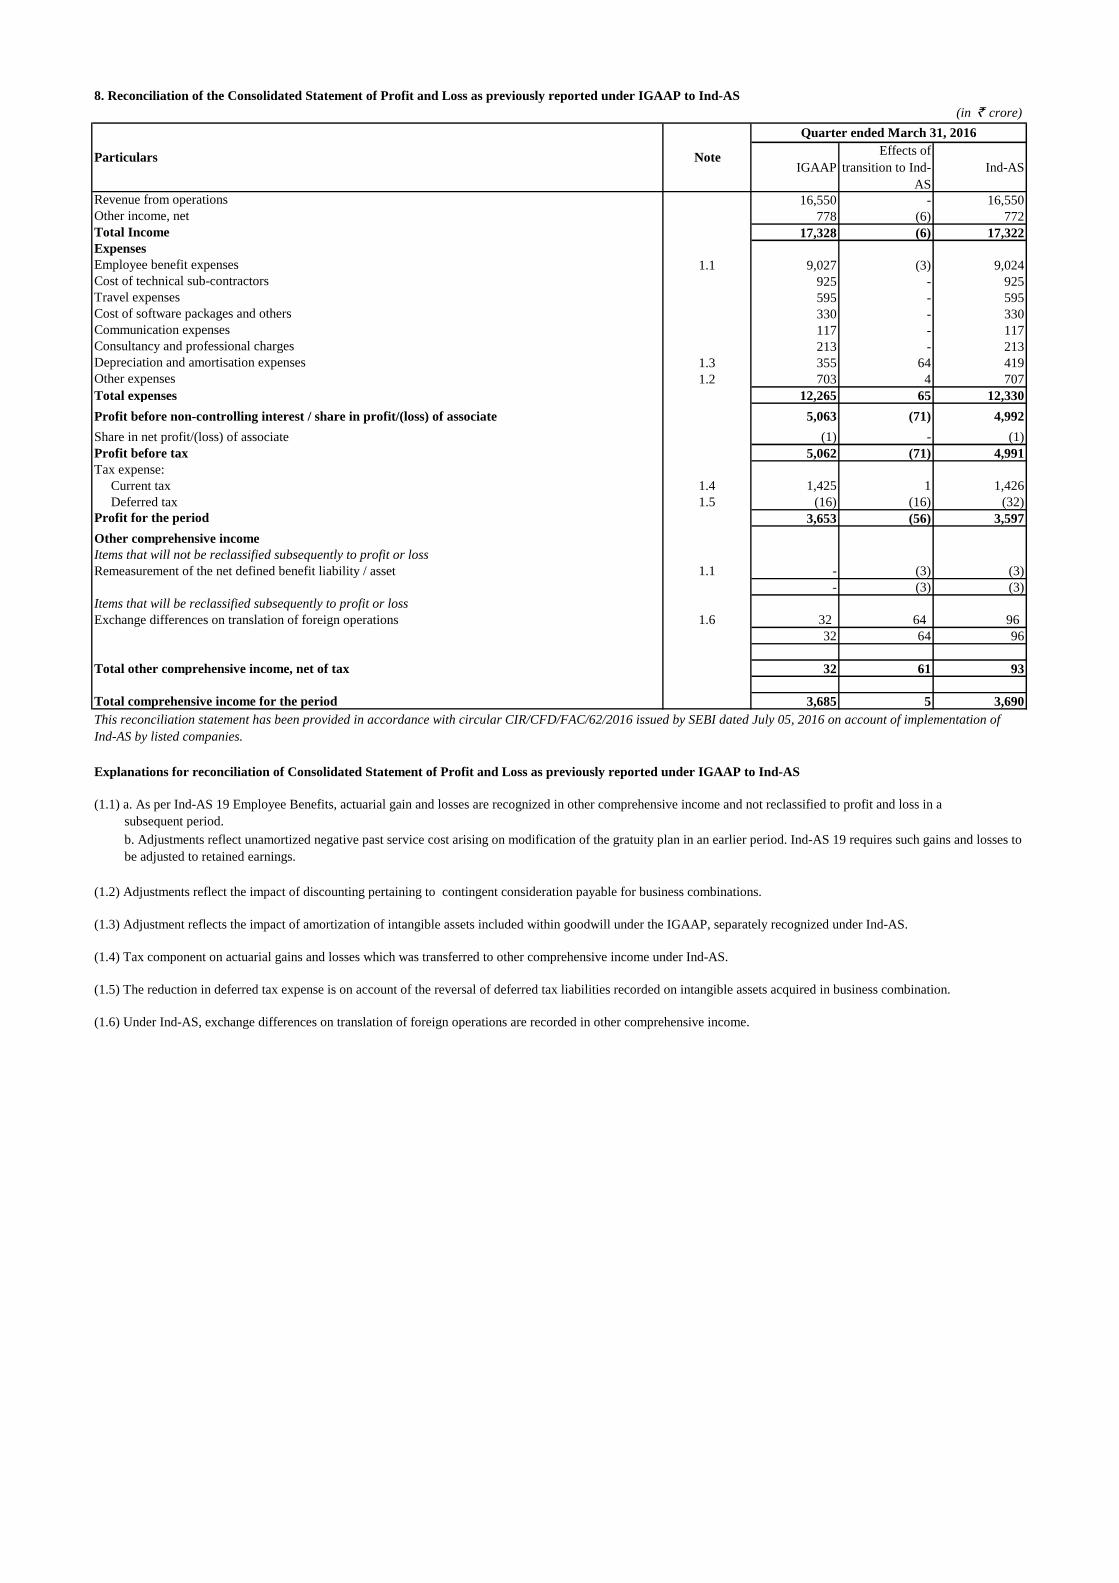
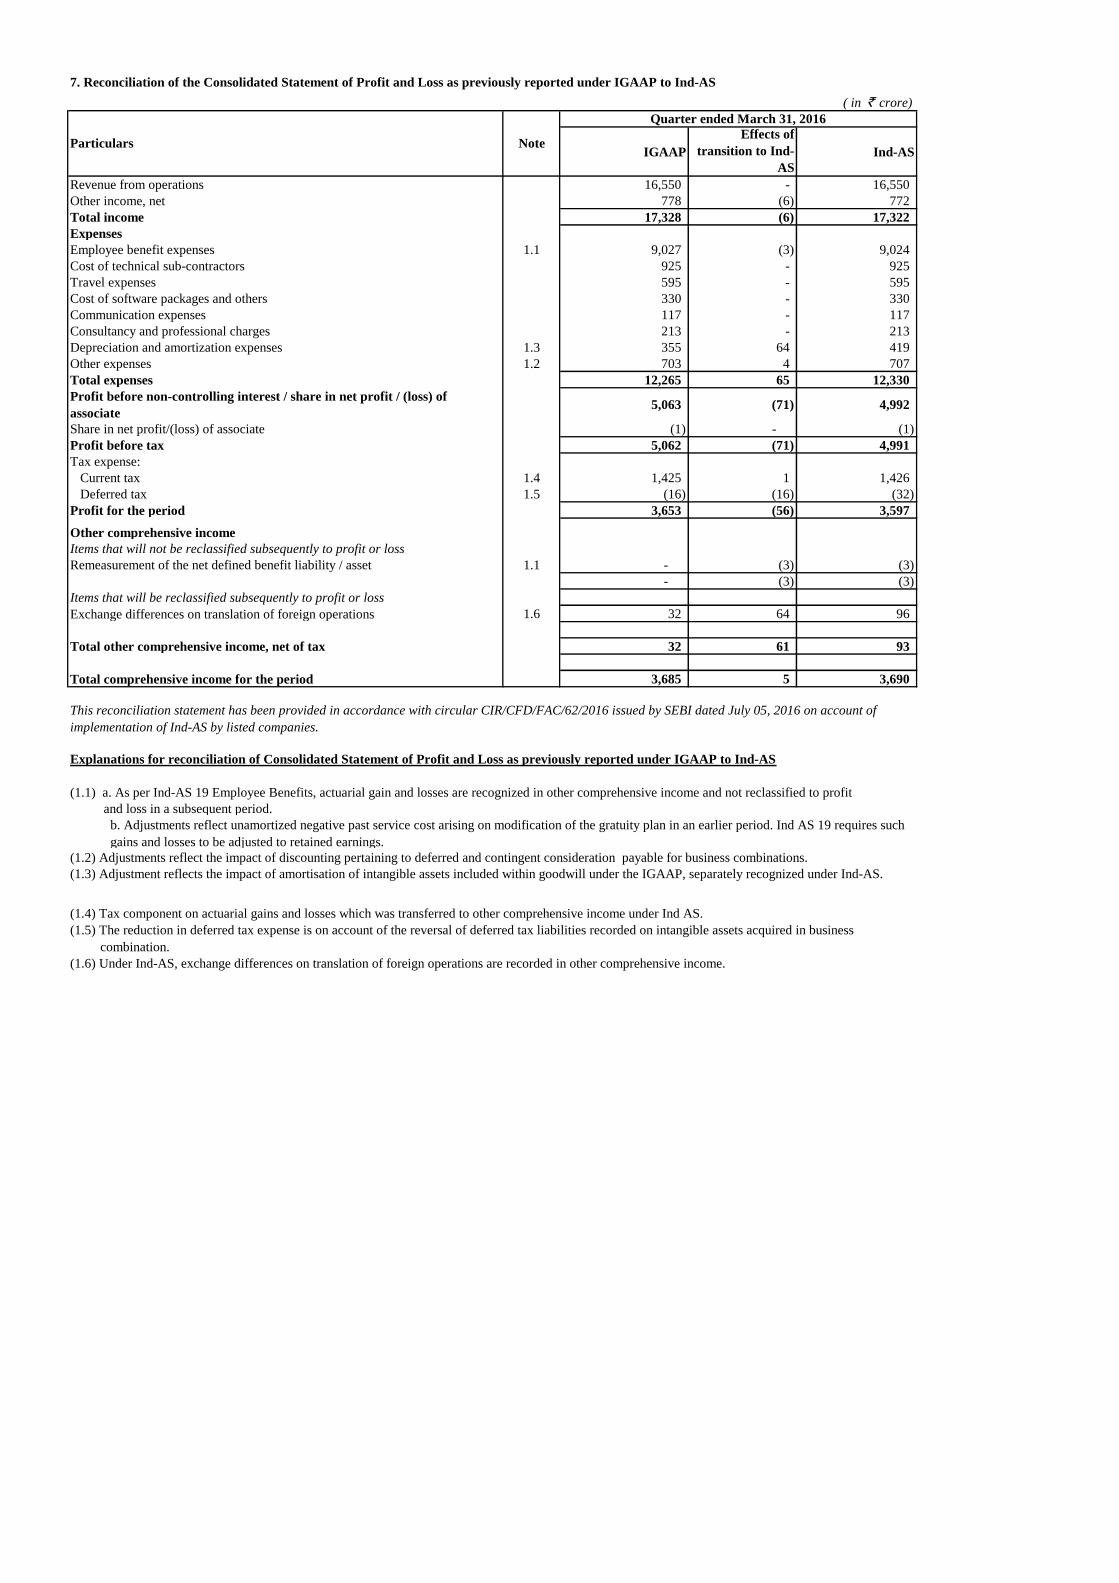
16,550 - 16,550
778 (6) 772
17,328 (6) 17,322
1.1 9,027 (3) 9,024
925 - 925
595 - 595
330 - 330
117 - 117
213 - 213
1.3 355 64 419
1.2 703 4 707
Total expenses 12,265 65 12,330
Profit before non-controlling interest / share in profit/(loss) of associate 5,063 (71) 4,992
Share in net profit/(loss) of associate (1) - (1)
Profit before tax 5,062 (71) 4,991
Tax expense:
Current tax 1.4 1,425 1 1,426
Deferred tax 1.5 (16) (16) (32)
3,653 (56) 3,597
Other comprehensive income
Items that will not be reclassified subsequently to profit or loss
Remeasurement of the net defined benefit liability / asset 1.1 - (3) (3)
- (3) (3)
Items that will be reclassified subsequently to profit or loss
Exchange differences on translation of foreign operations 1.6 32 64 96
32 64 96
Total other comprehensive income, net of tax 32 61 93
Total comprehensive income for the period 3,685 5 3,690
subsequent period.
Note
Quarter ended March 31, 2016
Particulars
8. Reconciliation of the Consolidated Statement of Profit and Loss as previously reported under IGAAP to Ind-AS
(in ` crore)
Revenue from operations
Profit for the period
(1.6) Under Ind-AS, exchange differences on translation of foreign operations are recorded in other comprehensive income.
Cost of technical sub-contractors
Travel expenses
Cost of software packages and others
Communication expenses
Consultancy and professional charges
(1.5) The reduction in deferred tax expense is on account of the reversal of deferred tax liabilities recorded on intangible assets acquired in business combination.
(1.2) Adjustments reflect the impact of discounting pertaining to contingent consideration payable for business combinations.
(1.3) Adjustment reflects the impact of amortization of intangible assets included within goodwill under the IGAAP, separately recognized under Ind-AS.
(1.4) Tax component on actuarial gains and losses which was transferred to other comprehensive income under Ind-AS.
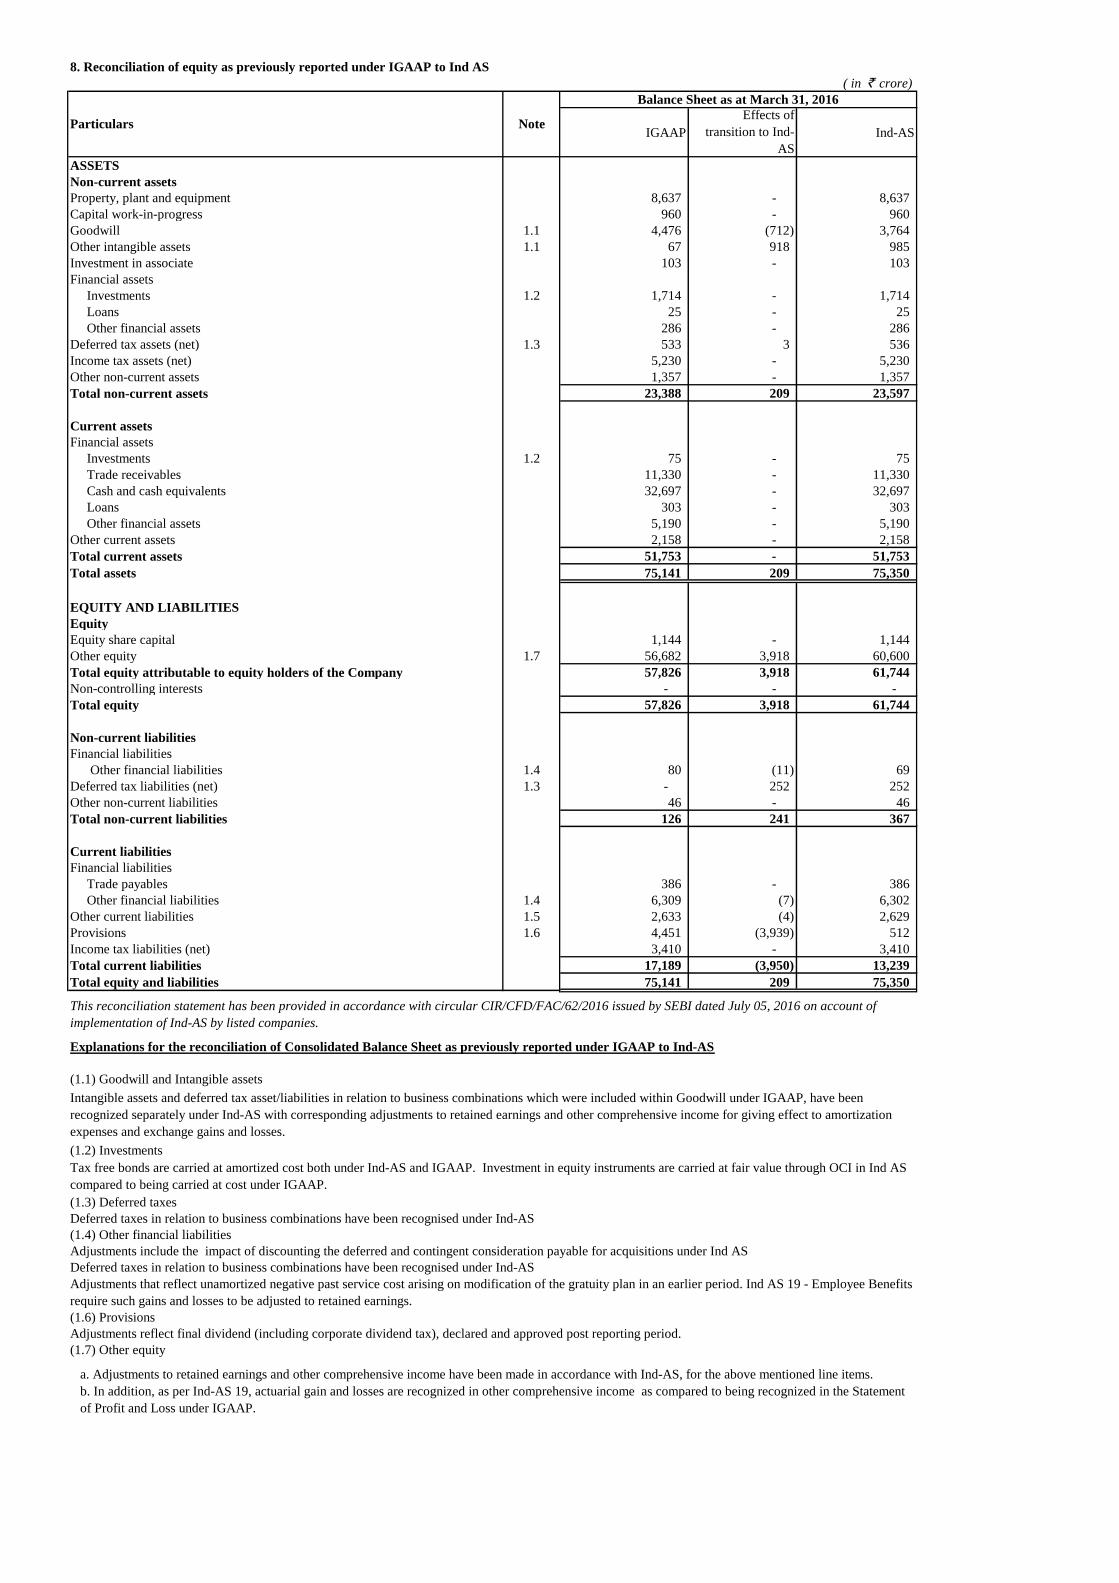
This reconciliation statement has been provided in accordance with circular CIR/CFD/FAC/62/2016 issued by SEBI dated July 05, 2016 on account of implementation of
Ind-AS by listed companies.
Explanations for reconciliation of Consolidated Statement of Profit and Loss as previously reported under IGAAP to Ind-AS
(1.1) a. As per Ind-AS 19 Employee Benefits, actuarial gain and losses are recognized in other comprehensive income and not reclassified to profit and loss in a
b. Adjustments reflect unamortized negative past service cost arising on modification of the gratuity plan in an earlier period. Ind-AS 19 requires such gains and losses to
be adjusted to retained earnings.
Other income, net
Total Income
Expenses
Employee benefit expenses
Depreciation and amortisation expenses
Other expenses

IGAAP Effects of
transition to Ind-
AS
Ind-AS
8,637 - 8,637
960 - 960
1.1 4,476 (712) 3,764
1.1 67 918 985
103 - 103
1.2 1,714 - 1,714
25 - 25
286 - 286
1.3 533 3 536
5,230 - 5,230
1,357 - 1,357
23,388 209 23,597
1.2 75 - 75
11,330 - 11,330
32,697 - 32,697
303 - 303
5,190 - 5,190
2,158 - 2,158
51,753 - 51,753
75,141 209 75,350
1,144 - 1,144
1.7 56,682 3,918 60,600
57,826 3,918 61,744
- - -
57,826 3,918 61,744
1.4 80 (11) 69
1.3 - 252 252
46 - 46
126 241 367
386 - 386
1.4 6,309 (7) 6,302
1.5 2,633 (4) 2,629
1.6 4,451 (3,939) 512
3,410 - 3,410
17,189 (3,950) 13,239
75,141 209 75,350
Goodwill
Loans
Other financial assets
Deferred tax assets (net)
Income tax assets (net)
Other non-current assets
Other intangible assets
Investment in associate
Financial assets
Investments
ASSETS
Non-current assets
Property, plant and equipment
Capital work-in-progress
(in ` crore)
Reconciliation of equity as previously reported under IGAAP to Ind-AS
Balance Sheet as at March 31, 2016Particulars
Note
Total non-current assets
Current assets
Financial assets
Investments
Total current assets
Total assets
Trade receivables
Cash and cash equivalents
Loans
Financial liabilities
Other financial liabilities
Other equity
Total equity attributable to equity holders of the Company
Non-controlling interests
Total equity
(1.2) Investments
Other financial assets
Other current assets
Explanations for the reconciliation of Consolidated Balance Sheet as previously reported under IGAAP to Ind-AS
(1.6) Provisions
Provisions
(1.7) Other equity
Adjustments reflect final dividend (including corporate dividend tax), declared and approved post reporting period.
(1.4) Other financial liabilities
(1.5) Other liabilities
Adjustments include the impact of discounting the contingent consideration payable for acquisitions under Ind-AS.
Adjustments that reflect unamortized negative past service cost arising on modification of the gratuity plan in an earlier period. Ind-AS 19 - Employee Benefits require such
gains and losses to be adjusted to retained earnings.
EQUITY AND LIABILITIES
Equity
Financial liabilities
Trade payables
Other financial liabilities
Other current liabilities
Equity share capital
Non-current liabilities
a. Adjustments to retained earnings and other comprehensive income have been made in accordance with Ind-AS, for the above mentioned line items.
b. In addition, as per Ind-AS 19, actuarial gain and losses are recognized in other comprehensive income as compared to being recognized in the Statement of Profit and
Loss under IGAAP.
This reconciliation statement has been provided in accordance with circular CIR/CFD/FAC/62/2016 issued by SEBI dated July 05, 2016 on account of implementation of
Ind-AS by listed companies.
Deferred tax liabilities (net)
Other non-current liabilities
Total non-current liabilities
Current liabilities
(1.1) Goodwill and Intangible assets
(1.3) Deferred taxes
Deferred taxes in relation to business combinations have been recognized under Ind-AS.
Tax free bonds are carried at amortized cost both under Ind-AS and IGAAP. Investment in equity instruments are carried at fair value through Other Comprehensive Income
in Ind-AS compared to being carried at cost under IGAAP.
Intangible assets and deferred tax asset/liabilities in relation to business combinations which were included within Goodwill under IGAAP, have been recognized separately
under Ind-AS with corresponding adjustments to retained earnings and other comprehensive income for giving effect to amortization expenses and exchange gains and losses.
Income tax liabilities (net)
Total current liabilities
Total equity and liabilities

Particulars
Quarter
ended
March 31,
Quarter
ended
December 31,
Quarter
ended
March 31,
2017 2016 2016 2017 2016
Revenue from operations 14,920 14,949 14,158 59,289 53,983
Profit before tax 4,783 4,883 4,705 18,938 17,600
Profit for the period 3,562 3,599 3,391 13,818 12,693
Particulars
Quarter
ended
March 31,
Quarter
ended
December 31,
Quarter
ended
March 31,
2017 2016 2016 2017 2016
Revenue by business segment
Financial Services (FS) 4,655 4,663 4,522 18,555 17,024
Manufacturing (MFG) 1,918 1,893 1,748 7,507 6,948
Energy & utilities, Communication and Services (ECS) 3,963 3,885 3,635 15,430 13,547
Retail, Consumer packaged goods and Logistics (RCL) 2,710 2,821 2,727 11,225 10,226
Life Sciences, Healthcare and Insurance (HILIFE) 2,148 2,196 2,083 8,437 8,090
Hi-Tech 1,211 1,250 1,327 5,122 4,891
All other segments 515 565 508 2,208 1,715
Total 17,120 17,273 16,550 68,484 62,441
Less: Inter-segment revenue - - - - -
Net revenue from operations 17,120 17,273 16,550 68,484 62,441
Financial Services (FS) 1,328 1,320 1,249 5,209 4,839
Manufacturing (MFG) 472 455 426 1,848 1,560
Energy & utilities, Communication and Services (ECS) 1,120 1,123 1,108 4,431 4,029
Retail, Consumer packaged goods and Logistics (RCL) 784 837 767 3,249 2,840
Life Sciences, Healthcare and Insurance (HILIFE) 596 632 626 2,308 2,265
Hi-Tech 291 324 364 1,277 1,301
All other segments 70 78 105 292 259
Total 4,661 4,769 4,645 18,614 17,093
Less: Other unallocable expenditure 449 435 425 1,713 1,473
Add: Unallocable other income 746 820 772 3,080 3,123
Add: Share in net profit/(loss) of associate and others (25) - (1) (30) (3)
Profit before tax and non-controlling interests 4,933 5,154 4,991 19,951 18,740
Bengaluru, India
April 13, 2017
Based on the "management approach" as defined in Ind-AS 108 - Operating Segments, the Chief Operating Decision Maker evaluates the Company's performance and
allocates resources based on an analysis of various performance indicators by business segments. Accordingly, information has been presented along these business segments.
The accounting principles used in the preparation of the financial statements are consistently applied to record revenue and expenditure in individual segments.
(in ` crore)
Segment profit before tax, depreciation and non-controlling interests:
Business segments
By order of the Board
Assets and liabilities used in the Company's business are not identified to any of the reportable segments, as these are used interchangeably between segments. The
Management believes that it is not practicable to provide segment disclosures relating to total assets and liabilities since a meaningful segregation of the available data is
onerous.
for Infosys Limited
Dr. Vishal Sikka
Chief Executive Officer and Managing Director
Notes on segment information
Year ended
March 31,
Year ended
March 31,
Segmental capital employed
Note: The audited results of Infosys Limited for the above mentioned periods are available on our website, www.infosys.com and on the Stock Exchange website
www.nseindia.com and www.bseindia.com. The information above has been extracted from the audited standalone financial statements as stated.
10. Segment reporting (Consolidated - Audited)
9. Audited financial results of Infosys Limited (Standalone Information)
(in ` crore)

Particulars
Quarter
ended
March 31,
Quarter
ended
December 31,
Quarter
ended
March 31,
2017 2016 2016 2017 2016
Revenues 2,569 2,551 2,446 10,208 9,501
Cost of sales 1,614 1,601 1,516 6,446 5,950
Gross profit 955 950 930 3,762 3,551
Net profit 543 547 533 2,140 2,052
Earnings per equity share
Basic 0.24 0.24 0.23 0.94 0.90
Diluted 0.24 0.24 0.23 0.94 0.90
Total assets 12,854 11,870 11,378 12,854 11,378
Cash and cash equivalents including current investments 5,027 4,487 4,946 5,027 4,946
Certain statements in this release concerning our future growth prospects are forward-looking statements regarding our future business expectations intended to qualify for the
'safe harbor' under the Private Securities Litigation Reform Act of 1995, which involve a number of risks and uncertainties that could cause actual results to differ materially
from those in such forward-looking statements. The risks and uncertainties relating to these statements include, but are not limited to, risks and uncertainties regarding
fluctuations in earnings, fluctuations in foreign exchange rates, our ability to manage growth, intense competition in IT services including those factors which may affect our
cost advantage, wage increases in India, our ability to attract and retain highly skilled professionals, time and cost overruns on fixed-price, fixed-time frame contracts, client
concentration, restrictions on immigration, industry segment concentration, our ability to manage our international operations, reduced demand for technology in our key focus
areas, disruptions in telecommunication networks or system failures, our ability to successfully complete and integrate potential acquisitions, liability for damages on our
service contracts, the success of the companies in which Infosys has made strategic investments, withdrawal or expiration of governmental fiscal incentives, political instability
and regional conflicts, legal restrictions on raising capital or acquiring companies outside India, and unauthorized use of our intellectual property and general economic
conditions affecting our industry. Additional risks that could affect our future operating results are more fully described in our United States Securities and Exchange
Commission filings including our Annual Report on Form 20-F for the fiscal year ended March 31, 2016. These filings are available at www.sec.gov. Infosys may, from time
to time, make additional written and oral forward-looking statements, including statements contained in the company's filings with the Securities and Exchange Commission
and our reports to shareholders. In addition, please note that the date of this result is April 13, 2017, and any forward-looking statements contained herein are based on
assumptions that we believe to be reasonable as of this date. The company does not undertake to update any forward-looking statements that may be made from time to time by
or on behalf of the company unless it is required by law.
The Board has also taken on record the unaudited condensed consolidated results of Infosys Limited and its subsidiaries for the quarter and year ended March 31,
2017, prepared as per International Financial Reporting Standards (IFRS) and reported in US dollars. A summary of the financial statements is as follows:
(in US$ million, except per equity share data)
Year ended
March 31,
Quarter ended
March 31,
Year ended
March 31
Quarter ended
March 31,
2017 2017 2016
Revenue from operations 17,120 68,484 16,550
Profit before tax 4,933 19,951 4,991
Net profit after tax 3,603 14,353 3,597
3,422 14,075 3,690
Paid-up equity share capital (par value `5/- each, fully paid) 1,144 1,144 1,144
Other equity 67,838 67,838 60,600
Earnings per share (par value `5/- each)
Basic 15.77 62.80 15.74
Diluted 15.76 62.77 15.74
3. Capital Allocation Policy
The Board reviewed and approved a revised Capital Allocation Policy of the Company after taking into consideration the strategic and operational cash
requirements of the Company in the medium term.
The key aspects of the Capital Allocation Policy are:
1. The Company’s current policy is to pay dividends of up to 50% of post-tax profits of the Financial Year. Effective from Financial Year 2018, the Company
expects to payout up to 70% of the free cash flow* of the corresponding Financial Year in such manner (including by way of dividend and/or share buyback)
as may be decided by the Board from time to time, subject to applicable laws and requisite approvals, if any.
2. In addition to the above, the Board has identified an amount of upto `13,000 crore ($2 billion)** to be paid out to shareholders during Financial Year 2018,
in such manner (including by way of dividend and/ or share buyback), to be decided by the Board, subject to applicable laws and requisite approvals, if any.
Further announcements in this regard will be made, as appropriate, in due course
4. The Board, at its meeting held on April 13, 2017, appointed Ravi Venkatesan, Independent Director as the Co- Chairman of the Board. Ravi Venkatesan,
who has been on the Board of Infosys since April, 2011 has made valuable contribution to the development of the strategic direction of the Company during
his tenure.
Infosys Limited
CIN : L85110KA1981PLC013115
Regd. Office: Electronics City, Hosur Road, Bengaluru 560 100, India.
Website: www.infosys.com; Email: [email protected]; Telephone: 91 80 2852 0261; Fax: 91 80 2852 0362
Extract of Audited consolidated financial results of Infosys Limited and its subsidiaries for the quarter and year ended
March 31, 2017, prepared in compliance with the Indian Accounting Standard (Ind-AS)
( in ` crore except equity share data)
Notes:
1. The audited consolidated financial statements for the quarter and year ended March 31, 2017 have been taken on record by the Board of Directors at its
meeting held on April 13, 2017. The statutory auditors have expressed an unqualified audit opinion. The information presented above is extracted from the
audited consolidated financial statements. The consolidated financial statements are prepared in accordance with the Indian Accounting Standards (Ind-AS) as
prescribed under Section 133 of the Companies Act, 2013 read with Rule 3 of the Companies (Indian Accounting Standards) Rules, 2015 and Companies
(Indian Accounting Standards) Amendment Rules, 2016.
2. The Group has adopted all the Ind-AS on April 1, 2016 with the transition date as April 1, 2015, and the adoption was carried out in accordance with Ind-
AS 101-First time adoption of Indian Accounting Standards. The transition was carried out from Indian Accounting Principles generally accepted in India as
prescribed under Sec 133 of the Companies Act, 2013 read with Rule 7 of the Companies (Accounts) Rules, 2014 (IGAAP), which was the previous GAAP.
Particulars
* Free cash flow is defined as net cash provided by operating activities less capital expenditure as per the consolidated statement of cash flows prepared under
IFRS
** USD/INR exchange rate as on March 31, 2017
Dividend payout includes Dividend Distribution Tax
This announcement contains insider information
Total comprehensive income for the period (comprising profit for the period after tax and
other comprehensive income after tax)
5. Pursuant to the approval from the shareholders through postal ballot on March 31, 2016, Dr. Vishal Sikka, Managing Director and CEO is eligible to
receive under the 2015 Plan, an annual grant of RSU's of fair value $2 Mn which will vest over time, subject to continued service. He is also eligible for an
annual grant of performance based equity and stock options of $5 Mn, subject to achievement of performance targets set by the Board or its committee, which
vest over time. The Board based on the recommendations of the Nominations and Remuneration Committee approved on April 13, 2017, RSUs amounting to
$1.9 Mn and ESOP's amounting to $0.96 Mn representing the performance based equity and stock options for the financial year 2017. Further, the Board also
approved the annual time based vesting grant for financial year 2018 of RSU's of fair value amounting to $2 Mn.
The Nomination and Remuneration Committee in its meeting held on October 14, 2016 recommended a grant of 27,250 RSUs and 43,000 ESOPs to
U.B.Pravin Rao, Chief Operating Officer (COO), under the 2015 Plan and the same was approved by the shareholders through postal ballot on March 31,
2017. These RSUs and ESOPs will be granted w.e.f May 2, 2017. These RSUs and stock options would vest over a period of 4 years and shall be exercisable
within the period as approved by the Committee. The exercise price of the RSU's will be equal to the par value of the shares and the exercise price of the stock
options would be the market price as on the date of grant, as approved by the shareholders.
The Nomination and Remuneration Committee of the Board of Directors of Infosys Limited at its meeting held on April 13, 2017, based on fiscal 2017
performance, approved the grant of 37,100 RSU and 73,600 stock options with effect from May 2, 2017, to few eligible and identified employees of the
Company and its subsidiaries under the 2015 Stock Incentive Compensation Plan (2015 plan). These RSUs and stock options shall vest over a period of 4
years from the date of grant and shall be exercisable within the period as approved by the committee. The exercise price of the RSUs will be equal to the par
value of the shares and the exercise price of the stock options would be the market price as on the date of grant.

(in ` )
Quarter ended
March 31,
Year ended
March 31
Quarter ended
March 31,
2017 2017 2016
Dividend per share (par value `5/- each)
Interim dividend - 11.00 -
Final dividend 14.75 14.75 14.25
6. Information on dividends for the quarter and year ended March 31, 2017
Particulars
An interim dividend of `11/- per equity share was declared on October 14, 2016 and paid on October 26, 2016. The interim dividend declared in the previous
year was `30/- (not adjusted for bonus issues) per equity share. The Board of Directors recommended a final dividend of `14.75/- per equity share for the
financial year ended March 31, 2017. The payment is subject to the approval of the shareholders in the ensuing Annual General Meeting of the Company, to
be held on June 24, 2017. The book closure date for the purpose of the Annual General Meeting and payment of final dividend is June 3, 2017. The final
dividend declared in the previous year was `14.25/- per equity share.
IGAAP
Effects of
transition to Ind-
AS
Ind-AS
Revenue from operations 16,550 - 16,550
Other income, net 778 (6) 772
Total income 17,328 (6) 17,322
Expenses
Employee benefit expenses 1.1 9,027 (3) 9,024
Cost of technical sub-contractors 925 - 925
Travel expenses 595 - 595
Cost of software packages and others 330 - 330
Communication expenses 117 - 117
Consultancy and professional charges 213 - 213
Depreciation and amortization expenses 1.3 355 64 419
Other expenses 1.2 703 4 707
Total expenses 12,265 65 12,330
Profit before non-controlling interest / share in net profit / (loss) of
associate5,063 (71) 4,992
Share in net profit/(loss) of associate (1) - (1)
Profit before tax 5,062 (71) 4,991
Tax expense:
Current tax 1.4 1,425 1 1,426
Deferred tax 1.5 (16) (16) (32)
Profit for the period 3,653 (56) 3,597
Other comprehensive income
Items that will not be reclassified subsequently to profit or loss
Remeasurement of the net defined benefit liability / asset 1.1 - (3) (3)
- (3) (3)
Items that will be reclassified subsequently to profit or loss
Exchange differences on translation of foreign operations 1.6 32 64 96
Total other comprehensive income, net of tax 32 61 93
Total comprehensive income for the period 3,685 5 3,690
Explanations for reconciliation of Consolidated Statement of Profit and Loss as previously reported under IGAAP to Ind-AS
and loss in a subsequent period.
(1.6) Under Ind-AS, exchange differences on translation of foreign operations are recorded in other comprehensive income.
7. Reconciliation of the Consolidated Statement of Profit and Loss as previously reported under IGAAP to Ind-AS
( in ` crore)
Particulars Note
Quarter ended March 31, 2016
This reconciliation statement has been provided in accordance with circular CIR/CFD/FAC/62/2016 issued by SEBI dated July 05, 2016 on account of
implementation of Ind-AS by listed companies.
(1.1) a. As per Ind-AS 19 Employee Benefits, actuarial gain and losses are recognized in other comprehensive income and not reclassified to profit
b. Adjustments reflect unamortized negative past service cost arising on modification of the gratuity plan in an earlier period. Ind AS 19 requires such
gains and losses to be adjusted to retained earnings.
(1.2) Adjustments reflect the impact of discounting pertaining to deferred and contingent consideration payable for business combinations.
(1.3) Adjustment reflects the impact of amortisation of intangible assets included within goodwill under the IGAAP, separately recognized under Ind-AS.
(1.4) Tax component on actuarial gains and losses which was transferred to other comprehensive income under Ind AS.
(1.5) The reduction in deferred tax expense is on account of the reversal of deferred tax liabilities recorded on intangible assets acquired in business
combination.
IGAAP
Effects of
transition to Ind-
AS
Ind-AS
ASSETS
Non-current assets
Property, plant and equipment 8,637 - 8,637
Capital work-in-progress 960 - 960
Goodwill 1.1 4,476 (712) 3,764
Other intangible assets 1.1 67 918 985
Investment in associate 103 - 103
Financial assets
Investments 1.2 1,714 - 1,714
Loans 25 - 25
Other financial assets 286 - 286
Deferred tax assets (net) 1.3 533 3 536
Income tax assets (net) 5,230 - 5,230
Other non-current assets 1,357 - 1,357
Total non-current assets 23,388 209 23,597
Current assets
Financial assets
Investments 1.2 75 - 75
Trade receivables 11,330 - 11,330
Cash and cash equivalents 32,697 - 32,697
Loans 303 - 303
Other financial assets 5,190 - 5,190
Other current assets 2,158 - 2,158
Total current assets 51,753 - 51,753
Total assets 75,141 209 75,350
EQUITY AND LIABILITIES
Equity
Equity share capital 1,144 - 1,144
Other equity 1.7 56,682 3,918 60,600
Total equity attributable to equity holders of the Company 57,826 3,918 61,744
Non-controlling interests - - -
Total equity 57,826 3,918 61,744
Non-current liabilities
Financial liabilities
Other financial liabilities 1.4 80 (11) 69
Deferred tax liabilities (net) 1.3 - 252 252
Other non-current liabilities 46 - 46
Total non-current liabilities 126 241 367
Current liabilities
Financial liabilities
Trade payables 386 - 386
Other financial liabilities 1.4 6,309 (7) 6,302
Other current liabilities 1.5 2,633 (4) 2,629
Provisions 1.6 4,451 (3,939) 512
Income tax liabilities (net) 3,410 - 3,410
Total current liabilities 17,189 (3,950) 13,239
Total equity and liabilities 75,141 209 75,350
Explanations for the reconciliation of Consolidated Balance Sheet as previously reported under IGAAP to Ind-AS
(1.2) Investments
Tax free bonds are carried at amortized cost both under Ind-AS and IGAAP. Investment in equity instruments are carried at fair value through OCI in Ind AS
compared to being carried at cost under IGAAP.
Adjustments reflect final dividend (including corporate dividend tax), declared and approved post reporting period.
(1.7) Other equity
a. Adjustments to retained earnings and other comprehensive income have been made in accordance with Ind-AS, for the above mentioned line items.
b. In addition, as per Ind-AS 19, actuarial gain and losses are recognized in other comprehensive income as compared to being recognized in the Statement
of Profit and Loss under IGAAP.
(1.6) Provisions
(1.3) Deferred taxes
Deferred taxes in relation to business combinations have been recognised under Ind-AS
Adjustments that reflect unamortized negative past service cost arising on modification of the gratuity plan in an earlier period. Ind AS 19 - Employee Benefits
require such gains and losses to be adjusted to retained earnings.
Deferred taxes in relation to business combinations have been recognised under Ind-AS
(1.4) Other financial liabilities
Adjustments include the impact of discounting the deferred and contingent consideration payable for acquisitions under Ind AS
(1.1) Goodwill and Intangible assets
Intangible assets and deferred tax asset/liabilities in relation to business combinations which were included within Goodwill under IGAAP, have been
recognized separately under Ind-AS with corresponding adjustments to retained earnings and other comprehensive income for giving effect to amortization
expenses and exchange gains and losses.
This reconciliation statement has been provided in accordance with circular CIR/CFD/FAC/62/2016 issued by SEBI dated July 05, 2016 on account of
implementation of Ind-AS by listed companies.
8. Reconciliation of equity as previously reported under IGAAP to Ind AS
( in ` crore)
Particulars Note
Balance Sheet as at March 31, 2016
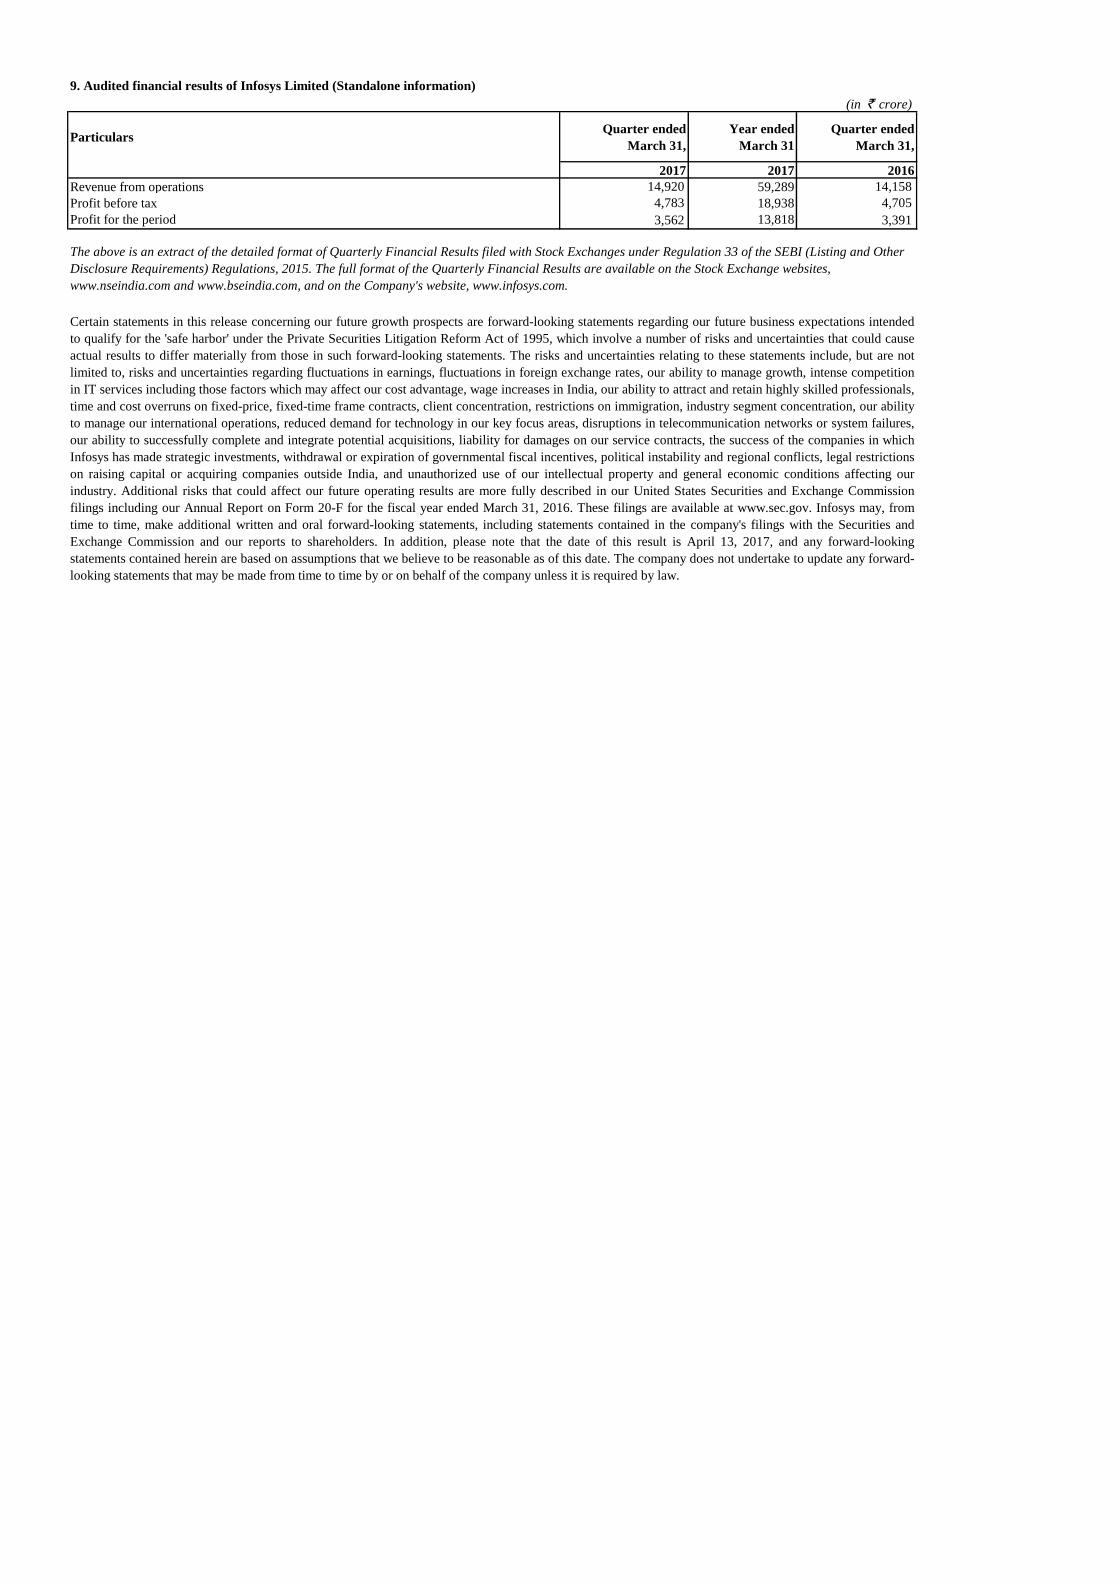
9. Audited financial results of Infosys Limited (Standalone information)
(in ` crore)
ParticularsQuarter ended
March 31,
Year ended
March 31
Quarter ended
March 31,
2017 2017 2016
Revenue from operations 14,920 59,289 14,158
Profit before tax 4,783 18,938 4,705
Profit for the period 3,562 13,818 3,391
The above is an extract of the detailed format of Quarterly Financial Results filed with Stock Exchanges under Regulation 33 of the SEBI (Listing and Other
Disclosure Requirements) Regulations, 2015. The full format of the Quarterly Financial Results are available on the Stock Exchange websites,
www.nseindia.com and www.bseindia.com, and on the Company's website, www.infosys.com.
Certain statements in this release concerning our future growth prospects are forward-looking statements regarding our future business expectations intended
to qualify for the 'safe harbor' under the Private Securities Litigation Reform Act of 1995, which involve a number of risks and uncertainties that could cause
actual results to differ materially from those in such forward-looking statements. The risks and uncertainties relating to these statements include, but are not
limited to, risks and uncertainties regarding fluctuations in earnings, fluctuations in foreign exchange rates, our ability to manage growth, intense competition
in IT services including those factors which may affect our cost advantage, wage increases in India, our ability to attract and retain highly skilled professionals,
time and cost overruns on fixed-price, fixed-time frame contracts, client concentration, restrictions on immigration, industry segment concentration, our ability
to manage our international operations, reduced demand for technology in our key focus areas, disruptions in telecommunication networks or system failures,
our ability to successfully complete and integrate potential acquisitions, liability for damages on our service contracts, the success of the companies in which
Infosys has made strategic investments, withdrawal or expiration of governmental fiscal incentives, political instability and regional conflicts, legal restrictions
on raising capital or acquiring companies outside India, and unauthorized use of our intellectual property and general economic conditions affecting our
industry. Additional risks that could affect our future operating results are more fully described in our United States Securities and Exchange Commission
filings including our Annual Report on Form 20-F for the fiscal year ended March 31, 2016. These filings are available at www.sec.gov. Infosys may, from
time to time, make additional written and oral forward-looking statements, including statements contained in the company's filings with the Securities and
Exchange Commission and our reports to shareholders. In addition, please note that the date of this result is April 13, 2017, and any forward-looking
statements contained herein are based on assumptions that we believe to be reasonable as of this date. The company does not undertake to update any forward-
looking statements that may be made from time to time by or on behalf of the company unless it is required by law.
Particulars
2017 2016 2016 2017 2016Audited Audited Audited Audited Audited14,920 14,949 14,158 59,289 53,983
Other income, net 733 805 773 3,062 3,006
Total income 15,653 15,754 14,931 62,351 56,989
Expenses
Employee benefit expenses 7,667 7,733 7,297 30,944 28,207
Deferred consideration pertaining to acquisition - - - - 149
Cost of technical sub-contractors 1,263 1,228 1,191 4,809 4,417
Travel expenses 342 356 438 1,638 1,655
Cost of software packages and others 341 358 223 1,235 1,049
Communication expenses 104 96 79 372 311
Consultancy and professional charges 176 124 155 538 563
Depreciation and amortisation expense 336 339 315 1,331 1,115
Other expenses 641 637 528 2,546 1,923
Total expenses 10,870 10,871 10,226 43,413 39,389
Profit before tax 4,783 4,883 4,705 18,938 17,600
Tax expense:
Current tax 1,141 1,287 1,309 5,068 4,898
Deferred tax 80 -3 5 52 9
Profit for the period 3,562 3,599 3,391 13,818 12,693
Other comprehensive income
Items that will not be reclassified subsequently to profit or loss
Remeasurement of the net defined benefit liability / asset 16 -6 (3) (42) (2)
Equity instruments through other comprehensive income (5) - - (5) -
Items that will be reclassified subsequently to profit or loss
Fair value changes on cash flow hedges, net 11 26 - 39 -
Fair value changes on investments, net (10) - - (10) -
Total other comprehensive income, net of tax 12 20 (3) (18) (2)
Total comprehensive income, for the period 3,574 3,619 3,388 13,800 12,691
Paid-up share capital (par value `5/- each fully paid) 1,148 1,148 1,148 1,148 1,148
Other Equity 66,869 59,934 59,934 66,869 59,934
Earnings per equity share ( par value `5 /- each)
Basic (`) 15.51 15.67 14.76 60.16 55.26
Diluted (`) 15.51 15.67 14.76 60.15 55.26
Notes:
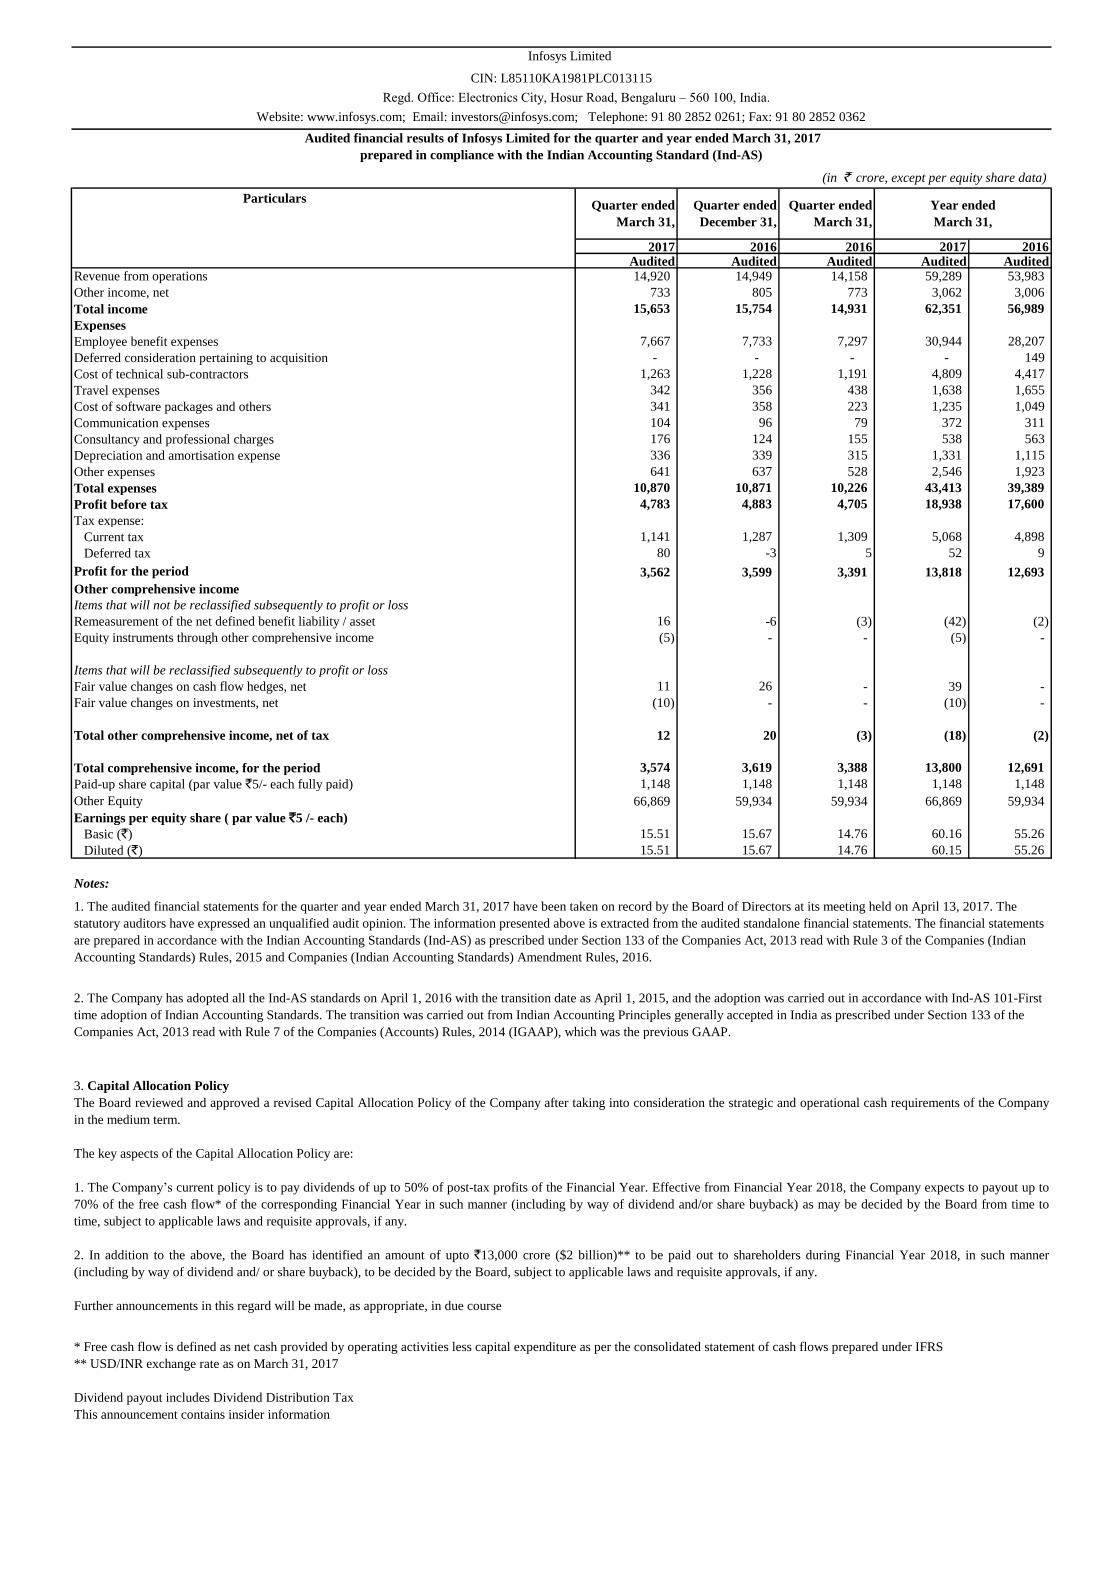
3. Capital Allocation Policy
The Board reviewed and approved a revised Capital Allocation Policy of the Company after taking into consideration the strategic and operational cash requirements of the Company
in the medium term.
The key aspects of the Capital Allocation Policy are:
1. The Company’s current policy is to pay dividends of up to 50% of post-tax profits of the Financial Year. Effective from Financial Year 2018, the Company expects to payout up to
70% of the free cash flow* of the corresponding Financial Year in such manner (including by way of dividend and/or share buyback) as may be decided by the Board from time to
time, subject to applicable laws and requisite approvals, if any.
2. In addition to the above, the Board has identified an amount of upto `13,000 crore ($2 billion)** to be paid out to shareholders during Financial Year 2018, in such manner
(including by way of dividend and/ or share buyback), to be decided by the Board, subject to applicable laws and requisite approvals, if any.
Further announcements in this regard will be made, as appropriate, in due course
* Free cash flow is defined as net cash provided by operating activities less capital expenditure as per the consolidated statement of cash flows prepared under IFRS
** USD/INR exchange rate as on March 31, 2017
Dividend payout includes Dividend Distribution Tax
This announcement contains insider information
Infosys Limited
Regd. Office: Electronics City, Hosur Road, Bengaluru – 560 100, India.
(in ` crore, except per equity share data)
CIN: L85110KA1981PLC013115
Website: www.infosys.com; Email: [email protected]; Telephone: 91 80 2852 0261; Fax: 91 80 2852 0362
Audited financial results of Infosys Limited for the quarter and year ended March 31, 2017
prepared in compliance with the Indian Accounting Standard (Ind-AS)
1. The audited financial statements for the quarter and year ended March 31, 2017 have been taken on record by the Board of Directors at its meeting held on April 13, 2017. The
statutory auditors have expressed an unqualified audit opinion. The information presented above is extracted from the audited standalone financial statements. The financial statements
are prepared in accordance with the Indian Accounting Standards (Ind-AS) as prescribed under Section 133 of the Companies Act, 2013 read with Rule 3 of the Companies (Indian
Accounting Standards) Rules, 2015 and Companies (Indian Accounting Standards) Amendment Rules, 2016.
2. The Company has adopted all the Ind-AS standards on April 1, 2016 with the transition date as April 1, 2015, and the adoption was carried out in accordance with Ind-AS 101-First
time adoption of Indian Accounting Standards. The transition was carried out from Indian Accounting Principles generally accepted in India as prescribed under Section 133 of the
Companies Act, 2013 read with Rule 7 of the Companies (Accounts) Rules, 2014 (IGAAP), which was the previous GAAP.
Revenue from operations
Year ended
March 31,
Quarter ended
December 31,
Quarter ended
March 31,
Quarter ended
March 31,

4. The Board, at its meeting held on April 13, 2017, appointed Ravi Venkatesan, Independent Director as the Co- Chairman of the Board. Ravi Venkatesan, who has been on the Board
of Infosys since April 2011 has made valuable contribution to the development of the strategic direction of the Company during his tenure.
The Nomination and Remuneration Committee of the Board of Directors of Infosys Limited at its meeting held on April 13, 2017, based on fiscal 2017 performance,
approved the grant of 37,100 RSU and 73,600 stock options with effect from May 2, 2017, to few eligible and identified employees of the Company and its subsidiaries under the
2015 Stock Incentive Compensation Plan (2015 plan). These RSUs and stock options shall vest over a period of 4 years from the date of grant and shall be exercisable within the
period as approved by the committee. The exercise price of the RSUs will be equal to the par value of the shares and the exercise price of the stock options would be the market price
as on the date of grant.
5. Pursuant to the approval from the shareholders through postal ballot on March 31, 2016, Dr. Vishal Sikka, Managing Director and CEO is eligible to receive under the 2015 Plan, an
annual grant of RSU's of fair value $2 Mn which will vest over time, subject to continued service . He is also eligible for an annual grant of performance based equity and stock
options of $5 Mn subject to achievement of performance targets set by the Board or its committee, which vest over time. The Board based on the recommendations of the Nominations
and Remuneration Committee approved on April 13, 2017, RSU's amounting to $1.9 Mn and ESOP's amounting to $0.96 Mn representing the performance based equity and stock
options for the financial year 2017. Further, the Board also approved the annual time based vesting grant for financial year 2018 of RSU's of fair value amounting to $ 2Mn
The Nomination and Remuneration Committee in its meeting held on October 14, 2016 recommended a grant of 27,250 RSU's and 43,000 ESOP's to U.B.Pravin Rao, Chief Operating
Officer (COO), under the 2015 Plan and the same was approved by the shareholders through postal ballot on March 31, 2017. These RSUs and ESOPs will be granted w.e.f May 2,
2017. These RSUs and stock options would vest over a period of 4 years and shall be exercisable within the period as approved by the Committee. The exercise price of the RSU's will
be equal to the par value of the shares and the exercise price of the stock options would be the market price as on the date of grant, as approved by the shareholders.
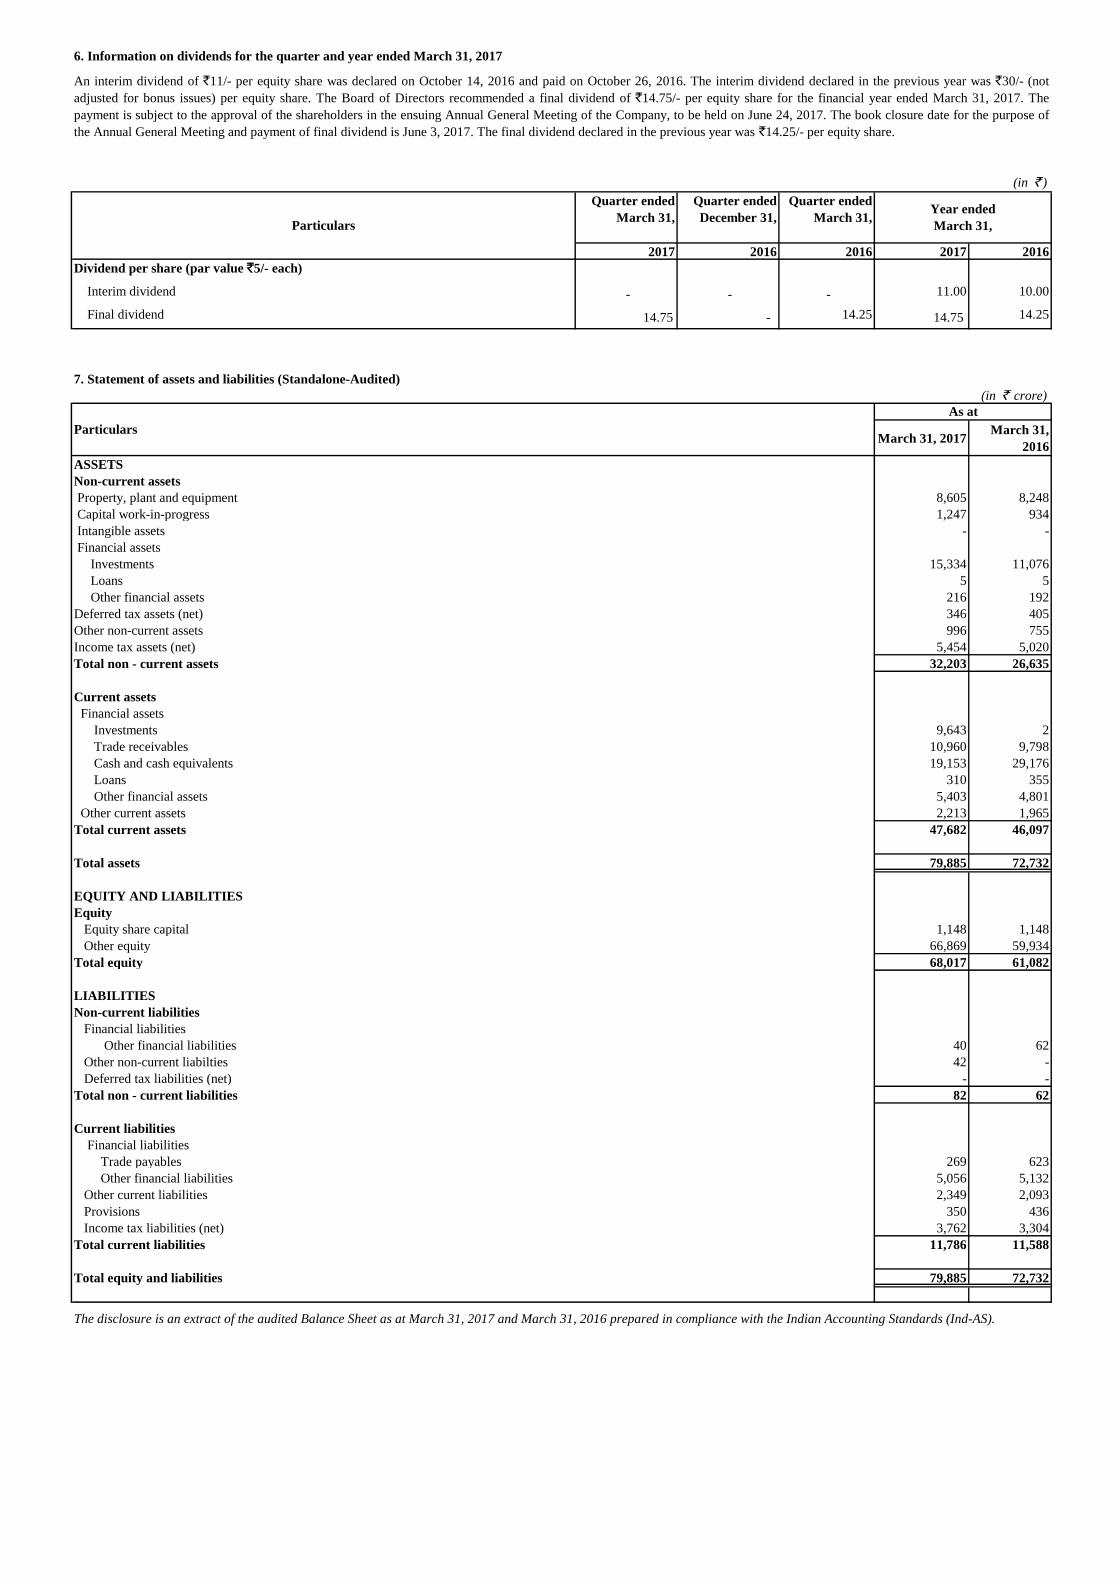
6. Information on dividends for the quarter and year ended March 31, 2017
Quarter ended
March 31,
Quarter ended
December 31,
Quarter ended
March 31,
2017 2016 2016 2017 2016
- - - 11.00 10.00
14.75 - 14.25 14.75 14.25
7. Statement of assets and liabilities (Standalone-Audited)
(in ` crore)
March 31, 2017March 31,
2016
ASSETS
Non-current assets
Property, plant and equipment 8,605 8,248
Capital work-in-progress 1,247 934
Intangible assets - -
Financial assets
Investments 15,334 11,076
Loans 5 5
Other financial assets 216 192
Deferred tax assets (net) 346 405
Other non-current assets 996 755
Income tax assets (net) 5,454 5,020
Total non - current assets 32,203 26,635
Current assets
Financial assets
Investments 9,643 2
Trade receivables 10,960 9,798
Cash and cash equivalents 19,153 29,176
Loans 310 355
Other financial assets 5,403 4,801
Other current assets 2,213 1,965
Total current assets 47,682 46,097
Total assets 79,885 72,732
EQUITY AND LIABILITIES
Equity
Equity share capital 1,148 1,148
Other equity 66,869 59,934
Total equity 68,017 61,082
LIABILITIES
Non-current liabilities
Financial liabilities
Other financial liabilities 40 62
Other non-current liabilties 42 -
Deferred tax liabilities (net) - -
82 62
Current liabilities
Financial liabilities
Trade payables 269 623
Other financial liabilities 5,056 5,132
Other current liabilities 2,349 2,093
Provisions 350 436
Income tax liabilities (net) 3,762 3,304
11,786 11,588
Total equity and liabilities 79,885 72,732
Total non - current liabilities
Total current liabilities
As at
(in ` )
An interim dividend of `11/- per equity share was declared on October 14, 2016 and paid on October 26, 2016. The interim dividend declared in the previous year was `30/- (not
adjusted for bonus issues) per equity share. The Board of Directors recommended a final dividend of `14.75/- per equity share for the financial year ended March 31, 2017. The
payment is subject to the approval of the shareholders in the ensuing Annual General Meeting of the Company, to be held on June 24, 2017. The book closure date for the purpose of
the Annual General Meeting and payment of final dividend is June 3, 2017. The final dividend declared in the previous year was `14.25/- per equity share.
Interim dividend
Final dividend
Particulars
The disclosure is an extract of the audited Balance Sheet as at March 31, 2017 and March 31, 2016 prepared in compliance with the Indian Accounting Standards (Ind-AS).
Particulars
Year ended
March 31,
Dividend per share (par value `5/- each)
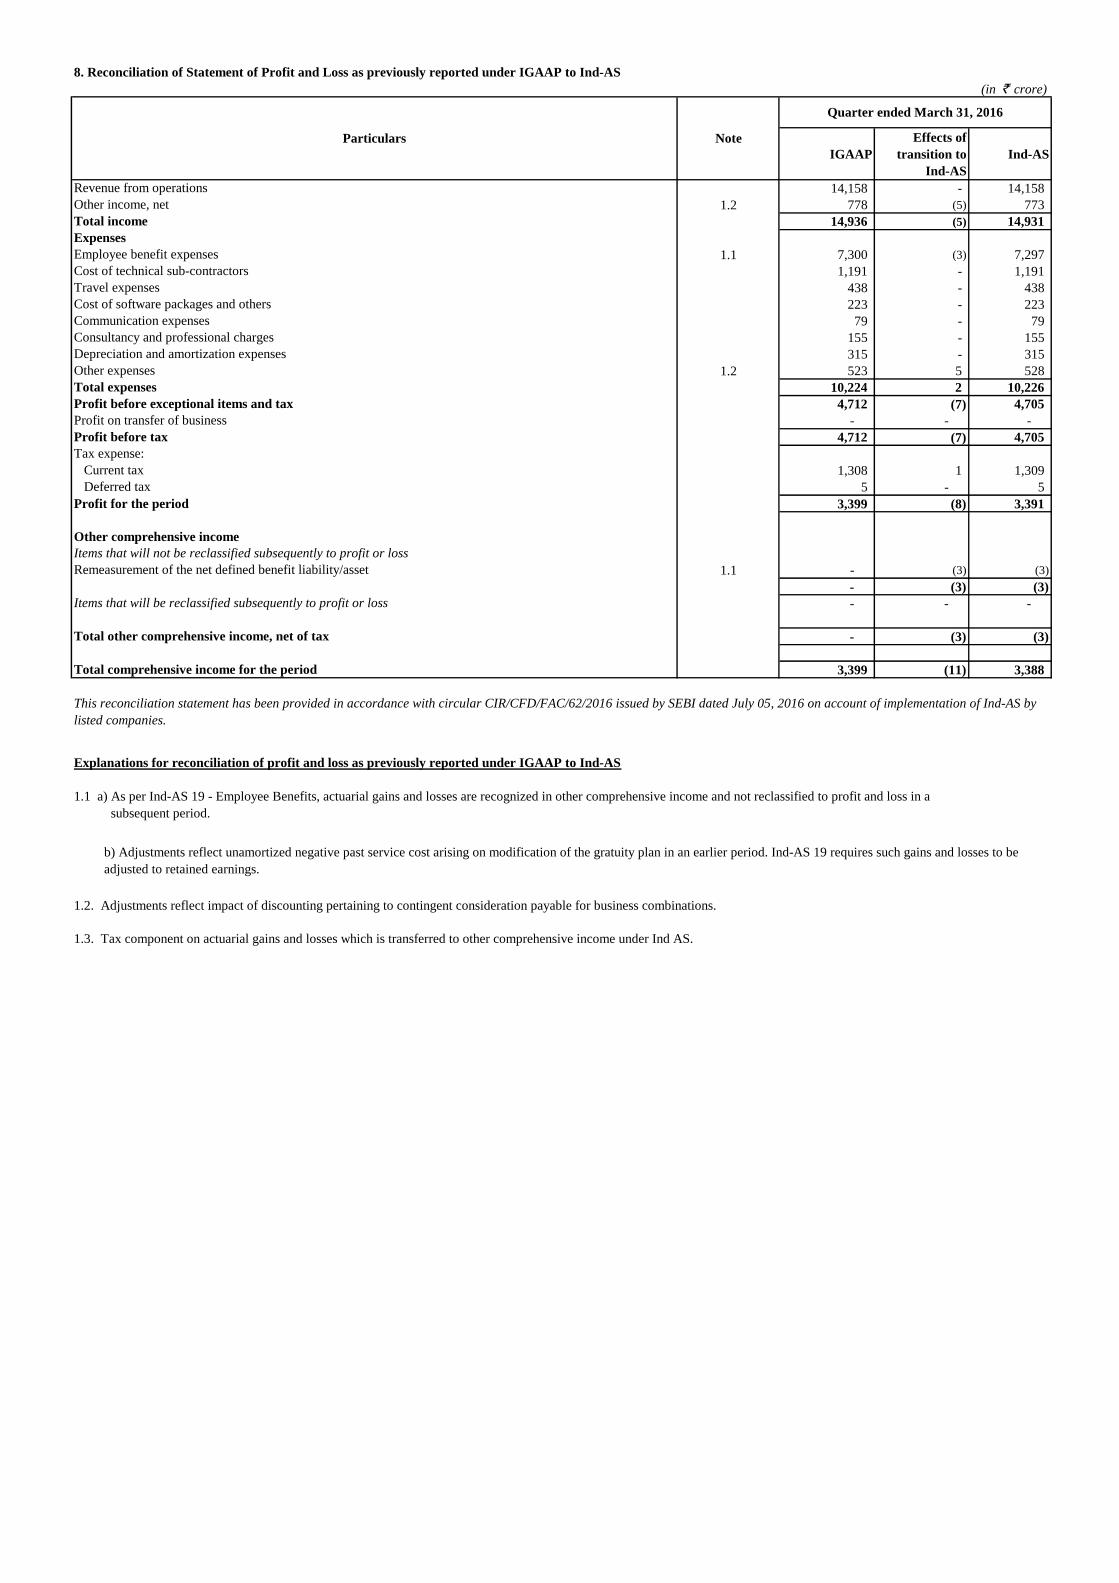
8. Reconciliation of Statement of Profit and Loss as previously reported under IGAAP to Ind-AS
(in ` crore)
IGAAP
Effects of
transition to
Ind-AS
Ind-AS
14,158 - 14,158
1.2 778 (5) 773
14,936 (5) 14,931
1.1 7,300 (3) 7,297
1,191 - 1,191
438 - 438
223 - 223
79 - 79
155 - 155
315 - 315
1.2 523 5 528
10,224 2 10,226
4,712 (7) 4,705
- - -
4,712 (7) 4,705
1,308 1 1,309
5 - 5
3,399 (8) 3,391
1.1 - (3) (3)
- (3) (3)
- - -
- (3) (3)
3,399 (11) 3,388
1.3. Tax component on actuarial gains and losses which is transferred to other comprehensive income under Ind AS.
Explanations for reconciliation of profit and loss as previously reported under IGAAP to Ind-AS
Quarter ended March 31, 2016
Cost of software packages and others
Communication expenses
Other expenses
Total expenses
Profit before exceptional items and tax
Profit on transfer of business
Consultancy and professional charges
Depreciation and amortization expenses
Profit before tax
Tax expense:
Particulars
Revenue from operations
Total income
Other income, net
Expenses
Employee benefit expenses
Travel expenses
Note
Cost of technical sub-contractors
Deferred tax
Current tax
Profit for the period
Other comprehensive income
Items that will not be reclassified subsequently to profit or loss
Remeasurement of the net defined benefit liability/asset
1.1 a) As per Ind-AS 19 - Employee Benefits, actuarial gains and losses are recognized in other comprehensive income and not reclassified to profit and loss in a
subsequent period.
b) Adjustments reflect unamortized negative past service cost arising on modification of the gratuity plan in an earlier period. Ind-AS 19 requires such gains and losses to be
adjusted to retained earnings.
1.2. Adjustments reflect impact of discounting pertaining to contingent consideration payable for business combinations.
This reconciliation statement has been provided in accordance with circular CIR/CFD/FAC/62/2016 issued by SEBI dated July 05, 2016 on account of implementation of Ind-AS by
listed companies.
Total other comprehensive income, net of tax
Total comprehensive income for the period
Items that will be reclassified subsequently to profit or loss

(in ` crore)
IGAAP
Effects of
transition to
Ind-AS
Ind-AS
ASSETS
Non-current assets
Property, plant and equipment 8,248 - 8,248
Capital work-in-progress 934 - 934
Intangible assets - - -
Financial assets
Investments 1.1 11,111 (35) 11,076
Loans 5 - 5
Other financial assets 192 - 192
Deferred tax assets (net) 405 - 405
Other non-current assets 755 - 755
Income tax assets (net) 5,020 - 5,020
Total non-current assets 26,670 (35) 26,635
Current assets
Financial assets:
Investments 1.1 2 - 2
Trade receivables 9,798 - 9,798
Cash and cash equivalents 29,176 - 29,176
Loans 355 - 355
Other financial assets 4,801 - 4,801
Other current assets 1,965 - 1,965
Total current assets 46,097 - 46,097
Total assets 72,767 (35) 72,732
EQUITY AND LIABILITIES
Equity
Equity share capital 1,148 - 1,148
Other equity 1.5 56,009 3,925 59,934
Total equity 57,157 3,925 61,082
Non-current liabilities
Financial liabilities
Other financial liabilities 1.2 73 -11 62
Deferred tax liabilities (net) - - -
Other non-current liabilities - - -
Total non-current liabilities 73 -11 62
Current liabilities
Financial liabilities
Trade payables 623 - 623
Other financial liabilities 1.2 5,138 -6 5,132
Other current liabilities 1.3 2,097 -4 2,093
Provisions 1.4 4,375 -3,939 436
Income tax liabilities (Net) 3,304 - 3,304
Total current liabilities 15,537 -3,949 11,588
Total liabilities and equity 72,767 -35 72,732
This reconciliation statement has been provided in accordance with circular CIR/CFD/FAC/62/2016 issued by SEBI dated July 05, 2016 on account of implementation of Ind-AS by
listed companies.
1.4. Provisions
Explanations for reconciliation of balance sheet as previously reported under IGAAP to IND-AS
1.1. Investment
a) Tax free bonds are carried at amortized cost both under Ind-AS and IGAAP. Investment in equity instruments are carried at fair value through OCI in Ind-AS compared to being
carried at cost under IGAAP.
b) Investments include discounted value of contingent consideration payable on acquisition of business under Ind-AS as compared to undiscounted value of contingent consideration
under IGAAP.
1.2. Other financial liabilities
Particulars Note
Balance Sheet as at March 31, 2016
Adjustments reflect final dividend (including corporate dividend tax), declared and approved post reporting period.
1.5. Other equity
a) Adjustments to retained earnings and other comprehensive income has been made in accordance with Ind-AS, for the above mentioned line items.
b) In addition, as per Ind-AS 19, actuarial gain and losses are recognized in other comprehensive income as compared to being recognized in the statement of profit and loss under
IGAAP.
c) Profit on transfer of business between entities under common control which were earlier recognized in statement of profit and loss under IGAAP are adjusted to reserves on
transition to Ind-AS.
Adjustments includes impact of discounting the deferred and contingent consideration payable for acquisitions under Ind-AS.
1.3. Other current liabilities
Adjustments that reflect unamortised negative past service cost arising on modification of the gratuity plan in an earlier period. Ind-AS 19 requires such gains and losses to be adjusted
to retained earnings.
9. Reconciliation of equity as previously reported under IGAAP to Ind-AS
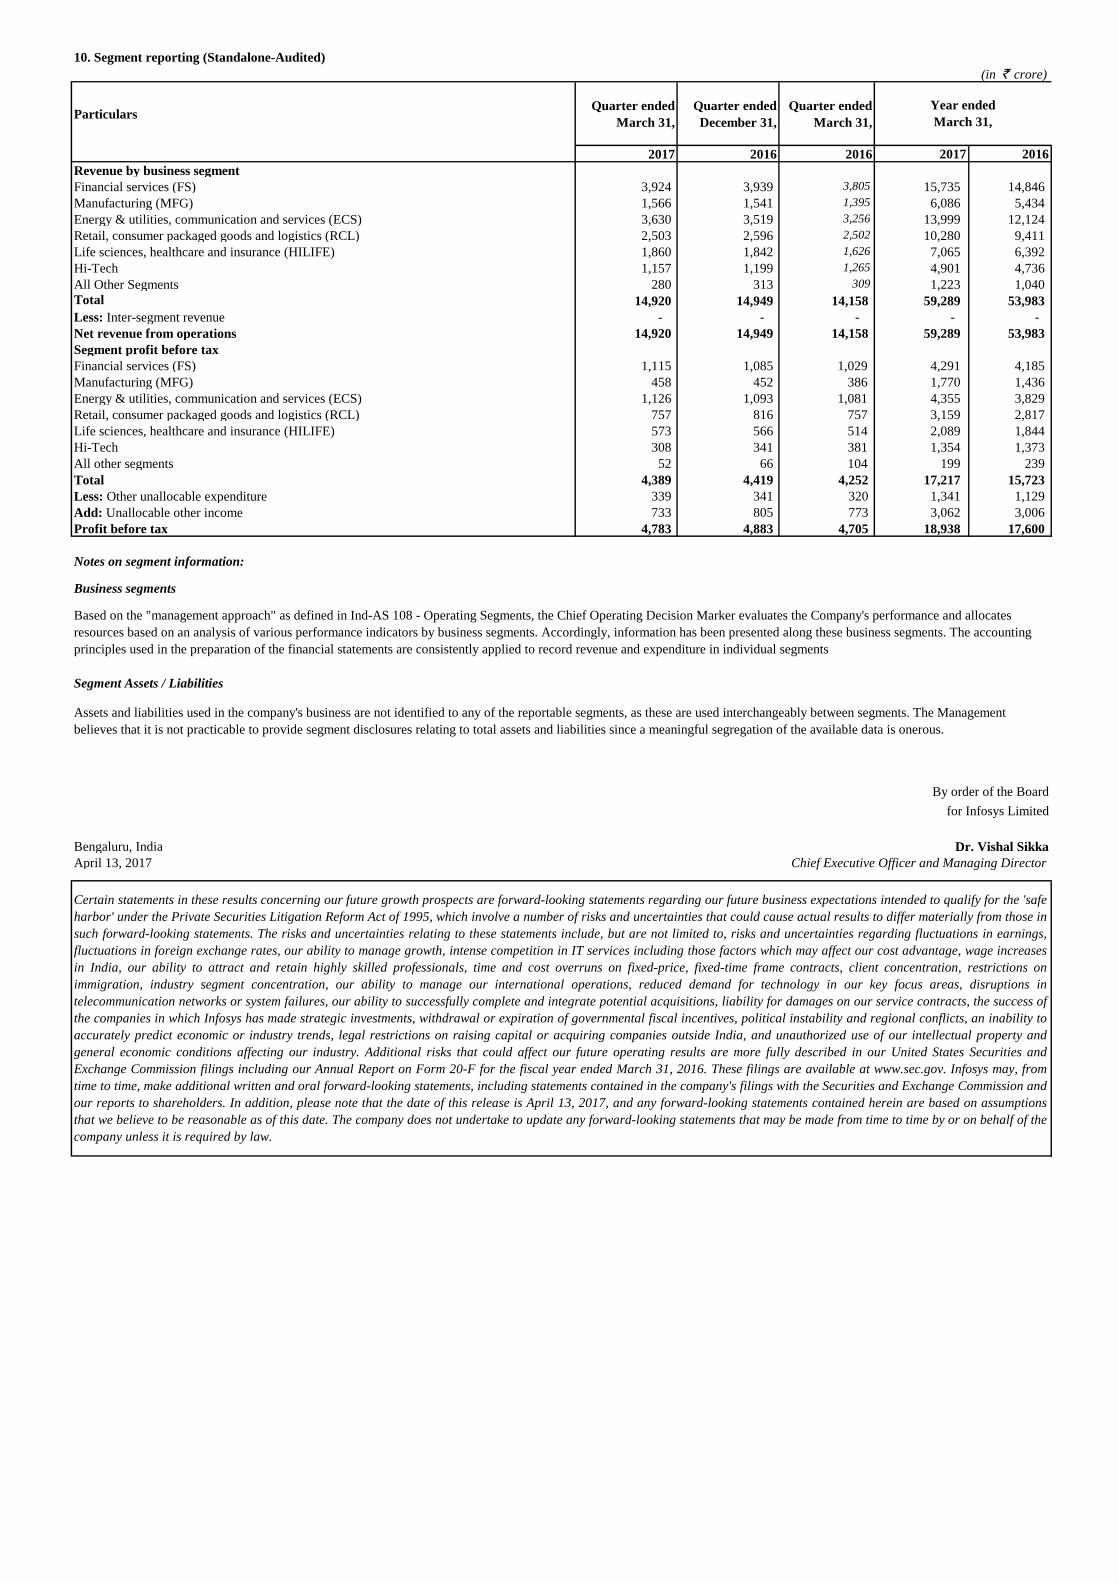
10. Segment reporting (Standalone-Audited)
Particulars Quarter ended
March 31,
Quarter ended
December 31,
Quarter ended
March 31,
2017 2016 2016 2017 2016
Revenue by business segment
Financial services (FS) 3,924 3,939 3,805 15,735 14,846
Manufacturing (MFG) 1,566 1,541 1,395 6,086 5,434
Energy & utilities, communication and services (ECS) 3,630 3,519 3,256 13,999 12,124
Retail, consumer packaged goods and logistics (RCL) 2,503 2,596 2,502 10,280 9,411
Life sciences, healthcare and insurance (HILIFE) 1,860 1,842 1,626 7,065 6,392
Hi-Tech 1,157 1,199 1,265 4,901 4,736
All Other Segments 280 313 309 1,223 1,040
Total 14,920 14,949 14,158 59,289 53,983
Less: Inter-segment revenue - - - - -
Net revenue from operations 14,920 14,949 14,158 59,289 53,983
Segment profit before tax
Financial services (FS) 1,115 1,085 1,029 4,291 4,185
Manufacturing (MFG) 458 452 386 1,770 1,436
Energy & utilities, communication and services (ECS) 1,126 1,093 1,081 4,355 3,829
Retail, consumer packaged goods and logistics (RCL) 757 816 757 3,159 2,817
Life sciences, healthcare and insurance (HILIFE) 573 566 514 2,089 1,844
Hi-Tech 308 341 381 1,354 1,373
All other segments 52 66 104 199 239
Total 4,389 4,419 4,252 17,217 15,723
Less: Other unallocable expenditure 339 341 320 1,341 1,129
Add: Unallocable other income 733 805 773 3,062 3,006
Profit before tax 4,783 4,883 4,705 18,938 17,600
Bengaluru, India
April 13, 2017
Certain statements in these results concerning our future growth prospects are forward-looking statements regarding our future business expectations intended to qualify for the 'safe
harbor' under the Private Securities Litigation Reform Act of 1995, which involve a number of risks and uncertainties that could cause actual results to differ materially from those in
such forward-looking statements. The risks and uncertainties relating to these statements include, but are not limited to, risks and uncertainties regarding fluctuations in earnings,
fluctuations in foreign exchange rates, our ability to manage growth, intense competition in IT services including those factors which may affect our cost advantage, wage increases
in India, our ability to attract and retain highly skilled professionals, time and cost overruns on fixed-price, fixed-time frame contracts, client concentration, restrictions on
immigration, industry segment concentration, our ability to manage our international operations, reduced demand for technology in our key focus areas, disruptions in
telecommunication networks or system failures, our ability to successfully complete and integrate potential acquisitions, liability for damages on our service contracts, the success of
the companies in which Infosys has made strategic investments, withdrawal or expiration of governmental fiscal incentives, political instability and regional conflicts, an inability to
accurately predict economic or industry trends, legal restrictions on raising capital or acquiring companies outside India, and unauthorized use of our intellectual property and
general economic conditions affecting our industry. Additional risks that could affect our future operating results are more fully described in our United States Securities and
Exchange Commission filings including our Annual Report on Form 20-F for the fiscal year ended March 31, 2016. These filings are available at www.sec.gov. Infosys may, from
time to time, make additional written and oral forward-looking statements, including statements contained in the company's filings with the Securities and Exchange Commission and
our reports to shareholders. In addition, please note that the date of this release is April 13, 2017, and any forward-looking statements contained herein are based on assumptions
that we believe to be reasonable as of this date. The company does not undertake to update any forward-looking statements that may be made from time to time by or on behalf of the
company unless it is required by law.
Assets and liabilities used in the company's business are not identified to any of the reportable segments, as these are used interchangeably between segments. The Management
believes that it is not practicable to provide segment disclosures relating to total assets and liabilities since a meaningful segregation of the available data is onerous.
Notes on segment information:
(in ` crore)
Segment Assets / Liabilities
By order of the Board
for Infosys Limited
Dr. Vishal Sikka
Chief Executive Officer and Managing Director
Business segments
Based on the "management approach" as defined in Ind-AS 108 - Operating Segments, the Chief Operating Decision Marker evaluates the Company's performance and allocates
resources based on an analysis of various performance indicators by business segments. Accordingly, information has been presented along these business segments. The accounting
principles used in the preparation of the financial statements are consistently applied to record revenue and expenditure in individual segments
Year ended
March 31,