infovis toolkit tutorial - college of computing
TRANSCRIPT

1
InfoVis Toolkit Tutorial
CS 4460/7450 - Information Visualization
Feb. 11, 2010
Guest speaker: Zhicheng Liu (“Leo”)
Spring 2010 CS 4460/7450 2
Agenda
• Tutorial and demo of toolkits
flare
prefuse
processing
protovis
• Powers and limitations of each

2
IDEs for building InfoVis
• Integrated Development Environment
Syntax highlighting, real-time compilation …
Easy import of existing projects / libraries
• Eclipse (Java)
prefuse, processing (has own PDE)
• Flex (Flash Actionscript)
flare
• ? (Javascript)
protovis Spring 2010 CS 4460/7450 3
Spring 2010 CS 4460/7450 4
InfoVis Reference Model
• Different toolkits have different support for each of the stages (as we shall see…)

3
Spring 2010 CS 4460/7450 5
Prefuse & Flare
• Written by Jeffrey Heer
• Similar architectural design in different languages:
Java vs. Actionscript
• Built-in support for
reading data sources
generating fine-grained visualization building blocks
applying layout and interaction algorithms
Top Level Components
Prefuse Flare
Spring 2010 CS 4460/7450 6
Java Container
Display
Visualization
Visual Object Container: Sprite
Visualization
4
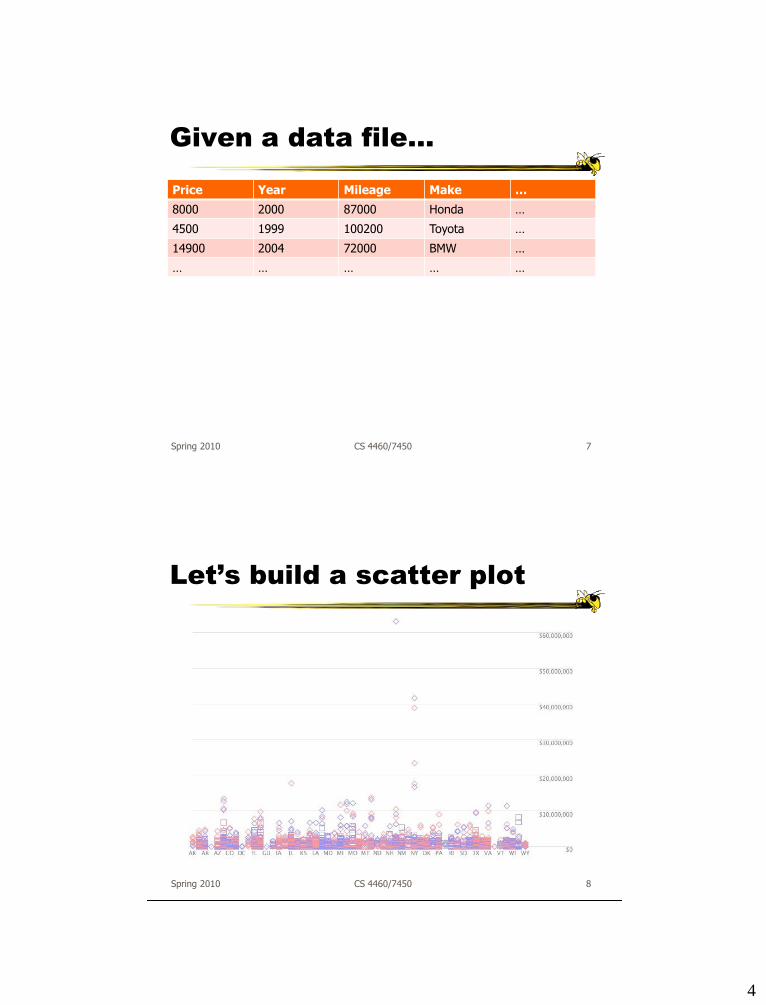
Given a data file…
Price Year Mileage Make …
8000 2000 87000 Honda …
4500 1999 100200 Toyota …
14900 2004 72000 BMW …
… … … … …
Spring 2010 CS 4460/7450 7
Let’s build a scatter plot
Spring 2010 CS 4460/7450 8

5
CODE SNIPPETS ONLY!
Spring 2010 CS 4460/7450 9
1. Reading Data Source
Prefuse (csv and other delimited text files, GraphML, TreeML)
Table t = new DelimitedTextTableReader().readTable(datafile);
Visualization vis = new Visualization();
VisualTable vt = vis.addTable(“datacases”, t);
Display m_display = new Display(vis);
jpanel.add(m_display);
Flare (tab-delimited, JSON and GraphML)var ds:DataSource = new DataSource( datafile );
var loader:URLLoader = ds.load();
loader.addEventListener(Event.COMPLETE, function(evt:Event) : void {
var ds:DataSet = loader.data as DataSet;
});
Data data = Data.fromDataSet(ds);
Visualization vis = new Visualization(data);
sprite.addChild(vis);Spring 2010 CS 4460/7450 10
6
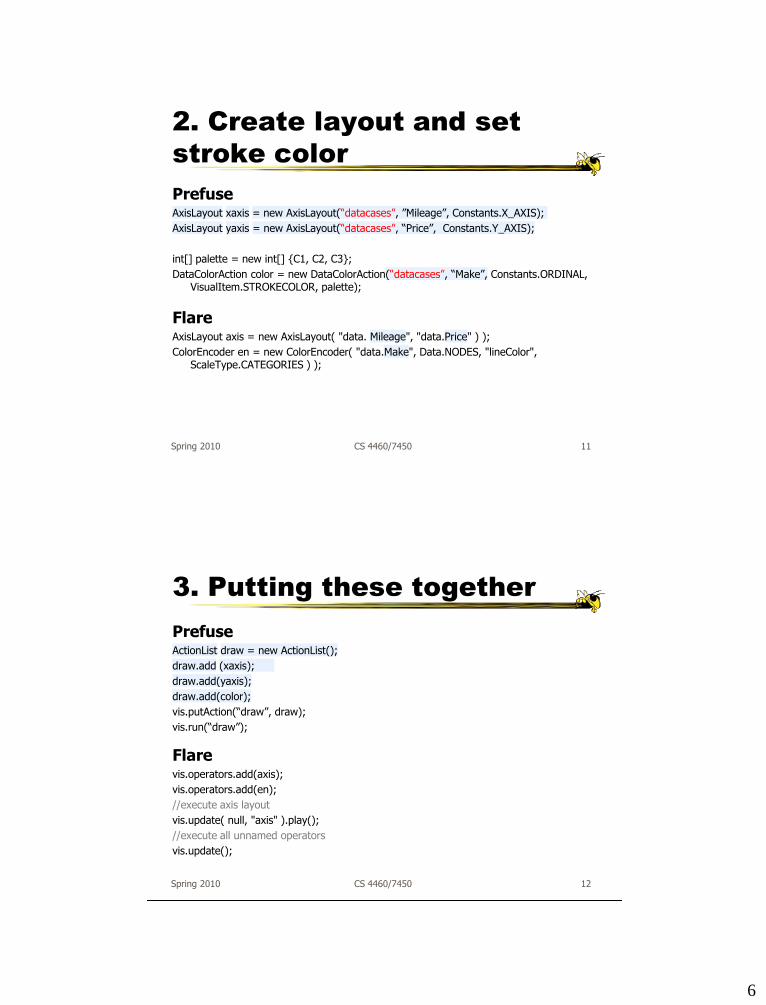
2. Create layout and set
stroke color
PrefuseAxisLayout xaxis = new AxisLayout(“datacases”, ”Mileage”, Constants.X_AXIS);
AxisLayout yaxis = new AxisLayout(“datacases”, “Price”, Constants.Y_AXIS);
int[] palette = new int[] {C1, C2, C3};
DataColorAction color = new DataColorAction(“datacases”, “Make”, Constants.ORDINAL, VisualItem.STROKECOLOR, palette);
Flare AxisLayout axis = new AxisLayout( "data. Mileage", "data.Price" ) );
ColorEncoder en = new ColorEncoder( "data.Make", Data.NODES, "lineColor", ScaleType.CATEGORIES ) );
Spring 2010 CS 4460/7450 11
3. Putting these together
PrefuseActionList draw = new ActionList();
draw.add (xaxis);
draw.add(yaxis);
draw.add(color);
vis.putAction(“draw”, draw);
vis.run(“draw”);
Flare vis.operators.add(axis);
vis.operators.add(en);
//execute axis layout
vis.update( null, "axis" ).play();
//execute all unnamed operators
vis.update();
Spring 2010 CS 4460/7450 12
7
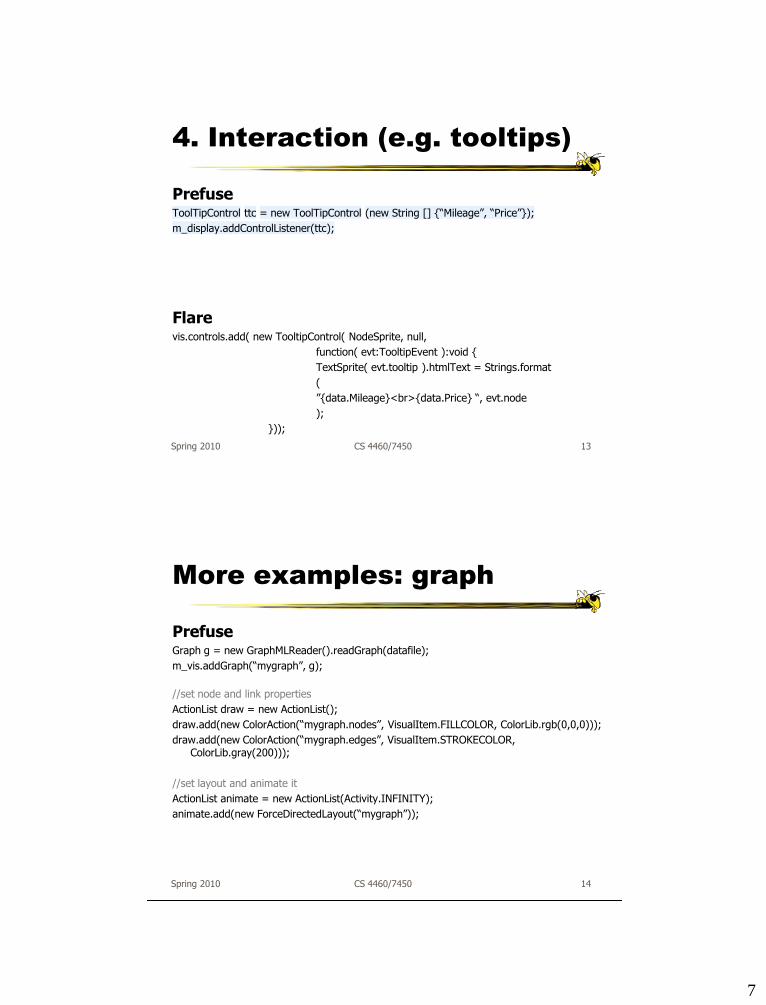
4. Interaction (e.g. tooltips)
PrefuseToolTipControl ttc = new ToolTipControl (new String [] {“Mileage”, “Price”});
m_display.addControlListener(ttc);
Flare vis.controls.add( new TooltipControl( NodeSprite, null,
function( evt:TooltipEvent ):void {
TextSprite( evt.tooltip ).htmlText = Strings.format
(
”{data.Mileage}<br>{data.Price} “, evt.node
);
}));
Spring 2010 CS 4460/7450 13
More examples: graph
PrefuseGraph g = new GraphMLReader().readGraph(datafile);
m_vis.addGraph(“mygraph”, g);
//set node and link properties
ActionList draw = new ActionList();
draw.add(new ColorAction(“mygraph.nodes”, VisualItem.FILLCOLOR, ColorLib.rgb(0,0,0)));
draw.add(new ColorAction(“mygraph.edges”, VisualItem.STROKECOLOR, ColorLib.gray(200)));
//set layout and animate it
ActionList animate = new ActionList(Activity.INFINITY);
animate.add(new ForceDirectedLayout(“mygraph”));
Spring 2010 CS 4460/7450 14

8
For more references…
Prefuse
• Demos included in the distribution
• User manual (incomplete): http://prefuse.org/doc/manual
• JavaDoc: http://prefuse.org/doc/api/
Flare
• Demos included in the distribution
• API documentation: http://flare.prefuse.org/api/
• Tutorial: http://flare.prefuse.org/tutorial
Spring 2010 CS 4460/7450 15
Pros and Cons
• A few lines of code can do a lot!
• Built-in support for many useful features
• Quick and efficient for building standard visualizations
• Non-standard data format, custom visual design..
Extending abstract classes in the toolkits: e.g. Layout
Or resort to Java2D graphics / sprite graphics: back to square one
Spring 2010 CS 4460/7450 16

9
Processing
• Java based
• Unlike prefuse & flare, not specially designed for InfoVis
Data Reader? Layout algorithm?
But can definitely be used to build visualizations!
• Written by Ben Fry
• Well documented, lots of tutorials with contributions from many people and even books
Spring 2010 CS 4460/7450 17
Processing: the idea
• Programming as scripting
PDE: processing development environment
A program is called a sketch
written as a list of statements
Spring 2010 CS 4460/7450 18
10
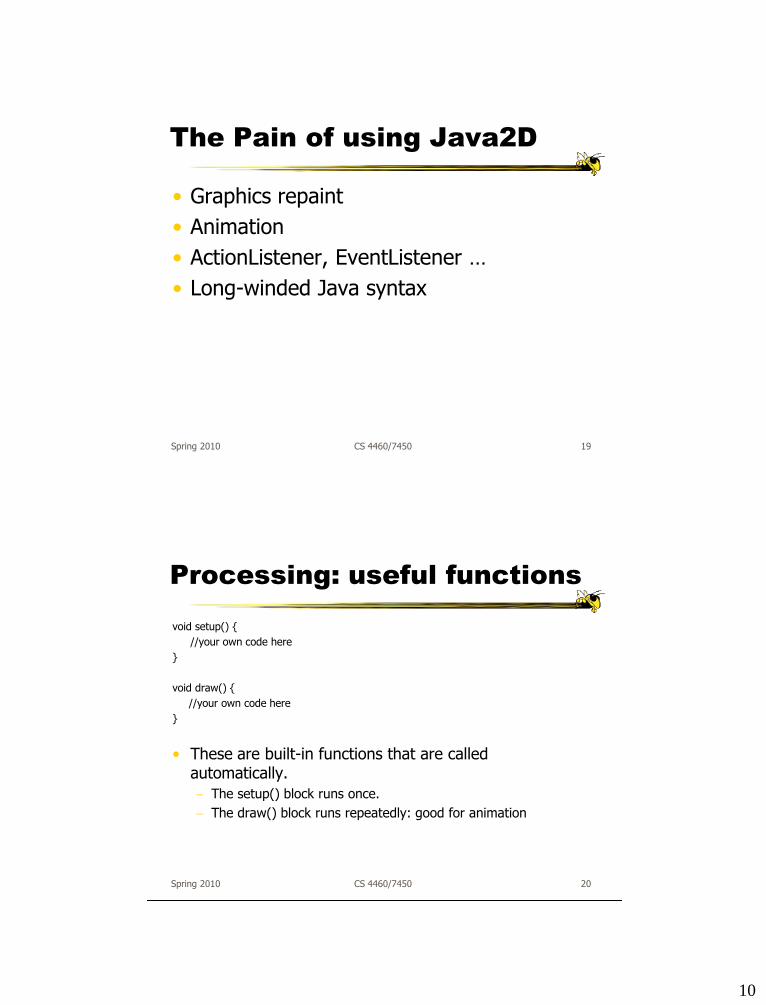
The Pain of using Java2D
• Graphics repaint
• Animation
• ActionListener, EventListener …
• Long-winded Java syntax
Spring 2010 CS 4460/7450 19
Processing: useful functions
void setup() {
//your own code here
}
void draw() {
//your own code here
}
• These are built-in functions that are called automatically.
The setup() block runs once.
The draw() block runs repeatedly: good for animation
Spring 2010 CS 4460/7450 20

11
Barchart
float[] data = new float[] { 2.3f, 0.34f, 5.4f, 6.5f, 2.9f, 1.2f, 8.9f };
float max = 8.9f;
float left= 300; float right= 500;
float barWidth = (right- left) / data.length;
float chartHt = 300;
void setup() {
size(800, 600);
background(255);
fill(204, 102, 0);
stroke(255);
for (int i = 0; i < data.length; i++) {
rect(left+ i * barWidth, 100.0f, barWidth, chartHt * data[i]/ max);
}
}
void draw() {}
Spring 2010 CS 4460/7450 21
Animated Barchart
float[] data = new float[] { 2.3f, 0.34f, 5.4f, 6.5f, 2.9f, 1.2f, 8.9f };
float max = 8.9f;
float iniHt = 0.001f;
float left = 300;
float right = 500;
float barWidth = (right- left) / data.length;
float chartHt = 300;
void setup() {
size(800, 600);
frameRate(60);
background(255);
fill(204, 102, 0);
stroke(255);
}
Spring 2010 CS 4460/7450 22

12
Animated Barchart cont’d
void draw() {
background(255);
for (int i = 0; i < data.length; i++) {
if (iniHt < 1) {
rect(left+ i * barWidth, 100.0f, barWidth, chartHt * data[i]/ max * iniHt);
iniHt += 0.001;
} else
rect(left+ i * barWidth, 100.0f, barWidth, chartHt * data[i]/ max);
}
}
Spring 2010 CS 4460/7450 23
MouseEvent
• Rollover:
Create a class called MyBar, which represents each of the bars in the chart,
Create methods in the class that checks if the mouse position is over the bar
Override void mouseMoved () to change the bar color
Spring 2010 CS 4460/7450 24
13
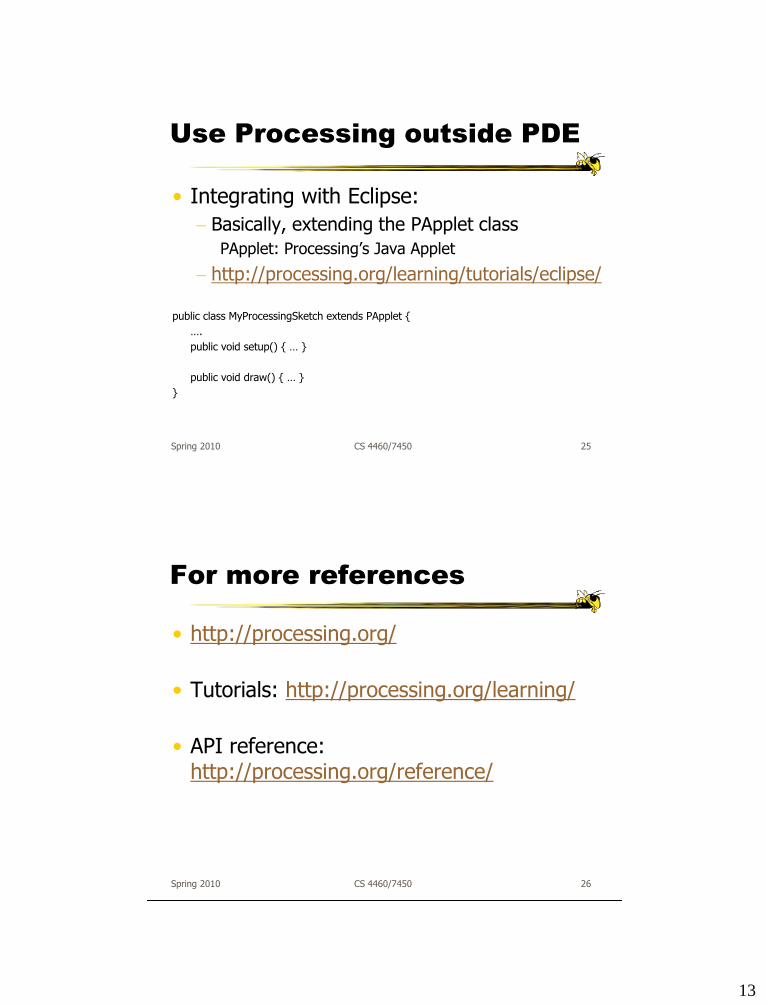
Use Processing outside PDE
• Integrating with Eclipse:
Basically, extending the PApplet class
PApplet: Processing’s Java Applet
http://processing.org/learning/tutorials/eclipse/
public class MyProcessingSketch extends PApplet {
….
public void setup() { … }
public void draw() { … }
}
Spring 2010 CS 4460/7450 25
For more references
• http://processing.org/
• Tutorials: http://processing.org/learning/
• API reference: http://processing.org/reference/
Spring 2010 CS 4460/7450 26
14
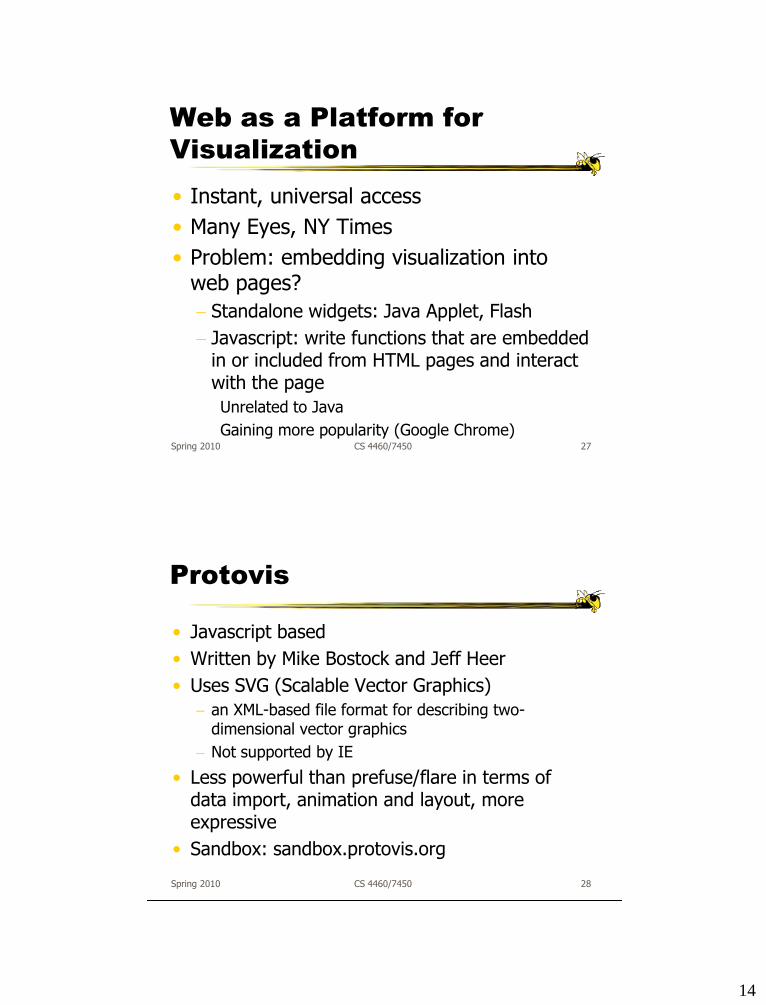
Web as a Platform for
Visualization
• Instant, universal access
• Many Eyes, NY Times
• Problem: embedding visualization into web pages?
Standalone widgets: Java Applet, Flash
Javascript: write functions that are embedded in or included from HTML pages and interact with the page
Unrelated to Java
Gaining more popularity (Google Chrome)Spring 2010 CS 4460/7450 27
Protovis
• Javascript based
• Written by Mike Bostock and Jeff Heer
• Uses SVG (Scalable Vector Graphics)
an XML-based file format for describing two-dimensional vector graphics
Not supported by IE
• Less powerful than prefuse/flare in terms of data import, animation and layout, more expressive
• Sandbox: sandbox.protovis.org
Spring 2010 CS 4460/7450 28
15
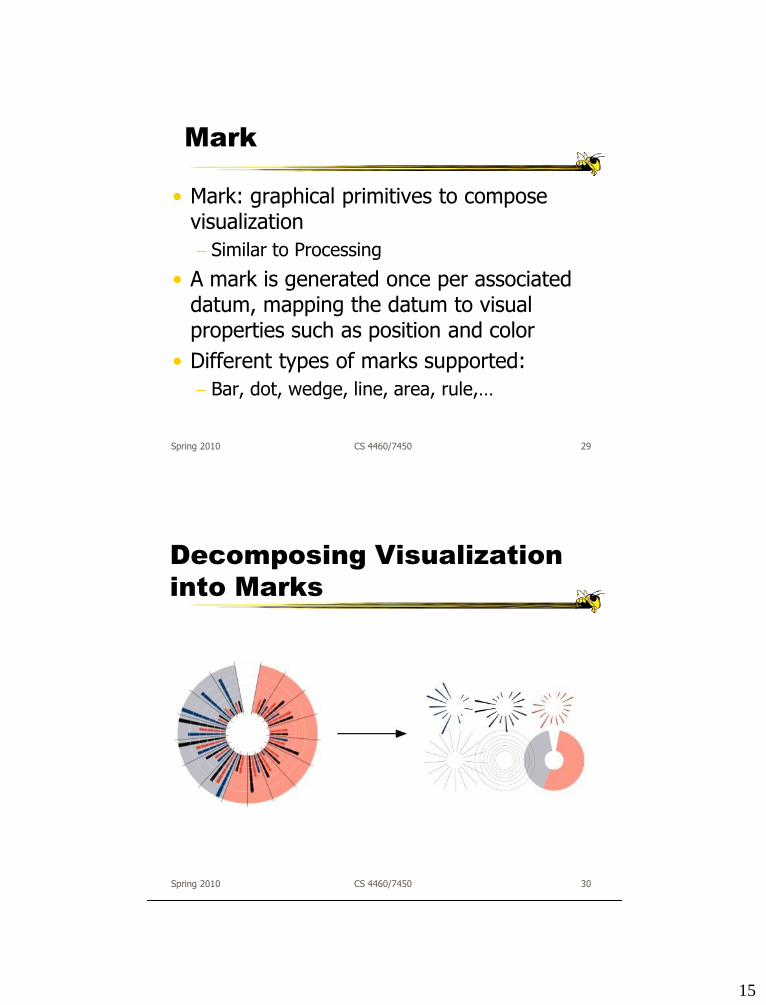
Mark
• Mark: graphical primitives to compose visualization
Similar to Processing
• A mark is generated once per associated datum, mapping the datum to visual properties such as position and color
• Different types of marks supported:
Bar, dot, wedge, line, area, rule,…
Spring 2010 CS 4460/7450 29
Decomposing Visualization
into Marks
Spring 2010 CS 4460/7450 30

16
Mark: data & visual properties
data [1, 1.2, 1.7, 1.5, .7]
visible true
left i * 25
bottom 0
height d * 80
width 20
fillStyle blue
strokeStyle black
… …
Spring 2010 CS 4460/7450 31
Method Chaining
Spring 2010 CS 4460/7450 32
new pv.Panel().width(150).height(150) .add(pv.Wedge)
.left(75).bottom(75)
.outerRadius(70)
.angle(function(d) d * 2 * Math.PI)
.data(pv.normalize([1, 1.2, 1.7, 1.5, .7]))
.root.render();
size(150, 150); background(255); smooth(); noStroke(); int diameter = 140; float[] data = {1, 1.2, 1.7, 1.5, .7}; float lastAng = 0, sum = 0;for (int i = 0; i < data.length; i++){
sum += data[i]; } for (int i = 0; i < data.length; i++) {
fill(data[i] * 120); float ang = data[i] / sum * 2 * PI; arc(width / 2, height / 2, diameter, diameter,
lastAng, lastAng + ang); lastAng += ang;
}
protovis processing
The method to set a property returns a reference to the mark itself, allowing you to set multiple properties in a single statement.
http://martinfowler.com/dslwip/MethodChaining.html
17
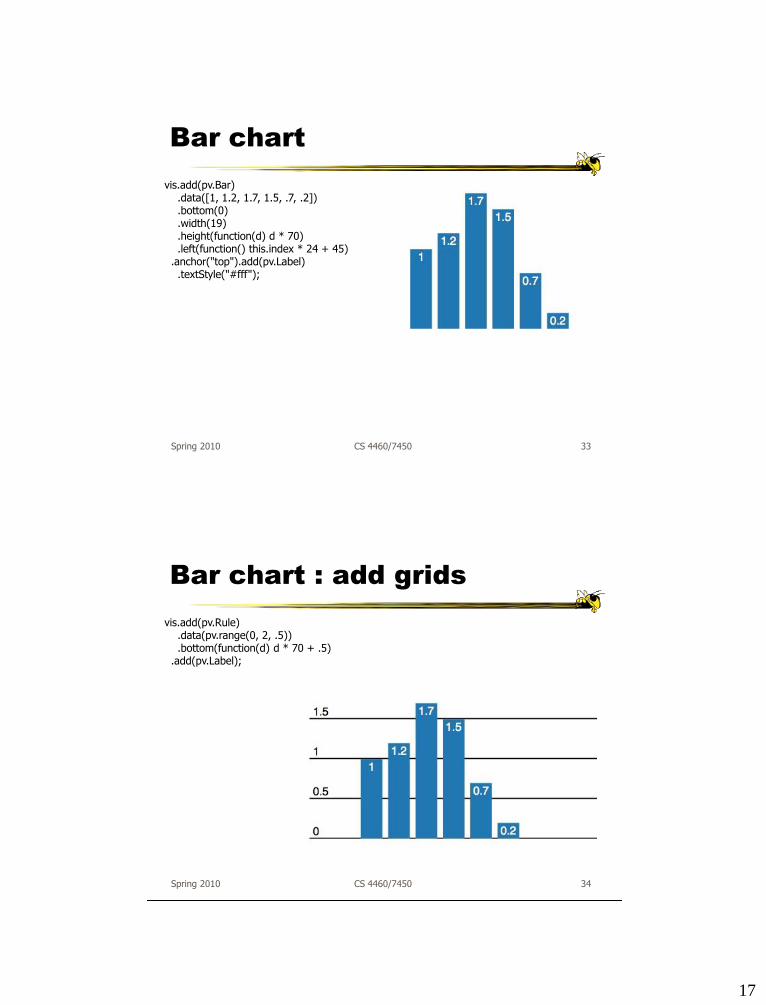
Bar chart
Spring 2010 CS 4460/7450 33
vis.add(pv.Bar).data([1, 1.2, 1.7, 1.5, .7, .2]).bottom(0).width(19).height(function(d) d * 70).left(function() this.index * 24 + 45)
.anchor("top").add(pv.Label).textStyle("#fff");
Bar chart : add grids
Spring 2010 CS 4460/7450 34
vis.add(pv.Rule).data(pv.range(0, 2, .5)).bottom(function(d) d * 70 + .5)
.add(pv.Label);
18
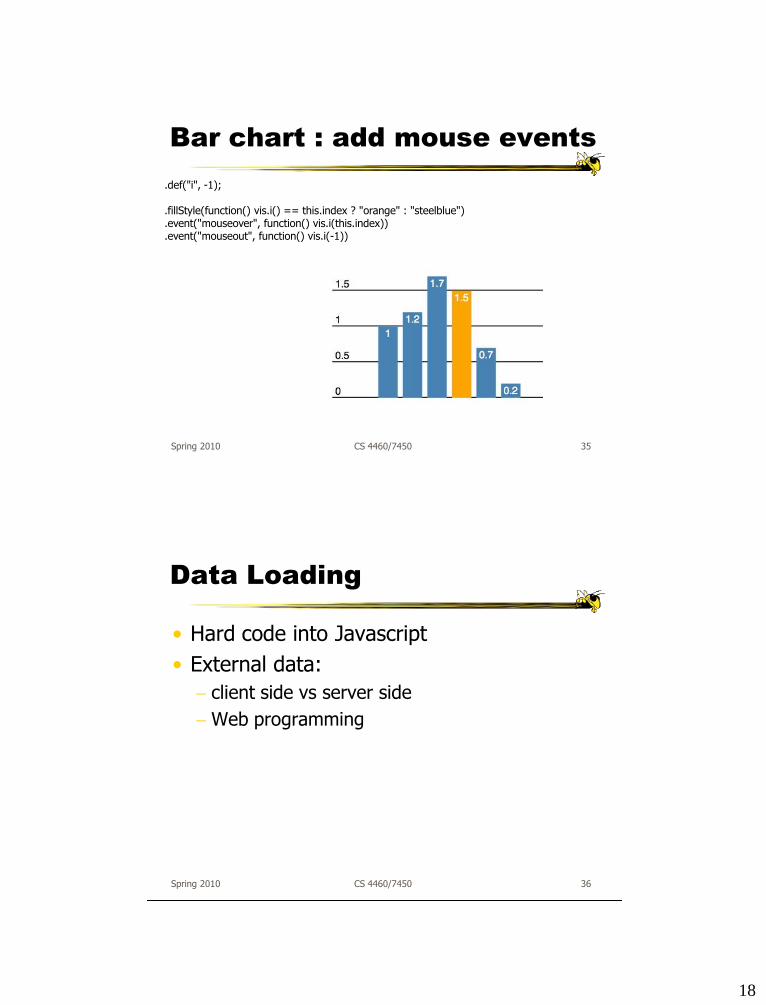
Bar chart : add mouse events
Spring 2010 CS 4460/7450 35
.def("i", -1);
.fillStyle(function() vis.i() == this.index ? "orange" : "steelblue")
.event("mouseover", function() vis.i(this.index))
.event("mouseout", function() vis.i(-1))
Data Loading
• Hard code into Javascript
• External data:
client side vs server side
Web programming
Spring 2010 CS 4460/7450 36

19
Embed Protovis into HTML
<html>
<head> <script type="text/javascript" src="../protovis-r3.1.0.js"></script>
//javascript containing the data array<script type="text/javascript" src=”data.js"></script><style type="text/css"> #fig { width: 334px; height: 833px; } </style> </head>
<body><div id="center">
<div id="fig">
<script type="text/javascript+protovis">
//protovis code here
</script>
</div>
</div>
</body>
</html>
Spring 2010 CS 4460/7450 37
For more references
• http://vis.stanford.edu/protovis/
• Tutorial: http://code.google.com/p/protovis-js/wiki/ReadMeFirst
• Examples: http://vis.stanford.edu/protovis/ex/
• Documentation: http://protovis-js.googlecode.com/svn/trunk/jsdoc/index.html
Spring 2010 CS 4460/7450 38

20
Which toolkit to use?
• Depending on your visualization design and programming experience
• Whatever you choose, it is important to know the basic concepts in object-oriented programming
Class, method, arguments, loop ...
• Recommendation: “Don't start by trying to build a cathedral”
Spring 2010 CS 4460/7450 39
Spring 2010 CS 4460/7450 40
Upcoming
• Commercial systems
Reading
Spenke paper
• Tufte’s Design Principles
No reading