infra-red analysis and the intermolecular interactions of
TRANSCRIPT

Infra-red analysis and the intermolecular interactions of ingredients during baking: enzymatic hydrolysis of starch, protein secondary structure and product characteristics
MOHAMED AHMED OMER
BSc. (Honours Biochemistry and Food Technology), MSc. (Food Science and
Technology)
A thesis submitted in fulfillment of the requirements for the degree of Doctor of Philosophy
Department of Applied Chemistry School of Applied Sciences
RMIT University March 2012

ii
Declaration
I certify that except where due acknowledgement has been made, the work is that of the
author alone; the work has not been submitted previously, in whole or in part, to qualify for
any other academic award; the content of the thesis is the result of work which has been
carried out since the official commencement date of the approved research program; and,
any editorial work, paid or unpaid, carried out by a third party is acknowledged.
MOHAMED AHMED OMER

iii
Acknowledgments
First of all, I would like to thank the Almighty God for all his blessing and for shedding
health on me and keeping my brain functioning to complete this work, which I hope will
contribute to the wellbeing of human kind.
I would like to express my deepest appreciation and gratitude to my kind supervisor
Associate Professor Darryl Small for his unlimited support, continuous help and beneficial
advice throughout my post graduate studies at RMIT University. He is an infinite source of
encouragement and inspiration for me. Darryl Small’s door is always open to me
whenever I need help or advice. His patience, encouragement and support help me
coping with various challenges I faced during my post graduate studies. He gave me his
time and efforts so generously, and showed me the true and wonderful spirit of academic
supervision. It has been a great pleasure and privilege to work with him and to benefit
from his rich knowledge and experience. I found him most helpful whenever I stuck with
any problem. He always reminds me of ethics in science and life, and that our real value is
linked to how much we serve people and contribute to the advancement of science. No
one has ever helped me as much as Darryl; I owed all my success to his guidance and
support.
I also would like to thank my co-supervisor Professor Mike Adams for his help and support
during various stages of my candidature at RMIT, in particular His encouragement in the
RACI conference and his helpful comments on the FT-IR results.
I extend my thanks and appreciation to Professor Mohamed Mathlouthi from Laboratoire
Chimie Industrielle, Faculty of Science, University of Reims, France for his helpful
comments and suggestions on the FT-IR results, the supply of his book and other
references and for reviewing and commenting on early version of one of my manuscript
paper.
I would like to express my special thanks to Dr Mohamed Alkobisi, RMIT University, for his
help, support and continuous scientific discussion. Mohamed was there whenever I seek
help, he provided me with unlimited encouragement and unconditional support.
I also would like to thank Mr Michael Kakoullis, Food Science Pilot Plant, for his help and
support on various things. His friendly nature always encourages me to approach him
whenever I need him. It has been great to know a helpful and wonderful person like him. I
iv
am also grateful to Mr Frank Antolasic, Senior Technical Officer from RMIT vibration
spectroscopy facility. Mr. Frank allows me to use the facility and help with the operation of
various instruments in the facility. His valuable discussions have contributed to the
progress of my project.
My thanks are also extended to Perkin Elmer staff for providing me with the training
course in the use of FT-IR &UV-Vis. It has been useful and helpful training Module.
I would like to express special thanks to the staff of the Rheology and material processing
centre at the faculty of chemical engineering for allowing me to use their instruments.
Special thank to Mr Anderew Cris for the training on the use of the rheometer and the
results interpretation, he spent a lot of time helping me. I also would like to thank Mr. Karl
Lang, Laboratory coordinator, Applied Chemistry, for his assistance and support in
ordering and supplying chemicals and materials, and to all laboratory technicians in both
Applied Chemistry and Food Science for their help and cheerfulness, especially Nadia,
Zahra and Howard.
I would like to express my special thanks to my applied chemistry department colleagues
especially Mr Ylias Sabri, Mr Kris Frost, Dr Abdulgadir, Dr Prashant Sawant, Mr
Abdulrahman Anod and to my food chemistry research group Dr Lan, Associated
professor Omar, Dr Larisa, Dr Thu, Dr Tim, Dr Niji, To all of you I am grateful, you have
been supportive and I enjoyed being with you.
I would like to thank my students at Menzies Institute of technology and would like to
express my special thanks to many friends in Australia and around the world. These
people provided me with support, encouragement and were able to be “family” for me.
Among my friends I especially thank Dr Seedahmed and his family.
Finally, I would like to dedicate this work and all of my success to the memories of my
father Omer and my friend Hamza, both would have been very happy with this
achievement, and also to my mother (Haram Mohamed Kheir), brothers, sisters and
friends. I always tried my best to make them proud of me. In spite of the hard time they
going through, they have always been there to support me and for that I am very grateful.

v
Publications
Part of the results in this study were presented in conference presentation in the
15th Annual RACI Environmental and Analytical Division R&D Topics Flinders University,
Adelaide, South Australia 9th – 12th December, 2007

vi
Abstract Wheat flour doughs are important in the manufacture of various bakery products. There is
a complex array of intermolecular interactions occurring within doughs and during the
baking process; these interactions determine the end product quality and consumer
appeal. In this study the inter-molecular interactions of flour components and other baking
ingredients were investigated in the main three stages of bread making. These are, firstly,
the mixing stage which primarily involves protein components, then the fermentation
process which depends on both protein and starch because this requires both the
production and retention of gas. Finally the baking process impacts end product quality
through the changes of staling following the interactions occurring in the earlier stages.
The primary aim of this study has been to investigate the inter-molecular interactions of
selected baking ingredients during the three main stages of bread making process. The
specific objectives have been to monitor the impact of the interactions at each stage as
well as the impact on the ultimate characteristics of the resultant bread. In seeking to
provide chemical and biochemical interpretation for the ingredient interactions during the
dough mixing and proofing stages as well as their impact on the final product quality, an
approach based on Attenuated total reflectance Fourier transform infrared (ATR/FT-IR)
spectroscopy has also been evaluated. The purpose has been to seek new ways to
investigate the complexity of these systems and adapting modern instrumental techniques
to the study of wheat flour doughs.
In this study ATR/FT-IR spectroscopy has been used and adapted to an investigation of
the interactions occurring during bread making. Recent innovations and software which
facilitate deconvolution of spectral data have been applied. In addition, baking tests were
used to study the impact of ingredient interactions on the quality attributes of the end
product. The paramters evaluated included texture and bread staling measured using
texture analysis, bread colour using Minolta Chroma Meter as well as bread volume.
The interaction of baking ingredients during the dough development stage were
investigated using ATR/FT-IR spectroscopy particularly utilising its capability of showing
the relative contributions of the different types of protein secondary structure, specifically
α-helix, β-pleated sheet and β-turns. The results obtained during this study showed that
the wheat flour proteins in the dough are the primary determinant of the dough
development process. The changes taking place in the dough structure have been
interpreted in relation to the changes in the protein secondary structural components. The
relative proportion of the β-sheet content increased upon addition of the oxidising agent

vii
ascorbic acid. The resultant changes in dough strength reflect the increased contribution
of the β-sheet structure. Since the glutenin components of the gluten matrix are known to
be rich in β -sheet, the dough strength has been interpreted in relation to the role and
involvement of the glutenin within the matrix. Conversely, the incorporation of the reducing
agent L-cysteine weakens the dough structure. This appears to be reflected in an increase
in the intra-molecular interactions, protein- protein as well as starch- protein. The results
are also interpreted as indicating that the oxidising agent increases inter-molecular
interactions within the same protein molecule by enhancing the formation of disulfide
bonds.
A further aspect of molecular interaction investigated during the fermentation process was
the action of α-amylase on wheat flour starch. This was monitored and measured, using
ATR/FT-IR in the region of 800-1300 cm-1 corresponding with vibration associated with C-
C and C-O bonds. In order to study the inter-molecular interactions during the
fermentation process, time dependent measurements were taken to monitor the reaction
in which α-amylase hydrolysed starch components of wheat flour. In the spectra, peaks
corresponding to the various sugars were detected, the relative areas of each were
calculated and the amount of the sugars was observed to increase during the reaction.
The rate of cleavage of the glycosidic linkage in starch by the action of α-amylase was
monitored over the incubation time. The changes in starch structure were also estimated
during this study focussing on the peak at 1045 cm-1 which indicates the crystallinity of the
starch. This was seen to decrease while increases were seen in the peak at around 1022
cm-1, corresponding with the amorphous structure of starch. In addition, it was possible to
quantitate the peak appearing at approximately 976 cm-1 and this is identified as the
damaged starch component.
The interaction of ingredients during baking and their impact on the end product quality
were investigated. The addition of various levels of the oxidising agent ascorbic acid
increased bread volume and enhanced bread texture while the reducing agent L-cysteine
increased bread volume to certain extent, but with elevated levels of incorporation,
marked decreases in volume occurred, whilst at all levels bread crust color was improved.
These changes in the baking quality were related to the changes brought about by the
same dosage of both ingredients in the previous two steps of dough development and the
fermentation stage. The effects of various levels of α-amylase on bread quality were
measured and the addition of α-amylase was found to enhance bread volume, texture and
colour as well as slowing the rate of bread staling.

viii
The current study enhances our knowledge of the baking process, confirms the value of
deconvolution software for the evaluation of infra-red spectra as well as demonstrating the
value of infra-red analysis as a means of monitoring the changes taking place and the
influence of improver ingredients.

ix
Abbreviations
ATR attenuated total refelectance WS-AX water souluble arabino xylan
ASA ascorbic acid WU-AX water unsouluble arabino xylan
α alpha S-AX soluble arabino xylan
β beta WE-AX water extractable arabino xylan
γ gamma WEP water extractable pentosan
ω omega RACI Royal Australian Chemical Institute
DATEM diacetyl tartaric acid esters of monodiglycerides
ml millilitre
SSL sodium stearoyl-2-lactylate ppm parts per million
CSL calcium stearoyl-2-lactylate μm micrometer
FT-IR Fourier transform infrared λ lambda
IRE internal reflection element θ theta
KBr potasium bromide % percentage
D2O deuterium oxide DHA dehydro ascorbic acid
HMW high molecular weight AOX ascorbate oxidase
LMW low molecular weight SKB Sandstedt - Kneen - Blish
EC Enzyme Commission U.S. United states
BU Brabender units ºC degrees Celsius
CM centimeter NMR nuclear magnetic resonance
N nitrogen SH sulfdryl
FT Fourier transform S-S disulfide
OH nydroxyl IUBMB International Union of Biochemistry and Molecular Biology
min minutes ATP adenosine triphosphate
BRIA Bread Research Institute of Australia
NAD nicotinamide adenine dinucleotide
g gram NADP nicotinamide adenine dinucleotide phosphate
kg kilogram EC Enzymes commission
AACC American Association of Cereal chemists
GSH-DH
glutathione dehydrogenase
s seconds

x
T Triticum
mm millimeter
CFV compression force value
N Newton

xi
List of Figures Figure 1-1 Digital image of bread crumb showing the effect of mixing in the grain of the
crumb, adapted from [4].......................................................................................................2
Figure 1-2 Gluten network development and gluten extension adapted from [12] ..............3
Figure 1-3 The effect of energy input (Wh/kg) on bread volume. [13] .................................4
Figure 1-4 Yeast multiplication by budding. [17]..................................................................5
Figure 1-5 Different stages in the transformation of dough into bread during the baking
process. [22] ........................................................................................................................7
Figure 1-6 The formation of the peptide pond in proteins [43].............................................8
Figure 1-7 Amino acids structure [49]..................................................................................9
Figure 1-8 The structure of the 20 commonly occurring amino acids. [50]........................10
Figure 1-9 Protein structure. [59] .......................................................................................13
Figure 1-10 Hydrogen bonding in α helix. [16] ..................................................................14
Figure 1-11 Van der Waal’s forces. [49] ............................................................................15
Figure 1-12 The electromagnetic wave. [68] .....................................................................16
Figure 1-13 The electromagnetic spectrum. [73] ...............................................................17
Figure 1-14 The effects of interaction between the electromagnetic spectrum radiation and
molecules. [74]...................................................................................................................17
Figure 1-15 Schematic representation of an FT-IR spectrometer. [82] .............................19
Figure 1-16 Stretching and bending vibrational bands in FT-IR spectrum adapted from.
[87].....................................................................................................................................20
Figure 2-1 The relation between wheat hardness and protein content in relation to end
uses [93] ............................................................................................................................21
Figure 2-2 Longitudinal section of a wheat kernel showing the different layers; 1. Pericarp,
2. Hypodermis, 3. Tube cells, 4. Seed coat, 5. Nucellar tissue, 6. Aleurone layer, 7. Outer
starchy endosperm cells, 8. Inner starchy endosperm cells, 9. Germ, 10. Scutellum, from
[91].....................................................................................................................................22
Figure 2-3 α-(D) glucose ...................................................................................................23
Figure 2-4 Amylose structure where n indicates a relatively large number .......................23
Figure 2-5 Amylopectin structure showing the α-(1,6) linkage at a branch point in the
polymeric structure ............................................................................................................24
Figure 2-6 Amylopectin structure (a) glucosyl units connected via α-1,4 and α-1,6
glycoside linkages (b) the cluster model of amylopectin structure [96]..............................25
Figure 2-7 Schematic depiction of gluten components [114]. Note the clockwise
presentation of the diagram (A) gliadin; (B) HMW glutenin sub unit showing action of β

xii
spirals as molecular spring; (C) HMW glutenin sub unit showing the action of the disulfide
in preventing the extension of β spirals; (D) LMW glutenin sub unit. .................................27
Figure 2-8 The effects of formation of disulfide bonds between glutenin and gliadin during
the dough mixing [29] ........................................................................................................28
Figure 2-9 The effect of different AX fractions on bread volume [101] Note that the
abbreviations used here are: 1. WU-AX water unextractable arabinoxylan 2. S-AX soluble
arabinoxylan 3. WE-AX water extractable arabinoxylan....................................................29
Figure 2-10 The oxidative cross linking of ferulic acid in pentosan [114] ..........................30
Figure 2-11 The yeast cell. [135] .......................................................................................31
Figure 2-12 Effect of different levels of fat incorporation on bread volume [135] ..............32
Figure 2-13 The action of different types of amylolytic enzymes on amylopectin polymer
[31].....................................................................................................................................36
Figure 3-1 The ATR accessory used for aqueous solutions..............................................39
Figure 3-2 The accessory arrangement used for presentation of dry samples in the form of
a KBr disc ..........................................................................................................................39
Figure 3-3 Starch gelatinisation process [207] ..................................................................46
Figure 3-4 The stages in the process of starch retrogradation [219] .................................47
Figure 5-1 The effect of sodium chloride concentration on bread volume.........................59
Figure 5-2 The effect of sodium chloride on crust color.....................................................60
Figure 5-3 The effect of salt concentration on crumb texture ............................................61
Figure 5-4 The effect of L-cysteine incorporation on bread volume ..................................63
Figure 5-5 The effect of L-Cysteine addition on bread texture ..........................................64
Figure 5-6 The effect of L-cysteine addition on crust color................................................65
Figure 5-7 Effect of ascorbic acid on bread volume ..........................................................66
Figure 5-8 The effect of AsA on bread texture...................................................................67
Figure 5-9 The effect of AsA on crust color .......................................................................67
Figure 5-10 The effect of fumaric acid on wheat flour dough. [260] ..................................68
Figure 5-11 The effect of fumaric acid on bread volume ...................................................69
Figure 5-12 Effect of fumaric acid on bread texture...........................................................69
Figure 5-13 The effect of α-amylase on bread volume......................................................70
Figure 5-14 The effect of α-amylase on bread crust color.................................................71
Figure 5-15 α-Amylase and it influence on bread staling ..................................................72
Figure 6-1 The equation for the depth of penetration of the ATR/FT-IR radiation. [278] ...75
Figure 6-2 A typical wheat flour dough ATR/FT-IR spectrum ............................................76
Figure 6-3 The deconvoluted blank dough spectrum before the addition of α-amylase....77

xiii
Figure 6-4 The deconvoluted dough spectrum immediately after the addition of α-amylase.
...........................................................................................................................................78
Figure 6-5 The deconvoluted dough spectrum after 5 min of the α-amylase reaction with
dough.................................................................................................................................78
Figure 6-6 The deconvoluted dough spectrum after 10 min from initiation of the α-amylase
reaction with dough............................................................................................................79
Figure 6-7 The deconvoluted dough spectrum after 15 min of the α-amylase reaction with
dough.................................................................................................................................79
Figure 6-8 The deconvoluted dough spectrum after 20 min of the α-amylase reaction with
dough.................................................................................................................................80
Figure 6-9 The deconvoluted dough spectrum after 25 min of the α-amylase reaction with
dough.................................................................................................................................80
Figure 6-10 The kinetics of the α-amylase reaction in dough based on the 937 cm-1
(glycosidic linkage α-1,4) relative peak area obtained from the deconvoluted spectra .....82
Figure 6-11 The kinetics of the α-amylase reaction with dough based on the 975 cm-1
relative peak area obtained from the deconvoluted spectra ..............................................83
Figure 6-12 The kinetics of the α-amylase reaction with dough based on the relative area
of the 997 cm-1 peak obtained from deconvoluted spectra ................................................83
Figure 6-13 The kinetics of the α-amylase reaction with dough based on the 1022 cm-1
(amorphous structure) relative peak area obtained from deconvoluted spectra................84
Figure 6-14 The kinetics of the α-amylase reaction with dough based on the 1047 cm-1
(crystal structure) relative peak area obtained from the deconvoluted spectra .................85
Figure 6-15 The ratio of the 1047 cm-1 (crystal structure) relative peak area to 1022 cm-1
(amorphous structure) obtained from the deconvoluted spectra. ......................................85
Figure 6-16 The kinetics of the α-amylase reaction with dough based on the 1060 cm-1
relative peak area obtained from the deconvoluted spectra ..............................................86
Figure 6-17 The kinetics of the α-amylase reaction with dough based on the 1105 cm-1
relative peak area obtained from the deconvoluted spectra. .............................................87
Figure 6-18 The kinetics of the α-amylase reaction with dough based on the 1127 cm-1
relative peak area obtained from the deconvoluted spectra. .............................................88
Figure 6-19 The kinetics of the α-amylase reaction with dough based on the 1151 cm-1
relative peak area obtained from the deconvoluted spectra. .............................................89
Figure 7-1 ATR/FT-IR spectrum of a typical wheat flour dough following deconvolution ..92
Figure 7-2 ATR/FTIR spectrum of wheat flour dough showing the amide I and II regions in
the dough spectrum following deconvolution.....................................................................93

xiv
Figure 7-3 ATR/FT-IR spectra following deconvolution for (A) dough before water
subtraction, (B) water, and (C) dough after water subtraction. ..........................................95
Figure 7-4 Wheat flour dough spectrum with 300ppm ascorbic acid following
deconvolution.....................................................................................................................96
Figure 7-5 Oxidation of ascorbic acid to DHA during dough mixing [91] ...........................97
Figure 7-6 Representation of the improver action of ascorbic acid in the dough. [317].....97
Figure 7-7 The effect of various levels of ascorbic acid on amide I components Note: Inter-
molecular β-sheet 1613 cm-1, Intra-molecular β-sheet 1630 cm-1, α-helix 1653 cm-1, and β-
turn 1673 cm-1....................................................................................................................98
Figure 7-8 The effect of various levels of ascorbic acid on amide I components Antiparallel
β-sheet 1686 cm-1, and C=O of ascorbic acid 1744 cm-1...................................................99
Figure 7-9 The effect of ascorbic acid on amide II components, the peaks at 1503 cm-1,
and 1517 cm-1. ...................................................................................................................99
Figure 7-10 The effect of ascorbic acid on amide II components, the peaks at 1530 cm-1,
and 1545 cm-1. .................................................................................................................100
Figure 7-11 The effect of ascorbic acid on amide II components 1560 cm-1, and 1580 cm-1.
.........................................................................................................................................100
Figure 7-12 The spectrum of a wheat flour dough incorporating 15 ppm L-cysteine
following deconvolution....................................................................................................101
Figure 7-13 The effect of various levels of L-cysteine on amide I components. Inter-
molecular β-sheet 1613 cm-1, Intra-molecular β-sheet 1634 cm-1, and β-turn 1673 cm-1 102
Figure 7-14 The effect of various levels of L-cysteine on α-helix (1653 cm-1) .................102
Figure 7-15 Effect of various levels of L-cyteine on amide II components (1494 cm-1, 1567
cm-1, and 1580 cm-1) ........................................................................................................103
Figure 7-16 Effect of various levels of L-cyteine on amide II components (1525 cm-1 and
1548 cm-1)........................................................................................................................103

xv
List of Tables Table 1-1 Mixing time for different bread making methods for North American wheat. [11] 3
Table 2-1 Ranges for major components in U.S. wheat [95] .............................................23
Table 2-2 The main enzymes used in cereal grain processing, their reactions, and their
substrates [144] .................................................................................................................35
Table 4-1 Materials and suppliers of bakery ingredients ...................................................50
Table 4-2 Ingredient formulation used in baking................................................................52
Table 4-3 Settings employed with the texture analyser .....................................................53
Table 7-1 The possible reactions involved in the improver action of ascorbic acid [317] ..97

xvi
Contents
Acknowledgments xi
Publications xiii
Abstract xiv
Abbreviations xvi
List of Figures xvii
List of Tables xviii
Contents xix
1 Introduction
2 Literature review
3 Literature review
4 Material and Methods
5 The interaction of ingredients during baking
6 The interaction of α amylase during the fermentation process
7 Investigating the effect of inter and intra-molecular interaction on protein secondary
structure in dough system using ATR FT-IR
8 Conclusions and future research

xvii
Table of Contents
1 Introduction ...................................................................................................................1
1.1 Stages of bread making ....................................................................................... 1
1.1.1 Dough development stage (Mixing) .................................................................1
1.1.2 Dough proving..................................................................................................4
1.1.3 Baking ..............................................................................................................5
1.2 Proteins................................................................................................................ 7
1.2.1 Structure of amino acids ..................................................................................8
1.2.2 Hydrophobic or nonpolar amino acids............................................................10
1.2.3 Hydrophilic or polar amino acids ....................................................................11
1.2.4 Negatively charged (acidic) amino acids........................................................11
1.2.5 Positively charged (basic) amino acids ..........................................................11
1.3 Protein structure................................................................................................. 11
1.3.1 Primary structure............................................................................................12
1.3.2 Secondary structure .......................................................................................12
1.3.3 Tertiary structure ............................................................................................12
1.3.4 Quaternary structure ......................................................................................12
1.4 Forces stabilising protein structures .................................................................. 13
1.4.1 Hydrogen bonding..........................................................................................14
1.4.2 Hydrophobic interactions................................................................................14
1.4.3 Electrostatic interactions ................................................................................15
1.4.4 Van der Waal’s forces ....................................................................................15
1.5 Infrared spectroscopy ........................................................................................ 15
1.5.1 Interactions between molecules and light ......................................................16
1.5.2 FT-IR Measurements .....................................................................................18
1.5.3 Molecular vibration .........................................................................................19
2 Literature review: I. Wheat flour components and baking ingredients ........................21
2.1 Wheat flour and its composition......................................................................... 21
2.1.1 Introduction ....................................................................................................21
2.1.2 Composition of wheat.....................................................................................22
2.2 Baking ingredients ............................................................................................. 30
2.2.1 Yeast ..............................................................................................................30
2.2.2 Salt .................................................................................................................32
2.2.3 Shortening......................................................................................................32
2.2.4 Bread improver...............................................................................................33
3 Literature review: II. Fourier transform infra-red analysis............................................38
xviii
3.1 FT-IR of protein secondary structure ................................................................. 38
3.1.1 FT-IR and protein analysis .............................................................................38
3.1.2 ATR/FT-IR of proteins ....................................................................................40
3.1.3 ATR/FT-IR of wheat flour dough systems ......................................................41
3.1.4 ATR/FT-IR of purified wheat flour gluten........................................................42
3.1.5 Protein secondary structure of glutenin..........................................................43
3.1.6 Protein secondary structure of gliadins ..........................................................43
3.2 ATR/FT-IR studies of the enzymatic degradation of starch ............................... 43
3.2.1 Hydrolysis of starch by amylases...................................................................43
3.2.2 ATR/FT-IR of carbohydrates ..........................................................................44
3.2.3 ATR/FT-IR of oligosaccharides and polysaccharides ....................................44
3.2.4 The use of ATR/FT-IR in the study of starch structure...................................44
3.2.5 ATR/FT-IR of starch gels ...............................................................................45
4 Material and Methods..................................................................................................50
4.1 Materials ............................................................................................................ 50
4.1.1 Wheat flour.....................................................................................................50
4.1.2 Baking ingredients..........................................................................................50
4.2 Instruments ........................................................................................................ 51
4.2.1 ATR/FT-IR and KBr disc ................................................................................51
4.2.2 Dough mixing, bread making and assessment instruments...........................51
4.3 Methods ............................................................................................................. 51
4.3.1 Bread making.................................................................................................51
4.3.2 Bread texture measurements.........................................................................52
4.3.3 Measurement of loaf volume..........................................................................53
4.3.4 Dough preparation for spectroscopy experiments .........................................54
4.3.5 Water subtraction methods ............................................................................54
4.3.6 Deconvolution ................................................................................................55
4.3.7 Solutions preparation .....................................................................................56
5 Results and discussion: the interaction of ingredients during baking..........................57
5.1 Introduction ........................................................................................................ 57
5.2 Effect of sodium chloride.................................................................................... 57
5.2.1 Bread volume.................................................................................................57
5.2.2 Crust color......................................................................................................59
5.2.3 Crumb texture ................................................................................................61
5.3 L-cysteine........................................................................................................... 61
5.3.1 Effect of L-Cysteine on bread volume............................................................62
5.3.2 Effect of L-Cysteine on bread texture.............................................................63

xix
5.3.3 Effect of L-cysteine on crust color ..................................................................64
5.4 Ascorbic acid...................................................................................................... 65
5.4.1 Effect of ascorbic acid on bread volume ........................................................65
5.4.2 Effect of ascorbic acid on bread texture.........................................................66
5.4.3 Effect of ascorbic acid on crust color .............................................................67
5.5 The incorporation of fumaric acid into bread formulations ................................. 68
5.5.1 Effect of fumaric acid on bread volume..........................................................68
5.6 Effect of α-Amylase............................................................................................ 69
5.6.1 Effect of α-Amylase on bread volume............................................................70
5.6.2 Effect of α-amylase on bread crust colour .....................................................71
5.6.3 The influence of α-amylase on bread staling .................................................71
6 Results and discussion: the interactions of α-amylase during the fermentation process
73
6.1 Summary............................................................................................................ 73
6.2 Introduction ........................................................................................................ 73
6.2.1 Starch composition.........................................................................................74
6.2.2 Amylases mode of action on starch ...............................................................74
6.2.3 Features of ATR/FT-IR...................................................................................74
6.3 Wheat flour dough spectra................................................................................. 75
6.4 α Amylase hydrolysis product spectrum ............................................................ 77
6.5 Monitoring the breakage of the glycosidic linkage (α-1, 4)................................. 81
6.6 The kinetics of the α-amylase reaction with dough based on the peak at around 976 cm-1 ............................................................................................................ 82
6.7 Effect of the enzymatic degradation on starch amorphous and crystalline structure ......................................................................................................................... 84
6.8 Conclusion ......................................................................................................... 89
7 Results and discussion: the application of ATR/FT-IR to an investigation of inter- and
intra-molecular interactions and protein secondary structure in a dough system..............90
7.1 Introduction ........................................................................................................ 90
7.2 ATR/FTIR of wheat flour dough ......................................................................... 92
7.2.1 Amide I ...........................................................................................................92
7.2.2 Amide II ..........................................................................................................94
7.2.3 Water subtraction ...........................................................................................94
7.2.4 Deconvolution ................................................................................................95
7.3 The effect of oxidising agent .............................................................................. 96
7.4 The effect of reducing agent ............................................................................ 100
7.5 Conclusion ....................................................................................................... 103

xx
8 Conclusions and recommendations for future research............................................105
8.1 Starch and α-amylase reaction ........................................................................ 105
8.2 Protein secondary structure ............................................................................. 106
8.3 ATR/FT-IR and the interactions occurring during baking................................. 106
8.4 Recommendations for future research into wheat flour dough ........................ 107
8.5 Recommendations for future research in food products .................................. 108
9 References................................................................................................................110

1
1 1 Introduction
1.1 Stages of bread making
During the baking process various ingredients are used to enhance the baking
performance of different types of flour with differing chemical composition. These additives
have diverse chemical structure and include enzymes, oxidising and reducing agents, as
well as emulsufiers. Recently enzymes have increasingly been preferred by the baking
industry as they are natural. Understanding the chemical and physical changes during the
various stages of bread making, is the key factor in controlling the action of baking
ingredients throughout the various steps in the baking process. [1, 2] Bread dough
systems are multiphase and have many components, with the major ones being starch,
protein, lipids, other carbohydrates, water, and air. The quality parameters of bread are
appearance, texture, taste, and stability and these are determined by the macroscopic
structure of the product. This, in turn, is greatly influenced by dough ingredients and
processing conditions. The macroscopic structure is developed during the baking process
through mixing and kneading of the ingredients, proving the dough and baking. [3]
1.1.1 Dough development stage (Mixing)
Dough mixing is a very important stage in bread making. It performs three primary
functions. Firstly, hydration occurs as the ingredients are homogenised and evenly
distributed into the flour which is the main ingredient. On a weight for weight basis, most
of the water added to make up the dough is absorbed by hydrophilic groups on the protein
molecules.[4] The second function is the mechanical development of the gluten network,
necessary to trap and hold the gases produced during the fermentation stage. The third
function is dough aeration and, during the initial mixing stage, the gas bubbles in the
dough are first created.[5, 6] In fact a significant component of the dough is air, which

2
arises from air entrapped in the bulk volume of the flour mass or from entrainment during
the mixing process.[4, 7] The contribution of this air in the baking process is lowering the
density of the dough, as shown in Figure 1-1, supplying oxygen for the yeast growth, and
creating the gas bubbles which act as nuclei for homogenous expansion. [7]
Figure 1-1 Digital image of bread crumb showing the effect of mixing in the grain of the crumb, adapted from [4]
Dough can be regarded as a foam and this is formed during the mixing process. A
continuous protein network is formed, air bubbles are created and larger bubbles are
broken up into smaller bubbles. [8] Dough mixing characteristics, rheological properties
and bread quality are very much related to protein composition. [9, 10] The extent to
which dough should be mixed and developed depends on the type of flour and its
chemical composition, the bread making method used and the subsequent processing
Steps as shown in, as well as the desired end product characteristics. [11]
The amount of mixing required to achieve optimum dough development may be
determined through a variety of means. The first approach is to perform baking trials on
dough mixed for different lengths of time possibly with differing mixing speeds. For the
Chorleywood bread processes a minimum mechanical energy input of 40kJ kg-1 with no
more than 5min mixing time is recommend. [6] During mixing, gliadin and glutenin form
disulfide bridges producing the gluten protein matrix which is a three–dimensional
structure capable of stretching without breaking as shown in Figure 1-2.

3
Table 1-1 Mixing time for different bread making methods for North American wheat. [11]
Process Total mixing time (min)
Total fermentation time (h)
Cysteine added (ppm)
Sponge and dough
15-17 3-5 -
Straight dough 16-21 2 -
No-time straight dough
16-21 - 40
Figure 1-2 Gluten network development and gluten extension adapted from [12]
The three dimensional structure of the gluten may break with overextension if the dough is
kneaded too much or over mixed. Therefore mixing time is an important factor in
determining the end product quality. [10, 12] Mixing energy on the other hand plays an
important role in optimising bread quality and final bread volume during the mechanical
dough development as shown in Figure 1-3. [13] The high energy input facilitates the
breaking of disulfide bonds which hold the original protein configuration together. As a

4
result, the sites available for the oxidation will increase. In addition, the energy input
during mixing causes a considerable temperature rise in the final dough. [13, 14]
Figure 1-3 The effect of energy input (Wh/kg) on bread volume. [13]
1.1.2 Dough proving
Proving is the heart of the bread making process; it is the very important link between
mixing and baking.[15] Understanding how aeration during mixing affects bread quality
requires a knowledge therefore of how the bubbles in the dough grow and change during
proving. [16] Bubble growth during proving is influenced by four factors: the first is the rate
of carbon dioxide production, which is a function of the rate of yeast growth and
multiplication. Yeast multiply by budding as shown in Figure 1-4. [17]. Carbon dioxide is
one of the by products of yeast growth and another condition that favours yeast growth is
the availability of food in the form of fermentable sugars. This is typically provided by the
addition of α-amylase to the bread formula to work upon damaged starch to produce
fermentable sugars and can also be aided by the addition of sucrose to the bread formula.
[16]

5
Figure 1-4 Yeast multiplication by budding. [17]
The second factor influencing the growth of gas bubbles is the gas retention capacity of
the dough, which is a function of the strength of the gluten network. The other factors are
the amount of carbon dioxide diffusing from the liquid phase into the nitrogen nuclei and
the rate of bubble coalescence. [16, 18] The amount of energy used during mixing
influences the bubble size distribution in the dough. Bubble size is important as it
influences bubble growth during the proving stage and hence the texture of the final
product. [18]
1.1.3 Baking
Baking is the last stage in bread making process; several chemical, biological and
physical changes take place. For example oven spring (Tthe sudden increases of bread
dough during the early stage of bread baking), protein denaturation, starch gelatinisation,
formation of a porous structure, evaporation of water, crust formation, and death of yeast
at temperature of 54ºC.[19, 20] These changes can take place in three different stages as
shown in Figure 1-5. The first of these takes place during the first 6 minutes of baking, the
temperature of the outer crumb increases to 60 ºC at rate of 4.7 ºC per minute, resulting in
high enzymatic activity, high yeast growth rate, and expansion of the gases resulting in
the oven spring. This effect takes place in the first 8 min of the baking time and reaches its
maximum in the first 5 min resulting in increase in bread volume by one third. The

6
changes in matrix rheology with temperature have a significant effect on oven spring and
bread quality. [21-24] Also in this stage, differences in baking quality and rheological
properties between flours from different wheat varieties become more pronounced and
are indicated by the extent of oven spring. [25] In the second stage, the combination of
heat, moisture, and time induces starch gelatinisation which starts at approximately 65 ºC.
[20] The heating rate and shear conditions during baking have a significant influence on
starch gel characteristics, while there is limited shearing encountered during baking due to
oven spring and gas expansion, heating rate becomes the most important factor in
determining the characteristic of crumb structure. [26-30] In addition, heat setting of gluten
proteins takes place in this stage, leading to the formation of the solid foam structure in
the bread.
Changes in the transient glutenin protein network during baking are due to changes in
protein surface hydrophobicity, sulfhydryl/disulfide interchanges, and the formation of new
disulfide cross-links. [31-35] Also during this stage crust colour becomes more brown-gold
in colour due to the chemical reactions producing coloured compounds, specifically the
non enzymatic browning caramelisation and Maillard reactions. Caramelisation is a result
of direct heating of carbohydrates, while the minimum requirements for the Maillard
reaction are amino groups associated with proteins, reducing sugars, heat, and some
water. [36-39] Browning depends on surface temperature, and is well correlated with
weight loss during baking and oven temperature.[36, 40] This stage takes around 12
minutes and the temperature increases to 98 ºC at rate of 5.4 ºC per minute. [23] The last
step involves volatilisation of organic compounds, which is considered to be the bake-out
loss. This stage takes about 6 minutes.[23] During baking, heat transport towards the
centre induces water transport and changes the water distribution in the bread loaf. [41]

7
Figure 1-5 Different stages in the transformation of dough into bread during the baking process. [22]
1.2 Proteins
Proteins are polymers made up of amino acids, joined by strong covalent peptide bonds,
where the amino group of one molecule reacts with the carboxyl group of the other
molecule in a condensation reaction resulting in the elimination of water. [42-44] as shown
in Figure 1-6.

8
Figure 1-6 The formation of the peptide pond in proteins [43]
All proteins contain carbon, hydrogen, nitrogen, and oxygen atoms. Most also contain
sulfur and some of have additional elements, including phosphorous in milk proteins and
iron in myoglobin, as prosthetic groups. [45] Proteins are very important in foods, playing
important roles in the food texture and adding nutritional value. [46]
1.2.1 Structure of amino acids
Amino acids are the building blocks of proteins. In all species proteins are made up of the
same set of 20 standard amino acids. All of these are comprised of a central carbon atom
(α-carbon) and attached to it are a carboxyl group (COOH), an amino group (NH2), a
hydrogen atom, and the side chain R which is specific to a particular amino acid [47, 48]
as shown in Figure 1-7.

9
Figure 1-7 Amino acids structure [49]
The properties of all the 20 amino acids depend on the nature of their side chain. The
simplest amino acid is Glycine in which the R group is a hydrogen atom. [44, 46, 48] The
nature of the side chain and the structure of the amino acids are shown in Figure 1-8.

10
Figure 1-8 The structure of the 20 commonly occurring amino acids. [50]
The physicochemical properties of amino acids (polarity, acidity, basicity, aromaticity,
bulkiness, conformational inflexibility, ability to form hydrogen bonds, ability to cross- link
and chemical reactivity) are governed by the nature of their side chain. [47] Amino acids
can be divided into four categories, according to the nature of their side chain. [46]
1.2.2 Hydrophobic or nonpolar amino acids
This group of amino acids contain nonpolar or hydrophobic (water “hating”) hydrocarbon
side chains. Alanine is the simplest amino acid in this group, with a side chain consisting

11
of a methyl group (CH3). Leucine and valine also belong to this group of amino acids, both
contain longer, branched hydrocarbon groups. In proline the side chain is conformationally
rigid. It is an important member of the nonpolar amino acid group, containing a bulky-five
membered ring which interrupts ordered protein structure. Also belonging to this group is
the sulfur containing amino acid methonine. This group of amino acids are involved in
hydrophobic interactions in proteins whereby they associate with each other to avoid
association with water. [42, 44, 46, 48]
1.2.3 Hydrophilic or polar amino acids
The amino acids in this group contain hydrophilic polar side chains. One example of
amino acids in this group is cysteine, with its highly reactive hydrophilic sulfur containing
side chain (SH). All amino acids in this group can form hydrogen bonds in proteins.
Cysteine is unique because it can form the strong covalent disulfide bond when it interacts
with another cysteine residue. As a result, the presence of cysteine in a protein has a
significant effect on protein conformation. [42, 44, 46, 48, 51]
1.2.4 Negatively charged (acidic) amino acids
The side-chains of the acidic amino acids aspartic acid and glutamic acid are negatively
charged at neutral pH because they both contain an additional carboxyl group. When an
acidic amino acid is contained within a protein structure, the extra carboxyl group is free
and may be charged depending on the pH of the medium. [42, 44, 46, 47, 52]
1.2.5 Positively charged (basic) amino acids
The amino acids arginine, lysine, and histidine are positively charged at pH 7 because
they contain an extra additional group. This amino group is free, does not participate in
peptide bond formation and may be positively charged depending on the medium pH.
Acidic amino acids and basic amino acids are involved in the formation of ionic
interactions and salt bridges in proteins. [42, 44, 46, 47, 52]
1.3 Protein structure
A knowledge of protein structure is essential for understanding how the various proteins
perform their function in food products. Experimental techniques for protein secondary

12
structure include X-ray crystallography, Nuclear magnetic resonance (NMR) spectroscopy
and fourier transform infrared (FT-IR) spectroscopy. [53]
Proteins composed of single polypeptide chain, are generally considered at three levels of
structure, the primary structure, the secondary structure and the tertiary structure, while
proteins containing two or more polypeptide chains, each chain is a subunit and there is a
quaternary level of structure. [42, 54] These levels of protein structure are presented in
Figure 1-9.
1.3.1 Primary structure
The primary structure of polypeptide chain of a protein is the order in which amino acids
are joined together in a chain and that will also determine the potential location of any
disulfide bonds. [48]
1.3.2 Secondary structure
Within the folded protein a few characteristic patterns occur frequently due to the
interactions between the chemical groups in the amino acids: these shapes are referred to
as protein secondary structure. The patterns occur repeatedly because they are stable
and the common protein secondary structures include α helix β sheet and β turns. [48, 55,
56]
1.3.3 Tertiary structure
Protein tertiary structure involves the folding and bending of the secondary structure. The
final shape of a polypeptide is formed as a result of simple molecular forces set up by
water- avoiding and water- attracting properties of the side chains. β sheet and α helix
undergo twisting and folding until the hydrophobic groups are tucked to the inside of the
polypeptide, away from water, and the hydrophilic groups remain exposed to the water.
[42, 57]
1.3.4 Quaternary structure
Protein quaternary structure refers to the number and the arrangement of subunits that
form a protein. Quaternary structure is an important protein attribute that is closely related
to its function. [58]

13
Figure 1-9 Protein structure. [59]
1.4 Forces stabilising protein structures
Protein primary structure is maintained by covalent bonds, while secondary, tertiary and
quaternary structures are stabilized principally by noncovalent bonds. In addition, any
disulfide bonds that form may be considered as contributing to the secondary and the
tertiary levels of structure.[54] The –SH ends of two cysteine R groups often form an –S-

14
S- bond, a covalent disulfide bridge that typically brings distant parts of the chain together.
[42, 51]
1.4.1 Hydrogen bonding
The properties of many substances suggest that, in addition to the normal chemical
bonding between the atoms and ions, there exists some further interaction involving a
hydrogen atom placed between two or more other groups of atoms. [60] Hydrogen
bonding is a force of attraction between a hydrogen atom in one molecule and a small
atom of high electro negativity in another molecule. It is an inter-molecular force rather
than intera-molecular force. Hydrogen bonding plays an important role in the properties of
water, protein and nucleic acids. [61] in the formation of the α-helix structure in proteins
the hydrogen bonding causes the poly peptide to twist into a helical shape [62] as shown
in Figure 1-10.
Figure 1-10 Hydrogen bonding in α helix. [16]
1.4.2 Hydrophobic interactions
These interactions arise because of the thermodynamic incompatibility between the
nonpolar side chains of amino acids and water.[63, 64] The presence of the hydrophobic
groups in an aqueous solution prevents the water molecules from forming hydrogen
bonds and they interfere with the organisation of the water molecules. [52]
15
1.4.3 Electrostatic interactions
Among the various forces and interactions stabilising the tertiary and quaternary
structures of proteins, electrostatic interaction is recognised as being as important as
hydrophobic interactions in maintaining protein structure.[65] At neutral pH values, the
side- chains of the acidic amino acids (aspartic and glutamic acids) will be negatively
charged, while the side chain of the basic amino acids (lysine, arginine and histidine to
some extent) will be positively charged. These groups may result in bonding between
different portions of a given molecule or between two or more protein chains if
appropriately positioned. [42, 52]
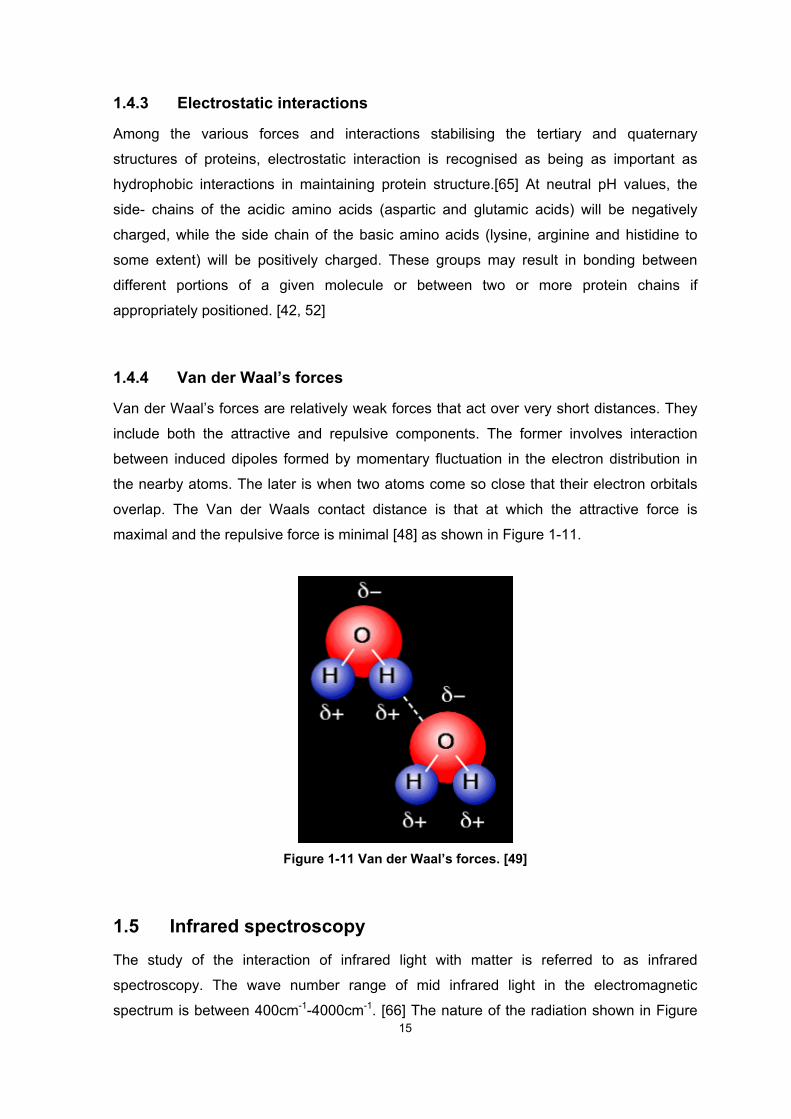
1.4.4 Van der Waal’s forces
Van der Waal’s forces are relatively weak forces that act over very short distances. They
include both the attractive and repulsive components. The former involves interaction
between induced dipoles formed by momentary fluctuation in the electron distribution in
the nearby atoms. The later is when two atoms come so close that their electron orbitals
overlap. The Van der Waals contact distance is that at which the attractive force is
maximal and the repulsive force is minimal [48] as shown in Figure 1-11.
Figure 1-11 Van der Waal’s forces. [49]
1.5 Infrared spectroscopy
The study of the interaction of infrared light with matter is referred to as infrared
spectroscopy. The wave number range of mid infrared light in the electromagnetic
spectrum is between 400cm-1-4000cm-1. [66] The nature of the radiation shown in Figure

16
1-13, has been interpreted by Maxwell’s classical theory of electro- and magneto-
dynamics. Radiation is considered as two mutually perpendicular electric and magnetic
fields oscillating in single planes at right angles to each other and these are in phase and
being propagated as sine waves [67] as shown in Figure 1-12.
Figure 1-12 The electromagnetic wave. [68]
1.5.1 Interactions between molecules and light
The molecular energy of a specific molecule is the sum of its electronic energy, vibrational
energy and rotational energy. Electronic energy is caused by visible light and ultraviolet
energy, while vibration energy is caused by infrared radiation. Rotational energy is a
function of near-infrared energy.[69, 70] There are five possible effects of the interaction
between radiation and molecules, ultraviolet high energetic radiation can cause ionization,
while electron transitions are usually caused by visible light. The other three possible
effects are scattering, emission and absorption. The last of these is the process by which
the energy of a photon is taken up by matter and this process plays a key role in (IR)
spectroscopy [71] as shown in Figure 1-14.
The most unique physical property of a compound is its infrared absorption spectrum. No
two compounds with different structures have the same IR spectra, with the exception of
optical isomers. [72]

17
Figure 1-13 The electromagnetic spectrum. [73]
Figure 1-14 The effects of interaction between the electromagnetic spectrum radiation and molecules. [74]

18
1.5.2 FT-IR Measurements
The first step in producing an IR spectrum is to collect and store a reference interferogram
with no sample in the sample cell. Then the sample is placed in the cell and a second
interferogram is collected, the Fourier transformation is then applied to the two
interferograms to compute the IR spectra of the reference and the sample. The ratio of the
two spectra can then be computed to produce an IR spectrum of the sample. [67, 69, 72,
75, 76]
FT-IR measurement involves irradiating the sample with the whole range of IR
frequencies; some of this irradiation will be absorbed by the sample if the radiant energy
matches the energy of specific molecular vibrations and the remainder will be
transmitted.[66, 71] The IR radiation in FT-IR measurement is guided by an optical device
containing all the IR frequencies and this is referred to as an interferogram. In this the
beam of light is divided into two different paths by a beam splitter, as described in Figure
1-15. The beam splitter is designed to transmit half of the radiation to strike the fixed
mirrors, and reflect the other half to strike the moving mirrors [76]. An optical path
difference is introduced between the two beams by translating the moving mirrors away
from the beam spliter. The two beams are recombined at the beam splitter, after reflecting
off their respective mirrors. After their recombination, half of the light is returned to the
source and the other half is passed through the sample and then to a detector. [69, 71,
77-79] The resulting interferogram is then subjected to FT to produce the spectrum by
changing the signal from the time domain to the frequency domain. [67, 69, 80, 81]

19
Figure 1-15 Schematic representation of an FT-IR spectrometer. [82]
1.5.3 Molecular vibration
The vibrational energy of a molecule is determined by the shape of the molecule, the
masses of atoms and by the associated vibronic coupling.[71, 72] Each mass requires
three coordinates to define its position, so for a molecule composed of N atoms there is
3n degree of freedom for its motion, six of which are translational and rotational of the
molecule itself. This leaves 3n-6 or 3n-5 degrees of vibrational freedom if the molecular is
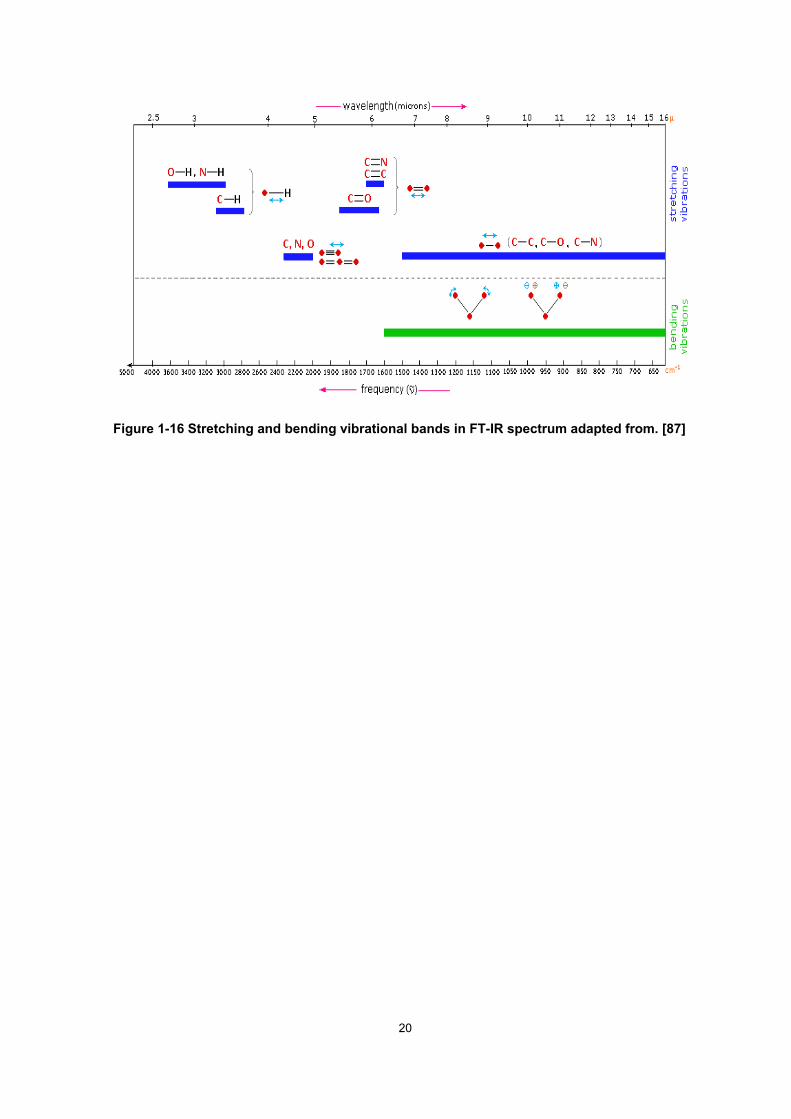
linear.[66, 71, 82] The different types of vibration mode are shown in Figure 1-16 and are
given descriptive names including asymmetric stretch, symmetric stretch, bending,
rocking, twisting and scissoring. [48, 71, 72] The actual vibration of structure is a
combination of all of the vibrational modes. [79, 81, 83]
For a vibrating molecule to absorb IR the molecular vibration has to cause a net change of
the dipole moment of the molecule. Absorption strength depends on the size of
deformation of the dipole moment due to vibration. [70, 77, 78, 84] A large deformation of
the dipole moment results in strong absorption as in the case of C=O, while small
deformation produces weak absorption as in the case of C-C. In addition, the strength of
absorption increases with increasing polarity of the vibrating bond. [67, 72, 85, 86]
20
Figure 1-16 Stretching and bending vibrational bands in FT-IR spectrum adapted from. [87]

21
2 2 Literature review: I. Wheat flour components and
baking ingredients
2.1 Wheat flour and its composition
2.1.1 Introduction
Cereal grains are important dietary sources of energy and a primary provider of proteins.
[88, 89] Among the cereal grains, wheat is widely cultivated because of its relatively high
protein, high carbohydrate, and mineral contents. [90, 91] Wheat is processed into a
variety of different types of food products worldwide because of the unique viscoelastic
properties of its dough.[92] The chemical composition of wheat greatly affects the end
uses and the type of products which are made, as shown in Figure 2-1. Commercially
three wheat species are grown Triticum aestivum (common wheat), T. durum (durum
wheat) and T. compactum (club wheat). [91, 93]
Figure 2-1 The relation between wheat hardness and protein content in relation to end uses [93]

22
Within Australia wheat is mainly used for human consumption, with bakers using
approximately half of the domestic flour production. The other main group of users is the
starch/gluten industry which uses about a quarter of the domestic flour production. [94]
2.1.2 Composition of wheat
Several factors govern the composition of wheat grains and result in variations from one
area to another and from year to year. [95] Table 2-1 shows the ranges of major
components in wheats grown in the U.S. The different layers of wheat kernel are shown in
Figure 2-2 . The seed coat encloses the endosperm and the germ in the wheat kernel.
The aleurone layer is rich in soluble protein and contains fat, enzymes, and minerals.
Flour is essentially a product derived from the endosperm; its thin –walled cells are
packed with starch granules embedded in a protein matrix. [91]
Figure 2-2 Longitudinal section of a wheat kernel showing the different layers; 1. Pericarp, 2. Hypodermis, 3. Tube cells, 4. Seed coat, 5. Nucellar tissue, 6. Aleurone layer, 7. Outer starchy endosperm cells, 8. Inner starchy endosperm cells, 9. Germ, 10. Scutellum, from [91]

23
Table 2-1 Ranges for major components in U.S. wheat [95]
Grain component Range %
Protein (Nx5.7) 7.0-18.0
Mineral matter (ash) 1.5-2.0
Lipids (fat) 1.5-2.0
Starch 60.0-68.0
Cellulose (crude fibre) 2.0-2.5
Moisture 8.0-18.0
2.1.2.1 Starch
Starch is the energy reserve carbohydrate of many plants. [96, 97] Like most foods, wheat
contains starch as a macro-constituent, typically supplying 50-70% of the energy in the
human diet. [98]
Amylose and amylopectin are the two distinct constituents of starch; glucose is the
monomer building block in both of the forms of starch molecules [99, 100] as shown in
Figure 2-3.
O
H
HO
HOH2C
HH
OH
H
OH
HO
H1
23
45
6
Figure 2-3 α-(D) glucose
Amylose is a linear polymer, consisting of α-(1,4)-linked D-glucopyranosyl units, its degree
of polymerisation ranging from 500-6000 glucose units. [101] Figure 2-4 illustrates the
linear structure of amylose.
OH
OH
H
H
OHH
OH
CH2OH
H
OH H
OH
H
OHH
OH
CH2OH
HOH H
H
OHH
OH
CH2OH
H
O O
n Figure 2-4 Amylose structure where n indicates a relatively large number

24
Amylopectin is a branched glucose polymer typically with a molecular weight around 107, it
contains chains of 20-25 glucose units connected via α-(1,4) glucosidic linkage in the
linear regions and interlinked by α-(1,6) glucosidic linkage in the branched regions.[97]
The structure of amylopectin is presented in Figure 2-5.
OH H
H
OHH
OH
CH2OH
H
OH H
H
OHH
OH
CH2OH
HOH H
H
OHH
OH
CH2
H
O O
OH H
H
OHH
OH
CH2OH
H
OO
OO
Figure 2-5 Amylopectin structure showing the α-(1,6) linkage at a branch point in the
polymeric structure
2.1.2.1.1 The ratio of amylose and amylopectin
The end uses of many cereal starches and their gelatinisation, solubility, formation of
resistant starch, gelation characteristics and physicochemical properties are influenced by
the ratio of amylose to amylopectin. [102] In addition, the molecular weight of both
amylose and amylopectin and the molecular fine structure affect the physicochemical
characteristics of starch from a particular source. [103] Different starches contain different
amount of amylose and amylopectin, but generally the typical levels are 25-28% amylose
and 72-75% amylopectin. [101] The waxy varieties of some cereals including rice, maize
and sorghum contain as much as 99% amylopectin. [97]
2.1.2.1.2 Starch gelatinisation
Starch undergoes irreversible changes when heated in the presence of water and the
term gelatinisation is used to refer to these changes. [104] Gelatinisation is initiated with
the swelling of the starch granular followed by an increase in the molecular mobility to an
extent sufficient to disrupt the crystal structure within the starch granule, ultimately
resulting in the formation of amorphous paste or gel upon cooling. [105]

25
2.1.2.1.3 Starch crystal and amorphous structure
The structure of starch molecules within intact granules is described as semicrystalline
and crystallisation occurs in two polymorphic forms, known as the A and B-type
structures. [106]
Wheat starch, like that from most cereal grains contains crystal structure type A which
consists of starch double helices packed into a monoclinic array. [107] The B-type pattern
is believed to involve double helices parallel-packed into hexagonal unit cells, and this is
found in tuber starches. [106] Amylopectin is structurally highly organized, with regions
having a high- frequency of branching alternating with others that are devoid of branches
thereby enabling intervening linear chains to align in parallel arrays of double helices, [96]
as shown in Figure 2-6.
Figure 2-6 Amylopectin structure (a) glucosyl units connected via α-1,4 and α-1,6 glycoside linkages (b) the cluster model of amylopectin structure [96]
2.1.2.1.4 Starch damage
During the milling process whereby wheat is processed into flour, the action of the mill
rollers causes physical damage to a relatively small proportion of the starch granules of
the flour. This is significant in the subsequent utilisation of the flour because when the
crystallites are disrupted, the starch granules can swell in water at room temperature. [93]

26
The milling of hard grained wheat varieties produces a higher level of starch damage than
is found for softer varieties of wheat.
The levels of starch damage in wheat flour can be assessed by two different approaches.
The first is the measurement of the susceptibility of a sample of the flour to amylolysis, the
second is the extractability of starch measured as the amylose content of a cold aqueous
extract of the flour. [108]
2.1.2.2 Protein
Wheat flour protein is unique among the proteins of both cereal grains, as well as other
food ingredients, in its ability to form dough with viscoelastic properties, suitable for
processing of many appealing food products including breads, biscuit and pasta products.
[90]
Gluten is the term used to describe the matrix which forms during dough development and
this largely consists of the wheat seed storage prolamins. The first scientific reports on the
fractionation of wheat protein were provided by Osborne, who carried out experiments by
extracting flour with salt solution. By this approach gluten can be separated from starch.
[109] The prolamin components are the major storage proteins in wheat endosperm. [110]
In addition to the proteins which account for 80-90%, gluten also contains 3.5-6.8% lipids,
0.5-0.9 minerals, and 7.0- 16% carbohydrates. [111]
The wheat prolamins consist of the glutenins which are polymeric and the monomeric
gliadins. [112] The gliadin molecules are soluble in aqueous alcohols while glutenin is not
soluble, because it is a disulfide-stabilised polymer. The reduction of the disulfide bonds in
glutenin molecular allow the separation of high molecular weight glutenin (HMW) and low
molecular weight glutenin (LMW) components. [113] The disulfide cross-links play a highly
significant role in the physico-chemical and functional properties of wheat gluten. [92]
Figure 2-7 demonstrates the role of the disulfide linkage in gluten components. [114]
Figure 2-8 shows the formation of the disulfide bond during dough mixing. [29, 91]

27
Figure 2-7 Schematic depiction of gluten components [114]. Note the clockwise
presentation of the diagram (A) gliadin; (B) HMW glutenin sub unit showing action of β
spirals as molecular spring; (C) HMW glutenin sub unit showing the action of the disulfide
in preventing the extension of β spirals; (D) LMW glutenin sub unit.
The monomeric gliadins are classified into four groups based on the molecular mobility
during gel electrophoresis under conditions of low pH and these are commonly referred to
as α-, β-, γ- and ω- gliadins in order of decreasing mobility. [115] In this context, the
baking potential of wheat flour depends largely on the protein quality and quantity. [116]
Gliadin confers viscous properties on gluten, while glutenin is responsible for the strength
and elasticity of the gluten network. This is necessary for the gas retention capacity of the
dough. [109, 111, 117, 118] The composition of glutenin fractions and the ratio of glutenin
to gliadin are the primary determinants of the viscoelastic properties of wheat gluten and
therefore, also of the bread making quality of a flour. [111, 113, 117]

28
Figure 2-8 The effects of formation of disulfide bonds between glutenin and gliadin during the dough mixing [29]
2.1.2.3 Lipids
Lipids represent a relatively small proportion of wheat flour accounting for approximately
2.5%, with many different components making up this group of relatively hydrophobic
molecules. The non polar lipids (triacylglycerols, diacylglycerols, free fatty acids and sterol
esters) comprise about 1% and the main polar lipids being phospholipids (0.9%) and
galactosyl glycerides (0.6%). [114] During the baking process lipids interact with other
flour components especially proteins and these interactions have a significant influence on
the bread making quality of flour. [119] Polar lipids, the acylglycerols are known to have
an impact on enhancing loaf volume, while phospholipids can only contribute to improved
bread volume in the presence of added shortening. [119, 120]
2.1.2.4 Non-starch polysaccharides
Non-starch polysaccharides are plant polymers which cannot be hydrolysed by
mammalian α-amylases. They typically contain combinations of various hexoses and
pentoses particularly including arabinose, xylose, mannose, glucose and galactose as the
principal constituent sugars. [121] Non-starch polysaccharides in wheat flour are
considered to be minor components accounting, in total for only 2.0-2.5% of flour. [114]
Arabinoxylan (AX) is the principal non-starch polysaccharide in wheat flour and it is known
to have very high water binding capacity. [122, 123] Depending on their water
extractability, non-starch polysaccharides can be divided into water extractable

29
pentosans, (WEP) which generally account for 25% of all pentosan and those that are not
extractable using water (the remaining 75%). [123, 124] Water soluble pentosans, (W-SP)
are believed to have an impact on bread volume, crumb texture and bread staling. [123,
125, 126] Figure 2-9 shows the effect of different AX fractions on bread volume. [101]
Figure 2-9 The effect of different AX fractions on bread volume [101] Note that the abbreviations used here are: 1. WU-AX water unextractable arabinoxylan 2. S-AX soluble arabinoxylan 3. WE-AX water extractable arabinoxylan.
AX-bound ferulic acid is a component of WEP, and it is reported to be involved in the
direct effect of WEP on gluten formation and in the lower extensibility of dough and gluten.
[123, 127] The free radical generating oxidant causes AX to undergo oxidative gelation
through the dimerisation of esterified ferulic acid [114, 126] as shown in Figure 2-10.

30
Figure 2-10 The oxidative cross linking of ferulic acid in pentosan [114]
2.1.2.5 Ash
Generally the overall ash content of wheat grains is in the range of 1.5-2.0%. Ash
components in the wheat kernel are distributed unevenly; the bran contains 6% while in
the level in the endosperm is much lower, typically 0.4%. [128] These ash contents can
vary depending on grain hardness, environmental conditions and the variety of the wheat.
[129] The presence of elevated levels of ash in wheat flour indicates contamination of the
flour with bran particles, which have detrimental effect on the baking potential of a
flour.[93]
2.2 Baking ingredients
Bread is considered to be a very important staple food in western countries. [130]
Depending on the type of the bread, the process used, flour type and end product
specification, different additives and ingredients can be incorporated into the bread
formula, in order to enhance the eating quality and appeal of the product or to improve the
keeping quality of bread. [130, 131] The chemical composition of the flour and the quality
and the quantity of ingredients used are of great importance for the characteristics of the
baked bread. [132] There are three main stages in bread-baking processes and these are
dough mixing, fermentation and baking. [133]
2.2.1 Yeast
Saccharomyces cerevisiae or bakers yeast is widely used in the production of different
types of bread as well as other food products. The main function of incorporating yeast

31
into a bread formula is to generate gas during the fermentation process as a part of the
metabolic activity of yeast. [95] For this, yeast utilizes sugars which may be either added
directly to the dough formula or be produced by the action of amylases during
fermentation, to produce ethanol and carbon dioxide according to the equation below. [93,
95]
C6H12O6 → 2 C2H5OH + 2 CO2
The types of yeast used in bread making can be classified into two classes based on their
stability and the way they are processed. These are the fresh forms of yeast, which can
be compressed, crumbled or cream types, and the second class are the dry forms and
these may be instant or active dry yeast. [95, 134]
The selective permeability property of the yeast cell wall plays an important role in
regulating the transportation of the required nutrients from the dough medium into the cell
and these include sugars, amino acids, as well as other nutrients. Additionally, the cell
wall contributes through the release of the metabolic by-products including carbon dioxide
and alcohol from the cell into the dough medium. [135] The different parts of the yeast cell
are illustrated in Figure 2-11.
Figure 2-11 The yeast cell. [135]

32
2.2.2 Salt
In addition to its contribution to the taste of bread, salt serves so many other functions in
the bread making process. It tightens the gluten network structure resulting in stronger
dough and this is then better able to retain the gas produced by the yeast. Also its
strength effect on the dough could be due to the inhibitory action on proteases.[54] Some
salts favour the hydrolytic action of amylases on starch, thereby contributing to the
maintenance of a continuous supply of simple sugars in the form of maltose for yeast
growth. [136] Salt probably also regulates yeast activity during the fermentation by
competing with yeast for water, resulting in moderate expansion of the dough without
rupturing the gluten network. [54, 136]
2.2.3 Shortening
The term shortening is usually used in the baking industry to describe fats, oils, their
derivatives as well as blends of these [136, 137] The functional significance of native
wheat flour lipids and of added lipids as shortening during bread making has been
comprehensively investigated. [138] They are used in the baking process to enhance
bread volume and crumb softness, as illustrated in Figure 2-12. [136, 137] Shortening
lubricates the gluten strands, preventing these from sticking to each other and by doing so
the gluten strands are shortened. [57]
Figure 2-12 Effect of different levels of fat incorporation on bread volume [135]

33
2.2.4 Bread improver
The term improver is widely used in the baking industry, and it refers to a group of
ingredients that in some way contribute by enhancing the baking performance, sensory
attributes and storage stability of bread. [139] Bread improvers include enzymes,
emulsifiers, oxidizing agents, reducing agents, nutrients for yeast growth as well as other
ingredients. However, a minimally processed high quality food with few or no additives is
the preference of most modern consumers. [139, 140]
2.2.4.1 Enzymes
Enzymes are proteins possessing a powerful catalytic activity. They are synthesized by
biological cells to catalyse chemical reactions related to the metabolic requirements of the
cell and the organism. [141] Their properties are important to food chemists since they are
available in increasing number both for use as specific tools and reagents in food analysis
[142] and also for incorporation into food formulations and use in industrial food
processing. [143-147]
2.2.4.1.1 Enzyme specificity
One of the significant attributes of enzymes is that most are highly specific for a particular
reaction. Most enzymes specifically bind to only one or a very limited number of the
substrates during activated so that, among the several thermodynamically permissible
reactions, only one can specifically occurs. [143] The catalytic activity of an individual
enzyme is due to its particular protein structure. A specific chemical reaction is catalysed
at an area representing a relatively small portion of the surface of an enzyme and this is
called the active site. There is chemical and physical interaction occurring at this site to
catalyse a particular chemical reaction that certain enzyme. [141, 145, 148, 149]
2.2.4.1.2 Nomenclature of enzymes
The nomenclature committee of the International Union of Biochemistry and Molecular
Biology (IUBMB) has developed a system in which all enzymes are classified into six
major groups, based on the nature of the chemical reaction catalysed. [141, 143, 145,
149]
1. Oxidoreductases
1.1 Acting on =CH-OH group of substrates
1.1.1Requires NAD+ or NADP+ as hydrogen acceptor
34
1.1.1.1 Specific substrate is ethyl alcohol
2. Transferases
2.1 Transfer of methyl groups
2.2 Transfer of glycosyl groups
3. Hydrolases
4. Lyases (cleave C-C, C-O, C-N, and other groups by elimination, leaving double
bonds, or conversely adding groups to double bonds).
5. Isomerases (involved in the catalysis of isomerisation reactions within one
molecule).
6. Ligases (involved in the biosynthesis of a compound with the simultaneous
hydrolysis of the pyrophosphate bond in ATP or a similar triphosphate. [141, 143,
145-148]
2.2.4.1.3 Enzymes in baking
Enzymes have a very central role in the baking industry, with many composite bread
improver formulations containing a number of ingredients which are sources of enzymes.
Among the enzymes used most widely in the baking process are amylases, proteases,
lipoxygenase and hemicellulases [140, 144] as shown in Table 2-2.
2.2.4.1.4 Amylases
Amylases are routinely incorporated into the formulations of breads of many styles
including both loaf products as well as many of the flat breads popular in the Middle East.
Their functionality depends primarily on their specificity as shown in Figure 2-13, as well
as the degradation products and their thermostability. [101] α-Amylases are categorised
as endoglucanases on the basis that they hydrolyse internal α-1,4 or α-1,6 linkages by
random attack. On the other hand, β-amylases and glucoamylases are exoglucanases
because they act by attacking only those linkages occurring at the end of a chain of
monosaccharide units, specifically from the non reducing end. [144, 150, 151]
The functions of α-amylases include their action as anti firming agents because it is has
been shown that some bacterial α-amylases decrease the rate of bread firming. [152] Also
it has been reported that barley malt α-amylase increases the rate of bread firming while
fungal α-amylase decreases the initial firmness of bread. [153] Different mechanisms for
the role of different α-amylases as antifirming agents were proposed; these reflect either

35
the effect of released dextrins or the modified residual starch, impacting the rheological
properties of the dough and subsequently starch retrogradation. [144, 154]
Table 2-2 The main enzymes used in cereal grain processing, their reactions, and their substrates [144]
Class of enzyme Substrate(s) Reaction catalysed
Amylolytic enzymes Starch Hydrolysis
α-Amylase EC 3.2.1.1 Amylose and amylopectin α(1→4) D-glucosidic linkage endo mode of action
β-Amylase EC 3.2.1.2 Amylase and amylopectin α(1→4) D-glucosidic linkage exo mode of action
Glucoamylase EC 3.2.1.3 Amylase and amylopectin α(1→4) and α(1→6) D-glucosidic linkage
Pullulanase EC 3.2.1.41 Amylopectin α(1→6) D-glucosidic linkage
Cellulases & hemicellulases Cellulose, β-glucan & pentosans
Hydrolysis
Cellulase EC 3.2.1.4 Cellulose & β-glucan β(1→4) glucosidic linkage
Laminarinase EC 3.2.1.6 β-glucan β (1→4) and β (1→3) D-glucosidic linkage
Lichenase EC 3.2.1.73 β-glucan β(1→4) D-glucosidic linkage
Endo 1,4- β-D-Xylanase EC 3.2.1.8
Arabinoxylan β(1→4) D-Xylosidic linkage
Ferulic acid esterase EC 3.1.1.1
Arabinoxylan containing ferulic acid groups
Ester bonds to liberate ferulic acid
Proteases Protein Hydrolysis of peptide bonds
Lipases and esterases Lipids and phospholipids Hydrolysis of ester bonds
Lipase EC 3.1.1.3 Triacylglycerol Liberation of free fatty acids
Lysophospholipase EC 3.1.1.5
lysophospholipids Liberation of carboxylic acids
6-phytase EC 3.1.3.26 3-phytase EC 3.1.3.8
Phytate Liberation of phosphate group
Oxidases Various substrates Oxidoreduction with oxygen as electron acceptor
Lipoxygenase EC 1.13.11.12
Poly unsaturated fatty acids Oxidation of fatty acids
Glucose oxidase EC 1.1.3.4 Glucose Oxidation of glucose to produce hydrogen peroxide

36
Figure 2-13 The action of different types of amylolytic enzymes on amylopectin polymer [31]
2.2.4.1.5 Proteases
Wheat proteases belong to the papain type of enzymes which are activated in the
presence of compounds that reduce the disulfide bonds. While native proteases have little
effect on bread quality, gluten degrading proteolytic enzymes have been found to have a
drastic effect on bread quality. [140]

37
2.2.4.1.6 Hemicellulases
Hemicelluloses are widely distributed heteropolysaccharides, and there is a diverse group
of enzymes that are involved in their degradation. One example is the xylanases and
these are increasingly used in the baking industry to enhance dough quality and facilitate
the increase in dough volume required to achieve the optimal bread volume. [155] It has
also been reported that, on the other hand, the group of enzymes active on the pentosans
and known as the pentosanases, have an anti-staling effect on baked products. [140]
2.2.4.2 Emulsifiers
Emulsifiers are a group of compounds belonging to the surface- active agents or
surfactants class of molecules. They are fatty substances possessing both lipophilic and
hydrophilic properties. [137] This involves the unique property of being able to suspend
two substances that normally do not dissolve in each other, and in food systems this
typically includes water and an oil. [136] Depending on their function in the baking
process, emulsifiers can be further classified: crumb softeners including α-
monoacylglycerols with a level of addition of approximately 0.5%, and the dough
strengtheners particularly diacetyl tartaric acid esters of monodiglycerides (DATEM),
Calcium stearoyl-2-actylate (CSL), and sodium stearoyl-2-lactylate (SSL). The last of
these serves both functions in bread making. [93, 136, 137] In addition, the swelling of
wheat starch granules during gelatinisation has been reported to be delayed in the
presence of certain emulsifiers. [156, 157] The mechanism by which emulsifiers retard
staling is based on their formation of a complex with amylose. Due to their differing
abilities to form complexes with amylose, their contribution to retardation of staling also
varies. [158]
The incorporation of emulsifiers into bread formulations can be used as a means to
reduce the caloric value of bread by replacing some of the harder shortening materials
with lower calorie emulsifiers. [159]

38
3 3 Literature review: II. Fourier transform infra-red analysis
3.1 FT-IR of protein secondary structure
3.1.1 FT-IR and protein analysis
FT-IR is one of the earliest experimental methods applied to the evaluation of the
secondary structure of polypeptides and proteins. [160-162] Typically FT-IR spectroscopy
involves varying the wavelength and monitoring the extent to which the IR radiation is
absorbed by a sample. [163] Attenuated Total Reflectance (ATR) FT-IR is a type of
internal reflection spectroscopy in which the sample is placed in contact with an internal
reflection element (IRE) of high refractive index. Infrared radiation is focussed onto the
edge of the IRE, reflected through the IRE, and then directed to a suitable detector.[164,
165] One of the advantages of using ATR/FT-IR in protein structural analysis is that the
analysis can be performed on samples having a variety of forms. These may be solids,
including powders, [166-168] or may also involve the use of KBr discs, as well as aqueous
solutions, [160, 169, 170] organic solvents [171] and phospholipid membranes. [172, 173]
The different analytical techniques are illustrated in Figure 3-1 and Figure 3-2.

39
Figure 3-1 The ATR accessory used for aqueous solutions
Figure 3-2 The accessory arrangement used for presentation of dry samples in the form of a KBr disc
One of the challenges encountered in using ATR/FT-IR for the structural analysis of
proteins is that one of the absorption bands of water molecules is in the specific region of
interest, which is referred to as the amide I region. Two techniques have been applied to
solve this problem: the first is based on the use of deuterium water as solvent rather than
water. [174] The second option is to use short path lengths and digital subtraction

40
routines. A further potential problem of ATR/FT-IR is that each particular protein is
composed of a specific combination or proportion of the commonly occurring secondary
structures. [175]
In recent years many factors have contributed to the revitalisation of ATR/FT-IR in protein
analysis. In particular, the availability of fast computers has led to FT- processors able to
rapidly compute Fourier- transforms, and further having the capability to carry out detailed
normal mode analysis treatments on model biopolymers.[176] The use of stable and
powerful lasers has led to the development of the Fourier transform (FT) method for IR
data acquisition and reliable digital subtraction. [163] The development of methods for
processing the recorded spectrum to resolve overlapping bands has also contributed to
the renewed interest in the application of ATR/FT-IR in protein analysis. Examples of
these methods are Fourier deconvolution, the use of second derivatives as well as band
fitting algorithms. [177]
Common features of the IR spectra of proteins are the so-called amide bands, which arise
from delocalised vibrations of the peptide linkage. [178] Elliot and Ambrose [161] were the
first to demonstrate the existence of empirical correlations between the amide I and amide
II bands of polypeptides and their conformation. [179]
Very little of the work in this field has specifically been done on wheat flour doughs for the
quantification or examination of the protein secondary structure. Accordingly there is
relatively little literature available. The importance of the current study has been to explore
changes in protein secondary structure brought about by the addition of baking
ingredients, to establish methods for quantifying protein secondary structure, and also to
investigate the relationship between the dough strength and a specific type or component
of protein secondary structure. The current lack of published work related to each of these
important scientific problems have formed the basis for the research reported in this
thesis.
3.1.2 ATR/FT-IR of proteins
A considerable amount of experimental and theoretical research has been done on the IR
spectra of proteins and polypeptides [179-186] and this will be reviewed briefly here.
3.1.2.1 ATR/FT- IR of protein secondary structure in different environments
Byler and Susi [160] obtained the spectra of 21 globular proteins in deuterium oxide
solution. They reported that after applying Fourier self-deconvolution the amide I band of

41
each protein consists of six to nine components which are helical segments, extended β-
segments, unordered segments and turns. Protein secondary structure in aqueous
solutions was studied by Dousseau and Pezolet [179] They reported the spectra of 13
proteins of known crystal structure and a comparison of the classical and partial least-
squares methods was included.
Protein secondary structures in water were studied by Dong and co-workers. [184] Twelve
globular proteins from a variety of sources were selected as having different combinations
of protein secondary structure. The spectra were recorded for these proteins in aqueous
solution at 20 ºC and it was reported that band frequency assignments for α-helix, β-
sheet, unordered, and turn structures were highly consistent among all of the proteins
studied.
3.1.2.2 Secondary structure of proteins with parallel β-chains
The secondary structure of proteins having parallel β-chains were reported by Susi and
Byler. [180] The characteristic absorption bands for the parallel β-segments are observed
at 1626-1639 cm-1 (strong) and around 1675 cm-1 (weak).
3.1.2.3 Secondary structure of denatured protein
Purcell and Susi [183] investigated the conformational changes induced by denaturation
and reported that in the denatured form there is structure similar but not identical to, the β-
structure of native proteins. This structure is characterised by absorption bands around
1615-1618 cm-1 and 1684-1688 cm-1. Protein secondary structure changes by low-energy
ion irradiation are reported by Cui and co-workers. [186] They found that irradiation
decreased the proportion of α-helix and β-turn and increased random coil and β-sheet
structures.
3.1.3 ATR/FT-IR of wheat flour dough systems
Changes in secondary protein structure during mixing and development of high absorption
(90%) flour and water mixtures have also been examined. [187] The wheat flour dough
was evaluated at various mixing times. When amide I band was deconvoluted, peaks
representing those for known secondary structural features of proteins were revealed. The
peak assignments included α-helix, β-turn, β-strand and β-sheet.
3.1.3.1 ATR/FT-IR of wheat flour dough
Popineau et al. [188] studied the conformations of gluten proteins selected as having
differing gliadin and glutenin compositions. They studied both the conformation of whole

42
gluten and the subsequent fractionated preparations; in addition two different
environments were used with one in solution the second was the dough mass. The results
demonstrated that in the hydrated viscoelastic state, the β-sheet content, especially that of
intermolecular β-sheet conformation, of gluten proteins was higher than that observed in
solution. They also found that in viscoelastic gluten fractions, the proportion of
intermolecular β-sheet increased as the glutenin content increased. Their band
assignment was slightly different than that used by some other workers [187] in that their
assignment included only intermolecular β-sheet, intramolecular β-sheet, α-helix, β-turn.
The effect of some additives on wheat gluten solubility was investigated by Mathlouthi
[189] using a structural approach. The additives they used were potassium chloride,
sodium chloride and cysteine in combination with partially hydrolysed gluten. The addition
of potassium chloride and cysteine increased the band associated with the OH stretching
mode of water at around 2800-3800 cm-1 and the intensity of this band was correlated with
the amount of water absorbed by the protein polymer. [190] The area of the OH stretching
band was shown to be proportional to the sample water content [166, 177, 190, 191]
confirming the correlation previously observed by Rueegg. [192] The band assignments
for amide I were intermolecular β-sheet, intramolecular β-sheet, α-helix, β-turn, and
antiparallel β-sheet. These assignments are in broad agreement with most of the research
reported in this field. [193]
Dough optimum mixing time was studied by Seabourn and others [194] who plotted the
mixing time against the second derivative band area ratio of the peak 1336 cm-1 / 1242
cm-1. The peaks are amide 111 peaks and the peak assignments were: 1336 cm-1 for α-
helix and 1242 cm-1 for β-sheet. Samples with short mixing times tended to develop β-
sheet faster than those with long mixing time. This indicates that the protein network in a
dough system is dependent on the formation of specific secondary structures including the
β-sheet structure.
3.1.4 ATR/FT-IR of purified wheat flour gluten
The effects of temperature and water content on the secondary structure of wheat gluten
were investigated by Georget and co-workers. [195] For the study, gluten samples were
conditioned at water content levels of 0%, 13 %, 47%. Over a temperature range of 25-85
ºC it was found that in the 0% hydrated sample heating the material did not affect the
conformation of the protein secondary structure. On the other hand, at 13% hydration the
band assigned to intra-molecular β-sheet at around 1630 cm-1 was shifted to a lower

43
frequency and became deeper compared to the band at 1613 cm-1 which is due to inter-
molecular β-sheet. At 47% hydration both peaks were replaced by one broad peak
centred at 1620 cm-1.
3.1.5 Protein secondary structure of glutenin
The hydration of the glutenin fraction having high molecular subunits was studied by
Belton. [196] It was reported that increasing hydration affects the conformation of the
protein secondary structure in favour of a more extended structure of the β-sheet-type.
The presence of the disulfide bonds was found to enhance the formation of β-sheet. In
addition, the elasticity of high molecular subunits was influenced by the balance between
the interactions involving protein-protein and protein-water hydrogen bonding.
3.1.6 Protein secondary structure of gliadins
The interactions between gliadins and dextrins and their effect on protein secondary
structure were investigated by Secundo and Guerrieri. [197] It was reported that gliadin
secondary structure changes upon heat treatment both in the presence and absence of
dextrin. The changes are reflected as a decrease of the band at 1651 cm-1 and
corresponding increases of the bands at 1628 cm-1 and 1690 cm-1. The results also
indicated the formation of hydrogen bonds between gliadin and dextrin molecules.
3.2 ATR/FT-IR studies of the enzymatic degradation of starch
3.2.1 Hydrolysis of starch by amylases
Starch is a major storage product of many economically important crops including wheat,
rice, maize, tapioca, and potato.[198] The main two constituents of starch are amylose
and amylopectin, with amylose having a linear structure while amylopectin is branched.
Both amylose and amylopectin consist of α(1-4) linked glucose units in the linear regions,
amylopectin also containing α-1-6 links at the branch points. [199] Carbohydrates owe
some of their functionality to such structural features as glycosidic bonds and hydrogen
bonding.[200] α-Amylase (α-1,4-glucan 4-glucanohydrolase, E.C.3.2.1.1) cleaves α-1,4-
glycosidic links at random in an endo mode yielding shorter fragments. [201]

44
On a global basis, the starch industry uses about 30% of the enzymes produced on a
commercial scale. The application of these amylases include the conversion of starch to
glucose syrups and in the liquefaction process to produce dextrins. [202]
3.2.2 ATR/FT-IR of carbohydrates
The region of 1300-900 cm-1, (C-C and C-O) in the IR spectrum is sensitive to the
conformation of carbohydrates. [199] In addition, the region referred to as the anomeric
region at 950-750 cm-1 is frequently used in carbohydrates analysis. This is applied in
order to distinguish bands characteristic for α and β conformers corresponding to the
vibrations for both monosaccharides and carbohydrates having higher degrees of
polymerisation. [203]
3.2.3 ATR/FT-IR of oligosaccharides and polysaccharides
The effect of mass concentration on the structure of oligosaccharides and their constituent
monosaccharides has been studied by Mathlouthi.and co-workers. [200] A series of
oligosaccharides were employed in which the position of the glycosidic bond differed. In
order to distinguish between the oligosaccharides and their monomers time dependent
spectral measurements were undertaken during acid hydrolysis of some of the
oligosaccharides. It was concluded that the bands most affected are those situated in the
region 993-966 cm-1 which is due to the stretching of the C-O linkages within the C-O-C
structure which is the glycosidic linkage. These researchers achieved the tentative
assignment of a very large number of the observed IR bands.
The glycosidic linkage in oligosaccharides has also been investigated by Sekkal et al.
[204] who studied eight oligosaccharides, the results of this study provided confirmation of
the assignments of Mathlouthi. [200] In a further study in this field, the influence of
hydration of food additive polysaccharides has been reported [205] indicating that it is
possible to distinguish sugars and polysaccharides by ATR/FT-IR with no apparent loss of
information in hydrated samples.
3.2.4 The use of ATR/FT-IR in the study of starch structure
Starch granules exhibit a crystalline-amorphous structure to varying extents. [206] In the
native form of starch, amylose and amylopectin molecules are organised in granules as
alternating semi-crystalline and amorphous layers that form growth rings. [207]

45
Several researchers have used ATR/FT-IR in structural analysis of starch. [206, 208-215]
In a study of the short range structure by van Soest [215] the IR spectrum in the 1300-800
cm-1 region was utilised corresponding with C-C and C-O stretching modes of vibration. It
was reported that the peak at 1047 cm-1 is characteristic of crystalline starch and the peak
at 1022 cm-1 is characteristic of amorphous material. Additionally, the peak at 994 cm-1,
which is related to intramolecular hydrogen bonding of the hydroxyl group at C-6 was
reported to be sensitive to the level of water present.
ATR/FT-IR was also used to study the organisation of the external region of the starch
granule by Sevenou. [206] For this study, different types of native starches were used and
compared to acid hydrolysed and gelatinsed starch, however, ATR/FT-IR was not able to
differentiate between A-and B-type crystallinity. The results showed that starches from
potato and amylomaize were more ordered on their outer regions, which explains their
greater resistance to enzymatic hydrolysis.
FT-IR has also been used to study the granular structure of resistant starches having the
type 4 characteristics. [213].For this, starches including normal, high amylose as well as
waxy corn starch citrate were investigated. The intensity ratio of 1016 cm-1 /1045 cm-1 was
used to estimate the ratio of amorphous to crystalline phase in the starch citrate. These
are the same two peaks used by van Soest to characterise the amorphous and crystal
structure with a shift in the band position.
3.2.5 ATR/FT-IR of starch gels
Gelation of starch starts with the penetration of water into the amorphous part of starch
causing the granule to swell. [207, 216]The endothermic water uptake changes the crystal
structure to that of a gel with the temperature depending upon the type of starch and its
source. [201] This is illustrated in Figure 3-3.

46
Figure 3-3 Starch gelatinisation process [207]
From the results of a study on the pressure- induced gelation of selected starches,
Rubens and co-workers [216] proposed a two step mechanism. First the hydration of the
amorphous regions leads to the swelling of the granule and distortion of the crystalline
regions which leads to the destruction of the granular structure. In the second step the
crystalline regions become more accessible for water. They reported that, during gelation,
increasing the pressure results in an increase in the relative proportion of the amorphous
compared to the crystalline structure.
Wheat starch gels were investigated by Wilson and Belton. [217] They monitored the
behaviour of starch gels over a period of 21 days following gelatinisation. During the
storage of a wheat starch gel in a sealed cell, no changes were observed, but when the
samples were exposed to an environment of gradual drying, the peak representing the
starch having crystalline structure increased until it returned to its original intensity. It has
also been shown that the kinetics of starch retrogradation can be monitored by following
the changes of the peak at 1046 cm-1. [217]

47
Goodfellow [199] investigated the gelation and retrogradation in amylose and amylopectin
and found that they show a fast initial change, amylopectin also showed a second slower
change over a time scale of approximately 400 hours. The fast changes in amylose can
be summarised into the increase in intensity of the band at 1053 cm-1, while in
amylopectin the increase in the intensity of the band at 1053 cm-1 is much greater. The
band at 1053 cm-1 is correlated with starch recrystallisation and retogradation.
In a study of the retrogradation and physical ageing of model starch systems Smits and co-
workers [218] distinguished between the physical aging which takes place below the glass
transition of starch and retrogradation which takes place above the glass transition of
starch. The changes reflected changes in the ratios of the peak intensities at 1047 cm-1
(crystal) and 1022 cm-1 (amorphous) during storage, as described in Figure 3-4.
Figure 3-4 The stages in the process of starch retrogradation [219]

48
Summary of significance of project and statement of aims
This investigation has been developed on the basis of the following:
• Wheat is a major crop and food source internationally;
• In the processing of wheat, milling is generally involved and the resultant meal
(flour) is mixed with water to form a dough;
• In the commercial utilisation of wheat quality control is required in order to ensure
that the flour being produced is suited to the processing parameters selected or
available so that the quality of the resultant foods meets the expectation of
consumers;
• Among the specific measurements required so that quality can be readily measured
and thereby controlled, the incorporation of enzymes and the use of food additive
ingredients are ways in which processing can be manipulated for enhancement of
quality;
• The use of flour also relies upon the extent to which starch is mechanically damaged
and the susceptibility to enzymatic hydrolysis as well as retrogradation;
• One of the current constraints is the availability of rapid, reliable analytical
procedures that allow for the rapid analysis of relevant parameters during milling
and flour processing, in particular the lack of non-destructive techniques is a
limitation upon the implementation of reliable quality control approaches at a
commercial level;
• At a research level there remains a need to access techniques which facilitate the
evaluation of protein structure during dough development;
• Whilst infra-red reflectance and transmittance technology has been adopted at a
variety of points within research and industrial situations for grain processing and
utilisation, much remains to be elucidated in these areas; and
• One recent technological development involves the use of new generations of infra-
red instrumentation. In conjunction with deconvolution software there is considerable
scope for rapid developments in these areas with strong implications for our
understanding of grain processing as well as potential for practical application.
It is within this context that the following aims have been developed for this investigation.

49
Statement of hypothesis and aims
The hypothesis of this project has been that the use of deconvolution software and infra-
red spectroscopy will allow the monitoring of a range of processing and chemical changes
in wheat flour doughs.
The primary aim of the project has been to evaluate this hypothesis and the specifc
objectives included:
1. To study the use of the current generation of instrumentation and software as a tool
for monitoring changes during the stages of bread making;
2. To apply the techniques to a study of the influence of enzymes, oxidants and
reductants during dough development and breadmaking;
3. To evaluate the changes occurring in the secondary a structure of the protein
components of dough; and
4. To assess the influences of the enzyme α- amylase on starch properties and staling
of the resultant baked products from bread making.

50
4 4 Material and Methods
4.1 Materials
4.1.1 Wheat flour
Wheat flour was obtained from Manildra Group Australia, from milling of Australian hard
wheat varieties, suitable for bread making. The flour properties were: Protein 11.8 %,
Moisture 13.3%, Water Absorption 66.0 %, Extensograph Height 45 Minutes (min) = 400
Brabender units (BU), Extensograph Length 45min= 20.5 centimetres (cm), Falling
Number =500 Seconds (s) and Dough Development Time= 5 min.
4.1.2 Baking ingredients
The materials and suppliers are show in Table 4-1
Table 4-1 Materials and suppliers of bakery ingredients
Supplier Material
CSR, Australia White sugar
Saxa, Australia Table salt
Crisco Australia Blended vegetable oil
BDH Laboratory Supplies, England L-ascorbic acid
Lowan instant dry yeast, Australia High activity, instant dried yeast
Aldrich Chemical Company Fumaric acid
BDH Laboratory Supplies, England L-cysteine
Sigma α-Amylase (from Bacillus sp, product code A4551 )
Merck L-cystine, L-Cysteine HCl
Sigma Dextrin type 1, dextrin type 11, and D-glucose

51
4.2 Instruments
4.2.1 ATR/FT-IR and KBr disc
FT-IR spectra on the dough were recorded using a Perkin-Elmer 2000 ATR/FT-IR
spectrometer equipped with ATR accessory 45° angles ZnSe crystal. For all analyses,
except for L-cysteine and L-cystine, the KBr Disc accessory was used. For this, the dry
samples were mixed with potassium bromide in a ratio of 1: 100, ground to a very fine
powder and pressed to make a disc.
For all spectra using ATR and the KBr disc accessories, 100 scans were taken at an
interval of 1 cm-1 and recorded at a 4 cm-1 resolution to give an optimal signal to noise
ratio, generally in the wave number range of 700 cm-1 -4000 cm-1. In the case of the dough
and for the KBr disc the range was from 400 cm-1 -4000 cm-1. The background spectrum
was obtained using the empty crystal, and before each measurement the crystal was
washed with water, acetone and dried with nitrogen.
4.2.2 Dough mixing, bread making and assessment instruments
For bread texture measurement the Texture analyser from Stable Micro Systems, England
model TA-XT2 was used. Dough mixing for spectroscopy experiments was carried out in a
small Kenwood kitchen mixer. The balance used was Mettler Toledo PB303DR and for pH
measurements, a Hanna Instruments, Italy model pH211 pH meter was used. For bread
making, a Panasonic bread maker from Panasonic Australia Pty. Ltd. Australia SD-253
was used. For colour measurement Minolta chromameter CR-200 was used.
4.3 Methods
4.3.1 Bread making
In the preparation of bread loaves for the investigation of the impact of different additives,
the basic baking ingredients used were wheat flour, sugar, salt, water, yeast and
shortening. L- ascorbic acid, L-cysteine, fumaric acid, α-amylase as well as sodium
chloride were added in varying amounts in individual experiments to study the effect of
addition of each ingredient. Loaves were prepared following a method based upon that
described by the Bread Research Institute of Australia (BRIA) (1989). The ingredient
formulation used is shown in Table 4-2
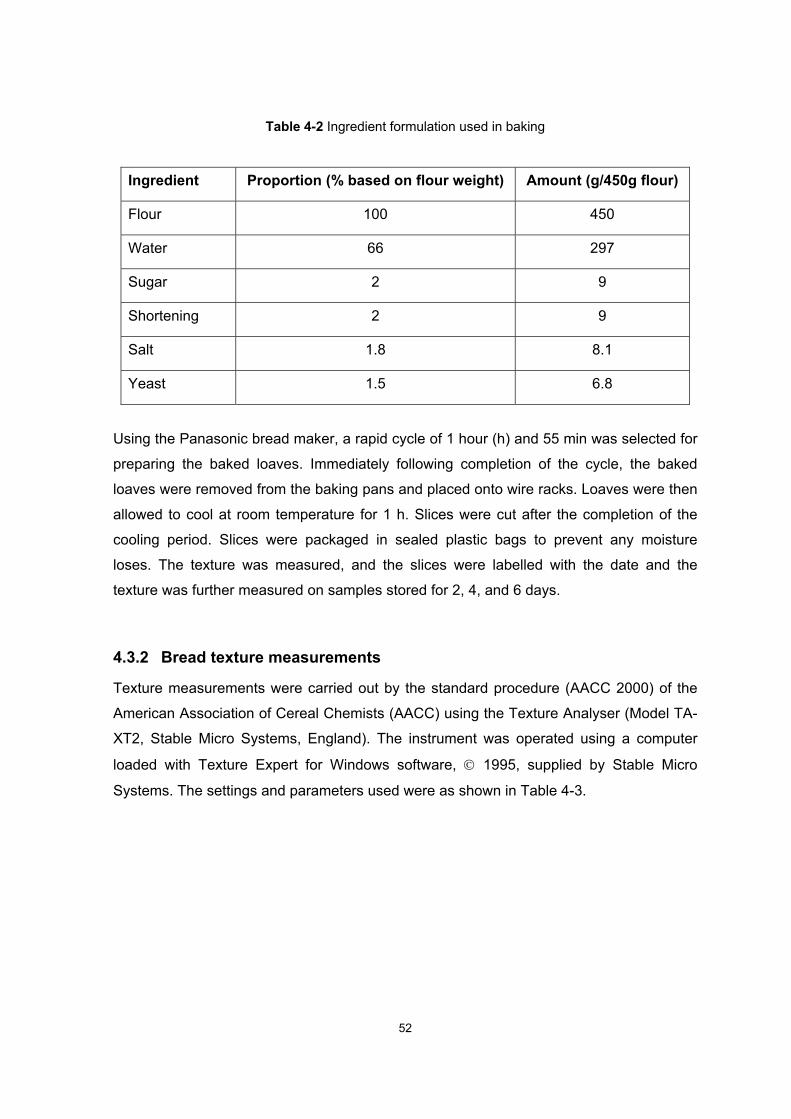
52
Table 4-2 Ingredient formulation used in baking
Ingredient Proportion (% based on flour weight) Amount (g/450g flour)
Flour 100 450
Water 66 297
Sugar 2 9
Shortening 2 9
Salt 1.8 8.1
Yeast 1.5 6.8
Using the Panasonic bread maker, a rapid cycle of 1 hour (h) and 55 min was selected for
preparing the baked loaves. Immediately following completion of the cycle, the baked
loaves were removed from the baking pans and placed onto wire racks. Loaves were then
allowed to cool at room temperature for 1 h. Slices were cut after the completion of the
cooling period. Slices were packaged in sealed plastic bags to prevent any moisture
loses. The texture was measured, and the slices were labelled with the date and the
texture was further measured on samples stored for 2, 4, and 6 days.
4.3.2 Bread texture measurements
Texture measurements were carried out by the standard procedure (AACC 2000) of the
American Association of Cereal Chemists (AACC) using the Texture Analyser (Model TA-
XT2, Stable Micro Systems, England). The instrument was operated using a computer
loaded with Texture Expert for Windows software, © 1995, supplied by Stable Micro
Systems. The settings and parameters used were as shown in Table 4-3.

53
Table 4-3 Settings employed with the texture analyser
Parameter Setting used
Mode Measure Force in Compression
Option Return to Start
Pre-Test Speed: 1.0 mm/s
Test Speed: 1.7 mm/s (i.e. 100mm/min)
Post-Test Speed 10.0 mm/s
Strain 40%
Trigger Type Auto – 5g
Data Acquisition Rate 250pps
Accessory AACC 36mm cylinder probe
Radius (P/36R)
Load cell 5kg
All samples were packaged in sealed plastic bags until the day of the compression test, to
minimise any sample drying or moisture losses. When slicing the bread care was taken to
achieve the same thickness for all slices to minimise the measurement error. All samples
were sliced mechanically to a slice thickness of 25mm. The probe compresses the sample
slice until it has compressed 40% of the product height. It then withdraws from the sample
and returns to its starting position. A graphical plot is generated illustrating the variation of
force as a function of time (equivalent to the distance travelled by the probe). The samples
were compressed in five different points (one in the centre and four near the corners), and
average force was calculated. The software analyses the curve and tabulates specified
measurements showing the characteristics of crumb firmness.
Firmness is defined in this method as the force required compressing the product by a
preset distance (i.e. force taken at 25% compression of 25mm) (AACC, 2000) A 25%
compression of 25mm thick sample = 6.25mm compression distance at which point the
compression force value (CFV) was taken. Whilst force can be expressed in units of
grams, kilograms or Newtons (AACC, 2000), in the current study the unit used was the
Newton (abbreviated N).
4.3.3 Measurement of loaf volume
Bread volume was measured by using the Royal Australia Chemical Institute (RACI)
standard procedure (RACI 1995). This method measures bread loaf volume as estimation

54
from the sum of the two circumference values of the loaf. The second measurement was
taken perpendicular to the first. The measurements were taken after one hour of cooling
at room temperature and the final value used is the sum expressed in centimetres.
4.3.4 Dough preparation for spectroscopy experiments
4.3.4.1 Dough for protein secondary structure studies
Distilled water (66 ml) was added to 100 g of flour in the Kenwood mixer then the
appropriate volume of ascorbic acid or L- cysteine solution was added to the flour and
adjusted to give final water addition of 66 ml. The dough was mixed for 8 min.
A small piece of the dough was cut using scissors and loaded onto the ATR accessory
immediately. The remainder of the dough was covered with plastic and rested for 20 min
in the mixing bowl and loaded onto the ATR accessory as soon as 20 min had elapsed.
4.3.4.2 Dough preparation for the enzymatic degradation of starch
Flour (100 g) was added to 66 ml of water and mixed in a beaker using a spatula, α-
amylase was added and the dough re-mixed before loading on to the ATR crystal. There
was a delay of two minutes from the time of addition of the enzyme until the loading of the
dough onto the crystal the latter is considered as zero minutes. The remainder of the
dough was incubated at 35 ºC and every 5 minutes a spectrum was collected.
4.3.5 Water subtraction methods
4.3.5.1 Water subtraction for protein secondary structure studies
The band which interferes with Amide I absorption band is that occurring at around 1640
cm-1 and this arises from the water bending vibration mode. In order to elucidate any
information from the amide I band, the contribution of absorption of this band has to be
removed from the dough spectra or using deuterium oxide solution as solvent, instead of
water, to shift the absorption band due to water bending to a region out of the amide I
region. Deuterium oxide is usually employed instead of water because of its greater
transparency in the region of interest. [220]
In this study the band occurring due to the combination of bending and libration mode of
vibration of water molecular appear at around 2125 cm-1 was used to subtract the water
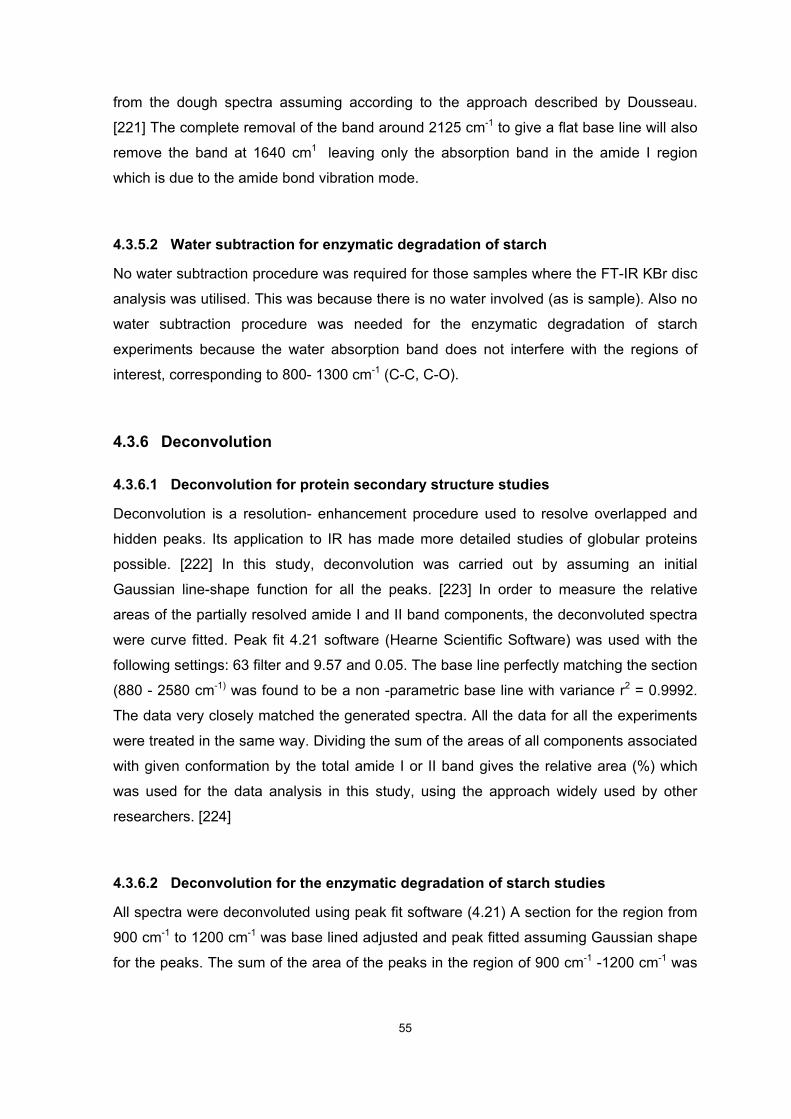
55
from the dough spectra assuming according to the approach described by Dousseau.
[221] The complete removal of the band around 2125 cm-1 to give a flat base line will also
remove the band at 1640 cm1 leaving only the absorption band in the amide I region
which is due to the amide bond vibration mode.
4.3.5.2 Water subtraction for enzymatic degradation of starch
No water subtraction procedure was required for those samples where the FT-IR KBr disc
analysis was utilised. This was because there is no water involved (as is sample). Also no
water subtraction procedure was needed for the enzymatic degradation of starch
experiments because the water absorption band does not interfere with the regions of
interest, corresponding to 800- 1300 cm-1 (C-C, C-O).
4.3.6 Deconvolution
4.3.6.1 Deconvolution for protein secondary structure studies
Deconvolution is a resolution- enhancement procedure used to resolve overlapped and
hidden peaks. Its application to IR has made more detailed studies of globular proteins
possible. [222] In this study, deconvolution was carried out by assuming an initial
Gaussian line-shape function for all the peaks. [223] In order to measure the relative
areas of the partially resolved amide I and II band components, the deconvoluted spectra
were curve fitted. Peak fit 4.21 software (Hearne Scientific Software) was used with the
following settings: 63 filter and 9.57 and 0.05. The base line perfectly matching the section
(880 - 2580 cm-1) was found to be a non -parametric base line with variance r2 = 0.9992.
The data very closely matched the generated spectra. All the data for all the experiments
were treated in the same way. Dividing the sum of the areas of all components associated
with given conformation by the total amide I or II band gives the relative area (%) which
was used for the data analysis in this study, using the approach widely used by other
researchers. [224]
4.3.6.2 Deconvolution for the enzymatic degradation of starch studies
All spectra were deconvoluted using peak fit software (4.21) A section for the region from
900 cm-1 to 1200 cm-1 was base lined adjusted and peak fitted assuming Gaussian shape
for the peaks. The sum of the area of the peaks in the region of 900 cm-1 -1200 cm-1 was

56
taken and the relative area of the individual peaks were calculated. The same settings
were used for all spectra.
4.3.7 Solutions preparation
4.3.7.1 Preparation of solutions for studies of protein secondary structure
L-Ascorbic acid or L-cysteine HCl (0.1g) was dissolved in 100 ml of distilled water in
volumetric flasks and sonicated for 10 min in a sonic water bath to facilitate dissolution.
Volumes equivalent to the following dosages of ascorbic acid were added to individual
flour samples: 0.0, 50, 100, 150, 200, 250, 300 ppm and for L-cysteine the following
dosages were added 0.0, 2.5, 5.0, 7.5, 10.0, 12.5, 15.0 ppm.
4.3.7.2 Solution preparation for the enzymatic degradation of starch studies
The spectra of Dextrin type1, Dextrin type 11, D-glucose and unmodified starch were
obtained by dissolving 2 g of each in 5 ml of distilled water.

57
5 5 Results and discussion: the interaction of ingredients
during baking
5.1 Introduction
Bread is widely regarded as the most important staple food in the western world. [130]
There is a great variety of baking processes and the differing baking performance of flours
has led to the term baking quality being difficult to clearly define. In addition this
complexity is compounded if we seek to establish general criteria of additives effects.
[131] For example it has been reported that, on a worldwide basis, more than 60
distinguishable types of flat bread are made. [225] Over time there have been many
developments in bread making and today additives and technological aids are extensively
used in the baking industry. [226] One of the significant changes has been in the
increasing use of enzymes in bread formulations over recent decades. [227] Enzymes as
technological aids are usually added to flour during the mixing step of the bread making
process. [228] However it is significant that grains naturally contain a large number of
enzymes and the variation in their activity levels may exert strong effects on the quality of
cereal raw materials and the resultant food products. [144]
5.2 Effect of sodium chloride
5.2.1 Bread volume
A significant increase in bread volume was found when salt dosage increased from 0.0%
to 1.6% as shown in Figure 5-1, this is due firstly to the function of salt in bread making
process. Additionally, there are effects of salt on the function of various components and
molecules incorporated during the bread making process including the α-amylase
routinely added to dough formulations. The results confirm the findings of other
researchers: Salt is known to control yeast growth, at 0% salt concentration the yeast

58
fermented the dough too quickly producing gases in the dough system such that this did
not coincide with the complete development of the gluten network. As a result the gases
formed were not fully trapped and some of the gas burst through the dough surface and
escaped without contributing to the bread volume. The inflation of the dough was
incomplete because the rate of the production of these gases was higher than the dough
gas retention capacity. In order to produce a loaf of bread with a light and even crumb
texture, the dough must be able to retain the gases produced by the yeast fermentation as
discrete gas cells for a sufficiently long period. [229] In the current study, the observation
was made that some gas bubbles holes appeared on the surface of the bread crust for
loaves with 0 % concentration of salt. This is consistent with a rupturing of the matrix
during baking, leading to the establishment of continuous gas phase and consequently,
the rapid loss of gas. [229] There was probably also a decrease in bread volume due to
the effect of salt on α-amylase activity. As salt increases the energy necessary for
chemical and physical reactions involving water [230], so the addition of sodium chloride
regulates the rate of starch hydrolysis and sugar production by α-amylase. This, in turn
regulates yeast growth and gas production rate, resulting in moderate inflation and a
desirable final bread volume.
Additionally the effect of salt on dough rheological characteristics cannot be ignored, as
salt strengthens dough structure as reported by other researchers. [231] Salt effectively
toughens the gluten. [232] Accordingly, the absence of salt weakens the dough, causing
the structure to be unable to hold and trap the gas, leading to the loaf having a small
volume bread. On the other hand the presence of salt contributes to the structure of the
dough and the gluten network producing strong dough capable of retaining the gases
produced by the yeast.
Increasing the salt in the dough system beyond 1.6% results in a considerable decrease
in bread volume. Increasing salt increase α-amylase hydrolysis reaction activation energy
and lower the water activity. [233-235] resulting in less sugars produced by α-amylase for
yeast to produce carbon dioxide in dough system and increase the volume, also sodium
chloride inhibit the growth of yeast and affect the amount of gases in the dough, the
increase in salt dosage in the dough system produce strong dough structure hard to be
inflated by the low rate of gases produced by the inhibited yeast.

59
100.5 104.5 103.0 99.0
85.3
108.8111.5
0.0
20.0
40.0
60.0
80.0
100.0
120.0
0 1.6 2.5 3.3 4.2 5.1 6
CSalt (%)
Bre
ad V
olum
e (c
m3 )
Figure 5-1 The effect of sodium chloride concentration on bread volume
5.2.2 Crust color
The increase in salt dosage increased crust color darkness, as shown in Figure 5-2
Minolta chromameter defines colour numerically in terms of lightness or L* value, (0 =
black, 100 = white), a* value (greenness 0 to –100, redness 0 to +100) and b* value
(blueness 0 to -100, yellowness 0 to +100) Minolta chroma meter values for L, a, b were
recorded and (L-b) values were calculated. Additionally L-√ (a²) –b was calculated and
these values were used as an indication of the crust darkness. [236, 237] The
observations of an increase in crust darkness with increasing in salt incorporation are at
least partly due the inhibitory effect that salt exerts on the yeast: The salt attracts water
away from the yeast surface thereby reducing their ability to grow and divide. This then
impacts the level of simple sugars in the dough, including those directly added as well as
those produced by α-amylase in the dough system. In comparison with the doughs
containing lower levels of salt, the accumulation of sugars facilitates reaction with amino
acids when, during baking, heat is applied. This produces the dark brown colour through
Maillard reactions which are a series non-enzymatic reactions leading to the formation of
brown products. [238]
In contrast, for samples with 0% salt the colour was relatively pale and the appearance
was much whiter than for the samples with increasing salt dosage. For Maillard reactions
to proceed, the minimum requirements are the presence of an unionised amino

60
compound, usually in the form of a protein or amino acid component, a reducing sugar
and some water. [239]
The amylases promote yeast action during fermentation by degrading damaged starch
into smaller dextrins thereby increasing the availability of reducing sugar groups. [240]
Surface colour depends both on the physico-chemical characteristics of the raw dough
particularly water content, pH, reducing sugar levels and amino acid content. [241] Values
for L-b were used as a measure for crust darkness in comparison with calculated values
for the colour index [L-√(a²) –b], as both of these have been suggested as useful single
number parameters that may be easier to utilise than the three separate values of L, a
and b measured on the crust samples. The differences in these calculated parameters
were greater when salt levels were varied and as a result the wide variations were found
to be useful in assessing the impact on crust darkness. The differences observed in the
colour index value were higher than for L-b so the colour index appears to be the most
useful in evaluating crust darkness. [236]
0 1.6 2.5 3.3 4.2 5.1 6
aL-b
Color indexb
L
-10
0
10
20
30
40
50
60
70
Arb
itrar
y un
its
Nacl ( % )
aL-bColor indexbL
Figure 5-2 The effect of sodium chloride on crust color

61
5.2.3 Crumb texture
The increase in salt dosage increased crumb firmness, as shown in Figure 5-3. The
increase in salt dosage affects yeast growth and so gas production rate which will then
directly affect the crumb texture and structure. This reflects the fact that gas is important
as it inflates the dough and enhances the texture. Increasing the salt increase the dough
strength[233] and so produces a more rigid and toughened gluten network which
contributes to the gas retention. The diffusion of gas through the dough phase is retarded
[229] and the result is a dense crumb. Also increasing the salt dosage increases the ratio
of salt to the initial dough component, this contribute to the crumb firmness.
2.5
3.5 3.3
4.4
7.2
0
1
2
3
4
5
6
7
8
0 1.6 2.5 3.3 4.2CNacl (%)
Ave
rage
forc
e ( N
)
Figure 5-3 The effect of salt concentration on crumb texture
5.3 L-cysteine
Cysteine is an amino acid containing a sulfhydryl group that is available and accessible for
reaction. This molecule occurs naturally in gluten proteins of wheat flour and can also be
added to the dough as a reducing agent to increase dough extensibility. This occurs
through its action on the gluten during mixing process of bread making. Effectively it may
serve the same function as the energy of the mixer and also of proteases and these are
opposite to the effects of oxidizing agents. [242] it is now well recognised that the
sulfhydryl group plays an important role in dough chemistry. This occurs because
sulfhydryl groups are potentially capable of undergoing a disulfide-sulfhydryl interchange

62
that involve the cleave and reformation of disulfide bonds. This can be mediated by the
sulfhydryl groups naturally occurring in flour or by the relatively small amounts of
sulfhydryl compounds added as improver additives and the reactions are referred to as
disulfide interchange. [243] The reactions are shown here with R and R' representing the
two gluten molecules and with cysteine as the reducing agent:
R–S–S–R' + cys–SH → R–S–S–cys + R'–SH
R–S–S–cys + cys–SH → cys–S–S–cys + R–SH
If these reactions occur, the effect is to reduce the number of cross-links between the
gluten subunits and this will be proportional to the amount of cysteine added into the
dough system. [242] The physico-chemical and functional properties of wheat protein are
primarily attributed to the disulfide cross-links which play a significant role in the gluten net
work formation in dough. [244] In addition, the effect of amino acids on bread making are
important not only to the browning of the crust and its colour but also to flavour. [245]
Crust browning is essential for the production of attractive bread and it has been
hypothesised that crust browning is due to Maillard reactions, rather than caramelisation
or pyrolysis of sugar and starch. [246]
5.3.1 Effect of L-Cysteine on bread volume
The addition of L-cysteine to the bread formula increased bread volume as shown in
Figure 5-4. The added L-cysteine contributes to breaking of disulfide links during mixing
and partially depolymerises the gluten proteins. [247] This results in a shorter mixing time,
reduced resistance to extension [248] and a softer dough which can be readily inflated by
carbon dioxide produced by yeast, giving a higher volume. At higher levels of L-cysteine
addition decreased bread volumes were observed. This is due to the excessive breakage
of the disulfide bonds resulting in very soft dough incapable of retaining the gas produced
by yeast. [248]
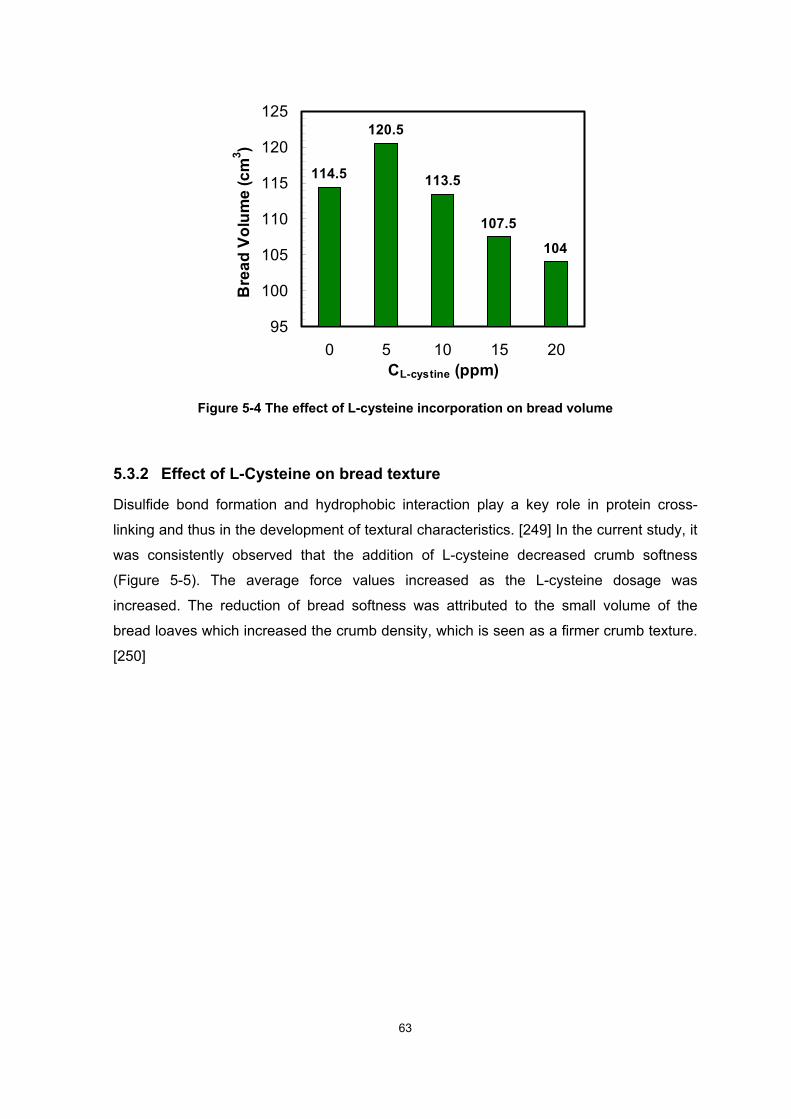
63
114.5
120.5
113.5
107.5
104
95
100
105
110
115
120
125
0 5 10 15 20CL-cystine (ppm)
Bre
ad V
olum
e (c
m3 )
Figure 5-4 The effect of L-cysteine incorporation on bread volume
5.3.2 Effect of L-Cysteine on bread texture
Disulfide bond formation and hydrophobic interaction play a key role in protein cross-
linking and thus in the development of textural characteristics. [249] In the current study, it
was consistently observed that the addition of L-cysteine decreased crumb softness
(Figure 5-5). The average force values increased as the L-cysteine dosage was
increased. The reduction of bread softness was attributed to the small volume of the
bread loaves which increased the crumb density, which is seen as a firmer crumb texture.
[250]

64
2.5
3.8
5.66.5
10.9
0
2
4
6
8
10
12
0 5 10 15 20CL-cystine (ppm)
Ave
rage
forc
e ( N
)
Figure 5-5 The effect of L-Cysteine addition on bread texture
5.3.3 Effect of L-cysteine on crust color
L-Cysteine addition decreased the L value for bread crust color as shown in Figure 5-6.
This is due to the colour of peptides and gluten and to the occurrence of Maillard reactions
involving the free amino acids. [245] L-Cysteine, as an amino acid is able to participate in
Maillard reactions under suitable conditions and then contribute to the brown crust color.

65
0 5 1015
20
a
L-b
Color indexb
L
70 64.7
53.949.5 51.5
34.432.9 31.6
27.9
23.2
32.8
28
14.2 14.6
25.9
35.631.8
22.321.6
28.3
2.8 3.88.1
7
2.40
10
20
30
40
50
60
70A
rbitr
ary
units
CL-Cystine (ppm)
aL-bColor indexbL
Figure 5-6 The effect of L-cysteine addition on crust color
5.4 Ascorbic acid
It has been established that the beneficial effect of ascorbic acid (AsA) in bread making is
due to the oxidised form of AsA which is dehydro ascorbic acid (DHA). It has also been
shown that flour contains DHA acid reductase which catalyses the oxidation of AsA to
DHA. [251]
5.4.1 Effect of ascorbic acid on bread volume
The results obtained for bread volume when AsA was added to the bread formulation are
presented in Figure 5-7 It was found that for each of the levels of addition from 50 to 200
ppm loaf volumes were higher than for the blank sample. AsA strengthens the dough and
the gluten structure and the occurrence of sulfhydryl- disulfide interchange reaction also is
used to explain the action of ascorbic acid. [252]

66
In addition it is likely that AsA inhibits the formation of dityrosine molecules in the dough.
[253] The strength caused by the formation of disulfide bonds in the dough due to the
action of AsA, makes the dough and the gluten network strong and capable of effectively
retaining the gas produced by the yeast. The result is increased loaf volumes, due to the
greatly enhanced gas retention capacity of the dough.
115
117 117118
119.5
112113114115116117118119120
0 50 100 150 200Cascorbic acid ( ppm )
Bre
ad V
olum
e (c
m3 )
Figure 5-7 Effect of ascorbic acid on bread volume
5.4.2 Effect of ascorbic acid on bread texture
Incorporation of AsA into the bread formula decreases bread firmness (Figure 5-8).
Ascorbic acid increases bread volume, resulting in low specific volume: the crumb of the
bread is inflated by gas as it is produced by the yeast. The subsequent retention is
facilitated by the action of AsA on the dough structure, as this is finer and lighter in texture
and much less dense compared to the control samples. It has also been suggested that
AsA serves a protective function for certain of the lipid components which are known to
have a strong influence on loaf volume and bread quality. [254]

67
2.5
3
1.82.1
1.8
0
0.5
1
1.5
2
2.5
3
3.5
0 50 100 150 200Cascorbic acid (ppm)
Ave
rage
forc
e ( N
)
Figure 5-8 The effect of AsA on bread texture
5.4.3 Effect of ascorbic acid on crust color
The addition of AsA also influences the colour of the bread crust (Figure 5-9).
0 50 100150 200
a
L-bColor index
bL
0
10
20
30
40
50
60
70
Arbi
trar
y un
its
Ascorbic acid ( ppm )
aL-bColor indexbL
Figure 5-9 The effect of AsA on crust color

68
5.5 The incorporation of fumaric acid into bread formulations
Fumaric acid is a dicarboxylic, naturally occurring, organic, general purpose food acid.
[255] Owing to its double bond and two carboxylic groups, fumaric acid has been widely
applied industrially as a good substrate for chemical syntheses, such as esterifications
and polymerisation. [256] It made synthetically by the isomerisation of maleic acid, and it
can also be produced by fermentation of glucose or molasses with the mould of Rhizopus
spp. [256, 257] As an approved additive it has potential applications in bakery
formulations.
5.5.1 Effect of fumaric acid on bread volume
Fumaric acid is like other α, β-unsaturated carbonyl compounds (maleic acid and ferulic
acid) in its effect on dough mixing characteristics, which is similar to the effect of cysteine
and the SH-blocking reagent N-ethylmaleimide (NEMI). [258] Fumaric acid shows a
reducing effect due to the double bond configuration in its molecular structure. [259] It
contributes to dough relaxation by breaking the disulfide bonds between protein molecules
and by this mechanism it enhances the machinability of the dough. [260] Its effect on
wheat flour dough protein is illustrated in Figure 5-10, its effect on bread volume is shown
in Figure 5-11, and its effect on bread texture in Figure 5-12.
Before addition after addition
Figure 5-10 The effect of fumaric acid on wheat flour dough. [260]

69
117.5103 97
120107
0
20
40
60
80
100
120
140
0 0.05 0.1 0.15 0.2Cfumaric acid ( % )
Bre
ad V
olum
e (c
m3 )
Figure 5-11 The effect of fumaric acid on bread volume
2.5
3
1.82.1
1.8
0
0.5
1
1.5
2
2.5
3
3.5
0 0.05 0.1 0.15 0.2Cfumaric acid (%)
Ave
rage
forc
e ( N
)
Figure 5-12 Effect of fumaric acid on bread texture
5.6 Effect of α-Amylase
Among the carbohydrases in cereals are α-amylases, β-amylases, debranching enzymes,
cellulases, β-glucanases, and many glucosidases. α-Amylase appears to be the most
important of these carbohydrases as it is widely used in dough formulations. [261] The
enzymes most frequently incorporated during bread making are the α-amylases which

70
may be from different origins (cereal, fungal and bacterial). [262] It is also well established
that β-amylase is prevalent in wheat flour made from unsprouted grains, however the
amount of α-amylase is negligible and it is therefore necessary to supplement these flours
with a certain amount of α-amylase. [263] In this study, the influence of added α-amylase
has been established by application of the baking test.
5.6.1 Effect of α-Amylase on bread volume
The addition of α-amylase increases bread volume (Figure 5-13). The increase is due to
the action of α-amylase, because during mixing, relaxation, scaling, dividing and proofing,
α-amylase act on damaged starch producing fermentable sugars: these can be utilised by
the yeast to multiply and produce carbon dioxide, necessary to inflate the dough and
increase bread volume. [264] During dough mixing damaged starch swells and becomes
more readily soluble. This, in addition to possible increase in starch protein interaction,
results in increased dough strength; this in turn makes it more difficult for the dough
expand as the gases are produced during fermentation. [265] The addition of α-amylase
results in hydrolysis of damage starch reducing the strength of the dough allowing the
gases to inflate the dough and increase bread volume.
115.5
120121.5
123
126.5
110112114116118120122124126128
0 5 10 15 20Calpha amylase (SKB/100g)
Bre
ad V
olum
e (c
m3 )
Figure 5-13 The effect of α-amylase on bread volume
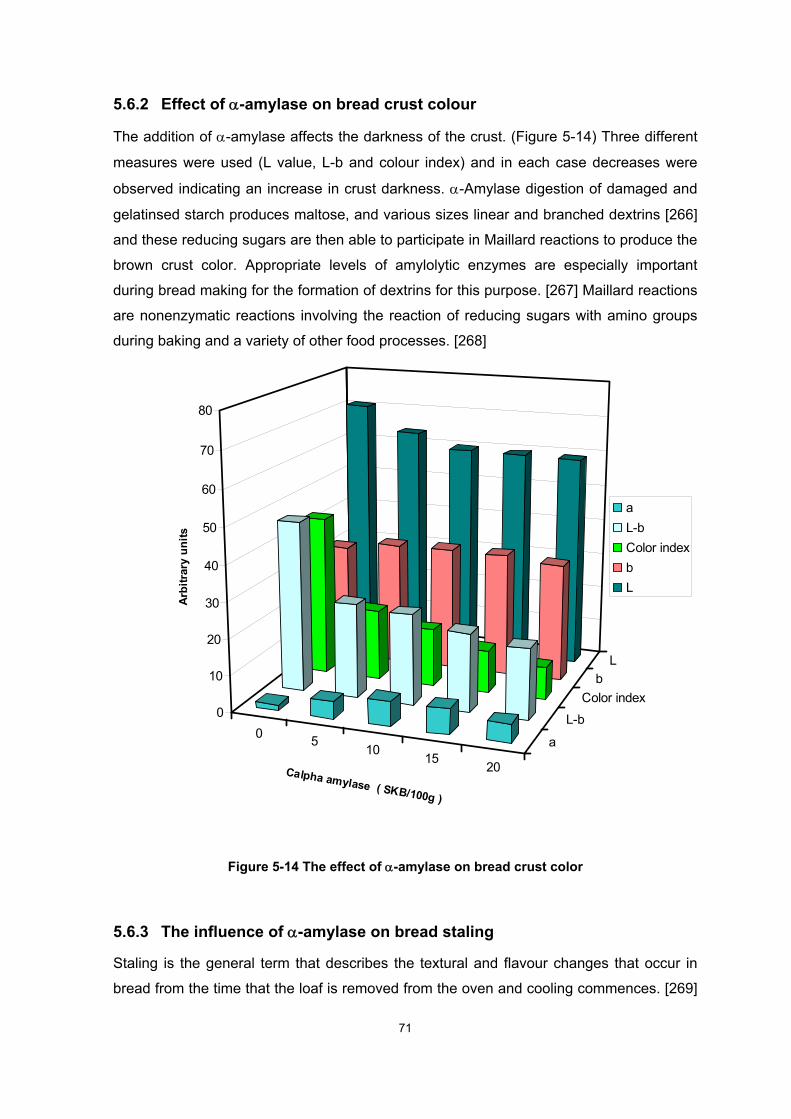
71
5.6.2 Effect of α-amylase on bread crust colour
The addition of α-amylase affects the darkness of the crust. (Figure 5-14) Three different
measures were used (L value, L-b and colour index) and in each case decreases were
observed indicating an increase in crust darkness. α-Amylase digestion of damaged and
gelatinsed starch produces maltose, and various sizes linear and branched dextrins [266]
and these reducing sugars are then able to participate in Maillard reactions to produce the
brown crust color. Appropriate levels of amylolytic enzymes are especially important
during bread making for the formation of dextrins for this purpose. [267] Maillard reactions
are nonenzymatic reactions involving the reaction of reducing sugars with amino groups
during baking and a variety of other food processes. [268]
0 510 15
20
a
L-b
Color indexb
L
0
10
20
30
40
50
60
70
80
Arb
itrar
y un
its
Calpha amylase ( SKB/100g )
aL-bColor indexbL
Figure 5-14 The effect of α-amylase on bread crust color
5.6.3 The influence of α-amylase on bread staling
Staling is the general term that describes the textural and flavour changes that occur in
bread from the time that the loaf is removed from the oven and cooling commences. [269]

72
During storage, changes in flavour and, normally, a loss of the freshly baked aroma take
place. [270] In our study, as illustrated in Figure 5-15, the addition of α-amylase
decreases bread firmness. During storage of the trial loaves, the samples into which α-
amylase had been incorporated was slower than those samples where no α-amylase was
used. In addition, the rate of staling was found to be dependant on the level of
incorporation.
05
115
20
1
2
4
6
10.6 11
9.5 9.498.8
7.3
5.95.4 5.6
76.6
4.43.7 4.3
2.9 3.1
1.51.4 1.50
2
4
6
8
10
12
Ave
rage
forc
e (N
)
Amylase dosage (SKB/100g)
Days
1246
Figure 5-15 α-Amylase and it influence on bread staling

73
6
6 Results and discussion: the interactions of α-amylase
during the fermentation process
6.1 Summary
Wheat flour doughs are complex systems in which the various molecular interactions
influence the ultimate appeal of the resulting baked products. In the current study,
vibration spectroscopy based upon ATR/FT-IR in the region of 800- 1300 cm-1 (C-C, C-O)
has been used to study the interactions of α-amylase with starch in a dough system. The
kinetics of the breakage of the glycosidic link and starch damage content as well as mono
and polysaccharides produced during the reaction were monitored. The ATR/FT-IR
spectrums were deconvoluted and the relative area of the individual peaks was
calculated. Peaks at 1060 cm-1 and 1127 cm-1 were assigned to the C1-OH in glucose and
the glucosidic link in the starch respectively. These peaks were monitored in order to
follow the cleavage of the glycosidic link in starch and the subsequent formation of C1-
OH. During the reaction, the relative area of the peak at 1060 cm-1 increased from 0% in
the blank dough to 10% after 25 min reaction time, while the peak at 1127 cm-1 decreased
from 2.4% to 1.7%. The peak at 976 cm-1 assigned to the axial deformation of C-OH in
starch. This peak decreased from 15% to 5% during the same time span. These results
provide a novel means of monitoring the baking process.
6.2 Introduction
Wheat is a versatile crop with the unique property that the dough prepared using its flour
has the ability to be processed into a range of foodstuffs notably bread, other baked
products and pastas. [110] Starch and protein are the two major constituents of wheat
flour. In the case of bread, the significance of the starch will show up during each of the

74
major processing stages: milling, dough mixing, fermentation as well as the oven baking
step and finally the storage of bread. [271]
6.2.1 Starch composition
In starch the two major constituents are amylose and amylopectin. Amylose is a linear
polymer consisting of up to 6000 glucose units with α, 1-4 glycosidic bonds. Amylopectin
consists of short α 1-4 linked linear chains of 10–60 glucose units and α, 1-6 linked side
chains with 15–45 glucose units. [272] The kinetics and the products of the breakage of
these gulcosidic bonds by exo and endoamylases have significance in starch processing
in a variety of different industries.
6.2.2 Amylases mode of action on starch
Endoamylases cleave α-1,4 glycosidic bonds in amylose and amylopectin chains in a
random fashion and α-amylase is well-known as having the mode of action of an
endoamylase. Exoamylases, including β-amylase, amyloglucosidase, glucoamylase and α
glucosidase cleave either of both of the glycosidic bonds in starch, that is the α-1, 4 and α-
1, 6. [198] These glucosidic bonds in starches within the intact starch granule are
stabilised by the formation of intra and intermolecular hydrogen bonds rendering starch
insoluble in cold water and often resistant to both chemical and enzymatic treatments.
However, starches can be gelatinsed by heating in water, which increases their chemical
reactivity to the action of amylolytic enzymes. [273] This is because heat weakens the
intermolecular hydrogen bonds. Unlike native starch granules, which are semicrystalline,
insoluble and as a consequence inaccessible to α-amylase, damaged starch is
amorphous, soluble [274] and very susceptible to attack by α-amylase enzymes. Thus
damaged starch effectively provides a further supply of sugars to the yeast during the
fermentation process if an active α-amylase is also present.[275]
6.2.3 Features of ATR/FT-IR
In this study the breakage of the glucosidic linkage and the production of various sugars
during the reaction were monitored in a dough system using ATR/FT-IR. The theory of
ATR/FT-IR has been reviewed earlier and is also available elsewhere. [164, 276] Some of
the general features of ATR/FT-IR in relation to this study are that it is a type of internal
reflection spectroscopy in which the sample is placed in contact with an Internal Reflection
Element (IRE) of high refractive index. IR radiation is focussed onto the edge of the IRE,
reflected through the IRE, and then directed to a suitable detector. [164] The depth of

75
penetration depends upon the wavelength of incident radiation (λ1), the angle of incidence
(θ) and the ratio of the ATR crystal and sample refractive indices (n2/n1). The equation
relating these parameters is presented in Figure 6-1. [277, 278] The depth of penetration
of radiation is relatively shallow for many types of samples and for dough, it has been
calculated to be in the order of 0.5–4 μm. [279]
Figure 6-1 The equation for the depth of penetration of the ATR/FT-IR radiation. [278]
Several researchers have previously reported different applications for ATR/FT-IR in
starch studies [199, 218, 280-286]. In the current study ATR/FT-IR was used to monitor
the hydrolysis of starch by α-amylase in a dough system using a water absorption chosen
as similar to that applied in the baking of yeast leavened bread.
6.3 Wheat flour dough spectra
Figure 6-2 shows the main peaks in the dough spectra and these have been assigned to
the main components of wheat flour dough, namely water, starch, protein, and fat. The
peak at 3300 cm-1 originated from the stretching of OH and N-H bonds. [187] While the
peak at 1743 cm-1 is due to the carbonyl stretching of the fatty ester groups from lipids.
[279] Water also absorbed strongly at around 1645 cm-1 due to OH bending, which is also
within the amide 1 region (1600-1700 cm-1). The bands in this particular region of the
spectrum are very sensitive to conformation changes in protein secondary structure. The
results presented in chapter 6 showed valuable information about the intermolecular
interaction of baking ingredients and their impact on wheat flour protein secondary
structure. Amide 1 originated from C=O stretch and N-H vibration modes. [195] To
eliminate the interference of water with Amide 1 the band at 2125 due to OH deformation
has been used for water subtraction procedure effectively representing an internal
standard.[221] The region from 1500-1600 is Amide 11 which is primarily N-H bending, C-
N stretching modes, and it is particularly sensitive to protein- solvent interaction and
protein–protein hydrophobic interaction. [287] The region from 1300-800 cm-1 (C-C, C-O)
corresponds to the starch along with its hydrolysis products, and this region is not
perturbed by water. [200] This is a result of the water absorption band due to OH
deformation appearing in the region below 800 cm-1 [279] so that no water subtraction
procedures were needed.

76
0
0.2
0.4
0.6
0.8
1
1.2
70011001500190023002700310035003900
Wavenumber (cm-1)
Abs
orba
nce
900100011001200
Figure 6-2 A typical wheat flour dough ATR/FT-IR spectrum

6.4 α Amylase hydrolysis product spectrum
The deconvoluted spectrum of the blank dough (Figure 6-3) is presented in Figure 6-3. The
main peak observed in the spectra for the product involving α-amylase hydrolysis (Figure 6-4
to Figure 6-9) and not observed in the blank dough spectrum (Figure 6-3) is the peak at 1060
cm-1. This peak also appear in the spectrum obtained for pure glucose. As one of the main
peaks featuring in the D-glucose spectrum, this peak is assigned to the bending of C1-OH in
the D-glucose molecule. [200-202] Careful inspection of Figure 6-4 to Figure 6-9 indicates
that the area under this peak increases as the incubation time is extended.
0.00
0.02
0.04
0.06
0.08
0.10
0.12
0.14
0.16
900 950 1000 1050 1100 1150 1200
Wavenumber (cm-1)
Abso
rban
ce
1152
11281103
1070
1046
1021
1000
976938
925
1183
910
Figure 6-3 The deconvoluted blank dough spectrum before the addition of α-amylase.
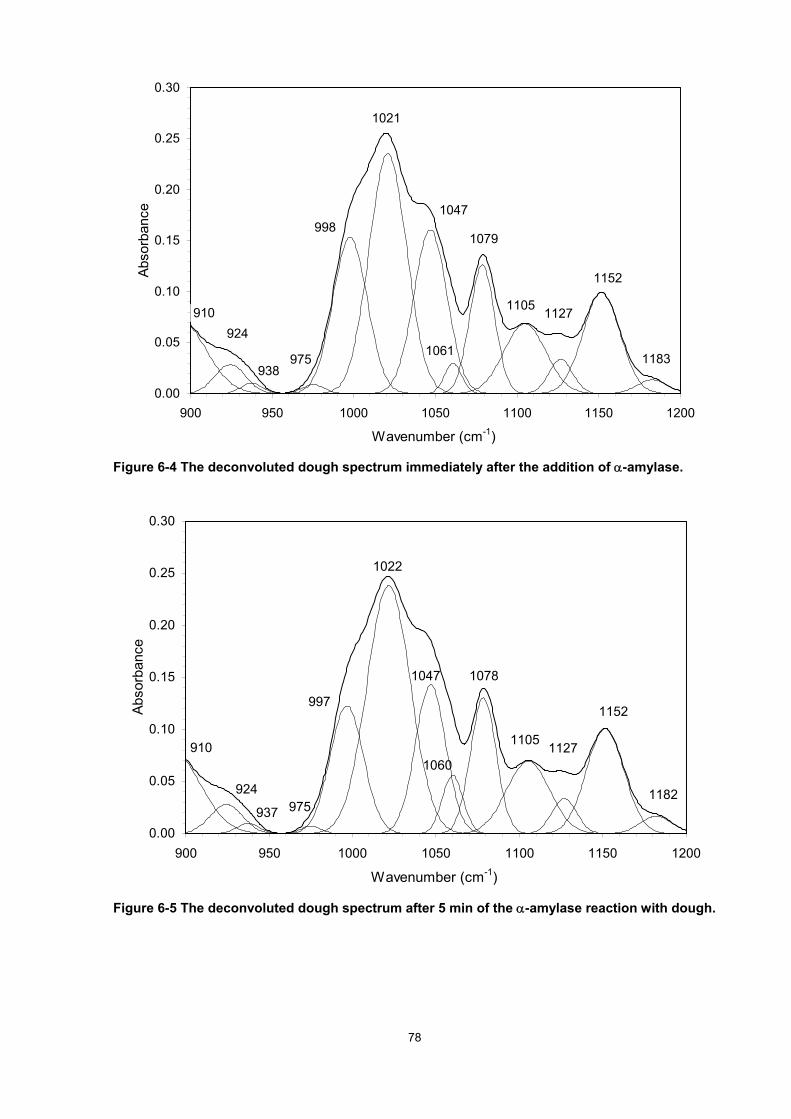
78
0.00
0.05
0.10
0.15
0.20
0.25
0.30
900 950 1000 1050 1100 1150 1200
Wavenumber (cm-1)
Abso
rban
ce
1152
11271105
1079
1061
1047
1021
998
975
924
1183
910
938
Figure 6-4 The deconvoluted dough spectrum immediately after the addition of α-amylase.
0.00
0.05
0.10
0.15
0.20
0.25
0.30
900 950 1000 1050 1100 1150 1200
Wavenumber (cm-1)
Abso
rban
ce
1152
11271105
1078
1060
1047
1022
997
975924 1182
910
937
Figure 6-5 The deconvoluted dough spectrum after 5 min of the α-amylase reaction with dough.

79
0.00
0.05
0.10
0.15
0.20
0.25
0.30
900 950 1000 1050 1100 1150 1200
Wavenumber (cm-1)
Abs
orba
nce
1152
11271105
1078
1060
1047
1022
997
975924 1182
910
937
Figure 6-6 The deconvoluted dough spectrum after 10 min from initiation of the α-amylase
reaction with dough.
0.00
0.05
0.10
0.15
0.20
0.25
0.30
900 950 1000 1050 1100 1150 1200
Wavenumber (cm-1)
Abso
rban
ce
1151
11271106
1078
1059
1043
1023
995
975924
1182
910
937
Figure 6-7 The deconvoluted dough spectrum after 15 min of the α-amylase reaction with
dough.

80
0.00
0.05
0.10
0.15
0.20
0.25
0.30
900 950 1000 1050 1100 1150 1200
Wavenumber (cm-1)
Abso
rban
ce
1151
11271106
1078
1056
1043
1023
994
975
924
1182
910
937
Figure 6-8 The deconvoluted dough spectrum after 20 min of the α-amylase reaction with
dough.
0.00
0.05
0.10
0.15
0.20
0.25
0.30
900 950 1000 1050 1100 1150 1200
Wavenumber (cm-1)
Abso
rban
ce
1151
11271106
1078
1056
1042
1023
994
975924 1181
910
937
Figure 6-9 The deconvoluted dough spectrum after 25 min of the α-amylase reaction with
dough.

81
6.5 Monitoring the breakage of the glycosidic linkage (α-1, 4)
Interesting changes in relation to the action of α-amylase on starch is seen through the peak
at 937 cm-1 which is specifically assigned to the C-O-C in α-1, 4- linkage in the glycosidic
chain of starch.[200, 202, 204, 211, 288] The relative area of this peak decreased from 0.67
% at the initiation of the reaction to 0.54 % after 25 minutes of reaction time. The kinetics of
the breakage of the glycosidic linkage in starch is presented in Figure 6-10, showing that
there is a linear relation between time and the breakage of the glycosidic linkage. The shape
of the graph is very similar to that observed for glucose production (Figure 6-16), the
difference being that the glucose is seen to increase and the glycosidic bond decreases
coinciding with the mode of action of α-amylase in producing glucose as a product of the
breakage of the glycosidic linkage in starch polymer.
One of the purposes of α amylase addition in wheat flour dough is to break the starch
molecules, producing glucose so this can permeate through the yeast cell wall and be
utilised as a carbon source for the yeast. This results, in turn in the production of carbon
dioxide as a by-product which has the important function of inflating the dough during the
fermentation process. So in the light of these results, we have been able to monitor the
fermentation process with the changes from the addition of water to the flour, up to the
proofing stage, Including the kinetics of the breakage of the glycosidic linkage in wheat flour
starch which will be of great interest to cereal chemists in order to monitor the effect of
various ingredients on the kinetics of the breakage of the glycosidic linkage, more over the
level of α amylase can effectively be quantified.

82
0.5
0.52
0.54
0.56
0.58
0.6
0.62
0.64
0.66
0.68
0.7
0 5 10 15 20 25 30 35Time (min)
Area
%
937 cm-1
Figure 6-10 The kinetics of the α-amylase reaction in dough based on the 937 cm-1 (glycosidic
linkage α-1,4) relative peak area obtained from the deconvoluted spectra
6.6 The kinetics of the α-amylase reaction with dough based on
the peak at around 976 cm-1
The relative area of the peak at 976 cm-1 decreased from 0.43% at the beginning of the
reaction to 0.29% after 25 min of reaction time, Figure 6-11 shows the plot of the relative
area of this peak versus reaction time. Similar results for the time dependent acid hydrolysis
of some oligosaccharides were reported by Mathlouthi. [200] The band most affected in the
previous study was situated in the 993-966 cm-1 range and corresponded to the stretching of
the C-O bond within the C-O-C structure. The vibration in this region can be assigned to the
glycosidic linkage, and could also be assigned to the deformation of the axial C-OH at C-4
(C-4-OH). [200] We stongly suggest that there is a correlation between this peak and the
level of starch damage in wheat flour, because under the reaction conditions used in the
current study, the most susceptible of the glycosidic linkages likely to be present in the dough
system, is the glycosidic linkage in the damage starch components because this is
amorphous, soluble and highly susceptible to α-amylase action while intact starch granules
are semi crystal, insoluble and inaccessible to α-amylase. [274] Other changes in the dough
spectra include those in the peak at around 997 cm-1.This peak is water sensitive and the
changes of this peak are presented in Figure 6-12.

83
0
0.1
0.2
0.3
0.4
0.5
0.6
0.7
0 5 10 15 20 25 30Time (min)
Are
a %
975 cm-1
Figure 6-11 The kinetics of the α-amylase reaction with dough based on the 975 cm-1 relative
peak area obtained from the deconvoluted spectra
0
2
4
6
8
10
12
14
16
18
0 5 10 15 20 25 30 35Time (min)
Area
%
997 cm-1
Figure 6-12 The kinetics of the α-amylase reaction with dough based on the relative area of the
997 cm-1 peak obtained from deconvoluted spectra
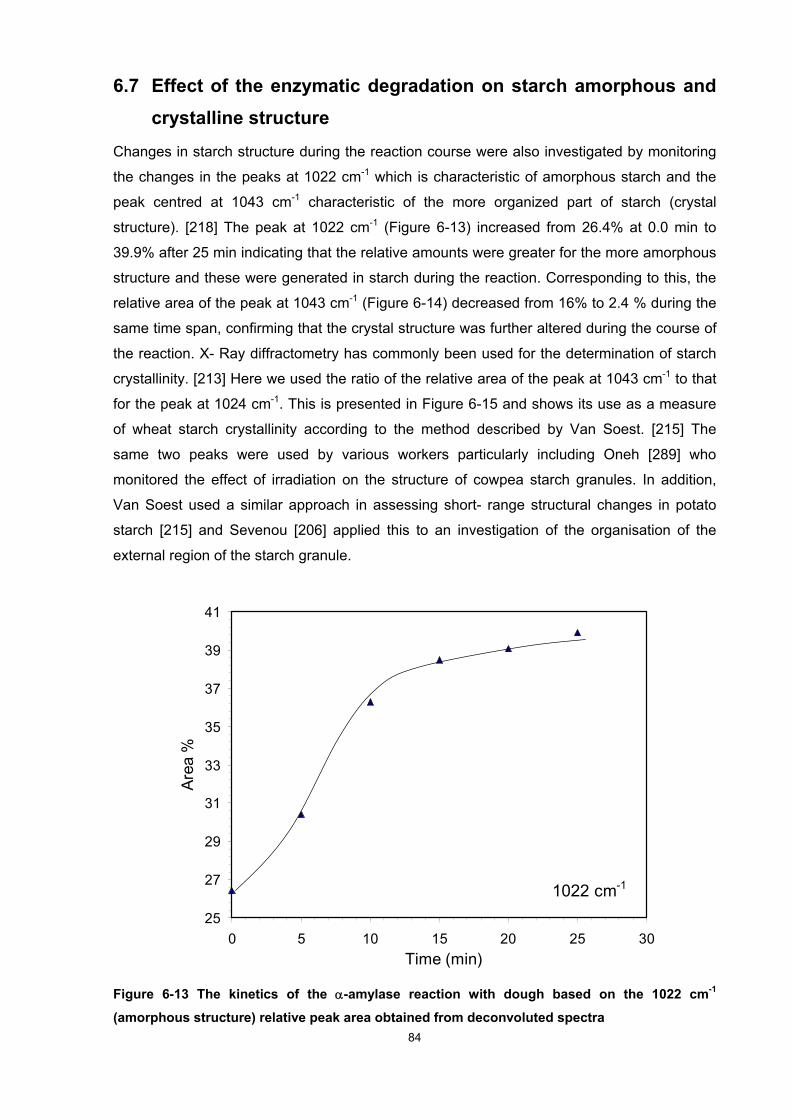
84
6.7 Effect of the enzymatic degradation on starch amorphous and crystalline structure
Changes in starch structure during the reaction course were also investigated by monitoring
the changes in the peaks at 1022 cm-1 which is characteristic of amorphous starch and the
peak centred at 1043 cm-1 characteristic of the more organized part of starch (crystal
structure). [218] The peak at 1022 cm-1 (Figure 6-13) increased from 26.4% at 0.0 min to
39.9% after 25 min indicating that the relative amounts were greater for the more amorphous
structure and these were generated in starch during the reaction. Corresponding to this, the
relative area of the peak at 1043 cm-1 (Figure 6-14) decreased from 16% to 2.4 % during the
same time span, confirming that the crystal structure was further altered during the course of
the reaction. X- Ray diffractometry has commonly been used for the determination of starch
crystallinity. [213] Here we used the ratio of the relative area of the peak at 1043 cm-1 to that
for the peak at 1024 cm-1. This is presented in Figure 6-15 and shows its use as a measure
of wheat starch crystallinity according to the method described by Van Soest. [215] The
same two peaks were used by various workers particularly including Oneh [289] who
monitored the effect of irradiation on the structure of cowpea starch granules. In addition,
Van Soest used a similar approach in assessing short- range structural changes in potato
starch [215] and Sevenou [206] applied this to an investigation of the organisation of the
external region of the starch granule.
25
27
29
31
33
35
37
39
41
0 5 10 15 20 25 30Time (min)
Area
%
1022 cm-1
Figure 6-13 The kinetics of the α-amylase reaction with dough based on the 1022 cm-1
(amorphous structure) relative peak area obtained from deconvoluted spectra

85
0
2
4
6
8
10
12
14
16
18
0 5 10 15 20 25 30Time (min)
Area
%
1047 cm-1
Figure 6-14 The kinetics of the α-amylase reaction with dough based on the 1047 cm-1 (crystal
structure) relative peak area obtained from the deconvoluted spectra
0
0.1
0.2
0.3
0.4
0.5
0.6
0.7
0 5 10 15 20 25 30Time (min)
1043
to 1
022
area
ratio
Figure 6-15 The ratio of the 1047 cm-1 (crystal structure) relative peak area to 1022 cm-1 (amorphous structure) obtained from the deconvoluted spectra.

86
Figure 6-16 shows the plot the relative area of the peak versus time at 1060 cm-1 the area of
this peak increased from 0.0 to 10.01% after 25 minutes of α-amylase reaction on starch.
Glucose is one of the products of this reaction and the increase in the % area of this peak
can be interpreted as more free hydroxyl groups were produced during the reaction. This
reflects the fact that free glucose contains five free OH groups while in the starch polymer, a
monomeric unit contains, on average, fewer than three OH groups. [201] Monitoring this
peak is a useful approach in that it facilitates the study of the kinetics of the action of α-
amylase on starch; quantitative measurement of the total of all sugars is possible.
These results are in good agreement with the endo mode of action of α-amylase in which it
cleaves α-1,4-glycosidic links at random, yielding shorter chain fragments including
oligosaccharides. [201] These, in turn, can then be converted to glucose by amylases
because they are soluble thereby increasing accessibility by the amylases and resulting in
conversion to glucose. [290]
0
2
4
6
8
10
12
0 5 10 15 20 25 30Time (min)
Area
%
1060 cm-1
Figure 6-16 The kinetics of the α-amylase reaction with dough based on the 1060 cm-1 relative
peak area obtained from the deconvoluted spectra
Another peak change observed to be due to the hydrolytic action of α-amylase is the peak at
around 1100 cm-1 (Figure 6-17). This peak is assigned to the stretching of (C-O), associated
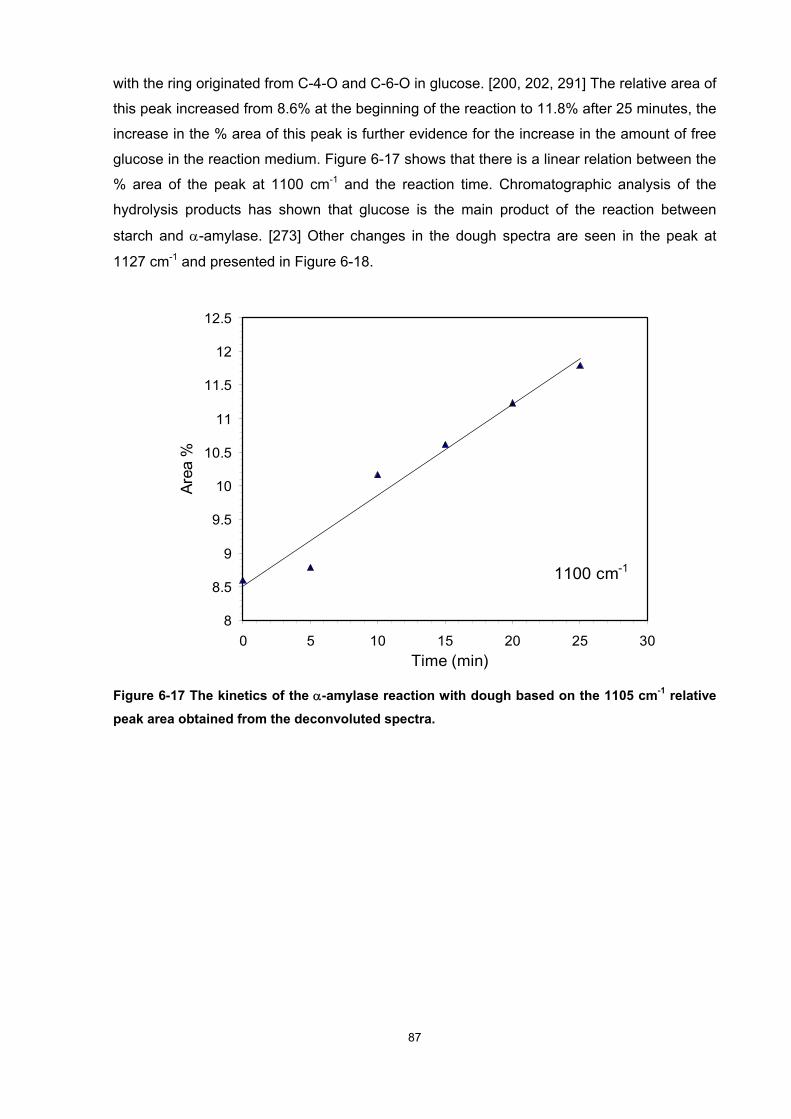
87
with the ring originated from C-4-O and C-6-O in glucose. [200, 202, 291] The relative area of
this peak increased from 8.6% at the beginning of the reaction to 11.8% after 25 minutes, the
increase in the % area of this peak is further evidence for the increase in the amount of free
glucose in the reaction medium. Figure 6-17 shows that there is a linear relation between the
% area of the peak at 1100 cm-1 and the reaction time. Chromatographic analysis of the
hydrolysis products has shown that glucose is the main product of the reaction between
starch and α-amylase. [273] Other changes in the dough spectra are seen in the peak at
1127 cm-1 and presented in Figure 6-18.
8
8.5
9
9.5
10
10.5
11
11.5
12
12.5
0 5 10 15 20 25 30Time (min)
Area
%
1100 cm-1
Figure 6-17 The kinetics of the α-amylase reaction with dough based on the 1105 cm-1 relative
peak area obtained from the deconvoluted spectra.

88
1.5
1.7
1.9
2.1
2.3
2.5
2.7
0 5 10 15 20 25 30 35Time (min)
Area
%
1127 cm-1
Figure 6-18 The kinetics of the α-amylase reaction with dough based on the 1127 cm-1 relative
peak area obtained from the deconvoluted spectra.
Another band affected by the hydrolytic action of α amylase is the peak at 1151 (Figure
6-19). The vibration in this region originates from the coupling of the stretching of (C-O), the
bending of (C-H) and the stretching of (C-O-H). [200] The area of this peak decreased from
11.0 to 10.4% after 25 min of reaction time corresponding to the decrease in the intensity of
this peak as a consequent of the hydrolytic action of α amylase on starch that has been
reported by Krieg. [202, 292] In attempting to determine the activity of α amylase in human
serum samples, by recording two spectra, one immediately after the addition of the enzyme
to starch, and one after 20 min reaction time and taking the difference in the spectra, this
peak was one of the main peaks giving rise to negative peaks in the their study of the
difference spectra.

89
10
10.5
11
11.5
0 10 20 30 40Time (min)
Area
%
1151 cm-1
Figure 6-19 The kinetics of the α-amylase reaction with dough based on the 1151 cm-1 relative
peak area obtained from the deconvoluted spectra.
6.8 Conclusion
ATR/FT-IR is a useful technique in studies of starch hydrolysis and quantitative
measurement of sugar in the dough system. The various ingredients and conditions affecting
the kinetics of the breakage of the glycosidic linkage were monitored by using ATR/FT-IR.
The effect of dough ingredients on starch can be monitored and measured. The structural
changes and intra and inter molecular interactions accompanying the reaction catalysed by
the α amylase greatly affect the appealing and characteristics of the food products made
from wheat flour doughs. The whole fermentation process can effectively be monitored using
ATR FT-IR.

90
7 7 Results and discussion: the application of ATR/FT-IR to
an investigation of inter- and intra-molecular interactions and protein secondary structure in a dough system
7.1 Introduction
The purpose of this study has been to investigate the effect of the widely used oxidising
agent ascorbic acid and the reducing agent L-cysteine on dough structure. These are
important as they influence the ability of dough to retain the gases produced as a by-product
when yeast utilise the sugars produced by the action of α-amylase on starch. This chapter
focuses on the amide I and amide II components and relates these with the characteristics of
the dough. It also investigates the changes in inter-molecular and intra-molecular interactions
upon addition of the selected oxidising or reducing agent, so it seeks to elucidate information
from the whole spectrum of the wheat flour dough.
Plant proteins play significant roles in human nutrition. [293] Wheat is one of the most widely
cultivated plants. [92] Gluten proteins are the predominant proteins in wheat flour; these are
insoluble in water under conditions in which the pH values are near-neutral as well as having
viscoelastic properties when hydrated. [294] Gluten contains two distinguishable fractions:
the glutenins (disulfide -linked polymers) and the gliadins (typically monomeric proteins)
which together give dough a combination of strength and extensibility. [196] Gliadin
contributes particularly to the viscosity of the dough while glutenin provides elasticity
characteristics to the dough. Gliadins were initially classified into four groups on the basis of
mobility at low pH during gel electrophoresis (α-, β-, γ-, ω- gliadins in order of decreasing
mobility). [115] Glutenin subunits, on the other hand, consist of two distinct groups, the

91
predominant low-molecular-weight species and the high molecular weight (HMW) subunits.
[287]
Dough, in its most basic form, is made by combining water, flour, and energy. [295] Water
causes the proteins to swell and mechanical energy promotes organisation of the proteins
into a continuous matrix giving dough a unique viscoelastic structure. [296] Dough also can
be defined as a composite system that comprises two dispersed filler phases (gas cells and
starch granules) and the gluten matrix. The relative proportions of these and the rheological
properties of the matrix are a reflection of those of the fillers and these all contribute in
determining the behaviour of the composite. [297] Additives and technological aids (also
referred to as processing aids) are extensively used in the baking industry for the
enhancement of the dough handling properties and machinability. [226]
L-Cysteine and similar thiol compounds play an important role in the modification of the
rheological properties of foods. [249] L-cysteine reduces the disulfide bonds between
proteins and, in a dough, weakens the strength of the gluten network in the dough. [298] The
usefulness of ascorbic acid on the other hand depends on its ability to modify the properties
of the proteins of wheat flour in a technologically advantageous manner. [299]
Many attempts have been made to establish the biochemical basis for the baking quality of
wheat flour. [300] A wide variety of methods have been used by other researchers in an
attempt to quantify the effect of oxidising and reducing agents on wheat flour dough.
However those methods do not give direct information about the effect on protein secondary
structure. [252, 301, 302] The basis of the studies reported here is that a vibrational
spectrum can give a more complete picture of the structure (geometry, electronic structure)
and dynamics of an analysed molecule. [177]
IR spectroscopy was one of the earliest experimental methods recognised as potentially
useful for estimating the secondary structure of polypeptides and proteins. [174] Over the
past decade, more recent developments in methods for analysis of spectral data have
revitalised the use of ATR/FT-IR spectroscopy in protein analysis. Several different
techniques are available for the quantification of protein secondary structure from ATR/FT-IR
spectra of proteins. [303] This includes methods for accurately quantify protein secondary
structure [304] and there are now three analytical procedures currently in use: Fourier self
deconvolution, second derivative and curve-fitting. [184]

92
7.2 ATR/FTIR of wheat flour dough
ATR/FT-IR spectroscopy has played a pioneering role in studying the conformation of
peptides, poly-peptides and proteins. [176] Its application to analysis of protein secondary
structure is based on the sensitivity of the absorption bands of the peptide group to the
conformation of the surrounding polypeptide chain. [305] Figure 7-1 shows the typical
spectrum obtained in the current study for a wheat flour dough that might be used in
breadmaking. The amide groups of polypeptides and proteins possess nine characteristic
vibration modes or group frequencies [174] and these are referred to as amide A, B, I, II, III,
V, VI, VII, VIII. As seen in the spectrum, the amide A band occurs at around 3500 cm-1 and
amide B at 3100 cm-1. Between 300-1700 cm-1 the peaks are those of amide I to amide VII
starting from the higher wave number for amide I to the lower wave number for amide VII that
are characteristic of secondary trans amides. [224] Of these vibrational bands, the amide I
band has been the most useful probe for determining the secondary structures of proteins.
[184] This particular band is due almost entirely to the C-O stretch vibration of the peptide
linkages that constitute the backbone structure of a protein.
0
0.1
0.2
0.3
0.4
0.5
0.6
700120017002200270032003700
Wave number (cm-1)
Abs
.
1550 cm -1 (amide II)
1650 cm -1 (amide I)
Figure 7-1 ATR/FT-IR spectrum of a typical wheat flour dough following deconvolution
7.2.1 Amide I
The regions of amide I in the wheat flour dough (1600-1700 cm-1) are seen in Figure 7-1. The
assignment of this peak has been based upon the report by Lee and co-workers [178] The
peak for amide I is centred at around 1650 cm-1 Figure 7-1, although in this study it was
observed that the peak did shift to a lower frequency and sometimes to higher values
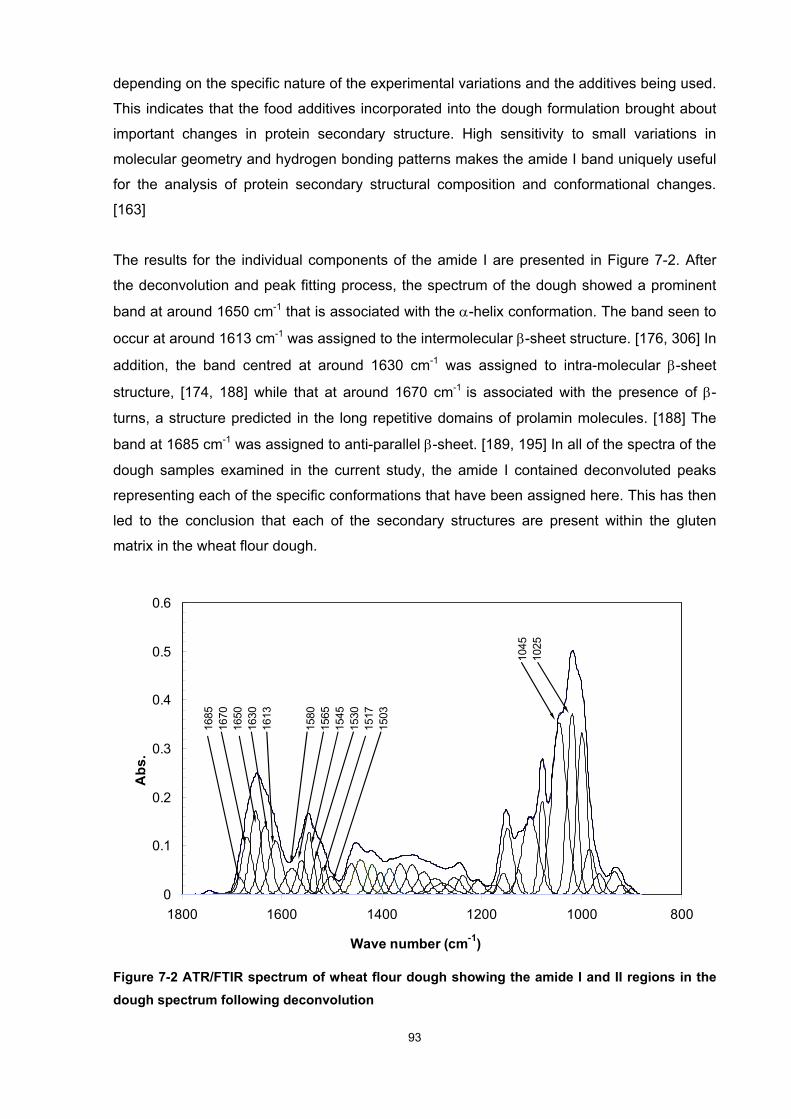
93
depending on the specific nature of the experimental variations and the additives being used.
This indicates that the food additives incorporated into the dough formulation brought about
important changes in protein secondary structure. High sensitivity to small variations in
molecular geometry and hydrogen bonding patterns makes the amide I band uniquely useful
for the analysis of protein secondary structural composition and conformational changes.
[163]
The results for the individual components of the amide I are presented in Figure 7-2. After
the deconvolution and peak fitting process, the spectrum of the dough showed a prominent
band at around 1650 cm-1 that is associated with the α-helix conformation. The band seen to
occur at around 1613 cm-1 was assigned to the intermolecular β-sheet structure. [176, 306] In
addition, the band centred at around 1630 cm-1 was assigned to intra-molecular β-sheet
structure, [174, 188] while that at around 1670 cm-1 is associated with the presence of β-
turns, a structure predicted in the long repetitive domains of prolamin molecules. [188] The
band at 1685 cm-1 was assigned to anti-parallel β-sheet. [189, 195] In all of the spectra of the
dough samples examined in the current study, the amide I contained deconvoluted peaks
representing each of the specific conformations that have been assigned here. This has then
led to the conclusion that each of the secondary structures are present within the gluten
matrix in the wheat flour dough.
0
0.1
0.2
0.3
0.4
0.5
0.6
80010001200140016001800
Wave number (cm-1)
Abs
.
1685
1670
1650
1630
1613
1580
1565
1545
1530
1517
1503
1045
1025
Figure 7-2 ATR/FTIR spectrum of wheat flour dough showing the amide I and II regions in the dough spectrum following deconvolution
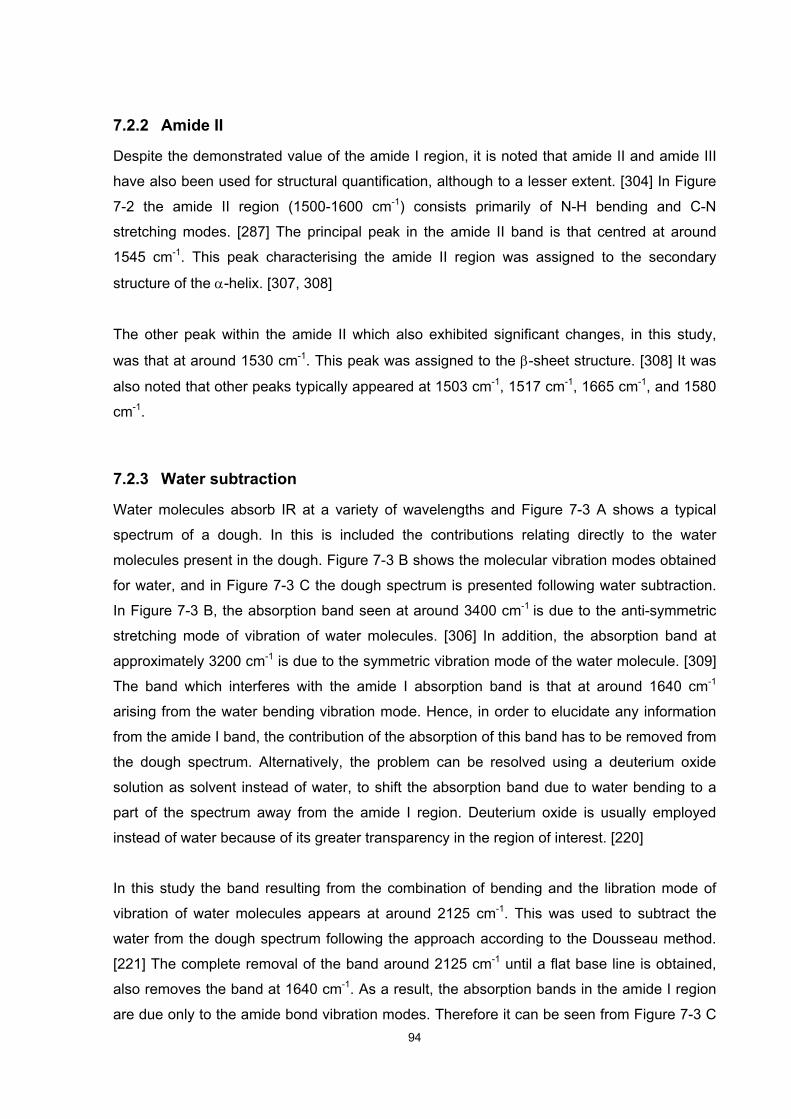
94
7.2.2 Amide II
Despite the demonstrated value of the amide I region, it is noted that amide II and amide III
have also been used for structural quantification, although to a lesser extent. [304] In Figure
7-2 the amide II region (1500-1600 cm-1) consists primarily of N-H bending and C-N
stretching modes. [287] The principal peak in the amide II band is that centred at around
1545 cm-1. This peak characterising the amide II region was assigned to the secondary
structure of the α-helix. [307, 308]
The other peak within the amide II which also exhibited significant changes, in this study,
was that at around 1530 cm-1. This peak was assigned to the β-sheet structure. [308] It was
also noted that other peaks typically appeared at 1503 cm-1, 1517 cm-1, 1665 cm-1, and 1580
cm-1.
7.2.3 Water subtraction
Water molecules absorb IR at a variety of wavelengths and Figure 7-3 A shows a typical
spectrum of a dough. In this is included the contributions relating directly to the water
molecules present in the dough. Figure 7-3 B shows the molecular vibration modes obtained
for water, and in Figure 7-3 C the dough spectrum is presented following water subtraction.
In Figure 7-3 B, the absorption band seen at around 3400 cm-1 is due to the anti-symmetric
stretching mode of vibration of water molecules. [306] In addition, the absorption band at
approximately 3200 cm-1 is due to the symmetric vibration mode of the water molecule. [309]
The band which interferes with the amide I absorption band is that at around 1640 cm-1
arising from the water bending vibration mode. Hence, in order to elucidate any information
from the amide I band, the contribution of the absorption of this band has to be removed from
the dough spectrum. Alternatively, the problem can be resolved using a deuterium oxide
solution as solvent instead of water, to shift the absorption band due to water bending to a
part of the spectrum away from the amide I region. Deuterium oxide is usually employed
instead of water because of its greater transparency in the region of interest. [220]
In this study the band resulting from the combination of bending and the libration mode of
vibration of water molecules appears at around 2125 cm-1. This was used to subtract the
water from the dough spectrum following the approach according to the Dousseau method.
[221] The complete removal of the band around 2125 cm-1 until a flat base line is obtained,
also removes the band at 1640 cm-1. As a result, the absorption bands in the amide I region
are due only to the amide bond vibration modes. Therefore it can be seen from Figure 7-3 C

95
that the peak at around 2125 cm-1 becomes a flat line and the amide I and II became more
fully resolved.
Another mode of water vibration is the libration mode of vibration, corresponding to a peak at
around 800 cm-1 which is due to reorientation of the water molecules in the hydrogen bonded
network. This is particularly sensitive to the dynamic properties of the water molecules. [310]
0
0.2
0.4
0.6
0.8
1
1.2
1.4
1.6
1.8
700120017002200270032003700
Wave number (cm-1)
Abs
.
(A)
(B)
(C)
Figure 7-3 ATR/FT-IR spectra following deconvolution for (A) dough before water subtraction, (B) water, and (C) dough after water subtraction.
7.2.4 Deconvolution
As shown in Figure 7-2 ATR/FT-IR spectra of the food samples and in particular the protein
amide I is composed of broad, overlapped bands. [309] Deconvolution is a resolution-
enhancement procedure used to resolve overlapped and hidden peaks. Its application to
ATR/FT-IR has made more detailed studies of globular proteins possible. [222] In the current
study deconvolution was carried out by assuming an initial Gaussian [85, 223, 311] line-
shape function for all the peaks. In order to measure the relative areas of the partially
resolved amide I and II components the deconvoluted spectra were curve fitted. Peak fit
version 4.12 software was used with the following settings: 63 filter, 9.57 and 0.05. The base
line perfectly matched within the section of the spectrum at 880-2580 cm-1 and this was
found to be a non-parametric base line with the data very closely matching the generated
spectrum. During the current study, all of the data for all the experiments was treated in the

96
same way. Dividing the sum of the areas of all components associated with the given
conformation, by the total amide I or II band, gives the relative area, which is used for the
data analysis in this study. This approach has been widely used by other researchers. [224]
7.3 The effect of oxidising agent
This study monitors all of the changes in dough structure that are reflected by their vibration
spectra. These include changes in protein secondary structure brought about by chemical
additives at various levels of addition, while simultaneously reflecting the changes in starch
regions as well as the amorphous and crystal structures of the dough spectrum. Figure 7-4
shows the effect of the addition of ascorbic acid at 300ppm level of addition on the dough.
0
0.1
0.2
0.3
0.4
0.5
0.6
80010001200140016001800
Wave number (cm-1)
Abs
.
1685
1670
1650
1630
1613
1580
1565
1545
1530
1503
1045
1025
Figure 7-4 Wheat flour dough spectrum with 300ppm ascorbic acid following deconvolution
The addition of ascorbic acid to the dough results in an increase in the relative area of inter-
molecular β-sheet (1613 cm-1), while the intra-molecular β-sheet (1630 cm-1) decreased. In
Figure 7-7 to Figure 7-11 the increase in the inter-molecular β-sheet type of structure was
due to the oxidation action of ascorbic acid on dough protein molecules, specifically the
oxidation of sulfhydryl during the dough mixing process. Ascorbic acid is rapidly oxidised by
atmospheric oxygen kneaded into the dough to give dehydroascorbic acid (DHA) and the
reaction is accelerated by the presence of the enzyme ascorbate oxidase (AOX), naturally
present in wheat flour. [91, 251, 312] The rate of this reaction during dough mixing is shown

97
in Figure 7-5. DHA is the cofactor of the enzyme glutathione dehydrogenase (GSH-DH) and
this enzyme oxidises the glutathione (GSH) naturally present in wheat flour to produce
disulfide linkages. [91, 312, 313] This reaction is linked to the baking quality of wheat flour
dough. [314-316] The results obtained here will be further related to the baking results in the
discussion presented in Chapter 7 of this thesis. The mechanism of the improver action of
ascorbic acid is illustrated in Figure 7-6 and the possible reaction involved is presented in
Table 7-1.
Figure 7-5 Oxidation of ascorbic acid to DHA during dough mixing [91]
Ascorbic acid DHA the sum of ascorbic acid and DHA
Figure 7-6 Representation of the improver action of ascorbic acid in the dough. [317]
The results indicate that the oxidation of sulfhydryl groups to the disulfide structure
strengthens the protein- protein interactions and since glutenin polymers are richer in β-sheet
structure than gliadins [188] the strengthening effect of ascorbic acid on the dough can be
related to the amount and involvement of glutenin.
Table 7-1 The possible reactions involved in the improver action of ascorbic acid [317]

98
Reactants Catalyst products
1 AA + ½ O2 AOX DHA + H2O
2 DHA + 2GSH GSH-DH AA + GSSG
3 PSH + GSSG → PSSG + GSH
4 GSH + PSSP → GSSP + PSH
5 GSH + CSSC → GSSC + CSH
6 CSH + PSSP → CSSP + PSH
7 PSH + CSSC → PSSC + CSH
Note: GSSG, oxidised glutathione; CSSC, cystine; CSH, cysteine; PSSP, gluten; PSSG,
gluten-bound glutathione; PSH, gluten sulfhydryl
151719212325272931
0 100 200 300 400
Ascorbic acid (ppm)
Rel
ativ
e ar
ea (%
)
1613 cm-1
1634 cm-1
1653 cm-1
1673 cm-1
Figure 7-7 The effect of various levels of ascorbic acid on amide I components
Note: Inter-molecular β-sheet 1613 cm-1, Intra-molecular β-sheet 1630 cm-1, α-helix 1653 cm-1,
and β-turn 1673 cm-1

99
00.5
11.5
22.5
33.5
44.5
5
0 100 200 300 400
Ascorbic acid (ppm)
Rel
ativ
e ar
ea (%
)1686 cm-1
1744 cm-1
Figure 7-8 The effect of various levels of ascorbic acid on amide I components Antiparallel β-
sheet 1686 cm-1, and C=O of ascorbic acid 1744 cm-1.
6
8
10
12
14
16
18
20
0 100 200 300 400
Ascorbic acid (ppm)
Rel
ativ
e ar
ea (%
)
1503 cm-1
1517 cm-1
Figure 7-9 The effect of ascorbic acid on amide II components, the peaks at 1503 cm-1, and 1517 cm-1.

100
-10
0
10
20
30
40
0 100 200 300 400
Ascorbic acid (ppm)
Rela
tive
area
(%) 1530 cm-1
1545 cm-1
Figure 7-10 The effect of ascorbic acid on amide II components, the peaks at 1530 cm-1, and 1545 cm-1.
101520253035404550
0 100 200 300 400
Ascorbic acid (ppm)
Rela
tive
area
(%)
1560 cm-1
1580 cm-1
Figure 7-11 The effect of ascorbic acid on amide II components 1560 cm-1, and 1580 cm-1.
7.4 The effect of reducing agent
The addition of the reducing agent L-cysteine to wheat flour dough at various levels also has
a substantial effect on the IR spectrum of the dough. Figure 7-12 shows the dough spectrum
following deconvolution and peak fitting. Both amide I and amide II components have
exhibited significant changes in relative area as a result of L-cysteine addition. These
changes were the opposite of those observed when ascorbic acid were added. In addition,
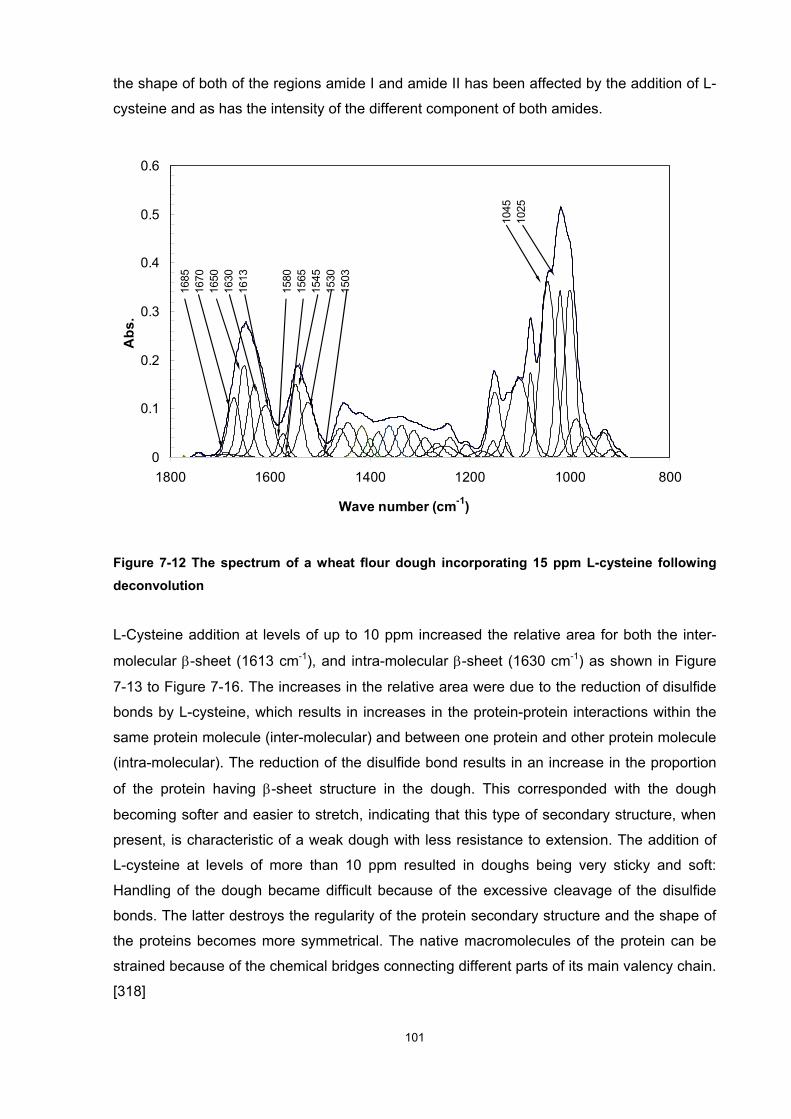
101
the shape of both of the regions amide I and amide II has been affected by the addition of L-
cysteine and as has the intensity of the different component of both amides.
0
0.1
0.2
0.3
0.4
0.5
0.6
80010001200140016001800
Wave number (cm-1)
Abs
.
1685
1670
1650
1630
1613
1580
1565
1545
1530
1503
1045
1025
Figure 7-12 The spectrum of a wheat flour dough incorporating 15 ppm L-cysteine following deconvolution
L-Cysteine addition at levels of up to 10 ppm increased the relative area for both the inter-
molecular β-sheet (1613 cm-1), and intra-molecular β-sheet (1630 cm-1) as shown in Figure
7-13 to Figure 7-16. The increases in the relative area were due to the reduction of disulfide
bonds by L-cysteine, which results in increases in the protein-protein interactions within the
same protein molecule (inter-molecular) and between one protein and other protein molecule
(intra-molecular). The reduction of the disulfide bond results in an increase in the proportion
of the protein having β-sheet structure in the dough. This corresponded with the dough
becoming softer and easier to stretch, indicating that this type of secondary structure, when
present, is characteristic of a weak dough with less resistance to extension. The addition of
L-cysteine at levels of more than 10 ppm resulted in doughs being very sticky and soft:
Handling of the dough became difficult because of the excessive cleavage of the disulfide
bonds. The latter destroys the regularity of the protein secondary structure and the shape of
the proteins becomes more symmetrical. The native macromolecules of the protein can be
strained because of the chemical bridges connecting different parts of its main valency chain.
[318]
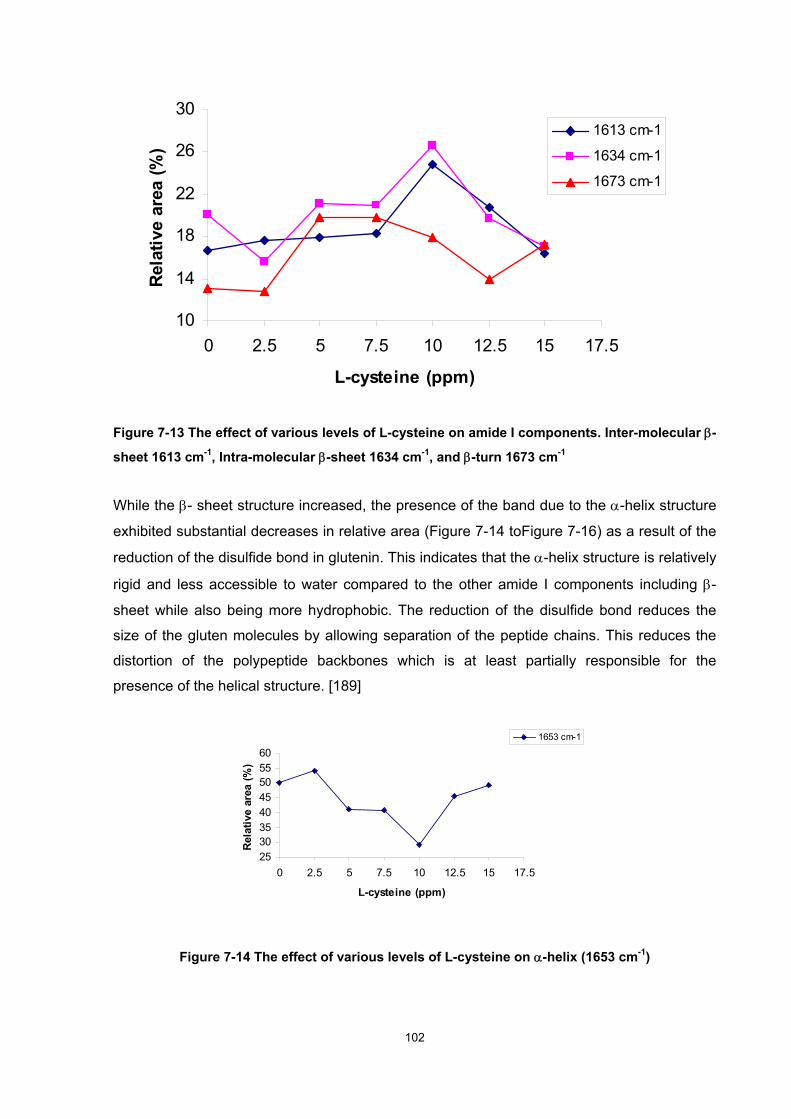
102
10
14
18
22
26
30
0 2.5 5 7.5 10 12.5 15 17.5
L-cysteine (ppm)
Rela
tive
area
(%)
1613 cm-1
1634 cm-1
1673 cm-1
Figure 7-13 The effect of various levels of L-cysteine on amide I components. Inter-molecular β-
sheet 1613 cm-1, Intra-molecular β-sheet 1634 cm-1, and β-turn 1673 cm-1
While the β- sheet structure increased, the presence of the band due to the α-helix structure
exhibited substantial decreases in relative area (Figure 7-14 toFigure 7-16) as a result of the
reduction of the disulfide bond in glutenin. This indicates that the α-helix structure is relatively
rigid and less accessible to water compared to the other amide I components including β-
sheet while also being more hydrophobic. The reduction of the disulfide bond reduces the
size of the gluten molecules by allowing separation of the peptide chains. This reduces the
distortion of the polypeptide backbones which is at least partially responsible for the
presence of the helical structure. [189]
2530354045505560
0 2.5 5 7.5 10 12.5 15 17.5
L-cysteine (ppm)
Rel
ativ
e ar
ea (%
)
1653 cm-1
Figure 7-14 The effect of various levels of L-cysteine on α-helix (1653 cm-1)

103
02468
10121416
0 2.5 5 7.5 10 12.5 15 17.5
L-cysteine (ppm)
Rel
ativ
e ar
ea (%
)
1494 cm-1
1567 cm-1
1580 cm-1
Figure 7-15 Effect of various levels of L-cyteine on amide II components (1494 cm-1, 1567 cm-1, and 1580 cm-1)
202530354045505560
0 2.5 5 7.5 10 12.5 15 17.5
L-Cysteine (ppm)
Rel
ativ
e ar
ea (%
)
1525 cm-1
1548 cm-1
Figure 7-16 Effect of various levels of L-cyteine on amide II components (1525 cm-1 and 1548 cm-1)
7.5 Conclusion
The modifications which were observed to occur in the chemical structure of the protein as a
result of the action of the food additives, corresponded with significant changes in the
rheological properties of the wheat flour doughs. This has been confirmed by the baking
experiments which will be discussed in Chapter 7 of this thesis which show that the changes
in protein secondary structure affect the baking performance of wheat flour dough.
From the studies reported in this chapter, FT-IR has been shown to provide an effective
means to monitor the protein-protein interactions, starch-protein interactions and disulfide

104
sulfhydryl interchange. These are the main elements that determine the overall dough
strength and therefore, processing characteristics of the dough.
105
8 8 Conclusions and recommendations for future research
8.1 Starch and α-amylase reaction
Throughout this study the technique of ATR/FT-IR has been utilised in studies of dough
processing and baking. The results clearly demonstrate that this is a useful approach which
can enhance our understanding of the changes occurring in a dough. ATR/FT-IR has been
applied to estimating and evaluating a number of components having significance in the
bread making process.
Firstly the technique has been utilised for the investigation of starch hydrolysis and also to
the qualitative measurement of sugars within the dough system. The kinetics of α-amylase
reaction with starch has been considered in two ways: by monitoring both the rate of
production of sugars in the reaction medium as well as by assessing the cleavage of the
glycosidic linkages in starch. The findings were that when various ingredients were
incorporated and the impact of processing conditions was evaluated, it was possible to
determine their impact upon the kinetics of the cleavage of the glycosidic linkage. These
effects could be readily monitored. Accordingly, the effects of dough ingredients on starch
were clearly seen. Correspondingly, structural changes in starch were monitored and these
were shown to be directly related to the period of time which had elapsed for the incubation
of starch in the dough with the α-amylase. These observations were also related to the intra-
and inter-molecular interactions accompanying the reaction catalysed by the enzyme α-
amylase. The various quality attributes of the end product in the form of bread loaves
produced from the doughs were measured and these included loaf volumes, crumb texture
and colour characteristics. The quality of the resultant loaves were strongly influenced by the
action of the enzyme and it was possible to effectively monitor the whole fermentation
process using ATR/FT-IR.

106
8.2 Protein secondary structure
Extensive research has previously been carried out on the role of protein components in the
formation of the gluten matrix and their significance in the development of desirable dough
characteristics for bread making. In this context there have been relatively few studies that
have been able to evaluate the relative significance of the recognised forms of protein
secondary structure. In addition, whilst it is recognised that bakery additives in the form of
dough conditioners can be used to manipulate dough and bread characteristics, the
application of ATR/FT-IR instrumentation to monitor these has not been reported.
A number of chemical additives significantly change the rheological properties of wheat flour
doughs and the baking experiments discussed in chapter 7 have significantly advanced our
knowledge of the use of ATR/FT-IR as a tool in this area of research. Changes in protein
secondary structure clearly affect the baking performance of wheat flour doughs. The
addition of the oxidising agent AsA results in a decrease in the relative area of the IR peaks
that reflect the interactions of the structure identified as reflecting the formation and presence
of inter-molecular β-sheets. The results indicate that the oxidation of sulfhydryl groups to
form disulfide linkages strengthens the protein-protein interactions. Since glutenin polymers
are known to be higher in β-sheet structures than gliadins, the results obtained in the current
study provide confirm that the strength effect shown to be associated with AsA incorporation
into the dough formulation are directly related to role of the glutenin component of the gluten-
forming proteins.
The results obtained in the current study are consistent with the developing understanding
that the overall strength of wheat flour doughs reflects the significance of three main
elements which are protein-protein interactions, starch-protein interactions as well as
disulfide-sulfhydryl interchange. ATR/FT-IR provides a useful means of comparing doughs
and studying the changes occurring during dough development and also as a result of
subsequent processing.
8.3 ATR/FT-IR and the interactions occurring during baking
Following the studies of doughs, a similar approach has been applied for a re-evaluation of
the interactions and the synergetic effect of ingredients during baking. Consistent with the
accumulated knowledge of baking systems, it has been demonstrated here that the
incorporation of α-amylase increases bread volume, and also serves to retard bread staling
while the addition of the reducing agent L-cysteine increases bread volume up until a certain
point has been reached, followed by a clear decrease in bread volume. Sodium chloride

107
levels in the baking formulation were shown to influence yeast growth and α-amylase action
on starch. The results show that, based upon the quality attributes measured in this study,
the optimum level of salt incorporation was found to be within the range of 1.6-1.8% based
on flour weight.
It was found that within the wheat flour doughs, the preparation with the addition of the
oxidising agent and reducing agent, both had a marked effect upon dough protein secondary
structure. This then affected the baking performance as reflected in the measured attributes
of baked loaves.
8.4 Recommendations for future research into wheat flour dough
It is generally accepted that wheat flour doughs are complex matrices and that a diverse
range of molecular components are probably interacting, thereby influencing the quality of
the products ultimately consumed as part of the diet throughout the world. Whilst the current
investigation provides novel results and establishes the potential and usefulness of the
approaches developed here, much remains to be done to extend the current results. Among
the additional work that can now be considered, the use of ATR/FT-IR warrants further
attention.
A number of components and interactions that were beyond the scope of this research
project, can now be considered as part of ongoing and future research. This has the potential
to extend the applications and usefulness of ATR/FT-IR in the processing of a variety of
foods made from cereal grains.
Firstly further investigation into the determination of the starch damage content of wheat flour
is recommended as the preliminary evidence reported here is promising. The peak identified
as being useful for this purpose and corresponding to damage starch in wheat flour doughs
is the peak occurring at 975 cm-1. During the current study this peak has been monitored in
conjunction with the assessment of the effect α-amylase on the relative area of this peak.
Clearly, future quantitative measurement of damaged starch should focus on this peak.
Another area recommend for ongoing studies is related to the effects of various levels of
addition of different baking ingredients. It is suggested that the impact of a range of bakery
ingredients be analysed regarding protein secondary structure as well as the activity of α-
amylase. Based upon the results reported in this thesis, the determination of α-amylase
activity in wheat flour by using ATR/FT-IR appears to be achievable. This might be done
108
either by monitoring the rate of production of the various sugar products in the dough
spectra, or alternatively by monitoring the cleavage of the glycosidic linkage. It will be useful
to compare these two approaches as a means of determining their relative suitability for
future adoption in routine analysis that might provide useful strategies for quality control and
assurance.
On the basis of the demonstration of the potential of vibrational spectroscopy instruments for
the study of wheat flour doughs, further work on disulfide interactions and their significance
are also recommended. Instruments including ATR/FT-IR as well as Raman spectroscopy
may well provide invaluable tools and information. In future studies the estimation of the
disulfide content of wheat flour dough might be explored. During the current work, both the
disulfide and sulfhydryl peaks appeared to be relatively weak in ATR/FT-IR. However these
may be more readily detected in Raman spectroscopy. Accordingly research in the area of
the disulfide-sulfhydryl interactions might usefully focus on the use of Raman spectroscopy
rather than using ATR/FT-IR. In the context of increasing evidence of the importance of
selenium in wheat flour doughs, along with the likelihood of links forming between the
seleno-amino acids, particularly selenocysteine in doughs, it is also possible that Raman
spectroscopy may be applied to this area as well.
8.5 Recommendations for future research in food products
The results from this study demonstrating that computer software that is able to effect
deconvolution of IR spectra obtained for dough samples, indicates that it may also be
possible to use this approach for other measurements. These may usefully include the
determination of a range of other components found in flours and doughs, as well as
extending to constituents of other grains and foods more generally.
As examples, the determination of ascorbic acid content in wheat flour and other food
products can probably be achieved by monitoring the vibration corresponding with C=O
stretch appearing at 1743cm-1 in the spectrum. In the study reported in this thesis, the peak
of this particular vibration is strong in the ATR/FT-IR spectra. In addition, the relative area of
this peak has been shown to have increased with increasing levels of addition of AsA in
wheat flour doughs.
The focus of this thesis has been upon the various peaks and aspects of starch and protein
components. In addition to these, it is likely that ATR/FT-IR can be evaluated and used to
study other food constituents including lipids and the non-starch polysaccharides in doughs,
the resultant products and other foods.

109
Another area of interest is in the peak identified as corresponding to O-H stretch specifically
of water at around 2800-3800 cm-1. This relates to the degree of hydration of the samples
and to that of the various components in foods which have varying affinities for water. Based
upon the observations made here, it is also likely that ATR/FT-IR can prove useful to future
studies of the hydration kinetics of food samples. It might be expected that this peak can be
used to study protein-water and starch-water interactions. Other groups of food components
are also involved in the competition for hydration. This region of the spectrum may provide
promising insights through the monitoring of changes occurring during processing and
storage.
Finally, whilst the results discussed here have necessarily been limited in scope, they do
demonstrate the potential of the approach described. Further work is now warranted and it is
sincerely hoped that what has already been achieved might stimulate further studies in this
area, thereby enhancing our understanding of dough systems as well as other foods, and
that this might ultimately lead to more effective ways of providing nutritious and appealing
food products in the future.

110
9 References 1. Singh, H., A study of changes in wheat protein during bread baking using SE-HPLC.
Food Chem., 2004. 90(1-2): p. 247-250. 2. Rosell, C.M., J.A. Rojas, and C. Benedito de Barber, Influence of hydrocolloids on
dough rheology and bread quality. Food Hydrocolloids, 2001. 15(1): p. 75-81. 3. Romano, A., et al., Description of leavening of bread dough with mathematical
modelling. Journal of Food Engineering, 2007. 83(2): p. 142-148. 4. Scanlon, M.G. and M.C. Zghal, Bread properties and crumb structure. Food
Research International, 2001. 34(10): p. 841-864. 5. Chin, N.L., P.J. Martin, and G.M. Campbell, Aeration During Bread Dough Mixing: I.
Effect of Direction and Size of a Pressure Step-change During Mixing on the Turnover of Gas. Food and Bioproducts Processing, 2004. 82(4): p. 261-267.
6. Martin, P.J., et al., Aeration During Bread Dough Mixing: III. Effect of Scale-up. Food and Bioproducts Processing, 2004. 82(4): p. 282-290.
7. Shimiya, Y. and T. Yano, Measurements of accompanying air, specific surface area and micropore volume of some flour particles. Agric. Biol. Chem., 1987. 51(1): p. 25-30.
8. Örnebro, J., T. Nylander, and A.C. Eliasson, Interfacial Behaviour of Wheat Proteins. J. Cereal Sci., 2000. 31(2): p. 195-221.
9. Every, D., et al., Predicting wheat quality - consequences of the ascorbic acid improver effect. J. Cereal Sci, 2008. 48(2): p. 339-348.
10. Vaclavik, V.A. and E.W. Christian, Fat and Oil Products, in Essentials of Food Science. 2008. p. 273-309.
11. Gould, J.T., Baking Around the World, in Technology of Breadmaking. 2007. p. 223-243.
12. Vaclavik, V.A. and E.W. Christian, Baked Products: Batters and Dough, in Essentials of Food Science. 2008. p. 351-378.
13. Cauvain, S.P., Breadmaking Processes, in Technology of Breadmaking. 2007. p. 21-49.
14. Kuktaite, R., H. Larsson, and E. Johansson, The Influence of Dough Mixing Time on Wheat Protein Composition and Gluten Quality for Four Commercial Flour Mixtures, in Wheat Production in Stressed Environments, H.T. Buck, J.E. Nisi, and N. Salomón, Editors. 2007, Springer Netherlands. p. 543-548.
15. Chiotellis, E. and G.M. Campbell, Proving of Bread Dough II: Measurement of Gas Production and Retention. Food and Bioproducts Processing, 2003. 81(3): p. 207-216.
16. Shah, P., et al., Proving of Bread Dough: Modelling the Growth of Individual Bubbles. Food and Bioproducts Processing, 1998. 76(2): p. 73-79.
17. io.uwinnipeg.ca/~simmons/16cm05/1116/16fungi.htm. 18. Mills, E.N.C., et al., Bubble Formation and Stabilization in Bread Dough. Food and
Bioproducts Processing, 2003. 81(3): p. 189-193. 19. Mondal, A. and A.K. Datta, Bread baking - A review. Journal of Food Engineering,
2008. 86(4): p. 465-474. 20. Zhang, L., et al., Effects of crust constraints on bread expansion and CO2 release.
Journal of Food Engineering, 2007. 80(4): p. 1302-1311. 21. Fan, J., J.R. Mitchell, and J.M.V. Blanshard, A model for the oven rise of dough
during baking. Journal of Food Engineering, 1999. 41(2): p. 69-77. 22. Hoseney et al., H., R.C., Sievert, D., Delcour, J.A.,, Bread and other baked products,
in Ullmann's Encyclopedia of Industrial Chemistry. 2008, Wiley-VCH Verlag: Weinheim, Germany.

111
23. Therdthai, N., W. Zhou, and T. Adamczak, Optimisation of the temperature profile in bread baking. Journal of Food Engineering, 2002. 55(1): p. 41-48.
24. Yamada, Y. and K.R. Preston, Effect of individual oxidants on oven rise and bread properties of Canadian short process bread. J. Cereal Sci., 1992. 15(3): p. 237-51.
25. Stathopoulos, C.E., et al., Effect of heat on rheology of gluten fractions from flours with different bread-making quality. J. Cereal Sci., 2006. 43(3): p. 322-330.
26. Patel, B.K., R.D. Waniska, and K. Seetharaman, Impact of different baking processes on bread firmness and starch properties in breadcrumb. J. Cereal Sci, 2005. 42(2): p. 173-184.
27. Bloksma, A.H., Effect of heating rate on viscosity of wheat flour doughs. Journal of Texture Studies, 1980. 10(3): p. 261-269.
28. Doublier, J.L., G. Llamas, and M. Le Meur, A rheological investigation of cereal starch pastes and gels. Effect of pasting procedures. Carbohydrate Polymers, 1987. 7(4): p. 251-275.
29. Wootton, M. and A. Bamunuarachchi, Application of Differential Scanning Calorimetry to Starch Gelatinization. II. Effect of Heating Rate and Moisture Level. Starch - Stärke, 1979. 31(8): p. 262-264.
30. Eliasson, A.C., Effect of Water Content on the Gelatinization of Wheat Starch. Starch - Stärke, 1980. 32(8): p. 270-272.
31. Goesaert, H., et al., Amylases and bread firming - an integrated view. J. Cereal Sci., 2009. 50(3): p. 345-352.
32. Jeanjean, M.F., R. Damidaux, and P. Feillet, Effect of heat treatment on protein solubility and viscoelastic properties of wheat gluten. Cereal Chem., 1980. 57(5): p. 325-31.
33. Morel, M.-H., A. Redl, and S. Guilbert, Mechanism of Heat and Shear Mediated Aggregation of Wheat Gluten Protein upon Mixing. Biomacromolecules, 2002. 3(3): p. 488-497.
34. Schofield, J.D., et al., The effect of heat on wheat gluten and the involvement of sulfydryl-disulfide interchange reactions. J. Cereal Sci., 1983. 1(4): p. 241-53.
35. Weegels, P.L., et al., Effects on gluten of heating at different moisture contents. II. Changes in physicochemical properties and secondary structure. J. Cereal Sci., 1994. 19(1): p. 39-47.
36. Purlis, E. and V.O. Salvadori, Bread browning kinetics during baking. Journal of Food Engineering, 2007. 80(4): p. 1107-1115.
37. Purlis, E. and V.O. Salvadori, Modelling the browning of bread during baking. Food Research International, 2009. 42(7): p. 865-870.
38. Zanoni, B., C. Peri, and D. Bruno, Modelling of browning kinetics of bread crust during baking. Lebensmittel-Wissenschaft und-Technologie, 1995. 28(6): p. 604-609.
39. Vanin, F.M., T. Lucas, and G. Trystram, Crust formation and its role during bread baking. Trends in Food Science & Technology, 2009. 20(8): p. 333-343.
40. Wählby, U. and C. Skjöldebrand, Reheating characteristics of crust formed on buns, and crust formation. Journal of Food Engineering, 2002. 53(2): p. 177-184.
41. Wagner, M.J., et al., Water transport in bread during baking. Journal of Food Engineering, 2007. 78(4): p. 1167-1173.
42. Whitford, D., Proteins: Structure and Function. 2005: John Wiley & Sons. 528. 43. http://bill.srnr.arizona.edu/classes/182/PeptideBond-HiRes.JPEG. 44. Amino Acids, Peptides, Proteins, in Food Chem. 2009. p. 8-92. 45. Dzwolak, W., M. Kato, and Y. Taniguchi, Fourier transform infrared spectroscopy in
high-pressure studies on proteins. Biochimica et Biophysica Acta (BBA) - Protein Structure and Molecular Enzymology, 2002. 1595(1-2): p. 131-144.
46. Vaclavik, V.A. and E.W. Christian, Proteins in Food: An Introduction, in Essentials of Food Science. 2008. p. 145-159.
47. Anon, Instant notes: biochemistry (3rd ed.) by Hames, David and Hooper. Biochem. Mol. Biol. Educ. . Vol. 34. 2006. 59-60.
48. Murray, R.K. and et al., Harper's Biochemistry. 24th Edition ed. 1996. 868 pp. 49. https://eapbiofield.wikispaces.com/Katie+Chapter+2?f=print.

112
50. http://en.wikibooks.org/wiki/Biochemistry/Proteins/The_chemistry_of_proteins. 51. Silberberg, M., Chemistry: The Molecular Nature of Matter and Change; 3rd Edition.
2002. 1062. 52. Kilgar, G.L., Fundamentals of Biochemistry. 1981. 380 pp. 53. Chen, H. and J. Skolnick, M-TASSER: an algorithm for protein quaternary structure
prediction. Biophys. J., 2008. 94(3): p. 918-928. 54. Bhagavan, N.V., Three-Dimensional Structure of Proteins, in Medical Biochemistry.
2002, Academic Press: San Diego. p. 51-65. 55. http://www.moleculesinmotion.com/protarch/page_helix/intro.html. 56. Murray, R.K., et al., Harper's Biochemistry 24th ed. Lange Series. 1996: Appleton &
Lange. 820pp. 57. Holum, J.R., Fundamentals of General, Organic, and Biological Chemistry, 6th
Edition. 1997. 880 pp. 58. Yu, X., C. Wang, and Y. Li, Classification of protein quaternary structure by functional
domain composition. BMC Bioinf., 2006. 7: p. No pp given. 59. http://academic.brooklyn.cuny.edu/biology/bio4fv/page/3d_prot.htm. 60. Greenwood, N.N. and A. Earnshaw, Chemistry of the Elements. 2nd Edition ed. 1997.
1542. 61. http://hyperphysics.phy-astr.gsu.edu/hbase/chemical/bond.html#c7. 62. http://www.microbelibrary.org/index.asp. 63. Ovaa, H. and A.N.M. Schumacher, Breaking noncovalent binding interactions in
multimeric proteins: dissociation of MHC-bound ligand through the use of light-sensitive or periodate sensitive group. 2006, (Het Nederlands Kanker Instituut, Neth.). Application: EP
EP. p. 19 pp. 64. Gaonkar, A.G., A. McPherson, and Editors, Ingredient Interactions: Effects on Food
Quality, Second Edition. [In: Food Sci. Technol. (Boca Raton, FL, U.S.); 2006, 154]. 2006. 554 pp.
65. Rao, M.V.R., M. Atreyi, and M.R. Rajeswari, Specific interactions between amino acid side chains - a partial molar volume study. Can. J. Chem., 1988. 66(3): p. 487-90.
66. Smith, B.C., Infrared Spectral Interpretation: A Systematic Approach. 1999. 200 pp (approx ).
67. George, W.O. and P.S. Mcintyre, infrared Spectroscopy. Analytical chemistry by open learning. 1987, New York: John Wiley &Sons. 537.
68. http://www.bbemg.ulg.ac.be/Images/UKondeelm.gif. 69. Hester, R., Handbook of Vibrational Spectroscopy, John Chalmers & Peter Griffiths
(eds). Chem. Ind. (London, U. K.). 2002. 23-24. 70. Harris, D.C. and M.D. Bertolucci, Symmetry and Spectroscopy. An Introduction to
Vibrational and Electronic Spectroscopy. 1989. 550 pp. 71. http://physics.schooltool.nl/irspectroscopy/theory.php. 72. Smith, A.L., Applied Infrared Spectroscopy: Fundamentals, Techniques, and
Analytical Problem Solving. 1979. 322 pp. 73. http://atropos.as.arizona.edu/aiz/teaching/a204/lecture1.html. 74. http://www.specialtyinspections.com/images/electro_clip_image003.gif. 75. Skoog, D.A., D.M. West, and F.J. Holler, Fundamentals of Analytical Chemistry. 5th
Ed. 1988. 894 pp. 76. Calton, E.F., Fourier Transform Infrared Spectrometry. 2nd Edition. P. R. Griffiths and
J. A. de Haseth, Eds. Appl. Spectrosc. . Vol. 61. 2007. 289A. 77. Griffiths, P.R., Fourier transform infrared spectrometry. Science ( N.Y.), 1983.
222(4621): p. 297-302. 78. Griffiths, P.R., Fourier Transform Infrared Spectrometry: Theory and Instrumentation,
in Transform Techniques in Chemistry, P.R. Griffiths, Editor. 1978, Plenum Publishing Corporation: New York. p. 109-39.
79. Davis, S.P., M.C. Abrams, and J.W. Brault, Fourier analysis, in Fourier Transform Spectrometry. 2001, Academic Press: San Diego. p. 41-66.

113
80. Nakamoto, K. and Editor, Infrared and Raman Spectra of Inorganic and Coordination Compounds, Part A: Theory and Applications in Inorganic Chemistry, Sixth Edition. 2009. 419 pp.
81. Davis, S.P., M.C. Abrams, and J.W. Brault, Introduction, in Fourier Transform Spectrometry. 2001, Academic Press: San Diego. p. 1-16.
82. http://spectroscopy.lbl.gov/FTIR-Martin/. 83. http://www.dliengineering.com/vibman/gloss_modeofvibration1.htm. 84. Durig, J.R., NATO Advanced Study Institute Series: Series C, Vol. 57: Analytical
Applications of FT-IR to Molecular and Biological Systems [Proceedings of the NATO Advanced Study Institute Held at Florence, Italy, August 31 to September 12, 1979]. 1980. 607 pp.
85. Barth, A., Infrared spectroscopy of proteins. Biochim. Biophys. Acta, Bioenerg., 2007. 1767(9): p. 1073-1101.
86. Goormaghtigh, E., V. Raussens, and J.-M. Ruysschaert, Attenuated total reflection infrared spectroscopy of proteins and lipids in biological membranes. Biochim. Biophys. Acta, Rev. Biomembr., 1999. 1422(2): p. 105-185.
87. http://www.spectroscopynow.com/coi/cda/detail.cda?id=18427&type=EducationFeature&chId=2&page=1.
88. Davila-El Rassi, G.M., et al., Studies of molecular association of glutenins and maltodextrin in solution by capillary electrophoresis. J. Liq. Chromatogr. Relat. Technol., 2003. 26(15): p. 2465-2479.
89. Roberts, T.A., et al., Cereals and cereal products: Micro-Organisms in Foods 6, in Micro-Organisms in Foods 6, T.A. Roberts, et al., Editors. 2005, Springer US. p. 392-439.
90. Autran, J.C., Recent perspectives on the genetics, biochemistry and functionality of wheat proteins. Trends in Food Science & Technology, 1993. 4(11): p. 358-64.
91. Belitz, H.-D., W. Grosch, and P. Schieberle, Cereals and Cereal Products, in Food Chemistry. 2009, Springer: Berlin p. 670-745.
92. Aminlari, M. and M. Majzoobi, Effect of chemical modification, pH change, and freezing on the rheological, solubility, and electrophoretic pattern of wheat flour proteins. J. Food Sci., 2002. 67(7): p. 2502-2506.
93. Sievert, D. and R.C. Hoseney, Wheat Types and their Uses in Bread and Other Baked Products. 2005, Wiley-VCH Verlag GmbH & Co. KGaA: Weinheim. p. 2.
94. Martin, D.J. and B.G. Stewart. in ASEAN Food J. 1994. 95. Matz, s.A., Wheat Ingredients, in Bakery Technology and Engineering, s.A. Matz,
Editor. 1992, Van Nostrand Reinhold: New York. p. 3. 96. James, M.G., K. Denyer, and A.M. Myers, Starch synthesis in the cereal endosperm.
Current Opinion in Plant Biology, 2003. 6(3): p. 215-222. 97. Manners, D.J., Recent developments in our understanding of amylopectin structure.
Carbohydr. Polym., 1989. 11(2): p. 87-112. 98. Copeland, L., et al., Form and functionality of starch. Food Hydrocolloids, 2009.
23(6): p. 1527-1534. 99. Zobel, H.F., Molecules to granules: a comprehensive starch review. Starch/Staerke,
1988. 40(2): p. 44-50. 100. Hannah, L., Starch Formation in the Cereal Endosperm, in Endosperm. 2007. p. 179-
193. 101. Goesaert, H., et al., Wheat flour constituents: how they impact bread quality, and how
to impact their functionality. Trends in Food Science & Technology, 2005. 16(1-3): p. 12-30.
102. Gibson, T.S., V.A. Solah, and B.V. McCleary, A procedure to measure amylose in cereal starches and flours with concanavalin A. J. Cereal Sci., 1997. 25(2): p. 111-119.
103. Lindeboom, N., P.R. Chang, and R.T. Tyler, Analytical, biochemical and physicochemical aspects of starch granule size, with emphasis on small granule starches: a review. Starch/Staerke, 2004. 56(3-4): p. 89-99.

114
104. Jenkins, P.J. and A.M. Donald, Gelatinisation of starch: a combined SAXS/WAXS/DSC and SANS study. Carbohydrate Research, 1998. 308(1-2): p. 133-147.
105. Perry, P.A. and A.M. Donald, The effect of sugars on the gelatinisation of starch. Carbohydr. Polym., 2002. 49(2): p. 155-165.
106. Crochet, P., et al., Starch crystal solubility and starch granule gelatinisation. Carbohydrate Research, 2005. 340(1): p. 107-113.
107. Parker, R. and S.G. Ring, Aspects of the Physical Chemistry of Starch. J. Cereal Sci, 2001. 34(1): p. 1-17.
108. Evers, A.D. and D.J. Stevens, Production and measurement of starch damage in flour. Part 4: Effect of starch damage on hot pasting properties. Starch/Staerke, 1988. 40(8): p. 297-9.
109. Weegels, P.L., R.J. Hamer, and J.D. Schofield, Functional properties of wheat glutenin. J. Cereal Sci., 1996. 23(1): p. 1-18.
110. Shewry, P.R., et al., The structure and properties of gluten: An elastic protein from wheat grain. Philos. Trans. R. Soc. London, Ser. B, 2002. 357(1418): p. 133-142.
111. Song, Y. and Q. Zheng, Dynamic rheological properties of wheat flour dough and proteins. Trends in Food Science & Technology, 2007. 18(3): p. 132-138.
112. Wellner, N., et al., Effect of selected hofmeister anions on the secondary structure and dynamics of wheat prolamins in gluten. Cereal Chem., 2003. 80(5): p. 596-600.
113. Shewry, P.R. and A.S. Tatham, Disulfide bonds in wheat gluten proteins. J. Cereal Sci., 1997. 25(3): p. 207-227.
114. Stauffer, C.E., Principles of Dough Formation in Technology of Breadmaking S.P.C.a.L.S. Young, Editor. 2007, Springer US. p. 299-332.
115. Wieser, H., Chemistry of gluten proteins. Food Microbiol., 2007. 24(2): p. 115-119. 116. Khatkar, B.S., et al., Functional Properties of Wheat Gliadins. II. Effects on Dynamic
Rheological Properties of Wheat Gluten. J. Cereal Sci., 2002. 35(3): p. 307-313. 117. Khatkar, B.S., A.E. Bell, and J.D. Schofield, The dynamic rheological properties of
glutens and gluten sub-fractions from wheats of good and poor bread making quality. J. Cereal Sci., 1995. 22(1): p. 29-44.
118. Sun, S., Y. Song, and Q. Zheng, Rheological behavior of heat-induced wheat gliadin gel. Food Hydrocolloids, 2008. 23(3): p. 1054-1056.
119. McCann, T.H., et al., Protein-lipid interactions in gluten elucidated using acetic acid fractionation. Food Chem., 2009. 115(1): p. 105-112.
120. Macritchie, F., The role of lipids in baking, in Lipids in Cereal Technology, P.J. Barnes, Editor. 1983, Academic Press: New York. p. 165-88.
121. Englyst, H.N., V. Anderson, and J.H. Cummings, Starch and non-starch polysaccharides in some cereal foods. J. Sci. Food Agric., 1983. 34(12): p. 1434-40.
122. Sasaki, T., T. Yasui, and J. Matsuki, Influence of non-starch polysaccharides isolated from wheat flour on the gelatinization and gelation of wheat starches. Food Hydrocolloids, 2000. 14(4): p. 295-303.
123. Rouau, X., M.L. El-Hayek, and D. Moreau, Effect of an enzyme preparation containing pentosanases on the bread-making quality of flours in relation to changes in pentosan properties. J. Cereal Sci., 1994. 19(3): p. 259-72.
124. Wang, M., et al., Interaction of Water Extractable Pentosans with Gluten Protein: Effect on Dough Properties and Gluten Quality. J. Cereal Sci., 2002. 36(1): p. 25-37.
125. Biliaderis, C.G., M.S. Izydorczyk, and O. Rattan, Effect of arabinoxylans on bread-making quality of wheat flours. Food Chem., 1995. 53(2): p. 165-71.
126. Labat, E., X. Rouau, and M.-H. Morel, Effect of flour water-extractable pentosans on molecular associations in gluten during mixing. Lebensm.-Wiss. Technol., 2002. 35(2): p. 185-189.
127. Wang, M., T. van Vliet, and R.J. Hamer, Evidence that pentosans and xylanase affect the re-agglomeration of the gluten network. J. Cereal Sci., 2004. 39(3): p. 341-349.
128. Singh, N., H. Singh, and M.S. Bakshi, Determining the distribution of ash in wheat using debranning and conductivity. Food Chem., 1998. 62(2): p. 169-172.

115
129. Peterson, C.J., V.A. Johnson, and P.J. Mattern, Influence of cultivar and environment on mineral and protein concentrations of wheat flour, bran, and grain. Cereal Chem., 1986. 63(3): p. 183-6.
130. Pateras, I.M.C., Bread Spoilage and Staling in Technology of Breadmaking, S.P.C.a.L.S. Young, Editor. 2007, Springer US. p. 275-298.
131. Armero, E. and C. Collar, Antistaling additive effects on fresh wheat bread quality. Food Sci. Technol. Int. (London), 1996. 2(5): p. 323-333.
132. Aamodt, A., E.M. Magnus, and E.M. Faergestad, Effect of flour quality, ascorbic acid, and DATEM on dough rheological parameters and hearth loaves characteristics. J. Food Sci., 2003. 68(7): p. 2201-2210.
133. Skaf, A., et al., A new acoustic technique to monitor bread dough during the fermentation phase Journal of Food Engineering, 2009. 93(3): p. 365-378.
134. Lin, H.-I., Using enzymes to improve frozen-dough bread quality, in Department of Grain Science and Industry. 2008, Kansas State University: Manhattan. p. 90.
135. Williams, T. and G. Pullen, Functional Ingredients, in Technology of Breadmaking. 2007. p. 51-91.
136. Charley, H., Food Science. 2nd Ed. 1982. 564 pp. 137. Stampfli, L. and B. Nersten, Emulsifiers in bread making. Food Chem., 1995. 52(4): p.
353-60. 138. Addo, K. and Y. Pomeranz, Effects of lipids and emulsifiers on alveograph
characteristics. Cereal Chem., 1992. 69(1): p. 6-12. 139. Mandala, I., A. Polaki, and S. Yanniotis, Influence of frozen storage on bread
enriched with different ingredients. Journal of Food Engineering, 2009. 92(2): p. 137-145.
140. Linko, Y.-Y., P. Javanainen, and S. Linko, Biotechnology of bread baking. Trends in Food Science & Technology, 1997. 8(10): p. 339-344.
141. Enzyme Kinetics, in Fundamentals of Biochemical Engineering. 2008. p. 8-49. 142. Arcot, J., A.K. Shrestha, and U. Gusanov, Enzyme protein binding assay for
determining folic acid in fortified cereal foods and stability of folic acid under different extraction conditions. Food Control. 13(4-5): p. 245-252.
143. Enzymes, in Food Chem. 2009. p. 93-157. 144. Poutanen, K., Enzymes: An important tool in the improvement of the quality of cereal
foods. Trends in Food Science & Technology, 1997. 8(9): p. 300-306. 145. Chaplin, M.F., C. Bucke, and Editors, Enzyme Technology. 1990. 264 pp. 146. Tucker, G.A., L.F.J. Woods, and Editors, Enzymes in Food Processing. 1995. 320 pp. 147. Whitehurst, R.J. and B.A. Law, Enzymes in Food Technology. 2002. 255 pp. 148. Wong, D. and Editor, Food Enzymes: Structure and Mechanism. 1995. 408 pp. 149. Reed, G. and Editor, Food Science and Technology Series: Enzymes in Food
Processing. 2nd Ed. 1975. 573 pp. 150. Christophersen, C. and D.E.O.B.E.N.S.C.T. Schäfer, Enzymatic Characterisation
Starch - Stärke, 1998. 50(1): p. 39-45. 151. Muralikrishna, G. and M. Nirmala, Cereal α-amylases - an overview. Carbohydrate
Polymers, 2005. 60(2): p. 163-173. 152. Goesaert, H., et al., Antifirming Effects of Starch Degrading Enzymes in Bread
Crumb. J. Agric. Food Chem, 2009. 57(6): p. 2346-2355. 153. Palacios, H.R., P.B. Schwarz, and B.L. D'Appolonia, Effect of α-Amylases from
Different Sources on the Retrogradation and Recrystallization of Concentrated Wheat Starch Gels: Relationship to Bread Staling. J. Agric. Food Chem, 2004. 52(19): p. 5978-5986.
154. Leman, P., et al., Maltogenic amylase has a non-typical impact on the molecular and rheological properties of starch. Carbohydr. Polym., 2005. 62(3): p. 205-213.
155. Jeffries, T.W., Biochemistry and genetics of microbial xylanases. Curr. Opin. Biotechnol., 1996. 7(3): p. 337-342.
156. Eliasson, A.C., Starch gelatinization in the presence of emulsifiers. A morphological study of wheat starch. Starch/Staerke, 1985. 37(12): p. 411-15.

116
157. Ghiasi, K., R.C. Hoseney, and E. Varriano-Marston, Gelatinization of wheat starch. I. Excess-water systems. Cereal Chem., 1982. 59(2): p. 81-5.
158. Azizi, M.H. and G.V. Rao, Effect of storage of surfactant gels on the bread making quality of wheat flour. Food Chem., 2004. 89(1): p. 133-138.
159. Kamel, B.S. and R. Hoover, Production of bread using sodium stearoyl lactylate as a replacement for shortening. Food Res. Int., 1992. 25(4): p. 285-8.
160. Byler, D.M. and H. Susi, Examination of the secondary structure of proteins by deconvolved FTIR spectra. Biopolymers, 1986. 25(3): p. 469-487.
161. Elliott A, A.E., structure of synthetic polypeptides. nature, 1950. 165: p. 921-922. 162. Krimm S, B.J., vibrational spectroscopy and conformation of peptides, polypeptides,
and proteins. advance protein chemistry, 1986. 38: p. 181-364. 163. Kong, J. and S. Yu, Fourier Transform Infrared Spectroscopic Analysis of Protein
Secondary Structures. Acta Biochimica et Biophysica Sinica, 2007. 39(8): p. 549–559.
164. Hind, A.R., S.K. Bhargava, and A. McKinnon, At the solid/liquid interface: FTIR/ATR the tool of choice. Advances in Colloid and Interface Science, 2001. 93(1-3): p. 91-114.
165. Fink, D.J. and R.M. Gendreau, Quantitative surface studies of protein adsorption by infrared spectroscopy : I. Correction for bulk concentrations. Analytical Biochem, 1984. 139(1): p. 140-148.
166. Maréchal, Y., Interaction configurations of H2O molecules in a protein (Stratum Corneum) by infrared spectrometry journal of molecular structure, 1997. 416(1-3): p. 133-143.
167. Grdadolnik, J. and Y. Maréchal, Bovine Serum Albumin Observed by Infrared Spectrometry.I. Methodology, Structural Investigation, and Water Uptake. Biopolymers (Biospectroscopy), 2001. 62: p. 40-53.
168. Grdadolnik, J. and Y. Maréchal, Biopolymers (Biospectroscopy), 2001. 62: p. 40-53. 169. Krimm, S., J. Mol. Biol, 1962. 4: p. 528–540. 170. Jackson, M. and C.H.H. Mantsch, J. Chem., 1991. 69: p. 1639–1642. 171. Besset, F., J. Spectr, 1975. 20: p. 126-136. 172. Arrondoa, J.L.R. and F.M. Goni, Structure and dynamics of membrane proteins as
studied by infrared spectroscopy. Progress in Biophysics and Molecular Biology, 1999. 72: p. 367–405.
173. Grdadolnik, J., Saturation effects in FTIR spectroscopy: intensity of amide I and amide II bands in protein spectra. Acta Chim. Slov., 2003. 50(4): p. 777-788.
174. Surewicz, W.K. and H.H. Mantsch, New insight into protein secondary structure from resolution-enhanced infrared spectra. Biochimica et Biophysica Acta (BBA) - Protein Structure and Molecular Enzymology, 1988. 952: p. 115-130.
175. Jackson, M. and H.H. Mantsch, Protein secondary structure from FT-IR spectroscopy: correlation with dihedral angles from three-dimensional Ramachandran plots. Can. J. Chem., 1991. 69(11): p. 1639-42.
176. Bandekar, J., Amide modes and protein conformation. Biochim Biophys Acta., 1992. 1120(2): p. 123-43.
177. Grdadolnik, J. and Y. Marechal, Infrared difference spectroscopy Part II. Spectral Decomposition. Vibrational Spectroscopy, 2003. 31(2): p. 289-294.
178. Lee, D.C., et al., Determination of protein secondary structure using factor analysis of infrared spectra. Biochemistry., 1990. 29(39): p. 9185-93.
179. Dousseau, F. and M. Pezolet, Determination of the secondary structure content of proteins in aqueous solutions from their amide I and amide II infrared bands. Comparison between classical and partial least-squares methods. Biochemistry, 1990. 29(37): p. 8771-9.
180. Susi, H. and D.M. Byler, Fourier transform infrared study of proteins with parallel beta -chains. Arch. Biochem. Biophys., 1987. 258(2): p. 465-9.
181. Byaruhanga, Y.B., et al., Alteration of kafirin and kafirin film structure by heating with microwave energy and tannin complexation. J. Agric. Food Chem., 2006. 54(12): p. 4198-4207.

117
182. Lefevre, T. and M. Subirade, Structural and interaction properties of beta -lactoglobulin as studied by FTIR spectroscopy. Int. J. Food Sci. Technol., 1999. 34(5/6): p. 419-428.
183. Purcell, J.M. and H. Susi, Solvent denaturation of proteins as observed by resolution-enhanced Fourier transform infrared spectroscopy. J. Biochem. Biophys. Methods, 1984. 9(3): p. 193-9.
184. Dong, A., P. Huang, and W.S. Caughey, Protein secondary structures in water from second-derivative amide I infrared spectra. Biochemistry, 1990. 29(13): p. 3303-8.
185. Lin, S.-Y., et al., Effect of ethanol or/and captopril on the secondary structure of human serum albumin before and after protein binding. Eur. J. Pharm. Biopharm., 2004. 57(3): p. 457-464.
186. Cui, F.Z., et al., Irradiation effects on secondary structure of protein induced by keV ions. Radiat. Phys. Chem., 2001. 60(1-2): p. 35-38.
187. Robertson, G.H., K.S. Gregorski, and T.K. Cao, Changes in secondary protein structures during mixing development of high absorption (90%) flour and water mixtures. Cereal Chem., 2006. 83(2): p. 136-142.
188. Popineau, Y., et al., A study by infrared spectroscopy of the conformations of gluten proteins differing in their gliadin and glutenin compositions. J. Cereal Sci., 1994. 20(1): p. 15-22.
189. Mejri, M., et al., Effects of some additives on wheat gluten solubility: A structural approach. Food Chem., 2005. 92(1): p. 7-15.
190. Servaty, R., et al., Hydration of polymeric components of cartilage - an infrared spectroscopic study on hyaluronic acid and chondroitin sulfate. Int. J. Biol. Macromol., 2001. 28(2): p. 121-127.
191. Starzak, M. and M. Mathlouthi, Cluster composition of liquid water derived from laser-Raman spectra and molecular simulation data. Food Chem., 2003. 82(1): p. 3-22.
192. Rueegg, M. and H. Haeni, Infrared spectroscopy of the water vapor sorption process of caseins. Biochim. Biophys. Acta, Protein Struct., 1975. 400(1): p. 17-23.
193. Subirade, M., et al., Molecular basis of film formation from a soybean protein: comparison between the conformation of glycinin in aqueous solution and in films. Int. J. Biol. Macromol., 1998. 23(4): p. 241-249.
194. Seabourn, B.W., F. Xie, and O.K. Chung, Rapid determination of dough optimum mixing time for early generation wheat breeding lines using FT-HATR infrared spectroscopy. Crop Sci., 2008. 48(4): p. 1575-1578.
195. Georget, D.M.R. and P.S. Belton, Effects of Temperature and Water Content on the Secondary Structure of Wheat Gluten Studied by FTIR Spectroscopy. Biomacromolecules, 2006. 7(2): p. 469-475.
196. Belton, P.S., et al., FTIR and NMR studies on the hydration of a high-Mr subunit of glutenin. Int. J. Biol. Macromol., 1995. 17(2): p. 74-80.
197. Secundo, F. and N. Guerrieri, ATR-FT/IR Study on the Interactions between Gliadins and Dextrin and Their Effects on Protein Secondary Structure. J. Agric. Food Chem., 2005. 53(5): p. 1757-1764.
198. Agrawal, M., et al., Hydrolysis of starch by amylase from Bacillus sp. KCA102: a statistical approach. Process Biochem. (Oxford, U. K.), 2005. 40(7): p. 2499-2507.
199. Goodfellow, B.J. and R.H. Wilson, A Fourier transform IR study of the gelation of amylose and amylopectin. Biopolymers, 1990. 30(13-14): p. 1183-9.
200. Kacurakova, M. and M. Mathlouthi, FTIR and laser-Raman spectra of oligosaccharides in water: characterization of the glycosidic bond. Carbohydr. Res., 1996. 284(2): p. 145-157.
201. Schuster, K.C., et al., On-line FT-Raman spectroscopic monitoring of starch gelatinisation and enzyme catalysed starch hydrolysis. Vibrational Spectroscopy, 2000. 22(1-2): p. 181-190.
202. Boussarsar, H., B. Rogé, and M. Mathlouthi, Physico-chemical Approach of the Amylolytic Action Pattern of a Thermostable Amylopullulanase Food Biophysics, 2007. Volume 2(2-3): p. 100-107.

118
203. Kacurakova, M. and R.H. Wilson, Developments in mid-infrared FT-IR spectroscopy of selected carbohydrates. Carbohydr. Polym., 2001. 44(4): p. 291-303.
204. Sekkal, M., et al., Investigation of the glycosidic linkages in several oligosaccharides using FT-IR and FT Raman spectroscopies. J. Mol. Struct., 1995. 349: p. 349-52.
205. Copikova, J., et al., Influence of hydration of food additive polysaccharides on FT-IR spectra distinction. Carbohydr. Polym., 2006. 63(3): p. 355-359.
206. Sevenou, O., et al., Organisation of the external region of the starch granule as determined by infrared spectroscopy. Int J Biol Macromol, 2002. 31(1-3): p. 79-85.
207. Hancock, R.D. and B.J. Tarbet, The other double helix - the fascinating chemistry of starch. J. Chem. Educ., 2000. 77(8): p. 988-992.
208. Cael, J.J., J.L. Koenig, and J. Blackwell, Infrared and Raman spectroscopy of carbohydrates. VI. Normal coordinate analysis of V-amylose. Biopolymers, 1975. 14(9): p. 1885-903.
209. Cael, J.J., et al., Infrared and Raman spectroscopy of carbohydrates. V. Normal coordinate analysis of cellulose I. J. Chem. Phys., 1975. 62(3): p. 1145-53.
210. Cael, J.J., J.L. Koenig, and J. Blackwell, Infrared and Raman spectroscopy of carbohydrates. IV. Identification of configuration-and conformation-sensitive modes for D-glucose by normal coordinate analysis. Carbohyd. Res., 1974. 32(1): p. 79-91.
211. Cael, J.J., J.L. Koenig, and J. Blackwell, Infrared and Raman spectroscopy of carbohydrates. III. Raman spectra of the polymorphic forms of amylose. Carbohyd. Res., 1973. 29(1): p. 123-34.
212. Vasko, P.D., J. Blackwell, and J.L. Koenig, Infrared and Raman Spectroscopy of carbohydrates. II. Normal coordinate analysis of alpha -D-glucose. Carbohyd. Res., 1972. 23(3): p. 407-16.
213. Xie, X., Q. Liu, and S.W. Cui, Studies on the granular structure of resistant starches (type 4) from normal, high amylose and waxy corn starch citrates. Food Res. Int., 2006. 39(3): p. 332-341.
214. Wolkers, W.F., et al., A Fourier-transform infrared spectroscopy study of sugar glasses. Carbohydr. Res., 2004. 339(6): p. 1077-1085.
215. van Soest, J.J.G., et al., Short-range structure in (partially) crystalline potato starch determined with attenuated total reflectance Fourier-transform IR spectroscopy. Carbohydr. Res., 1995. 279: p. 201-14.
216. Rubens, P., et al., In situ observation of pressure-induced gelation of starches studied with FTIR in the diamond anvil cell. Carbohydr. Polym., 1999. 39(3): p. 231-235.
217. Wilson, R.H. and P.S. Belton, A Fourier-transform infrared study of wheat starch gels. Carbohydr. Res., 1988. 180(2): p. 339-44.
218. Smits, A.L.M., et al., Aging of starch based systems as observed with FT-IR and solid state NMR spectroscopy. Starch/Staerke, 1998. 50(11-12): p. 478-483.
219. www.landfood.ubc.ca/.../301/water/waterq5.htm. 220. Susi, H. and D.M. Byler, Protein structure by Fourier transform infrared spectroscopy:
second derivative spectra. Biochemical and Biophysical Research Communications, 1983. 115(1): p. 391-7.
221. Dousseau, F., M. Therrien, and M. Pezolet, On the spectral subtraction of water from the FT-IR spectra of aqueous solutions of proteins. Applied Spectroscopy, 1989. 43(3): p. 538-42.
222. Byler, D.M. and H. Susi, Examination of the secondary structure of proteins by deconvolved FTIR spectra. Biopolymers, 1986. 25(3): p. 469-87.
223. Barilaro, D., et al., FT-IR absorbance spectroscopy to study Sicilian "proto-majolica" pottery. Vibrational Spectroscopy, 2008. 48(2): p. 269-275.
224. Byler, D.M., J.N. Brouillette, and H. Susi, Quantitative studies of protein structure by FT-IR spectral deconvolution and curve fitting. Spectroscopy (Duluth, MN, United States), 1986. 1(3): p. 29-32.
225. Farvili, N., C.E. Walker, and J. Qarooni, Effects of Emulsifiers on Pita Bread Quality. j. cereal sci, 1995. 21(3): p. 301-308.

119
226. Gomez, M., et al., Functionality of different emulsifiers on the performance of breadmaking and wheat bread quality. Eur. Food Res. Technol., 2004. 219(2): p. 145-150.
227. Iorga, E., et al., Synergistic effect of bacterial and fungal amylases on breadmaking. Roum. Biotechnol. Lett., 2003. 8(1): p. 1129-1138.
228. Sanz Penella, J.M., C. Collar, and M. Haros, Effect of wheat bran and enzyme addition on dough functional performance and phytic acid levels in bread. J.Cereal Sci, 2008. 48(3): p. 715-721.
229. Z.Gan, Gas Cell stabilization and Gas Retention in Wheat Bread Dough. journal of cereal science, 1994. 21: p. 215-230.
230. Kim, Y.-R. and P. Corni, Effects of temperature and mixing time on molecular mobility in wheat dough. LWT - Food Science and Technology, 2001. 34(7): p. 417-423.
231. K. Wehrle, H.G., E. K. Arendt and Effects of Lactic Acid, Acetic Acid, and Table Salt on Fundamental Rheological Properties of Wheat Dough
Cereal Chemistry, 1997. 74(6): p. 739-744. 232. Hoseney, R.C., Principals of Cereal Science and Technology. St:paulAmerican
Association of Cereal Chemists, 1986: p. 205-206. 233. Gujral, H.S.a.N.S., Effect of additives on dough development, gaseous release and
bread making properties. Food Research International, 2000. 32(10): p. 691-697. 234. Kim, Y.-R. and P. Cornillon, Effects of temperature and mixing time on molecular
mobility in wheat dough. Lebensmittel-Wissenschaft und -Technologie, 2001. 34(7): p. 417-423.
235. Seetharaman, K., N. Yao, and M.K. Rout, Role of water in pretzel dough development and final product quality. Cereal Chemistry, 2004. 81((3)): p. 336-340.
236. R., O.J., measurement of flour color in color space parameters. Cereal Chemistry, 1992. 69(5): p. 546-551.
237. Jooyandeh, H., African Journal of Food Science., 2009. 3(2): p. 028-034. 238. Owen, R.F., Food chemistry, ed. r. ed. 1996, New York: Marcel Dekker. 239. Purlis, E. and V.O. Salvadori, Bread browning kinetics during baking. Journal of Food
Engineering, 2007. 80(4): p. 1107–1115. 240. Bollain, C., A. Angioloni, and C. Collar, Relationships between dough and bread
viscoelastic properties in enzyme supplemented wheat samples. Journal of Food Engineering, 2006. 77(3): p. 665-671.
241. Zanoni, B., C. Peri, and D. Bruno, Modeling of browning kinetics of bread crust during baking. Food Science & Technology (London), 1995. 28(6): p. 604-9.
242. http://www.lallemand.com/BakerYeastNA/eng/PDFs/LBU%20PDF%20FILES/1_7REDUC.PDF. 2006 [cited 1.
243. HOSENEY, W.D.R.C., Effect of Certain Bread Making Oxidants and Reducing Agents on Dough Rheological Properties. Cereal Chem, 1995. 72(1): p. 58-64.
244. Aminlari, M. and M. Majzoobi, Effect ofChemical Modification, pH change, and Freezing on the Rheological,Solubility,and Electrophoretic Pattern of Wheat Flour Proteins. Journal of Food Science, 2002. 67(7): p. 2502-2506.
245. Koh, B.-K., G.-C. Lee, and S.-T. Lim, Effect of Amino Acids and Peptides on Mixing and Frozen Dough Properties of Wheat flour. journal of cereal science, 2005. 70(6): p. 359-364.
246. Horvat, R.J., H. Ng, and J. Pence, Amino acids in fermented bread doughs. journal of cereal science, 1962. 27: p. 583-586.
247. Hoseney, J.M.F.a.R.C., the Viscoelastic properties of wheat flour dough, in Dough Rheology and Baked Product Texture, H.A. Faridi, Editor. 1989, Chapman & Hall: New York. p. 29-66.
248. Ravi, R., R.S. Manohar, and P.H. Rao, Influence of additives on the rheological characteristics and baking quality of wheat flours. Eur. Food Res. Technol., 2000. 210(3): p. 202-208.
249. Lambert, I.A. and J.L. Kokini, Effect of L-cysteine on the rheological properties of wheat flour. Cereal Chem., 2001. 78(3): p. 226-230.

120
250. Jalaludin Qarooni, M.W., Graham McMaster, Factors affecting the quality of Arabic bread - additional ingredients. J Agric Food Chem, 1989. 48(2): p. 235-244.
251. Hruskova, M. and D. Novotna, Effect of ascorbic acid on the rheological properties of wheat fermented dough. Czech J. Food Sci., 2003. 21(4): p. 137-144.
252. Dong, W. and R.C. Hoseney, Effects of certain breadmaking oxidants and reducing agents on dough rheological properties. Cereal Chem., 1995. 72(1): p. 58-64.
253. Rodriguez-Mateos, A., et al., Formation of dityrosine cross-links during breadmaking. J Agric Food Chem, 2006. 54(7): p. 2761-6.
254. Grant, D.R., Role of ascorbic acid in chemical dough development. I. Reaction of ascorbic acid with flour-water suspensions. Cereal Chem., 1974. 51(5): p. 684-92.
255. Suarez-Luque, S., et al., Different forms of maleic and fumaric acids (cis and trans of 2-butenedioic acid) in honey. Food Chem., 2002. 80(2): p. 215-219.
256. Moresi, M., et al., Optimization of fumaric acid production from potato flour by Rhizopus arrhizus. Applied Microbiology and Biotechnology, 1991. 36(1): p. 35-39.
257. Francis, J.J. and Editor, Wiley Encyclopedia of Food Science and Technology, Second Edition, 4-Volume Set. 1999. 3840 pp.
258. Schroeder, L.F. and R.C. Hoseney, Mixograph studies. II. Effect of activated double-bond compounds on dough-mixing properties. Cereal Chem., 1978. 55(3): p. 348-60.
259. http://www.bartek.ca/pdfs/BulletinsFumaric/Bartek%20Fumaric%20Acid%20in%20Wheat%20and%20Corn%20Flour%20Tortillas.pdf.
260. http://www.bartek.ca/pdfs/BulletinsFumaric/Technical%20Bulletin%20Fumaric%20Acid%20in%20Wheat%20Flour%20Tortillas.pdf.
261. Matz, S.P.-T.I., USA), ingredients from wheat, in Bakery Technology and Engineering. March 1992, Kluwer Academic Publishers Group. p. 10.
262. Haros, M., C.M. Rosell, and C. Benedito, Effect of different carbohydrases on fresh bread texture and bread staling. Eur. Food Res. Technol., 2002. 215(5): p. 425-430.
263. Curic, D., J. Dugum, and I. Bauman, The influence of fungal alpha -amylase supplementation on amylolytic activity and baking quality of flour. Int. J. Food Sci. Technol., 2002. 37(6): p. 673-680.
264. Martinez-Anaya, M.A. and T. Jimenez, Functionality of enzymes that hydrolyze starch and non-starch polysaccharide in breadmaking. Z. Lebensm.-Unters. Forsch. A, 1997. 205(3): p. 209-214.
265. Sievert, D., R.C. Hoseney, and J.A. Delcour, Starch, in bread and other baked products. 2007, Wiley-VCH Verlag GmbH & Co. KGaA. p. 7.
266. Doğan, İ.S., Effect of α-amylases on dough properties during Turkish hearth bread production. Int. J. Food Sci. Technol., 2003. 38(2): p. 209-216.
267. Jòzef, S., The Use of Starch Processing Enzymes in the Food Industry in Industrial Enzymes, J.P.a.A.P. MacCabe, Editor. 2007, Springer Netherlands. p. 19-34.
268. Sievert, D., R.C. Hoseney, and J.A. Delcour, Flavour of baked products, in bread and other baked products. 2007, Wiley-VCH Verlag GmbH & Co. KGaA. p. 28.
269. Hassan Ahmadi Gavilighi, M.H.A., Mohsen Barzegar and Majid Arab Ameri, Effect of Selected Hydrocolloids on Bread Staling as Evaluated by DSC and XRD. Journal of Food Technology, 2006. 4(3): p. 185-188.
270. Fiszman, S.M., A. Salvador, and P. Varela, Methodological developments in bread staling assessment: application to enzyme-supplemented brown pan bread Eur. Food Res. Technol., 2005. 221(5 ): p. 613-623.
271. Eliasson, A.-C., M. Gudmundsson, and G. Svensson, Thermal behaviour of wheat starch in flour -- Relation to flour quality. LWT - Food Science and Technology, 1995. 28(2): p. 227-235.
272. van der Maarel, M.J.E.C., et al., Properties and applications of starch-converting enzymes of the [alpha]-amylase family. Journal of Biotechnology, 2002. 94(2): p. 137-155.

121
273. Mitsuiki, S., et al., Comparative characterization of raw starch hydrolyzing [alpha]-amylases from various Bacillus strains. Enzyme and Microbial Technology, 2005. 37(4): p. 410-416.
274. Tester, R.F., T. Patel, and S.E. Harding, Damaged starch characterisation by ultracentrifugation. Carbohydrate Research, 2006. 341(1): p. 130-137.
275. Miralbes, C., Quality control in the milling industry using near infrared transmittance spectroscopy. Food Chem, 2004. 88(4): p. 621-628.
276. Mirabella, F.M., Internal reflection spectroscopy : theory and applications Practical spectroscopy series. 1993, New York Marcel Dekker. 374.
277. Sammon, C., et al., The application of attenuated total reflectance Fourier transform infrared spectroscopy to monitor the concentration and state of water in solutions of a thermally responsive cellulose ether during gelation. Polymer, 2006. 47(2): p. 577-584.
278. Öhman, M., D. Persson, and C. Leygraf, In situ ATR-FTIR studies of the aluminium/polymer interface upon exposure to water and electrolyte. Progress in Organic Coatings, 2006. 57(1): p. 78-88.
279. van Velzen, E.J.J., et al., Factors associated with dough stickiness as sensed by attenuated total reflectance infrared spectroscopy. Cereal Chem, 2003. 80(4): p. 378-382.
280. Iizuka, K. and T. Aishima, Starch gelation process observed by FT-IR/ATR spectrometry with multivariate data analysis. J. Food Sci, 1999. 64(4): p. 653-658.
281. Schindler, R., B. Lendl, and R. Kellner, Simultaneous determination of [alpha]-amylase and amyloglucosidase activities using flow injection analysis with fourier transform infrared spectroscopic detection and partial least-squares data treatment. Analytica Chimica Acta, 1998. 366(1-3): p. 35-43.
282. Bellon-Maurel, V., C. Vallat, and D. Goffinet, Quantitative analysis of individual sugars during starch hydrolysis by FT-IR/ATR spectrometry. Part II: Influence of external factors and wavelength parameters. Applied Spectroscopy, 1995. 49(5): p. 563-8.
283. Kapusniak, J. and P. Siemion, Thermal reactions of starch with long-chain unsaturated fatty acids. Part 2. Linoleic acid. Journal of Food Engineering, 2006. 78(1): p. 323-332.
284. Mondal, K., A. Sharma, and M.N. Gupta, Three phase partitioning of starch and its structural consequences. Carbohydrate Polymers, 2004. 56(3): p. 355-359.
285. van Staden, J.F. and L.V. Mulaudzi, Flow injection spectrophotometric assay of a-amylase activity. Analytica Chimica Acta, 2000. 421(1): p. 19-25.
286. Athawale, V.D. and V. Lele, Thermal studies on granular maize starch and its graft copolymers with vinyl monomers. Starch/Staerke, 2000. 52(6-7): p. 205-213.
287. Mejia, C.D., L.J. Mauer, and B.R. Hamaker, Similarities and differences in secondary structure of viscoelastic polymers of maize a-zein and wheat gluten proteins. J.Cereal Sci, 2007. 45(3): p. 353-359.
288. Kizil, R., J. Irudayaraj, and K. Seetharaman, Characterization of Irradiated Starches by Using FT-Raman and FTIR Spectroscopy. J Agri Food Chem, 2002. 50(14): p. 3912-3918.
289. Oneh Abu, J., K. Gyebi Duodu, and A. Minnaar, Effect of g-irradiation on some physicochemical and thermal properties of cowpea (Vigna unguiculata L. Walp) starch. Food Chem, 2005. 95(3): p. 386-393.
290. Azevedo, H.S., F.M. Gama, and R.L. Reis, In Vitro Assessment of the Enzymatic Degradation of Several Starch Based Biomaterials. Biomacromolecules, 2003. 4(6): p. 1703-1712.
291. Vasques, C.T., et al., Effect of thermal treatment on the stability and structure of maize starch cast films. Starch/Staerke, 2007. 59(3-4): p. 161-170.
292. Krieg, P., et al., Determination of a-amylase activity using Fourier-transform IR spectroscopy. Fresenius' Journal of Analytical Chemistry, 1996. 356(8): p. 504-507.
293. Khalid, E.K., E.E. Babiker, and A.H. El Tinay, Solubility and functional properties of sesame seed proteins as influenced by pH and/or salt concentration. Food Chem, 2003. 82(3): p. 361-366.

122
294. Popineau, Y., et al., Foaming and Emulsifying Properties of Fractions of Gluten Peptides Obtained by Limited Enzymatic Hydrolysis and Ultrafiltration. J. Cereal Sci, 2002. 35(3): p. 327-335.
295. Campos, D.T., J.F. Steffe, and P.K.W. Ng, Mixing wheat flour and ice to form undeveloped dough. Cereal Chem, 1996. 73(1): p. 105-7.
296. Schluentz, E.J., J.F. Steffe, and P.K.W. Ng, Rheology and microstructure of wheat dough developed with controled deformation. Journal of Texture Studies, 2000. 31(1): p. 41-54.
297. Agyare, K.K., et al., Dynamic rheological and thermal properties of soft wheat flour dough containing structured lipid. J. Food Sci, 2004. 69(7): p. E297-E302.
298. Angioloni, A. and M. Dalla Rosa, Effects of cysteine and mixing conditions on white/whole dough rheological properties. Journal of Food Engineering, 2006. 80(1): p. 18-23.
299. Chamberlain, N., The use of ascorbic acid in breadmaking. Vitam. C (Ascorbic Acid), 1981: p. 87-104.
300. Lee, J.W. and C.W. Wrigley, The protein composition of gluten extracted from different wheats. Australian J. Exptl. Agr. Animal Husbandry, 1963. 3(9): p. 85-8.
301. Singh, H. and F. MacRitchie, Use of sonication to probe wheat gluten structure. Cereal Chem, 2001. 78(5): p. 526-529.
302. Engelsen, S.B., et al., NMR-baking and Multivariate Prediction of Instrumental Texture Parameters in Bread. J. Cereal Sci, 2001. 33(1): p. 59-69.
303. Haris, P.I., Fourier transform infrared spectroscopic studies of peptides: potentials and pitfalls. ACS Symposium Series, 2000. 750(Infrared Analysis of Peptides and Proteins): p. 54-95.
304. Hering, J.A., P.R. Innocent, and P.I. Haris, Automatic amide I frequency selection for rapid quantification of protein secondary structure from Fourier transform infrared spectra of proteins. Proteomics, 2002. 2(7): p. 839-849.
305. Yang, J.T., Quantitative IR spectrophotometry of peptide compounds in water (H2O) solutions: Spectral parameters of amino acid residue absorption bands. Amide absorption bands of polypeptides and fibrous proteins in a-, b-, and random coil conformations. Estimation of the protein secondary structure. Chemtracts: Biochemistry and Molecular Biology, 1991. 2(4): p. 239-44.
306. Li-Chan, E.C.Y., et al., Vibrational Spectroscopy of Food and Food Products. John Wiley & Sons Ltd, 2002.
307. Nevskaya, C., Biopolymers, 1976. 4: p. 637-48. 308. Nakanishi, M. and M. Tsuboi, Determination of the number of hydrogen bonds in a
protein molecule. Bulletin of the Chemical Society of Japan, 1974. 47(2): p. 305-7. 309. Arrondo, J.L.R., et al., Quantitative studies of the structure of proteins in solution by
Fourier-transform infrared spectroscopy. Progress in Biophysics & Molecular Biology, 1993. 59(1): p. 23-56.
310. Bruun Susanne, W., et al., Correcting attenuated total reflection-Fourier transform infrared spectra for water vapor and carbon dioxide. Appl Spectrosc, 2006. 60(9): p. 1029-39.
311. Carbonaro, M., et al., Application of Fourier transform infrared spectroscopy to legume seed flour analysis. Food Chem, 2008. 108(1): p. 361-368.
312. Schofield, J.D. and X. Chen, Analysis of free reduced and free oxidised glutathione in wheat flour. J. Cereal Sci, 1995. 21(2): p. 127-136.
313. Jones, I.K. and P.R. Carnegie, Rheological activity of peptides, simple disulphides and simple thiols in wheaten dough. J.Agri Food Chem, 1969. 20(1): p. 60-64.
314. Ewart, J.A.D., Thiols in flour and baking quality. Food Chem, 1990. 38(1): p. 41-60. 315. Jones, I.K. and P.R. Carnegie, Binding of oxidised glutathione to dough proteins and
a new explanation, involving thiol disulphide exchange, of the physical properties of dough. J.Agri Food Chem, 1971. 22(7): p. 358-364.
316. Zentner, H., Effect of ascorbic acid on wheat gluten. J. Agri Food Chem, 1968. 19(8): p. 464-467.
123
317. Koehler, P., Effect of Ascorbic Acid in Dough: Reaction of Oxidized Glutathione with Reactive Thiol Groups of Wheat Glutelin. J.Agri Food Chem, 2003. 51(17): p. 4954-4959.
318. Bresler, S.E., Structure, molecular forces and aggregation reactions of macromolecules of complex polymers. Discuss. Faraday Soc., 1958. No. 25: p. 158-66.

124