infrared absorption enhancement at silver colloidal particles
TRANSCRIPT
278 Volume 52, Number 2, 1998 APPLIED SPECTROSCOPY0003-7028 / 98 / 5202-0278$2.00 / 0q 1998 Society for Applied Spectroscopy
Infrared Absorption Enhancement at Silver ColloidalParticles
SO YOUNG KANG, IL CHEOL JEON, and KWAN KIM*Department of Chemistry and Center for Molecular Catalysis, Seoul National University,Seoul 151-742, Korea (S.Y.K., K.K.); and Department of Chemistry, Jeonbuk National University, Jeonbuk 561-756, Korea (I.C.J.)
Infrared absorption enhancement is observed as occurring at silvercolloidal particles spread on an infrared transparent substrate. Itsapplicability to qualitative analysis was tested by comparing thetransmission spectra of 9,10-anthraquinone (AQ) on a KRS-5 platewith and without silver colloidal particles. The largest enhancementfactor observed was about 100, and the detection limit for AQ ap-peared to be less than 10 ng/cm2. The scanning electron micrographindicated that the colloidal silver ® lm consisted of irregularlyshaped islands. AQ does not possess a functional group reactive tosilver, so that the infrared absorption enhancement could be as-sumed to occur through the long-range electromagnetic enhance-ment mechanism.
Index Headings: Infrared; Surface-enhanced IR absorption; Silvercolloid; Anthraquinone.
INTRODUCTION
Ever since Hartstein et al.1 reported infrared absorp-tion enhancement for thin evaporated metal ® lms, nu-merous studies have been performed not only to deter-mine the mechanism of the phenomena but also to ® ndits application to the qualitative and the quantitativeanalysis of nanogram amounts of substances and theanalysis of absorbed species on electrode surfaces, ofLangmuir± Blodgett monolayers, and of polymer sur-faces.2± 9 So far, the thin metal ® lms that have been em-ployed were prepared exclusively by using a high-vac-uum evaporator equipped with an evaporation rate con-troller and a thickness measuring device. Herein, wereport that metal colloidal particles, which can be pre-pared readily in any laboratory, can also be used for thequalitative analysis of substances. This procedure willbe demonstrated with the infrared spectra of 9,10-an-thraquinone (AQ) on a KRS-5 plate with and withoutsilver colloidal particles. The molecule was chosen be-cause it is symmetric and is not reactive to the colloidalingredients used in this work.10,11
EXPERIMENTAL
The method of preparation of the aqueous silver col-loid has been reported previously.12 Brie¯ y, 10 mL of10 2 3 M AgNO3 solution was added dropwise to 30 mLof 2 3 10 2 3 M NaBH4 solution. The latter solution wasmaintained at ice temperature, and the mixture wasstirred vigorously during preparation. The resulting col-loid, which was stable for several weeks, was yellowishin tint with an ultraviolet-visible (UV-vis) absorptionspectrum displaying a single peak near 392 nm. An al-iquot amount (500 m L) of silver colloid was spread on
Received 8 April 1997; accepted 25 July 1997.* Author to whom correspondence should be sent.
the one face of the KRS-5 plate (38.5 mm 3 19.5 mm3 4.9 mm), and the wet crystal was dried off underambient conditions. This wetting and drying processwas repeated to acquire thick colloidal ® lms. Thereafter,9,10-anthraquinone (AQ) dissolved in acetone wasspread on the Ag colloid-coated crystal with a micro-syringe. The average thickness of the AQ ® lm (dAQ) wasestimated from the volume and concentration of the so-lution by assuming a density of 1.43 g/cm3 for the crys-talline AQ.13 For a comparative study, vacuum-evapo-rated silver ® lm was also prepared at 10 2 6 torr on theKRS-5 plate. The infrared spectrum was obtained witha Bruker IFS 113v spectrometer equipped with a globarlight source and a liquid N2-cooled mercury cadmiumtelluride detector. Each spectrum was obtained with atransmission mode by averaging 512 interferograms at4 cm2 1 resolution. The spectra of the colloidal ® lmsmeasured before the deposition of the AQ moleculeswere used as reference spectra. All chemicals otherwisespeci® ed were reagent grade, and triply distilled waterwas used throughout.
RESULTS AND DISCUSSION
In the present work, the silver colloidal particles wereprepared by the reaction of silver nitrate with the re-ducing agent, sodium borohydride.14,15 Accordingly, theresulting aqueous solution contained not only the col-loidal Ag particles but also several ionic species such asNa1 , NO3
2 , and H2BO32 . A preliminary X-ray photoe-
lectron spectroscopy (XPS) measurement showed thatthose ionic species could be washed out by immersingthe colloid-coated KRS-5 substrate in water, leavingmost of the silver particles on the KRS-5 substrate.Since our intention was primarily to examine whetherthe infrared absorption of organic thin ® lms could benotably enhanced even by the presence of those ionicspecies to be applied to the trace organic analysis, theprepared colloidal solution was spread on the KRS-5substrate without any post-treatment. Moreover, thoseionic species were not expected to interact chemicallywith AQ as with Ag particles.11
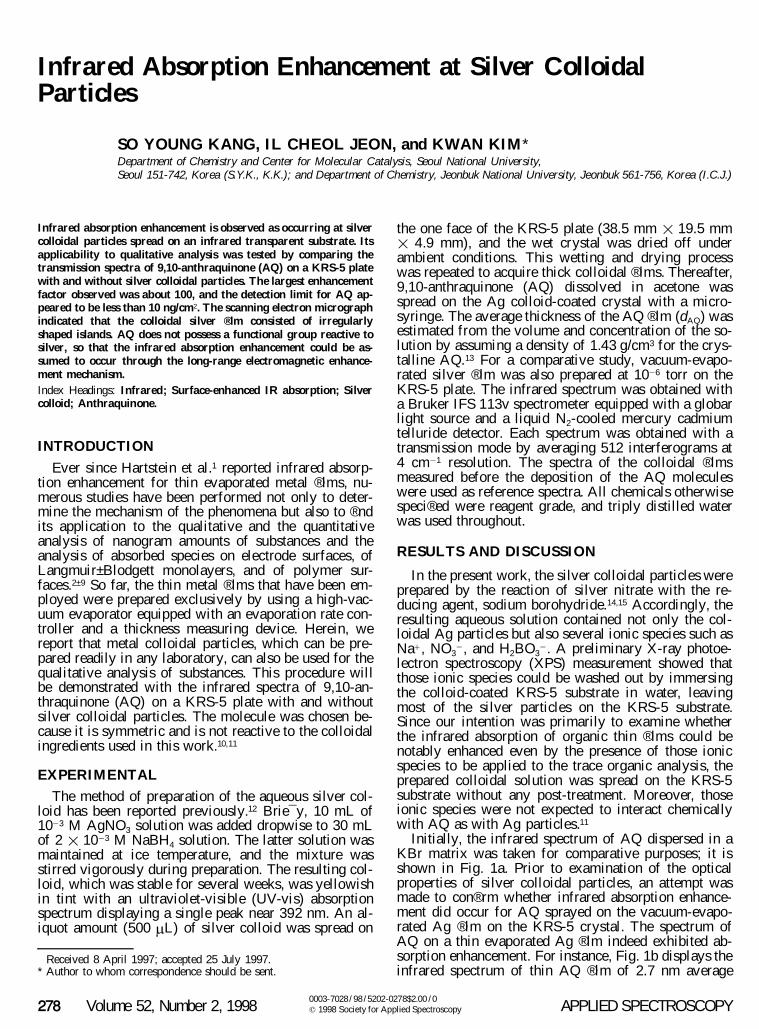
Initially, the infrared spectrum of AQ dispersed in aKBr matrix was taken for comparative purposes; it isshown in Fig. 1a. Prior to examination of the opticalproperties of silver colloidal particles, an attempt wasmade to con® rm whether infrared absorption enhance-ment did occur for AQ sprayed on the vacuum-evapo-rated Ag ® lm on the KRS-5 crystal. The spectrum ofAQ on a thin evaporated Ag ® lm indeed exhibited ab-sorption enhancement. For instance, Fig. 1b displays theinfrared spectrum of thin AQ ® lm of 2.7 nm average
APPLIED SPECTROSCOPY 279
FIG. 1. Infrared spectra of (a) neat 9,10-anthraquinone (AQ) dispersedin a KBr matrix and (b) thin AQ ® lm of 2.7 nm average thickness( ; 375 ng/cm2) deposited on thin evaporated silver ® lm. See text.
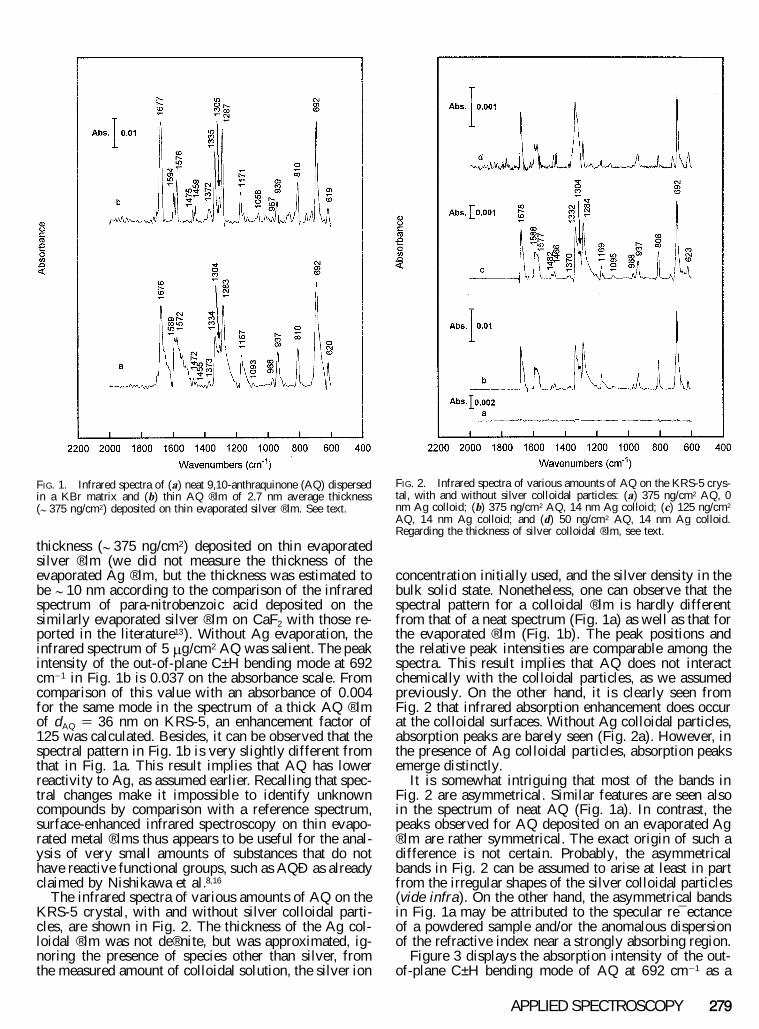
FIG. 2. Infrared spectra of various amounts of AQ on the KRS-5 crys-tal, with and without silver colloidal particles: (a) 375 ng/cm2 AQ, 0nm Ag colloid; (b) 375 ng/cm2 AQ, 14 nm Ag colloid; (c) 125 ng/cm2
AQ, 14 nm Ag colloid; and (d) 50 ng/cm2 AQ, 14 nm Ag colloid.Regarding the thickness of silver colloidal ® lm, see text.
thickness ( ; 375 ng/cm2) deposited on thin evaporatedsilver ® lm (we did not measure the thickness of theevaporated Ag ® lm, but the thickness was estimated tobe ; 10 nm according to the comparison of the infraredspectrum of para-nitrobenzoic acid deposited on thesimilarly evaporated silver ® lm on CaF2 with those re-ported in the literature13). Without Ag evaporation, theinfrared spectrum of 5 m g/cm2 AQ was salient. The peakintensity of the out-of-plane C± H bending mode at 692cm2 1 in Fig. 1b is 0.037 on the absorbance scale. Fromcomparison of this value with an absorbance of 0.004for the same mode in the spectrum of a thick AQ ® lmof dAQ 5 36 nm on KRS-5, an enhancement factor of125 was calculated. Besides, it can be observed that thespectral pattern in Fig. 1b is very slightly different fromthat in Fig. 1a. This result implies that AQ has lowerreactivity to Ag, as assumed earlier. Recalling that spec-tral changes make it impossible to identify unknowncompounds by comparison with a reference spectrum,surface-enhanced infrared spectroscopy on thin evapo-rated metal ® lms thus appears to be useful for the anal-ysis of very small amounts of substances that do nothave reactive functional groups, such as AQÐ as alreadyclaimed by Nishikawa et al.8,16
The infrared spectra of various amounts of AQ on theKRS-5 crystal, with and without silver colloidal parti-cles, are shown in Fig. 2. The thickness of the Ag col-loidal ® lm was not de® nite, but was approximated, ig-noring the presence of species other than silver, fromthe measured amount of colloidal solution, the silver ion
concentration initially used, and the silver density in thebulk solid state. Nonetheless, one can observe that thespectral pattern for a colloidal ® lm is hardly differentfrom that of a neat spectrum (Fig. 1a) as well as that forthe evaporated ® lm (Fig. 1b). The peak positions andthe relative peak intensities are comparable among thespectra. This result implies that AQ does not interactchemically with the colloidal particles, as we assumedpreviously. On the other hand, it is clearly seen fromFig. 2 that infrared absorption enhancement does occurat the colloidal surfaces. Without Ag colloidal particles,absorption peaks are barely seen (Fig. 2a). However, inthe presence of Ag colloidal particles, absorption peaksemerge distinctly.
It is somewhat intriguing that most of the bands inFig. 2 are asymmetrical. Similar features are seen alsoin the spectrum of neat AQ (Fig. 1a). In contrast, thepeaks observed for AQ deposited on an evaporated Ag® lm are rather symmetrical. The exact origin of such adifference is not certain. Probably, the asymmetricalbands in Fig. 2 can be assumed to arise at least in partfrom the irregular shapes of the silver colloidal particles(vide infra). On the other hand, the asymmetrical bandsin Fig. 1a may be attributed to the specular re¯ ectanceof a powdered sample and/or the anomalous dispersionof the refractive index near a strongly absorbing region.
Figure 3 displays the absorption intensity of the out-of-plane C± H bending mode of AQ at 692 cm2 1 as a
280 Volume 52, Number 2, 1998
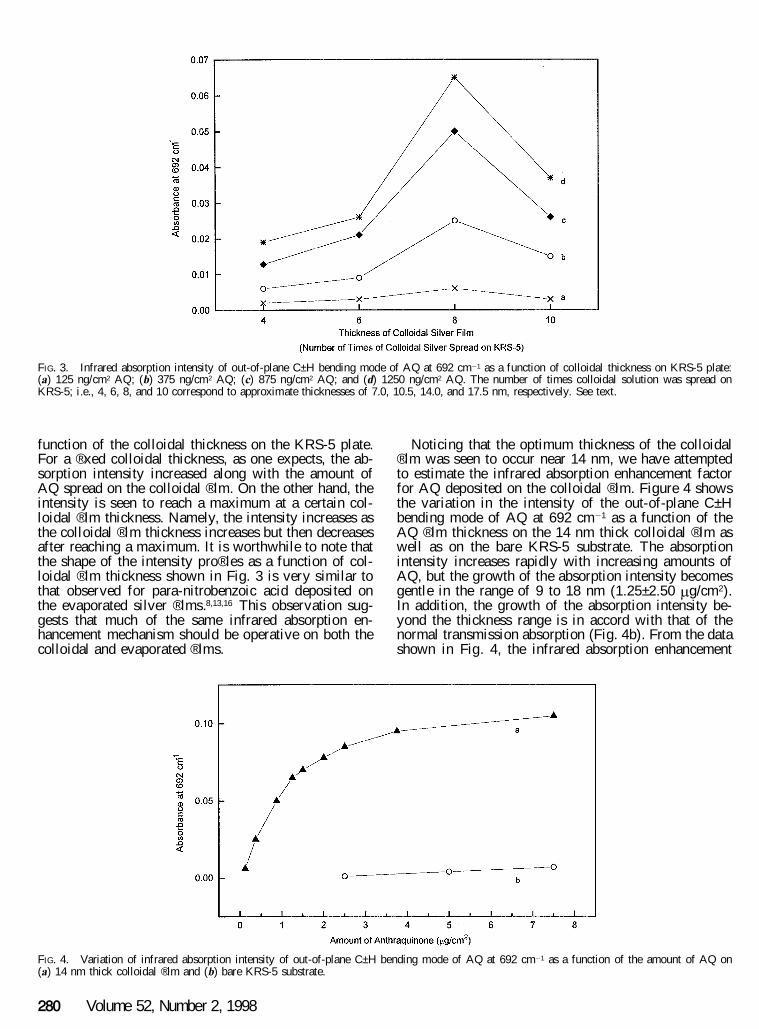
FIG. 3. Infrared absorption intensity of out-of-plane C± H bending mode of AQ at 692 cm2 1 as a function of colloidal thickness on KRS-5 plate:(a) 125 ng/cm2 AQ; (b) 375 ng/cm2 AQ; (c) 875 ng/cm2 AQ; and (d) 1250 ng/cm2 AQ. The number of times colloidal solution was spread onKRS-5; i.e., 4, 6, 8, and 10 correspond to approximate thicknesses of 7.0, 10.5, 14.0, and 17.5 nm, respectively. See text.
FIG. 4. Variation of infrared absorption intensity of out-of-plane C± H bending mode of AQ at 692 cm2 1 as a function of the amount of AQ on(a) 14 nm thick colloidal ® lm and (b) bare KRS-5 substrate.
function of the colloidal thickness on the KRS-5 plate.For a ® xed colloidal thickness, as one expects, the ab-sorption intensity increased along with the amount ofAQ spread on the colloidal ® lm. On the other hand, theintensity is seen to reach a maximum at a certain col-loidal ® lm thickness. Namely, the intensity increases asthe colloidal ® lm thickness increases but then decreasesafter reaching a maximum. It is worthwhile to note thatthe shape of the intensity pro® les as a function of col-loidal ® lm thickness shown in Fig. 3 is very similar tothat observed for para-nitrobenzoic acid deposited onthe evaporated silver ® lms.8,13,16 This observation sug-gests that much of the same infrared absorption en-hancement mechanism should be operative on both thecolloidal and evaporated ® lms.
Noticing that the optimum thickness of the colloidal® lm was seen to occur near 14 nm, we have attemptedto estimate the infrared absorption enhancement factorfor AQ deposited on the colloidal ® lm. Figure 4 showsthe variation in the intensity of the out-of-plane C± Hbending mode of AQ at 692 cm2 1 as a function of theAQ ® lm thickness on the 14 nm thick colloidal ® lm aswell as on the bare KRS-5 substrate. The absorptionintensity increases rapidly with increasing amounts ofAQ, but the growth of the absorption intensity becomesgentle in the range of 9 to 18 nm (1.25± 2.50 m g/cm2).In addition, the growth of the absorption intensity be-yond the thickness range is in accord with that of thenormal transmission absorption (Fig. 4b). From the datashown in Fig. 4, the infrared absorption enhancement
APPLIED SPECTROSCOPY 281
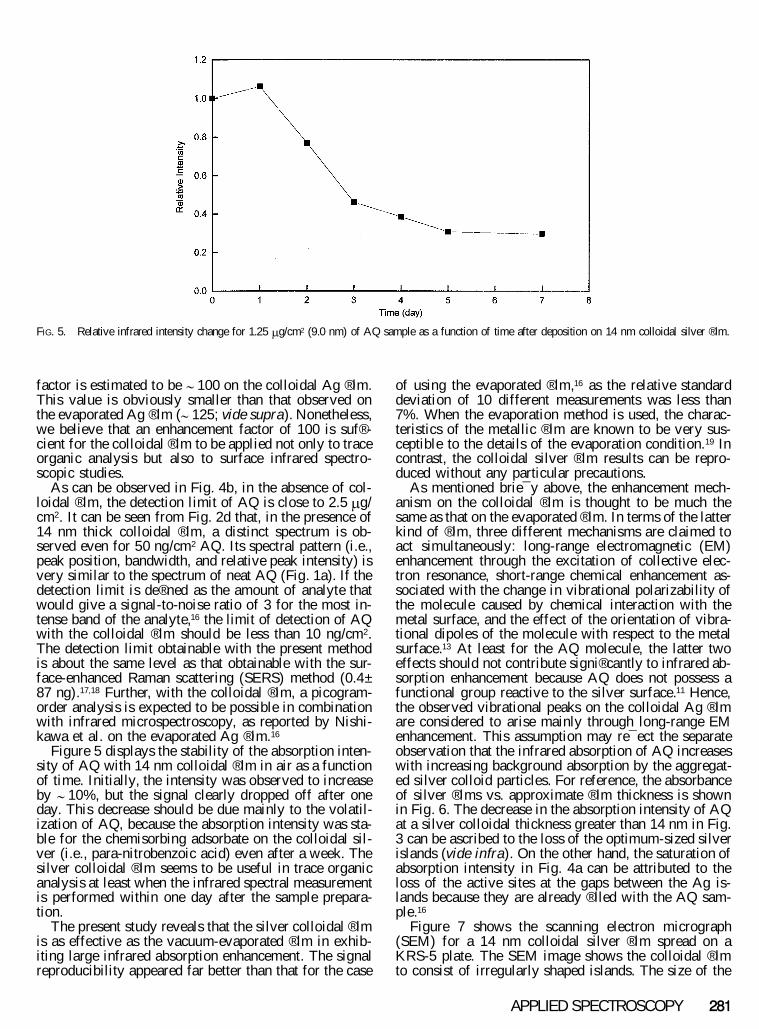
FIG. 5. Relative infrared intensity change for 1.25 m g/cm2 (9.0 nm) of AQ sample as a function of time after deposition on 14 nm colloidal silver ® lm.
factor is estimated to be ; 100 on the colloidal Ag ® lm.This value is obviously smaller than that observed onthe evaporated Ag ® lm ( ; 125; vide supra). Nonetheless,we believe that an enhancement factor of 100 is suf® -cient for the colloidal ® lm to be applied not only to traceorganic analysis but also to surface infrared spectro-scopic studies.
As can be observed in Fig. 4b, in the absence of col-loidal ® lm, the detection limit of AQ is close to 2.5 m g/cm2. It can be seen from Fig. 2d that, in the presence of14 nm thick colloidal ® lm, a distinct spectrum is ob-served even for 50 ng/cm2 AQ. Its spectral pattern (i.e.,peak position, bandwidth, and relative peak intensity) isvery similar to the spectrum of neat AQ (Fig. 1a). If thedetection limit is de® ned as the amount of analyte thatwould give a signal-to-noise ratio of 3 for the most in-tense band of the analyte,16 the limit of detection of AQwith the colloidal ® lm should be less than 10 ng/cm2.The detection limit obtainable with the present methodis about the same level as that obtainable with the sur-face-enhanced Raman scattering (SERS) method (0.4±87 ng).17,18 Further, with the colloidal ® lm, a picogram-order analysis is expected to be possible in combinationwith infrared microspectroscopy, as reported by Nishi-kawa et al. on the evaporated Ag ® lm.16
Figure 5 displays the stability of the absorption inten-sity of AQ with 14 nm colloidal ® lm in air as a functionof time. Initially, the intensity was observed to increaseby ; 10%, but the signal clearly dropped off after oneday. This decrease should be due mainly to the volatil-ization of AQ, because the absorption intensity was sta-ble for the chemisorbing adsorbate on the colloidal sil-ver (i.e., para-nitrobenzoic acid) even after a week. Thesilver colloidal ® lm seems to be useful in trace organicanalysis at least when the infrared spectral measurementis performed within one day after the sample prepara-tion.
The present study reveals that the silver colloidal ® lmis as effective as the vacuum-evaporated ® lm in exhib-iting large infrared absorption enhancement. The signalreproducibility appeared far better than that for the case
of using the evaporated ® lm,16 as the relative standarddeviation of 10 different measurements was less than7%. When the evaporation method is used, the charac-teristics of the metallic ® lm are known to be very sus-ceptible to the details of the evaporation condition.19 Incontrast, the colloidal silver ® lm results can be repro-duced without any particular precautions.
As mentioned brie¯ y above, the enhancement mech-anism on the colloidal ® lm is thought to be much thesame as that on the evaporated ® lm. In terms of the latterkind of ® lm, three different mechanisms are claimed toact simultaneously: long-range electromagnetic (EM)enhancement through the excitation of collective elec-tron resonance, short-range chemical enhancement as-sociated with the change in vibrational polarizability ofthe molecule caused by chemical interaction with themetal surface, and the effect of the orientation of vibra-tional dipoles of the molecule with respect to the metalsurface.13 At least for the AQ molecule, the latter twoeffects should not contribute signi® cantly to infrared ab-sorption enhancement because AQ does not possess afunctional group reactive to the silver surface.11 Hence,the observed vibrational peaks on the colloidal Ag ® lmare considered to arise mainly through long-range EMenhancement. This assumption may re¯ ect the separateobservation that the infrared absorption of AQ increaseswith increasing background absorption by the aggregat-ed silver colloid particles. For reference, the absorbanceof silver ® lms vs. approximate ® lm thickness is shownin Fig. 6. The decrease in the absorption intensity of AQat a silver colloidal thickness greater than 14 nm in Fig.3 can be ascribed to the loss of the optimum-sized silverislands (vide infra). On the other hand, the saturation ofabsorption intensity in Fig. 4a can be attributed to theloss of the active sites at the gaps between the Ag is-lands because they are already ® lled with the AQ sam-ple.16
Figure 7 shows the scanning electron micrograph(SEM) for a 14 nm colloidal silver ® lm spread on aKRS-5 plate. The SEM image shows the colloidal ® lmto consist of irregularly shaped islands. The size of the

282 Volume 52, Number 2, 1998
FIG. 6. Infrared absorbance vs. the thickness of silver colloidal ® lm at 1000 cm2 1. The number of times colloidal solution was spread on KRS-5;i.e., 4, 6, 8, and 10 correspond to approximate thicknesses of 7.0, 10.5, 14.0, and 17.5 nm, respectively. The solid line is drawn only as a guide tothe eye.
FIG. 7. Scanning electron micrograph of 14 nm colloidal silver ® lmon KRS-5 plate taken with a JEOL JSM-840A scanning electron mi-croscope (magni® cation 3 20,000). The bar equals 1.0 m m.
islands is 100± 250 nm, and the islands are well sepa-rated from one another. Although the islands are sepa-rated from one another, the size of islands on the non-optimized colloidal ® lm was smaller or larger than thatshown in Fig. 7. It is intriguing that, at the optimumenhancement condition, the size of islands on the col-loidal ® lm is much larger than that on the evaporatedsilver ® lm.16 This result may imply that not only the sizeof islands but also their separation is an important factorthat results in infrared absorption enhancement. As thegaps between the islands increase, the size of the islandmay have to be enlarged for optimum enhancement tobe achieved.
In summary, we have shown that infrared absorptionenhancement takes place at silver colloidal particlesspread on the infrared-transparent substrate. Although
the enhancement factor on the colloidal ® lm ( ; 100)may be slightly lower than that on the evaporated thinmetal ® lm ( ; 125), the colloidal ® lm appeared to be suf-® cient to be used in trace organic analysis. The colloidalsilver ® lm was observed to consist of irregularly shapedislands. Recalling that AQ does not possess a functionalgroup reactive to silver, the infrared absorption enhance-ment on the colloidal ® lm appears to occur mainlythrough the long-range electromagnetic enhancementmechanism. Unlike the case of SERS measurement inaqueous silver sol, any cathedral peak (i.e., ghost peakarising from the decomposition of sample around 1200±1600 cm2 1) was not at all observed with infrared spec-troscopy. Subsequently, we will examine the effects ofionic species, which are present on the infrared-trans-parent substrate along with the silver colloidal particles,on the infrared spectral pattern by choosing moleculesthat could bind chemically to the colloidal silver parti-cles, e.g., para-nitrobenzoic acid.
ACKNOWLEDGMENTS
This work was supported in part by the Korea Research Foundationthrough the Non Directed Research Fund (1995), by the Korea Scienceand Engineering Foundation through the Speci® ed Basic ResearchFund (95-0501-09) and the Center for Molecular Catalysis at SeoulNational University (1997), and by the Ministry of Education, Re-public of Korea, through the Basic Science Research Fund (1997).
1. A. Hartstein, J. R. Kirtley, and J. C. Tsang, Phys. Rev. Lett. 45,201 (1980).
2. A. A. Sigarev and V. A. Yakovlev, Opt. Spectrosc. 56, 336 (1984).3. A. Hatta, T. Ohshima, and W. SueÈ taka, Appl. Phys. A29, 71
(1982).4. A. Hatta, Y. Suzuki, and W. SueÈ taka, Appl. Phys. A35, 135
(1984).5. M. Osawa, M. Kuramitsu, A. Hatta, and W. SueÈ taka, Surf. Sci.
175, L787 (1986).6. S. Badilescu, P. V. Ashrit, and Vo-Van Truong, Appl. Phys. Lett.
52, 1551 (1988).
APPLIED SPECTROSCOPY 283
7. S. Badilescu, P. V. Ashrit, Vo-Van Truong, and I. I. Badilescu,Appl. Spectrosc. 43, 549 (1989).
8. Y. Nishikawa, K. Fujiwara, and T. Shima, Appl. Spectrosc. 44,691 (1990).
9. M. Osawa, K. Ataka, K. Yoshii, and Y. Nishikawa, Appl. Spec-trosc. 47, 1497 (1993).
10. C. Pecile and B. Lunelli, J. Chem. Phys. 46, 2109 (1967).11. Y. Suzuki, A. Kawana, and T. Yamada, Electron. Opt. 175 (1987).12. Y. J. Kwon, S. S. Park, K. Kim, and M. S. Kim, J. Raman Spec-
trosc. 25, 655 (1994).13. M. Osawa and M. Ikeda, J. Phys. Chem. 95, 9914 (1991).
14. J. A. Creighton, C. G. Blatchford, and M. G. Albrecht, J. Chem.Soc. Faraday Trans. 2, 75, 790 (1979).
15. J. C. Cook, C. M. P. Cuypers, B. J. Kip, and R. J. Meier, J. RamanSpectrosc. 24, 609 (1993).
16. Y. Nishikawa, K. Fujiwara, and T. Shima, Appl. Spectrosc. 45,747 (1991).
17. J. M. Bello, D. L. Stokes, and T. Vo-Dinh, Appl. Spectrosc. 43,1325 (1989).
18. J. M. Bello and T. Vo-Dinh, Appl. Spectrosc. 44, 63 (1990).19. Y. Nishikawa, T. Nagasawa, K. Fujiwara, and M. Osawa, Vib.
Spectrosc. 6, 43 (1993).