infrared gas sensors
TRANSCRIPT
55
Chapter 5 Infrared Gas Sensors
Chapter 5
Infrared Gas Sensors
I nfrared (IR) gas detection is a well-developedmeasurement technology. Infrared gas analyzershave a reputation for being complicated, cumber-
some, and expensive. However, recent technical ad-vancements, including the availability of powerful am-plifiers and associated electronic components, haveopened a new frontier for infrared gas analysis. Theseadvancements have resulted from an increase in de-mand in the commercial sector, and these demandswill likely continue to nourish the advancement of thistechnology.
Gases to be detected are often corrosive and reac-tive. With most sensor types, the sensor itself is directlyexposed to the gas, often causing the sensor to driftor die prematurely.
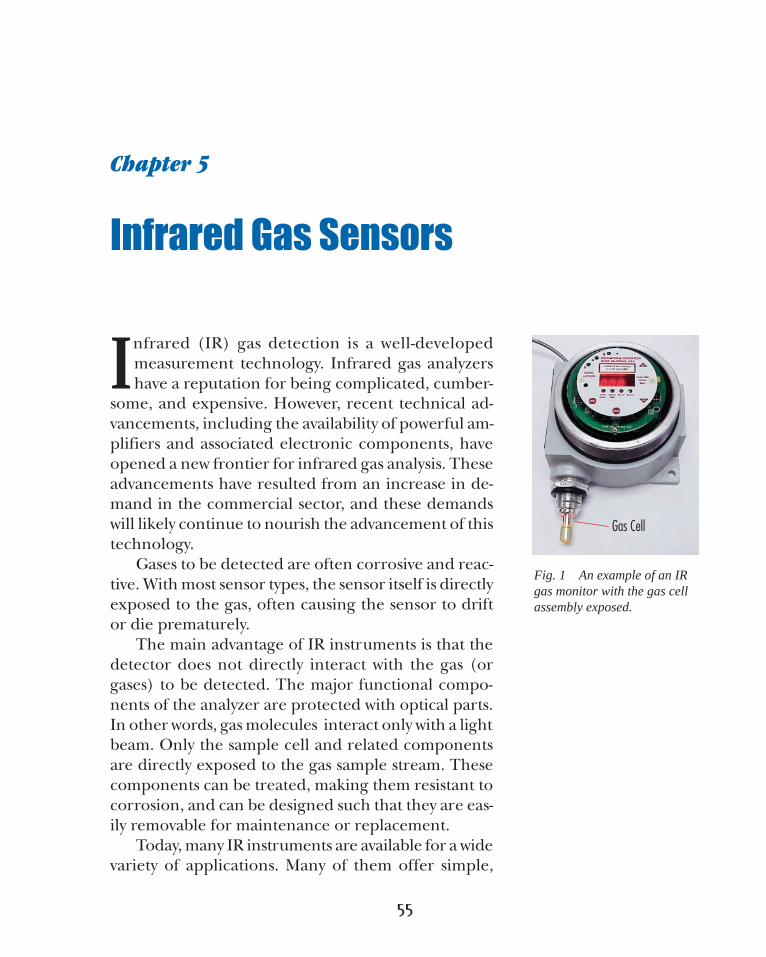
The main advantage of IR instruments is that thedetector does not directly interact with the gas (orgases) to be detected. The major functional compo-nents of the analyzer are protected with optical parts.In other words, gas molecules interact only with a lightbeam. Only the sample cell and related componentsare directly exposed to the gas sample stream. Thesecomponents can be treated, making them resistant tocorrosion, and can be designed such that they are eas-ily removable for maintenance or replacement.
Today, many IR instruments are available for a widevariety of applications. Many of them offer simple,
Fig. 1 An example of an IRgas monitor with the gas cellassembly exposed.
Gas Cell
56
Hazardous Gas Monitors
rugged, and reliable designs. In general, for toxic andcombustible gas monitoring applications, IR instrumentsare among the most user friendly and require the leastamount of maintenance. There is virtually an unlimitednumber of applications for which IR technology can beused. Gases whose molecules consist of two or more dis-similar atoms absorb infrared radiation in a unique man-ner and are detectable using infrared techniques. Infra-red sensors are highly selective and offer a wide rangeof sensitivities, from parts per million levels to 100 per-cent concentrations. This chapter provides general in-formation, with a special emphasis on instruments usedfor area air quality and safety applications.
Principle of Operation
The infrared detection principle incorporates only asmall portion of the very wide electromagnetic spectrum.The portion used is that which we can feel as heat. Thisis the region close to the visible region of the spectrumto which our eyes are sensitive. Electromagnetic radia-tion travels at close to 3 x 10⁸ m/sec and has a wave-likeprofile. Let’s review the basic physics of electromagneticradiation by defining the terminology involved with it.
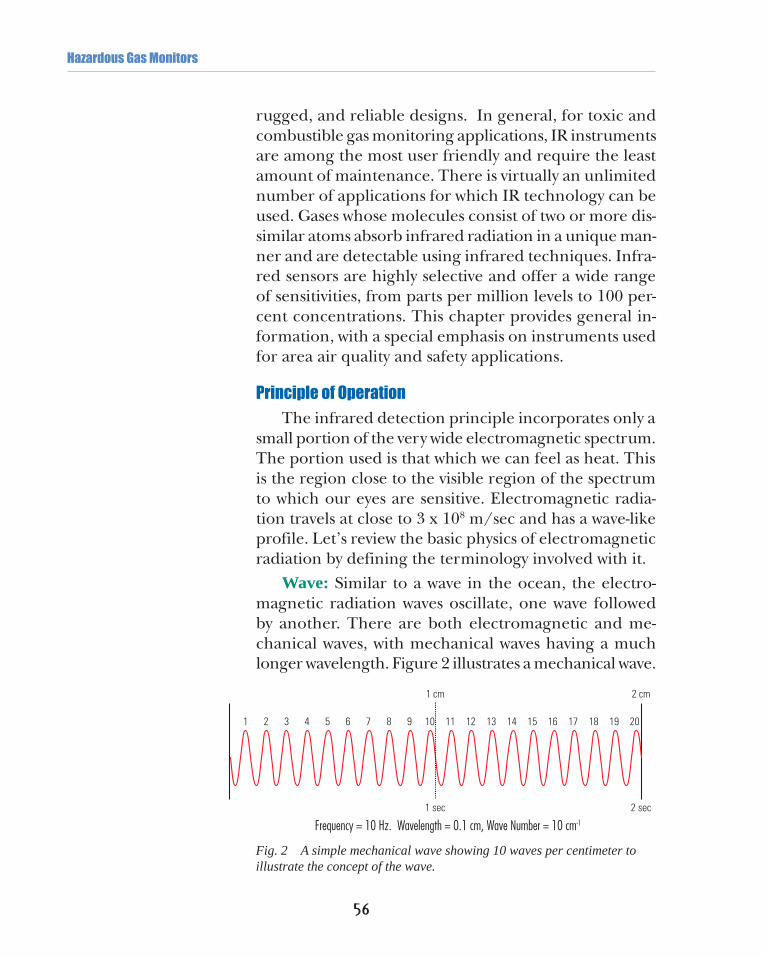
Wave: Similar to a wave in the ocean, the electro-magnetic radiation waves oscillate, one wave followedby another. There are both electromagnetic and me-chanical waves, with mechanical waves having a muchlonger wavelength. Figure 2 illustrates a mechanical wave.
1 sec 2 sec
1 2 3 4 5 6 7 8 9 10 11 12 13 14 15 16 17 18 19 20
1 cm 2 cm
Frequency = 10 Hz. Wavelength = 0.1 cm, Wave Number = 10 cm-1
Fig. 2 A simple mechanical wave showing 10 waves per centimeter toillustrate the concept of the wave.

57
Chapter 5 Infrared Gas Sensors
Frequency: Number of waves per second passingthrough a point. An electromagnetic wave travels atthe speed of light which is 300 million meters per sec-ond, or 3 x 10⁸ m/sec. Therefore, the frequency is thespeed of light divided by the wavelength, and is ex-pressed as the number of waves per second, or hertz(Hz).
Wavelength: The distance between two peaks ofthe wave, or the spacing between two waves. It is com-monly expressed in microns. It is a very popular termused in representing gas molecular absorption bandsas well as optical component characteristics.
Wave number:The number of waves in one centi-meter. It is the reciprocal of wavelength. Since 1 mi-cron = 10-6 m = 10-4 cm, the reciprocal of one micron is1/10-4 (10,000 wave numbers per cm), and 2 microns =5000 wave numbers per cm. The formula is:
Wave number = 1/wavelength
Micron: A common unit used to express wave-length in the infrared region. It is one millionth of ameter(10-6m) or a micrometer, and is abbreviated as µ.
Transmittance: The ratio of transmitted radiationenergy to the incident energy. The energy not trans-mitted is absorbed and reflected. It is used to specifyoptical parts.
Absorbance: Opposite of transmittance. Used todescribe the amount of energy absorbed by gas mol-ecules. Both percent absorption and percent transmittanceare used as the y-axis versus wave number or wavelengthas the x-axis in the infrared spectra.
Wave number and wavelength are common termsused by scientists to describe the infrared region forgas analysis because they provide a convenient methodto express radiation frequency and the mechanisms ofinteraction between infrared radiation and gas mol-ecules. Mathematically, they are the reciprocals of each
Transmittance = 100
= 65%65
65Transmitted Energy
25
AbsorbedEnergy
100Incident Energy
10Reflected Energy

58
Hazardous Gas Monitors
other. For example, methane gas has the absorption wave-length of 3.4 microns, or a wave number of 2941 cm-1.(Figure 4, on page 59, shows a spectroscopic descriptionof methane gas which illustrates that methane has a strongabsorption peak at 3.4µ, or a wave number of 2941 cm-1.)
Electromagnetic waves propagate through space ormatter by oscillating electric and magnetic fields. In avacuum, they travel at the speed of light. The completerange of frequencies of these waves is called the electro-magnetic spectrum.
These frequencies range from gamma rays of 1020 Hzto radio waves of 106 Hz. They are classified from higherto lower frequencies as gamma rays, x-rays, ultravioletlight, visible light, infrared light, microwaves, and radiowaves. Figure 3 shows the electromagnetic spectrum.
Visible light, at about 4 x 10¹⁴ Hz (or 0.4 to 0.7 mi-crons), is actually only a very narrow portion of the spec-trum. Infrared is just below visible light, and this explainswhy we feel, but do not see, temperature. The infraredregion is most useful for gas analysis because absorptionby gas molecules is unique and selective in this region.
Unique Gas Absorption “Fingerprints.” The com-plexity of the gas molecules determines the number ofabsorption peaks. The more atoms that form a molecule,the more absorption bands that will occur. The regionin which this absorption occurs, the amount of absorp-tion, and the specific character of the absorption curveis unique to each gas. Gas molecules can be fingerprintedusing their absorption characteristics and archived for
Fig. 3 Location of Infrared in the Electromagnetic Spectrum
4 x 10¹⁴
Frequency (cycles/sec.)
Radio
8 x 10¹⁴
106 1020101810151012109
Television Microwave Infrared Ultra-violet X-rays Gamma rays
59
Chapter 5 Infrared Gas Sensors
gas analysis and identification purposes. A library of thesecurves can then be stored in the memory inside an in-strument. When a given gas is scanned by the instrument,the graph is then compared with the stored curves toidentify the gas molecules. This method of gas analysis isthe most popular in analytical chemistry.
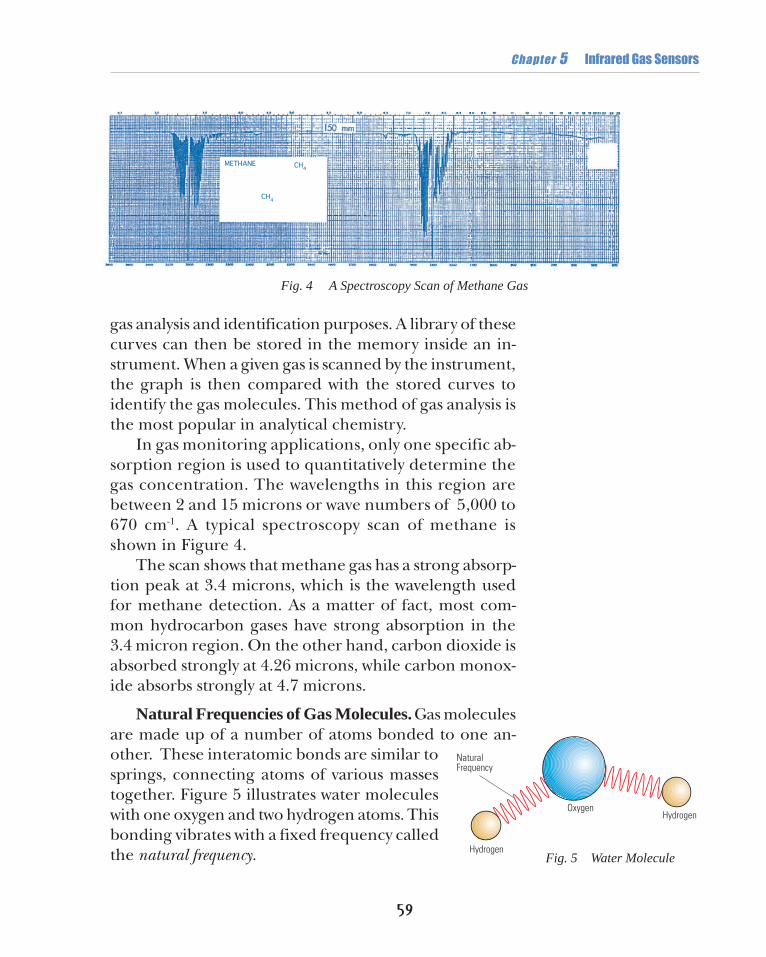
In gas monitoring applications, only one specific ab-sorption region is used to quantitatively determine thegas concentration. The wavelengths in this region arebetween 2 and 15 microns or wave numbers of 5,000 to670 cm-1. A typical spectroscopy scan of methane isshown in Figure 4.
The scan shows that methane gas has a strong absorp-tion peak at 3.4 microns, which is the wavelength usedfor methane detection. As a matter of fact, most com-mon hydrocarbon gases have strong absorption in the3.4 micron region. On the other hand, carbon dioxide isabsorbed strongly at 4.26 microns, while carbon monox-ide absorbs strongly at 4.7 microns.
Natural Frequencies of Gas Molecules. Gas moleculesare made up of a number of atoms bonded to one an-other. These interatomic bonds are similar tosprings, connecting atoms of various massestogether. Figure 5 illustrates water moleculeswith one oxygen and two hydrogen atoms. Thisbonding vibrates with a fixed frequency calledthe natural frequency.
Fig. 4 A Spectroscopy Scan of Methane Gas
Fig. 5 Water MoleculeHydrogen
HydrogenOxygen
NaturalFrequency
METHANE CH4
CH4
60
Hazardous Gas Monitors
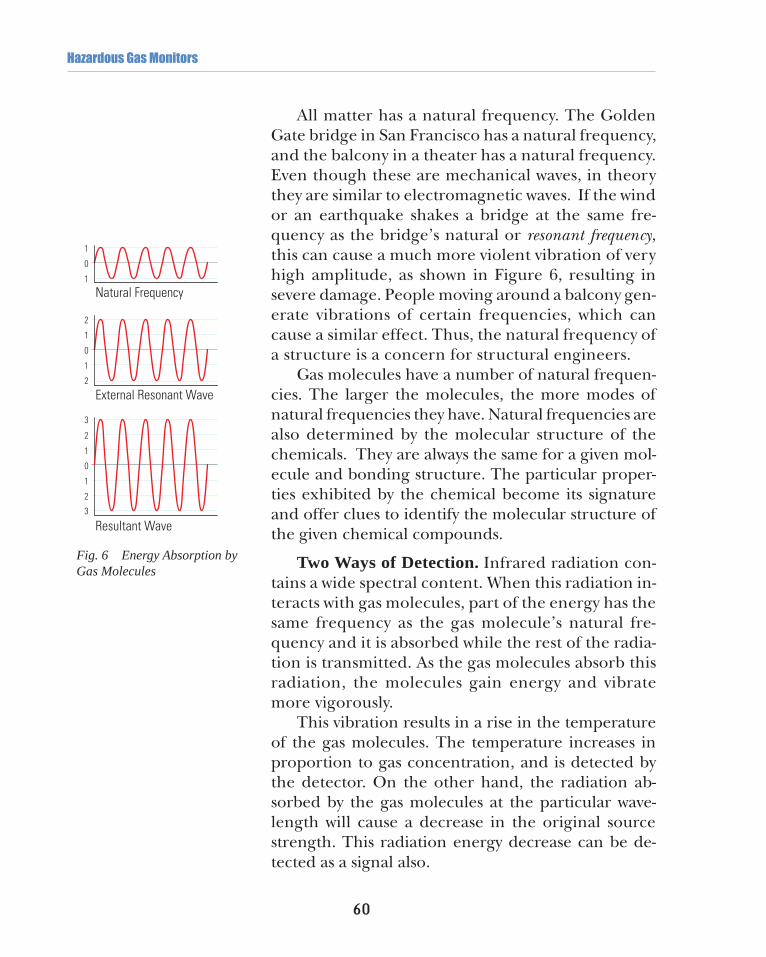
All matter has a natural frequency. The GoldenGate bridge in San Francisco has a natural frequency,and the balcony in a theater has a natural frequency.Even though these are mechanical waves, in theorythey are similar to electromagnetic waves. If the windor an earthquake shakes a bridge at the same fre-quency as the bridge’s natural or resonant frequency,this can cause a much more violent vibration of veryhigh amplitude, as shown in Figure 6, resulting insevere damage. People moving around a balcony gen-erate vibrations of certain frequencies, which cancause a similar effect. Thus, the natural frequency ofa structure is a concern for structural engineers.
Gas molecules have a number of natural frequen-cies. The larger the molecules, the more modes ofnatural frequencies they have. Natural frequencies arealso determined by the molecular structure of thechemicals. They are always the same for a given mol-ecule and bonding structure. The particular proper-ties exhibited by the chemical become its signatureand offer clues to identify the molecular structure ofthe given chemical compounds.
Two Ways of Detection. Infrared radiation con-tains a wide spectral content. When this radiation in-teracts with gas molecules, part of the energy has thesame frequency as the gas molecule’s natural fre-quency and it is absorbed while the rest of the radia-tion is transmitted. As the gas molecules absorb thisradiation, the molecules gain energy and vibratemore vigorously.
This vibration results in a rise in the temperatureof the gas molecules. The temperature increases inproportion to gas concentration, and is detected bythe detector. On the other hand, the radiation ab-sorbed by the gas molecules at the particular wave-length will cause a decrease in the original sourcestrength. This radiation energy decrease can be de-tected as a signal also.
Natural Frequency
External Resonant Wave
0
1
2
3
3
2
1
0
1
1
Resultant Wave
0
1
2
2
1
Fig. 6 Energy Absorption byGas Molecules

61
Chapter 5 Infrared Gas Sensors
Key Components for Analysis
To get a useful signal for gas analysis, there aremany different components and parts used in the vari-ous designs found today. However, there are no spe-cific rules regarding the selection of each of the com-ponents. The configuration of these instruments de-pends on what needs to be accomplished and the dis-cretion of the designer. Following is a description ofthe major components.
1. Detector: Infrared detectors convert electro-magnetic radiation energy or temperature changesinto electrical signals. There are many types of infra-red detectors and each detector type offers a widerange of performance characteristics. Some of thetypes are described briefly below:
a. Thermoelectric: A detector that converts tem-perature into an electrical signal is commonlyknown as a thermocouple. The junction of dissimi-lar metals generates a voltage potential, which isdirectly proportional to the temperature. Thisjunction can be made into multiple junctions toimprove sensitivity. Such a configuration is calleda thermopile.
Using techniques used in the semiconductorindustry, many junctions are connected in a seriesto multiply the output of the device, yet the detec-tor package is miniaturized and compact. The sizeand mass of the device are important in determin-ing its response time and other characteristics ofthe device.
This detector has a relatively slow responsetime, but offers the advantages of DC stability, re-quiring no bias, and responding to all wavelengths.It is the simplest way of converting light energyinto an electrical signal.
b. Thermistor Bolometer: A bolometer changes re-sistance when incident infrared radiation interacts
Metal 2
Metal 1
– +
T1 T2
DissimilarMetalJunction
T1 = Reference or normally ice point
T2 = Measuring probe
THERMOCOUPLE
62
Hazardous Gas Monitors
with the detector. This thermally sensitive semi-conductor is made of a sintered metal oxide ma-terial. It has a high temperature coefficient of re-sistance.
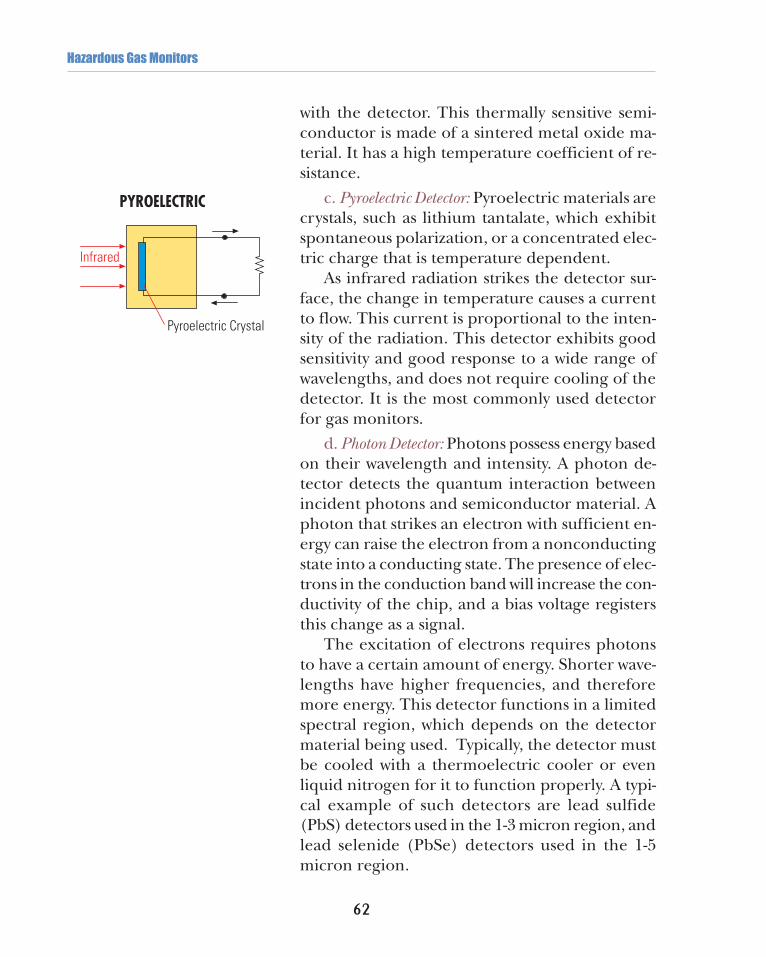
c. Pyroelectric Detector: Pyroelectric materials arecrystals, such as lithium tantalate, which exhibitspontaneous polarization, or a concentrated elec-tric charge that is temperature dependent.
As infrared radiation strikes the detector sur-face, the change in temperature causes a currentto flow. This current is proportional to the inten-sity of the radiation. This detector exhibits goodsensitivity and good response to a wide range ofwavelengths, and does not require cooling of thedetector. It is the most commonly used detectorfor gas monitors.
d. Photon Detector: Photons possess energy basedon their wavelength and intensity. A photon de-tector detects the quantum interaction betweenincident photons and semiconductor material. Aphoton that strikes an electron with sufficient en-ergy can raise the electron from a nonconductingstate into a conducting state. The presence of elec-trons in the conduction band will increase the con-ductivity of the chip, and a bias voltage registersthis change as a signal.
The excitation of electrons requires photonsto have a certain amount of energy. Shorter wave-lengths have higher frequencies, and thereforemore energy. This detector functions in a limitedspectral region, which depends on the detectormaterial being used. Typically, the detector mustbe cooled with a thermoelectric cooler or evenliquid nitrogen for it to function properly. A typi-cal example of such detectors are lead sulfide(PbS) detectors used in the 1-3 micron region, andlead selenide (PbSe) detectors used in the 1-5micron region.
PYROELECTRIC
Pyroelectric Crystal
Infrared
63
Chapter 5 Infrared Gas Sensors
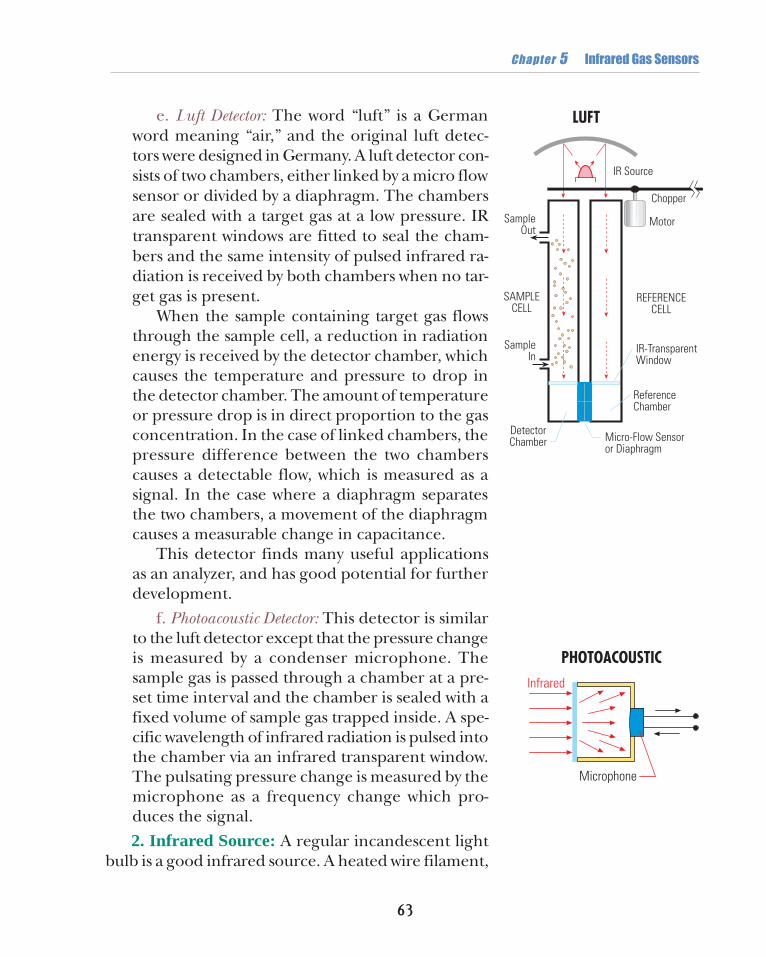
e. Luft Detector: The word “luft” is a Germanword meaning “air,” and the original luft detec-tors were designed in Germany. A luft detector con-sists of two chambers, either linked by a micro flowsensor or divided by a diaphragm. The chambersare sealed with a target gas at a low pressure. IRtransparent windows are fitted to seal the cham-bers and the same intensity of pulsed infrared ra-diation is received by both chambers when no tar-get gas is present.
When the sample containing target gas flowsthrough the sample cell, a reduction in radiationenergy is received by the detector chamber, whichcauses the temperature and pressure to drop inthe detector chamber. The amount of temperatureor pressure drop is in direct proportion to the gasconcentration. In the case of linked chambers, thepressure difference between the two chamberscauses a detectable flow, which is measured as asignal. In the case where a diaphragm separatesthe two chambers, a movement of the diaphragmcauses a measurable change in capacitance.
This detector finds many useful applicationsas an analyzer, and has good potential for furtherdevelopment.
f. Photoacoustic Detector: This detector is similarto the luft detector except that the pressure changeis measured by a condenser microphone. Thesample gas is passed through a chamber at a pre-set time interval and the chamber is sealed with afixed volume of sample gas trapped inside. A spe-cific wavelength of infrared radiation is pulsed intothe chamber via an infrared transparent window.The pulsating pressure change is measured by themicrophone as a frequency change which pro-duces the signal.
2. Infrared Source: A regular incandescent lightbulb is a good infrared source. A heated wire filament,
Microphone
Infrared
PHOTOACOUSTIC
SampleOut
SampleIn
IR-TransparentWindow
SAMPLECELL
REFERENCECELL
Micro-Flow Sensoror Diaphragm
Chopper
Motor
IR Source
ReferenceChamber
DetectorChamber
LUFT

64
Hazardous Gas Monitors
similar to that in a pen flashlight, radiates sufficientenergy in the 1-5 micron range for the detection ofmost hydrocarbons, carbon dioxide, and carbon mon-oxide. This simple and inexpensive light source of-fers long life and long-term stability.
Any source that can generate enough radiation atthe wavelength of interest for the purpose of detect-ing the specific target gas may be used. There are manylight sources available, ranging from specially designedheating filaments to electronically generated sources.
Modulating the light. Depending on the type ofdetector used, it may be necessary to modulate thelight source, turning it on and off at a specific fre-quency, in order for the detector and correspondingcircuitry to function properly. Typically, this is doneby passing the light through a chopper blade, whichresembles a fan blade. The blade interrupts the light,creating a pulsing frequency. The frequency is deter-mined by the speed of the motor and arrangement ofthe chopper blade.
The advantage of the chopper is that it is simpleand can provide a high chopping frequency, one whichwould otherwise be unattainable by a pulsing filamentsource. This is due to the fact that the filament is aheated wire and is limited to how fast it can be heatedup and cooled down. Although choppers do have ad-vantages, the large size of the chopper and motor as-sembly can be a liability for applications that requirea simple, rugged instrument for use in harsh locations.For this reason, pulsing filament sources are usedwhenever possible. The pulsating filament source typi-cally provides a wavelength in the range of 2-5 microns,depending on the filament temperature and bulb en-closure material. There are many different lightsources and modulating techniques available.
3. Optical filter: There are two basic types of gasanalyzers, namely dispersive and nondispersive. The dif-ference between the two is the way in which the spe-

65
Chapter 5 Infrared Gas Sensors
cific wavelength of interest is extracted from the infra-red source.
Dispersive types utilize an optical device such as agrating or prism to spread the light spectrum over anarea containing the wavelength of interest.
Nondispersive types use discrete optical bandpassfilters, similar to sunglasses that are used for eyeprotection to filter out unwanted UV radiation. Thistype of configuration is commonly referred to asnondispersive infrared (NDIR). Almost all commercialIR instruments are of the nondispersive type. The dis-persive type instrument is typically used only for spe-cial requirements. The bandpass filter is one of themost important components in designing for the typeof target gas and selectivity of an analyzer. The filtersare generally produced by a specialty optical manu-facturer. Typical specifications for a methane filter areshown in Figure 7.
Percent transmittance specifies the ratio of transmit-
Fig. 7 Methane Filter Specifications
Peak Wavelength
Peak Transmission
Transmission Region
Bandwidth
Center Wavelength
Wavelength (µm)
Tran
smitt
ance
100%
80%
60%
40%
20%
0%3.0 3.1 3.2 3.3 3.4 3.5 3.6 3.7 3.8 3.9 4.0

66
Hazardous Gas Monitors
ted radiation to the incident radiation. Bandwidth isdefined as the range of wavelengths that pass throughthe filter at half of the peak transmission point. Band-width determines the selectivity of the filter, and hencethe selectivity of the instrument. Center wavelength de-termines the gas that will be detected. There are cer-tain designs where filters of different wavelengths aremounted in a carousal arrangement. By exposing thegas mixture to different filters, different gases in thegas mixture can be identified.
4. Gas Cell/Light Path: Gas cells are often designedin such a way as to allow the light path to interact with
the sample gas. This is normally done by using atube that allows light to enter from one end andexit the other, where it meets the detector. Thereare “inlet” and “outlet” ports that allow the samplegas to circulate through the tube.
The path length, or the distance in which thelight passes through the gas, is called the length ofthe gas cell. This length is in direct proportion to
the amount of radiation absorbed; that is, the longerthe path length, the more radiation will be absorbed.A longer path length results in a greater signal usingthe same amount of radiation. Since the gas cellsare in direct contact with the gas sample, it is desir-able to construct them using chemically inert mate-rials to ensure the long-term stability and reliabilityof the instrument.
Configuration
There are a number of ways by which various IRcomponents can be arranged to produce a gas ana-lyzer. The design may be relatively simple, or verycomplicated, using many different optical componentsdepending on the type of analyzers for the applica-tions. For applications that require high sensitivity, se-lectivity, and stability, the design of the analyzer is morecomplex. For applications where the selectivity and
Sample Gas Entrance/Exit
IR Source Detector
SELF-SAMPLING GAS CELL
67
Chapter 5 Infrared Gas Sensors
sensitivity can be compromised for reli-ability in a hostile, industrial environ-ment, a simpler design can be imple-mented.
Figures 8, 9, and 10 illustrate some ofthe basic features of an IR analyzer.
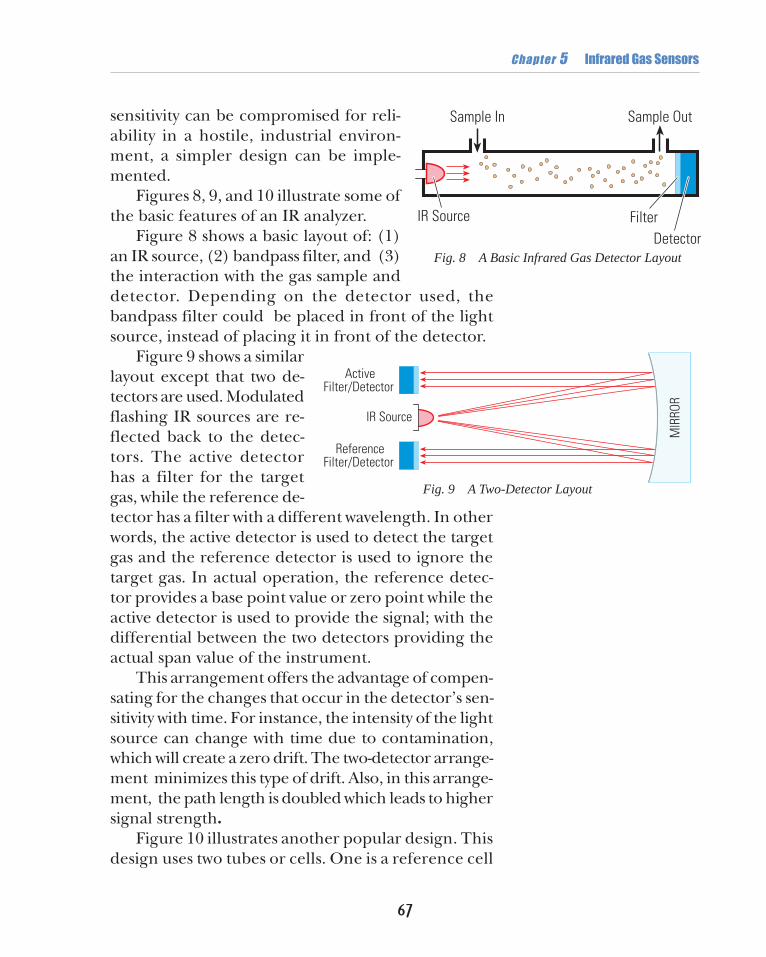
Figure 8 shows a basic layout of: (1)an IR source, (2) bandpass filter, and (3)the interaction with the gas sample anddetector. Depending on the detector used, thebandpass filter could be placed in front of the lightsource, instead of placing it in front of the detector.
Figure 9 shows a similarlayout except that two de-tectors are used. Modulatedflashing IR sources are re-flected back to the detec-tors. The active detectorhas a filter for the targetgas, while the reference de-tector has a filter with a different wavelength. In otherwords, the active detector is used to detect the targetgas and the reference detector is used to ignore thetarget gas. In actual operation, the reference detec-tor provides a base point value or zero point while theactive detector is used to provide the signal; with thedifferential between the two detectors providing theactual span value of the instrument.
This arrangement offers the advantage of compen-sating for the changes that occur in the detector’s sen-sitivity with time. For instance, the intensity of the lightsource can change with time due to contamination,which will create a zero drift. The two-detector arrange-ment minimizes this type of drift. Also, in this arrange-ment, the path length is doubled which leads to highersignal strength.
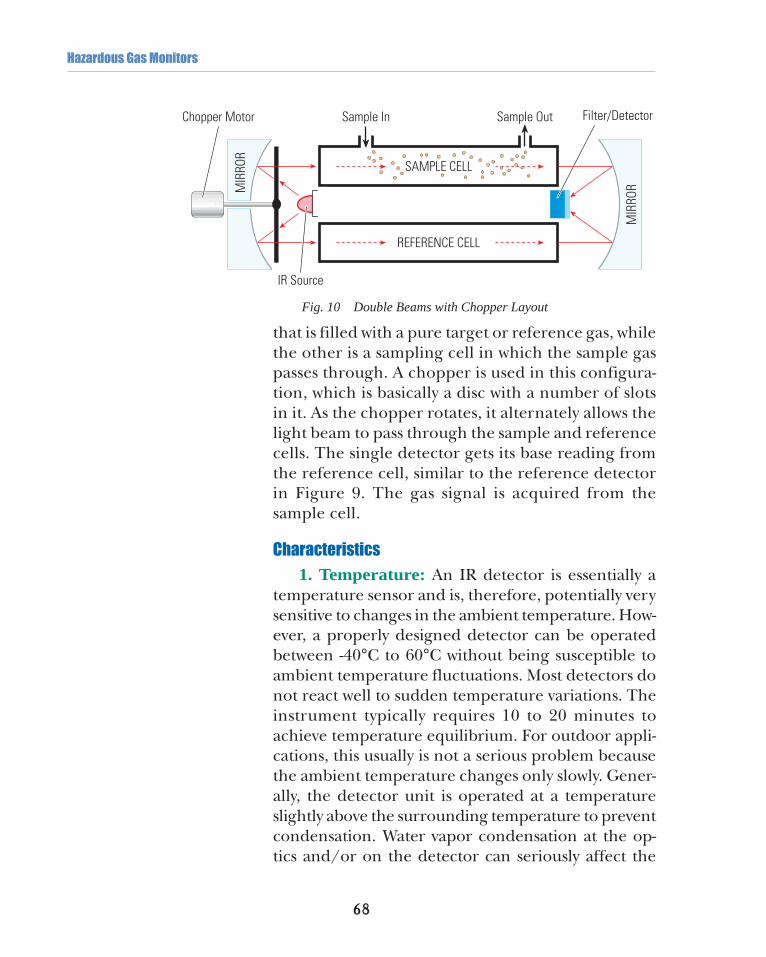
Figure 10 illustrates another popular design. Thisdesign uses two tubes or cells. One is a reference cell
Fig. 8 A Basic Infrared Gas Detector Layout
Sample Out
IR Source
Sample In
FilterDetector
Fig. 9 A Two-Detector Layout
ActiveFilter/Detector
MIR
ROR
ReferenceFilter/Detector
IR Source
68
Hazardous Gas Monitors
that is filled with a pure target or reference gas, whilethe other is a sampling cell in which the sample gaspasses through. A chopper is used in this configura-tion, which is basically a disc with a number of slotsin it. As the chopper rotates, it alternately allows thelight beam to pass through the sample and referencecells. The single detector gets its base reading fromthe reference cell, similar to the reference detectorin Figure 9. The gas signal is acquired from thesample cell.
Characteristics
1. Temperature: An IR detector is essentially atemperature sensor and is, therefore, potentially verysensitive to changes in the ambient temperature. How-ever, a properly designed detector can be operatedbetween -40°C to 60°C without being susceptible toambient temperature fluctuations. Most detectors donot react well to sudden temperature variations. Theinstrument typically requires 10 to 20 minutes toachieve temperature equilibrium. For outdoor appli-cations, this usually is not a serious problem becausethe ambient temperature changes only slowly. Gener-ally, the detector unit is operated at a temperatureslightly above the surrounding temperature to preventcondensation. Water vapor condensation at the op-tics and/or on the detector can seriously affect the
Sample OutSample In Filter/Detector
SAMPLE CELL
REFERENCE CELL
MIR
RORM
IRRO
R
Chopper Motor
IR Source
Fig. 10 Double Beams with Chopper Layout
69
Chapter 5 Infrared Gas Sensors
performance of the analyzer.
2. Humidity: Normal environmental humidity hasvery little effect. However, high humidity could promotecorrosion and contamination that lead to the failure ofthe analyzer. High humidity poses an even more seriousproblem in the presence of corrosive gases. The wavepath (sample chamber) can be constructed of any mate-rial that does not absorb the IR light. The most commonmaterials used are stainless steel, aluminum, or copper,plated with a corrosion-resistant coating. For some ex-tremely “wet” applications, such as a confined space, wetcontainers, or drainage sumps, the wet sample shouldbe “dried” before exposing it to the detector.
3. Sensitivity: The IR energy absorption is directlyproportional to the molecular structure of the hydrocar-bon (in addition to the concentration of the hydrocar-bon present). For example, the detector is least sensitiveto methane (CH4) with its simple, single bond. With pro-pane (C3H8) and butane (C4H10), however, the sensitivityincreases dramatically. An example of the drastic differ-ence between the sensitivity among varying hydrocarbonscan be seen by the fact that an IR detector can be cali-brated to 100% pure methane, but only a few percent byvolume of propane or butane will saturate the system. Inthe case of percent lower explosive limit (%LEL) or lowerflammable limit (LFL) applications, the volume concen-tration of each gas to reach 100% LFL or LEL varies,and the response curves are nonlinear; hence, each hy-drocarbon must have its own curve programmed intothe system. Unlike the catalytic sensor, which has nearlinear response to gases at the LFL range, the IR unitrequires some means to linearize the output.
4. Life Expectancy: The IR detector is a solid-statedevice that is sealed inside a standard electronic pack-age with a sapphire window filter. It has a long life ex-pectancy, similar to most electronic devices. The IR lightsource typically has a life expectancy on the order of 3 to

70
Hazardous Gas Monitors
5 years. This lifetime can be dramatically prolonged byoperating the source at a lower-than-designed energy.Alternatively, the IR source can be designed so that itcan be easily replaced when needed.
Application
As shown in Figure 11, the IR detector responds toradiation by generating a constant signal, which is con-sidered the “zero” point for the source. Once the zeropoint is established and maintained, the span calibra-tion is automatically taken care of. This is due to thefact that the absorption of radiation by the gas is alwaysin the same proportion, regardless of its initial sourceintensity. Therefore, as long as the zero point is main-tained, the accuracy of the detector remains intact. Thisis one of the biggest advantages of IR technology. How-ever, a routine calibration check is an invaluable safetycheck and should not be eliminated from any periodicmaintenance.
For gas monitoring applications, the design of theunit should be relatively compact. Sampling should bedone by diffusion. The extractive type methods thatrequire a pump to move the sample into the detectorare more troublesome due to the limited electricalmotor life expectancy and the maintenance requiredon the pump.
The IR instruments used for this monitoring appli-cation are typically limited to the detection of higherconcentrations (1% and above) of hydrocarbons andcarbon monoxide. Carbon dioxide absorbs infrared ra-diation very strongly, and many monitors are availablethat can detect carbon dioxide in concentration rangesof 0.1% and higher.
With the filter used for the %LEL combustible gasesapplication, the center wavelength is typically at 3.4microns. This is the wavelength of most hydrocarbonsand it is also where most of the hydrocarbon derivativegases have a strong absorption.
Fig. 11 Advantage of an IRDetector. Zero point has thehighest output making it easy todetect any abnormal condition.
Gas Concentration
Span
Zero
0
Signal

71
Chapter 5 Infrared Gas Sensors
Following is a list of common gases that are detected bythis detector:
1. Alkanes or saturated hydrocarbons such as methane,ethane, propane, butane, pentane, hexane, andheptane, etc.
2. Cycloalkanes such as cyclopropane, cyclohexane,methyl cyclohexane, etc.
3. Alkenes or unsaturated hydrocarbons such as ethylene,propylene, butene, pentene, hexene, octene, etc.Acetylene has absorption at 3.1 microns which is notdetectable.
4. Cycloalkenes such as cyclohexene and pinene.5. Aromatics such as benzene, toluene, and xylene.6. Alcohols such as methanol, ethanol, propanol, and
allyl alcohol.7. Amines such as dimethyl amine, trimethyl amine,
butanamine, cyclopropanamine, and pyridines.8. Ethers such as dimethyl ether, ethyl ether, n-propyl
ether, methylvinyl ether, vinyl ether, ethylene oxide,tetrahydrofuran, furan, and 1,4-dioxane.
9. Ketones such as acetone, methyl ethyl ketone,pentanone, methyl isobutyl ketone and heptanone.
10. Aldehydes that have a central wavelength mostly atthe 3.55 micron region and generally have a weakdetection signal at 3.4 microns.
Carbon dioxide at 4.3 microns and carbon monoxideat 4.6 microns have very little interference by other gases.
Summary
Detection of hydrocarbons using IR has been availablefor a few years. However, because of the many design op-tions, the features and implementation of the technologyvary greatly from one manufacturer to another. Neverthe-less, IR detection has been well received by many indus-tries, including the petrochemical industry.
For the purpose of area air quality and safety applica-
72
Hazardous Gas Monitors
tions, some comparisons between IR, solid-state, and cata-lytic bead sensors, used for the detection of combustiblegases are given below.
1. Poisoning: This is the main problem with catalyticsensors. Various chemical compounds, such as hydrogensulfide, silicon compounds, and chlorinated or fluorinatedcompounds, among others, can poison the catalyst in thesensor and cause the sensor to lose sensitivity. IR detec-tors do not suffer from this problem.
2. Burn Out: Catalytic senors will burn out if exposedto high gas concentrations. Again, IR detectors do nothave this problem.
3. Life Expectancy: Catalytic sensors have a life expect-ancy of about 1-2 years, while solid-state sensors typicallylast more than 10 years. A well-designed IR unit also has alife expectancy of more than 10 years.
4. Calibration: Periodic calibration must be done onall sensor types. However, on IR units, as long as the zerois maintained, the IR unit is assured a good response andgood span accuracy. Because of this characteristic, ab-normal functioning of an IR unit can be easily determined.
5. Continuous Exposure to Gas: In applications that re-quire the detector to be constantly exposed to a gas streamto monitor for hydrocarbons, catalytic and solid-state sen-sors will experience a shortened life span. Continuous ex-posure to gas ultimately changes the characteristic of thesensor and leads to permanent damage. However, withIR instruments, the functional components are protectedby the optical parts, which are basically inert to mostchemicals. Only the IR radiation interacts with the gas;therefore, as long as gas samples are dry and noncorro-sive, IR instruments can be used to monitor a gas streamcontinuously over a long period of time.
By selecting one of the three available sensor tech-nologies (IR, solid-state, and catalytic), one can tailor asolution to almost any hydrocarbon detection application.