infrared thermal imaging (i.r. amera thermography) … digital infrared thermal imaging (diti) uses...
TRANSCRIPT
Abstract
Digital Infrared Thermal Imaging (DITI) uses an infrared (IR) camera with an IR sensor array that receives photons emitted
from the skin surface and converts them into electrical impulses. These impulses are then reconstructed as images to show
individual heat patterns in different colors that are displayed for interpretation. The camera is typically placed directly in
front of the patient and an image is taken.
One shortcoming of this method involves the oblique aspects of the skin (e.g. side of the breast) which arrive at the camera at
a different focal length interfering with wavelength interpretation that may therefore contribute to false positive and nega-
tive results. In addition, IR camera images require expert “human” interpretation which is inherently subjective and can
result in missed or misinterpreted data further impacting accuracy.
Regulation Thermography uses a hand-held sensor equipped with a germanium crystal that filters the infrared photons spe-
cifically tuned to the temperature ranges of the human body. The sensor is held at precisely the same angle and distance
from the skin for each of the 120 points measured, and the data is evaluated digitally thereby eliminating human subjectivity
for increased accuracy. Sophisticated Internet-based ‘signature recognition’ software (an accumulation of 30 years of data
that has been clinically corroborated through blood tests, imaging, and pathology findings), recognizes signature patterns of
physiological disorders in nearly 40 categories.
The software not only identifies the disorder signature, but also indicates the severity of the fulfillment of that signature’s
pattern criteria. These advances not only guide physicians in developing targeted treatment strategies, but also address the
primary factors leading to false positives and negatives associated with medical thermography in general. Both Infrared
Thermal Imaging and Regulation Thermography can play important roles in health assessment and treatment optimization.
- 1 -
Infrared Thermal Imaging (I.R. Camera Thermography)
and Regulation Thermography in Medicine
Complementary & Non-Invasive Patient Assessment Tools
- A Comparative Study -
by Dr. Daniel Beilin, OMD, L.Ac.
Dr. Daniel Beilin has practiced complementary medicine for 32 years, and has a neurophysiology,
gastroenterology and herbal pharmacology background. He is internationally recognized for his contributions
to early detection and causal identification of disease using cutting-edge European technologies and methods.
From his website, fortifyhealth.com, he specializes in providing treatments to individuals using energetic as well
as orthomolecular and natural-product-based methods.
Dr. Beilin holds degrees from the University of California at Davis (Physiology) and SAMRA University in Los Angeles (Oriental
Medicine). He initiated the dark-field blood microscopy movement in the United States after having studied alternative hematol-
ogy in Germany. He then introduced Regulation Thermography to the U.S., and led the subsequent FDA clearances for this tech-
nology.
Dr. Beilin teaches dark-field hematology, dynamic thermography, and bio-pharmacology courses to physicians in the United
States, Asia, Europe, South America and Canada. He was past inventor of a sclerotherapy endoscopy needle that has been uti-
lized in modern medical applications (UCLA). He is the inventor of the AlfaSight™ 9000 Regulation Thermometry device, used
worldwide to help identify the root causes of chronic disease and disorders.
© 2015, Dr. Daniel Beilin, OMD, L.Ac.
Introduction
Medical thermography is a non-invasive, radiation-free physiological test that measures skin temperature and skin tem-
perature differences at focused locations through the use of infrared chip arrays. It provides information that can help
identify or clarify disease processes, and is considered an adjunct to conventional imaging tests such as X-Ray, mam-
mography, ultrasound, and MRI. Infrared Thermal Imaging (IR Camera method) records photon emissions from the skin
at a distance of 1-3 meters, while Regulation Thermography (point-temperature measurement method) uses an infra-
red, neurologically specific, controlled point, near-proximity (0.5 cm.) sensor that samples 120 points on the body sur-
face and can provide deep tissue and organ information specific to the measured regions as conveyed through the sym-
pathetic nervous system’s signals and response.
The primary objective of this paper is to illustrate that while both methods are valuable and complementary,
the addition of Regulation Thermography helps the physician to:
More clearly understand multiple and parallel influences in disease etiology
Reveal parallel dysfunctions that may not have been prioritized or realized
with conventional imaging methods
Direct a more specific treatment strategy
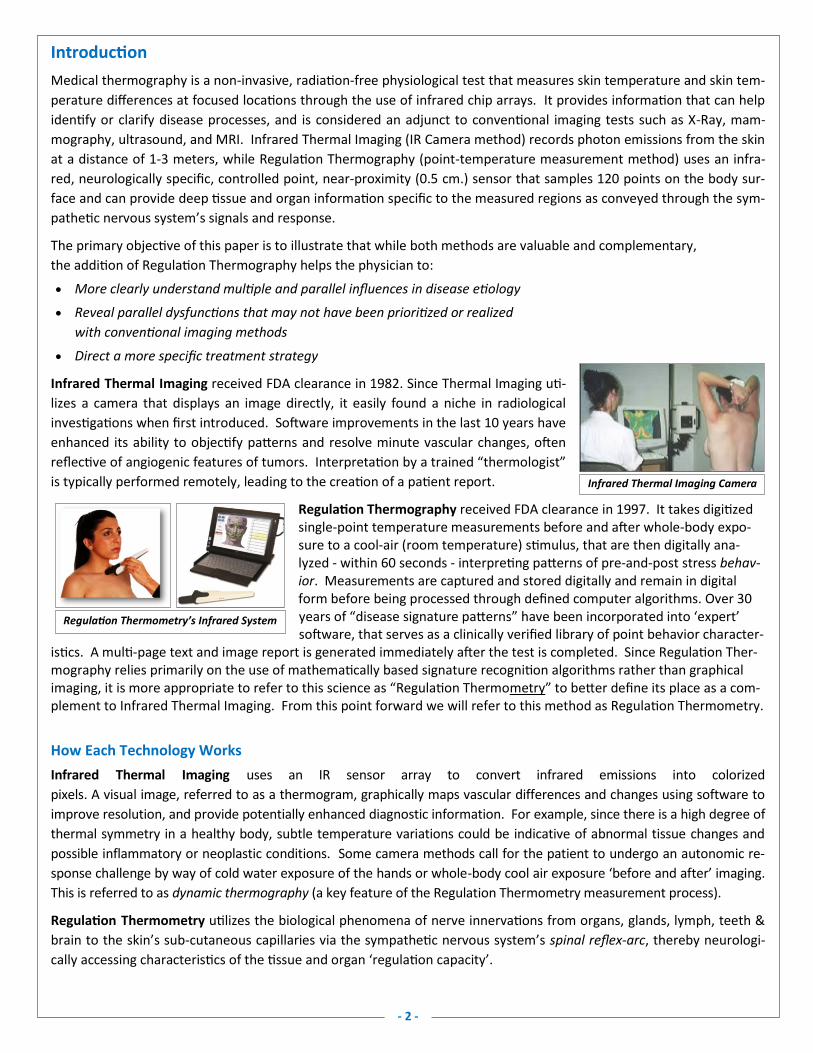
Infrared Thermal Imaging received FDA clearance in 1982. Since Thermal Imaging uti-
lizes a camera that displays an image directly, it easily found a niche in radiological
investigations when first introduced. Software improvements in the last 10 years have
enhanced its ability to objectify patterns and resolve minute vascular changes, often
reflective of angiogenic features of tumors. Interpretation by a trained “thermologist”
is typically performed remotely, leading to the creation of a patient report.
Regulation Thermography received FDA clearance in 1997. It takes digitized single-point temperature measurements before and after whole-body expo-sure to a cool-air (room temperature) stimulus, that are then digitally ana-lyzed - within 60 seconds - interpreting patterns of pre-and-post stress behav-ior. Measurements are captured and stored digitally and remain in digital form before being processed through defined computer algorithms. Over 30 years of “disease signature patterns” have been incorporated into ‘expert’ software, that serves as a clinically verified library of point behavior character-
istics. A multi-page text and image report is generated immediately after the test is completed. Since Regulation Ther-mography relies primarily on the use of mathematically based signature recognition algorithms rather than graphical imaging, it is more appropriate to refer to this science as “Regulation Thermometry” to better define its place as a com-plement to Infrared Thermal Imaging. From this point forward we will refer to this method as Regulation Thermometry.
How Each Technology Works
Infrared Thermal Imaging uses an IR sensor array to convert infrared emissions into colorized
pixels. A visual image, referred to as a thermogram, graphically maps vascular differences and changes using software to
improve resolution, and provide potentially enhanced diagnostic information. For example, since there is a high degree of
thermal symmetry in a healthy body, subtle temperature variations could be indicative of abnormal tissue changes and
possible inflammatory or neoplastic conditions. Some camera methods call for the patient to undergo an autonomic re-
sponse challenge by way of cold water exposure of the hands or whole-body cool air exposure ‘before and after’ imaging.
This is referred to as dynamic thermography (a key feature of the Regulation Thermometry measurement process).
Regulation Thermometry utilizes the biological phenomena of nerve innervations from organs, glands, lymph, teeth &
brain to the skin’s sub-cutaneous capillaries via the sympathetic nervous system’s spinal reflex-arc, thereby neurologi-
cally accessing characteristics of the tissue and organ ‘regulation capacity’.
- 2 -
Regulation Thermometry’s Infrared System
Infrared Thermal Imaging Camera
By measuring skin temperature and temperature changes before and
after a cool stress, information can be gained from specific organ-
influenced regions. The data is derived from the measurement and
relational behavior of two sets of point measurements taken before
and after the body is subjected to a 68-71°F (normal room tempera-
ture) exposure. The patterns of the point and region behavior are
compared to a database of some 30,000 cases, utilizing and compar-
ing data from proven ‘normal’ or ‘ideal’ point-temperature responses.
A graph of the temperature readings, referred to as a regulation ther-
mogram, is included in a data-driven report that includes written and
graphical portrayals of the various patterns or ‘signatures’. In addi-
tion, deviations from the known ideal behaviors, both regionally and
locally, are displayed by a synthesis-mapping of the behaviors onto a
2D colorized body image.
Because Regulation Thermometry provides insights into the internal biological terrain while analyzing and prioritizing
reflections of organ dysfunction, it can help to clarify potential causal factors of many disease processes often years be-
fore symptoms become visible through imaging methods.. Although it is able to reveal hidden focal infections and met-
abolic abnormalities through physiological functional resolution, Regulation Thermometry is not a substitute for other
anatomical resolution imaging methods, such as mammography, ultrasound, or infrared (IR) camera.
Case Study: 60 Year Old Female with Possible DCIS and Viral Presence
A 6o-year old female with a family history of breast cancer and a personal history of skin cancer (basal cell carcinoma.) pre-
sents at the clinic with a set of sequential Infrared Camera breast images evaluated to reflect a minor risk for malignant dis-
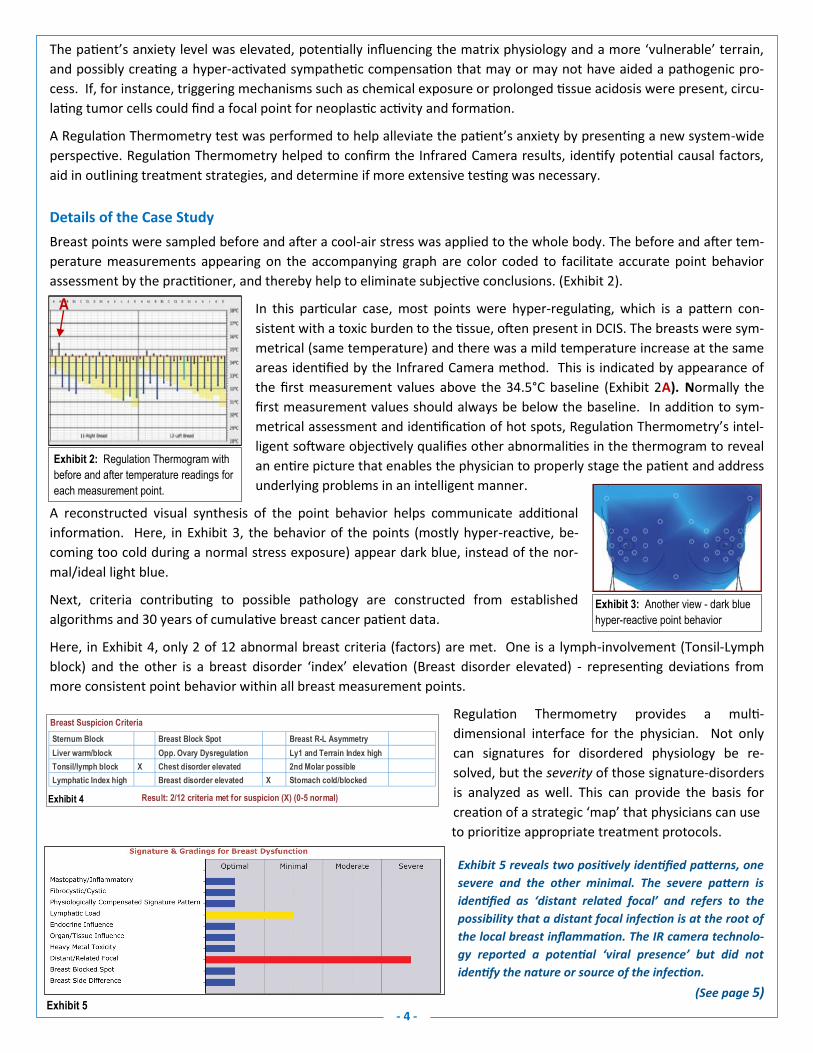
ease (TH-3F). Two hyperthermic (hot) spots appear on each breast, indicative of probable acute hyper-metabolic activity or
a mammary duct infection (Exhibit 1). . She was advised to return for a third test in 6 months for further clarification of risk
category.
The patient was anxious about the prospects of further aggressive diagnostic procedures such as biopsy, contrast MRI, etc.
She was also seeking recommendations for proactive steps she could take to address the findings, since the image resolu-
tion of the abnormality in temperature characteristics was not significant enough to determine a definitive course of appro-
priate action. The IR camera consultation suggested possible DCIS and a viral presence, but with no further direction for
therapeutic intervention. Status was clearly stable and not indicative of a progressive disorder. Although the IR Camera
method was able to show diminished risk, the data set was unable to identify any deeper causal and/or related surrounding
dysfunctions. This is a clear example of where anatomical resolution revealed abnormalities, but without functional resolu-
tion to reveal the surrounding influences and physiological dynamics, a treatment strategy could not be determined.
Exhibit 1: Second Infrared Camera Thermogram (nearly identical to one year prior) depicting hyperthermic vascular-related
regions as previously indicated, and again, a TH-3F classification not clearly indicative of metastatic presence, and with rec-
ommendations to repeat the test again in another 6 months.
- 3 -
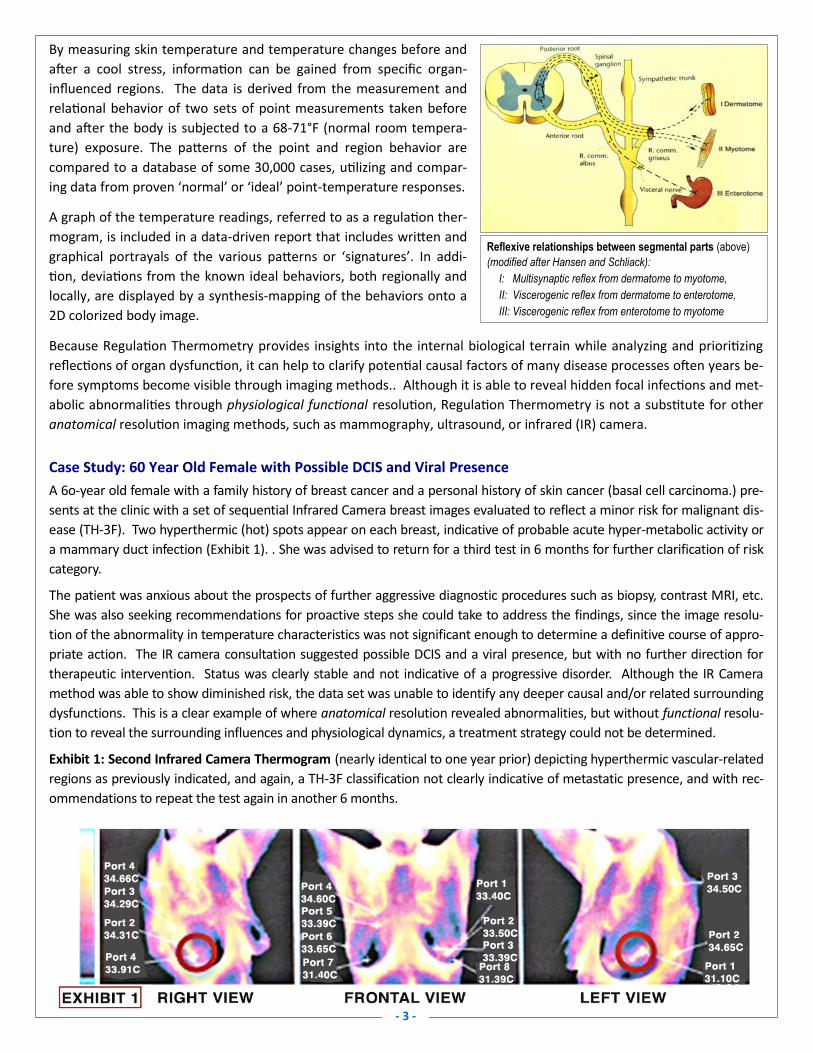
Reflexive relationships between segmental parts (above)
(modified after Hansen and Schliack):
I: Multisynaptic reflex from dermatome to myotome,
II: Viscerogenic reflex from dermatome to enterotome,
III: Viscerogenic reflex from enterotome to myotome
The patient’s anxiety level was elevated, potentially influencing the matrix physiology and a more ‘vulnerable’ terrain,
and possibly creating a hyper-activated sympathetic compensation that may or may not have aided a pathogenic pro-
cess. If, for instance, triggering mechanisms such as chemical exposure or prolonged tissue acidosis were present, circu-
lating tumor cells could find a focal point for neoplastic activity and formation.
A Regulation Thermometry test was performed to help alleviate the patient’s anxiety by presenting a new system-wide
perspective. Regulation Thermometry helped to confirm the Infrared Camera results, identify potential causal factors,
aid in outlining treatment strategies, and determine if more extensive testing was necessary.
Details of the Case Study
Breast points were sampled before and after a cool-air stress was applied to the whole body. The before and after tem-
perature measurements appearing on the accompanying graph are color coded to facilitate accurate point behavior
assessment by the practitioner, and thereby help to eliminate subjective conclusions. (Exhibit 2).
In this particular case, most points were hyper-regulating, which is a pattern con-
sistent with a toxic burden to the tissue, often present in DCIS. The breasts were sym-
metrical (same temperature) and there was a mild temperature increase at the same
areas identified by the Infrared Camera method. This is indicated by appearance of
the first measurement values above the 34.5°C baseline (Exhibit 2A). Normally the
first measurement values should always be below the baseline. In addition to sym-
metrical assessment and identification of hot spots, Regulation Thermometry’s intel-
ligent software objectively qualifies other abnormalities in the thermogram to reveal
an entire picture that enables the physician to properly stage the patient and address
underlying problems in an intelligent manner.
A reconstructed visual synthesis of the point behavior helps communicate additional
information. Here, in Exhibit 3, the behavior of the points (mostly hyper-reactive, be-
coming too cold during a normal stress exposure) appear dark blue, instead of the nor-
mal/ideal light blue.
Next, criteria contributing to possible pathology are constructed from established
algorithms and 30 years of cumulative breast cancer patient data.
Here, in Exhibit 4, only 2 of 12 abnormal breast criteria (factors) are met. One is a lymph-involvement (Tonsil-Lymph
block) and the other is a breast disorder ‘index’ elevation (Breast disorder elevated) - representing deviations from
more consistent point behavior within all breast measurement points.
Regulation Thermometry provides a multi-
dimensional interface for the physician. Not only
can signatures for disordered physiology be re-
solved, but the severity of those signature-disorders
is analyzed as well. This can provide the basis for
creation of a strategic ‘map’ that physicians can use
to prioritize appropriate treatment protocols.
Exhibit 5 reveals two positively identified patterns, one
severe and the other minimal. The severe pattern is
identified as ‘distant related focal’ and refers to the
possibility that a distant focal infection is at the root of
the local breast inflammation. The IR camera technolo-
gy reported a potential ‘viral presence’ but did not
identify the nature or source of the infection.
(See page 5)
- 4 - Exhibit 5
Exhibit 2: Regulation Thermogram with
before and after temperature readings for
each measurement point.
Exhibit 3: Another view - dark blue
hyper-reactive point behavior
A
Breast Suspicion Criteria
Result: 2/12 criteria met for suspicion (X) (0-5 normal) Exhibit 4
Sternum Block Breast Block Spot Breast R-L Asymmetry
Liver warm/block Opp. Ovary Dysregulation Ly1 and Terrain Index high
Tonsil/lymph block X Chest disorder elevated 2nd Molar possible
Lymphatic Index high Breast disorder elevated X Stomach cold/blocked
Distant Focal Infection: Dental Analysis Using Regulation Thermometry
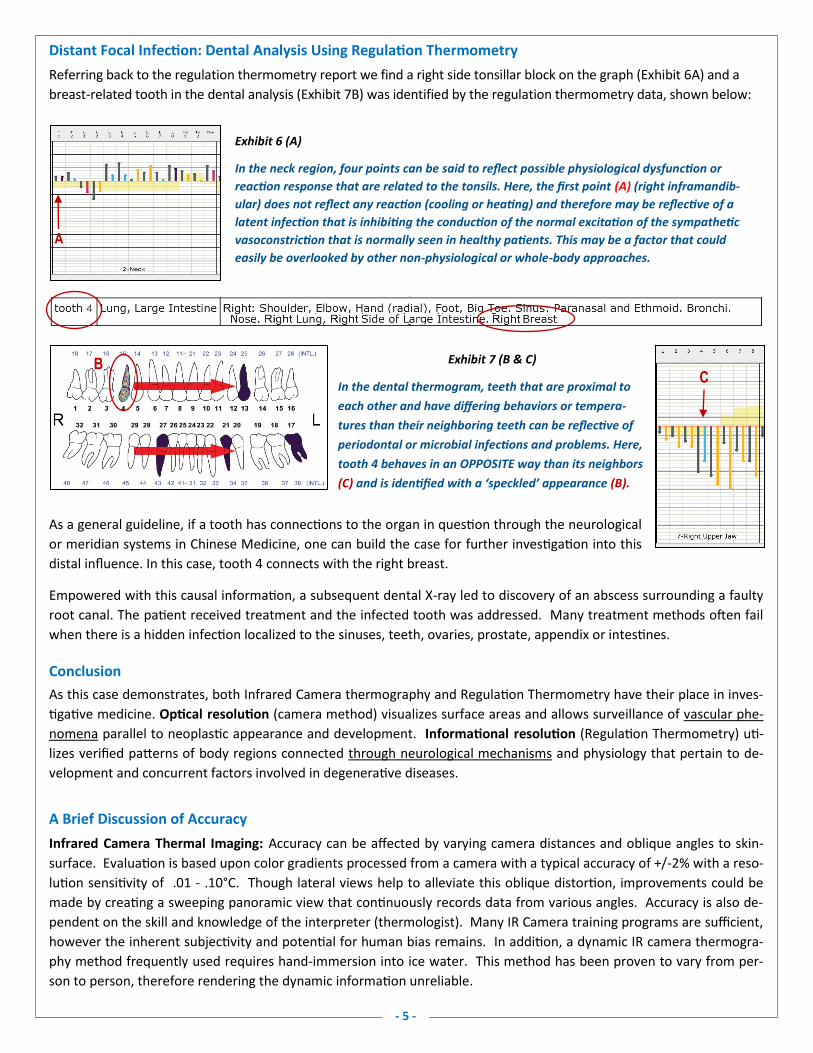
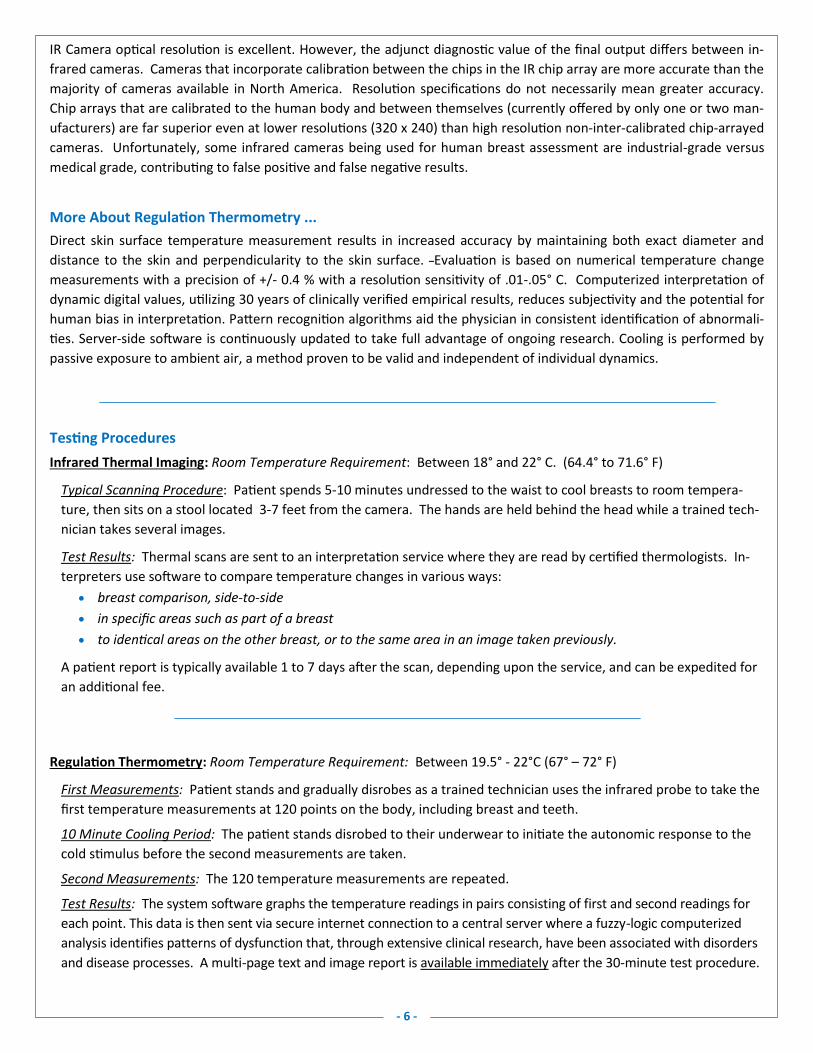
Referring back to the regulation thermometry report we find a right side tonsillar block on the graph (Exhibit 6A) and a
breast-related tooth in the dental analysis (Exhibit 7B) was identified by the regulation thermometry data, shown below:
As a general guideline, if a tooth has connections to the organ in question through the neurological
or meridian systems in Chinese Medicine, one can build the case for further investigation into this
distal influence. In this case, tooth 4 connects with the right breast.
Empowered with this causal information, a subsequent dental X-ray led to discovery of an abscess surrounding a faulty
root canal. The patient received treatment and the infected tooth was addressed. Many treatment methods often fail
when there is a hidden infection localized to the sinuses, teeth, ovaries, prostate, appendix or intestines.
Conclusion
As this case demonstrates, both Infrared Camera thermography and Regulation Thermometry have their place in inves-
tigative medicine. Optical resolution (camera method) visualizes surface areas and allows surveillance of vascular phe-
nomena parallel to neoplastic appearance and development. Informational resolution (Regulation Thermometry) uti-
lizes verified patterns of body regions connected through neurological mechanisms and physiology that pertain to de-
velopment and concurrent factors involved in degenerative diseases.
A Brief Discussion of Accuracy
Infrared Camera Thermal Imaging: Accuracy can be affected by varying camera distances and oblique angles to skin-
surface. Evaluation is based upon color gradients processed from a camera with a typical accuracy of +/-2% with a reso-
lution sensitivity of .01 - .10°C. Though lateral views help to alleviate this oblique distortion, improvements could be
made by creating a sweeping panoramic view that continuously records data from various angles. Accuracy is also de-
pendent on the skill and knowledge of the interpreter (thermologist). Many IR Camera training programs are sufficient,
however the inherent subjectivity and potential for human bias remains. In addition, a dynamic IR camera thermogra-
phy method frequently used requires hand-immersion into ice water. This method has been proven to vary from per-
son to person, therefore rendering the dynamic information unreliable.
- 5 -
Exhibit 6 (A)
In the neck region, four points can be said to reflect possible physiological dysfunction or
reaction response that are related to the tonsils. Here, the first point (A) (right inframandib-
ular) does not reflect any reaction (cooling or heating) and therefore may be reflective of a
latent infection that is inhibiting the conduction of the normal excitation of the sympathetic
vasoconstriction that is normally seen in healthy patients. This may be a factor that could
easily be overlooked by other non-physiological or whole-body approaches.
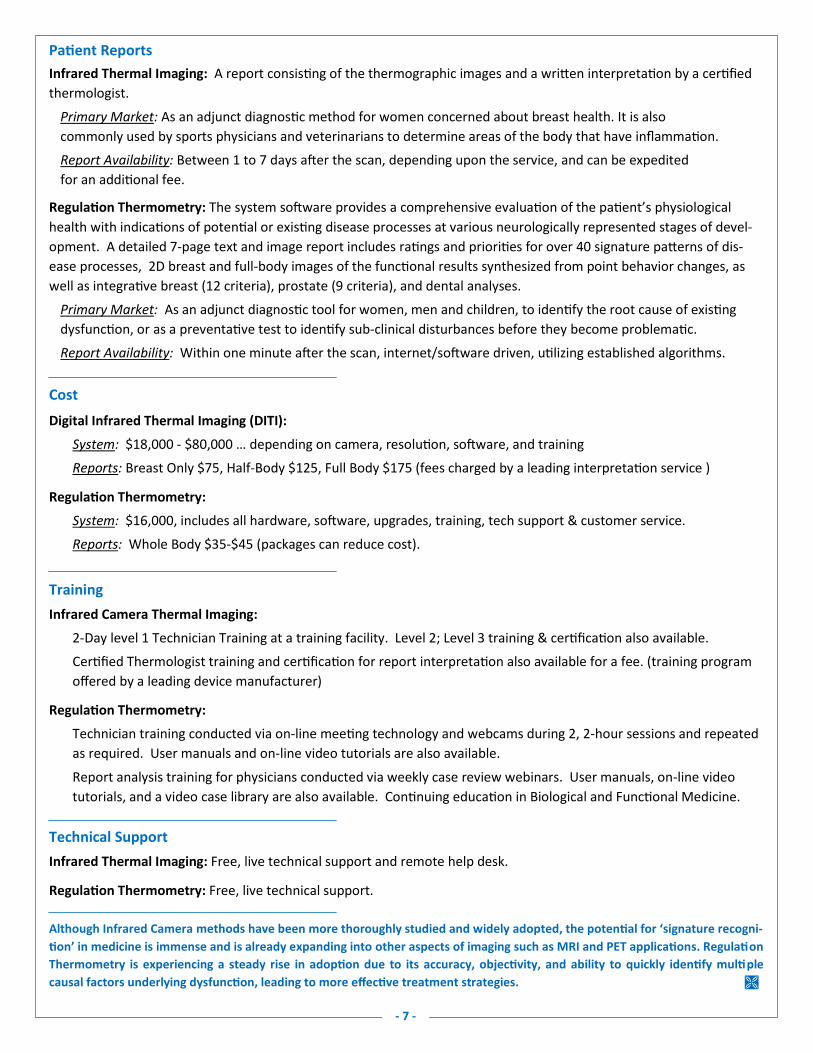
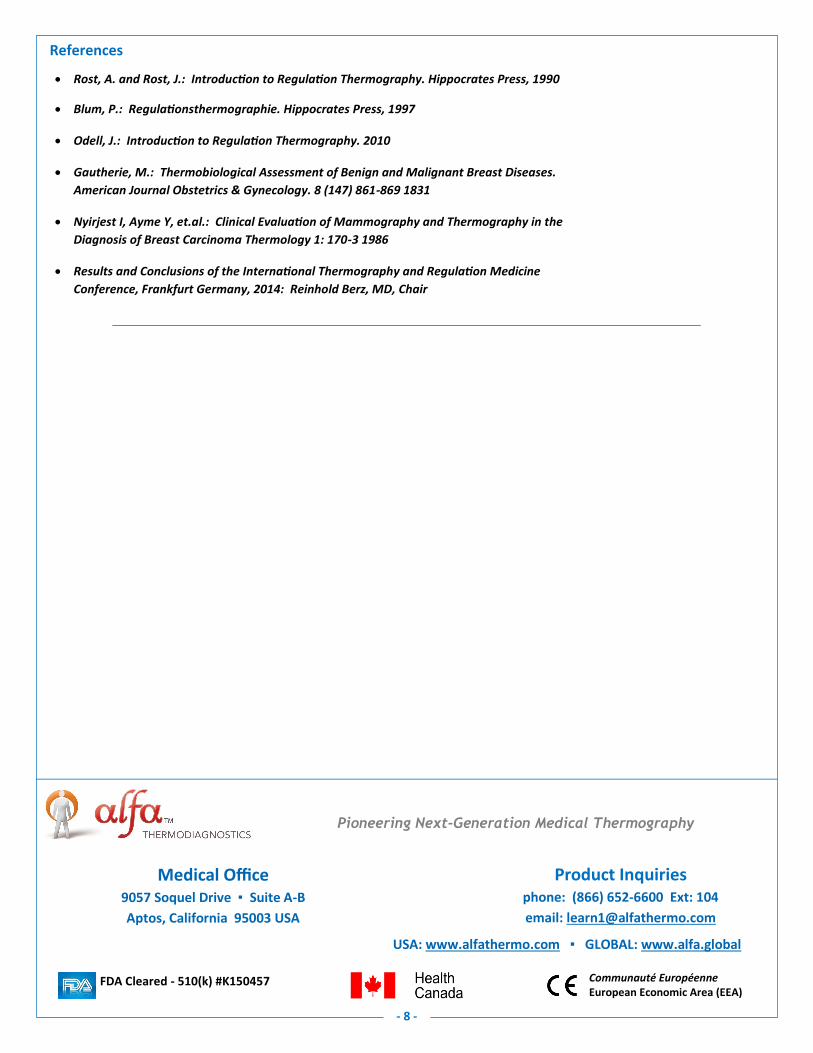
Exhibit 7 (B & C)
In the dental thermogram, teeth that are proximal to
each other and have differing behaviors or tempera-
tures than their neighboring teeth can be reflective of
periodontal or microbial infections and problems. Here,
tooth 4 behaves in an OPPOSITE way than its neighbors
(C) and is identified with a ‘speckled’ appearance (B).
A
B C
IR Camera optical resolution is excellent. However, the adjunct diagnostic value of the final output differs between in-
frared cameras. Cameras that incorporate calibration between the chips in the IR chip array are more accurate than the
majority of cameras available in North America. Resolution specifications do not necessarily mean greater accuracy.
Chip arrays that are calibrated to the human body and between themselves (currently offered by only one or two man-
ufacturers) are far superior even at lower resolutions (320 x 240) than high resolution non-inter-calibrated chip-arrayed
cameras. Unfortunately, some infrared cameras being used for human breast assessment are industrial-grade versus
medical grade, contributing to false positive and false negative results.
More About Regulation Thermometry ...
Direct skin surface temperature measurement results in increased accuracy by maintaining both exact diameter and
distance to the skin and perpendicularity to the skin surface. Evaluation is based on numerical temperature change
measurements with a precision of +/- 0.4 % with a resolution sensitivity of .01-.05° C. Computerized interpretation of
dynamic digital values, utilizing 30 years of clinically verified empirical results, reduces subjectivity and the potential for
human bias in interpretation. Pattern recognition algorithms aid the physician in consistent identification of abnormali-
ties. Server-side software is continuously updated to take full advantage of ongoing research. Cooling is performed by
passive exposure to ambient air, a method proven to be valid and independent of individual dynamics.
Testing Procedures
Infrared Thermal Imaging: Room Temperature Requirement: Between 18° and 22° C. (64.4° to 71.6° F)
Typical Scanning Procedure: Patient spends 5-10 minutes undressed to the waist to cool breasts to room tempera-
ture, then sits on a stool located 3-7 feet from the camera. The hands are held behind the head while a trained tech-
nician takes several images.
Test Results: Thermal scans are sent to an interpretation service where they are read by certified thermologists. In-
terpreters use software to compare temperature changes in various ways:
breast comparison, side-to-side
in specific areas such as part of a breast
to identical areas on the other breast, or to the same area in an image taken previously.
A patient report is typically available 1 to 7 days after the scan, depending upon the service, and can be expedited for
an additional fee.
Regulation Thermometry: Room Temperature Requirement: Between 19.5° - 22°C (67° – 72° F)
First Measurements: Patient stands and gradually disrobes as a trained technician uses the infrared probe to take the
first temperature measurements at 120 points on the body, including breast and teeth.
10 Minute Cooling Period: The patient stands disrobed to their underwear to initiate the autonomic response to the
cold stimulus before the second measurements are taken.
Second Measurements: The 120 temperature measurements are repeated.
Test Results: The system software graphs the temperature readings in pairs consisting of first and second readings for
each point. This data is then sent via secure internet connection to a central server where a fuzzy-logic computerized
analysis identifies patterns of dysfunction that, through extensive clinical research, have been associated with disorders
and disease processes. A multi-page text and image report is available immediately after the 30-minute test procedure.
- 6 -
Patient Reports
Infrared Thermal Imaging: A report consisting of the thermographic images and a written interpretation by a certified
thermologist.
Primary Market: As an adjunct diagnostic method for women concerned about breast health. It is also
commonly used by sports physicians and veterinarians to determine areas of the body that have inflammation.
Report Availability: Between 1 to 7 days after the scan, depending upon the service, and can be expedited
for an additional fee.
Regulation Thermometry: The system software provides a comprehensive evaluation of the patient’s physiological
health with indications of potential or existing disease processes at various neurologically represented stages of devel-
opment. A detailed 7-page text and image report includes ratings and priorities for over 40 signature patterns of dis-
ease processes, 2D breast and full-body images of the functional results synthesized from point behavior changes, as
well as integrative breast (12 criteria), prostate (9 criteria), and dental analyses.
Primary Market: As an adjunct diagnostic tool for women, men and children, to identify the root cause of existing
dysfunction, or as a preventative test to identify sub-clinical disturbances before they become problematic.
Report Availability: Within one minute after the scan, internet/software driven, utilizing established algorithms.
Cost
Digital Infrared Thermal Imaging (DITI):
System: $18,000 - $80,000 … depending on camera, resolution, software, and training
Reports: Breast Only $75, Half-Body $125, Full Body $175 (fees charged by a leading interpretation service )
Regulation Thermometry:
System: $16,000, includes all hardware, software, upgrades, training, tech support & customer service.
Reports: Whole Body $35-$45 (packages can reduce cost).
Training
Infrared Camera Thermal Imaging:
2-Day level 1 Technician Training at a training facility. Level 2; Level 3 training & certification also available.
Certified Thermologist training and certification for report interpretation also available for a fee. (training program
offered by a leading device manufacturer)
Regulation Thermometry:
Technician training conducted via on-line meeting technology and webcams during 2, 2-hour sessions and repeated
as required. User manuals and on-line video tutorials are also available.
Report analysis training for physicians conducted via weekly case review webinars. User manuals, on-line video
tutorials, and a video case library are also available. Continuing education in Biological and Functional Medicine.
Technical Support
Infrared Thermal Imaging: Free, live technical support and remote help desk.
Regulation Thermometry: Free, live technical support.
Although Infrared Camera methods have been more thoroughly studied and widely adopted, the potential for ‘signature recogni-
tion’ in medicine is immense and is already expanding into other aspects of imaging such as MRI and PET applications. Regulation
Thermometry is experiencing a steady rise in adoption due to its accuracy, objectivity, and ability to quickly identify multiple
causal factors underlying dysfunction, leading to more effective treatment strategies.
- 7 -
References
Rost, A. and Rost, J.: Introduction to Regulation Thermography. Hippocrates Press, 1990
Blum, P.: Regulationsthermographie. Hippocrates Press, 1997
Odell, J.: Introduction to Regulation Thermography. 2010
Gautherie, M.: Thermobiological Assessment of Benign and Malignant Breast Diseases.
American Journal Obstetrics & Gynecology. 8 (147) 861-869 1831
Nyirjest I, Ayme Y, et.al.: Clinical Evaluation of Mammography and Thermography in the
Diagnosis of Breast Carcinoma Thermology 1: 170-3 1986
Results and Conclusions of the International Thermography and Regulation Medicine
Conference, Frankfurt Germany, 2014: Reinhold Berz, MD, Chair
- 8 -
Pioneering Next-Generation Medical Thermography
USA: www.alfathermo.com ▪ GLOBAL: www.alfa.global
FDA Cleared - 510(k) #K150457
Medical Office 9057 Soquel Drive ▪ Suite A-B
Aptos, California 95003 USA
Product Inquiries phone: (866) 652-6600 Ext: 104
email: [email protected]
Communauté Européenne European Economic Area (EEA)