infrastructural development and environmental status...
TRANSCRIPT

63
Chapter 5
INFRASTRUCTURAL DEVELOPMENT AND
ENVIRONMENTAL STATUS OF HALDWANI URBAN AREA
In order to understand the urbanization and environment interface, the
urbanization of Haldwani is studied keeping in mind the following indicators:
1. Population 2. Urban land use 3. Transportation 4. Water supply 5. Sanitation
and drainage 6. Industrial growth 7. Occupational structure. But to study the
environmental status of the city with regard to the infrastructural developmental,
emphasis is specially put on the physical indicators of urbanization viz. –(1)
Urban land use (2) Transportation (3)Water supply(4) Sanitation and drainage (6)
Industrial growth.
The parameters of environmental dimensions taken into account are:
1. Pollution (air, water, land and noise) 2. Green cover depletion 3. Problem of
sewage and solid waste disposal
1. Population
(i) Population growth
Being the largest city and an important commercial centre of Kumaun,
the population and population growth is higher than the population of other cities
of Kumaun region. People have migrated here not just from the hilly regions of
Kumaun but also from Nepal and states like U.P., Bihar and Bengal in order to
earn a living.
The total population of Haldwani- Kathgodam regulated area which
consists of urban as well as rural areas is 203608. However, the total population
of Haldwani urban area is 129015 (census 2001).
Estelar

64
The total population and population increase is depicted in the following
table:
Table 5.02
Population trends of Haldwani from 1901 to 2001
Census year Population Decennial Growth Decennial Growth Rate (%)
1901 7498 - -
1911 7605 107 1.43
1921 8536 931 12.11
1931 11288 2752 32.24
1941 17967 5588 59.24
1951 23665 7089 39.43
1961 38022 12967 51.73
1971 52205 14178 37.27
1981 77300 25095 48.07
1991 104195 26895 37.79
2001 129015 23408 22.48
Source: Census Book, N.I.C. Nainital
It is clear from the table that increase in population was highest in the
decade 1931-41. The reason for this is the development of commercial activities
during that period. There is a steady increase in the population of the city. In
1901 the population was only 7498, which increased to 129015 in 2001 (more
than 17 times). The main reason for the increase in population is the growth and
development of trade and commerce and setting up of small industrial units.
After the inception of the State of Uttarakhand on November 9, 2000,
there has been a rapid development and at present the estimated population of the
city is 185564. The establishment of medical college in Haldwani and SIDCUL
(State Infrastructure Industrial Development Corporation of Uttarakhand) in 2002
Estelar

65
in Udham Singh nagar has also opened new vistas of human settlement in
Haldwani.
(ii) Density of population
The total area under Haldwani urban area is 1062 hectare. The density of
population of Haldwani was 36 persons per hectare in 1961 which went up to 46
persons per hectare in 1971 and this increased to 73 persons per hectare in 1981.
In 1991 the density of population was 98 persons per hectare which went up to
120 persons per hectare in 2001.
(iii) Family size
The size of family in the urban area is 5.7 persons (Census 2001) which
was 5.6 in 1991. The family size of each of the wards is different with some
wards like Damudhunga, Malli Bamori and Bhotia Parao having family size as
small of 4.7 persons and others like Banbhoolpura having family size of 7.1
persons.
(iv) Sex ratio
According to census 1971 the sex ratio was merely 770 with 56.40
percent males and 43.5 percent females. In 1981, there were 53.56 percent males
and 46.44 percent females. Therefore, there were 823 females per 1000 males. In
1991 there were 54.27 percent males and 45.73 percent females. Hence, the sex
ratio was 842 in 1991.In 2001 the sex ratio went up to 876.
(v) Literacy
In the year 1991, the literacy rate of Haldwani urban area was 57%. In
2001 the literacy rate went up to 68.17% with male literacy rate as 71.83% and
Estelar

66
female literacy rate as 63.99%. Out of the total population, there are 87949
literates out of which 49385 are males and 38563 are females.
The distribution of population throughout the city is highly uneven.
Some of the areas are densely populated while some areas are not. Out of the
total 25 wards, some have high density of population like Indranagar east and
Banbhoolpura and some wards have low density of population like Bhawaniganj
and Bazar area.
2. Urban Land Use
The Government of India set up a committee for urban land policy in 1965
and stated that the objectives of urban land policy should be to:
1. Achieve an optimum social use of urban land
2. Make land available in adequate quantity at right time and at reasonable price
to both public authorities as well as to the individual.
3. Encourage co-operative, community effort and bonafide individual builders in
the field of land development, housing and construction.
4. Prevent concentration of land ownership in few private hands and safeguard
especially the interests of poor and underprivileged section of urban society.
However, no serious efforts were made to achieve the above objectives. The
centrally sponsored scheme of Integrated Development of Small and Medium
Towns (IDSMT) was initiated in the Sixth Plan (1979-80). The towns under
consideration were with population slabs-
1. 20000-50000
2. 50000 -100000
3. 100000-300000
4. 300000-500000
Estelar

67
The components for assistance under IDSMT were to include works as per
City/Town Development/Master Plans which may have city/ town wide
significances. An illustrative list is as under:
1. Strengthening of Master Plan road facilities including ring, arterial, bypass/link
roads and small bridges
2. Site and services
3. Development of bus/truck terminals
4. Construction/up gradation of Master Plan drains including storm water
channels
5. Solid Waste Management
6. Development of market complexes/shopping centres
7. Provision of tourist facilities
8. Development of city/town parks
9. Street lighting for Master Plan roads
10. Slaughter houses
11. Major public amenities like gardens, playgrounds, marriage halls, pay and use
toilets, etc.
12.Cycle/rickshaw stands
13. Traffic improvement and management schemes
14. Construction of retaining walls and slope stability measures in hill station
towns
15. Social amenities, especially for the poor sections
This was a futuristic framework for urban development by the government
of India.
Considering the studies and trends regarding the development and growth
of other cities and the population growth of Haldwani cum Kathgodam municipal
area till 2025, which is assumed to be 4.31 lakh, a master plan was formulated
and announced on 10th November 2003.
Estelar

68
Commencement of the masterplan was not welcomed by the rural community
because the guidelines given in the master plan were not in the interest of the
rural population including the farmers. The guidelines include the following –
(i) The land use as mentioned in the master plan should be followed by the
farmers.
(ii) The residents will have to play several taxes such as house tax, sewage tax,
sanitation tax, etc.
(iii) If the farmers utilize or sell their land for residential complex they have to
follow norms regarding roads, drainage, open spaces etc. as mentioned in the
master plan.
(iv) If they utilize or sell land for market or marketing complex they will have to
register their agricultural land for commercial status under the land
registration act 143.
The master plan has been prepared in such a way that it can fulfill all the
needs and demands of the projected population. Thus, the masterplan for
Haldwani urban area is basically a programme for land use and its lawful
regularization in order to create a balance for the optional need of the future
population and its social, cultural and economic development in the recent urban
scenario
Due to the oversaturation of the main urban area the development is mainly
directed towards the adjoining areas which are beyond the municipal limits.
These areas comprising of 32 villages and further 24 villages together with the
main municipal area constitute Haldwani-Kathgodam regulated area. Though
these areas come under the rural ambit but they are an expression of the physical
development of the city and have an urban form. There are sporadically some
open spaces present within the municipal area which are used as graveyard,
grounds, etc in an unplanned way. Besides this, there are some open spaces
which have developed as stadium, parks, ‘Ramleela maidan’ etc in a planned
Estelar

69
manner. The open spaces beyond the ambit of municipality are mainly for
agricultural purpose.
In the due course of development various changes have occurred and have
given shape to present form of the city
(1) The central part of the city includes civil hospital, female hospital, market
area, ‘sabji mandi’ etc. It is developed on both sides of Nainital-Bareilly road.
This dense area is the main part of the city and the main commercial centre.
This part of the city was predominantly a residential area but gradually it took
a commercial shape. Due to its central location, easy access and high prices of
land, this part of the city mainly has multistoried commercial complexes
instead of residential houses. As a consequence, lot of anomalies is observed
in the planning of the city which are as under:
(i) Due to the development of uncontrolled and unplanned commercial activities
the main urban area has high population density. At the same time, the
population pressure on the limited urban infrastructure has badly affected
services like water, electricity, sanitation, sewerage system, etc.
(ii) Uncontrolled commercial activities have given rise to serious traffic problem.
Due to this, vehicular transportation has become more and more impeditive
day by day. The situation has got worsened in the absence of proper off street
parking in the limited road infrastructure.
(iii) As a result of exponential growth of commercial activities the area that is
beyond the main area is also engulfed and this has marginalized the residential
use of land.
(2) Most developed area of the urban expanse is situated near the above
mentioned dense area and within the regulated area, in which commercial
buildings are pre-dominantly present along the main road. Planned open areas
and community utility offices are also situated in this area along the main
road. Residential areas are also present in the main urban area. As a result of
Estelar

70
this sort of development i.e. the location of commercial expansions and
community services along the main road only, the residential areas located
away from the main road face a lack of the basic services.
(3) Such residential areas also lack proper road facilities. The roads are found to
be 4.5mt to 6 mt. whereas roads with a width of 9 mt. are permissible.
(4) The linear sort of development along the road has curbed any future
possibility to widen the road and any proposal to construct new roads.
Evidently, the past decade has witnessed relatively much faster rate of urban
settlements especially after the commencement of the state of Uttaranchal (now
Uttarakhand) As a result; the adjoining villages along Rampur road, Kaladhungi
road, Lamachaur area, Halduchaur area, etc. have been occupied in random
unplanned manner and have culminated into residential extension of the city.
This very form of non contextual, unbalanced and random development with
respect to infrastructure has become a problem for the city. The whole present
existential situation reflects an unhealthy and distorted picture of future city.
Development of Haldwani has taken place in the form of mixed land use
pattern in an unusual way. At present the total area under Haldwani Municipal
Corporation is 1062 hectares and this is divided into two parts: (i) the constructed
area and (ii) the open area. Residential and commercial areas, offices, industry
and community services and facilities fall under the constructed part whereas
agricultural land, garden, barren land, canals comprising 708.32 hectares of the
total area fall under open area. Further, this area can be taken for future planning.
The table shows the pattern of land use and area under Haldwani-Kathgodam
regulated area.
Estelar

71
Table 5.02
Land use Pattern of Haldwani-Kathgodam regulated area
S.No. Land use Area (Hectares) Percentage (%)
(A) Developed Area
1. Residential 768.32 12.0
Built Residential 675.11 10.6
Rural population 98.21 1.4
2. Commercial 29.90 0.4
Retail 2.0 -
Petrol Pump 4.0 0.1
Cinema Hall 3.00 0.05
Whole sale market 18.09 0.3
Store Houses 2.81 -
3. Offices 30.93 0.5
4. Industries 18.76 0.3
5. Community Services 94.14 1.05
Educational 43.37 0.7
Technological 19.92 0.3
Research Centre 22.91 0.4
Hospital/Health centres 7.94 0.1
6. Utilities and Services 54.21 0.9
Parks and play grounds 5.76 0.1
Rest houses 1.35 -
Religious places 0.75 -
Police station 0.82 -
Jail 3.33 0.1
Fire station 0.12 -
Electricity/power house 4.00 0.1
Graveyard/ cemetery 29.22 0.5
7. Transportation 86.10 1.4
Bus station 1.30 0.1
Estelar

72
Roads 31.12 0.5
Railway land 53.68 0.8
(B) Underdeveloped Area 5292.04 83.0
Grounds/open area/ 4992.04 78.3
Nala/Canals/Rivers 300.00 4.7
6374.00 100.00
The table clearly suggests that 675.11 hectare land is utilized for residential
purpose from the Haldwani -Kathgodam municipal area which is 10.6% of the
total area.
Haldwani has been a commercial city since the very beginning providing
goods and services to entire Kumaun region. At present the market area is spread
along the main Nainital- Bareilly road. This is the main area of the city and
includes banks, petrol pumps, cinema halls etc. Its total area is 29.90 hectare
which is 0.4% of the total area.
The main central part of the city deals with commercial activities. Thus,
pattern of the city is mainly responsible for the problem of transportation.
Loading and unloading of goods on main road has created the problem of traffic
jam. Since there is only one parking area in the entire city hence the main road
sides are thronged with vehicles. This kind of land use has become a potential
threat to the environment.
Haldwani is an important ‘tehsil’ headquarter of Nainital district.
Therefore various offices of centre and state are present along with the ‘tehsil’.
This area occupies 30.93 hectares (0.5%) of the total area.
Haldwani is an important city of Kumaun especially for commercial
purposes. Several small scale and handicraft and few large scale industries are
established here. HMT factory at Ranibagh and Ganesh Kattha factory on
Estelar

73
Rampur road are the main industries besides the stone crushing factory on
Bareilly and Rampur road which lie beyond the municipal limits.
At present the total area occupied by industries is 18.76 hectare which is
0.3% of the total built area. Transportation occupies 86.10 hectare of land which
is 1.4% of total area.
According to the master plan there is about 5292.04 hectare land (83 % of
the total area) which is presently utilized for agriculture, horticulture, forests,
canals, etc.
3. Transportation
In a society which is urbanizing rapidly, transport and communication
are usually the sectors that show fastest growth. Within transportation, it is the
use of personally owned transport and not the public transport that has increased
greatly. In Haldwani the problem of unscrupulous, uncontrolled and unorganized
traffic has increased manifolds after the inception of the state of Uttarakhand. In
the city, various modes of transportation like authorikshaws, cyclerikshaws, cars,
two wheelers, bicycles etc. are used which create traffic problems. These vehicles
move at different speeds and the effective management of traffic becomes very
difficult. Lack of parking spaces, linear development of the market place along
the main road, ignoring traffic rules and also the lack of ethics among the
populace are some other causes of traffic problems. It is generally taken for
granted that traffic congestion and environmental pollution are aggravated with
the greater use of personal transport than of public transport.
A trend that is very common in Haldwani is the presence of 2 or more
number of two wheelers in one family. The working population including women
uses 2 wheelers for conveyance and the young generation widely uses vehicles to
colleges, schools and even tuition classes.
Estelar

74
There has been a tremendous growth in the transport sector. The table
below shows the number of annually registered vehicles in Haldwani from the
year 2000 to 2008.
Table 5.03
No. of Annually Registered Vehicles
S. No. Year No. of registered Vehicles % increase
1. March 01-02 6338 -
2. March 02-03 6702 5.74
3. March 03-04 7393 10.31
4. March 04-05 10658 44.16
5. March 05-06 10069 -5.52
6. March 06-07 12817 27.29
7. March 07-08 16895 31.82
Source: Regional Transport Office, Haldwani
The above table clearly suggests that there is a continuous increase in the
number of vehicles registered in the city. The highest percentage increase is in
the period March 04-05.
Out of the total annually registered vehicles, motorcycles account for more
than 50% of the registration every year followed by cars which account for 11%
to 15 % of the total registered vehicles. The table shows the different type of
vehicles registered each year in Haldwani.Estelar
75
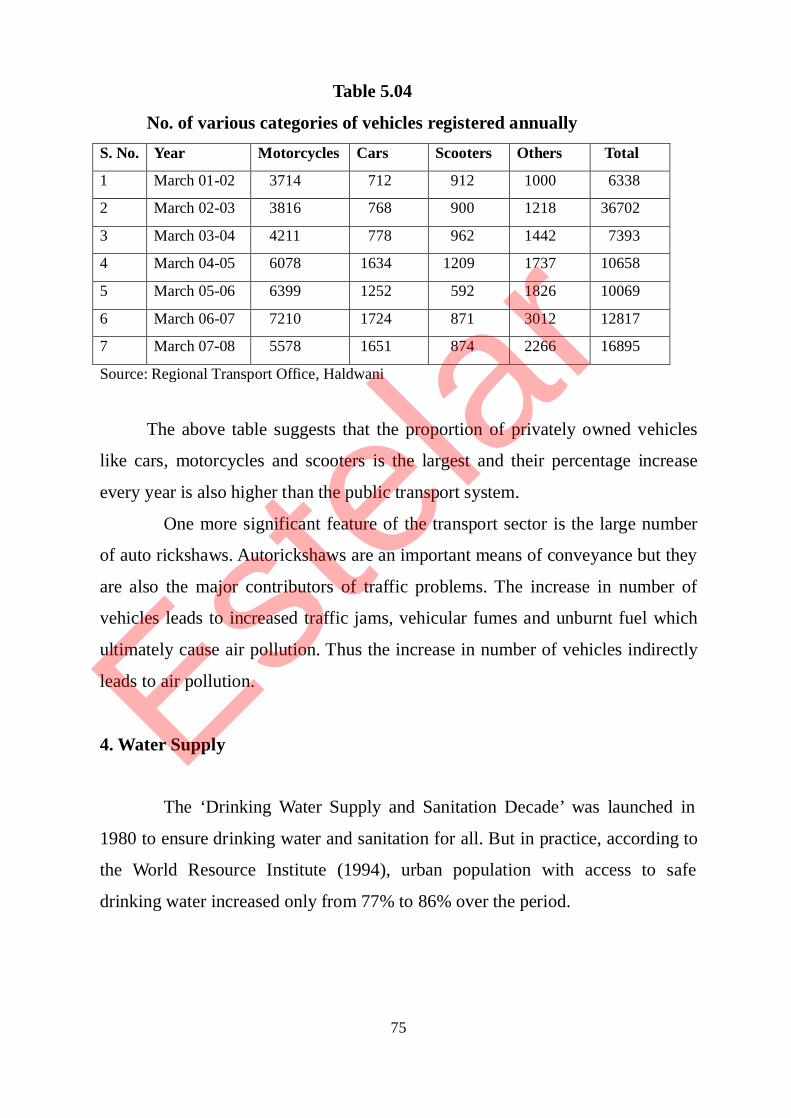
Table 5.04
No. of various categories of vehicles registered annually
S. No. Year Motorcycles Cars Scooters Others Total
1 March 01-02 3714 712 912 1000 6338
2 March 02-03 3816 768 900 1218 36702
3 March 03-04 4211 778 962 1442 7393
4 March 04-05 6078 1634 1209 1737 10658
5 March 05-06 6399 1252 592 1826 10069
6 March 06-07 7210 1724 871 3012 12817
7 March 07-08 5578 1651 874 2266 16895
Source: Regional Transport Office, Haldwani
The above table suggests that the proportion of privately owned vehicles
like cars, motorcycles and scooters is the largest and their percentage increase
every year is also higher than the public transport system.
One more significant feature of the transport sector is the large number
of auto rickshaws. Autorickshaws are an important means of conveyance but they
are also the major contributors of traffic problems. The increase in number of
vehicles leads to increased traffic jams, vehicular fumes and unburnt fuel which
ultimately cause air pollution. Thus the increase in number of vehicles indirectly
leads to air pollution.
4. Water Supply
The ‘Drinking Water Supply and Sanitation Decade’ was launched in
1980 to ensure drinking water and sanitation for all. But in practice, according to
the World Resource Institute (1994), urban population with access to safe
drinking water increased only from 77% to 86% over the period.
Estelar

76
With respect to Haldwani the initial arrangement of water supply was
made from Shitlahat gravity water source. But later, the demand of water got
highly increased due to the increase in population and fast development of the
city. As such it became necessary to reorganize the existing water supply system.
Consequently, in subsequent phases various schemes financed by the 10 th finance
commission were executed in different years.
But despite the efforts made by the government there has been a
continuous shortage of water throughout the year and at some places residents are
forced to cover long distances to fetch water. Water supply is one of the major
problems which the residents face. The problem gets aggravated during the
summer months when the discharge from Gaula Canal which is the main source
of water gets considerably reduced.
On an average the water supply in class I cities in India is 147 lpcd
(liters per capita per day) as against 157 lpcd to 270 lpcd which is the prescribed
standard for cities falling in the population size of 100000 and above. In case of
Haldwani the water available is merely 85 lpcd which further goes down to 50
lpcd during the summer season.
Actually the drinking water available for the city is 35mld whereas the
demand of drinking water in the city per day is 27 mld. Despite the surplus water
available for the city the urban as well as the rural water supply is not
satisfactory. The main reason for the insufficient water supply is the low capacity
of the treatment plant.
After the execution of the various schemes the supply of water was
started from Gaula River through Sheeshmahal water treatment plant where
water gets chlorinated and is supplied to the city. But the capacity of the
treatment plant is low(only 9 mld) and the water available from Gaula River is 22
mld. Together with this ten tube wells were also started to meet the ever
increasing demand for water but again the tube wells were connected to the old
Estelar

77
pipelines. Therefore, the water supply in the city still remains faulty and
defective.
During the monsoon season the level of Gaula River increases therefore
the sluce gates of the barrages are opened due to which silt containing water
reaches the filter plant which hampers the filtering of water. This affects the
water supply during the monsoon season. Thus, due to some reason or the other
there is always scarcity of water throughout the year.
The distribution of water in the city is also faulty and inequitable. Some
areas get sufficient water while others face an acute scarcity. The main reasons
for the water scarcity and inequitable distribution of water which is the
characteristic feature of the water supply system of Haldwani are-
(i) Low storage capacity of the treatment plant.
(ii) The pipelines are about 50-60 years old and are severely damaged, they leak
at several places. Since the soil in Haldwani is sandy the leakage cannot be
checked. This accounts for 15% of water cost. Sometimes the sewage water
enters these pipes through the leakages.
(iii) Faulty distribution system is another reason for the unequal and scarce water
supply. There are total 17565 water connections out which 7% are not in use
but water is still supplied there.
(iv) Apathy of the local government to look after the problem of the residents.
5. Sanitation and Drainage
Drainage and sanitation of a place directly influences the health of the
residents. Poor drainage and improper sanitation are the causes of different
diseases. In Haldwani only 40% of the population has the facility of sewer line.
Rest of the city residents depend on septic tanks and soak pits. In the congested
areas of the city where there is no space for the construction of soak pits and
Estelar

78
septic tanks, people have to depend on conservancy system. The soil in the area
has high porosity and is favourable for the leaching of soak pit and septic
effluents to considerable distance so there is every possibility that these effluents
are carried away through the main water pipes which have leakages. When the
effluents are carried away by the main water pipes they act as a carrier of many
fold infestations like gastro intestinal typhoid, para typhoid, diarrhoea, etc. which
are very common in the area under consideration.
The main sewer line which was laid in the city long Bareilly road some
30 years back is running under overloading condition and gets boiled up at few
places thereby creating extremely unhygienic conditions. This main sewer line at
Bareilly Nainital road is not sufficient to handle the present load. As the existing
main sewer line of the city is almost running with its full capacity, the addition of
sewerage load either through new connection or reorganization of water supply at
subsequent main sewer laying parallel sewer or to use as a branch sewer by
relieving its excess load into new main sewer is required essentially.
The duplication of main sewer whole at Nainital highway is not possible
due to these reasons:-
(i) A network of various types of conduits i.e. sewer mains various water mains,
electric and telephone cables run along this road at varying depths. The laying
of new parallel sewer will be difficult task and shall involve considerable
expenditure.
(ii) Being Nainital highway the only road to handle to and fro traffic of hilly
region, it experiences voluminous traffic pressure round the clock. As there is
no nearby bye-pass road, therefore minimizing traffic congestion is not
possible.
As explained above the main sewer has now become insufficient to
accommodate even the present overburden and it is not possible to duplicate the
main sewer therefore it has become necessary to release and divert the additional
Estelar

79
load of existing main sewer into new main sewer which onward will run as
branch sewer.
Drainage facility also holds an important place in basic services. But
unfortunately the situation is far from satisfactory in this regard too. Inadequate,
improper and unmaintained drainage is the main feature of the drainage system
of Haldwani.
There is a network of drains in the city but they are not cleaned regularly
and are encroached upon at several places. Open drains can be seen flowing close
to the houses. The drains remain chocked for most of the year and serve as
dustbins for the people and breeding ground for several disease causing
organisms. Improper drainage is a problem that primarily affects the poor
communities living in marginal lands. The most adverse health effect fall on the
poor with unsafe sanitation and poorly drained wastewater, creating conditions
for various disease causing organisms.
At some places the drainage is so inadequate that even a slight shower
results in flooding of low-lying areas of the city. This causes the garbage and
drain water to come on the main road which again causes inconvenience to the
people. In some wards like Banbhulpura, Rajpura, Kidwainagar and Indranagar,
chocking of sewer lines is a common feature. The lines get choked and the
sewage flows out into the open. The residents have to face discomfort and
inconvenience. Complains of the residents are generally over looked by the
municipal authority and such issues do not get any attention. Individual efforts to
keep the city clean, encroachment free and green often dies away due to the
indifference of the local authorities and the residents who have become
accustomed to such kind of problems.
Estelar

80
6. Industrial Growth
Urbanization and industrialization are closely related terms and have often
been considered as two facets of the same coin but while industrialization is
followed by urbanization, the vice verse is not always true. Urbanization is the
outcome of several factors and urban areas come into existence and develop due
to various reasons other than industrialization.
In case of Haldwani the growth of industries is not high enough to bring
about the deterioration of environment. The industries that are set up are mainly
small scale industries like paint industry, printing press, tin industry etc. Such
small-scale industries do not cause pollution of any serious kind. Though the
number of industries registered per year at DIC (District Industry Centre) is fairly
high but all of them are small scale industries which do not affect the quality of
the environment very much. The industries take a no objection certificate from
the pollution control board of Haldwani if they comply with the norms of the
PCB (Pollution Control Board). Hence, the industries set up every year are
environmentally safe. The number of industries registered per year in Haldwani
at DIC after the inception of the state of Uttarakhand is mentioned in table 5.05.
Table 5.05
No. of Industries Registered Annually
S.No. Year Number of Industries
1. November 2000-March 01 8
2. April 01- March 02 38
3. April 02- March 03 30
4. April 03- March 04 66
5. April 04- March 05 92
6. April 05- March 06 68
7. April 06- March 07 86
Source:DIC, Haldwani
Estelar

81
The table clearly shows that the number of industries registered per year is
considerably high but all of them are small scale industries which are in
compliance to the norms of the PCB.
7. Occupational Structure
Majority of the population of Haldwani urban area comprises of
businessmen and intellectuals. The central old area of the city is thickly
populated and generally comprises of service class, businessmen and other work
force with a fine blend of various religions, status, areas and beliefs living in
great harmony
Out of the total population, the number of total workers is 36014 which
are 28% of the total population. The population of the non-workers is 93001. Out
of all the workers main workers constitute 93.6% i.e. 33713 people and marginal
workers form 7.4% i.e. 2301 workers. Out of the main workers, 61 are cultivators
72 are agricultural labourers, 414 are engaged in household industries and 33166
form the other workers category. In the marginal category, 8 are cultivators, 27
are agricultural labourers, 59 workers are engaged in household industries and
remaining 2207 form the others category. Thus the total number of cultivators is
69, total number of agricultural labourers is 99, total number of workers engaged
in household industries is 473 and total number of workers belonging to others
category is 35373. In this way the total number of workers in agricultural sector
is only 0.47% of the total workers. Occupational structure of Haldwani according
to Census 2001 is as follows :
Estelar

82
Table 5.06
Occupational structure of Haldwani
S.No. Occupation Main Marginal Total
1. Cultivators 61 8 69
2. Agricultural labourers 72 27 99
3. Workers in household Industries 414 59 473
4. Other workers 33166 2207 35373
Total workers 33713 2301 36014
Source: Census of India 2001
1. Environmental Pollution
(i) Air Pollution
In the city the main reason for air pollution is the traffic exhaust. Due to
increase in traffic over the years the level of air pollution has crossed the
permissible limit. Increase in population, increase in consumption pattern and
unplanned development of the city have further accelerated the problem.
Vehicular emissions are of particular concern since these are ground level
sources and thus have the maximum impact on the general population. The
industries set up in the area are not responsible for causing any serious kind of
pollution.
The population of Haldwani urban area has increased by about more than
17 times i.e. from 7498 to 129015 from 1901-2001. The growth in population has
led to higher demand for transport. The number of privately owned vehicles
registered between 2002 to 2008 shows and increase from 6338 to 16895. This
sharp increase in the number of vehicles has led, not only to traffic problem but
also to the problem of air pollution and fuel consumption. Drastic increase in the
number of vehicles has increased the emission of various pollutants like oxides of
carbon, sulphur, nitrogen, suspended particulate matter, etc. There has been a
Estelar

83
sharp increase in the number of privately owned vehicles like motorcycles, cars
and gearless scooters.
To keep an eye on the increasing level of air pollution, the Uttarakhand
Environment Protection and Pollution Control Board (UEPPCB) started
monitoring the level of suspended particulate matter (SPM) in the air. SPM is one
of the most critical air pollutant in most of the urban areas in India and
permissible standards are frequently violated at several monitored location.
Suspended particulate matter is the amount of particles present in the given
volume of air
In Haldwani the level of SPM is measured at two different places with the
help of a device called High Volume Sampler (HVS). One of the machines is
installed at ‘Kaladhungi Chauraha’ which is a commercial area and the other at
‘Awas Vikas’ which is a residential area. The level of SPM is checked from time
to time but this is not done on a regular basis despite the SPM level exceeding the
safe limit. The SPM level is checked only during the summer season, after Diwali
and one or two times according to the will of the UEPPCB. The tables below
give a detail of SPM measured from 2003 to 2008:
Table 5.07
Level of SPM measured from January 2003 to October 2003
Month Level of SPM(in micrograms)
Kaladhungi Chauraha Awas Vikas
Jan 03 183.72 205.6
Feb 03 231.05 264.17
Mar 03 240.93 258.5
Apr 03 195.21 180.4
June 03 279 294.8
Oct 03 287 316
Nov 03 351.6 385.5
Source : UEPPCB, Haldwani
Estelar

84
Table 5.08Level of SPM from March 2004 to October 2004
Month Level of SPM(in micrograms)
Kaladhungi Chauraha Awas Vikas
March 04 215.8 227.4
April 04 N.A 208.75
May 04 266.15 242.81
June 04 437.03 321.16
July 04 173.1 219.2
Aug 04 196.32 203.48
Sep 04 218.25 259.6Oct 04 230.3 252
Source : UEPPCB, Haldwani
Table 5.09
Level of SPM measured from April 2005 to December 2005
Month Level of SPM (in micrograms)
Kaladhungi Chauraha Awas Vikas
April 05 264.83 287.63
May- 05 287.1 387.84
June- 05 537.43 350.15
July-05 136.03 N.A.
Aug-05 163.14 204.25
Sep.-05 94.80 121.43
Oct.-05 119.81 129.48
Source : UEPPCB, HaldwaniEstelar

85
Table 5.10
Level of SPM from January 2006 to March 2006
Month Level of SPM (in micrograms)
Kaladhungi Chauraha Awas Vikas
Jan-06 284.85 261.55
Feb-06 220.17 221.25
March-06 218.38 220.64
April-06 239 256.03
June-06 311.94 N.A
Oct-06 241.5 272.1
Nov-06 348 365.24
Source : UEPPCB, Haldwani
Table 5.11
Level of SPM during the year 2007 at different time intervals
Month Level of SPM (in micrograms)
Kaladhungi Chauraha Awas Vikas
Jan-07 260 184
Feb-07 137 152
March-07 207 254
April-07 212.1 247.8
June-07 146 189
Oct-07 193.9 255.8
Nov-07 276.4 263.3
Source : UEPPCB, Haldwani
Estelar

86
Table 5.12
Level of SPM during the year 2008 at different time intervals
Month Level of SPM (in micrograms)
Kaladhungi Chauraha Awas Vikas
Jan-08 278.1 217.45
Feb-08 205 192.03
March-08 286.4 263.51
May-08 319.15 326
July-08 294.33 288.6
Oct-08 354.1 324.2
Nov-08 261.72 257
Source : UEPPCB, Haldwani
The table clearly suggests that during several months the level of SPM has
crossed the permissible limits. During the summer months and after ‘diwali’ the
levels are considerably high both in the commercial as well as residential areas.
Though the level of pollution is not measured on a regular basis, this is done
intermittently. The available data reveals that the safe limit of SPM is crossed in
most of the cases.
Despite the increase in air pollution, the UEPPCB is not much concerned
about checking the level of SPM regularly. The other pollutants like carbon
monoxides, sulphur dioxide, nitrogen oxides, oxidants and ozone, aldehydes, etc.
are not even monitored due to the absence of any provision for checking the level
of pollutants.
Although the main source of air pollution in Haldwani is the vehicular
emission but there are other sources also like waste burning. The vehicles have
increased continuously in the last few years but the level of SPM is not
increasing continuously but shows fluctuation. The noticeable feature is the high
Estelar

87
level of SPM during the summer months and after ‘diwali’. The UEPPCB does
not check the pollution levels regularly and it is measured only 2-3 times a year
or when it receives orders from the District Magistrate or if there is some
complain regarding air quality. Another source of air pollution is the burning of
domestic refuse which is a commonly observed phenomenon in the city. In the
absence of proper method of garbage disposal many families burn the household
waste. In addition to this it was also observed that during the wedding season, the
banquet halls also use the burning method to dispose off the waste.
(ii) Water Pollution
Water pollution is the introduction into water of chemical, physical or
biological material that degrades the quality of water. The process ranges from
simple addition of dissolved or suspended solids to discharge of the most toxic
pollutants like pesticides, heavy metals and no degradable chemical compounds.
With special reference to Haldwani, safe and potable water is not available to the
residents. Even after passing the filter plant, water is not upto the standard
parameter i.e. in terms of biological oxidation demand (BOD) and chemical
oxidation demand (COD). Since there are no such industries and their respective
industrial waste near the water source, hence no precautionary measures are
required for affluent treatment and for measuring COD. But biological
contamination is quite high due to the presence of crematorium near the water
source. Many of the residents find this practice inappropriate. The water even
after passing from the filter plant of the city (after being chlorinated) is still
contaminated and needs to be purified before consuming. The poor and ignorant
section of the society is unaware of safe drinking practices and cannot afford the
expensive water purifiers. As such this section becomes vulnerable to several
water borne diseases like diarrhea, jaundice, hepatitis, etc. Potability of water is
not checked by any agency at the moment. Although the UEPPCB is responsible
Estelar

88
for this, but like monitoring of air and noise pollution water quality is also
checked only when there are prolonged complains from the masses or when they
get any order from the higher officials.
Initially, a network of irrigational canals was laid down for the purpose of
irrigating the agricultural land. But as the agricultural land got converted into
residential and commercial areas, the canals became a medium for carrying the
garbage, refuse and sewage of the city. With the expansion of the city beyond its
limits, new colonies and residential houses developed around the canals. Since
these colonies were unauthorized, therefore there was no provision for garbage
and sewage disposal. As a result the canals became a very convenient medium
for dumping garbage and sewage.
The practice is so common in the cities that it is often taken for granted. In
addition the washermen use the canals for washing and the canal water is also
used by the poor for bathing and washing purposes. The sewage system of the
city is also planned in such a way that ultimately the sewage finds its way into
the canals. The sewer lines open into the canals in the south east of the city. The
contaminated canal water containing all these impurities is used for irrigation
purposes in the nearby villages. At certain places the sewage of the houses
directly opens into the canals.
(iii) Land Pollution
Owning to various human activities the land surface of the earth gets
degraded. Indiscriminate disposal of urban waste, improper use of soil by
inadequate agricultural practices, excessive deforestation etc. are some of the
contributing factors of land pollution. Land pollution includes soil pollution and
waste disposal. Soil pollution occurs due to the use of chemical fertilizers and
pesticides.
Estelar
89
With respect to Haldwani, pollution of the land is due to the disposal of
waste. The population of the city is increasing continuously and therefore the
amount of waste generated in the city has also increased. There are several open
spaces in the residential areas that have been converted into dumping grounds for
garbage. The urban society, which is a symbol of civilization, does not care to
dispose off its wastes in a proper way. The main reason for this is the inefficiency
of the municipality in providing basic services. There is no provision for door-to-
door collection of garbage.
Actually garbage disposal has a proper mechanism. The garbage should
be collected from the houses in two different bags, one containing biodegradable
wastes like vegetables, garden waste, etc. and the other containing non
biodegradable waste like plastic, metal etc. The garbage collected from the
houses by the sanitary workers should be taken to the community bins with
separate chambers for biodegradable and non-biodegradable waste. From there it
should be taken for recycling and compositing. Although the municipal
corporation has provided the facility of garbage bins but the people are not aware
of the concept of bio degradable and non-biodegradable waste. The consequence
is that they mix the garbage and since there is no availability of sanitary workers
hence the people themselves dispose off the garbage. The people dump the
household garbage wherever they find most convenient like the nearby canals, or
open spaces or vacant community bins. The garbage was also seen scattered
outside the community bins. Since there is no provision for solid waste
management at the municipal level hence the waste collected by the municipality
is dumped in the basin of the Gaula River. As such major portion of the river is
converted into a dumping site.
In the same way biomedical waste was also seen lying around the hospitals
at certain places. The biomedical waste including needles, bandages and infected
body fluids is highly infectious. This not only pollutes the land but also poses a
Estelar

90
potential danger for the rag pickers who are at high risk of infection from this
kind of contaminated waste.
(iv) Noise Pollution
Although there is no single universally accepted criterion of what
constitutes noise pollution or excessive noise, it is unquestioned that excessive
noise has adverse effects on human health. Noise has been defined as an
excessive, offensive, persistent or stoulting sound (Grewal 1995).
The main sources of noise in Haldwani are vehicles, bands and loud
speakers. Due to the increase in the number of vehicles in the past 7-8 years, the
level of noise has increased considerably. Even in the sensitive areas which
include schools and hospitals, noise levels have exceeded the permissible limits.
Although the noise levels are not measured on a regular basis but whenever
recorded the noise level is found to cross the standard limit. The device used for
measuring noise is called noise meter. Noise levels are checked only during
particular days like ‘diwali’, wedding season, etc. According to Ambient Air
Quality Standard, noise levels in the residential areas should be 55 dB(A) for day
time and 45dB(A) for night while in commercial areas it is 65 dB(A) for day and
55dB(A) for night. For silence zone it is 50dB(A) for day time and 40dB(A) for
night.
The following tables gives a detail of sound levels at various places during
day and night.Estelar

91
Table 5.13
Noise levels at various locations during day time
Locations
8.11.2007 9.11.2007 10.11.2007
Min. Max. Avg. Min. Max. Avg. Min. Max. Avg.
Awas Vikas
(Residential) 60.6 82.5 68.1 71.5 96.4 81.1 66.4 91.9 76.5
Kalawati Colony
(Residential) 64.3 90.4 71.8 68.4 97.7 81.4 63.2 98.1 73.9
Chowk Bazar
(Commercial) 70.4 94.9 81.1 75.1 98.6 87.2 68.7 95.3 78.7
Bus Station
(Commercial) 68.6 90.5 80.2 69.4 98.6 87.2 68.7 95.3 78.7
Nirmala Convent
(Silence Zone) 52.9 76.6 63.9 67.1 96.6 81.4 64.3 88.5 75.1
Base Hospital
(Silence Zone) 62.8 93.3 74.7 73.6 97.0 82.3 60.6 96.8 75.2
Source: UEPPCB,Haldwani
Estelar

92
Table 5.14
Noise levels at various locations during night time
Location 8.11.2007 9.11.2007 10.11.2007
Min. Max. Avg. Min Max. Avg. Min. Max. Avg.
Awas Vikas
(Residential)55.7 79.2 68.7 65.9 94.8 79.8 58.9 93.3 72.4
Kalawati Colony
(Residential)55.5 85.8 70.2 71.7 91.3 79.7 57.8 92.6 65.3
Chowk Bazar
(Commercial)67.2 87.4 76.4 66.9 99 79.8 60.5 96.7 65.3
Bus Station
(Commercial)57.8 90.7 75.3 68.1 86.3 74.4 62.6 90.4 70.1
Nirmala Convent
(Silence Zone)53.2 80.8 66.6 66.4 92.9 74.5 59.6 85.1 74.3
Base Hospital
(Silence Zone) 53.3 82.1 68.0 63.9 92.4 73.5 56.2 86.2 70.1
Source: UEPPCB,Haldwani
The table clearly shows that the level of noise has crossed the prescribed
limit at different times. Even in the silence zone like school and hospital, the
sound level exceeds the permissible limits. The hospitals are located at the main
areas which creates trouble for the sick patients. The other sources of noise are
the loudspeakers, the bands and the DJs. From time to time announcement is
made using the loudspeakers in the whole city. During the wedding season there
is a disturbing noise from the bands used in the ‘barats’ and the DJs.
Estelar

93
The noise levels are rarely monitored in Haldwani. The only available data
is of the year 2004 and 2007. After that no proper data is collected regarding the
sound levels.
2. Green Cover Depletion
Change in land use pattern in the preview of urbanization is not merely a
process of data representation, but is an accumulated account of chronological
depiction of socio historical, socio-economic and socio-cultural change. This
change has been reflected in the form of development before us. The saga of this
development has several facets and folds to denote consequences and conflicts
among nature, society and technology. Hence land use change and urbanization
have a reciprocal relationship. This reciprocal relationship further signifies
depletion in green cover. In the preview of urbanization land use change can be
seen under two categories:
(i) Depletion of green cover
(ii) Changing agrarian society
(i) Depletion in green cover
Initially, Haldwani was a small town with its gardens and ‘baghs’ as
veteran journalist Sri Om Prakash Arya has said about the history of Haldwani.
Haldwani was a town with lots of gardens, a city where there was no trace of heat
strokes and where there was no sign of cold wave. There was a series of gardens
starting from Ranibagh in the north and spreading upto Halduchaur in the south.
But at present there is not a single trace of any garden. The list below gives an
account of the gardens, ‘baghs’ and the areas that existed in the past but got
engulfed due to construction work like roads, schools, colonies, shopping
complexes, etc.
Estelar

94
Gardens /Baghs Location P r e s e n t Status
1. E.T. Fonsica Garden K a thgodam Buildings
2. Vidya Ratan garden Sheeshmahal Restaurant, furniture house
3. B alutia’s bagh a nd Tedi Pulia Market cum residential complex
Chaudhry’s bagh
4. Velezli Garden Judgee Sessions judges building
5. B hatt’s Bagh Tedhi Pulia Residential colony
6. Awagarh Kothi Bagh Nainital Road Gurugovind colony
7. G.B. Pant Bagh N a inital Road Khalsa and Guru Teg
Bahadur school
8. M .L. Sahis Bagh Nainital Road Durga city centre
9. Master Ganga Sing’s Bagh Tikonia Market and residential complex
10. Dr.Ram Lal Sahi’s Bagh Tikonia Nursing home, school
11. Upreti’s Bagh Jagdambanagar Residential colony
12. Bholanath Garden Kaladhungi Road M arket and residential complex
13. Haridatt’s Bagh Kaladhungi Road R e sidential colony
14. Mirpa’s Bagh Kaladhungi Road M arket
15. Hanif’s Bagh Heeranagar Residential colony
16. Safdar’s Bagh Heeranagar Forest compound
17. Ram Prasads Bagh North to R e s idential colony
Mukhani Chauraha
18. Judge Farm South to R e s i d e n tial colony
Mukhani Chauraha
19. Resham Bagh North to R esidential colony
Mukhani Chauraha
20. Anand Bagh Near Police StationR e sidential colony
21. Mision Compound Bagh Near Police Station Residential colony
22. Devidatt Chimwal’s Bagh Near Police Station Khanchand market
Estelar

95
23. Company Bagh Tanakpur Road P rem cinema hall,
Guru Nanak market
24. Kabul Bagh Tanakpur Road Residential colony
25. Rahmat Bagh Tanakpur Road R esidential colony
26. Kulyalpur Bagh Nawabi Road R e s i dential colony
27. Kholia Compound Nawabi Road R e s idential colony
28. Kailash Bagh Rampur Road A grawal Sabha
29. Mungali Garden Rampur Road S argam cinema and
Residential colony
30. Mulchand Bagh Rampur Road R esidential colony
31. Ratan Lal, Kishan Lal Bagh R ampur Road Residential colony
32. Abdul Rahim’s Bagh Bazar Area Mahavirganj
33. Khan’s Bagh Bazar Area S a r a s m arket
34. Numaish Bagh Bazar Area S t a d i u m
35. Himalaya Farm Bazar Area B a d r i p ura
36. Shiv Lal Mishra Farm Bareilly Road Residential colony
37. Badridatt Sharma Bareilly Road K attha factory
38. Sarkari Farm Bareilly Road D harampura colony
39. Ramchandra Mandir B areilly Road Medical college
40. Abdulla Bagh Bareilly Road Residential colony
41. Babulal’s Bagh Bareilly Road R esidential colony
42. Holi Lal’sBagh Bareilly Road R esidential colony
43. Devi Rameshwar Bagh Bareilly Road Residential colony
44. Dan Sing Maldar’s Bagh Bareilly Road Residential colony
To receive the lost green glory of Haldwani, Sardar Jagat Singh led a
movement called ‘green city movement’ with the help of social workers, various
local organizations and local administration. But it failed to achieve considerable
Estelar

96
results. The ‘Haldu’ trees (after which Haldwani got its name) were once present
here in abundance but now they are out of sight. The main road of Haldwani, the
Nainital road was lined by massive trees on both sides. Some trees were as old as
hundred years and had become a landmark. But in the year 2008-2009, about
hundred trees were cut during the ongoing drive to broaden the roads of
Haldwani and to construct drains and footpaths. As a result the roads give a
barren, dry and dusty look.
(ii) Change in Agrarian Society
It is well understood that urbanization is a process that involves a shift
from agrarian society to a more complex situation with a considerable increase in
population. In other words, it is a shift from primary mode of production to
secondary and tertiary sector. In this region government had successfully
facilitated settlement process by providing facilities regarding agricultural sector.
The establishment of Post War Reconstruction Board in January 1943 gave
impetus to large scale setting of immigrants, particularly ex-soldiers. The
erstwhile army personnel’s were allotted lands in villages around Bazpur,
Kashipur, Haldwani and Kaladhungi. Political sufferers, freedom fighters and
repatriates from Burma also settled here. Following the partition of India in 1947,
wave after wave of refugees came from Punjab and Bangladesh and settled in
‘tarai’ and ‘bhabhar’ region.
Though the ‘tarai’ region became the precursor of Green Revolution in
India, ‘bhabhar’ region was lagging behind because of its topography and non
availability of ground water for irrigation. With particular reference to Haldwani,
it can be said that the place remained untouched from the bane of Green
Revolution. Yet, whatever potential and possibilities were available and
accessible to the local marginal, sub marginal and medium farmers of Kumauni
origin; they were utilized to some extent.
Estelar

97
It is seen that there was a marked shift in cultivational practices during
1975 to 1985. Till 1975 the rural economy was based on the production of food
grains, but with the establishment of ‘mandi samiti’ there was a shift from the
production of food grains to vegetables. As such there was a shift in economic
dynamics and proportion. As a result small contractors mainly from the Muslim
community got involved in vegetable crop production. Thus marginal farmers
with the benefits of hybrid seeds and new technologies became more prosperous.
This prosperity transformed the traditional agricultural practices into more
mechanical and more diversified agriculture practices.
But lack of irrigational facilities for vegetable production, surplus
production and expansion of market network at pan Indian level increased the
cultivation cost which delivered negative effect on the vegetable producers. At
the same time it was felt that the irrigational water is contaminated with debris,
polythene and feacal matter which are harmful to the crop because of highly
acidic nature and undecomposed organic material. Due to all this, several farmers
ploughed over their ripen fields and there were also incidents of farmers crushing
their crops in the ‘mandi’ because of lower rates than the actual production cost.
At the same time hike in land value allured the cultivators to sell out their land
and shift their occupation to non agricultural mode.
Thus the change in land use emerged as a new urban situation. Agricultural
land which was hitherto used for cultivation was now used for residential and
commercial purposes, for shops and shopping complexes. But the revenue or
stamp duty is collected by revenue department on agricultural land only. Thus,
agricultural land was rapidly changed into residential plots or colonies without
proper drainage proper roads, proper regulation and norms just to escape various
taxes which have to be paid at municipal limit. Therefore no authentic data
regarding land use change is available to address the actual scenario.
Estelar

98
Prior to the formation of Udham Singh Nagar district, urbanization in
Kumaun can be seen under different categories which are-
(i) Natural growth of urban areas and their further expansion
(ii) Migration of population from villages to nearly town in search of better living
and employment situation.
(iii) Concentration of industries in some regions that grow into a town like Lalkuan.
(iv) Due to the growth of population in rural areas and their further development
which ultimately leads to their classification as urban area/nagar panchayat etc
according to the size of the population.
(v) Urbanization may take place due to some typical circumstances like wars,
famines, floods, refugees, political reasons and rehabilitations, etc. At present,
special economic zones (SEZs) for industrial development has become a new
precursor to create a situation for urbanization like Rudrapur, Sitarganj, etc.
Categorically, Haldwani falls under IV category where rural population
grows in a relatively small and marginal farm holding. This marginality of land
holding and relatively less irrigational facilities have given room to change in the
land use pattern.
Hence, post statehood pattern of urbanization has a background that
catalyzed an exponential growth in construction and allied activities.
3. Problem of Solid Waste and Sewage Disposal
Solid wastes are those by products of a society that are discarded as useless
or unwanted. The term is often used as a synonym for urban household waste but
as used here, it is all inclusive and encompasses the heterogeneous mass of
throwaways from the urban community as well as the more homogeneous
accumulation of agricultural, industrial and mining waste. Though solid wastes
are the broader problem of urbanization directly linked to economic growth, the
Estelar

99
difficulties associated with managing solid wastes are perhaps most apparent
because of their localized influence on the environment, especially health, well
being and aesthetics. Not so apparent are the linkages between improper solid
waste management and the pollution of air, water and soil, which makes it
difficult to quantify the environmental costs of solid waste
Litter along the roadsides, heaps of refuse on the streets and the pungent
piles of rotting garbage are unpleasant reminders of untidy human habits. The
characteristics of wastes generated in a particular area depend on a number of
factors such as food habits, traditions, lifestyle, etc. The urban society is often
referred to as the throwaway society. With the process of urbanization, the
consumption level increases and therefore the amount of waste generated also
increases.
The solid waste is mainly of 3 types (i) Municipal waste which consists of
household wastes like fuel residues, containers and packages, glass bits, food
residues and vegetable wastes from the markets and commercial wastes
generated from shops, offices, restaurants, warehouses and hotels (ii) Biomedical
waste generated from the hospitals containing infectious items like amputated
body parts, body fluids, cultures of contagious viruses, bandages, swabs and
other wastes from operation theatres and laboratories, needles, excreta from
patients with highly contagions diseases and (iii) Industrial waste coming out of
the industries.
Apart from these sources, construction debris with its heaps of sandstone,
bricks, rubble, etc. on streets and vacant plots are major sources of nuisance
which also cause traffic hindrances, besides presenting an ugly sight or visual
pollution. (Barai 2007)
In most of the cities of developing countries, untreated solid waste lying
along the roadside and in vacant plots is a very common scene and Haldwani is
no exception. Heaps of garbage and refuse can be seen scattered outside the
Estelar

100
community bins and in open areas. Even in the residential areas the residents use
the vacant lands as dumping places. There are several reasons for this scenario.
Firstly, there is no provision for door to door collection of household garbage.
Secondly, the number of community bins available for dumping garbage is less in
number and the few which are available are not attended regularly. Thirdly, there
is no proper method for solid waste disposal.
In Haldwani, the facility of door to door collection of garbage by the
sanitary workers is not provided by the municipal corporation. So, the people
dispose their garbage by themselves. Those people who have the facility of
community bins nearby use these bins, the rest use vacant lands, canals and
drains to throw their household waste. Sometimes the people also burn the
garbage. The waste from the community bins is collected by the trucks and
carried to the disposal sites. According to Mr. Lohani, Municipal Corporation of
Haldwani the total waste generated per day is 45-50 metric tons. But out of this
only 25 metric tons is collected per day and rest remains scattered around the
bins on the roadside. Since the municipal corporation is itself short of resources
and is not equipped with proper waste management technique, therefore there is a
serious problem of solid waste disposal in the city. In the absence of a proper
trenching ground the municipal waste that is collected is dumped openly along
the Gaula River.
This practice has transformed major portion of the river into a dumping
site. The site has become an unsightly dirty and unhealthy place with access of
birds, rodents, fleas, etc. Therefore, the residents of the nearby place who are
mostly slums are at a high risk of infection due to the hazardous waste which
keeps accumulating over time.
The bio medical waste is a highly infections waste and must be disposed
off immediately and carefully. With the increase in population more and more
private hospitals, nursing homes, clinics and pathology laboratories have
Estelar

101
emerged in the city. According to Dr. D.K.Joshi, A.S.O, UEPPCB the biomedical
waste is incinerated but in a city with a population of less than 5 lakhs the system
of deep burial is used. Disposal of biomedical waste is the responsibility of the
hospital authority and UEPPCB only checks whether the waste is disposed off or
not. Although, in Haldwani Susheela Tiwari Hospital has the facility of
incinerator where biomedical waste is brought from all the adjoining cities. But it
was observed that some hospitals do not follow the norms proposed by the
UEPPCB and bandages, cotton wool, syringes were seen lying around some of
the hospitals.
Actually every kind of waste has a proper method of disposal.
Biodegradable waste is utilized through composting. The non biodegradable
waste is recycled using a densifier plant. But all these are hi-tech methods of
solid waste management are highly expensive; hence they are beyond the reach
of developing countries like India. In most of the Indian cities low- tech methods
are used. Most of the solid waste is dumped on the open grounds and used as
landfill. But with respect to Haldwani space is not available even for landfill or
trenching ground.
The main reasons for the large amount of waste generated is increasing
population and inefficiency of the local government in providing basic services.
Another reason is the increasing consumerism which is an important feature of
the urban society. Increased use of plastics, synthetic good, polythene bags which
are use and throw materials have aggravated the problem of solid waste disposal.
Another area of concern in the city is the problem of sewage disposal.
There are 23083 households in the city but only 1145 households have access to
sewer line. Like solid waste there is again no proper method of sewage disposal.
The sewage directly opens into the irrigational canals. The contaminated canal
water carrying various disease causing germs and pathogens is used for irrigating
the adjoining farms in the rural areas.
Estelar

102
References
Barai, Daksha. 2005. C.A Perspective on Solid Waste Management in Bangalore
city: Viable Technologies Options, in Urbanization, Development and
Environment(Ed) Phadke V.S and S Banerjee Guha. Rawat
Publication.New Delhi.
District Industries Centre. 2007. Annual Report. Haldwani.
Grewal, R.S. 1995. Noise Pollution A case for Comprehensive Legislation, in
Environmental Pollution(Ed) Garg M.R, V.K Bansal and Tiwana. Deep
and Deep Publications. New Delhi.
Peyjal Nigam. 2006. Project Report-Haldwani Water Supply Reorganization
Scheme(source augmentation) ³Construction of 8 Tube Wells ´-Part II.
Haldwani.
Peyjal Sansthan. 2007. Project-Report. Haldwani-Kathgodam Sewerage
Reorganization Scheme. Haldwani.
Regional Transport Office.2007. Report S-4 of registered vehicles under
division/subdivision. Haldwani.
Urban and Rural Planning Department. 2004.Haldwani- Kathgodam Master
Plan-2025. Haldwani.
Uttarakhand Environmental Conservation and Pollution Control
Board.2005.Annual Report. Haldwani.
Estelar