infrastructure cost allocation methodology and practices heike link catrin seminar sopot, 21 january...
TRANSCRIPT

Infrastructure cost allocation methodology and practices
Heike Link
CATRIN SeminarSopot, 21 January 2009
2
Background for the CATRIN work
1. Cost allocation approaches for full-cost studies:• Long tradition• Highly sensitive on assumptions!
2. Marginal cost estimation:• Releatively new field• Too few studies for generalisation of results• Diverging results, wide range of estimates• Differentiation by vehicle types so far lacking
Focus of CATRIN: new evidence on MC!
3
MC estimation for road - Methodologies
1. Duration approaches …
• analyse impacts of traffic load and climate on lifetime of road surface
• are based on measurements of road condition
• assume a condition-responsive maintenance strategy
• MC estimates based on „ideal“ conditions, might be overestimated
4
MC estimation for road - Methodologies
Examples:
• AASHO road test (4th power rule)
• Newbery‘s fundamental theorem (1988)
• Small and Winston 1988, Small 1989
• Lindberg 2002 (empirical test of the fundamental theorem), Haraldsson 2006

5
MC estimation for road - Methodologies
2. Econometric cost function approaches …
• analyse the functional relationship between expenditures, traffic load,climate etc.
• use neoclassical production and cost function analysis
• are based on observed spending for road maintenance/renewal
• MC estimates based on real expenditures, might be underestimated
• Problems to include more than one traffic variable
6
MC estimation for road - MethodologiesExamples:
1. Log-linear single equation models• Sedlacek et al. 2002: Austrian roads• Schreyer et al. 2002: Swiss roads• Bak et al. 2006: Polish roads
2. Translog single equation models• Link 2002: German motorways• Haraldsson 2006: Swedish roads (reduced TL)
3. Translog multi-equation models• Link 2006: German motorways
7
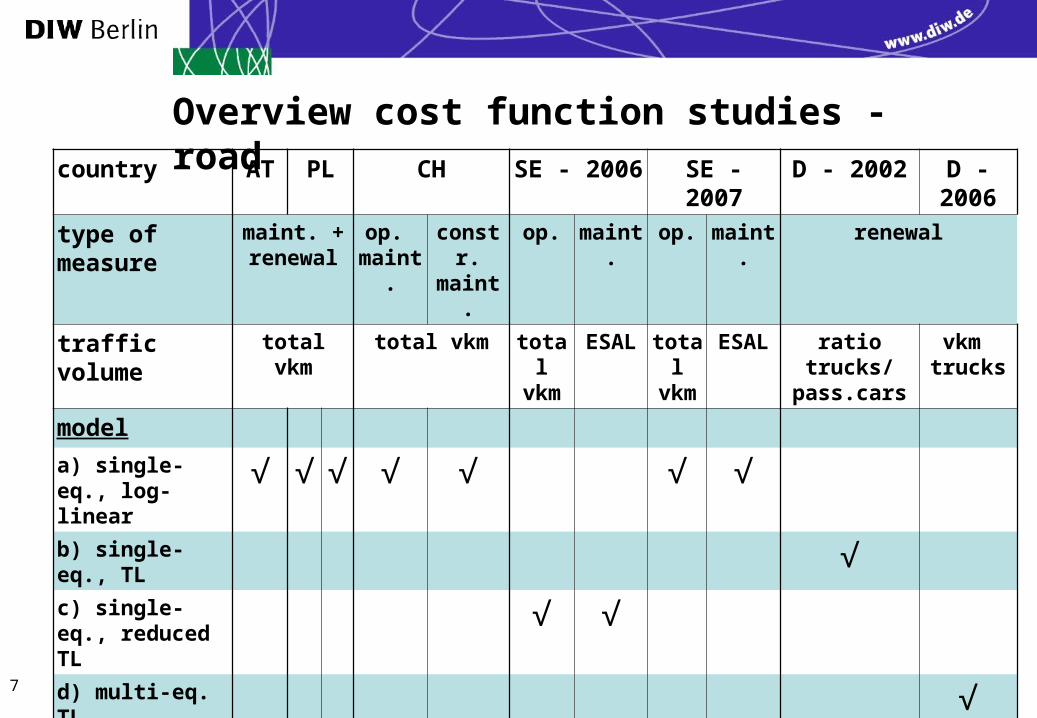
country AT PL CH SE - 2006 SE - 2007 D - 2002 D - 2006
type of measure maint. +renewal
op. maint.
constr.maint.
op. maint. op. maint. renewal
traffic volume total vkm total vkm total vkm
ESAL total vkm
ESAL ratio trucks/pass.cars
vkm trucks
model
a) single-eq., log-linear
√ √ √ √ √ √ √
b) single-eq., TL √c) single-eq., reduced TL
√ √
d) multi-eq. TL √cost elasticity
a) fixed √ √ √ √ √ √ √b) variable √ √ √ √
Overview cost function studies - road
8
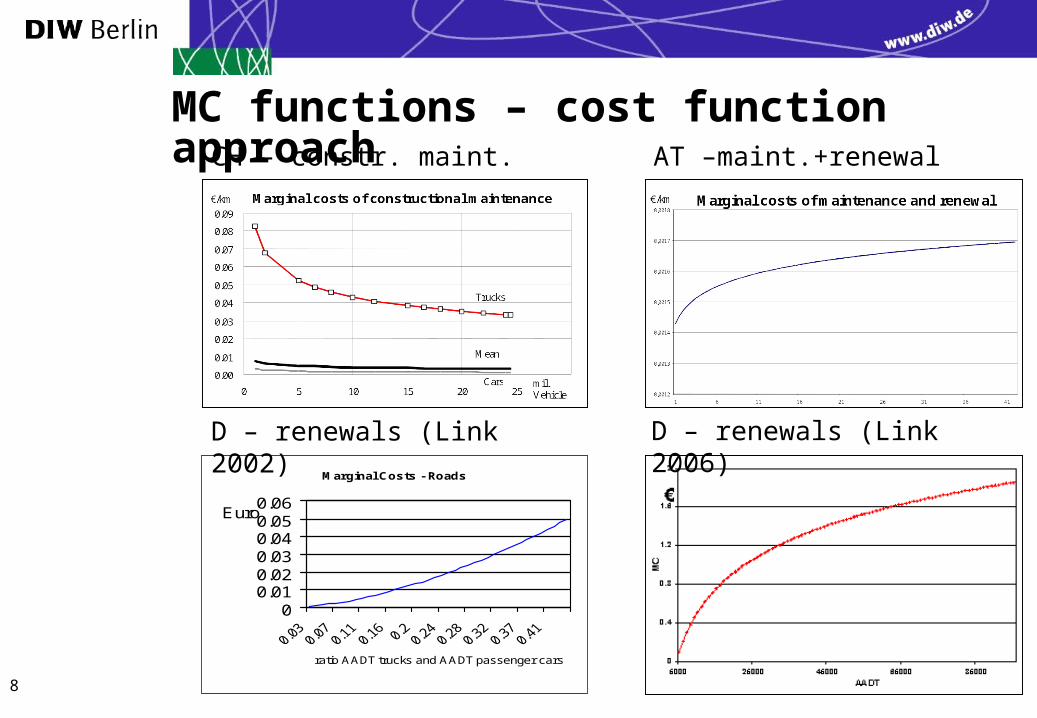
MC functions – cost function approach
Marginal Costs - Roads
00.010.020.030.040.050.06
ratio AADT trucks and AADT passenger cars
Euro
D – renewals (Link 2006)D – renewals (Link 2002)
CH – constr. maint. AT –maint.+renewal

9
MC functions – cost function approachSE – operation (Haraldsson 2006) SE – maint. (Haraldsson 2006)
PL – renewals (Bak et al. 06) PL – renewals + maint. (Bak et al. 06)

10
Duration approach - MC studies
Lindberg 2002
Haraldsson 2006
Model considers … x x
… age distribution of roads - x
… climate effect - x
Data refer to …
… optimal renewal cycles x -
… observed renewal cycles - x
Findings on …
…MC curve increasing decreasing
…cost elasticity (mean) 0.8 0.039
11
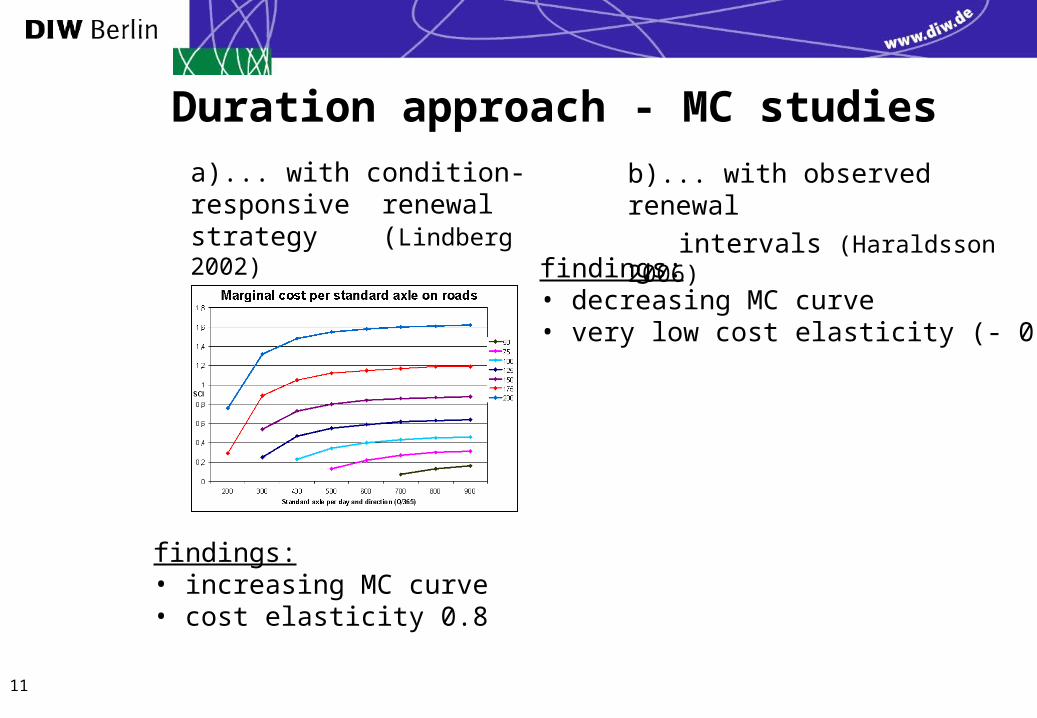
Duration approach - MC studies
a)... with condition-responsive renewal strategy (Lindberg 2002)
findings:• increasing MC curve• cost elasticity 0.8
b)... with observed renewal
intervals (Haraldsson 2006)
findings:• decreasing MC curve• very low cost elasticity (- 0.039)
12
Findings from MC studies – before CATRIN
1. All MC studies derive non-linear curves
2. Rather weak non-linearities might allow MC=VC
3. Mean of cost elasticity ε = MC/AC generally below 1
4. εrenewals > εmaint > εoperation
5. Road operation seems to be a fixed cost activity
6. Diverging results for shape of MC curves• Most studies: decreasing MC curves• increasing curves for D, AT, S

13
Country AUS US CH DK SF D a D b NL UK SE
Official study √ √ √ √ √ √ Scientific and empirical background studies
√ √ √ √ √ √ √ √
Repeated studies √ √ √ √ √ Overall methodology
- top-down √ √ √ √ √ √ √ √ √ √- club approach for
joint costs√
- incremental costs √ Cost / expenditure categories
7 5 6 5 6 21 3 17 8
No. of vehicle categories 33 6 30 6 6 6 27 37 10
No. road types 2 2 3 2 2 2 2 4 3
FAC studies road - Characteristics
14
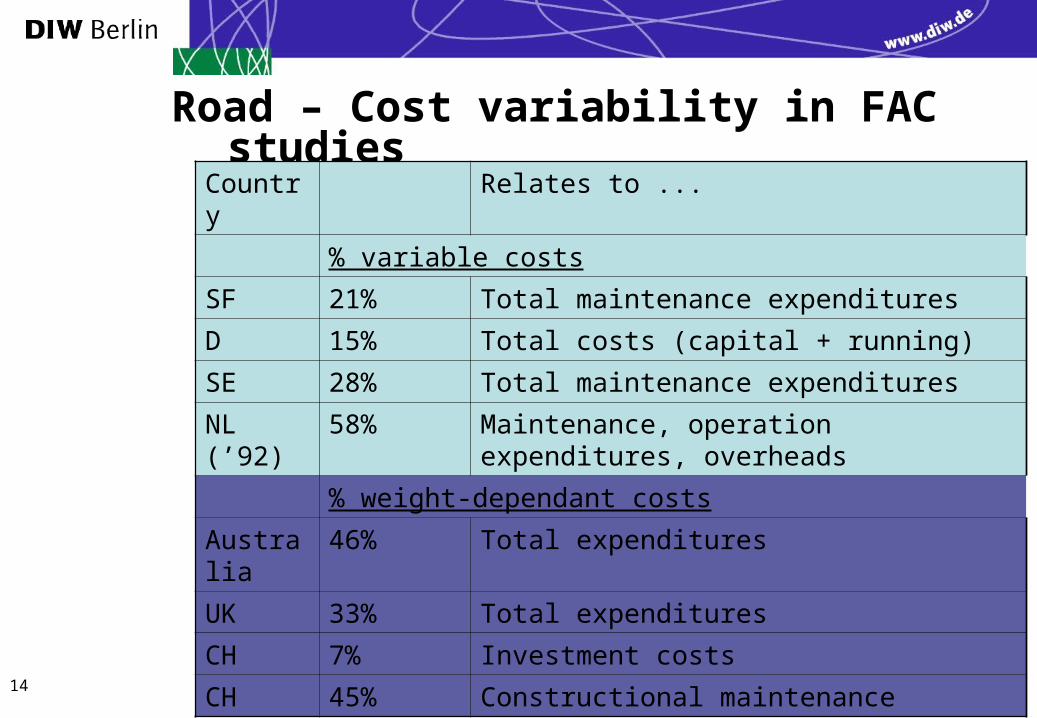
Road – Cost variability in FAC studies
Country Relates to ...
% variable costs
SF 21% Total maintenance expenditures
D 15% Total costs (capital + running)
SE 28% Total maintenance expenditures
NL (’92) 58% Maintenance, operation expenditures, overheads
% weight-dependant costs
Australia 46% Total expenditures
UK 33% Total expenditures
CH 7% Investment costs
CH 45% Constructional maintenance
15
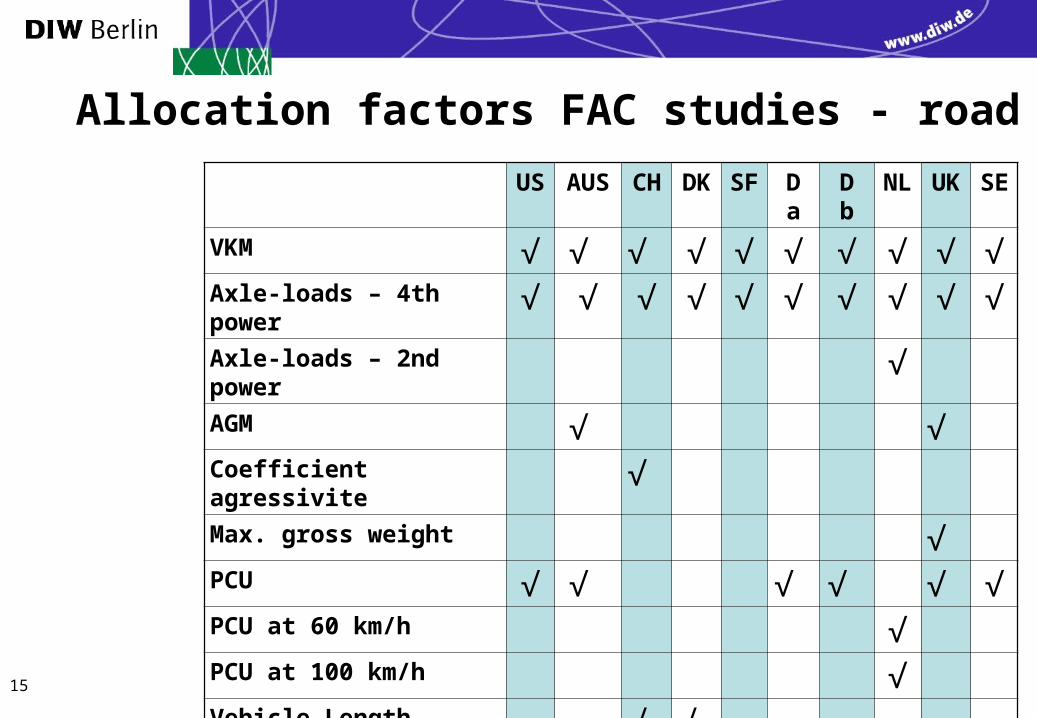
US AUS CH DK SF D a D b NL UK SE
VKM √ √ √ √ √ √ √ √ √ √Axle-loads – 4th power √ √ √ √ √ √ √ √ √ √Axle-loads – 2nd power √ AGM √ √ Coefficient agressivite √ Max. gross weight √ PCU √ √ √ √ √ √ PCU at 60 km/h √ PCU at 100 km/h √ Vehicle Length √ √
Allocation factors FAC studies - road
16
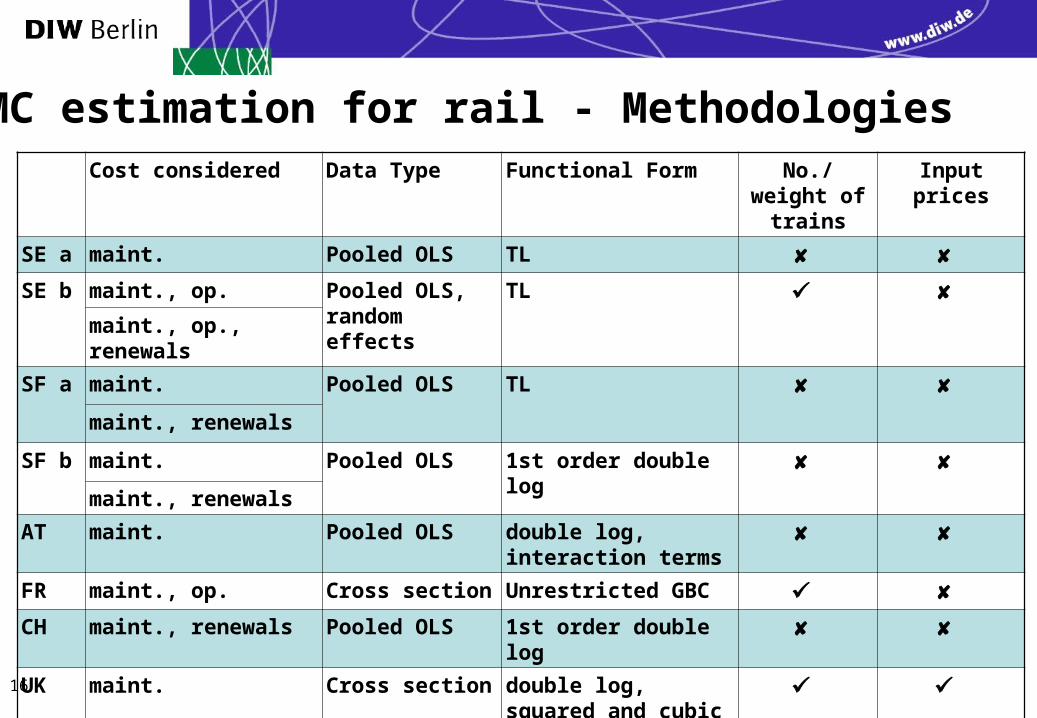
Cost considered Data Type Functional Form No./ weight of trains
Input prices
SE a maint. Pooled OLS TL
SE b maint., op. Pooled OLS, random effects
TL maint., op., renewals
SF a maint. Pooled OLS TL
maint., renewals
SF b maint. Pooled OLS 1st order double log
maint., renewals
AT maint. Pooled OLS double log, interaction terms
FR maint., op. Cross section Unrestricted GBC
CH maint., renewals Pooled OLS 1st order double log
UK maint. Cross section double log, squared and cubic terms
MC estimation for rail - Methodologies

17
Cost elasticities Rail Infrastructure - Maintenance only
0 0.2 0.4 0.6 0.8 1
Gaudry and Quinet, FR
Munduch et al., AT
Tervonen and Idstrom, SF
Marti / Neuenschwander, Model II, CH
Marti / Neuenschwander, Model I, CH
Andersson, SE
Booz Allen Hamilton, UK
Weath and Smith, Model IV, UK
Weath and Smith, Model VI, UK
Proportion of Maint. Cost considered in the study
Reported Total Usage Elasticity (Average)
Scaled Elasticity
...
18
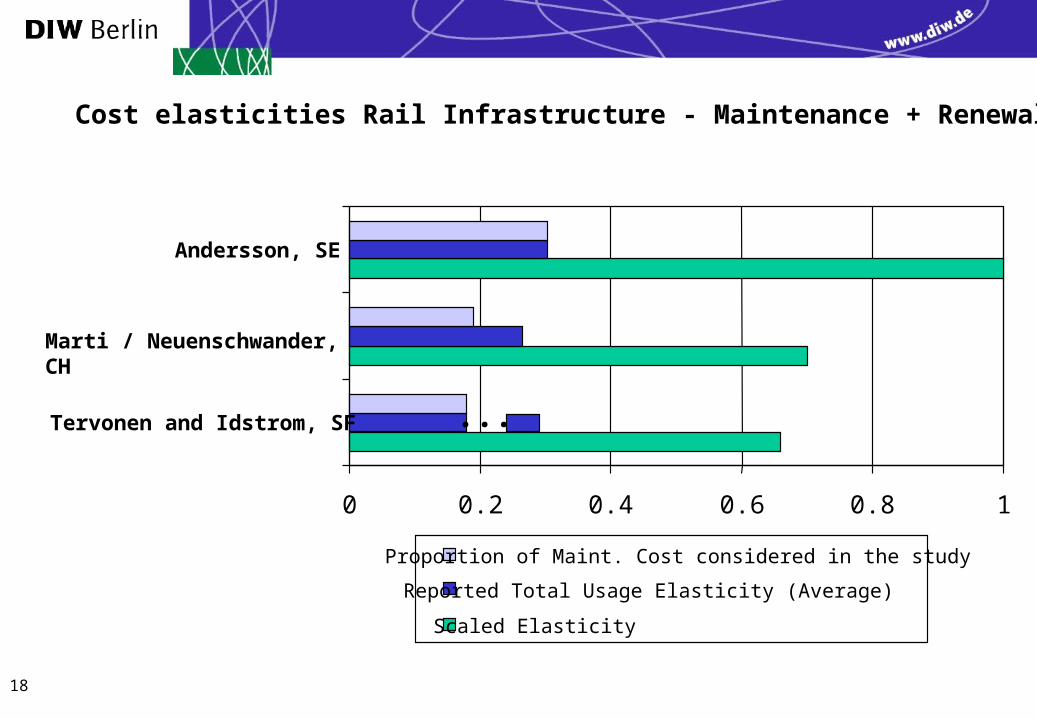
0 0.2 0.4 0.6 0.8 1
Tervonen and Idstrom, SF
Marti / Neuenschwander, CH
Andersson, SE
Proportion of Maint. Cost considered in the study
Reported Total Usage Elasticity (Average)
Scaled Elasticity
...
Cost elasticities Rail Infrastructure - Maintenance + Renewals
19
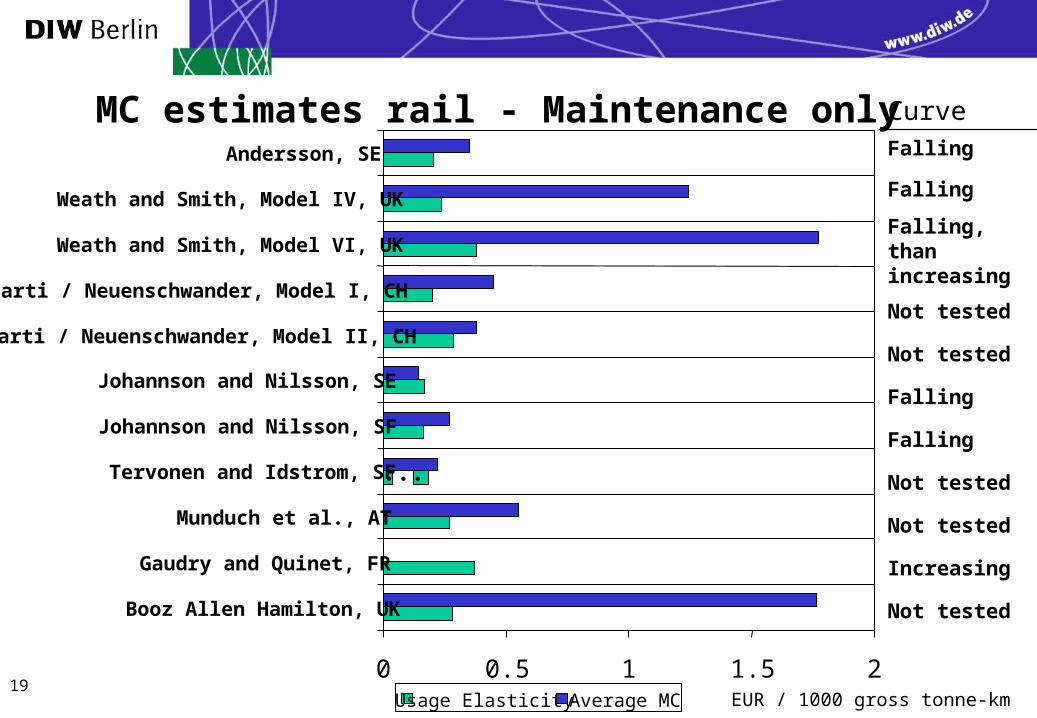
MC estimates rail - Maintenance onlyFalling
Falling
Falling, than increasing
Not tested
Not tested
Falling
Falling
Not tested
Not tested
Increasing
Not tested
Curve
0 0.5 1 1.5 2
Booz Allen Hamilton, UK
Gaudry and Quinet, FR
Munduch et al., AT
Tervonen and Idstrom, SF
Johannson and Nilsson, SF
Johannson and Nilsson, SE
Marti / Neuenschwander, Model II, CH
Marti / Neuenschwander, Model I, CH
Weath and Smith, Model VI, UK
Weath and Smith, Model IV, UK
Andersson, SE
Usage Elasticity Average MC
...
EUR / 1000 gross tonne-km

20
MC estimates rail - Maintenance and renewals
Falling
Not tested
Not tested
Not tested
Curve
0 0.5 1 1.5 2 2.5 3 3.5 4 4.5 5
Andersson, SE
Marti / Neuenschwander, CH
Tervonen and Idstrom, SF
Booz Allen Hamilton, UK
Usage Elasticity Average MC
...
EUR / 1000 gross tonne-km

21
Rail Cost variability estimates for the UK (in use 2005)Cost category % variable
with traffic
Track Maintenance 30
Renewals Rail 95
Sleepers 25
Ballast 30
Switches with crossing 25
Structures 10
Signals Maintenance 5
Renewals 0
Electrification Maintenance
AC 10
DC 10
Renewals
AC 35
DC 41

22
Rail Cost variability estimates for the UK (in use 2005)
Cost Category % variability with traffic
Maintenance
Track 28%
Structures 0%
Signalling 3%
Electrification 9%
Renewals
Track Plain line 44%
Switches and crossings 47%
Structures 3%
Signalling 4%
Electrification AC 11%
DC 6%

23
MC estimation for aviation - Methodologies
• Mostly econometric cost function studies
• Motivated by deregulation issues rather than MC estimation
• Functional forms: Cobb Douglas, translog, multivariate time series approach
• MC estimates hardly comparable due to:
a) different output measures (WLU, ATM, PAX)b) different cost categories considered

24
Cost shares in the FAC study for US airports
0 20 40 60 80
All lines of business
Total Air traffic Services
En-route facilities
Terminals and radar towers
Domestic en route services
incremental fixed common

25
Fixed/variable costs inland waterways NL
0 2 4 6 8 10
> 3000
2000 - 3000
1500 - 2000
1000 - 1500
650 - 1000
400 - 650
250 - 400
< 250
user dependent fixed
(CE 2004)
26
Starting point at the beginning of CATRIN
• Evidence on cost variability and cost elasticity
• No convergence on shape of MC curve
• MC estimates need to be disaggregated by vehicle types
• Comparability problems due to different cost categories, output measures, methodologies
• Huge efforts of researchers to collect and compile data!