infrastructure investments in japan - mitsuhiro teraoka, japan
TRANSCRIPT

Infrastructure investments in Japan
Mitsuhiro Teraoka Director of Research Division
Budget Bureau Ministry of Finance, JAPAN
19th December 2014 10th Meeting of ASIAN Senior Budget Officials

Basic Concept of Social Infrastructure Investment
Severe fiscal situation
Improved level of social infrastructure
Rapid decline of total population in the future
Need to effectively allocate public funds to highly prioritized public works. Need to conduct the investment in more deliberate and efficient manner.
● New Investment: Need to evaluate the cost effectiveness of projects and select them carefully, while focusing on the projects for enhancing the international competitiveness and for preventing and/or reducing the damage from natural disasters.
● Encouraging the private investments and private funds through PPP/PFI
● Implementing the PDCA cycle
Public Finance Act
Article 4 (Limitations on issue of public bonds and borrowings)
(1) The expenditure of the State shall have financial sources in the revenue excluding public bonds or borrowings. However, for the financial source of public works expenses, equity investments and loans, it shall be permitted to issue public bonds or make borrowings within the limits of the amounts of money approved by the Diet resolution.
● Overview
1
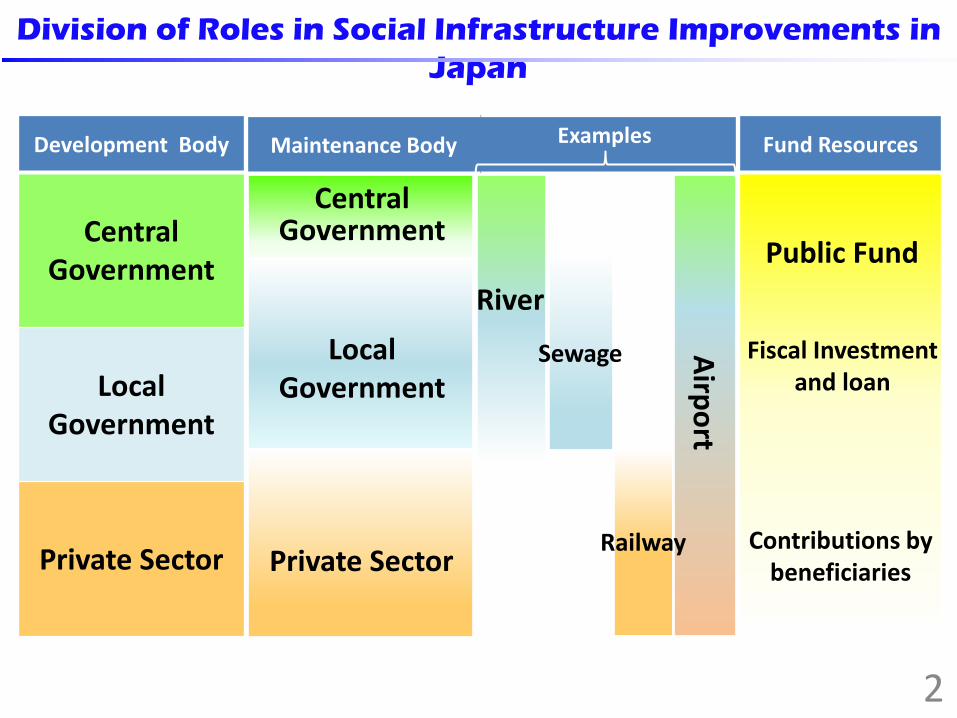
Development Body
Central Government
Local Government
Private Sector
Fund Resources
Public Fund
Fiscal Investment and loan
Contributions by beneficiaries
Maintenance Body
Central Government
Local Government
Private Sector
Division of Roles in Social Infrastructure Improvements in Japan
River
Sewage Airport
Railway
Examples
2
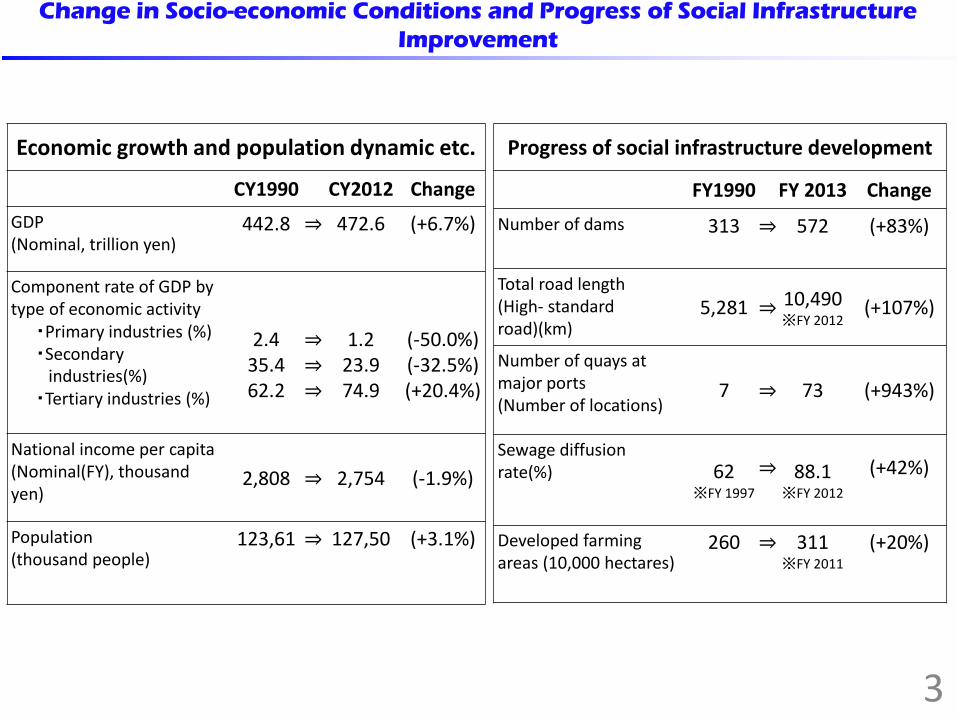
Change in Socio-economic Conditions and Progress of Social Infrastructure Improvement
Economic growth and population dynamic etc.
CY1990 CY2012 Change GDP (Nominal, trillion yen)
442.8 ⇒ 472.6 (+6.7%)
Component rate of GDP by type of economic activity ・Primary industries (%) ・Secondary
industries(%) ・Tertiary industries (%)
2.4 35.4 62.2
⇒ ⇒ ⇒
1.2 23.9 74.9
(-50.0%) (-32.5%) (+20.4%)
National income per capita (Nominal(FY), thousand yen)
2,808 ⇒ 2,754 (-1.9%)
Population (thousand people)
123,61 ⇒ 127,50 (+3.1%)
Progress of social infrastructure development
FY1990 FY 2013 Change Number of dams 313 ⇒ 572 (+83%)
Total road length (High- standard road)(km)
5,281 ⇒ 10,490 ※FY 2012
(+107%)
Number of quays at major ports (Number of locations)
7 ⇒ 73 (+943%)
Sewage diffusion rate(%)
62 ※FY 1997
⇒
88.1 ※FY 2012
(+42%)
Developed farming areas (10,000 hectares)
260
⇒ 311 ※FY 2011
(+20%)
3
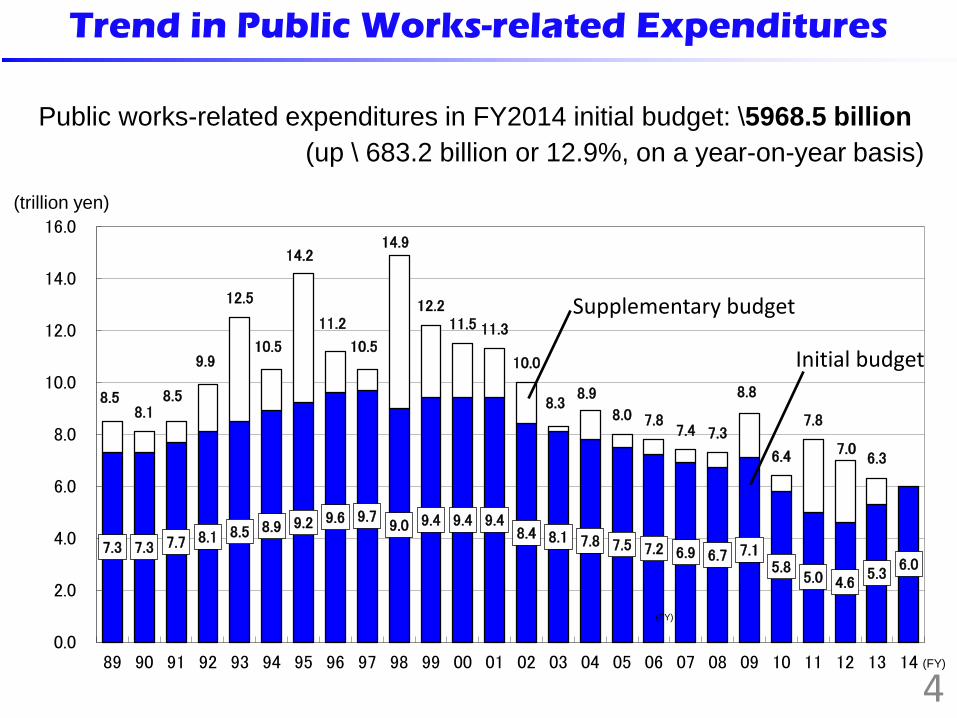
Public works-related expenditures in FY2014 initial budget: \5968.5 billion (up \ 683.2 billion or 12.9%, on a year-on-year basis)
7.3 7.3 7.7 8.1 8.5 8.9 9.2 9.6 9.7 9.0 9.4 9.4 9.4
8.4 8.1 7.8 7.5 7.2 6.9 6.7 7.1 5.8
5.0 4.6 5.3
6.0
8.5 8.1
8.5
9.9
12.5
10.5
14.2
11.2
10.5
14.9
12.2 11.5 11.3
10.0
8.3 8.9
8.0 7.8 7.4 7.3
8.8
6.4
7.8
7.0 6.3
0.0
2.0
4.0
6.0
8.0
10.0
12.0
14.0
16.0
89 90 91 92 93 94 95 96 97 98 99 00 01 02 03 04 05 06 07 08 09 10 11 12 13 14
(trillion yen)
(FY)
(FY)
Initial budget
Supplementary budget
Trend in Public Works-related Expenditures
4

Trend of General Government Fixed Capital Formation
Japan has been taking a sharp downward trend, but still keeps a higher level than major advanced countries.
4.8 4.8 5.0
5.7
6.3 6.0
6.2 5.9
5.5 5.7 5.6
5.1 4.9
4.6 4.2
3.7 3.6 3.3
3.1 3.0
3.5 3.2 3.2 3.1
2.3 2.4
2.5 2.4 2.3 2.3 2.3 2.4 2.4 2.4 2.4 2.5 2.5 2.6 2.5 2.4 2.4 2.4 2.4 2.6
2.6 2.5
2.3
2.2
2.3
2.2 2.2 2.1 2.1 1.9 1.5
1.2 1.3 1.3 1.2 1.5 1.6
1.6 1.8 1.9
1.8 1.9 2.3
2.7
2.5 2.2
2.2 2.0
2.3
2.2
2.6 2.8
2.7 2.5
2.2 2.1 1.9 1.9 2.0 1.9 1.8 1.8
1.6 1.5 1.4 1.5 1.5 1.6 1.8 1.7 1.7 1.5 1.6
3.4 3.4 3.6 3.6 3.5 3.4
3.2 3.1 2.9 2.8
2.9 3.1 3.0 2.9 3.0 3.1 3.3 3.2 3.3 3.2
3.4 3.1 3.1 3.2
3.2
0.0
1.0
2.0
3.0
4.0
5.0
6.0
7.0
89 90 91 92 93 94 95 96 97 98 99 00 01 02 03 04 05 06 07 08 09 10 11 12 13
(Note) The calculation is based on the numbers of 93 SNA standard. (Source) Japan: Cabinet Office “National Accounts” (fiscal year basis) Other countries: OECD “National Accounts” (OECD Stat Extracts) (calendar year basis), “Economic Outlook 70” (1989-1990 data for Germany) (calendar year basis)
(CY/FY)
(%)
Japan
France
U.K. Germany
U.S.
5
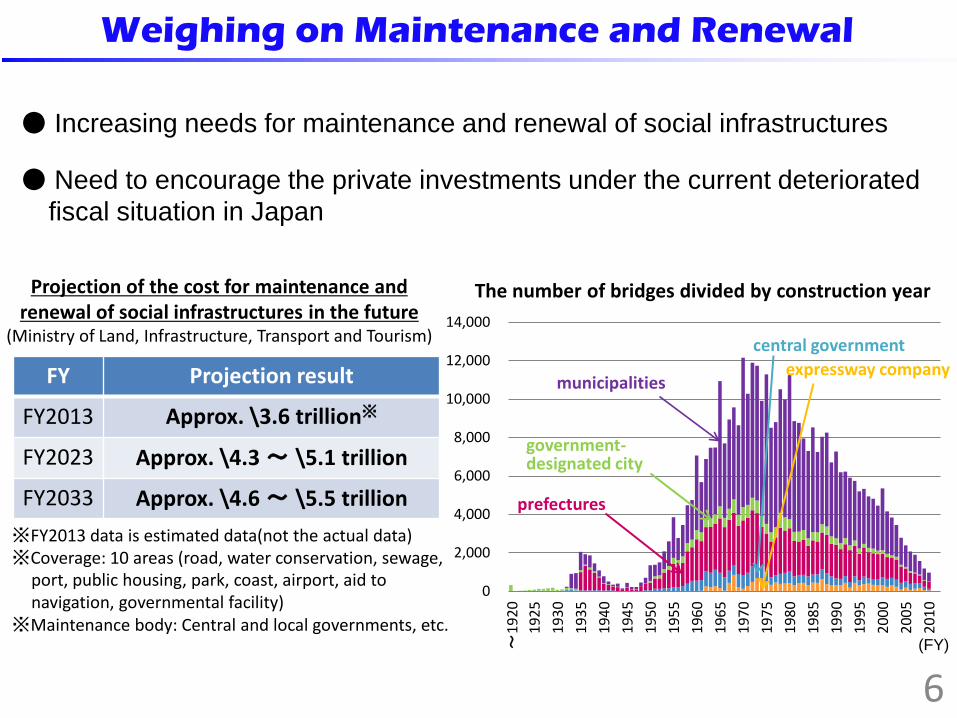
Weighing on Maintenance and Renewal
● Increasing needs for maintenance and renewal of social infrastructures
● Need to encourage the private investments under the current deteriorated fiscal situation in Japan
FY Projection result
FY2013 Approx. \3.6 trillion※
FY2023 Approx. \4.3 ~ \5.1 trillion
FY2033 Approx. \4.6 ~ \5.5 trillion ※FY2013 data is estimated data(not the actual data) ※Coverage: 10 areas (road, water conservation, sewage,
port, public housing, park, coast, airport, aid to navigation, governmental facility)
※Maintenance body: Central and local governments, etc.
Projection of the cost for maintenance and renewal of social infrastructures in the future
(Ministry of Land, Infrastructure, Transport and Tourism)
0
2,000
4,000
6,000
8,000
10,000
12,000
14,000
~19
20
1925
1930
1935
1940
1945
1950
1955
1960
1965
1970
1975
1980
1985
1990
1995
2000
2005
2010
The number of bridges divided by construction year
municipalities
prefectures
government-designated city
central government expressway company
(FY)
6

New Investment
● Need to evaluate the cost effectiveness of projects and select them carefully (value for money)
● Focusing on the projects to address the following issues;
- To enhance the international competitiveness of Japan
- To prevent and/or reduce the damage from natural disasters (earthquake, typhoon, etc.)
7

3 10
27
47
45
45
41 38 41 33
29
15 20
20 26
0 36
118
185
354
218
584
560 545
672
303
139 119
391
94 0
100
200
300
400
500
600
700
800
05
101520253035404550
99 00 01 02 03 04 05 06 07 08 09 10 11 12 13
The number of projects (per year)
Total amount of project(per year)
Overview of the PPP/PFI in Japan
(FY)
The number of PFI projects has been sluggish in recent years compared with early 2000’s. ⇒ Possible reasons have been pointed out as follows:
⇒ PFI has not fully utilized currently and need to promote it further.
8 (Note) the date: as the end of FY2013 (Source) The Cabinet Office
Less room for utilizing the private sector’s ideas and know-how Small number of projects for maintenance and management ⇒ Low incentives for private sector to participate in PFI projects ⇒ Amendment of PFI Act (Introducing Concession scheme, etc.)
(billion yen)

(1) Concession PFI : 2-3 trillion yen < Concrete action plan > • Introducing a concession PFI in the fields of airport, water supply and sewage etc.
(2) PFI projects collecting construction costs through utilizing the revenue from commercial facilities built on / in / public facilities: 3-4 trillion yen < Concrete action plan > • Introducing PPP method for rehabilitation of public facilities such as expressway (especially Metropolitan
Expressway which requires a large-scale rehabilitation).
(3) PPP projects utilizing the private sector’s proposals such as effective use of public real estate : 2 trillion yen < Concrete action plan > • Issuance of a guideline on the private sector’s proposals and establishment of a contact to receive them. • Establishment of public-private cooperation system in order to support formulation of PFI projects in cross-
cutting approach which Infrastructure UK has already adopted.
(4) Others (Introducing performance-linked revenue system, bundling the same type of several public facilities etc.): 3 trillion yen <Concrete efforts for (1) ~(4)> • Prioritizing subsidies and grants based on the appropriate evaluation toward government ministries and
agencies and local governments from the point of how much effort on Action Plan is made.
Action Plan toward Fundamental Reform of PPP/PFI (decided by the Council for the Promotion of PFI on June 6th, 2013)
Projects in the following 4 categories are to be focused on toward achievement of total 12 trillion yen of PPP/PFI projects in 10 years (2013-2022) as attractive to the private and local areas. The size and concrete action for each category are indicated below.
9

To accelerate “Action Plan toward fundamental reform of PPP/PFI” and achieve the creation of local business opportunities and the efficient administration of infrastructure and the improvement in infrastructure service and the economic growth led by leveraging of private investment, set the period of intensive enhancement and the priority area and the numerical targets and accelerate the scale objective of the “Action Plan” (2-3 trillion yen for next 3 years) by the government as a whole.
Period of Intensive Effort of “Action Plan” (decided by the Council for the Promotion of PFI on June 16th, 2014)
(1)Scale objective: 2-3 trillion yen (2)Number objective: 6 airport, 6 water supply and sewage, 1 road
○ the priority area and the numerical targets the period of intensive
enhancement Next 3 years(2014/4-2016/3)
the priority area airport, water supply and sewage, road
the numerical targets
(1) This target is not set on the precise accumulation of PFI project pipeline. (2) This target include consideration of introduction of concession 10

1
(Adoption of a new project) (Undertaken) (Completed)
(Within 5 years of completion)
Evaluation at adoption of a new project Revaluation Ex-post evaluation
(Not undertaken for 3 years)
(Continued for 5 years)
(Every 3 years after revaluation)
Planning-stage evaluation
In service Project implementation Planning stage
1. Planning-stage evaluation Clarify policy targets, and compare and evaluate several project proposals 2. Evaluation at adoption of a new project Evaluate the necessity of a new project to decide whether to launch the project 3. Revaluation Review the necessity of a project to decide whether to continue or discontinue the project 4. Ex-post evaluation Check the effects and environmental impacts of a project after its completion and, if
necessary, discuss more proper measures and planning to apply to future projects
Implementing the PDCA Cycle(Central Government)
11

Outline of the Calculation of Benefit by Cost (B/C) in the Road Development Project
Calculation of Benefits Calculation of Costs
○ Development cost ○ Total maintenance cost for 50 years
usage
Total costs
Evaluating the monetary value by measuring the value of time for people and traffic
Calculation of B/C
○ Social discount rate (4%) ○ To remove the price fluctuation (deflator)
○ Benefits from driving time reduction = The value of time per vehicle × Reduced driving time × Traffic volume ○ Benefits from driving costs reduction = Reduced driving costs by road development × Driving distance × Traffic volume ○ Benefits from traffic accidents reduction = Reduced the number of traffic accidents causing injury or death by road development × The average amount of loss per traffic accident (taking into account human loss, property damage and the loss by traffic jam)
○ Benefits from driving time reduction ○ Benefits from driving costs reduction ○ Benefits from traffic accidents reduction
Total benefits
Calculation method
Estimating the flow of traffic ○ Traffic volume ○ The speed of traffic flow etc.
12