infs 328 systems analysis and design · as stated in session 1, ... systems flow chart, data flow...
TRANSCRIPT

College of Education
School of Continuing and Distance Education2017
INFS 328
Systems Analysis and Design
Session 13 – Systems Analysis and Construction Tools
Lecturer: Prof. Ellis Edwin Badu, Dept. of Information Studies Contact Information: [email protected]

Session Overview
As stated in session 1, a number of tools and techniques areused by systems analysts and designers to analyse andsynthesise systems functions or units. Two were brieflydescribed. This session will demonstrate to you how toconstruct some of the tools for analysing and designingsystems namely; systems flow chart, data flow diagram,entity relationship diagram, entity life history and decisiontables.
Slide 2

Session Outline
The key topics to be covered in the session are as follows:
• Systems Flow Chart
• Data Flow Diagram
• Entity Relationship Diagram
• Entity Life History
• Decision Table
Slide 3

SYSTEMS FLOW CHARTTopic One
Slide 4

Systems Flow Chart
SYSTEM FLOW CHART
System flow chart is a physical modeling tool that hasvarious symbols to identify input and output operations,represent data or files and show media such as disks,documents and reports. It shows the overall structure of anInformation System. It is used mainly as documentation onlegacy systems
Slide 5

Systems Flow Chart
Advantages of Using System Flow Chart• It defines procedures for new operations
• It highlights physical media used in systems, thevarious work stations through which data pass aswell as the sequence of activities.
• Helps to avoid duplication
• Helps with the allocation of resources of staff tovarious jobs in the organization
Slide 6

Systems Flow Chart
Advantages of Using System Flow Chart• Uses very much in systems where the information flow
entails a large number of documents because it can showall input files, processing and output for a system. It isable to show origination, processing and destination ofeach document and the procedures employed by users.
• It is flexible and versatile
• Procedures can be compared to see which is best and it isvery useful for feasibility study particularly when it isused to establish that automation is beneficial
Slide 7

Systems Flow Chart
DISADVANTAGES
• It provides little details on how processes are actuallyaccomplished – does not furnish the details of programsfor a system.
• It reduces an entire program or set of programs into asingle box.
Slide 8

Systems Flow Chart
Symbols
There are many symbols used in systems flow charts. Theseare standard set of symbols developed by the AmericanNational Standards Institute (ANSI). Flow charts may alsobe drawn using software like Visio Professional, Corel Flow,System Architect, VISO Enterprise, Visible Analyst and ROSE.Symbol shapes indicate their meanings.
Slide 9

Systems Flow Chart
Symbols
Slide 10

Systems Flow Chart
Symbols
Slide 11

Systems Flow Chart
Symbols
Slide 12

Systems Flow Chart
Slide 13

Systems Flow Chart
Slide 14

Systems Flow Chart
Slide 15

DATA FLOW DIAGRAMTopic Two
Slide 16

Data Flow Diagram
Dataflow Diagram’s (DFD’s)
The basic purpose of dataflow diagrams is to describe the flow ofdata between entities, processes and data stores. Analysts usedataflow diagrams to understand the flow of data into, out of,and within the organisation and to provide a basic understandingof how a system works. The highest level DFD is called a contextdiagram (or Level 0 DFD). This defines the system boundary andshows how all information enters and leaves the system. DFDscan be used on both manual and computerised systems, and canb e used to model the existing system in order to highlight anygaps in the current data flow or logic. The four symbols used indataflow diagrams are as follows.
Slide 17

Data Flow Diagram
Dataflow Symbols:
Dataflow -
A dataflow indicates the movement of data from onelocation in the system to another location. A dataflow couldbe a letter, a verbal message, a telephone call an e-mail or afax (i.e. it may or may not involve the transfer of a physicaldocument).
Slide 18

Data Flow Diagram
Dataflow Symbols:
External Entity –
An entity is either the destination or the source of data,which is external to the system. It may be people, groups oranother organisation that either provide data to or receivedata from the system.
Slide 19

Data Flow Diagram
Dataflow Symbols:
Data Store –
Data stores are where data is held within the system andwhich receive dataflow. Examples of data stores are datafiles (manual or computerised), reports, documents andtransaction records.
Slide 20

Data Flow Diagram
Dataflow Symbols:
Data Process –
Data processes are processing activities carried out from a datastore or which produce data for a data store. Again, dataprocesses can be computerised or manual. A process simply usesdata from storage and performs some kind of operation uponthat data such as sorting, or re-calculating the data, then sendsthe processed data back to storage or as output to an externalentity.
Slide 21
Data Flow Diagram
Features of DFDs
As it is not possible to show all of the organisation’sprocesses within one context diagram, it is necessary toexplore DFDs in order to show increasingly detailed levels ofprocessing. This decomposition has the following purposes:
• Shows clearly where data is stored
• Defines which processes change data
• Ensures data analysis is complete and thorough
Slide 22

Data Flow Diagram
Features of DFDs
• Provides a basis for software specification by indicatingthe processing functions required by systems software.
• Each DFD will take one of the processes within a higherlevel DFD and draw further DFDs of its internal processes.This is repeated until a level is reached whereby theprocess has been described in sufficient detail to design acomputer program from the process description.
Slide 23

Data Flow Diagram
Slide 24

Questions
Activity:The stores department of X Ltd send purchase requisition orders(PRO) to the purchasing department. The purchasing departmentclerk checks the purchase requisition, and if incorrect it is returned tothe stores department for correction. If correct, the requisition isaccepted and an order is processed using an existing file of approvedsuppliers. The order is then processed and sent to the supplier. Theoriginal requisition order document is put on file and a copy of theorder is created and filed. Goods are delivered by the supplier andchecked on receipt and received. The supplier then sends an invoice.The invoice is compared with the requisition order on file and if theinvoice is queried it is returned to the supplier. Accepted invoices arepassed to accounts who pay the invoice. Completed orders are filed.
Prepare a DFD for the above process.Slide 25

Questions
Slide 26

ENTITY RELATIONSHIP DIAGRAMTopic Three
Slide 27

Entity Relationship Diagram
Entity relationship modelling (ERM)
Entity relationship modelling is a tool used within dataanalysis, and is structured around three basic concepts.
• An entity
This is an item (person, product, activity, job, departmentor business) that is important to an organisation and aboutwhich information must be stored. For example, customersand suppliers are entities as are employees.
Slide 28

Entity Relationship Diagram
• Attributes
An attribute is a fact or characteristic of an entitywhich the business records. For example, theattributes recorded about an employee couldinclude name, address, qualifications, departmentand current salary.
Slide 29

Entity Relationship Diagram
• Relationship
These are the logical links between entities. The degree ofrelationship between entities may be one of three, asshown below.
1. One-to-one relationship (1:1) means that the entityonly relates to one other entity.
That is, a student can only enrol on one degree.Slide 30

Entity Relationship Diagram
Relationship
2. One-to-many relationship (1:N) means that an entitycan relate to one or more other entities.
One degree will contain many modules of study.
Slide 31

Entity Relationship Diagram
Relationship
3. Many-to-many relationship (M:N) means that a numberof entities may relate to a number of other entities.
These various modules are likely to be taught by a numberof lecturers.
Slide 32

Questions
Activity:
Z Ltd has many departments (containing a numberof staff). Each department has only one manager,and these managers form the Management Board.The managers are all salaried and therefore are onthe monthly payroll. The other staff within thedepartment can either receive a salary (monthly) orcan be paid wages (received weekly).
Demonstrate the above using an ERM diagram.Slide 33
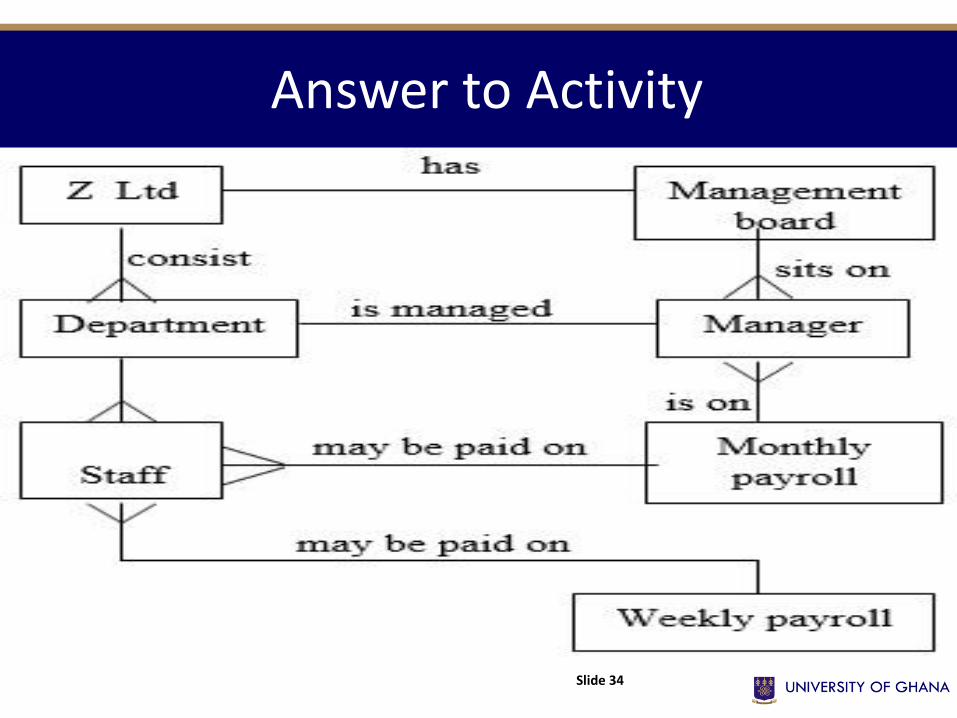
Answer to Activity
Slide 34

ENTITY LIFE HISTORY (ELH)
Topic Four
Slide 35

Entity Life History (ELH)
ELH is also sometimes referred to as an entity life cycleanalysis. An entity life history is a representation of theprocesses that occur in the life of each individual entity, andis designed to show the way in which information within asystem changes over time. An ELH shows what happens toan entity between its creation and its termination. Theentity can go through three phases of development:recreation, amendment and termination.
The important function of ELH analysis is the identificationof the events and functions of an entity that cause theentity to change, rather than the analysis of the entity itself.
Slide 36

Entity Life History (ELH)
Slide 37

Entity Life History (ELH)
Slide 38
There are three main symbols used within ELH diagrams; there is arectangular box, within which can be placed either an asterix or asmall circle. The top level shows the entity itself, and at eachsubsequent level the boxes read from left to right (in order ofcreate, amend, delete).At the lower levels, the boxes represent events which occur withinthe life of the entity. If an event affects an entity many times, thiscan be shown by an asterix. For example, the above shows thatthe student will study numerous modules during the life cycle.Similarly, testing will consist of a number of examinations.The boxes with small circles in the top right hand corner indicatealternatives for particular events. For example, students may belearning or being tested but not at the same time. Similarly, for anexamination, the student can either pass or fail, but not both.

DECISION TABLES
Topic Five
Slide 39

Decision Tables
Decision tables are used to describe the processinglogic of a system. The most useful application ofdecision tables is in a situation where there may bea number of alternative conditions to evaluate. Adecision table contains four quadrants: theconditions quadrant, the conditions entry quadrant,the action quadrant and the action entry quadrant.
Slide 40

Decision Tables
Decision Table Quadrants
Slide 41

Decision Tables
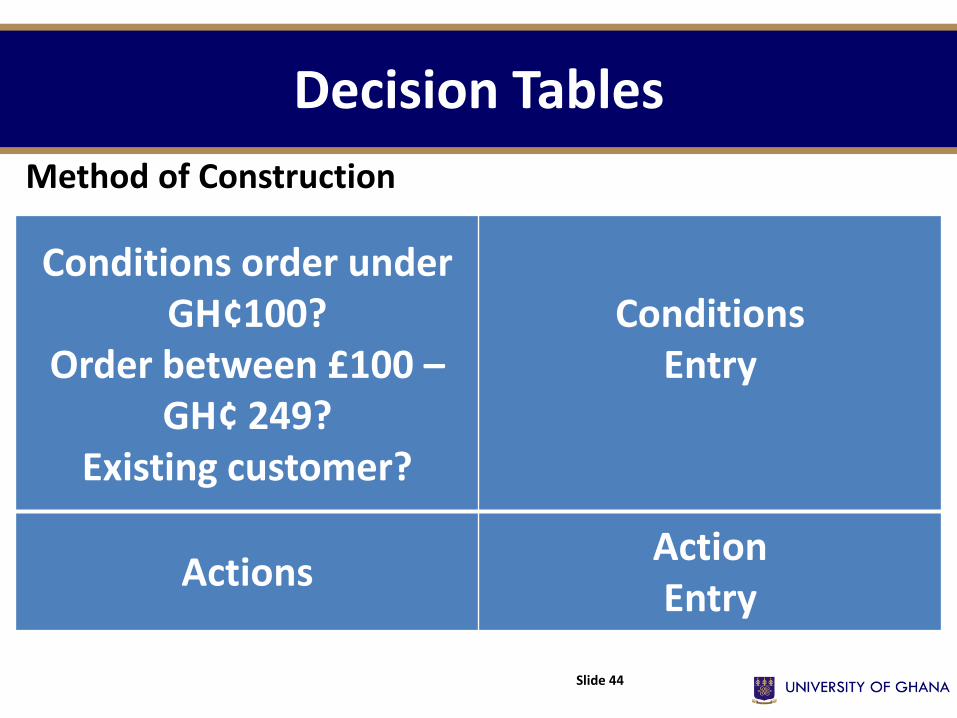
Method of Construction
The decision table begins with the posing of a question.Starting with a basic example: do we offer credit facilities toour customers?
From the question, establish the conditions and thencomplete the condition quadrant of the table. Theconditions need to be formulated into a question formatthat can be answered by yes or no answers only.
Slide 42

Decision TablesMethod of ConstructionThus, for the above example, the conditions could be as follows:• Customers with orders under GH¢100 do not receive credit
facilities• Customers with order valued between 100 euros and249
Ghana Cedis receive credit for one year. Existing customersrate of interest is 5 percent per annum, and new customersrate of interest is 7 per cent
• Existing customers with orders above GH¢250 are offeredcredit terms at 7 per cent for one year, but new customerswith orders over GH¢ 250 must undertake a credit checkprocedure.
Slide 43
Decision Tables
Method of Construction
Slide 44
Conditions order under GH¢100?
Order between £100 –GH¢ 249?
Existing customer?
ConditionsEntry
ActionsActionEntry

Decision Tables
Method of Construction
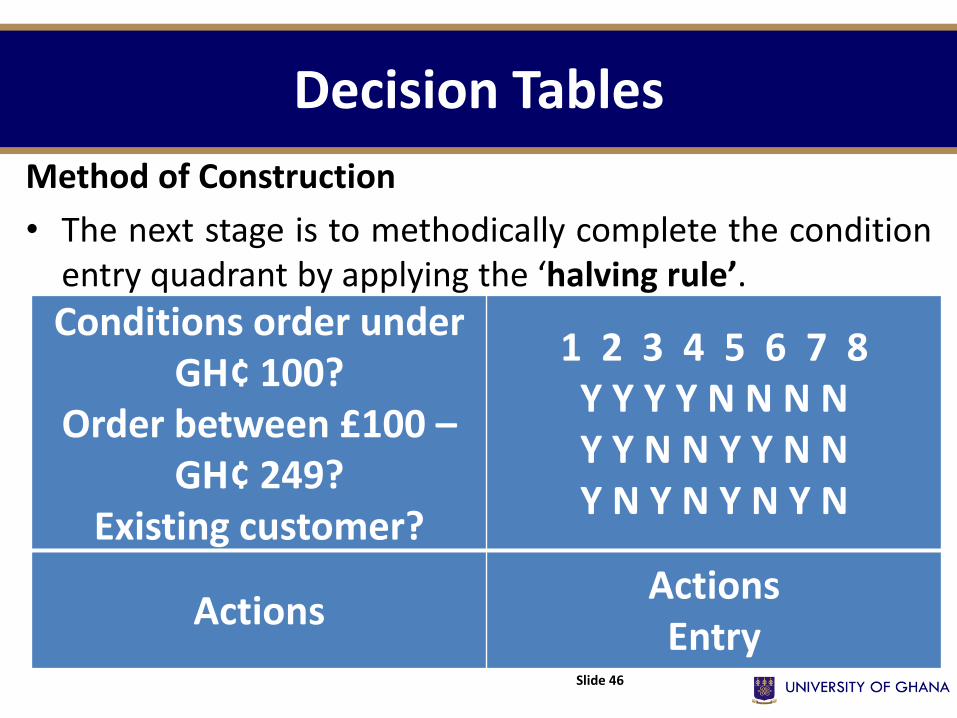
• The next stage is to fill in the condition entry quadrant.The condition entry should contain the answers in yes orno format that will cover every possible condition in thecondition quadrant. The condition entry quadrant iscompleted in the form of’ columns’ of combinations ofyes and no answers. The number of columns isdetermined by 2 to the power of’ n’, in being the numberof questions in the ‘conditions’ quadrant. In this casetherefore, the number of columns s 23=8
Slide 45
Decision Tables
Method of Construction
• The next stage is to methodically complete the conditionentry quadrant by applying the ‘halving rule’.
Slide 46
Conditions order under GH¢ 100?
Order between £100 –GH¢ 249?
Existing customer?
1 2 3 4 5 6 7 8Y Y Y Y N N N NY Y N N Y Y N NY N Y N Y N Y N
ActionsActionsEntry

Decision Tables
Method of Construction
• Now eliminate any impossible columns from thecondition entry quadrant
Slide 47
Conditions order under GH¢100?
Order between £100 –GH¢ 249?
Existing customer?
1 2 3 4 5 6 7 8Y Y Y Y N N N NY Y N N Y Y N NY N Y N Y N Y N
ActionsActionEntry

Decision Tables
Method of Construction• In this question, the first two columns are impossible situations and can
therefore be eliminated. The next stage is to complete the action quadrant, bylisting the possible alternative actions that can be carried out.
Slide 48
Conditions order under GH¢100?Order between £100 -
GH¢ 249?Existing customer?
3 4 5 6 7 8Y Y N N N NN N Y Y N NY N Y N Y N
ActionsNo credit given
Credit given 1 year at 5%Credit for 1 year at 7%
Credit check
ActionEntry

Decision Tables
Method of Construction
• Now complete the action entry quadrant by considering eachpossible combination of conditions, and place an x in the actionentry quadrant to indicate action to be taken.
Slide 49
Conditions order under GH ¢100?Order between £100 -
GH¢ 49?Existing customer?
3 4 5 6 7 8Y Y N N N NN N Y Y N NY N Y N Y N
ActionsNo credit given
Credit given 1 year at 5%Credit for 1 year at 7%
Credit check
XXXXX
X

References
Slide 50
• Checkland, P. (1999). System Thinking, System Practice.Chiches: John Wiley.
• O’Brien, J. A. (2003). Introduction to Information Systems:Essentials for E-Business Enterprise. Boston: Irwin
• O’Leary, I. and O’leary, T. I. (2004). Computing Today.Boston: Mc Craw-Hill
• Rowley, J. (1990). The Basics of Systems Analysis andDesign for Information Managers. Ludin: Clive Bingley
• Whitten, J. et al (2000). Systems Analysis and DesignMethods. 6th ed., Boston: Mc Craw-Hill