ingersoll rand -...
TRANSCRIPT

1 | TABLE OF CONTENTS
SustainingGlobal Leadership2016 ANNUAL REPORT
2017 NOTICE AND PROXY STATEMENT
4 | CORPORATE DATA
Ingersoll Rand (NYSE:IR) advances the quality of life by creating comfortable, sustainable and efficient
environments. Our people and our family of brands—including Club Car®, Ingersoll Rand®, Thermo King® and
Trane®—work together to enhance the quality and comfort of air in homes and buildings; transport and protect
food and perishables; and increase industrial productivity and efficiency. We are a $13 billion global business
working together for enduring results.
We are committed to using environmentally conscious print practices. ©2017 Ingersoll Rand
Ing
ersoll R
and
Sustain
ing
Glo
bal Lead
ership
20
16
AN
NU
AL R
EP
OR
T2
01
7 N
OT
ICE
AN
D P
RO
XY
STAT
EM
EN
T

We heat, cool and automate homes and buildings;
enhance commercial and industrial productivity;
keep transported food and perishables safe
and fresh; and deliver fun, efficient and reliable
transportation solutions. Diversity, engagement
and teamwork drive innovation and fuel our
passion for exceeding customer expectations.
Together with principled leadership and ethical
business practices, our high-engagement
culture delivers enduring results that lead to a
sustainable world.
SUSTAINING GLOBAL LEADERSHIP
Ingersoll Rand (NYSE: IR) creates comfortable, sustainable and efficient environments that advance the quality of life across the globe.
At Ingersoll Rand, sustainability is the very foundation of our business.
CONTENTS
GLOBAL MARKET-LEADING BRANDS 1
LETTER FROM OUR CEO 2
DELIVERING EXCELLENCE 5
WINNING TOGETHER 8
MAKING A DIFFERENCE 12
LEADERSHIP 16
Macro trends such as climate change, urbanization
and resource constraints are changing the world.
We are making our strategic choices against this
backdrop. We have assembled the right mix of
businesses, products and services, and our scale
and scope make us capable of transforming what
it means to be an industry leader. Living our
commitment to responsible leadership, we are
strategically investing our 146-year heritage of
success and talent to create a more sustainable
future for our business, society and the
environment.
CORPORATE DATA | 17
This integrated annual report and the 2016 online sustainability supplement at www.ingersollrand.com/sustainabilitysupplement is produced in accordance with the G4 framework established by the Global Reporting Initiative (GRI) and reports on our financial and non-financial performance for the 2016 fiscal year. For more information on GRI, please visit www.globalreporting.org. To ensure the quality of our environmental, health and safety data, we assure selected data with a third-party provider. The results of this assurance can be found in our online sustainability supplement at www.ingersollrand.com/sustainabilitysupplement. At the time of publication, assurance of our environmental and safety data from operations was not yet complete and the data presented in this document is subject to change. This annual report, including the letter to shareholders, contains “forward-looking statements,” which are statements that are not historical facts, including our ability to address environmental and social challenges, the future success of our operational excellence initiatives, our future financial performance, our growth and our positioning in and the performance of the markets in which we operate. These statements are based on currently available information and our current assumptions, expectations and projections about future events. While we believe that our assumptions, expectations and projections are reasonable in view of the currently available information, you are cautioned not to place undue dependence on our forward-looking statements. Forward-looking statements speak only as of the date they are made and are not guarantees of future performance. They are subject to future events, risks and uncertainties — many of which are beyond our control — as well as potentially inaccurate assumptions that could cause actual results to differ materially from our expectations and projections. You are advised to review the factors described under the captions “Risk Factors” and “Management’s Discussion and Analysis of Financial Conditions and Results of Operations” in our Form 10-K for the fiscal year ended December 31, 2016, and any further disclosures we make on related subjects in materials we file with or furnish to the SEC. We do not undertake to update any forward-looking statements.
SHAREHOLDER INFORMATION SERVICES
The company’s 2016 Annual Report on Form 10-K
as filed with the United States Securities and Exchange
Commission, and other company information, is
available through Ingersoll Rand’s website,
www.ingersollrand.com. Securities analysts, portfolio
managers and representatives of institutional
investors seeking information about the company
should contact:
Joe Fimbianti
Director, Investor Relations
704-655-4721
ANNUAL GENERAL MEETING
June 8, 2017, 2:30 p.m.
The K Club
Straffan, Co. Kildare
Ireland
NEW YORK STOCK EXCHANGE
TRANSFER AGENT AND REGISTRAR
Computershare
Telephone Inquiries: 866-229-8405
Website: www.computershare.com/Investor
Address shareholder inquiries with standard priority:
Computershare
P.O. Box 43006
Providence, RI 02940-3006
Address shareholder inquiries with overnight priority:
Computershare
250 Royall Street
Canton, MA 02021
CORPORATE DATA

GLOBAL MARKET-LEADING BRANDS | 1
Global Market-leading Brands Our people and family of brands – including Ingersoll Rand®, Club Car®, Thermo King® and Trane® – work together
to create value for customers in global commercial, industrial and residential markets.
Growth Excellence.
We use analytics to make
clear, strategic choices on
what businesses and markets
to invest in and pursue, and
how to succeed by introducing
productive, energy-efficient and
reliable products and services
to deliver on customer needs.
Operational Excellence.
We pursue continuous process
improvement that drives
growth, creates value, fosters
employee engagement, and
enhances quality and the
customer experience.
Winning Culture.
We engage our employees
and develop a workforce with
diverse backgrounds and skills
to foster an environment of
innovation and integrity that
leads to better products and
services for our customers,
society and the environment.
Our Strategy for Sustained Leadership
Club Car leads the industry in delivering fun,
efficient and reliable personal transportation
solutions for golf, commercial, institutional, resort
and consumer uses.
Our product portfolio includes a consumer vehicle,
golf cars, turf and commercial utility vehicles,
multi-passenger shuttle vehicles, rough-terrain
utility vehicles and a digital fleet management
system for course owners and resort operators.
Ingersoll Rand enhances operational efficiency,
saves energy and improves productivity through
innovative equipment, products and services.
Our industrial equipment, products and services
range from complete compressed air and gas
systems and services to power tools, fluid
management and material handling systems.
Thermo King enhances the quality of life
through temperature-management solutions
in global transportation to preserve fresh
foods, pharmaceuticals and other temperature-
sensitive products.
We manufacture transport temperature-control
systems for a variety of mobile applications,
including trailers, trucks, buses, shipboard
containers and railway cars.
Trane ensures homeowners and commercial
building owners maximize the comfort and energy-
efficiency potential of their home or facility.
We safely and efficiently optimize indoor
environments with a broad portfolio of heating,
ventilation and air conditioning (HVAC) systems,
connected building and energy services, parts
support and advanced building automation controls.
GLOBAL MARKET-LEADING BRANDS | 1
Our peoplee and family of brands – including Ingersoll Rand®, Club Car®, Thermo King® and Trane® – work together
to ccreattee value for custommers in global commercial, industrial and residential markets.
GGrroowth Excelllencee..
We use analytics to maakke
clear, strategic choicess o on
what businesses s and mamarkets
to invest inn a andnd ppuursue,, aand
how to succeed by intrododucing
prp oductive, energy-efficcieient and
reliable products and servrvices
to deliver on customer neee ds.
Operational Excellence.
We pursue continuous process
improvement that drives
growth, creates value, fosters
employee engagement, and
enhances quality and the
customer experience.
Winning Culture.
We engage our employees
and develop a workforce with
diverse backgrounds and skills
to foster an environment of
innovation and integrity that
leads to better products and
services for our customers,
society and the environment.
Our SSttrategy forr Sustained Leadership
Cl bub Carar leadss the industry in delivering fun,
efficienntt and rereliable personal transportation
solutions for golfl , commercial, institutional, resort
annd consumer usses.
OuOurr prp oduct portfolio includes a consumer vehicle,
ggolf c carars, turf f anand commercial utility vehicles,
muulti-passsenger shuttle vehicles, rough-terrain
utili ity y vevehicles and a digital fleet management
sysyststem for course owners and resort operators.
Ingersoll RaRand enhanceces operational efficiency,
saves enenergyy aandnd impm roves productivity through
innonovatitiveve equipment, products and services.
Our industrial equipmeent, products and services
range from complettee ccompressed air and gas
systems and servicees to power tools, fluid
management and mmaterial handling systems.
Thermo King enhances the quality of life
through temperature-management solutions
in global transportation to preserve fresh
foods, pharmaceuticals and other temperature-
sensitive products.
We manufacture transport temperature-control
systems for a variety of mobile applications,
including trailers, trucks, buses, shipboard
containers and railway cars.
Trane ensures homeowners and commercial
building owners maximize the comfort and energy-
efficiency potential of their home or facility.
We safely and efficiently optimize indoor
environments with a broad portfolio of heating,
ventilation and air conditioning (HVAC) systems,
connected building and energy services, parts
support and advanced building automation controls.
318349_NAR.indd 1 4/13/17 1:26 AM

2 | LETTER FROM OUR CEO2 |2 | LLETTETTTERER F FROMROM OU OURR CE CEOO
“Our legacy extends beyond just the next few years – as we lead long-term value creation and positive societal impact within our industries, we build a legacy for the next century and beyond.”
Dear Shareholder,
Ingersoll Rand links business opportunities to
important global trends to create long-term value for
our people, our customers and the world. Whether
the challenge is climate change, urbanization or
natural resource constraints, our expertise enables us
to reduce energy demand and improve efficiency in
buildings, industrial processes and transportation.
Sustainability in all its forms – business, social and
environmental – is central to our strategy. Just as
we have for the past 146 years, we continue to build
a more sustainable and thriving enterprise. We’re
leading the way to long-term value creation and
positive societal impact within our industries, and
building a legacy for the next century and beyond.
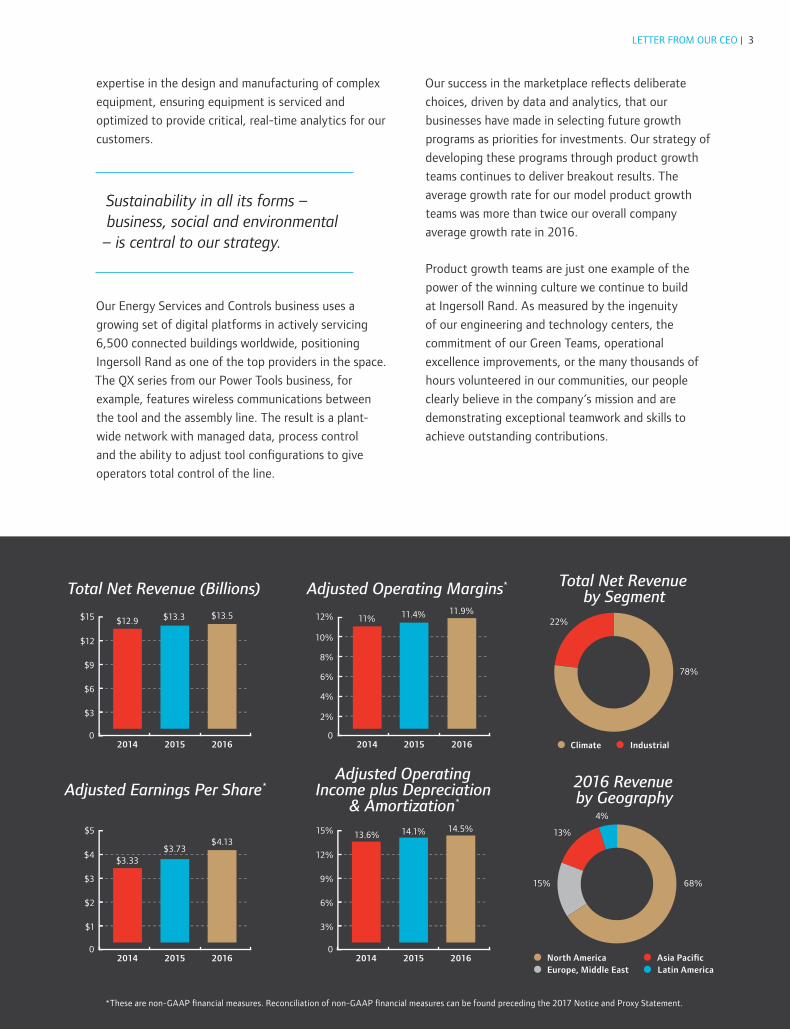
Our strategic focus on business sustainability served
us well in 2016. As you can see in the charts to the
right, net revenue, adjusted operating margins and
adjusted earnings per share (EPS) were up from the
prior year. These results follow a multi-year pattern
of consistently strong operating and financial
performance driven by our strategic framework of
sustained growth, operational excellence, favorable
cash flow conversion and a commitment to our
winning culture.
We launched more than 80 new products and
services in 2016, with introductions in nearly every
business and region, while continuing to reduce
costs and improve productivity. On a reported basis
this progress translated into 60 basis points of
operating margin expansion and strong cash flow in
a low-growth environment. Our cash flow success
story was one of the most noteworthy, as our free
cash flow* increased 37 percent from 2015 to
$1.3 billion – 121 percent of adjusted net earnings*.
We also retained a strong balance sheet while
returning significant cash to shareholders in 2016.
Ingersoll Rand paid approximately $350 million in
dividends during the year, and executed $250 million
in share buybacks. We continued our long history of
corporate dividend increases, raising our quarterly
dividend by approximately 40 percent through two
increases from $0.29 per share to $0.40 per share,
concluding the year at $1.60 annualized per share.
As anticipated, connected buildings, industrial
facilities, homes and vehicles are providing our
customers with more information, accessibility and
productivity, and we realized increased growth in
2016 stemming from smart, wireless and digitally
connected solutions. Each of our businesses is
executing a digital strategy that extends our core
MICHAEL W. LAMACH,
CHAIRMAN AND CEO
Letter From Our CEO
318349_NAR.indd 2 4/13/17 1:26 AM
LETTER FROM OUR CEO | 3
expertise in the design and manufacturing of complex
equipment, ensuring equipment is serviced and
optimized to provide critical, real-time analytics for our
customers.
Our Energy Services and Controls business uses a
growing set of digital platforms in actively servicing
6,500 connected buildings worldwide, positioning
Ingersoll Rand as one of the top providers in the space.
The QX series from our Power Tools business, for
example, features wireless communications between
the tool and the assembly line. The result is a plant-
wide network with managed data, process control
and the ability to adjust tool configurations to give
operators total control of the line.
Our success in the marketplace reflects deliberate
choices, driven by data and analytics, that our
businesses have made in selecting future growth
programs as priorities for investments. Our strategy of
developing these programs through product growth
teams continues to deliver breakout results. The
average growth rate for our model product growth
teams was more than twice our overall company
average growth rate in 2016.
Product growth teams are just one example of the
power of the winning culture we continue to build
at Ingersoll Rand. As measured by the ingenuity
of our engineering and technology centers, the
commitment of our Green Teams, operational
excellence improvements, or the many thousands of
hours volunteered in our communities, our people
clearly believe in the company’s mission and are
demonstrating exceptional teamwork and skills to
achieve outstanding contributions.
Sustainability in all its forms – business, social and environmental – is central to our strategy.
$15
2014 2015 2016
$12
$9
$6
$3
0
12%
2014 2015 2016
10%
8%
6%
4%
2%
0
$5
2014 2015 2016
$4
$3
$2
$1
0
15%
2014 2015 2016
12%
9%
6%
3%
0
22%
78%
Climate Industrial
4%
13%
15% 68%
North America Asia Pacific
Europe, Middle East Latin America
Total Net Revenue (Billions)
Adjusted Earnings Per Share*
Adjusted Operating Margins*
Adjusted Operating Income plus Depreciation
& Amortization*
Total Net Revenue by Segment
2016 Revenue by Geography
$12.9
$3.33
11%
13.6%
$13.3
$3.73
11.4%
14.1%
$13.5
$4.13
11.9%
14.5%
*These are non-GAAP financial measures. Reconciliation of non-GAAP financial measures can be found preceding the 2017 Notice and Proxy Statement.
318349_NAR.indd 3 4/13/17 1:26 AM
4 | LETTER FROM OUR CEO
I was delighted to see our employee engagement
scores continue our long-term improvement trend in
2016. Our people feel they are winning – individually,
as a team and as a company. It was particularly
inspiring to see our associates’ highest rankings in
sustainability, ethics and values, and safety, which
further helped us achieve top-quartile employee
engagement scores among all industries.
Employee engagement fuels the contributions we
are making to address critical social sustainability
issues through volunteerism, customer partnerships
and corporate social responsibility to meet the needs
of our local communities. We’re working to improve
food security, drive quality education, improve
gender equality, support sustainable cities and
communities, and create resilient infrastructures.
Employees from around the globe came together in
2016 to package meals for 110,000 undernourished
children, moving us one step closer to reaching our
2020 goal of providing food and nutrition education
to 200,000 children around the world.
Equally important, our people believe that
environmental sustainability and energy efficiency
are critical to our future success. With their support,
we’re able to stay out in front of our customers’
expectations, the competition and the regulatory
environment – making us a leader in reducing energy
use and greenhouse gas emissions.
Two years ago we made a public, enterprise-wide
Climate Commitment to significantly reduce the
greenhouse gas emissions of our products and
operations. We’re on track to complete this goal
and, through 2016, have avoided approximately
6.7 million metric tons of CO2e globally. This equates
to avoiding annual CO2 emissions from energy used
in more than 700,000 homes or more than 7.1 billion
pounds of coal burned. At the same time, we’ve
helped pioneer the development of several next-
generation, low-global warming potential EcoWise™
products that meet or exceed global refrigerant
transition requirements while delivering high energy
efficiency.
Our plan for 2017 is to capitalize on last year’s
positive momentum to maximize growth, while
delivering productivity and discerning investment
and allocation of our cash. Our commercial and
residential HVAC businesses are strong and focused
on growth areas with equipment, controls and
services. Our transport refrigeration business is
diverse and agile and will continue to execute its
strategy as in the past. Our industrial businesses are
focused on margin expansion as markets stabilize.
From a capital allocation perspective, strengthening
and growing our business organically will be
our highest priority and I am confident Ingersoll
Rand will continue to deliver top-tier financial
performance.
I am proud of our team for delivering record
performance in 2016, both operationally and
financially. We’re building a more strategically
and operationally integrated, top-tier diversified
industrial company and a more valuable and
sustainable Ingersoll Rand in every way.
On behalf of our entire team, I extend our deep
appreciation to you for your support this past
year. We’re committed to sustaining our leadership
globally for you and all the company’s stakeholders,
and I look forward to keeping you apprised of
our progress.
Sincerely,
Michael W. Lamach
Chairman and CEO
I am proud of our team for delivering record performance in 2016, both operationally and financially.
318349_NAR.indd 4 4/13/17 1:26 AM

DELIVERING EXCELLENCE | 5DDELIELIVERVERINGING E EXCEXCELLELLELLENCENCENCE | | | 5 5 5
Delivering Excellence
The core of our growth strategy is to invest in opportunities related to energy efficiency and environmental sustainability in buildings, industrial processes and transportation around the world.
Our commitment to sustainability starts with ensuring
the viability of our business over the long term. This
means achieving consistent top-quartile performance on
financial measures including organic growth, incremental
margins, EPS growth, cash flow conversion and total
return on invested capital. Powered by our business
operating system, Ingersoll Rand has delivered top-tier
results across these metrics over the past six years.
The core of our growth strategy is to invest in
opportunities related to energy efficiency and
environmental sustainability in buildings, industrial
processes and transportation around the world. Our
product portfolio is focused on enabling our customers
to use energy, water and other critical resources more
efficiently and productively to improve building and
operational performance, and optimize transportation
logistics. We are considered industry leaders in
developing and commercializing next-generation
energy-efficient technologies that incorporate
refrigerants with lower global-warming potential.
Execution of our growth strategy takes place at the
business level. This is where we make decisions regarding
where to focus resources, how to win and gain share
in the marketplace, and how to improve margins in
new products and services. Using data analytics and
competitive intelligence, each business is responsible for
identifying the market opportunities with the greatest
potential for driving profitable growth over the next
three to five years.
Our businesses translate these opportunities into
strategic growth programs, which are typically led by
product growth teams (PGTs). PGTs bring together
company leaders in product management, global
integrated supply chain and engineering to address
evolving customer needs and expand our market share
and operating income margins.
We launched more than 80 new products and services in
2016, spanning nearly every business and region. Each
Trane Introduces Seamless Experience for Dealer Customers
Responding to customer feedback, Trane is
targeting co-located Trane Supply stores and
residential HVAC dealer sales offices across
North America to provide a seamless parts
and equipment purchasing experience.
“The biggest change of all is a cultural shift in
how we think about customer relationships
and creating a differentiated experience,”
said Scott Garner, program manager, sales,
Residential HVAC & Supply.
318349_NAR.indd 5 4/13/17 1:26 AM

6 | DELIVERING EXCELLENCE
of these new offerings was designed to meet growing
customer demand for smart and digitally connected
solutions and services. Our average innovation
revenue from 2014 through 2016 was 22 percent, and
we delivered these high-quality products and services
to market on time and within budget.
We make the Ingersoll Rand Business Operating
System a living framework of best-known processes
inside the company to execute against our growth
and operational strategies. Our people invest in its
development and evolution, making it dynamic and a
core element of the company’s success.
Our growth and margin improvement over the past six
years reflects consistent productivity gains. Although
productivity is typically regarded as cost reduction,
efficiencies and labor savings, we define it as a way
of thinking creatively about how we can outperform
the competition in satisfying customers’ changing
expectations. As an example, we stress evaluating
total transactional costs versus independent
component costs, allowing us to better capitalize
upon productivity opportunities.
We have a proven track record for converting
the company’s profitable growth into reduced
working capital requirements and strong free cash
flow. The company’s balance sheet is healthy, and
has offered flexibility in our cash deployment
alternatives, including reinvestment in the business,
acquisitions, share repurchases and dividend
increases. The company has invested its cash flow
in differentiated products, services and acquisitions,
while also returning approximately $6.5 billion back
to shareholders over the past six years. Our goal is to
extend our record of creating long-term value for our
shareholders through discerning and dynamic capital
allocation.
Onward™, a New Ride for a New Era
Club Car recently introduced Onward, a
personal transportation vehicle that paves
the way for strategic growth. Onward is
designed for master-planned communities
and large open neighborhoods, which are
becoming commonplace across the United
States. “We continue to innovate with an
eye toward the future and understand that
our customers’ needs are changing,” said
Marc Dufour, president of Club Car.
“We’re proud of what our team has
delivered, and know we are in a great
position to accelerate growth in this
rapidly expanding market.”
Lean Transformation Reduces Inventory at Taicang Plant
Marking a milestone in a lean
transformation process underway since
2010, employees from our Taicang, China,
plant decreased the in-stock inventory of
CTV compressors from six to just one. This
initiative saved RMB 1 million in inventory
cost, reduced warehouse expenses and
accelerated delivery time for customers.
318349_NAR.indd 6 4/13/17 1:26 AM

DELIVERING EXCELLENCE | 7
VISION PURPOSE
A world of sustainable progress and enduring results.
We advance the quality of life by creating comfortable, sustainable and efficient environments.VALUES
INTEGRITY:
We act with the highest ethical and legal standards in
everything we do.
RESPECT:
We respect and value the worth of all people, cultures,
viewpoints and backgrounds.
TEAMWORK:
We work together and share resources to provide
greater value to our customers, employees, business
partners and shareholders.
INNOVATION:
We use our diverse skills, talents and ideas to develop
customer-driven, innovative and imaginative solutions.
COURAGE:
We speak up for what we believe is right and take
measured risks to create progress.
Next Generation R-Series Reduces Customers’ Energy Costs
Our Compression Technologies and Services (CTS) business expanded its
groundbreaking line of Next Generation R-Series contact-cooled rotary
screw air compressors. Launched in 2016, our new RS30n and RS37n
models boost air flow output for our customers by up to 15 percent and
reduce their energy costs by up to 35 percent, while improving system
reliability. “Plant managers and facility owners are under extraordinary
pressure to reduce costs, while improving productivity and energy
efficiency,” said Eric Seidel, vice president of product management for
CTS. “We introduced our 30-37 kilowatt models late in 2015, raising
the bar on performance. Now, by adding variable speed models, we are
meeting market needs for plants that have fluctuating air demands.”
318349_NAR.indd 7 4/13/17 1:26 AM

8 | WINNING TOGETHER8 | WINNNINGN TOGGEETHETHERR
Winning Together
We invest in our people at Ingersoll Rand. We respect and value their diverse cultures, backgrounds and perspectives, and we understand the success of our strategies require high employee engagement. We strive to create an environment where all associates win when the company wins.
As we work to create long-term enterprise
value, we recognize that sustainability also has
a social dimension. Ingersoll Rand defines social
sustainability as caring about and investing in the
needs of our associates and communities over
the long term. We partner with our stakeholders
in pursuit of positive societal change, ensuring
all parties operate with integrity and an ethical
mindset. In doing so, we share responsibilities for
delivering results the right way. We strive to engage
our employees, produce a better experience for
our customers, innovate with our suppliers and
collaborate with local nonprofits and education
institutions to improve the quality of life in the
communities where we do business.
We invest in our people at Ingersoll Rand. We respect
and value their diverse cultures, backgrounds and
perspectives, and we understand the success of our
strategies require high employee engagement. We
strive to create an environment where all associates
win when the company wins – that is, where our
people can learn and thrive in their careers and
realize their aspirations in a dynamic and progressive
organization.
More than 95 percent of our associates annually
participate in the company’s engagement survey. Our
engagement scores have increased 16 points over
the past five years, demonstrating that our people
We partner with our stakeholders in pursuit of positive societal change, ensuring all parties operate with integrity and an ethical mindset.
Career Progress: a New Approach to Career Management and Rewards
Career development and coaching is critical
to building a high-performing company
that is ready to meet current and future
challenges. Career Progress, our new,
integrated career management and rewards
system, is helping to meet that need with
a suite of career management resources.
Associates now have greater visibility to
career possibilities and the competencies,
skills and experiences needed to reach their
career aspirations. With new insights, our
people can better navigate career
options, take more deliberate development
steps, make more informed career decisions,
and, most important, have more meaningful
and productive career conversations with
their managers.
318349_NAR.indd 8 4/13/17 1:26 AM

WINNING TOGETHER | 9
100 of the company’s top suppliers came together for
the Ingersoll Rand Global Supplier Conference, which
concluded with a meeting of our newly established Global
Supplier Council. “Gathering our top suppliers was a great
way to demonstrate we’re seeking partners who, like
Ingersoll Rand, aim to invest in innovation and delight the
customer while advancing the goal of global sustainability,”
said John Evans, vice president, global procurement.
The Latin America chapter of the Ingersoll Rand Women’s
Employee Network (WEN) focused on women’s career
development, professional advancement and leadership
throughout 2016. The WEN has eight chapters around the
world and is just one of the company’s seven Employee
Resource Groups. These groups serve as catalysts in
helping our people advance their careers while learning
about other cultures and embracing workforce diversity.
In 2016, approximately 2,000 employees participated in
WEN chapters globally.
WORLD-CLASS PERFORMANCE
Ingersoll Rand Hosts Global Supplier Conference
Women’s Employee Network Strengthened in Latin America
World-class Safety PerformanceAS RANKED AMONG OTHER GLOBAL ORGANIZATIONS
42% Decline in total recordable incident rate
2010 2011 2012 2013 2014 2015 2016
SINCE 2010
318349_NAR.indd 9 4/13/17 1:26 AM

10 | WINNING TOGETHER
believe in Ingersoll Rand and its mission. At the
same time, we have used feedback from the survey
to strengthen our winning culture. Career Progress,
introduced in 2016, evolved from our associates’
feedback on improving the company’s career
development programs.
Employee engagement helps drive our business
operating system, nurturing continuous improvement
and enabling us to adopt new ideas more rapidly. We
believe the willingness to accept new ideas stems in
large part from being open to people with different
points of view. Ingersoll Rand is committed to being
progressive and inclusive, based on our conviction
that engaging a workforce from diverse backgrounds
is a powerful source of competitive advantage.
At a time when one of the few constants is
technology-driven change, we empower our people
to discover opportunities to continuously improve
their skills, build their capabilities, and strengthen
their personal and team performance. As our
markets migrate toward networked solutions, we
are recruiting and developing the company’s next
generation of tech-fluent employees and leaders
to execute on our digital strategy and ensure the
sustainability of our business.
We are partnering with our customers to address
their complex business challenges in sustainable
ways. The learning we gain from these partnerships
inspires us to create new products and services that
deliver to our customers both a seamless experience
and better business outcomes. This spirit of shared
value creation extends to our suppliers, as well. We
are improving supply chain quality and performance
while aligning our supplier base around the highest
standards of corporate social responsibility.
Our social sustainability vision extends to
involvement in the communities in which Ingersoll
Rand associates live and work. Across the globe,
Ingersoll Rand associates support our local
communities on a personal level. We achieved a
30 percent increase in the number of our people
who volunteered to make a difference in their local
communities in 2016.
We assist our teammates in contributing both
time and financial support to local community
organizations. This assistance targets four social
and environmental global issues: energy efficiency;
science, technology, engineering and math; nutrition
and food waste reduction; and housing and shelter.
Guided by the Ingersoll Rand Global Citizenship
Council, we donated more than $5.4 million in
philanthropic gifts to community partners in
2016. Over that same timeframe, our employees
volunteered more than 19,000 hours of their time.
Social sustainability in the form of charitable
donations occurs through the Ingersoll Rand
Foundation, the philanthropic arm of the company
that advances the quality of life through charitable
partnerships to help build comfortable, sustainable,
efficient and educated communities. This includes
our company matching of employee giving
to education institutions and the United Way
campaigns that occur in our locations, as well as
our global disaster relief efforts and education
scholarship programs.
Nine High Schools Awarded Real Tools for Schools Grants
Students at nine high schools began
reaping the benefits of our groundbreaking
Real Tools for Schools grants supporting
their automotive technology programs.
This brings the total to 21 schools now
benefiting from the program, with a target
of 50 schools in 2017. “Real Tools for
Schools has a three-fold purpose,” said
Power Tools President Donny Simmons.
“We want to give back to the community,
support education, and build our brand
and relationships with future customers.”
318349_NAR.indd 10 4/13/17 1:26 AM

WINNING TOGETHER | 11
Ingersoll Rand continued to win global recognition
for its environmental, social and governance (ESG)
performance, as well as for transparency and responsible
business practices, workforce diversity, engagement and
talent development, and commitment to environmental
sustainability.
And the Awards Go To…
FORTUNE Magazine’s 2016 World’s Most
Admired Companies in the Industrial
Machinery category; ranked No. 10 in the
Community Responsibility category.
2016 India Dream Company, sponsored by
Times Ascent and the World HRD Congress.
China Best Brand, acknowledged for excellent
performance across six key categories
including innovation and industry leadership.
Human Rights Campaign Foundation
Corporate Equality Index – perfect score of
100 percent in workplace equality.
Corporate Responsibility Magazine 2016
100 Best Corporate Citizens.
FTSE Group’s FTSE4Good Index Series –
recognized for strong ESG practices; suitability
for sustainable investment portfolios.
Material Handling Plant Named Green Business of the Year
Recognizing work led by the Green Team at our Material Handling plant in Kent, Washington, the mayor
and city council named the facility Green Business of the Year. “Along with coming up with great ideas
for cutting landfill waste at the plant, our Green Team stands out for organizing successful community
activities that promote recycling locally,” said John Young, environmental, health and safety leader at Kent.
Dow Jones Sustainability World and North
America Indices (DJSI), sixth consecutive
year – validates performance and showcases
sustainability commitment.
318349_NAR.indd 11 4/13/17 1:26 AM

12 | MAKING A DIFFERENCE12 | MAKING A DIFFERENCE
Making a Difference
From the efficiency of our buildings to our progress in managing energy, water and waste, we continue to find ways to reduce the company’s impact on the environment and embed sustainability across our businesses.
Our commitment to sustainability extends to the
environmental impacts of our people, operations
and products. Nearly half of all global energy
consumption takes place in commercial, industrial
and residential buildings, with HVAC representing
the greatest opportunity for improvement. Industrial
processes consume significant amounts of energy
around the world. One-third of global agricultural
production is wasted every year, with only
10 percent of the world’s perishable food receiving
refrigeration along the value chain.
As a global enterprise leading the way to a more
sustainable future, Ingersoll Rand is focused
on heating, cooling and automating homes and
buildings; enhancing industrial productivity;
keeping transported food and perishables safe and
fresh; and delivering efficient and reliable personal
transportation solutions. We approach sustainability
by integrating it into the anatomy of how we operate
and help our customers succeed, and by working
transparently with industry peers, governments
and non-governmental organizations (NGOs) as a
catalyst for change.
From the efficiency of our buildings to our progress
in managing energy, water and waste, we continue
to find ways to reduce the company’s impact on the
environment and embed sustainability across our
businesses. Over the past three years, the company’s
operations have decreased greenhouse gas emissions
by 122,618 metric tons of CO2e, or 23.8 percent,
while total energy use has declined 10.1 percent.
We continue our journey to zero waste to landfill
for our non-hazardous waste materials. For 2016,
we reduced our non-hazardous waste to landfill
by 8.9 percent compared to 2015. We continue
to explore and implement returnable packaging
opportunities, source reduction projects and waste
segregation that aids in recycling opportunities. Our
2016 recycling increased by 7.7 percent compared to
2015. For every pound of non-hazardous waste sent
to the landfill, we recycled 4.5 pounds.
Trane Introduces Sintesis™ eXcellent Chillers
Trane launched its Sintesis eXcellent air-cooled
chiller in Europe – an addition to the Ingersoll
Rand EcoWise™ portfolio of products designed
to lower their environmental impact with
next-generation, low-global warming potential
(GWP) refrigerants and high-efficiency
operation. “Sintesis eXcellent combines super
high efficiencies, with lower GWP through
the use of next-generation refrigerant. It’s
an exciting new solution that exceeds current
F-Gas legislation requirements and helps
customers reduce their CO2 emissions,” said
Jose La Loggia, vice president and general
manager, Trane Europe.
318349_NAR.indd 12 4/13/17 1:26 AM

MAKING A DIFFERENCE | 13
In 2010, we established the Ingersoll Rand Center
for Energy Efficiency & Sustainability (CEES),
focusing a team of company experts on integrating
sustainability into the business. The CEES team
facilitates the company’s sustainability-related
work with government and NGOs, universities,
and technology and industry leaders. These
collaborations enable us to implement sustainability
best practices in areas such as product innovation,
employee engagement, operations, supply chain
and advocacy.
Accountability for these best practices is in the hands
of our Internal Sustainability Strategy Council, a
group of company executives who provide guidance
on key business, social and environmental issues. In
addition, we draw upon the expertise of an External
Sustainability Advisory Council comprised of global
thought leaders in infrastructure, energy policy and
technology.
The insights we derive from this sustainability
governance structure stimulate operational and
product innovation, while also serving as the
foundation for our public sustainability commitments.
Pledging publicly to achieve specific corporate
targets – related to climate change or technology
innovation, for instance – sets a high bar internally
and motivates our people to bring their best
ideas forward.
Our recent work on low-global warming potential
(GWP) refrigerant technology development
demonstrates how Ingersoll Rand translates its public
stance into practical innovation. For example, instead
of waiting for the world’s regulatory authorities to
mandate the use of next-generation refrigerants, for
the past several years we have been working with
our suppliers to develop global solutions that are
energy efficient and leverage current designs to help
facilitate a smooth transition.
In 2014, we made a global Climate Commitment to
reduce the greenhouse gas refrigerant footprint of
Ingersoll Rand products by 50 percent by 2020 and
to incorporate refrigerant alternatives with lower
GWP across the company’s product portfolio by
2030. We are on track to achieve these goals and
have avoided approximately 6.7 million metric tons
of CO2e globally, equal to the CO
2 emissions from
the energy used in 700,000 homes for one year.
By 2030, we aim to reduce our products’ carbon
footprint by 50 million metric tons, which is equal
to the CO2 emissions from approximately 5.6 billion
gallons of gasoline consumed.
In support of our Climate Commitment, in 2015 we
launched the Ingersoll Rand EcoWise portfolio of
products, specifically branded for next-generation,
low-GWP refrigerants without sacrificing energy
efficiency and safety. We build many of our products
The Ingersoll Rand product portfolio is becoming smarter and more connected than ever before.
Thermo King Asia Pacific Launches All-electric Refrigeration Units for Trucks and Buses
Thermo King launched two series of all-
electric units – the EV and E series for all-
electric refrigerated trucks and air-conditioned
buses, respectively. Both are designed to meet
the growing demand in China for energy-
saving, environmentally friendly transport
refrigeration solutions, while also supporting
the development of China’s new energy
industry. “These innovative all-electric units
strengthen our leadership in China’s cold
chain logistics industry while helping to fulfill
the Ingersoll Rand Climate Commitment,” said
Xiang Yang, vice president of Thermo King
Asia Pacific and India.
318349_NAR.indd 13 4/13/17 1:26 AM

14 | MAKING A DIFFERENCE14 14 | | MAKINGG AA D DIIFFFFEREEREENCENCE
The U.S. Environmental Protection Agency (EPA)
honored Ingersoll Rand with its Organizational
Leadership Award. The EPA recognized Ingersoll
Rand for establishing a Climate Commitment that
encompasses our entire product portfolio and
includes refrigerant and energy efficiency initiatives
aimed at reducing the greenhouse gas footprint of
our operations and products.
“This is the ‘Oscar’ of this award series and the
only one to recognize a company’s significant
contributions at a national level,” said W. Scott
Tew, executive director of the CEES. “Our peers and
customers were very congratulatory and pleased
to see an industrial firm making such great strides
toward sustainability.”
Two Trane China energy management contracting
(EMC) projects were recognized for energy savings and
innovation by the China National Development and Reform
Commission, U.S. Department of Energy and U.S. State
Department. Trane China helped cut energy consumption
at the Yantai High-tech Industrial Development Zone
Venture Building and the Guangdong Hotel by 20 percent
and 44 percent, respectively, leading to their selection
as U.S.-China EMC Demonstration Projects. “This is
high recognition for our continuous efforts to develop
environmentally friendly products and solutions for new and
retrofit projects,” said Eric Zhang, general manager of parts,
controls and contracting, Trane China.
U.S. EPA Recognizes Ingersoll Rand for Climate Change Leadership
Trane China Wins Energy Management Contracting Awards
Trane India Strengthens Partnership with Delhi Metro
Trane India wrapped up phase 3 in 2016 in a 14-year
partnership with Delhi Metro Rail Corporation (DMRC).
Trane provided 141 water- and air-cooled screw and
centrifugal chillers to 26 underground metro stations
across Delhi. The partnership also includes a five-year
maintenance contract and chiller plant manager. The
newly installed chillers helped DMRC earn the “Metro
Green Building Council for LEED Platinum Certification.”
318349_NAR.indd 14 4/13/17 1:26 AM

MAKING A DIFFERENCE | 15
to operate for 15 to 20 years. Consequently,
designing them to far exceed current regulations
adds value for our customers today, while helping
them prepare for the more stringent regulatory
environments to come.
We added four new products to the Ingersoll Rand
EcoWise portfolio in 2016: Thermo King truck and
trailer refrigerant units; Trane Sintesis™ eXcellent,
an air-cooled chiller; Trane CenTraVac™ centrifugal
chillers in North America, Europe, the Middle East
and Asia; and the Trane Series R™ RTWD, a water-
cooled chiller.
In addition to energy and resource efficiency,
sustainability is a function of connectivity. In parallel
with growth in the internet of things, more devices
and sensors are being designed into buildings and
industrial facilities and their HVAC and production
subsystems. The Ingersoll Rand product portfolio
is becoming smarter and more connected than
ever before, enabling our customers to make
more informed decisions and improve productivity,
efficiency and occupant comfort.
Thermo King Launches Product Innovation in Central and South America
Thermo King launched an innovative trailer
refrigeration unit in Central and South
America for third-party logistics and fleet
owners who need precise temperature
control and demand fuel efficiency. “The
SLXe400 is the perfect solution for Latin
American customers looking for energy
efficiency, sustainability and lower upfront
operating costs,” said Dario Ferreira, Brazil
territory leader for Thermo King. “Our
feedback from customers in Brazil has been
very positive, and we are also seeing this
product gain popularity with increasing
numbers of food-processing customers
throughout the region.”
Fluid Management Finds Success in Solar
In 2016 the Fluid Management business
captured significant growth in the
burgeoning renewable energy industry.
“Solar panel manufacturers are using ARO®
piston pumps for precision applications of
adhesives during panel construction,” said
Oakley Roberts, vice president, product
management and global sales, Fluid
Management. “We’re proud to offer
solutions to customers and industries that
strive to reduce environmental impact and
advance green technologies.”
318349_NAR.indd 15 4/13/17 1:26 AM

16 | LEADERSHIP
Leadership
DIRECTORSANN C. BERZINFormer Chairman and Chief Executive Officer, Financial Guaranty Insurance Company
JOHN BRUTONFormer EU Commission Head of Delegation to the United States and Former Prime Minister of Ireland
JARED L. COHON, Ph.D.President Emeritus of Carnegie Mellon University
GARY D. FORSEERetired Chairman and Chief Executive Officer, Sprint Nextel Corporation and Former President of the University of Missouri System
CONSTANCE J. HORNERFormer Deputy Secretary, U.S. Department of Health and Human Services
LINDA P. HUDSONFounder, Chairman and CEO of The Cardea Group and Former President and CEO of BAE Systems, Inc.
MICHAEL W. LAMACHChairman and Chief Executive Officer of Ingersoll Rand
MYLES P. LEEFormer Chief Executive Officer and Executive Director of CRH plc
JOHN P. SURMAFormer Chairman and Chief Executive Officer, United States Steel
RICHARD J. SWIFTRetired Chairman, President and Chief Executive Officer, Foster Wheeler Ltd. and Former Chairman of Financial Accounting Standards Advisory Council
TONY L. WHITERetired Chairman, President and Chief Executive Officer, Applied Biosystems Inc.
ENTERPRISE LEADERSHIP TEAMMICHAEL W. LAMACHChairman and Chief Executive Officer
MARCIA J. AVEDON, Ph.D.Senior Vice President, Human Resources, Communications and Corporate Affairs
PAUL A. CAMUTISenior Vice President, Innovation and Chief Technology Officer
SUSAN K. CARTERSenior Vice President and Chief Financial Officer
ALLEN W. GE President, HVAC and Transport Solutions, Asia Pacific and India
MARIA C. GREENSenior Vice President and General Counsel
M. STEPHEN HAGOODSenior Vice President and Chief Information Officer
GARY S. MICHELSenior Vice President and President, Residential HVAC & Supply
RAYMOND D. PITTARDPresident, Transport Solutions, North America and EMEA
DAVID S. REGNERYPresident, Commercial HVAC, North America and EMEA
KEITH A. SULTANASenior Vice President, Global Operations and Integrated Supply Chain
DIDIER P.M. TEIRLINCK, Ph.D.Executive Vice President, Climate Segment
TODD D. WYMANSenior Vice President and President, Compression Technologies and Services
ROBERT G. ZAFARIExecutive Vice President, Industrial Segment
OTHER SENIOR LEADERSMARIA F. BLASE President, HVAC and Transport Solutions, Latin America
MARC J. DUFOURPresident, Club Car
FRANCESCO C. INCALZAVice President and Treasurer
CHRISTOPHER J. KUEHNVice President and Chief Accounting Officer
LAWRENCE R. KURLANDVice President, Tax
ZACHARY A. NAGLEVice President, Investor Relations
DONNY E. SIMMONS President, Fluid Management, Material Handling and Power Tools
EVAN M. TURTZSecretary
From Left to Right: Allen W. Ge, President, HVAC and Transport Solutions, Asia Pacific and India; Robert G. Zafari, Executive Vice President, Industrial Segment; M. Stephen Hagood, Senior Vice President and Chief Information Officer; Susan K. Carter, Senior Vice President and Chief Financial Officer; Paul A. Camuti, Senior Vice President, Innovation and Chief Technology Officer; Michael W. Lamach, Chairman and Chief Executive Officer; Didier P.
M. Teirlinck, Executive Vice President, Climate Segment; Marcia J. Avedon, Senior Vice President, Human Resources, Communications and Corporate Affairs; Raymond D. Pittard, President, Transport Solutions, North America and EMEA; Todd D. Wyman, Senior Vice President and President, Compression Technologies and Services; Keith A. Sultana, Senior Vice President, Global Operations and Integrated Supply Chain; Maria C. Green, Senior Vice President and General Counsel; David S. Regnery, President, Commercial HVAC, North America and EMEA; Gary S. Michel, Senior Vice President and President, Residential HVAC & Supply
318349_NAR.indd 16 4/13/17 1:26 AM

Reconciliation of GAAP to non-GAAP
*Non-GAAP measures definitions
Free cash flow in 2016 and 2015 is defined as net cash provided by operating activities, less capital expenditures, plus cash payments for restructuring. In 2015 this definition also excluded the cash impact of the IRS agreement which occurred in the third and fourth quarters.
In 2016, adjusted net earnings is defined as earnings from continuing operations attributable to Ingersoll-Rand plc plus restructuring costs and a legal settlement less the gain recognized on the sale of the Hussmann equity interest, net of tax impacts. In 2015, adjusted net earnings is defined as earnings from continuing operations attributable to Ingersoll-Rand plc plus restructuring expenses, acquisition-related inventory step-up costs, Venezuela re-measurement of monetary assets and the IRS agreement, net of tax impacts.
Adjusted operating margin is defined as the ratio of adjusted operating income divided by net revenues.
In 2016 adjusted earnings per share (EPS) is defined as GAAP EPS plus restructuring expenses and a legal settlement, less the gain recognized on the sale of the Hussmann equity interest in Q2 2016, net of tax impacts. In 2015 Adjusted EPS was defined as GAAP EPS plus restructuring expenses, acquisition-related inventory step-up costs, Venezuela re-measurement of monetary assets and the IRS agreement, net of tax impacts.
Adjusted operating income plus depreciation & amortization is defined as adjusted operating income plus depreciation and amortization expense.
Reconciliation of GAAP to non-GAAP
Adjusted Operating Income plus Depreciation and Amortization
(In millions)UNAUDITED
For the year ended December 31, 2016 For the year ended December 31, 2015
As Reported Margin As Reported MarginTotal Company Net revenues $ 13,508.9 $ 13,300.7 Operating Income $ 1,573.1 11.6% $ 1,458.0 11.0%Restructuring/Other 35.5 0.3% 59.0 0.4%Adjusted Operating Income 1,608.6 11.9% 1,517.0 11.4%Depreciation and Amortization 352.2 2.6% 364.1 2.7%Adjusted OI plus D&A $ 1,960.8 14.5% $ 1,881.1 14.1%
Free Cash Flow
($ in millions)UNAUDITED
Year ended Year endedDecember 31, 2016 December 31, 2015
Cash flow provided by operating activities $ 1,500.2 $ 851.1Capital expenditures (182.7) (249.6)Cash payment for IRS Agreement/Restructuring 27.5 383.7Free cash flow $ 1,345.0 $ 985.2 Adjusted earnings from continuing operations attributable to Ingersoll-Rand plc $ 1,080.4 $ 998.2Discontinued operations, net of tax 32.9 (24.3)Adjusted net earnings $ 1,113.3 $ 973.9Free cash flow as a percent of adjusted net earnings 121% 101%

Reconciliation of GAAP to non-GAAP UNAUDITED
For the year ended December 31, 2016 For the year ended December 31, 2015
(In millions, except per share amounts)
As Reported Adjustments
As Adjusted
As Reported Adjustments
As Adjusted
Net revenues $13,508.9 $- $13,508.9 $13,300.7 $- $13,300.7 Operating income 1,573.1 35.5 (a) 1,608.6 1,458.0 59.0 (a,b) 1,517.0Operating margin 11.6% 11.9% 11.0% 11.4% Earnings from continuing operations before income taxes 1,741.3 (345.9) (a,c,e) 1,395.4 1,247.9 101.6 (a,b,d) 1,349.5Provision for income taxes (281.5) (17.0) (f) (298.5) (540.8) 207.7 (f,g) (333.1)Tax rate 16.2% 21.4% 43.3% 24.7%Earnings from continuing operations attributable to Ingersoll-Rand plc $1,443.3 $(362.9) (h) $1,080.4 $688.9 $309.3 (h) $998.2 Diluted earnings per common shareContinuing operations $5.52 $(1.39) $4.13 $2.57 $1.16 $3.73 Weighted-average number of common shares outstanding
Diluted 261.7 - 261.7 267.8 - 267.8
Detail of Adjustments:(a) Restructuring costs $35.5 $34.3(b) Acquisition Inventory step up - 24.7(c) Hussmann Gain (397.8) -(d) Venezuela re-measurement of monetary
assets - 42.6(e) Legal Settlement 16.4 -(f) Tax impact of adjustments a, b, c, d and e (17.0) (18.9)(g) IRS agreement - 226.6(h) Impact of adjustments on earnings from
continuing operations attributable to Ingersoll-Rand plc $(362.9) $309.3
The Company reports its financial results in accordance with generally accepted accounting principles in the United States (GAAP). This supplemental schedule provides non-GAAP financial information and a quantitative reconciliation of the difference between the non-GAAP financial measures and the financial measures calculated and reported in accordance with GAAP.
The non-GAAP financial measures should be considered supplemental to, not a substitute for or superior to, financial measures calculated in accordance with GAAP. They have limitations in that they do not reflect all of the costs associated with the operations of our businesses as determined in accordance with GAAP. In addition, these measures may not be comparable to non-GAAP financial measures reported by other companies.

2017 Notice and Proxy Statement


Ingersoll Rand 2017 Proxy Statement 01
Proxy Statement
Ingersoll-Rand plcRegistered in Ireland No. 469272
U.S. Mailing Address:800-E Beaty StreetDavidson, NC 28036(704) 655-4000
Registered Office:170/175 Lakeview Dr.Airside Business ParkSwords, Co. DublinIreland
NOTICE OF 2017 ANNUAL GENERAL MEETING OF SHAREHOLDERS
DATE AND TIME Thursday, June 8, 2017, at 2:30 p.m., local time
LOCATION The K Club Straffan County Kildare Ireland
PROPOSALS TO BE VOTED1. To re-elect 10 directors for a period of 1 year.2. To give advisory approval of the compensation of the
Company’s Named Executive Officers.3. To consider an advisory vote on whether an advisory vote on
executive compensation should be held every one, two or three years.
4. To approve the appointment of PricewaterhouseCoopers LLP as independent auditors of the Company and authorize the Audit Committee of the Board of Directors to set the auditors’ remuneration.
5. To renew the existing authority of the directors of the Company (the “Directors”) to issue shares.
6. To renew the Directors’ existing authority to issue shares for cash without first offering shares to existing shareholders. (Special Resolution)
7. To determine the price range at which the Company can re-allot shares that it holds as treasury shares. (Special Resolution)
8. To conduct such other business properly brought before the meeting.
RECORD DATE Only shareholders of record as of the close of business on April 11, 2017, are entitled to receive notice of and to vote at the Annual General Meeting.
By Order of the Board of Directors,
EVAN M. TURTZ Secretary
HOW TO VOTE Whether or not you plan to attend the meeting, please provide your proxy by either using the Internet or telephone as further explained in the accompanying proxy statement or filling in, signing, dating, and promptly mailing a proxy card.
BY TELEPHONE In the U.S. or Canada, you can vote your shares by submitting your proxy toll-free by calling 1-800-690-6903.
BY INTERNET You can vote your shares online at www.proxyvote.com.
BY MAIL You can vote by mail by marking, dating, and signing your proxy card or voting instruction form and returning it in the postage-paid envelope.
ATTENDING THE MEETING Directions to the meeting can be found on page A-1 of the attached Proxy Statement.
If you are a shareholder who is entitled to attend and vote, then you are entitled to appoint a proxy or proxies to attend and vote on your behalf. A proxy is not required to be a shareholder in the Company. If you wish to appoint as proxy any person other than the individuals specified on the proxy card, please contact the Company Secretary at our registered office.
Important Notice regarding the availability of proxy materials for the Annual General Meeting of Shareholders to be held on June 8, 2017.
The Annual Report and Proxy Statement are available at www.proxyvote.com.
The Notice of Internet Availability of Proxy Materials or this Notice of 2017 Annual General Meeting of Shareholders, the Proxy Statement and the Annual Report are first being mailed to shareholders on or about April 24, 2017.

02
Prox
y St
atem
ent
TABLE OF CONTENTS
PROXY STATEMENT HIGHLIGHTS 4
OVERVIEW OF PROPOSALS TO BE VOTED 5
PROPOSALS REQUIRING YOUR VOTE 9
Item 1. Election of Directors 9
Item 2. Advisory Approval of the Compensation of Our Named Executive Officers 13
Item 3. Advisory Vote on Frequency of Advisory Vote on Executive Compensation 13
Item 4. Approval of Appointment of Independent Auditors 14
Audit Committee Report 14
Fees of the Independent Auditors 15
Item 5. Renewal of the Directors’ existing authority to issue shares 16
Item 6. Renewal of the Directors’ existing authority to issue shares for cash without first offering shares to existing shareholders 17
Item 7. Determine the price at which the Company can re-allot shares held as treasury shares 18
CORPORATE GOVERNANCE 19
Corporate Governance Guidelines 19
Role of the Board of Directors 19
Board Responsibilities 19
Board Leadership Structure 19
Board Risk Oversight 20
Director Compensation and Share Ownership 20
Board Committees 20
Board Diversity 21
Board Advisors 21
Executive Sessions 21
Board and Board Committee Performance Evaluation 21
Director Orientation and Education 21
Director Nomination Process 21
Director Retirement 21
Director Independence 21
Communications with Directors 22
Code of Conduct 22
Anti-Hedging Policy and Other Restrictions 22
Investor Outreach 22
Committees of the Board 22
Board, Committee and Annual Meeting Attendance 25
Compensation Committee Interlocks and Insider Participation 25

Ingersoll Rand 2017 Proxy Statement 03
Proxy Statement
COMPENSATION OF DIRECTORS 26
COMPENSATION DISCUSSION AND ANALYSIS 29
COMPENSATION COMMITTEE REPORT 43
SUMMARY OF REALIZED COMPENSATION 44
EXECUTIVE COMPENSATION 45
Summary Compensation Table 45
2016 Grants of Plan-Based Awards 48
Outstanding Equity Awards at December 31, 2016 49
2016 Option Exercises and Stock Vested 51
2016 Pension Benefits 51
2016 Nonqualified Deferred Compensation 53
Post-Employment Benefits 54
2016 Post-Employment Benefits Table 57
INFORMATION CONCERNING VOTING AND SOLICITATION 60
Why Did I Receive This Proxy Statement? 60
Why Are There Two Sets Of Financial Statements Covering The Same Fiscal Period? 60
How Do I Attend The Annual General Meeting? 60
Who May Vote? 60
How Do I Vote? 60
How May Employees Vote Under Our Employee Plans? 61
May I Revoke My Proxy? 61
How Will My Proxy Get Voted? 61
What Constitutes A Quorum? 62
What Vote Is Required To Approve Each Proposal? 62
Who Pays The Expenses Of This Proxy Statement? 62
How Will Voting On Any Other Matter Be Conducted? 62
SECURITY OWNERSHIP OF CERTAIN BENEFICIAL OWNERS AND MANAGEMENT 63
EQUITY COMPENSATION PLAN INFORMATION 64
CERTAIN RELATIONSHIPS AND RELATED PERSON TRANSACTIONS 64
SECTION 16(a) BENEFICIAL OWNERSHIP REPORTING COMPLIANCE 65
SHAREHOLDER PROPOSALS AND NOMINATIONS 65
HOUSEHOLDING 66
APPENDIX A – DIRECTIONS TO THE ANNUAL GENERAL MEETING A-1

04
Prox
y St
atem
ent
PROXY STATEMENT HIGHLIGHTS
This summary highlights information contained elsewhere in this Proxy Statement. For more complete information about these topics, please review Ingersoll-Rand plc’s Annual Report on Form 10-K and the entire Proxy Statement.
MEETING INFORMATIONDate and Time: June 8, 2017 at 2:30 p.m., local time
Place: The K ClubStraffanCounty KildareIreland
Record Date: April 11, 2017
Voting: Shareholders as of the record date are entitled to vote. Each ordinary share is entitled to one vote for each director nominee and each of the other proposals.
Attendance: All shareholders may attend the meeting.
CORPORATE GOVERNANCE HIGHLIGHTS• Substantial majority of independent directors (10 of 11)
current directors
• Annual election of directors
• Majority vote for directors
• Independent Lead Director
• Board oversight of risk management
• Succession planning at all levels, including for Board and CEO
• Annual Board and committee self-assessments
• Executive sessions of non-management directors
• Continuing director education
• Executive and director stock ownership guidelines
• Board oversight of sustainability program
2018 ANNUAL MEETINGDeadline for shareholder proposals for inclusion in the proxy statement: December 25, 2017
Deadline for business proposals and nominations for director: March 10, 2018

Ingersoll Rand 2017 Proxy Statement 05
Proxy Statement
OVERVIEW OF PROPOSALS TO BE VOTED
Election of Directors
The Board of Directors recommends a vote FOR the directors nominated for election
See page 9 for further information
Director Nominees
Ingersoll-Rand Committees
Name/ Occupation Age
Director since Independent
Other current public Boards A C CG F T E
Ann C. Berzin Former Chairman and CEO of Financial Guaranty Insurance Company
65 2001 YES - Exelon Corporation- Baltimore Gas & Electric
Company
M C M
John Bruton Former Prime Minister of the Republic of Ireland and Former European Union Commission Head of Delegation to the United States
69 2010 YES M M M
Jared L. Cohon President Emeritus of Carnegie Mellon University, University Professor of Civil and Environmental Engineering and of Engineering and Public Policy, and Director of the Scott Institute for Energy Innovation
69 2008 YES - Unisys M M C
Gary D. Forsee Former President of University of Missouri System and Former Chairman of the Board and Chief Executive Officer of Sprint Nextel Corporation
67 2007 YES - Great Plains Energy Inc.- DST Systems Inc.
M C M M
Linda P. Hudson Founder, Chairman and CEO of The Cardea Group and Former President and CEO of BAE Systems, Inc.
66 2015 YES - The Southern Company- Bank of America
M M M
Michael W. Lamach Chairman and CEO of Ingersoll-Rand plc
53 2010 NO - PPG Industries, Inc. C
Myles P. Lee Former Director and CEO of CRH plc
63 2015 YES - Babcock International Group plc- UDG Healthcare plc
M M
John P. Surma Former Chairman and CEO of United States Steel Corporation
62 2013 YES - Marathon Petroleum Corporation- MPLX LP (a publicly traded
subsidiary of Marathon Petroleum Corporation)
- Concho Resources Inc.
C M M
Richard J. Swift Lead Director Former Chairman of Financial Accounting StandardsAdvisory Council and Former Chairman, President and CEO of Foster Wheeler Ltd.
72 1995 YES - CVS Health Corporation- Hubbell Incorporated- Kaman Corporation- Public Service Enterprise Group
M M M M
Tony L. White Former Chairman, President and CEO of Applied Biosystems Inc.
70 1997 YES - C.R. Bard, Inc.- CVS Health Corporation
C M M M
A: Audit Committee C: Compensation Committee
CG: Corporate Governance & Nominating CommitteeF: Finance Committee
T: Technology and Innovation CommitteeE: Executive Committee
C: Chair M: Member
Item 1.

06
OVERVIEW OF PROPOSALS TO BE VOTEDPr
oxy
Stat
emen
t
Advisory Approval of the Compensation of Our Named Executive Officers
The Board of Directors recommends a vote FOR this item
We are asking for your advisory approval of the compensation of our named executive officers (“NEOs”). While our Board of Directors intends to carefully consider the shareholder vote resulting from the proposal, the final vote will not be binding on us and is advisory in nature. Before considering this proposal, please read our Compensation Discussion and Analysis, which explains our executive compensation programs and the Compensation Committee’s compensation decisions.
See page 13 and 29 for further information
EXECUTIVE COMPENSATIONCONSIDERATION OF 2016 ADVISORY VOTE ON EXECUTIVE COMPENSATIONThe Compensation Committee regularly reviews the philosophy, objectives and elements of our executive compensation programs in relation to our short and long-term business objectives. In undertaking this review, the Compensation Committee considers the views of shareholders as reflected in their annual advisory vote on our executive compensation proposal. Shareholders voted 94.3% in favor of the company’s Advisory Approval of the Compensation of Our Named Executive Officers at our 2016 annual general meeting. Based on the Compensation Committee’s review and the support our executive compensation programs received from shareholders, the Compensation Committee determined it would be appropriate to maintain the core elements of our executive compensation programs.
EXECUTIVE COMPENSATION PRINCIPLESOur executive compensation programs are based on the following principles:
(i) business strategy alignment(ii) pay for performance
(iii) mix of short and long-term incentives(iv) internal parity
(v) shareholder alignment(vi) market competitiveness
Consistent with these principles, the Compensation Committee has adopted executive compensation programs with a strong link between pay and achievement of short and long-term Company goals.
EXECUTIVE COMPENSATION ELEMENTSThe primary elements of the executive compensation programs are:
Total Direct Compensation
Element 1 Objective of Element
Base Salary Fixed cash compensation.
Annual Incentive Matrix (“AIM”)
Variable cash incentive compensation. Any award earned is based on performance measured against pre-defined annual revenue, Operating Income, cash flow and Operating Income Margin percent objectives, as well as individual performance measured against pre-defined objectives.
Long-Term Incentives (“LTI”)
Variable long-term incentive compensation. Performance is aligned with the Company’s stock price and is awarded in the form of stock options, restricted stock units (“RSUs”) and performance share units (“PSUs”). PSUs are only payable if the Company’s earnings per share (“EPS”) growth and total shareholder return (“TSR”) relative to companies in the S&P 500 Industrials Index exceed threshold performance.
1 See Section V of the Compensation Discussion and Analysis entitled “Compensation Program Descriptions and Compensation Decisions,” for additional discussion of these elements of compensation.
Item 2.

Ingersoll Rand 2017 Proxy Statement 07
OVERVIEW OF PROPOSALS TO BE VOTED
Proxy Statement
EXECUTIVE COMPENSATION MIXAs illustrated in the charts below, the Compensation Committee places significant emphasis on variable compensation (AIM and LTI) so that a substantial percentage of each NEO’s target total direct compensation is contingent on the successful achievement of the Company’s short-term and long-term performance goals.
Chairman and CEO 2016 Compensation Mix (Target Total Direct Compensation)
Other NEOs 2016 Compensation Mix (Target Total Direct Compensation)
Target AIM 16%
Target Long-TermIncentive 74% Base Salary 10%
Pay at Risk 90%
Target AIM 21%
Base Salary 23%
Pay at Risk 77%
Target Long-TermIncentive 56%
2016 EXECUTIVE COMPENSATIONThe summary below shows the 2016 compensation for our CEO and other NEOs, as required to be reported in the Summary Compensation Table pursuant to U.S. Securities and Exchange Commission (“SEC”) rules. Please see the notes accompanying the Summary Compensation Table for further information.
Name and Principal Position Salary ($)
Bonus ($)
Stock Awards ($)
Option Awards ($)
Non-Equity Incentive Plan Compensation
($)
Change inPension
Value andNonqualified
DeferredCompensation
Earnings($)
All Other Compensation Total ($)
M.W. LamachChairman and Chief Executive Officer
1,300,000 – 7,445,074 2,280,485 2,500,000 2,355,506 491,249 16,372,314
S.K. CarterSenior Vice President and Chief Financial Officer
690,000 – 1,567,450 480,108 817,862 297,243 147,270 3,999,933
D. P. M. TeirlinckExecutive Vice President, Climate Segment
696,250 – 1,449,891 444,096 814,718 861,907 158,243 4,425,105
R.G. ZafariExecutive Vice President, Industrial Segment
570,000 – 1,018,843 312,073 358,244 425,348 109,879 2,794,387
M. J. AvedonSenior Vice President, Human Resources, Communications and Corporate Affairs
593,750 – 940,470 288,068 600,158 612,582 101,691 3,136,719
M. C. GreenSenior Vice President and General Counsel
525,000 500,000 979,656 300,066 494,248 – 80,820 2,879,790

08
OVERVIEW OF PROPOSALS TO BE VOTEDPr
oxy
Stat
emen
t
Advisory Vote on Frequency of Advisory Vote on Executive Compensation
The Board of Directors recommends a vote FOR an annual advisory vote on executive compensation
We are asking you to consider an advisory vote on whether an advisory vote on executive compensation should be held every one, two or three years
See page 13 for further information
Item 3.
Approval of Appointment of Independent Auditors
The Board of Directors recommends a vote FOR this item
We are asking you to approve the appointment of PricewaterhouseCoopers LLP (“PwC”) as our independent auditors for 2017 and to authorize the Audit Committee to set PwC’s remuneration.
See page 14 for further information
Item 4.
To renew the Directors’ existing authority to issue shares.
The Board of Directors recommends a vote FOR this item
We are asking you to renew our Directors’ authority to issue shares under Irish law. This authority is fundamental to our business and granting the Board this authority is a routine matter for public companies incorporated in Ireland.
See page 16 for further information
Item 5.
To renew the Directors’ existing authority to issue shares for cash without first offering shares to existing shareholders. (Special Resolution)
The Board of Directors recommends a vote FOR this item
We are asking you to renew the Directors’ authority to issue shares for cash without first offering shares to existing shareholders. This authority is fundamental to our business and granting the Board this authority is a routine matter for public companies incorporated in Ireland. As required under Irish law, this proposal requires the affirmative vote of at least 75% of the votes cast.
See page 17 for further information
Item 6.
To determine the price range at which the Company can re-allot shares that it holds as treasury shares. (Special Resolution)
The Board of Directors recommends a vote FOR this item
We are asking you to determine the price at which the Company can reissue shares held as treasury shares. From time to time the Company may acquire ordinary shares and hold them as treasury shares. The Company may re-allot such treasury shares, and under Irish law, our shareholders must authorize the price range at which we may re-allot any shares held in treasury. As required under Irish law, this proposal requires the affirmative vote of at least 75% of the votes cast.
See page 18 for further information
Item 7.

Ingersoll Rand 2017 Proxy Statement 09
Proxy Statement
PROPOSALS REQUIRING YOUR VOTE
In this Proxy Statement, “Ingersoll Rand,” the “Company,” “we,” “us” and “our” refer to Ingersoll-Rand plc, an Irish public limited company. This Proxy Statement and the enclosed proxy card, or the Notice of Internet Availability of Proxy Materials, are first being mailed to shareholders of record on April 11, 2017 (the “Record Date”) on or about April 24, 2017.
Election of Directors
The Board of Directors recommends a vote FOR the directors nominated for election listed below.
The Company uses a majority of votes cast standard for the election of directors. A majority of the votes cast means that the number of votes cast “for” a director nominee must exceed the number of votes cast “against” that director nominee. Each director of the Company is being nominated for election for a one-year term beginning at the end of the 2017 Annual General Meeting of Shareholders to be held on June 8, 2017 (the “Annual General Meeting”) and expiring at the end of the 2018 Annual General Meeting of Shareholders. Under our Articles of Association, if a director is not re-elected in a director election, the director shall retire at the close or adjournment of the Annual General Meeting. Ms. Constance J. Horner is retiring at the 2017 Annual General Meeting in accordance with our Corporate Governance Guidelines due to her attaining the age of 75 prior to such meeting.
Item 1.
Principal OccupationChairman and Chief Executive Officer of Financial Guaranty Insurance Company (insurer of municipal bonds and structured finance obligations), a subsidiary of General Electric Capital Corporation, from 1992 to 2001.
Current Public Directorships- Exelon Corporation- Baltimore Gas & Electric Company
Other Directorships Held in the Past Five Years- Kindred Healthcare, Inc.
ANN C. BERZINIndependent Director
Age 65Director since 2001Committees Audit, Finance (Chair), Executive
Nominee HighlightsMs. Berzin’s extensive experience in finance at a global diversified industrial firm and her expertise in complex investment and financial products and services bring critical insight to the Company’s financial affairs, including its borrowings, capitalization, and liquidity. In addition, Ms. Berzin’s relationships across the global financial community strengthen Ingersoll Rand’s access to capital markets. Her board memberships provide deep understanding of trends in the energy sector, which presents ongoing opportunities and challenges for Ingersoll Rand.
Principal Occupation- European Union Commission Head of Delegation to the United States from 2004 to 2009. - Prime Minister of the Republic of Ireland from 1994 to 1997.
Current Public Directorships- None
Other Directorships Held in the Past Five Years- Montpelier Re Holding Ltd.
JOHN BRUTONIndependent Director
Age 69Director since 2010Committees Compensation, Corporate Governance and Nominating, Technology and Innovation
Nominee HighlightsMr. Bruton’s long and successful career of public service on behalf of Ireland and Europe provides extraordinary insight into critical regional and global economic, social and political issues, all of which directly influence the successful execution of the Company’s strategic plan. In particular, Mr. Bruton’s leadership role in transforming Ireland into one of the world’s leading economies during his tenure, as well as in preparing the governing document for managing the Euro, lend substantial authority to Ingersoll Rand’s economic and financial oversight.

10
PROPOSALS REQUIRING YOUR VOTEPr
oxy
Stat
emen
t
Principal Occupation- President Emeritus at Carnegie Mellon University, President of Carnegie Mellon University from 1997-2013 and also
appointed University Professor of Civil and Environmental Engineering / Engineering and Public Policy, and Director of the Scott Institute for Energy Innovation.
Current Public Directorships- Unisys
Other Directorships Held in the Past Five Years- Lexmark, Inc.
Other Activities- Carnegie Corporation, Trustee- Heinz Endowments, Trustee
- Center for Responsible Shale Gas Development, Director and Chair- Health Effects Institute, Director
JARED L. COHONIndependent Director
Age 69Director since 2008Committees Compensation, Corporate Governance and Nominating, Technology and Innovation (Chair)
Nominee HighlightsDr. Cohon’s extensive career in academics, including 16 years as president of an institution known throughout the world for its leadership in the fields of computer science and engineering, offers the Company tremendous insight into the latest developments in areas critical to commercial innovation and manufacturing process improvement. A member of the National Academy of Engineering, Dr. Cohon is a recognized authority on environmental and water resources systems analysis and management. As such, Dr. Cohon also brings unique perspectives on sustainable business practices, both within our own operations and on behalf of our customers and communities. In 2008 and 2009, at the request of Congress, Dr. Cohon chaired the National Research Council Committee that produced the report, “Hidden Costs of Energy: Unpriced Consequences of Energy Production and Use.” In 2014, Dr. Cohon was appointed co-chair of the Congressionally-mandated Commission to review and evaluate the National Energy Laboratories. Finally, Dr. Cohon’s more than nine years of service as a member of Trane Inc.’s (formerly American Standard) board of directors provides critical insight into that part of the Company’s business.
Principal Occupation- President, University of Missouri System from 2008 to 2011.- Chairman of the Board (from 2006 to 2007) and Chief Executive Officer (from 2005 to 2007) of Sprint Nextel
Corporation (a telecommunications company).
Current Public Directorships- Great Plains Energy Inc.- DST Systems Inc.
Other Directorships Held in the Past Five Years- None
Other Activities- Trustee, MRI Global- Board, University of Missouri – Kansas City, Foundation- Board, University of Missouri – Kansas City, Bloch Business School Foundation
GARY D. FORSEEIndependent Director
Age 67Director since 2007Committees Compensation, Corporate Governance and Nominating (Chair), Executive, Technology and Innovation
Nominee HighlightsIn addition to his broad operational and financial expertise, Mr. Forsee’s experience as chairman and chief executive officer with the third largest U.S. firm in the global telecommunications industry offers a deep understanding of the challenges and opportunities within markets experiencing significant technology-driven change. His recent role as president of a major university system provides insight into the Company’s talent development initiatives, which remain a critical enabler of Ingersoll Rand’s long-term success. Mr. Forsee’s membership on the board of an energy services utility also benefits the Company as it seeks to achieve more energy-efficient operations and customer solutions.
Principal Occupation- Founder, Chairman, and Chief Executive Officer of The Cardea Group, a business management consulting firm- Former President and Chief Executive Officer of BAE Systems, Inc.
Current Directorships- The Southern Company- Bank of America
Other Directorships Held in the Past Five Years- BAE Systems Plc
Other Activities- Director, University of Florida Foundation, Inc. and the University of Florida Engineering Leadership Institute- Director, Discovery Place- Director, Wake Forest Charlotte Center
LINDA P. HUDSONIndependent Director
Age 66Director since 2015Committees Audit, Finance, Technology and Innovation
Nominee HighlightsMs. Hudson’s prior role as President and CEO of BAE Systems and her extensive experience in the defense and engineering sectors provides the Company with strong operational insight and understanding of matters crucial to the Company’s business. Prior to becoming CEO, Ms. Hudson was president of BAE Systems’ Land & Armaments operating group, the world’s largest military vehicle and equipment business, with operations around the world. In addition, Ms. Hudson has broad experience in strategic planning and risk management in complex business environments.

Ingersoll Rand 2017 Proxy Statement 11
PROPOSALS REQUIRING YOUR VOTE
Proxy Statement
Principal Occupation- Chairman of the Company since June 2010 - Chief Executive Officer (since February 2010) of the Company.- President and Chief Operating Officer of the Company from February 2009 to February 2010.- Senior Vice President and President, Trane Commercial Systems, of the Company from June 2008 to
September 2009.
Current Directorships- PPG Industries, Inc.
Other Directorships Held in the Past Five Years- Iron Mountain Incorporated
MICHAEL W. LAMACHChairman and CEO
Age 53Director since 2010Committees Executive
Nominee HighlightsMr. Lamach’s extensive career of successfully leading global businesses, including thirteen years with Ingersoll Rand, brings significant experience and expertise to the Company’s management and governance. His 32 years of business leadership encompass global industrial systems, controls, security and HVAC systems businesses, representing a broad and diverse range of products and services, markets, channels, applied technologies and operational profiles. In his current role of Chairman and Chief Executive Officer, he led the successful spin-off of the Company’s commercial and residential security business and has been instrumental in driving growth and operational excellence initiatives across the Company’s global operations.
Principal Occupation- Director (from 2003 to 2013) and Chief Executive Officer (from 2009 to 2013) of CRH plc
Current Public Directorships- Babcock International Group plc- UDG Healthcare plc
Other Directorships Held in the Past Five Years- CRH plc
Other Activities- Director, St. Vincent’s Healthcare Group
MYLES P. LEEIndependent Director
Age 63Director since 2015Committees Audit, Finance
Nominee HighlightsMr. Lee’s experience as the former head of the largest public or private company in Ireland provides strategic and practical judgment to critical elements of the Company’s growth and productivity strategies, expertise in Irish governance matters and significant insight into the building and construction sector. In addition, Mr. Lee’s previous service as Finance Director and General Manager of Finance of CRH plc and in a professional accountancy practice provides valuable financial expertise to the Company.
Principal Occupation- Former Chairman (from 2006-2013) and Chief Executive Officer (from 2004-2013) of United States Steel
Corporation (a steel manufacturing company).
Current Public Directorships- Marathon Petroleum Corporation- MPLX LP (a publicly traded subsidiary of
Marathon Petroleum Corporation)- Concho Resources Inc.
Other Directorships Held in the Past Five Years- The Bank of New York Mellon Corporation
Other Activities- Director and Chair, Federal Reserve Bank of Cleveland- Director, UPMC- Director and Chair, National Safety Council- Director and Former Chair, Allegheny County Parks Foundation
JOHN P. SURMAIndependent Director
Age 62Director since 2013Committees Audit (Chair), Finance, Executive
Nominee HighlightsMr. Surma’s experience as the former chairman and chief executive officer of a large industrial company provides significant and direct expertise across all aspects of Ingersoll Rand’s operational and financial affairs. In particular, Mr. Surma’s financial experience, having previously served as the chief financial officer of United States Steel Corporation and as a partner of the audit firm PricewaterhouseCoopers LLP, provides the Board with valuable insight into financial reporting and accounting oversight of a public company. Mr. Surma’s board memberships and other activities provide the Board an understanding of developments in the energy sector as the Company seeks to develop more energy-efficient operations and insight into national and international business and trade policy that could impact the Company.
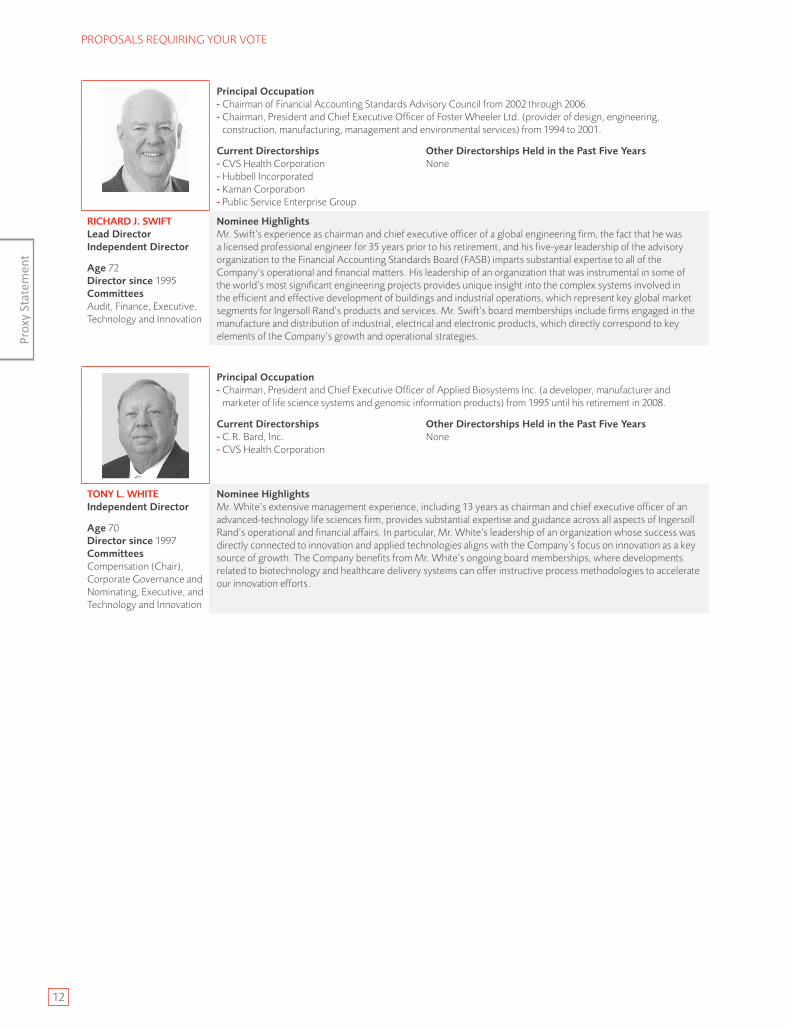
12
PROPOSALS REQUIRING YOUR VOTEPr
oxy
Stat
emen
t
Principal Occupation- Chairman of Financial Accounting Standards Advisory Council from 2002 through 2006.- Chairman, President and Chief Executive Officer of Foster Wheeler Ltd. (provider of design, engineering,
construction, manufacturing, management and environmental services) from 1994 to 2001.
Current Directorships- CVS Health Corporation- Hubbell Incorporated- Kaman Corporation- Public Service Enterprise Group
Other Directorships Held in the Past Five YearsNone
RICHARD J. SWIFTLead Director Independent Director
Age 72Director since 1995Committees Audit, Finance, Executive, Technology and Innovation
Nominee HighlightsMr. Swift’s experience as chairman and chief executive officer of a global engineering firm, the fact that he was a licensed professional engineer for 35 years prior to his retirement, and his five-year leadership of the advisory organization to the Financial Accounting Standards Board (FASB) imparts substantial expertise to all of the Company’s operational and financial matters. His leadership of an organization that was instrumental in some of the world’s most significant engineering projects provides unique insight into the complex systems involved in the efficient and effective development of buildings and industrial operations, which represent key global market segments for Ingersoll Rand’s products and services. Mr. Swift’s board memberships include firms engaged in the manufacture and distribution of industrial, electrical and electronic products, which directly correspond to key elements of the Company’s growth and operational strategies.
Principal Occupation- Chairman, President and Chief Executive Officer of Applied Biosystems Inc. (a developer, manufacturer and
marketer of life science systems and genomic information products) from 1995 until his retirement in 2008.
Current Directorships- C.R. Bard, Inc.- CVS Health Corporation
Other Directorships Held in the Past Five YearsNone
TONY L. WHITEIndependent Director
Age 70Director since 1997Committees Compensation (Chair), Corporate Governance and Nominating, Executive, and Technology and Innovation
Nominee HighlightsMr. White’s extensive management experience, including 13 years as chairman and chief executive officer of an advanced-technology life sciences firm, provides substantial expertise and guidance across all aspects of Ingersoll Rand’s operational and financial affairs. In particular, Mr. White’s leadership of an organization whose success was directly connected to innovation and applied technologies aligns with the Company’s focus on innovation as a key source of growth. The Company benefits from Mr. White’s ongoing board memberships, where developments related to biotechnology and healthcare delivery systems can offer instructive process methodologies to accelerate our innovation efforts.

Ingersoll Rand 2017 Proxy Statement 13
PROPOSALS REQUIRING YOUR VOTE
Proxy Statement
Advisory Approval of the Compensation of Our Named Executive Officers
�The Board of Directors recommends a vote FOR advisory approval of the compensation of our Named Executive Officers as disclosed in the Compensation Discussion and Analysis, the compensation tables, and the related disclosure contained in this proxy statement.
Item 2.
The Company is presenting the following proposal, commonly known as a “Say-on-Pay” proposal, which gives you as a shareholder the opportunity to endorse or not endorse our compensation program for Named Executive Officers by voting for or against the following resolution:
“RESOLVED, that the shareholders approve the compensation of the Company’s Named Executive Officers, as disclosed in the Compensation Discussion and Analysis, the compensation tables, and the related disclosure contained in the Company’s proxy statement.”
While our Board of Directors intends to carefully consider the shareholder vote resulting from the proposal, the final vote will not be binding on us and is advisory in nature.
In considering your vote, please be advised that our compensation program for Named Executive Officers is guided by our design principles, as described in the Compensation Discussion and Analysis section of this Proxy Statement:
(i) business strategy alignment (ii) pay for performance
(iii) mix of short and long-term incentives (iv) internal parity
(v) shareholder alignment (vi) market competitiveness
By following these design principles, we believe that our compensation program for Named Executive Officers is strongly aligned with the long-term interests of our shareholders.
Advisory Vote on Frequency of Advisory Vote on Executive Compensation
�The Board of Directors recommends a vote FOR an annual advisory vote on executive compensation
We are asking you to consider an advisory vote on whether an advisory vote on executive compensation should be held every one, two or three years.
Item 3.
The Company is presenting the following proposal, which gives you as a shareholder the opportunity to inform the Company as to how often you wish the Company to include a “Say-on-Pay” proposal, similar to Item 2 above, in our proxy statement. Under the following proposal, shareholders may vote to have the “Say-on-Pay” vote every year, every two years or every three years. This resolution is required pursuant to Section 14A of the Securities Exchange Act of 1934. While our Board of Directors intends to carefully consider the shareholder vote resulting from the proposal, the final vote will not be binding on us and is advisory in nature.
“RESOLVED, that the shareholders wish the company to include an advisory vote on the compensation of the company’s named executive officers pursuant to Section 14A of the Securities Exchange Act every:
• one year
• two years; or
• three years.”
The Company believes that “Say-on-Pay” votes should be conducted every year so that shareholders may annually express their views on the Company’s executive compensation program. The Compensation Committee of the Board of Directors, which administers the Company’s executive compensation program, values the opinions expressed by the Company’s shareholders in these votes and will continue to consider the outcome of these votes in making its decisions on executive compensation.
The Board of Directors recommends that shareholders vote to hold “Say-on-Pay” votes EVERY ONE YEAR (as opposed to every two years or every three years).
PROPOSALS REQUIRING YOUR VOTE

14
PROPOSALS REQUIRING YOUR VOTEPr
oxy
Stat
emen
t
Approval of Appointment of Independent Auditors
�The Board of Directors recommends a vote FOR the proposal to approve the appointment of PwC as independent auditors of the Company and to authorize the Audit Committee of the Board of Directors to set the auditors’ remuneration.
Item 4.
The Audit Committee is directly responsible for the appointment, compensation, retention and oversight of the independent external audit firm retained to audit the Company’s financial statements and internal controls over financial reporting. In executing its responsibilities, the Audit Committee engages in an annual evaluation of PricewaterhouseCoopers LLP (“PwC”) qualifications, performance and independence. In assessing independence, the Committee reviews the fees paid, including those related to non-audit services. The Audit Committee has sole authority to approve all engagement fees to be paid to PwC. The Audit Committee regularly meets with the lead audit partner without members of management present, and in executive session with only the Audit Committee members present, which provides the opportunity for continuous assessment of the firm’s effectiveness and independence and for consideration of rotating audit firms.
In addition, as part of its normal cadence, the Audit Committee considers whether there should be a regular rotation of the independent registered public accounting firm. The Audit Committee ensures that the mandated rotation of PwC’s lead engagement partner occurs routinely and the Audit Committee and its Chairman are directly involved in the selection of PwC’s lead engagement partner.
The Audit Committee has recommended that shareholders approve the appointment of PwC as our independent auditors for the fiscal year ending December 31, 2017, and to authorize the Audit Committee of our Board of Directors to set the independent auditors’ remuneration.
PwC has been acting continuously as our independent auditors for 111 years and, both by virtue of its long familiarity with the Company’s affairs and its ability, is considered best qualified to perform this important function. The Audit Committee and the Board believe that the continued retention of PwC to serve as our independent external auditor is in the best interests of the Company and its investors.
Representatives of PwC will be present at the Annual General Meeting and will be available to respond to appropriate questions. They will have an opportunity to make a statement if they so desire.
AUDIT COMMITTEE REPORTWhile management has the primary responsibility for the financial statements and the financial reporting process, including the system of internal controls, the Audit Committee reviews the Company’s audited financial statements and financial reporting process on behalf of the Board of Directors. The independent auditors are responsible for performing an independent audit of the Company’s consolidated financial statements in accordance with the standards of the Public Company Accounting Oversight Board (United States) and to issue a report thereon. The Audit Committee monitors those processes. In this context, the Audit Committee has met and held discussions with management and the independent auditors regarding the fair and complete presentation of the Company’s results. The Audit Committee has discussed significant accounting policies applied by the Company in its financial statements, as well as alternative treatments. Management has represented to the Audit Committee that the Company’s consolidated financial statements were prepared in accordance with United States generally accepted accounting principles, and the Audit Committee has reviewed and discussed the consolidated financial statements with management and the independent auditors. The Audit Committee also discussed with the independent auditors the matters required to be discussed by Auditing Standard No. 16, “Communications with Audit Committees” issued by the Public Company Accounting Oversight Board (United States).
In addition, the Audit Committee has received and reviewed the written disclosures and the letter from PwC required by the Public Company Accounting Oversight Board regarding PwC’s communications with the Audit Committee concerning independence and discussed with PwC the auditors’ independence from the Company and its management in connection with the matters stated therein. The Audit Committee also considered whether the independent auditors’ provision of non-audit services to the Company is compatible with the auditors’ independence. The Audit Committee has concluded that the independent auditors are independent from the Company and its management.

Ingersoll Rand 2017 Proxy Statement 15
PROPOSALS REQUIRING YOUR VOTE
Proxy Statement
The Audit Committee discussed with the Company’s internal and independent auditors the overall scope and plans for their respective audits. The Audit Committee meets separately with the internal and independent auditors, with and without management present, to discuss the results of their examinations, the evaluations of the Company’s internal controls and the overall quality of the Company’s financial reporting.
In reliance on the reviews and discussions referred to above, the Audit Committee recommended to the Board of Directors, and the Board has approved, that the audited financial statements be included in the Company’s Annual Report on Form 10-K for the fiscal year ended December 31, 2016 (“2016 Form 10-K”), for filing with the Securities and Exchange Commission (the “SEC”). The Audit Committee has selected PwC, subject to shareholder approval, as the Company’s independent auditors for the fiscal year ending December 31, 2017.
AUDIT COMMITTEE John P. Surma (Chair) Ann C. Berzin Linda P. Hudson Myles P. Lee Richard J. Swift
FEES OF THE INDEPENDENT AUDITORSThe following table shows the fees paid or accrued by the Company for audit and other services provided by PwC for the fiscal years ended December 31, 2016 and 2015:
2016($)
2015($)
Audit Fees (a) 12,275,000 12,853,000
Audit-Related Fees (b) 94,000 109,000
Tax Fees (c) 3,208,000 3,033,000
All Other Fees (d) 18,000 18,000
Total 15,595,000 16,013,000
(a) Audit Fees for the fiscal years ended December 31, 2016 and 2015, respectively, were for professional services rendered for the audits of the Company’s annual consolidated financial statements and its internal controls over financial reporting, including quarterly reviews, statutory audits, issuance of consents, comfort letters and assistance with, and review of, documents filed with the SEC.
(b) Audit-Related Fees consist of assurance services that are related to performing the audit and review of our financial statements. Audit Related Fees for the fiscal year ended December 31, 2016 and 2015 include employee benefit plan audits and abandoned and unclaimed property tax assessments.
(c) Tax Fees for the fiscal year ended December 31, 2016 and 2015 include consulting and compliance services in the U.S. and non-U.S. locations.
(d) All Other Fees for the fiscal year ended December 31, 2016 and 2015 include license fees for technical accounting software.
The Audit Committee has adopted policies and procedures which require that the Audit Committee pre-approve all non-audit services that may be provided to the Company by its independent auditors. The policy: (i) provides for pre-approval of an annual budget for each type of service; (ii) requires Audit Committee approval of specific projects if not included in the approved budget; and (iii) requires Audit Committee approval if the forecast of expenditures exceeds the approved budget on any type of service. The Audit Committee pre-approved all of the services described under “Audit-Related Fees,” “Tax Fees” and “All Other Fees.” The Audit Committee has determined that the provision of all such non-audit services is compatible with maintaining the independence of PwC.

16
PROPOSALS REQUIRING YOUR VOTEPr
oxy
Stat
emen
t
Renewal of the Directors’ existing authority to issue shares
�The Board of Directors recommends that you vote FOR renewing the Directors’ authority to issue shares.
Item 5.
Under Irish law, directors of an Irish public limited company must have authority from its shareholders to issue any shares, including shares which are part of the company’s authorized but unissued share capital. Our shareholders provided the Directors with this authorization at our 2016 annual general meeting on June 2, 2016 for a period of 18 months. Because this share authorization period will expire in December 2017, we are presenting this proposal to renew the Directors’ authority to issue our authorized shares on the terms set forth below.
We are seeking approval to authorize our Board of Directors to issue up to 33% of our issued ordinary share capital as of April 11, 2017 (the latest practicable date before this proxy statement), for a period expiring 18 months from the passing of this resolution, unless renewed, varied or revoked.
Granting the Board of Directors this authority is a routine matter for public companies incorporated in Ireland and is consistent with Irish market practice. This authority is fundamental to our business and enables us to issue shares, including in connection with our equity compensation plans (where required) and, if applicable, funding acquisitions and raising capital. We are not asking you to approve an increase in our authorized share capital or to approve a specific issuance of shares. Instead, approval of this proposal will only grant the Board of Directors the authority to issue shares that are already authorized under our articles of association upon the terms below. In addition, we note that, because we are a NYSE-listed company, our shareholders continue to benefit from the protections afforded to them under the rules and regulations of the NYSE and SEC, including those rules that limit our ability to issue shares in specified circumstances. Furthermore, we note that this authorization is required as a matter of Irish law and is not otherwise required for other U.S. companies listed on the NYSE with whom we compete. Renewal of the Directors’ existing authority to issue shares is fully consistent with NYSE rules and listing standards and with U.S. capital markets practice and governance standards.
As required under Irish law, the resolution in respect of Item 5 is an ordinary resolution that requires the affirmative vote of a simple majority of the votes cast.
The text of this resolution is as follows:
“That the Directors be and are hereby generally and unconditionally authorized with effect from the passing of this resolution to exercise all powers of the Company to allot relevant securities (within the meaning of Section 1021 of the Companies Act) up to an aggregate nominal amount of $90,154,373 (90,154,373 shares) (being equivalent to approximately 33% of the aggregate nominal value of the issued ordinary share capital of the Company as of April 11, 2017 (the latest practicable date before this proxy statement)), and the authority conferred by this resolution shall expire 18 months from the passing of this resolution, unless previously renewed, varied or revoked; provided that the Company may make an offer or agreement before the expiry of this authority, which would or might require any such securities to be allotted after this authority has expired, and in that case, the Directors may allot relevant securities in pursuance of any such offer or agreement as if the authority conferred hereby had not expired.”

Ingersoll Rand 2017 Proxy Statement 17
PROPOSALS REQUIRING YOUR VOTE
Proxy Statement
Renewal of the Directors’ existing authority to issue shares for cash without first offering shares to existing shareholders.
The Board of Directors recommends that you vote FOR renewing the Directors’ authority to issue shares for cash without first offering shares to existing shareholders.
Item 6.
Under Irish law, unless otherwise authorized, when an Irish public limited company issues shares for cash, it is required first to offer those shares on the same or more favorable terms to existing shareholders of the company on a pro-rata basis (commonly referred to as the statutory pre-emption right). Our shareholders provided the Directors with this authorization at our 2016 annual general meeting on June 2, 2016 for a period of 18 months. Because this share authorization period will expire in December 2017, we are presenting this proposal to renew the Directors’ authority to opt-out of the pre-emption right on the terms set forth below.
We are seeking approval to authorize our Board of Directors to opt out of the statutory pre-emption rights provision in the event of (1) the issuance of shares for cash in connection with any rights issue and (2) any other issuance of shares for cash, if the issuance is limited to up to 5% of our issued ordinary share capital as of April 11, 2017 (the latest practicable date before this proxy statement), for a period expiring 18 months from the passing of this resolution, unless renewed, varied or revoked.
Granting the Board of Directors this authority is a routine matter for public companies incorporated in Ireland and is consistent with Irish market practice. Similar to the authorization sought for Item 5, this authority is fundamental to our business and enables us to issue shares under our equity compensation plans (where required) and if applicable, will facilitate our ability to fund acquisitions and otherwise raise capital. We are not asking you to approve an increase in our authorized share capital. Instead, approval of this proposal will only grant the Board of Directors the authority to issue shares in the manner already permitted under our articles of association upon the terms below. Without this authorization, in each case where we issue shares for cash, we would first have to offer those shares on the same or more favorable terms to all of our existing shareholders. This requirement could undermine the operation of our compensation plans and cause delays in the completion of acquisitions and capital raising for our business. Furthermore, we note that this authorization is required as a matter of Irish law and is not otherwise required for other U.S. companies listed on the NYSE with whom we compete. Renewal of the Directors’ existing authorization to opt out of the statutory pre-emption rights as described above is fully consistent with NYSE rules and listing standards and with U.S. capital markets practice and governance standards.
As required under Irish law, the resolution in respect of this proposal is a special resolution that requires the affirmative vote of at least 75% of the votes cast.
The text of the resolution in respect of this proposal is as follows:
“As a special resolution, that, subject to the passing of the resolution in respect of Item 5 as set out above and with effect from the passing of this resolution, the Directors be and are hereby empowered pursuant to Section 1023 of the Companies Act 2014 to allot equity securities (as defined in Section 1023 of that Act) for cash, pursuant to the authority conferred by Item 5 as if sub-section (1) of Section 1022 did not apply to any such allotment, provided that this power shall be limited to:
(a) the allotment of equity securities in connection with a rights issue in favor of the holders of ordinary shares (including rights to subscribe for, or convert into, ordinary shares) where the equity securities respectively attributable to the interests of such holders are proportional (as nearly as may be) to the respective numbers of ordinary shares held by them (but subject to such exclusions or other arrangements as the directors may deem necessary or expedient to deal with fractional entitlements that would otherwise arise, or with legal or practical problems under the laws of, or the requirements of any recognized regulatory body or any stock exchange in, any territory, or otherwise); and
(b) the allotment (otherwise than pursuant to sub-paragraph (a) above) of equity securities up to an aggregate nominal value of $13,659,753 (13,659,753 shares) (being equivalent to approximately 5% of the aggregate nominal value of the issued ordinary share capital of the Company as of April 11, 2017 (the latest practicable date before this proxy statement)) and the authority conferred by this resolution shall expire 18 months from the passing of this resolution, unless previously renewed, varied or revoked; provided that the Company may make an offer or agreement before the expiry of this authority, which would or might require any such securities to be allotted after this authority has expired, and in that case, the Directors may allot equity securities in pursuance of any such offer or agreement as if the authority conferred hereby had not expired.”

18
PROPOSALS REQUIRING YOUR VOTEPr
oxy
Stat
emen
t
Determine the price at which the Company can re-allot shares held as treasury shares.
�The Board of Directors recommends that shareholders vote FOR the proposal to determine the price at which the Company can re-allot shares held as treasury shares.
Item 7.
Our open-market share repurchases (redemptions) and other share buyback activities may result in ordinary shares being acquired and held by the Company as treasury shares. We may reissue treasury shares that we acquire through our various share buyback activities including in connection with our executive compensation program and our director programs.
Under Irish law, our shareholders must authorize the price range at which we may re-allot any shares held in treasury. In this proposal, that price range is expressed as a minimum and maximum percentage of the closing market price of our ordinary shares on the NYSE the day preceding the day on which the relevant share is re-allotted. Under Irish law, this authorization expires 18 months after its passing unless renewed.
The authority being sought from shareholders provides that the minimum and maximum prices at which an ordinary share held in treasury may be re-allotted are 95% and 120%, respectively, of the closing market price of the ordinary shares on the NYSE the day preceding the day on which the relevant share is re-issued, except as described below with respect to obligations under employee share schemes, which may be at a minimum price of nominal value. Any re-allotment of treasury shares will be at price levels that the Board considers in the best interests of our shareholders.
As required under Irish law, the resolution in respect of this proposal is a special resolution that requires the affirmative vote of at least 75% of the votes cast.
The text of the resolution in respect of this proposal is as follows:
“As a special resolution, that the re-allotment price range at which any treasury shares held by the Company may be re-allotted shall be as follows:
(a) the maximum price at which such treasury share may be re-allotted shall be an amount equal to 120% of the “market price”; and
(b) the minimum price at which a treasury share may be re-allotted shall be the nominal value of the share where such a share is required to satisfy an obligation under an employee share scheme or any option schemes operated by the Company or, in all other cases, an amount equal to 95% of the “market price”; and
(c) for the purposes of this resolution, the “market price” shall mean the closing market price of the ordinary shares on the NYSE the day preceding the day on which the relevant share is re-allotted.
FURTHER, that this authority to reissue treasury shares shall expire at 18 months from the date of the passing of this resolution unless previously varied or renewed in accordance with the provisions of Sections 109 and 1078 of the Companies Act 2014.”

Ingersoll Rand 2017 Proxy Statement 19
Proxy Statement
CORPORATE GOVERNANCE
CORPORATE GOVERNANCE GUIDELINESOur Corporate Governance Guidelines, together with the charters of the various Board committees, provide a framework for the corporate governance of the Company. The following is a summary of our Corporate Governance Guidelines and practices. A copy of our Corporate Governance Guidelines, as well as the charters of each of our Board committees, are available on our website at www.ingersollrand.com under the heading “Discover Us – Our Company – Corporate Governance.”
ROLE OF THE BOARD OF DIRECTORSThe Company’s business is managed under the direction of the Board of Directors. The role of the Board of Directors is to oversee the management and governance of the Company and monitor senior management’s performance.
BOARD RESPONSIBILITIESThe Board of Directors’ core responsibilities include:
• selecting, monitoring, evaluating and compensating senior management;
• assuring that management succession planning is adequate;
• reviewing the Company’s financial controls and reporting systems;
• overseeing the Company’s management of enterprise risk;
• reviewing the Company’s ethical standards and legal compliance programs and procedures; and
• evaluating the performance of the Board of Directors, Board committees and individual directors.
BOARD LEADERSHIP STRUCTUREThe positions of Chairman of the Board and CEO at the Company are held by the same person, except in unusual circumstances, such as during a CEO transition. This policy has worked well for the Company. It is the Board of Directors’ view that the Company’s corporate governance principles, the quality, stature and substantive business knowledge of the members of the Board, as well as the Board’s culture of open communication with the CEO and senior management are conducive to Board effectiveness with a combined Chairman and CEO position.
In addition, the Board of Directors has a strong, independent Lead Director and it believes this role adequately addresses the need for independent leadership and an organizational structure for the independent directors. The Board of Directors appoints a Lead Director for a three-year minimum term from among the Board’s independent directors. The Lead Director coordinates the activities of all of the Board’s independent directors. The Lead Director is the principal confidant to the CEO and ensures that the Board of Directors has an open, trustful relationship with the Company’s senior management team. In addition to the duties of all directors, as set forth in the Company’s Governance Guidelines, the specific responsibilities of the Lead Director are as follows:
• Chair the meetings of the independent directors when the Chairman is not present;
• Ensure the full participation and engagement of all Board members in deliberations;
• Lead the Board of Directors in all deliberations involving the CEO’s employment, including hiring, contract negotiations, performance evaluations, and dismissal;
• Counsel the Chairman on issues of interest/concern to directors and encourage all directors to engage the Chairman with their interests and concerns;
• Work with the Chairman to develop an appropriate schedule of Board meetings and approve such schedule, to ensure that the directors have sufficient time for discussion of all agenda items, while not interfering with the flow of Company operations;
• Work with the Chairman to develop the Board and Committee agendas and approve the final agendas;
• Keep abreast of key Company activities and advise the Chairman as to the quality, quantity and timeliness of the flow of information from Company management that is necessary for the directors to effectively and responsibly perform their duties; although Company management is responsible for the preparation of materials for the Board of Directors, the Lead Director will approve information provided to the Board and may specifically request the inclusion of certain material;
• Engage consultants who report directly to the Board of Directors and assist in recommending consultants that work directly for Board Committees;
• Work in conjunction with the Corporate Governance and Nominating Committee in compliance with Governance Committee processes to interview all Board candidates and make recommendations to the Board of Directors;

20
CORPORATE GOVERNANCEPr
oxy
Stat
emen
t
• Assist the Board of Directors and Company officers in assuring compliance with and implementation of the Company’s Governance Guidelines; work in conjunction with the Corporate Governance Committee to recommend revisions to the Governance Guidelines;
• Call, coordinate and develop the agenda for and chair executive sessions of the Board’s independent directors; act as principal liaison between the independent directors and the CEO;
• Work in conjunction with the Corporate Governance and Nominating Committee to identify for appointment the members of the various Board Committees, as well as selection of the Committee chairs;
• Be available for consultation and direct communication with major shareholders;
• Make a commitment to serve in the role of Lead Director for a minimum of three years; and
• Help set the tone for the highest standards of ethics and integrity.
Mr. Swift has been the Company’s Lead Director since January 2010.
BOARD RISK OVERSIGHTThe Board of Directors has oversight responsibility of the processes established to report and monitor systems for material risks applicable to the Company. The Board of Directors focuses on the Company’s general risk management strategy and the most significant risks facing the Company and ensures that appropriate risk mitigation strategies are implemented by management. The full Board is responsible for considering strategic risks and succession planning and, at each Board meeting, receives reports from each Committee as to risk oversight within their areas of responsibility. The Board of Directors has delegated to its various committees the oversight of risk management practices for categories of risk relevant to their functions as follows:
• The Audit Committee oversees risks associated with the Company’s systems of disclosure controls and internal controls over financial reporting, as well as the Company’s compliance with legal and regulatory requirements.
• The Compensation Committee considers risks related to the attraction and retention of talent and risks related to the design of compensation programs and arrangements.
• The Corporate Governance and Nominating Committee oversees risks associated with board succession, conflicts of interest, corporate governance and sustainability.
• The Finance Committee oversees risks associated with foreign exchange, insurance, credit and debt.
The Company has appointed the Chief Financial Officer as its Chief Risk Officer and, in that role, the Chief Risk Officer periodically reports on risk management policies and practices to the relevant Board Committee or to the full Board so that any decisions can be made as to any required changes in the Company’s risk management and mitigation strategies or in the Board’s oversight of these. As part of its oversight of the Company’s executive compensation program, the Compensation Committee considers the impact of the Company’s executive compensation program and the incentives created by the compensation awards that it administers on the Company’s risk profile. In addition, the Company reviews all of its compensation policies and procedures, including the incentives that they create and factors that may reduce the likelihood of excessive risk taking, to determine whether they present a significant risk to the Company. Based on this review, the Company has concluded that its compensation policies and procedures are not reasonably likely to have a material adverse effect on the Company.
DIRECTOR COMPENSATION AND SHARE OWNERSHIPIt is the policy of the Board of Directors that directors’ fees be the sole compensation received from the Company by any non-employee director. The Company has a share ownership requirement of four times the annual cash retainer paid to the directors. A director cannot sell any shares of Company stock until he or she attains such level of ownership and any sale thereafter cannot reduce the total number of holdings below the required ownership level. Directors are required to retain this minimum level of Company share ownership until their resignation or retirement from the Board.
BOARD COMMITTEESThe Board of Directors has the following committees: Audit Committee, Compensation Committee, Corporate Governance and Nominating Committee, Finance Committee, Technology and Innovation Committee and Executive Committee. The Board of Directors consists of a substantial majority of independent, non-employee directors. Only non-employee directors serve on the Audit, Compensation, Corporate Governance and Nominating, Finance and Technology and Innovation Committees. The Board of Directors has determined that each member of each of these committees is “independent” as defined in the NYSE listing standards and the Company’s Guidelines for Determining Independence of Directors. Chairpersons and members of these five committees are rotated periodically, as appropriate. The Chairman, who is also the CEO, serves on the Company’s Executive Committee and is Chairperson of such Committee. The remainder of the Executive Committee is comprised of the Lead Director and the non-employee director Chairpersons of the Audit, Compensation, Corporate Governance and Nominating and Finance Committees. Committee memberships and chairs are rotated periodically.

Ingersoll Rand 2017 Proxy Statement 21
CORPORATE GOVERNANCE
Proxy Statement
BOARD DIVERSITYThe Company’s policy on Board diversity relates to the selection of nominees for the Board of Directors. In selecting a nominee for the Board, the Corporate Governance and Nominating Committee considers the skills, expertise and background that would complement the existing Board and ensure that its members are of sufficiently diverse and independent backgrounds, recognizing that the Company’s businesses and operations are diverse and global in nature. The Board of Directors currently has three female directors, one Hispanic director, and two Irish directors out of a total of 11 directors.
BOARD ADVISORSThe Board of Directors and its committees may, under their respective charters, retain their own advisors to carry out their responsibilities.
EXECUTIVE SESSIONSThe Company’s independent directors meet privately in regularly scheduled executive sessions, without management present, to consider such matters as the independent directors deem appropriate. These executive sessions are required to be held no less than twice each year.
BOARD AND BOARD COMMITTEE PERFORMANCE EVALUATIONThe Corporate Governance and Nominating Committee assists the Board in evaluating its performance and the performance of the Board committees. Each committee also conducts an annual self-evaluation. The effectiveness of individual directors is considered each year when the directors stand for re-nomination.
DIRECTOR ORIENTATION AND EDUCATIONThe Company has developed an orientation program for new directors and provides continuing education for all directors. In addition, the directors are given full access to management and corporate staff as a means of providing additional information.
DIRECTOR NOMINATION PROCESSThe Corporate Governance and Nominating Committee reviews the composition of the full Board to identify the qualifications and areas of expertise needed to further enhance the composition of the Board, makes recommendations to the Board concerning the appropriate size and needs of the Board and, on its own or with the assistance of management, a search firm or others, identifies candidates with those qualifications. In considering candidates, the Corporate Governance and Nominating Committee will take into account all factors it considers appropriate, including breadth of experience, understanding of business and financial issues, ability to exercise sound judgment, diversity, leadership, and achievements and experience in matters affecting business and industry. The Corporate Governance and Nominating Committee considers the entirety of each candidate’s credentials and believes that at a minimum each nominee should satisfy the following criteria: highest character and integrity, experience and understanding of strategy and policy-setting, sufficient time to devote to Board matters, and no conflict of interest that would interfere with performance as a director. Shareholders may recommend candidates for consideration for Board membership by sending the recommendation to the Corporate Governance and Nominating Committee, in care of the Secretary of the Company. Candidates recommended by shareholders are evaluated in the same manner as director candidates identified by any other means.
DIRECTOR RETIREMENTIt is the policy of the Board of Directors that each non-employee director must retire at the annual general meeting immediately following his or her 75th birthday. Directors who change the occupation they held when initially elected must offer to resign from the Board of Directors. At that time, the Corporate Governance and Nominating Committee reviews the continued appropriateness of Board membership under the new circumstances and makes a recommendation to the Board of Directors. Employee directors, including the CEO, must retire from the Board of Directors at the time of a change in their status as an officer of the Company, unless the policy is waived by the Board.
DIRECTOR INDEPENDENCEThe Board of Directors has determined that all of our current directors and director nominees, except Mr. Lamach, who is an employee of the Company, are independent under the standards set forth in Exhibit I to our Corporate Governance Guidelines, which are consistent with the NYSE listing standards. In determining the independence of directors, the Board evaluated transactions between the Company and entities with which directors were affiliated that occurred in the ordinary course of business and that were provided on the same terms and conditions available to other customers. A copy of Exhibit I to our Corporate Governance Guidelines is available on our website, www.ingersollrand.com, under the heading “Discover Us – Our Company—Corporate Governance.”

22
CORPORATE GOVERNANCEPr
oxy
Stat
emen
t
COMMUNICATIONS WITH DIRECTORSShareholders and other interested parties wishing to communicate with the Board of Directors, the non-employee directors or any individual director (including our Lead Director and Compensation Committee Chair) may do so either by sending a communication to the Board and/or a particular Board member, in care of the Secretary of the Company, or by e-mail at [email protected]. Depending upon the nature of the communication and to whom it is directed, the Secretary will: (a) forward the communication to the appropriate director or directors; (b) forward the communication to the relevant department within the Company; or (c) attempt to handle the matter directly (for example, a communication dealing with a share ownership matter).
CODE OF CONDUCTThe Company has adopted a worldwide Code of Conduct, applicable to all employees, directors and officers, including our Chief Executive Officer, our Chief Financial Officer and our Controller. The Code of Conduct meets the requirements of a “code of ethics” as defined by Item 406 of Regulation S-K, as well as the requirements of a “code of business conduct and ethics” under the NYSE listing standards. The Code of Conduct covers topics including, but not limited to, conflicts of interest, confidentiality of information, and compliance with laws and regulations. A copy of the Code of Conduct is available on our website located at www.ingersollrand.com under the heading “Discover Us – Our Company—Corporate Governance.” Amendments to, or waivers of the provisions of, the Code of Conduct, if any, made with respect to any of our directors and executive officers will be posted on our website.
ANTI-HEDGING POLICY AND OTHER RESTRICTIONSThe Company prohibits its directors and executive officers from (i) purchasing any financial instruments designed to hedge or offset any decrease in the market value of Company securities, (ii) engaging in any form of short-term speculative trading in Company securities and (iii) holding Company securities in a margin account or pledging Company securities as collateral for a loan.
INVESTOR OUTREACHWe believe it is important to understand our shareholders and their concerns and questions about our Company. During 2016, we met with a significant number of our major shareholders and with prospective shareholders to answer questions about our Company and to learn about issues that are important to them. We also worked with a third party firm to survey investor perception regarding our Company on a wide range of topics including corporate strategy and capital allocation priorities. The results of this survey were valuable and we were able to identify areas where we could improve or communications with investors. We plan to expand our investor outreach efforts during 2017.
COMMITTEES OF THE BOARDAUDIT COMMITTEEMeetings in 2016: 9
MembersJohn P. Surma (Chair) Ann C. Berzin Linda P. Hudson Myles P. Lee Richard J. Swift
Key Functions• Review annual audited and quarterly financial statements, as well as the Company’s disclosures under
“Management’s Discussion and Analysis of Financial Conditions and Results of Operations,” with management and the independent auditors.
• Obtain and review periodic reports, at least annually, from management assessing the effectiveness of the Company’s internal controls and procedures for financial reporting.
• Review the Company’s processes to assure compliance with all applicable laws, regulations and corporate policy.
• Recommend the public accounting firm to be proposed for appointment by the shareholders as our independent auditors and review the performance of the independent auditors.
• Review the scope of the audit and the findings and approve the fees of the independent auditors.
• Approve in advance, subject to and in accordance with applicable laws and regulations, permitted audit and non-audit services to be performed by the independent auditors.
• Satisfy itself as to the independence of the independent auditors and ensure receipt of their annual independence statement.
The Board of Directors has determined that each member of the Audit Committee is “independent” for purposes of the applicable rules and regulations of the SEC, as defined in the NYSE listing standards and the Company’s Corporate Governance Guidelines, and has determined that each member meets the qualifications of an “audit committee financial expert,” as that term is defined by rules of the SEC. In addition, each member of the Audit Committee qualifies as an independent director and possesses the requisite competence in accounting or auditing in satisfaction of the requirements for audit committees prescribed by the Companies Act 2014.
A copy of the charter of the Audit Committee is available on our website, www.ingersollrand.com, under the heading “Discover Us – Our Company—Corporate Governance.”

Ingersoll Rand 2017 Proxy Statement 23
CORPORATE GOVERNANCE
Proxy Statement
COMPENSATION COMMITTEEMeetings in 2016: 5
MembersTony L. White (Chair) John Bruton Jared L. Cohon Gary D. Forsee
Key Functions• Establish our executive compensation strategies, policies and programs.
• Review and approve the goals and objectives relevant to the compensation of the Chief Executive Officer, evaluate the Chief Executive Officer’s performance against those goals and objectives and set the Chief Executive Officer’s compensation level based on this evaluation. The Compensation Committee Chair presents all compensation decisions pertaining to the Chief Executive Officer to the full Board of Directors.
• Approve compensation of all other elected officers.
• Review and approve executive compensation and benefit programs.
• Administer the Company’s equity compensation plans.
• Review and recommend significant changes in principal employee benefit programs.
• Approve and oversee Compensation Committee consultants.
For a discussion concerning the processes and procedures for determining NEO and director compensation and the role of executive officers and compensation consultants in determining or recommending the amount or form of compensation, see “Compensation Discussion and Analysis” and “Compensation of Directors,” respectively. The Board of Directors has determined that each member of the Compensation Committee is “independent” as defined in the NYSE listing standards and the Company’s Corporate Governance Guidelines. In addition, the Board of Directors has determined that each member of the Compensation Committee qualifies as a “Non-Employee Director” within the meaning of Rule 16b-3 of the Securities Exchange Act of 1934 and an “outside director” within the meaning of Section 162(m) of the Code.
A copy of the charter of the Compensation Committee is available on our website, www.ingersollrand.com, under the heading “Discover Us – Our Company—Corporate Governance.”
CORPORATE GOVERNANCE AND NOMINATING COMMITTEEMeetings in 2016: 5
MembersGary D. Forsee (Chair) John Bruton Jared L. Cohon Tony L. White
Key Functions• Identify individuals qualified to become directors and recommend the candidates for all directorships.
• Recommend individuals for election as officers.
• Review the Company’s Corporate Governance Guidelines and make recommendations for changes.
• Consider questions of independence of directors and possible conflicts of interest of directors as well as executive officers.
• Take a leadership role in shaping the corporate governance of the Company.
• Oversee the Company’s sustainability efforts.
The Board of Directors has determined that each member of the Corporate Governance and Nominating Committee is “independent” as defined in the NYSE listing standards and the Company’s Corporate Governance Guidelines.
A copy of the charter of the Corporate Governance and Nominating Committee is available on our website, www.ingersollrand.com, under the heading “Discover Us – Our Company—Corporate Governance.”
FINANCE COMMITTEEMeetings in 2016: 6
MembersAnn C. Berzin (Chair) Linda P. Hudson Myles P. Lee John P. Surma Richard J. Swift
Key Functions• Consider and recommend for approval by the Board of Directors of (a) issuances of equity and/or debt
securities; or (b) authorizations for other financing transactions, including bank credit facilities.
• Consider and recommend for approval by the Board of Directors the repurchase of the Company’s shares.
• Review cash management policies.
• Review periodic reports of the investment performance of the Company’s employee benefit plans.
The Board of Directors has determined that each member of the Finance Committee is “independent” as defined in the NYSE listing standards and the Company’s Corporate Governance Guidelines.
A copy of the charter of the Finance Committee is available on our website, www.ingersollrand.com, under the heading “Discover Us – Our Company—Corporate Governance.”

24
CORPORATE GOVERNANCEPr
oxy
Stat
emen
t
EXECUTIVE COMMITTEEMeetings in 2016: 0
MembersMichael W. Lamach (Chair) Ann C. Berzin Gary D. Forsee John P. Surma Richard J. Swift Tony L. White
Key Functions• Aids the Board in handling matters which, in the opinion of the Chairman of the Board or Lead Director, should
not be postponed until the next scheduled meeting of the Board (except as limited by the charter of the Executive Committee).
The Board of Directors has determined that each member of the Executive Committee (other than Michael W. Lamach) is “independent” as defined in the NYSE listing standards and the Company’s Corporate Governance Guidelines.
A copy of the charter of the Executive Committee is available on our website, www.ingersollrand.com, under the heading “Discover Us – Our Company—Corporate Governance.”
TECHNOLOGY AND INNOVATION COMMITTEEMeetings in 2016: 2
MembersJared L. Cohon (Chair) John Bruton Gary D. Forsee Linda P. Hudson Richard J. Swift Tony L. White
Key Functions• Reviews the Company’s technology and innovation strategy and approach, including its impact on the
Company’s performance, growth and competitive position.
• Reviews with management technologies that can have a material impact on the Company, including product and process development technologies, manufacturing technologies and practices, and the utilization of quality assurance programs.
• Assists the Board in its oversight of the Company’s investments in technology and innovation, including through acquisitions and other business development activities.
• Reviews technology trends that could significantly affect the Company and the industries in which it operates.
• Assists the Board in its oversight of the Company’s technology and innovation initiatives.
• Oversees the direction and effectiveness of the Company’s research and development operations
The Board of Directors has determined that each member of the Technology and Innovation Committee is “independent” as defined in the NYSE listing standards and the Company’s Corporate Governance Guidelines.
A copy of the charter of the Technology and Innovation Committee is available on our website, www.ingersollrand.com, under the heading “Discover Us – Our Company—Corporate Governance.”

Ingersoll Rand 2017 Proxy Statement 25
CORPORATE GOVERNANCE
Proxy Statement
BOARD, COMMITTEE AND ANNUAL MEETING ATTENDANCEThe Board of Directors and its committees held the following number of meetings during the fiscal year ended December 31, 2016:
Board 6
Audit Committee 9
Compensation Committee 5
Corporate Governance and Nominating Committee 5
Finance Committee 6
Executive Committee 0
Technology and Innovation Committee 2
Each incumbent director attended 94% or more of the total number of meetings of the Board of Directors and the committees on which he or she served during the year. The Company’s non-employee directors held 6 independent director meetings without management present during the fiscal year 2016. It is the Board’s general practice to hold independent director meetings in connection with regularly scheduled Board meetings.
The Company expects all Board members to attend the annual general meeting, but from time to time other commitments prevent all directors from attending the meeting. All of our Board members standing for re-election at the 2016 Annual General Meeting attended that meeting, which was held on June 2, 2016.
COMPENSATION COMMITTEE INTERLOCKS AND INSIDER PARTICIPATIONOur Compensation Committee is composed solely of independent directors. During fiscal 2016, no member of our Compensation Committee was an employee or officer or former officer of the Company or had any relationships requiring disclosure under Item 404 of Regulation S-K. None of our executive officers has served on the board of directors or compensation committee of any other entity that has or has had one or more executive officers who served as a member of our Board or our Compensation Committee during fiscal 2016.

26
Prox
y St
atem
ent
COMPENSATION OF DIRECTORS
DIRECTOR COMPENSATIONOur director compensation program is designed to compensate non-employee directors fairly for work required for a company of our size and scope and to align their interests with the long-term interests of our shareholders. The program reflects our desire to attract, retain and use the expertise of highly qualified people serving on the Company’s Board of Directors. Employee directors do not receive any additional compensation for serving as a director. Our 2016 director compensation program for non-employee directors consisted of the following elements:
Compensation Element Compensation Value ($)
Annual Retainer (1/2 paid in cash and 1/2 paid in restricted stock units) * 285,000
Audit Committee Chair Cash Retainer 30,000
Compensation Committee Chair Cash Retainer 20,000
Corporate Governance and Nominating Committee Chair and Finance Committee Chair Cash Retainer 15,000
Executive Committee Chair Retainer No retainer paid to the Chair
Technology and Innovation Committee Chair Retainer 7,500
Audit Committee Member Cash Retainer (other than Chair) 7,500
Lead Director Cash Retainer 50,000
Additional Meetings or Unscheduled Planning Session Fees ** 2,500 (per meeting or session)
* The number of restricted stock units granted are determined by dividing the grant date value of the award, $142,500 by the average of the high and low prices of the Company’s common stock on the date of grant. A director who retires, resigns or otherwise separates from the Company receives a pro-rata cash retainer payment for the quarter in which such event occurs based on the number of days elapsed since the end of the immediately preceding quarter.
** The Board and the Compensation Committee, Corporate Governance and Nominating Committee and Finance Committee, each has 6 regularly scheduled meetings each year. The Audit Committee has 9 regularly scheduled meetings each year. The Technology and Innovation Committee meets at least once a year. The Executive Committee meets on an as needed basis when directed by the Chairman or Lead Director.
SHARE OWNERSHIP REQUIREMENTTo align the interests of directors with shareholders, the Board of Directors has adopted a share ownership requirement of four times the annual cash retainer paid to the directors. A director cannot sell any shares of Company stock until he or she attains such level of ownership and any sale thereafter cannot reduce the total number of holdings below the required ownership level. Directors are required to retain this minimum level of Company share ownership until their resignation or retirement from the Board.

Ingersoll Rand 2017 Proxy Statement 27
COMPENSATION OF DIRECTORS
Proxy Statement
2016 DIRECTOR COMPENSATIONThe compensation paid or credited to our non-employee directors for the year ended December 31, 2016, is summarized in the table below.
Name
Fees earnedor paid in cash
($) (a)
Equity / StockAwards
($) (b)
All OtherCompensation
($)Total
($)
A. C. Berzin 165,000 142,534 – 307,534
J. Bruton 142,500 142,534 – 285,034
E. L. Chao (c) 142,500 142,534 – 285,034
J.L. Cohon 150,000 142,534 – 292,534
G.D. Forsee 157,500 142,534 – 300,034
C.J. Horner 142,500 142,534 – 285,034
L. P. Hudson 150,000 142,534 – 292,534
M. P. Lee 150,000 142,534 – 292,534
J.P. Surma 172,500 142,534 – 315,034
R.J. Swift 200,000 142,534 – 342,534
T.L. White 162,500 142,534 – 305,034
(a) The amounts in this column represent the following: annual cash retainer, the Committee Chair retainers, the Audit Committee member retainer, the Lead Director retainer, and the Board, Committee and other meeting or session fees:
Name
Cash Retainer
($)
Committee Chair Retainer
($)
Audit Committee
Member Retainer
($)
Lead Director Retainer Fees
($)
Board, Committee and Other Meeting
or Session Fees ($)
Total Fees earned or
paid in cash ($)
A. C. Berzin 142,500 15,000 7,500 – – 165,000
J. Bruton 142,500 – – – – 142,500
E. L. Chao 142,500 – – – – 142,500
J.L. Cohon 142,500 7,500 – – – 150,000
G.D. Forsee 142,500 15,000 – – – 157,500
C.J. Horner 142,500 – – – – 142,500
L. P. Hudson 142,500 – 7,500 – – 150,000
M. P. Lee 142,500 – 7,500 – – 150,000
J.P. Surma 142,500 30,000 – – – 172,500
R.J. Swift 142,500 – 7,500 50,000 – 200,000
T.L. White 142,500 20,000 – – – 162,500
(b) Represents RSUs awarded in 2016 as part of each director’s annual retainer. The amounts in this column reflect the aggregate grant date fair value of RSU awards granted for the year under Financial Accounting Standards Board (FASB) Accounting Standards Codification (ASC) Topic 718 and do not reflect amounts paid to or realized by the directors. For a discussion of the assumptions made in determining the ASC 718 values see Note 12, “Share-Based Compensation,” to the Company’s consolidated financial statements contained in its 2016 Form 10-K.
(c) Ms. Chao resigned from the Board on January 31, 2017 in connection with her appointment as Secretary of the United States Department of Transportation.

28
COMPENSATION OF DIRECTORSPr
oxy
Stat
emen
t
For each non-employee director, the following table reflects all unvested RSU awards at December 31, 2016:
Name Number of Unvested RSUs
A. C. Berzin 2,150
J. Bruton 2,150
E. L. Chao 2,150
J.L. Cohon 2,150
G.D. Forsee 2,150
C.J. Horner 2,150
L. P. Hudson 2,150
M. P. Lee 2,150
J.P. Surma 2,150
R.J. Swift 2,150
T.L. White 2,150

Ingersoll Rand 2017 Proxy Statement 29
Proxy Statement
COMPENSATION DISCUSSION AND ANALYSIS
The Compensation Discussion and Analysis (“CD&A”) set forth below provides an overview of our executive compensation philosophy and the underlying programs, including the objectives of such programs, as well as a discussion of how awards are determined for our Named Executive Officers (“NEOs”). These NEOs include our Chairman and Chief Executive Officer (“CEO”), our Chief Financial Officer (“CFO”), and our three most highly compensated executive officers from the 2016 fiscal year other than the CEO and CFO. We have also voluntarily included a sixth NEO, Mr. Robert Zafari, who is the Segment President for our Industrial business. The NEOs are:
Named Executive Officers Title
Mr. Michael W. Lamach Chairman and Chief Executive Officer
Ms. Susan K. Carter Senior Vice President and Chief Financial Officer
Mr. Didier P. M. Teirlinck, Ph.D. Executive Vice President, Climate Segment
Mr. Robert G. Zafari Executive Vice President, Industrial Segment
Ms. Marcia J. Avedon, Ph.D. Senior Vice President, Human Resources, Communications and Corporate Affairs
Ms. Maria C. Green Senior Vice President and General Counsel
This discussion and analysis is divided into the following sections:
I. Executive Summary
II. Compensation Philosophy and Design Principles
III. Factors Considered in the Determination of Target Total Direct Compensation
IV. Role of the Committee, Independent Advisor, and Committee Actions
V. Compensation Program Descriptions and Compensation Decisions
VI. Other Compensation and Tax Matters
I. EXECUTIVE SUMMARYIngersoll Rand is a world leader in the creation of comfortable, sustainable and efficient environments. Our people and our family of brands – including Ingersoll-Rand, Trane, Thermo King and Club Car – work together to enhance the quality and comfort of air in homes and buildings, transport and protect food and perishables, and increase industrial productivity and efficiency. We continue to develop, mature and implement our business operating system throughout the company to consistently deliver top quartile growth, margin improvement, EPS growth and Cash Flow.
2016 FINANCIAL RESULTSThe following table documents the enterprise financial results realized in 2016 relative to our executive incentive compensation performance targets established for the period:
Metric Performance (1)
Revenue Adjusted Annual Revenue of $13.288 billion, which is 98% of target and a decrease of 2.3% over 2015
Operating Income Adjusted Operating Income of $1.585 billion, which is 96% of target and an increase of 3.3% over 2015
Operating Income Margin Adjusted Operating Income Margin of 11.93%, which is 0.32 percentage points less than target and an increase of 0.6 percentage points over 2015
Cash Flow Adjusted Cash Flow of $1,323 billion, which is 130% of target and an increase of 29.6% from 2015
3-Year EPS Growth 3-year adjusted EPS growth (2014 - 2016) of 15.6%, which ranks at the 85th percentile of the companies in the S&P 500 Industrials Index
3-Year TSR 3-year TSR (2014-2016) of 37.78%, which ranks at the 56th percentile of the companies in the S&P 500 Industrials Index
(1) We report our financial results in our annual report on Form 10-K and our quarterly reports on Form 10-Q in accordance with generally accepted accounting principles (“GAAP”). Our financial results described above for Revenue, Operating Income, Operating Income Margin and Cash Flow and 3-Year EPS Growth have been adjusted to exclude the impact of certain non-routine and other items as permitted by our incentive plans and approved by the Committee and are non-GAAP financial measures. These metrics and the related performance targets and results are relevant only to our executive compensation program and should not be used or applied in other contexts. For a description of how the metrics above are calculated from our GAAP financial statements, please see “Annual Incentive Matrix (’AIM’) - Determination of Payout” with respect to AIM payments and “Long Term Incentive Program (‘LTI’) – 2014 - 2016 Performance Share Units Payout” with respect to PSP awards.
30
COMPENSATION DISCUSSION AND ANALYSISPr
oxy
Stat
emen
t
• Based on our 2016 results for Revenue, Operating Income, Operating Income Margin and Cash Flow, achievement under the Annual Incentive Matrix (“AIM”) financial score was 106.98% of target for the Enterprise. At the Segment level, 2016 AIM financial score payout levels were 126.38% of target for the Climate Segment and 33.86% of target for the Industrial Segment.
• Based on our average EPS growth rate of 15.60% and a total shareholder return (“TSR”) of 37.78% during the 2014 to 2016 performance period, Performance Share Units (“PSUs”) under our Performance Share Program (“PSP”) achievement was 162% of target.
OTHER 2016 ACHIEVEMENTSIn 2016, we achieved the following:
• Continued to significantly reduce the greenhouse gas emissions on our products and operations, while also convening industry leaders to develop long-term solutions aimed at solving global climate challenges.
• Continued to be recognized for performance in the areas of climate change, employee engagement, environmental stewardship, human rights and philanthropy. Examples of this recognition included:
- Being named as one of the 100 best corporate citizens for the third year in a row in Corporate Responsibility Magazine;
- Being ranked 10th in the area of community responsibility in the 2016 Fortune Magazine’s list of most admired companies;
- Being awarded a perfect score in workplace equality on the Human Rights Campaign Foundation’s equality index;
- Continued to be placed on the 2016 Dow Jones Sustainability World and North America Indices, for the sixth consecutive year; and,
- Achieved a 42% improvement in Newsweek’s listing of top green companies in the US.
• In addition, we again improved our employee engagement as we sought meaningful ways to enhance the working lives of our employees, which translates into improved commitment to the company’s core values and mission. Our overall employee engagement score positions us well into the top quartile of all companies globally.
• Continued to increase our dividend, delivering on our strategy to provide value to our shareholders. In 2016 our dividend increased by 38%, and has increased 417% since 2011.
EXECUTIVE COMPENSATION PROGRAM OVERVIEWThe Compensation Committee (the “Committee”) has adopted executive compensation programs with a strong link between pay and the achievement of short term and long-term Company goals. The primary elements of the executive compensation programs are:
Total Direct Compensation
Element (1) Objective of Element
Base Salary Fixed cash compensation.
Annual Incentive Matrix (“AIM”) Variable cash incentive compensation. Any award earned is based on performance measured against pre-defined annual revenue, Operating Income, cash flow and Operating Income Margin percent objectives, as well as individual performance measured against pre-defined objectives.
Long-Term Incentives (“LTI”) Variable long-term incentive compensation. Performance is aligned with the Company’s stock price and is awarded in the form of stock options, restricted stock units (“RSUs”) and PSUs. PSUs are only payable if the Company’s EPS growth and TSR relative to companies in the S&P 500 Industrials Index exceed threshold performance.
(1) See Section V, “Compensation Program Descriptions and Compensation Decisions”, for additional discussion of these elements of compensation.

Ingersoll Rand 2017 Proxy Statement 31
COMPENSATION DISCUSSION AND ANALYSIS
Proxy Statement
As illustrated in the charts below, the Committee places significant emphasis on variable compensation AIM and LTI so that a substantial percentage of each NEO’s target total direct compensation is contingent on the successful achievement of the Company’s short-term and long-term performance goals.
Chairman and CEO 2016 Compensation Mix (Target Total Direct Compensation)
Target AIM 16%
Target Long-TermIncentive 74% Base Salary 10%
Pay at Risk 90%
Other NEOs 2016 Compensation Mix (Target Total Direct Compensation)
Target AIM 21%
Base Salary 23%
Pay at Risk 77%
Target Long-TermIncentive 56%
2016 COMMITTEE ACTIONSWhile there were no material changes to executive compensation programs in 2016, the Committee did take the following actions during the year:
• Oversaw the redesign of the annual proxy disclosure and refined the Compensation Discussion & Analysis (“CD&A”) to simplify and clarify disclosure and enhance investor understanding of the Company’s executive compensation design; and
• Reviewed and approved a revised peer group to be used to benchmark executive compensation levels and plan design in 2017.
GOOD GOVERNANCE PRACTICESIn addition to the actions taken in 2016, various good governance practices are in place, including:
• We employ diversified metrics for our AIM and PSP programs to align with business strategies and shareholder interests;
• We tie incentive awards to the achievement of rigorous pre-determined and measurable performance objectives;
• We place significant emphasis on variable compensation (AIM and LTI) in designing our compensation mix;
• We maintain a claw-back/recoupment policy and robust stock ownership requirements for our executives;
• We do not provide tax gross-ups for any change-in-control agreement entered into after May of 2009. Only 4 of our 16 officers have a tax gross-up provision in an agreement entered into with such officer prior to May 2009;
• We use tally sheets to fully understand all elements of current and potential future compensation, which are reviewed by the Committee prior to making compensation decisions for the NEOs;
• We prohibit the re-pricing of equity awards;
• We require “double-trigger” vesting for any cash payments under our change in control agreements; and,
• We conduct regular reviews of our executive compensation design to ensure it addresses business needs, shareholder interests and regulatory requirements.
CONSIDERATION OF 2016 ADVISORY VOTE ON EXECUTIVE COMPENSATIONThe Committee regularly reviews the philosophy, objectives and elements of our executive compensation programs in relation to our short and long-term business objectives. In undertaking this review, the Committee considers the views of shareholders as reflected in their annual advisory vote on our executive compensation proposal. Shareholders voted 94.3% in favor of the company’s Advisory Approval of the Compensation of Our Named Executive Officers proposal at our 2016 annual general meeting. Based on the Committee’s review and the support our executive compensation programs received from shareholders, the Committee determined it would be appropriate to maintain the core elements of our executive compensation programs.
32
COMPENSATION DISCUSSION AND ANALYSISPr
oxy
Stat
emen
t
II. COMPENSATION PHILOSOPHY AND DESIGN PRINCIPLESOur executive compensation programs are designed to enable us to attract, retain and focus the talent and energy of executive officers (including our NEOs) who are capable of meeting the Company’s current and future goals, most notably the creation of sustainable shareholder value. As we operate in an ever-changing environment, our Committee makes decisions with consideration of economic, technological, regulatory, investor and competitive factors as well as our executive compensation principles.
The design principles that govern our executive compensation programs are:
Business strategy alignment Our executive compensation programs provide flexibility to align with changing Company or business strategies. The programs allow for individuals within the Company’s businesses to focus on specific financial measures to meet the short and long-term plans of the particular business for which they are accountable. It is not only possible but also desirable for certain leaders to earn substantial awards in years when their business outperforms against their annual operating plan. Conversely, if a business fails to meet its performance goals, that business’ leader may earn a lesser award than his or her peers in that year. To provide a balanced incentive, all executives have a significant portion of their compensation tied to Company performance.
Pay for performance A strong pay for performance culture is paramount to our Company’s success. As a result, each executive’s target total direct compensation (“TDC”) is tied to performance of the Company, the applicable business, and individual goals. Company and business performance is measured against pre-established financial, operational and strategic objectives. Individual performance is measured against pre-established individual goals as well as demonstrated leadership competencies and behaviors consistent with our Company values. In addition, a portion of the long-term incentive is earned based upon earnings and shareholder value performance relative to peer companies.
Mix of short and long-term incentives A proper mix between short and long-term incentives is important to encourage decision making that mitigates risk and balances the need to meet our Annual Operating Plan (“AOP”) objectives while also taking into account the long-term interests of the Company and its shareholders. The mix of pay, including short and long-term incentives, is determined by considering the Company’s pay for performance compensation philosophy and strategic objectives as well as competitive market practice.
Internal parity Each executive’s target TDC opportunity is proportionate with the responsibility, scope and complexity of his or her role within the Company. Thus, similar jobs are assigned similar target compensation opportunities.
Shareholder alignment Our executive compensation programs align the interests of our executives with those of our shareholders by rewarding the achievement of key financial targets such as revenue growth, EPS, and cash flow, which should correlate with share price appreciation over time. In addition, our long-term incentives are tied to total shareholder returns and increase in value as share price increases. Other program requirements, including share ownership guidelines for executives and vesting schedules on equity awards further align executives’ and shareholders’ interests.
Market competitiveness Compensation opportunities must serve to attract and retain high performing executives in a competitive environment for talent. Therefore, target TDC levels are set referencing applicable market compensation benchmarks with consideration of retention and recruiting demands in the industries and markets where we compete for business and executive talent. As a result, each executive’s target TDC may be above or below the market benchmark reference based on his or her experience, proficiency, performance and potential in performing the duties of his or her position in addition to the competitive market for that individual and his or her experience.
III. FACTORS CONSIDERED IN THE DETERMINATION OF TARGET TOTAL DIRECT COMPENSATIONOur Committee reviews and evaluates our executive compensation levels and practices against those companies of comparable revenue, industry and/or business fit with which we compete for executive talent. These reviews are conducted throughout the year using a variety of methods such as:
• The direct analysis of the proxy statements of other diversified industrial companies (refer to peer group below),
• A review of compensation survey data of other global, diversified industrial companies of similar size published by independent consulting firms,
• A review of customized compensation survey data provided by independent consulting firms, and
• Feedback received from external constituencies.

Ingersoll Rand 2017 Proxy Statement 33
COMPENSATION DISCUSSION AND ANALYSIS
Proxy Statement
The Committee does not rely on a single source of information when making executive compensation decisions. Many of the companies included in these compensation surveys are also included in the S&P 500 Industrials Index referred to in our 2016 Form 10-K under the caption “Performance Graph.”
The Committee, with the assistance of its independent advisor, develops a peer group that it uses to evaluate executive compensation programs and levels. The 2016 peer group is comprised of the following seventeen global diversified industrial companies.
3M Honeywell International Pentair
Cummins, Inc. Illinois Tool Works Rockwell Automation (1)
Danaher Corp Johnson Controls Inc. Stanley Black & Decker
Dover Paccar Inc. TE Connectivity (1)
Eaton plc Parker Hannifin Corp Textron
Emerson Electric PPG Industries Tyco International (1)
(1) The peer group is reviewed annually and is updated periodically to ensure that it appropriately reflects the Company’s size, businesses and complexity. In August of 2016, SPX was removed as a significant portion of their business was spun-off, and Rockwell Automation and TE Connectivity were added. In addition, in September 2016, Tyco International merged with Johnson Controls and therefore, Tyco will be removed from the peer group in 2017.
In assessing the relationship of CEO compensation to compensation of other executive officers (including our NEOs), the Committee considers overall organization structure and scope of responsibility and also reviews the NEOs’ compensation levels relative to the CEO and to one another. This ensures that the target TDC levels are set in consideration of internal equity as well as market references and each executive’s experience, proficiency, performance and potential in performing the duties of his or her role.
The Company conducted a thorough review of the market competitiveness of our executive pay and determined that target long-term incentive opportunities and overall compensation targets for certain executives were below market levels and not fully reflective of the competency that they bring to their roles. Consequently, the Committee approved some increases in 2017 target long-term incentives to set total compensation targets at appropriate market levels. These adjusted long-term incentive targets better reflect the particular executives’ value to the Company and in the marketplace. These increases are summarized in the “2017 Compensation Decisions” section.
IV. ROLE OF THE COMMITTEE, INDEPENDENT ADVISOR AND COMMITTEE ACTIONSOur Committee, which is composed solely of independent directors, oversees our compensation plans and policies, administers our equity-based programs and reviews and approves all forms of compensation relating to our executive officers, including the NEOs.
The Committee exclusively decides the compensation elements and the amounts to be awarded to our CEO. Our CEO does not make any recommendations regarding his own compensation and is not informed of these awards until the decisions have been finalized. Our CEO makes compensation recommendations related to our other NEOs and executive officers. The Committee considers these recommendations when approving the compensation elements and amounts to be awarded to our other NEOs.
Our Committee is responsible for reviewing and approving amendments to our executive compensation and benefit plans. In addition, our Committee is responsible for reviewing our major broad-based employee benefit plans and making recommendations to our Board of Directors for significant amendments to, or termination of, such plans. The Committee’s duties are described in the Committee’s Charter, which is available on our website at www.ingersollrand.com.
Our Committee has the authority to retain an independent advisor for the purpose of reviewing and providing guidance related to our executive compensation and benefit programs. The Committee is directly responsible for the compensation and oversight of the independent advisor. For 2016, the Committee continued to engage Korn Ferry Hay Group, Inc. (“Hay Group”) to serve as its independent compensation advisor. Hay Group also provided the Corporate Governance and Nominating Committee with advice on director compensation matters. The Committee determined that Hay Group is independent and does not have a conflict of interest. In making this determination, the Committee considered the factors adopted by the New York Stock Exchange with respect to independence and conflicts of interest.

34
COMPENSATION DISCUSSION AND ANALYSISPr
oxy
Stat
emen
t
V. COMPENSATION PROGRAM DESCRIPTIONS AND COMPENSATION DECISIONSThe following table provides a summary of the elements, objectives, risk mitigation factors and other key features of our TDC program. Each of these elements is described in detail below:
ElementObjective of Element including Risk Mitigation Factors Key Features Relative to NEOs
Base Salary To provide a sufficient and stable source of cash compensation.
To avoid encouraging excessive risk-taking by ensuring that an appropriate level of cash compensation is not variable.
Adjustments are determined by the Committee based on an evaluation of the NEO’s proficiency in fulfilling his or her responsibilities, as well as performance against key objectives and behaviors.
Base salary represents only 10% of the CEO’s target total direct compensation and only 23%, on average, for the other NEOs.
Annual Incentive Matrix(“AIM”) Program
To serve as an annual cash award tied to the achievement of pre-established performance objectives.
Structured to take into consideration the unique needs of the various businesses.
Amount of compensation earned cannot exceed a maximum payout of 200% of individual target levels and is also subject to a claw-back in the event of a financial restatement.
Each NEO has an AIM target expressed as a percentage of base salary. Targets are set based on the compensation levels of similar jobs in comparable companies, as well as on the NEO’s experience and proficiency level in performing the duties of the role.
Actual AIM payouts are dependent on business and enterprise financial and individual performance. The financial metrics used to determine the awards for 2016 were Revenue, Operating Income, and Cash Flow, modified (up or down) based on Operating Income Margin performance.
AIM represents 16% of the CEO’s target total direct compensation and 21%, on average, for the other NEOs.
Performance ShareProgram (“PSP”)
To serve as a long-term incentive to outperform, on a relative basis, companies in the S&P 500 Industrials Index.
To promote long-term strategic focus and discourage an overemphasis on attaining short-term goals.
Amount earned cannot exceed a maximum payout of 200% of individual target levels and is also subject to a claw-back in the event of a financial restatement.
Performance share units (“PSUs”) granted under the PSP are earned over a 3-year performance period.
The number of PSUs earned is based on relative TSR and relative EPS growth compared to companies within the S&P 500 Industrials Index (with equal weight given to each metric).
Actual value of the PSUs earned depends on our share price at the time of payment.
PSUs represent 37% of the CEO’s target total direct compensation and 28%, on average, for the other NEOs.
Stock Options /Restricted Stock Units(“RSUs”)
Aligns the interests of the NEOs and shareholders.
Awards provide a balance between performance and retention.
Awards are subject to a claw-back in the event of a financial restatement.
Stock options and RSUs are granted annually, with stock options having an exercise price equal to the fair market value of ordinary shares on the date of grant.
Both stock options and RSUs typically vest ratably over three years, at a rate of one-third per year.
Stock options expire on the day immediately preceding the 10th anniversary of the grant date (unless employment terminates sooner).
A balanced mix of stock options and RSUs represent 37% of the CEO’s target total direct compensation and 28%, on average, for the other NEOs.

Ingersoll Rand 2017 Proxy Statement 35
COMPENSATION DISCUSSION AND ANALYSIS
Proxy Statement
BASE SALARYThe table below reflects the base salary adjustments for the NEOs for the 2016 performance period. When determining base salary adjustments, each NEO is evaluated based on their position to the market for their job and on the results achieved and the behaviors demonstrated.
(dollar amounts annualized)2015
($)2016
($)
Percentage Change
(%)
M. W. Lamach 1,300,000 1,300,000 No Change
S. K. Carter 675,000 695,000 3.0%
D. P. M. Teirlinck 685,000 700,000 2.2%
R. G. Zafari 570,000 570,000 No Change
M. J. Avedon 575,000 600,000 4.3%
M. C. Green 525,000 525,000 No Change (1)
(1) Ms. Green was hired on November 2, 2015 and her 2016 base salary was determined at that time.
ANNUAL INCENTIVE MATRIX (“AIM”)The AIM program is an annual cash incentive program designed to reward NEOs for Revenue growth, increases in Operating Income, the delivery of strong Cash Flow and individual contributions to the Company. We believe that our AIM design provides participants with clarity as to how they can earn a cash incentive based on strong performance relative to each metric. The Committee establishes a target award for each NEO that is expressed as a percentage of base salary. Individual AIM payouts are calculated as the product of a financial performance score and an individual performance score, both of which are based on achievement relative to pre-established performance objectives adopted by the Committee. Individual AIM awards are calculated by multiplying individual AIM targets by an AIM Payout Percentage calculated as illustrated below:
Financial Score:Core Financial Metrics x Multiplier =
AdjustedFinancial Score
(0% to 200%) x
IndividualPerformance Score
(0% to 150%) =
AIM PayoutPercentage(0% to 200%)
1/3 Revenue1/3 Operating Income
1/3 Cash Flow
Operating MarginPercent
Financial Score xMultiplier
Performance againstIndividual Objectives
Adjusted FinancialScore x Individual
Performance Score
Regardless of performance, AIM payouts for a NEO cannot exceed an established percentage of Operating Income from continuing operations. See discussion of the Senior Executive Performance Plan (“SEPP”).
Financial Performance
AIM incentive opportunity is tied to pre-established goals for three equally-weighted performance metrics (“Core Financial Metrics”): Revenue, Operating Income, and Cash Flow. These metrics align with the Company’s objectives to profitably grow the businesses, and improve margins through operational efficiency. Threshold performance for each metric must be achieved in order for any incentive to be payable for that metric. The financial AIM payout is the sum of the calculated payout percentage for each metric, adjusted by an Operating Income Margin percentage multiplier (“Multiplier”), which can range from 85% to 115%.
The Committee retains the authority to adjust the Company’s reported financial results for the impact of changes in accounting principles, extraordinary items and unusual or non-recurring gains or losses, including significant differences from the assumptions contained in the financial plan upon which the incentive targets were established. Adjustments to reported financial results are intended to better reflect an executive’s actual performance results, align award payments with decisions which support the plan and strategies, avoid unintended inflation or deflation of awards due to unusual or non-recurring items in the applicable period, and emphasize the Company’s preference for long-term and sustainable growth.

36
COMPENSATION DISCUSSION AND ANALYSISPr
oxy
Stat
emen
t
2016 AIM financial executive compensation performance goals for the NEOs are summarized in the following table:
Pre-Established Financial Targets ($ million) *
RevenueOperating
Income Cash FlowPayout as % of Target **
Operating Income Margin
Operating Income Margin
Multiplier **
Enterprise
Threshold $12,836.9 $1,490.0 $788.8 30% 11.61% 85%
Target $13,512.5 $1,655.6 $986.0 100% 12.25% 100%
Maximum $14,188.1 $1,821.2 $1,183.2 200% 12.84% 115%
Climate Segment
Threshold $9,997.3 $1,326.3 $1,281.8 30% 13.27% 85%
Target $10,523.5 $1,473.7 $1,602.3 100% 14.00% 100%
Maximum $11,049.7 $1,621.1 $1,922.8 200% 14.67% 115%
Industrial Segment
Threshold $2,839.6 $384.3 $352.9 30% 13.53% 85%
Target $2,989.0 $427.0 $441.1 100% 14.29% 100%
Maximum $3,138.5 $469.7 $529.3 200% 14.97% 115%
* Reflects the financial goals for the Enterprise and segments to which incentive opportunity for our 2016 NEOs was tied.
** Results are interpolated between performance levels.
For 2016 AIM purposes, Mr. Lamach, Ms. Carter, Ms. Avedon and Ms. Green were measured on the basis of the Enterprise financial metrics. Messrs. Teirlinck and Zafari were measured based on a combination of Enterprise financial objectives (50% weighting) and their respective 2016 Segment financial objectives (50% weighting). We believe this weighting appropriately focuses segment leaders on achieving the pre-established objectives for their business as well as aligning their interests with Enterprise goals to help deliver sustainable shareholder value.
The table below summarizes 2016 performance relative to performance targets and corresponding 2016 AIM payout levels.
(in millions) Financial TargetsAdjusted Financial
PerformancePayout as a % of Target
Aggregate Payout as % of
Target
Operating Income Margin
MultiplierAIM Financial
Score for 2016
Enterprise
Revenue $13,512.5 $13,287.8 77%
115.65% 92.50% 106.98%Operating Income $1,655.6 $1,585.2 70%
Cash Flow $986.0 $1,323.1 200%
Operating Income Margin 12.25% 11.93% N/A
Climate Segment
Revenue $10,523.5 $10,388.9 82%
113.66% 111.19% 126.38%Operating Income $1,473.7 $1,506.6 122%
Cash Flow $1,602.3 $1,719.5 137%
Operating Income Margin 14.00% 14.50% N/A
Industrial Segment
Revenue $2,989.0 $2,899.0 58%
39.83% 85.00% 33.86%Operating Income $427.0 $317.6 0%
Cash Flow $441.1 $392.8 62%
Operating Income Margin 14.29% 10.96% N/A

Ingersoll Rand 2017 Proxy Statement 37
COMPENSATION DISCUSSION AND ANALYSIS
Proxy Statement
Individual Performance
Individual objectives are established annually and include strategic initiatives as well as financial and non-financial metrics. Each NEO is evaluated based upon actual results against established measures and our leadership competencies. At the end of the fiscal year, the CEO evaluates each NEO’s overall performance against individual objectives and submits a recommendation to the Committee. The Committee evaluates the CEO’s performance against individual objectives. Based on its evaluation of the CEO, and the CEO’s recommendation for other NEOs, the Committee determines the individual performance score for each NEO, which can range from 0% to 150%.
In determining the individual factor for each NEO’s AIM award, the Committee considered pre-established individual performance objectives, including the following:
• Execution of identified key growth initiatives and the development of strategic organizational growth capabilities.
• Successful achievement of milestones to further implement operational excellence, the business operating system, and sustainability initiatives.
• Successful integration of strategic acquisitions.
• Accomplishments to further implement the information technology strategy and system launches.
• Improvements in employee engagement, talent development, retention, and diversity.
Determination of Payout
The actual AIM payout is determined by multiplying the NEO’s target award by the financial performance score and multiplying that result by the individual performance score. AIM payouts cannot exceed 200% of the target award. If the overall AIM payout score is less than 30%, no award is payable. In that event, the CEO, with approval from the Committee, may establish a discretionary pool (equal to 30% of the target payout levels) for top performers and/or other deserving employees in an amount determined to be appropriate based on their performance against objectives. Performance targets are established and results are measured against financial metrics that have been adjusted from our GAAP results as described below.
2016 AIM Revenue, Operating Income and Cash Flow performance goals were set based on 2016 financial plans using foreign currency exchange rates (“FX”) in effect at the time that the plans were established as well as projected FX rates over the course of 2016. In 2016, the U.S. dollar did not strengthen to the degree anticipated when AIM performance goals were established. As a result, there was an unanticipated and unintended favorable impact on business results and AIM payout levels to plan. The Committee used its discretion to adjust performance results to reflect exchange rates used in setting 2016 performance goals. This resulted in a downward adjustment to Revenue, Operating Income and Cash Flow which lowered 2016 AIM payouts.
In addition, the Committee approved adjustments to 2016 performance results for AIM purposes at the enterprise and segment levels to (a) offset the impact of the sale of the Company’s minority interest in Hussmann, (b) exclude unplanned costs associated with benefit program changes related to prior service years, (c) exclude product enhancement, development and IT investment costs that were not included in the 2016 plan, (d) exclude unplanned costs associated with discontinued business entities and production operations as well as the transfer of production operations to other facilities, and (e) exclude unplanned costs incurred to reposition existing contracts to meet new Energy Efficient Commercial Building standards. These events and the related financial impact had not been contemplated when the 2016 performance goals and plan were determined. In addition, the financial impact of certain contracts were excluded from 2016 performance results as those contracts had been excluded from 2016 goals when they were established. All of the above financial adjustments were also reviewed with the Audit Committee prior to approval by the Compensation Committee.
The Committee approved the following AIM awards for NEOs based on achieving both the 2016 financial and individual objectives:
Name AIM Target AIM Financial Score for 2016 Individual Performance Score AIM Award for 2016
M. W. Lamach 160% of $1,300,000 106.98% 112.35% $2,500,000
S. K. Carter 100% of $695,000 106.98% 110% $817,862
D. P. M. Teirlinck 95% of $700,000 116.68% 105% $814,718
R. G. Zafari 85% of $570,000 70.42% 105% $358,244
M. J. Avedon 85% of $600,000 106.98% 110% $600,158
M. C. Green 80% of $525,000 106.98% 110% $494,248
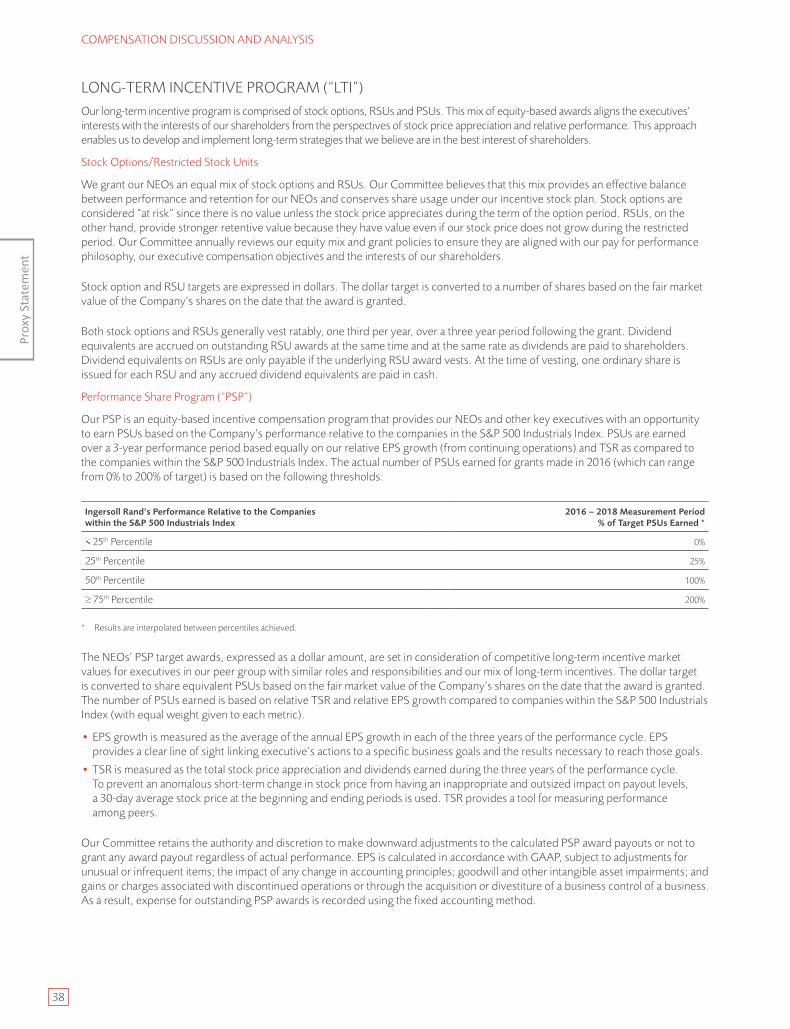
38
COMPENSATION DISCUSSION AND ANALYSISPr
oxy
Stat
emen
t
LONG-TERM INCENTIVE PROGRAM (“LTI”)Our long-term incentive program is comprised of stock options, RSUs and PSUs. This mix of equity-based awards aligns the executives’ interests with the interests of our shareholders from the perspectives of stock price appreciation and relative performance. This approach enables us to develop and implement long-term strategies that we believe are in the best interest of shareholders.
Stock Options/Restricted Stock Units
We grant our NEOs an equal mix of stock options and RSUs. Our Committee believes that this mix provides an effective balance between performance and retention for our NEOs and conserves share usage under our incentive stock plan. Stock options are considered “at risk” since there is no value unless the stock price appreciates during the term of the option period. RSUs, on the other hand, provide stronger retentive value because they have value even if our stock price does not grow during the restricted period. Our Committee annually reviews our equity mix and grant policies to ensure they are aligned with our pay for performance philosophy, our executive compensation objectives and the interests of our shareholders.
Stock option and RSU targets are expressed in dollars. The dollar target is converted to a number of shares based on the fair market value of the Company’s shares on the date that the award is granted.
Both stock options and RSUs generally vest ratably, one third per year, over a three year period following the grant. Dividend equivalents are accrued on outstanding RSU awards at the same time and at the same rate as dividends are paid to shareholders. Dividend equivalents on RSUs are only payable if the underlying RSU award vests. At the time of vesting, one ordinary share is issued for each RSU and any accrued dividend equivalents are paid in cash.
Performance Share Program (“PSP”)
Our PSP is an equity-based incentive compensation program that provides our NEOs and other key executives with an opportunity to earn PSUs based on the Company’s performance relative to the companies in the S&P 500 Industrials Index. PSUs are earned over a 3-year performance period based equally on our relative EPS growth (from continuing operations) and TSR as compared to the companies within the S&P 500 Industrials Index. The actual number of PSUs earned for grants made in 2016 (which can range from 0% to 200% of target) is based on the following thresholds:
Ingersoll Rand’s Performance Relative to the Companies within the S&P 500 Industrials Index
2016 – 2018 Measurement Period % of Target PSUs Earned *
< 25th Percentile 0%
25th Percentile 25%
50th Percentile 100%
≥ 75th Percentile 200%
* Results are interpolated between percentiles achieved.
The NEOs’ PSP target awards, expressed as a dollar amount, are set in consideration of competitive long-term incentive market values for executives in our peer group with similar roles and responsibilities and our mix of long-term incentives. The dollar target is converted to share equivalent PSUs based on the fair market value of the Company’s shares on the date that the award is granted. The number of PSUs earned is based on relative TSR and relative EPS growth compared to companies within the S&P 500 Industrials Index (with equal weight given to each metric).
• EPS growth is measured as the average of the annual EPS growth in each of the three years of the performance cycle. EPS provides a clear line of sight linking executive’s actions to a specific business goals and the results necessary to reach those goals.
• TSR is measured as the total stock price appreciation and dividends earned during the three years of the performance cycle. To prevent an anomalous short-term change in stock price from having an inappropriate and outsized impact on payout levels, a 30-day average stock price at the beginning and ending periods is used. TSR provides a tool for measuring performance among peers.
Our Committee retains the authority and discretion to make downward adjustments to the calculated PSP award payouts or not to grant any award payout regardless of actual performance. EPS is calculated in accordance with GAAP, subject to adjustments for unusual or infrequent items; the impact of any change in accounting principles; goodwill and other intangible asset impairments; and gains or charges associated with discontinued operations or through the acquisition or divestiture of a business control of a business. As a result, expense for outstanding PSP awards is recorded using the fixed accounting method.

Ingersoll Rand 2017 Proxy Statement 39
COMPENSATION DISCUSSION AND ANALYSIS
Proxy Statement
Dividend equivalents are accrued on outstanding PSU awards at the same time and at the same rate as dividends paid to shareholders. Dividend equivalents are only paid upon vesting on the number of PSUs actually earned and vested. Dividend equivalents are payable in cash at the time the associated PSUs are distributed unless the NEO elected to defer the PSUs into our executive deferred compensation plan, in which case the dividends are also deferred.
2016 EQUITY AWARDSIn 2016, the Committee approved the PSU, stock option and RSU awards based on its evaluation of market competitiveness and each NEO’s sustained individual performance and demonstrated potential to impact future business results. The values in the table below reflect equity-based awards approved by the Committee. These values differ from the corresponding values reported in the Summary Compensation Table and the Grants of Plan-Based Awards Table due to different methodologies used in assigning the economic value of equity-based awards required for accounting and proxy statement reporting purposes. The Committee makes equity award decisions based on grant date expected value while the accounting and proxy statement values are determined in accordance with GAAP requirements. The difference between the two methodologies is most significant for the PSU awards which are earned, in part, based on TSR performance relative to the S&P 500 Industrials Index over a three-year performance period which requires valuations to take into account the expected payout distribution from 0-200% of target for accounting and proxy statement purposes.
Name
Stock Option Award
($)RSU Award
($)
Target Value 2016-18 PSU Award
($)
M. W. Lamach 2,375,000 2,375,000 4,750,000
S. K. Carter 500,000 500,000 1,000,000
D. P. M. Teirlinck 462,500 462,500 925,000
R. G. Zafari 325,000 325,000 650,000
M. J. Avedon 300,000 300,000 600,000
M. C. Green 312,500 312,500 625,000
2014 – 2016 PERFORMANCE SHARE UNITS PAYOUTAs discussed above, PSUs for the three-year 2014 - 2016 performance period were earned based on the Company’s EPS growth (from continuing operations) and TSR performance relative to all of the companies in the S&P 500 Industrials Index.
• EPS growth is measured as the average of the annual EPS growth in each of the three years of the performance cycle. The rate of EPS growth was 15.6% for the 2014 to 2016 period, which ranked at the 85th percentile of the companies in the S&P 500 Industrials Index. 2014 EPS growth was calculated based on 2013 EPS excluding the residential and commercial security business spin-off to form Allegion.
• TSR is measured as the total stock price appreciation plus dividends earned during the three years of the performance cycle. To account for stock price volatility, a 30-day average stock price at the beginning and ending periods is used. TSR was 37.78% for the 2014 to 2016 period, which ranked at the 56th percentile of the companies in the S&P 500 Industrials Index.
PSUs for the 2014 to 2016 performance cycle paid achieved 162% of target levels as summarized in the table below.
Performance MetricIngersoll Rand
PerformancePercentile
RankMetric Payout Weighting
Payout Level
Relative EPS Growth 15.60% 85th 200% 50% 100%
Relative TSR 37.78% 56th 124% 50% 62%
Total Award Payout Percentage: 162%

40
COMPENSATION DISCUSSION AND ANALYSISPr
oxy
Stat
emen
t
2017 COMPENSATION DECISIONSThe Committee annually reviews the total direct compensation for each NEO and, using its discretion based on its compensation philosophy and design principles, may revise such compensation. For 2017, the Committee has set the base salary and target AIM award for each NEO as follows:
NameBase Salary
($) Change From 2016 Target AIM Award
M. W. Lamach 1,350,000 3.8% 160%
S. K. Carter 720,000 3.6% 100%
D. P. M. Teirlinck 725,000 3.6% 95%
R. G. Zafari 590,000 3.5% 85%
M. J. Avedon 625,000 4.2% 85%
M. C. Green 550,000 4.8% 80%
The Committee established the following target long-term incentives including PSU awards for the 2017 - 2019 performance period and granted the following stock option and RSU awards for each NEO in 2017:
Name
Target 2017 Long-Term
Incentive Value ($) (1)
Shares Underlying Stock Option
Awards (#) (2)
RSU Shares (#) (3)
Target 2017-19 PSU Shares
(#) (3)
M. W. Lamach 9,750,000 180,958 30,391 60,782
S. K. Carter 2,430,000 45,101 7,575 15,149
D. P. M. Teirlinck 2,485,000 46,122 7,746 15,492
R. G. Zafari 1,360,000 25,242 4,240 8,479
M. J. Avedon 1,545,000 28,675 4,816 9,632
M. C. Green 1,440,000 26,727 4,489 8,977
(1) The target long-term incentive value is delivered 25% in stock options, 25% in RSUs and 50% in PSUs. These target values reflect increases made in 2017 to better reflect the particular executive’s value to the Company and in the marketplace.
(2) The number of stock options was determined based on the Black-Scholes ratio on December 31, 2016 and the fair market value of our ordinary shares on the date of grant.
(3) The number of RSUs and target PSUs were determined using the fair market value of our ordinary shares on the date of grant.
VI. OTHER COMPENSATION AND TAX MATTERSRETIREMENT PROGRAMS AND OTHER BENEFITSWe maintain qualified and nonqualified defined benefit pension plans for our employees, including the NEOs, to provide for fixed benefits upon retirement based on the individual’s age and number of years of service. These plans include the Pension Plan, the Supplemental Pension Plan and our supplemental executive retirement plans (the Elected Officer Supplemental Pension (“EOSP”) or the Key Management Supplemental Pension (“KMP”) programs). Refer to the Pension Benefits table and accompanying narrative for additional details on these programs.
We offer a qualified defined contribution (401(k)) plan called the Ingersoll-Rand Company Employee Savings Plan (the “ESP”) to our salaried non-union and hourly U.S. workforce, including the NEOs. The ESP is a plan that provides a dollar-for-dollar Company match on the first six percent of the employee’s eligible compensation that the employee contributes to the ESP. The ESP has a number of investment options and is an important component of our retirement program.
We also have a nonqualified defined contribution plan. The Ingersoll-Rand Company Supplemental Employee Savings Plan (the “Supplemental ESP”) is an unfunded plan that makes up matching contributions that cannot be made to the ESP due to Internal Revenue Code limitations. Supplemental ESP balances are deemed to be invested in the funds selected by the NEOs, which are the same funds available in the ESP except for a self-directed brokerage account, which is not available in the Supplemental ESP.

Ingersoll Rand 2017 Proxy Statement 41
COMPENSATION DISCUSSION AND ANALYSIS
Proxy Statement
In June 2012, our Board of Directors approved significant changes to our broad-based, qualified retirement programs with the intent to move employees from a combined defined benefit/defined contribution approach to a fully defined contribution plan approach over time. Employees active prior to July 1, 2012 were given a choice between continuing to participate in the defined benefit plan until December 31, 2022, or moving to an enhanced version of the ESP effective January 1, 2013. Employees hired or rehired on or after July 1, 2012 were automatically covered under the enhanced version of the ESP. Under the enhanced version of the ESP, employees will receive a basic employer contribution equal to two percent of eligible compensation in addition to the Company’s matching contribution while ceasing to accrue benefits under the defined benefit plan (employees of our Club Car business are generally not eligible for the basic employer contribution). Effective as of December 31, 2022, accruals in the defined benefit plan will cease for all employees. The Committee approved corresponding changes to the applicable nonqualified defined benefit and contribution pension plans. Additional details on the changes can be found in the narrative accompanying the Pension Benefits table.
Our Ingersoll Rand Executive Deferred Compensation Plan (the “EDCP Plan”) allows eligible employees to defer receipt of a part of their annual salary, AIM award and/or PSP award in exchange for investments in ordinary shares or mutual fund investment equivalents. Refer to the Nonqualified Deferred Compensation table for additional details on the EDCP Plan.
We provide an enhanced, long-term disability plan to certain executives. The plan supplements the broad-based group plan and provides an additional monthly maximum benefit if the executive elects to purchase supplemental coverage under the group plan. It has an underlying individual policy that is portable when the executive terminates.
We provide our NEOs with other benefits that we believe are consistent with prevailing market practice and those of our peer companies. These other benefits and their incremental cost to the Company are reported in “All Other Compensation” shown in the Summary Compensation Table.
SEVERANCE ARRANGEMENTSIn connection with external recruiting of certain officers, we generally enter into employment arrangements that provide for severance payments upon certain termination events, other than in the event of a change in control (which is covered by separate agreements with the officers). Mr. Lamach, Ms. Carter and Ms. Avedon have such arrangements. In 2012, we adopted a Severance Plan, amended outstanding award agreements and adopted new equity award agreements to provide certain employees, including our NEOs, with certain benefits in the event of a termination of employment without cause or for good reason under a Major Restructuring (as defined in the Post-Employment Section below). Although we do not have a formal severance policy for our executives (other than in the event of a Major Restructuring), we do have guidelines that in most cases would provide for severance in the event of termination without cause. The severance payable under employment agreements for Mr. Lamach, Ms. Carter and Ms. Avedon and the benefits available in connection with a Major Restructuring and under the severance guidelines are further described in the Post-Employment Benefits section of the proxy statement.
CHANGE-IN-CONTROL PROVISIONSWe have entered into change-in-control agreements with our NEOs. Payments are subject to a “double trigger”, meaning that payments would be received only if an officer is terminated without cause or resigns for “good reason” within two years following a change in control. We provide change-in-control agreements to our NEOs to focus them on the best interests of shareholders and assure continuity of management in circumstances that reduce or eliminate job security and might otherwise lead to accelerated departures. Our incentive stock plans provide for the accelerated vesting of outstanding stock awards in the event of a change in control of the Company. Refer to the Post-Employment Benefits section of this proxy statement for a more detailed description of the change-in-control provisions.
TAX AND ACCOUNTING CONSIDERATIONSSection 162(m) of the Code imposes a limit of $1,000,000 on the amount that we may deduct for federal income tax purposes in any one year for compensation paid to our CEO and any of our three other highest-paid NEOs, other than our CFO, who are employed as of the end of the year. However, to the extent compensation is “performance-based” within the meaning of Section 162(m), the Section’s limitations will not apply. We intend most of the variable compensation (i.e., AIM, PSP and stock options) paid to NEOs to qualify as performance-based within the meaning of Section 162(m) so as to be tax deductible by us, which benefits our shareholders. In order to qualify as performance based, the compensation must, among other things, be paid pursuant to a shareholder approved plan upon the attainment of objective performance criteria.

42
COMPENSATION DISCUSSION AND ANALYSISPr
oxy
Stat
emen
t
Our Committee believes that tax deductibility of compensation is an important factor, but not the sole factor, in setting executive compensation policies and in rewarding superior executive performance. Accordingly, although our Committee generally intends to avoid the loss of a tax deduction due to Section 162(m), it reserves the right, in circumstances it deems appropriate in its sole discretion, to pay amounts that are not deductible.
In determining variable compensation programs, we consider other tax and accounting implications of particular forms of compensation, such as the implications of Section 409A of the Code governing deferred compensation arrangements and favorable accounting treatment afforded certain equity based plans that are settled in shares. However, the forms of variable compensation we utilize are determined primarily by their effectiveness in creating maximum alignment with our key strategic objectives and the interests of our shareholders.
SENIOR EXECUTIVE PERFORMANCE PLAN (“SEPP”)The SEPP is a shareholder approved plan that funds the annual cash incentive awards that may be granted to each of the NEOs. Under the SEPP, the maximum amount of cash incentive that can be paid to the CEO is 0.6% of Consolidated Operating Income from Continuing Operations (as defined in the SEPP) and the maximum amount of cash incentive that can be paid to any other covered executive is 0.3% of Consolidated Operating Income from Continuing Operations. Our Committee generally exercises its discretion to pay less than the maximum amount to the NEOs, after considering the factors described in the AIM Program.
TIMING OF AWARDSThe Committee generally grants our regular annual equity awards after the annual earnings release. The grant date is never selected or changed to increase the value of equity awards for executives.
CLAW-BACK/RECOUPMENT POLICYTo further align the interests of our employees and our shareholders, we have a claw-back/recoupment policy to ensure that any fraud or intentional misconduct leading to a restatement of our financial statements would be properly addressed. The policy provides that if it is found that an employee committed fraud or engaged in intentional misconduct that resulted, directly or indirectly, in a need to restate our financial statements, then our Committee has the discretion to direct the Company to recover all or a portion of any cash or equity incentive compensation paid or value realized, and/or to cancel any stock-based awards or AIM award granted to an employee on or after the effective date of the policy. Our Committee may also request that the Company seek to recover any gains realized on or after the effective date of the policy for equity or cash awards made prior to that date (including AIM, stock options, PSUs and RSUs). Application of the claw-back/recoupment policy is subject to a determination by our Committee that: (i) the cash incentive or equity compensation to be recouped was calculated on, or its realized value affected by, the financial results that were subsequently restated; (ii) the cash incentive or equity award would have been less valuable than what was actually awarded or paid based on the application of the correct financial results; and (iii) the employee to whom the policy applied engaged in fraud or intentional misconduct. This policy will be revised if required under the Dodd-Frank Act if and when final regulations implementing the claw-back policy requirements of that law have been adopted.
SHARE-OWNERSHIP GUIDELINESWe impose share ownership requirements on each of our officers. These share ownership requirements are designed to emphasize share ownership by our officers and to further align their interests with our shareholders. Each officer must achieve and maintain ownership of ordinary shares or ordinary share equivalents at or above a prescribed level. The requirements are as follows:
Position
Number of Active Participants as of the Record Date
Individual Ownership Requirement (Shares
and Equivalents)
Chief Executive Officer 1 150,000
Executive Vice Presidents 2 75,000
Senior Vice Presidents 6 40,000
Corporate Vice Presidents 7 15,000

Ingersoll Rand 2017 Proxy Statement 43
COMPENSATION DISCUSSION AND ANALYSIS
Proxy Statement
Based on the closing stock price on the record date of $83.65, this equates to an ownership requirement of approximately 9x for the CEO and the Executive Vice Presidents, and in excess of 5x for the Senior Vice Presidents. These ownership requirements have been achieved with actual ownership exceeding these levels: the CEO at over 19x base salary, the Executive Vice Presidents at over 11x base salary on average, and the Senior Vice Presidents at over 8x base salary on average.
Our share-ownership program requires the accumulation of ordinary shares (or ordinary share equivalents) over a five-year period following the date the person becomes subject to share-ownership requirements at the rate of 20% of the required level each year. Executives who are promoted, and who have their ownership requirement increased, have three years to achieve the new level from the date of promotion. Given the significant increase in the ownership requirement for an individual who is promoted to CEO, EVP or SVP, those individuals have five years from the date of the promotion to achieve the new level. Ownership credit is given for actual ordinary shares owned, deferred compensation that is invested in ordinary shares within our EDCP Plan, ordinary share equivalents accumulated in our qualified and nonqualified employee savings plans as well as unvested RSUs. Stock options, SARs and unvested PSUs do not count toward meeting the share-ownership target. If executives fall behind their scheduled accumulation level during their applicable accumulation period, or if they fail to maintain their required level of ownership after their applicable accumulation period, their right to exercise stock options will be limited to “buy and hold” transactions and any shares received upon the vesting of RSU and PSU awards must be held until the required ownership level is achieved. As of the Record Date, all of our executives subject to the share-ownership guidelines were in compliance with these requirements.
COMPENSATION COMMITTEE REPORT
We have reviewed and discussed with management the Compensation Discussion and Analysis contained in this Proxy Statement. Based on our review and discussion, we recommended to the Board of Directors that the Compensation Discussion and Analysis be included in this Proxy Statement as well as the Company’s Annual Report on Form 10-K for the year ended December 31, 2016.
COMPENSATION COMMITTEE
Tony L. White (Chair)
John Bruton
Jared L. Cohon
Gary D. Forsee
Constance J. Horner
COMPENSATION DISCUSSION AND ANALYSIS

44
Prox
y St
atem
ent
SUMMARY OF REALIZED COMPENSATION
The table below is a summary of the compensation actually realized by our CEO for 2016, 2015 and 2014. This information is intended as a supplement to and not as a substitute for the information shown on the Summary Compensation Table. The information required to be shown on the Summary Compensation Table includes elements of compensation that may or may not actually be realized by the NEOs at a future date. We believe this table enhances our shareholders’ understanding of our CEO’s compensation.
YearSalary
($)
Performance-based Cash Compensation
($) (1)
EquityCompensation
($) (2)
OtherCompensation
($) (3)
Total Realized Compensation
($)
2016 $1,300,000 $2,020,000 $17,343,821 $369,310 $21,033,131
2015 $1,287,500 $2,048,200 $23,865,069 $377,312 $27,578,081
2014 $1,250,000 $2,650,000 $15,106,336 $394,328 $19,400,664
(1) Represents the AIM award paid in the applicable year and earned in the immediately previous year.
(2) Represents amount realized upon the exercise of stock options and the vesting of RSUs and PSUs, before payment of applicable withholding taxes and brokerage commissions, and includes the value of dividend equivalents paid on such awards. For 2016, this includes the following amounts from stock options exercised, RSUs vesting and PSUs earned:
Value RealizedTotal Shareholder Return (“TSR”)
Over the Period Outstanding *
Stock Options Exercised:February 16, 2010 Grant $5,317,120 TSR for 2010 - 2016 was 166%
Restricted Stock Unit Vesting:February 22, 2013 GrantFebruary 25, 2014 GrantFebruary 3, 2015 GrantTotal:
$922,775$718,596$566,301
$2,207,672
TSR for 2013 - 2016 was 96%TSR for 2014 - 2016 was 28%TSR for 2015 - 2016 was 22%
Performance Stock Units Earned:2013-2015 Performance Period $9,264,900 TSR for 2013 - 2015 was 52%
* TSR calculated using closing stock price at the beginning and end of each period.
(3) Represents the amounts imputed as income under applicable IRS rules and regulations.
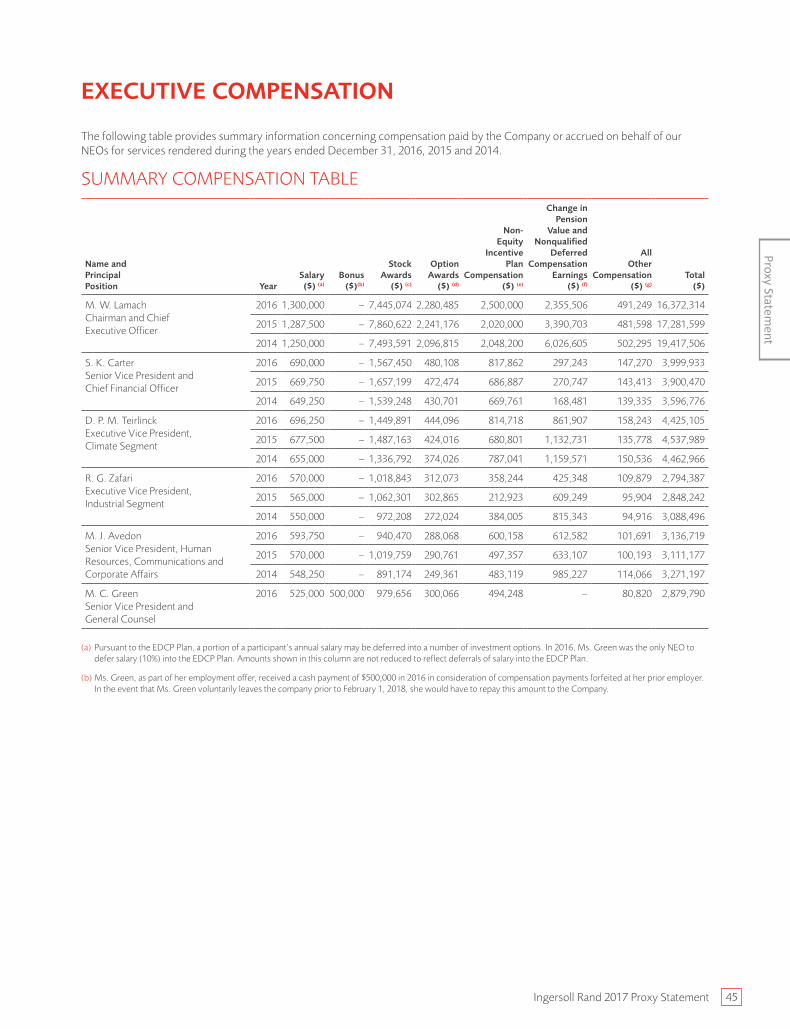
Ingersoll Rand 2017 Proxy Statement 45
Proxy Statement
EXECUTIVE COMPENSATION
The following table provides summary information concerning compensation paid by the Company or accrued on behalf of our NEOs for services rendered during the years ended December 31, 2016, 2015 and 2014.
SUMMARY COMPENSATION TABLE
Name and Principal Position Year
Salary ($) (a)
Bonus ($)(b)
Stock Awards
($) (c)
Option Awards
($) (d)
Non- Equity
Incentive Plan
Compensation ($) (e)
Change in Pension
Value and Nonqualified
Deferred Compensation
Earnings ($) (f)
All Other
Compensation ($) (g)
Total ($)
M. W. Lamach Chairman and Chief Executive Officer
2016 1,300,000 – 7,445,074 2,280,485 2,500,000 2,355,506 491,249 16,372,314
2015 1,287,500 – 7,860,622 2,241,176 2,020,000 3,390,703 481,598 17,281,599
2014 1,250,000 – 7,493,591 2,096,815 2,048,200 6,026,605 502,295 19,417,506
S. K. Carter Senior Vice President and Chief Financial Officer
2016 690,000 – 1,567,450 480,108 817,862 297,243 147,270 3,999,933
2015 669,750 – 1,657,199 472,474 686,887 270,747 143,413 3,900,470
2014 649,250 – 1,539,248 430,701 669,761 168,481 139,335 3,596,776
D. P. M. Teirlinck Executive Vice President, Climate Segment
2016 696,250 – 1,449,891 444,096 814,718 861,907 158,243 4,425,105
2015 677,500 – 1,487,163 424,016 680,801 1,132,731 135,778 4,537,989
2014 655,000 – 1,336,792 374,026 787,041 1,159,571 150,536 4,462,966
R. G. Zafari Executive Vice President, Industrial Segment
2016 570,000 – 1,018,843 312,073 358,244 425,348 109,879 2,794,387
2015 565,000 – 1,062,301 302,865 212,923 609,249 95,904 2,848,242
2014 550,000 – 972,208 272,024 384,005 815,343 94,916 3,088,496
M. J. Avedon Senior Vice President, Human Resources, Communications and Corporate Affairs
2016 593,750 – 940,470 288,068 600,158 612,582 101,691 3,136,719
2015 570,000 – 1,019,759 290,761 497,357 633,107 100,193 3,111,177
2014 548,250 – 891,174 249,361 483,119 985,227 114,066 3,271,197
M. C. Green Senior Vice President and General Counsel
2016 525,000 500,000 979,656 300,066 494,248 – 80,820 2,879,790
(a) Pursuant to the EDCP Plan, a portion of a participant’s annual salary may be deferred into a number of investment options. In 2016, Ms. Green was the only NEO to defer salary (10%) into the EDCP Plan. Amounts shown in this column are not reduced to reflect deferrals of salary into the EDCP Plan.
(b) Ms. Green, as part of her employment offer, received a cash payment of $500,000 in 2016 in consideration of compensation payments forfeited at her prior employer. In the event that Ms. Green voluntarily leaves the company prior to February 1, 2018, she would have to repay this amount to the Company.

46
Prox
y St
atem
ent
EXECUTIVE COMPENSATION
(c) The amounts in this column reflect the aggregate grant date fair value of PSU awards and any RSU awards granted for the year under Financial Accounting Standards Board (FASB) Accounting Standards Codification (ASC) Topic 718 and do not reflect amounts paid to or realized by the NEOs. For a discussion of the assumptions made in determining the ASC 718 values see Note 12, “Share-Based Compensation,” to the Company’s consolidated financial statements contained in its 2016 Form 10-K. The ASC grant date fair value of the PSU award is spread over the number of months of service required for the grant to become non-forfeitable, disregarding any adjustments for potential forfeitures. In determining the aggregate grant date fair value of the PSU awards, the awards are valued assuming target level performance achievement. If the maximum level performance achievement is assumed, the aggregate grant date fair value of the PSU awards would be as follows:
Name
Maximum Grant Date Value of 2016-18 PSU Awards
($)
M. W. Lamach 10,140,111
S. K. Carter 2,134,850
D. P. M. Teirlinck 1,974,736
R. G. Zafari 1,387,653
M. J. Avedon 1,280,910
M. C. Green 1,334,281
(d) The amounts in this column reflect the aggregate grant date fair value of stock option grants for financial reporting purposes for the year under ASC 718 and do not reflect amounts paid to or realized by the NEOs. For a discussion of the assumptions made in determining the ASC 718 values see Note 12, “Share-Based Compensation,” to the Company’s consolidated financial statements contained in its 2016 Form 10-K. Please see “2016 Grants of Plan-Based Awards” and “Outstanding Equity Awards at December 31, 2016” for additional detail.
(e) This column reflects the amounts earned as annual awards under the AIM program. Unless deferred into the EDCP Plan, AIM program payments are made in cash. In 2016, Mr. Zafari and Ms. Green elected to defer a percentage (15% and 20% respectively) of their AIM awards into the EDCP Plan. Amounts shown in this column are not reduced to reflect deferrals of AIM awards into the EDCP Plan.
(f) Amounts reported in this column reflect the aggregate increase in the actuarial present value of the benefits under the qualified Ingersoll Rand Pension Plan Number One (the “Pension Plan”), Supplemental Pension Plan, the KMP and EOSP, as applicable. The change in pension benefits value is attributable to the additional year of service and age, the annual AIM award and any annual salary increase. Amounts are higher for those NEOs who are older and closer to retirement than for those who are younger and further from retirement since the period over which the benefit is discounted to determine its present value for an older NEO is shorter and the impact of discounting is therefore reduced. Ms. Green does not participate in any of these plans and therefore no value is shown for her.
Other external factors, outside the influence of the plan design, also impact the values shown in this column. For all the NEOs, the amounts in this column for 2014 through 2016 were impacted by decreasing interest rates (rates for ten-year Constant Maturities for US Treasury Securities), which cause the value of the lump sum distributions under the EOSP and the KMP to increase. In addition, beginning in 2014, amounts for all NEOs were impacted by a change to the applicable mortality table as defined by the Internal Revenue Code that is used to estimate life expectancy.
There was no above market interest earned by the NEOs in any year.
(g) The following table summarizes the components of this column for fiscal year 2016:
Name
CompanyContributions
($) (1)
CompanyCost for
LifeInsurance
($)
Company Costfor Long Term
Disability($)
Tax Assistance($) (2)
Other Benefits($) (3)
Total($)
M. W. Lamach 199,200 3,450 1,285 118,563 168,751 491,249
S. K. Carter 110,151 3,225 2,262 – 31,632 147,270
D. P. M. Teirlinck 82,623 5,029 2,528 319 67,744 158,243
R. G. Zafari 46,975 2,683 2,029 80 58,112 109,879
M. J. Avedon 65,466 2,709 1,824 – 31,692 101,691
M. C. Green 42,000 3,762 1,477 – 33,581 80,820
(1) Represents Company contributions under the Company’s ESP and Supplemental ESP plans.
(2) The amount for Mr. Lamach represents tax equalization payments related to Irish taxes owed on $315,000, which is the portion of his income that is allocated to his role as a director of the Company. Without these payments, Mr. Lamach would be subject to double taxation on this amount since he is already paying U.S. taxes on this income. The amount for Messrs. Teirlinck and Zafari represent payments of taxes on their behalf related to Company contributions made to the Belgium social scheme.

Ingersoll Rand 2017 Proxy Statement 47
Proxy Statement
EXECUTIVE COMPENSATION
(3) For Mr. Lamach, this amount includes the incremental cost to the Company of personal use of the Company aircraft (whether leased or owned) by the CEO. For security and safety reasons and to maximize his availability for Company business, the Board of Directors requires the CEO to travel on Company-provided aircraft for business and personal purposes, unless commercial travel is deemed a minimal security risk by the Company. The incremental cost to the Company of personal use of the aircraft is calculated: (i) by taking the hourly average variable operating costs to the Company (including fuel, maintenance, on board catering and landing fees) multiplied by the amount of time flown for personal use in the case of leased aircraft; and (ii) by multiplying the flight time by a variable fuel charge and the average fuel price per gallon and adding any ground costs such as landing and parking fees as well as crew charges for travel expenses in the case of the Company owned aircraft. Both methodologies exclude fixed costs that do not change based on usage, such as pilots’ and other employees’ salaries, management fees and training, hangar and insurance expenses. We impose an annual limit of $150,000 on the CEO’s non-business use of Company-provided aircraft. For 2016, the amount for Mr. Lamach includes $122,318 for personal use of Company-provided aircraft. Under the Company’s aircraft use policy, the Compensation Committee has determined that business use includes travel that is related to the Company’s business or benefits the Company, such as travel to meetings of other boards on which the CEO sits. For 2016, the amount for Mr. Lamach includes $13,630 for such business-related travel.
These amounts also include: (i) the following incremental cost of the Company-leased cars, calculated based on the lease, insurance, fuel and maintenance costs to the Company: Mr. Lamach, $19,709; Ms. Carter $18,547; Mr. Teirlinck, $24,006; Mr. Zafari, $21,847; Ms. Avedon, $18,530; and Ms. Green, $18,188; (ii) the following costs for financial counseling services, which may include tax preparation and estate planning services: Mr. Lamach, $11,034; Ms. Carter $8,485; Mr. Teirlinck, $29,932; Mr. Zafari, $31,098; Ms. Avedon $9,742; and Ms. Green $11,000; (iii) the following costs for medical services provided through an on-site physician under the Executive Health Program: Mr. Lamach, $925; Ms. Carter, $2,655; Mr. Teirlinck, $558; Mr. Zafari, $1,856; Ms. Avedon $3,420 and Ms. Green, $4,393; (iv) the payments of $13,248 and $3,311 to permit Messrs. Teirlinck and Zafari to remain covered under the Belgium social scheme and have access to the country’s health plan should they return to Europe; and (v) the following amounts for product rebates that are available to all U.S. employees: Mr. Lamach, $1,135 and Ms. Carter, $1,945.

48
Prox
y St
atem
ent
EXECUTIVE COMPENSATION
2016 GRANTS OF PLAN-BASED AWARDSThe following table shows all plan-based awards granted to the NEOs during fiscal 2016. This table is supplemental to the Summary Compensation Table and is intended to complement the disclosure of equity awards and grants made under non-equity incentive plans in the Summary Compensation Table.
Estimated Future Payouts Under Non-Equity Plan Awards
Estimated Future Payouts Under Equity Incentive Plan
Awards
All Other Stock
Awards: Number of
Shares of Stock or
Units(#) (c)
All Other Option
Awards: Number of Securities
Underlying Options
(#) (c)
Exercise or Base Price of Option
Awards($/Sh) (d)
Grant Date Fair Value of Stock
and Option Awards
($) (e)
Threshold Target Maximum Threshold Target Maximum
Name Grant Date ($) (a) ($) (a) ($) (a) (#) (b) (#) (b) (#) (b)
M. W. Lamach
AIM 2/2/2016 624,000 2,080,000 4,160,000 – – – – – – –
PSUs (2016-18) 2/10/2016 – – – 23,749 94,996 189,992 – – – 5,070,055
Options 2/10/2016 – – – – – – – 242,347 50.0025 2,280,485
RSUs 2/10/2016 – – – – – – 47,498 – – 2,375,019
S. K. Carter
AIM 2/2/2016 208,500 695,000 1,390,000 – – – – – – –
PSUs (2016-18) 2/10/2016 – – – 5,000 20,000 40,000 – – – 1,067,425
Options 2/10/2016 – – – – – – – 51,021 50.0025 480,108
RSUs 2/10/2016 – – – – – – 10,000 – – 500,025
D. P. M. Teirlinck
AIM 2/2/2016 199,500 665,000 1,330,000 – – – – – – –
PSUs (2016-18) 2/10/2016 – – – 4,625 18,500 37,000 – – – 987,368
Options 2/10/2016 – – – – – – – 47,194 50.0025 444,096
RSUs 2/10/2016 – – – – – – 9,250 – – 462,523
R. G. Zafari
AIM 2/2/2016 145,350 484,500 969,000 – – – – – – –
PSUs (2016-18) 2/10/2016 – – – 3,250 13,000 26,000 – – – 693,826
Options 2/10/2016 – – – – – – – 33,164 50.0025 312,073
RSUs 2/10/2016 – – – – – – 6,500 – – 325,016
M. J. Avedon
AIM 2/2/2016 153,000 510,000 1,020,000 – – – – – – –
PSUs (2016-18) 2/10/2016 – – – 3,000 12,000 24,000 – – – 640,455
Options 2/10/2016 – – – – – – – 30,613 50.0025 288,068
RSUs 2/10/2016 – – – – – – 6,000 – – 300,015
M. C. Green
AIM 2/2/2016 126,000 420,000 840,000 – – – – – – –
PSUs (2016-18) 2/10/2016 – – – 3,125 12,500 25,000 – – – 667,141
Options 2/10/2016 – – – – – – – 31,888 50.0025 300,066
RSUs 2/10/2016 – – – – – – 6,250 – – 312,516
(a) The target award levels established for the AIM program are established annually in February and are expressed as a percentage of the NEO’s base salary. Refer to Compensation Discussion and Analysis under the heading “Annual Incentive Matrix Program” for a description of the Compensation Committee’s process for establishing AIM program target award levels. The amounts reflected in the “Estimated Future Payouts Under Non-Equity Incentive Plan Awards” columns represent the threshold, target and maximum amounts for awards under the AIM program that were paid in February 2017, based on performance in 2016. Thus, the amounts shown in the “threshold,” “target” and “maximum” columns reflect the range of potential payouts when the target award levels were established in February 2016 for all NEOs. The AIM program pays $0 for performance below threshold. The actual amounts paid pursuant to those awards are reflected in the “Non-Equity Incentive Plan Compensation” column of the Summary Compensation Table.

Ingersoll Rand 2017 Proxy Statement 49
Proxy Statement
EXECUTIVE COMPENSATION
(b) The amounts reflected in the “Estimated Future Payouts Under Equity Incentive Plan Awards” columns represent the threshold, target and maximum amounts for PSU awards. The PSP pays $0 for performance below threshold. For a description of the Compensation Committee’s process for establishing PSP target award levels and the terms of PSU awards, please refer to Compensation Discussion and Analysis under the heading “Long-Term Incentive Program” and the “Post-Employment Benefits” section below.
(c) The amounts in these columns reflect the stock option and RSU awards. Awards in 2016 were granted in February 2016. For a description of the Compensation Committee’s process for determining stock option and RSU awards and the terms of such awards, see Compensation Discussion and Analysis under the heading “Long-Term Incentive Program” and the “Post-Employment Benefits” section below.
(d) Stock options were granted under the Company’s Incentive Stock Plan of 2013 (the “2013 Plan”), which requires options to be granted at an exercise price equal to or greater than the fair market value of the Company’s ordinary shares on the date of grant. The fair market value is defined in the 2013 Plan as the average of the high and low trading price of the Company’s ordinary shares listed on the NYSE on the grant date. The closing price on the NYSE of the Company’s ordinary shares was $49.55 on the February 2016 grant date.
(e) Amounts in this column include the grant date fair value of the equity awards calculated in accordance with ASC 718. The Company cautions that the actual amount ultimately realized by each NEO from the stock option awards will likely vary based on a number of factors, including stock price fluctuations, differences from the valuation assumptions used and timing of exercise or applicable vesting. For a description of the assumptions made in valuing the equity awards see Note 12, “Share-Based Compensation” to the Company’s consolidated financial statements contained in its 2016 Form 10-K. For PSUs, the grant date fair value has been determined based on achievement of target level performance, which is the performance threshold the Company believes is the most likely to be achieved under the grants.
OUTSTANDING EQUITY AWARDS AT DECEMBER 31, 2016Option Awards Stock Awards
Name Grant Date
Number ofSecurities
UnderlyingUnexercised
Options(#)
Exercisable (a)
Number ofSecurities
UnderlyingUnexercised
Options(#)
Unexercisable (a)
OptionExercise
Price($)
OptionExpiration
Date (b)
Number of Shares or
Units of Stock that have Not
Vested(#) (c)
Market Value of
Shares or Units of
Stock that have Not
Vested ($) (d)
Equity Incentive
Plan Awards: Number of Unearned
Shares, Units or Other
Rights that have Not
Vested(#) (e)
Equity Incentive
Plan Awards: Market or
Payout Value of Unearned
Shares, Units or Other
Rights that have Not
Vested($) (d)
M. W. Lamach 2/16/2010 50,000 – 25.2192 2/15/2020 – – – –
2/14/2011 140,351 – 37.7420 2/13/2021 – – – –
2/14/2011 88,083 – 37.7116 2/13/2021 – – – –
2/24/2012 41,351 – 32.4643 2/23/2022 – – – –
2/24/2012 103,806 – 32.4256 2/23/2022 – – – –
2/22/2013 166,407 – 41.9062 2/21/2023 – – – –
2/25/2014 97,822 48,911 59.8250 2/24/2024 12,885 966,890 77,309 5,801,267
2/3/2015 52,833 105,666 67.0550 2/2/2025 22,992 1,725,320 68,974 5,175,809
2/10/2016 – 242,347 50.0025 2/9/2026 47,498 3,564,250 94,996 7,128,500
S. K. Carter 10/1/2013 4,016 – 51.9167 9/30/2023 – – – –
2/25/2014 20,093 10,047 59.8250 2/24/2024 2,647 198,631 15,880 1,191,635
2/3/2015 11,138 22,276 67.0550 2/2/2025 4,848 363,794 14,541 1,091,157
2/10/2016 – 51,021 50.0025 2/9/2026 10,000 750,400 20,000 1,500,800
D. P. M. Teirlinck 2/25/2014 17,449 8,725 59.8250 2/24/2024 2,299 172,517 13,791 1,034,877
2/3/2015 9,995 19,992 67.0550 2/2/2025 4,350 326,424 13,049 979,197
2/10/2016 – 47,194 50.0025 2/9/2026 9,250 694,120 18,500 1,388,240
R. G. Zafari 2/24/2012 7,210 – 32.4256 2/23/2022 – – – –
2/22/2013 13,947 – 41.9062 2/21/2023 – – – –
2/25/2014 12,690 6,346 59.8250 2/24/2024 1,672 125,467 10,030 752,651
2/3/2015 7,139 14,280 67.0550 2/2/2025 3,108 233,224 9,321 699,448
2/10/2016 – 33,164 50.0025 2/9/2026 6,500 487,760 13,000 975,520
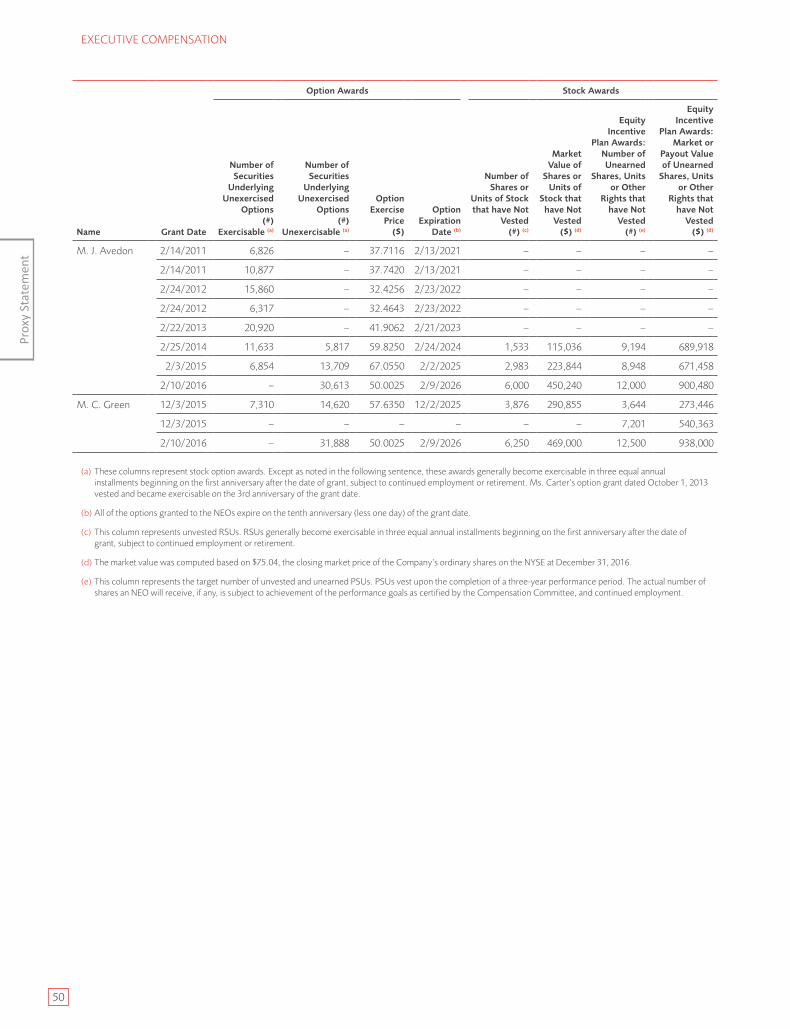
50
Prox
y St
atem
ent
EXECUTIVE COMPENSATION
Option Awards Stock Awards
Name Grant Date
Number ofSecurities
UnderlyingUnexercised
Options(#)
Exercisable (a)
Number ofSecurities
UnderlyingUnexercised
Options(#)
Unexercisable (a)
OptionExercise
Price($)
OptionExpiration
Date (b)
Number of Shares or
Units of Stock that have Not
Vested(#) (c)
Market Value of
Shares or Units of
Stock that have Not
Vested ($) (d)
Equity Incentive
Plan Awards: Number of Unearned
Shares, Units or Other
Rights that have Not
Vested(#) (e)
Equity Incentive
Plan Awards: Market or
Payout Value of Unearned
Shares, Units or Other
Rights that have Not
Vested($) (d)
M. J. Avedon 2/14/2011 6,826 – 37.7116 2/13/2021 – – – –
2/14/2011 10,877 – 37.7420 2/13/2021 – – – –
2/24/2012 15,860 – 32.4256 2/23/2022 – – – –
2/24/2012 6,317 – 32.4643 2/23/2022 – – – –
2/22/2013 20,920 – 41.9062 2/21/2023 – – – –
2/25/2014 11,633 5,817 59.8250 2/24/2024 1,533 115,036 9,194 689,918
2/3/2015 6,854 13,709 67.0550 2/2/2025 2,983 223,844 8,948 671,458
2/10/2016 – 30,613 50.0025 2/9/2026 6,000 450,240 12,000 900,480
M. C. Green 12/3/2015 7,310 14,620 57.6350 12/2/2025 3,876 290,855 3,644 273,446
12/3/2015 – – – – – – 7,201 540,363
2/10/2016 – 31,888 50.0025 2/9/2026 6,250 469,000 12,500 938,000
(a) These columns represent stock option awards. Except as noted in the following sentence, these awards generally become exercisable in three equal annual installments beginning on the first anniversary after the date of grant, subject to continued employment or retirement. Ms. Carter’s option grant dated October 1, 2013 vested and became exercisable on the 3rd anniversary of the grant date.
(b) All of the options granted to the NEOs expire on the tenth anniversary (less one day) of the grant date.
(c) This column represents unvested RSUs. RSUs generally become exercisable in three equal annual installments beginning on the first anniversary after the date of grant, subject to continued employment or retirement.
(d) The market value was computed based on $75.04, the closing market price of the Company’s ordinary shares on the NYSE at December 31, 2016.
(e) This column represents the target number of unvested and unearned PSUs. PSUs vest upon the completion of a three-year performance period. The actual number of shares an NEO will receive, if any, is subject to achievement of the performance goals as certified by the Compensation Committee, and continued employment.

Ingersoll Rand 2017 Proxy Statement 51
Proxy Statement
EXECUTIVE COMPENSATION
2016 OPTION EXERCISES AND STOCK VESTEDThe following table provides information regarding the amounts received by each NEO upon exercise of stock options, the vesting of RSUs or the vesting of PSUs during the fiscal year ended December 31, 2016:
Option Awards Stock Awards
Name
Number ofShares
Acquired onExercise
(#)
ValueRealized on
Exercise($) (a)
Number of SharesAcquired on Vesting
(#)
ValueRealized on
Vesting($)
M. W. Lamach (b) 150,000 5,317,120 205,689 11,472,572
S. K. Carter (c) – – 45,574 2,764,493
D. P. M. Teirlinck (d) 28,117 812,269 47,753 2,921,746
R. G. Zafari (d) – – 39,251 2,448,592
M. J. Avedon (b) 15,815 660,653 25,819 1,439,791
M. C. Green (e) – – 1,937 144,103
(a) This column reflects the aggregate dollar amount realized by the NEO upon the exercise of the stock options by determining the difference between the market price of the Company’s ordinary shares at exercise and the exercise price of the stock options.
(b) Reflects the value of the RSUs that vested on February 3, 2016, February 22, 2016 and February 25, 2016 and PSUs that vested on February 26, 2016, based on the average of the high and low stock price of the Company’s ordinary shares on the vesting date.
(c) Reflects the value of the RSUs that vested on February 3, 2016, February 25, 2016 and October 1, 2016 and PSUs that vested on February 26, 2016, based on the average of the high and low stock price of the Company’s ordinary shares on the vesting date.
(d) Reflects the value of the RSUs that vested on February 3, 2016, February 22, 2016, February 25, 2016 and December 6, 2016 and PSUs that vested on February 26, 2016, based on the average of the high and low stock price of the Company’s ordinary shares on the vesting date.
(e) Reflects the value of the RSUs that vested on December 3, 2016, based on the average of the high and low stock price of the Company’s ordinary shares on the vesting date.
2016 PENSION BENEFITSThe NEOs, with the exception of Ms. Green, participate in one or more, but not in all, of the following defined benefit plans:
• the Pension Plan;
• the Supplemental Pension Plan; and
• the EOSP or the KMP.
The Pension Plan is a funded, tax qualified, non-contributory (for all but a small subset of participants) defined benefit plan that covers the majority of the Company’s salaried and non-union hourly U.S. employees who were hired or re-hired prior to June 30, 2012. The Pension Plan provides for normal retirement at age 65. The formula to determine the lump sum benefit under the Pension Plan is: 5% of final average pay (the five consecutive years with the highest compensation out of the last ten years of eligible compensation) multiplied by years of credited service (as defined in the Pension Plan). A choice for distribution between an annuity and a lump sum option is available. The Pension Plan was closed to new participants after June 30, 2012 and no further benefits will accrue to any Pension Plan participant for service performed after December 31, 2022. In addition, any employee who was a Pension Plan participant on June 30, 2012 was provided the option to waive participation in the Pension Plan effective January 1, 2013, and, in lieu of participation in the Pension Plan, receive an annual non-elective employer contribution equal to 2% of eligible compensation in the ESP.
The Supplemental Pension Plan is an unfunded, nonqualified, non-contributory defined benefit restoration plan. The Supplemental Pension Plan restores what is lost in the Pension Plan due to limitations under the Internal Revenue Code (the “Code”) on the annual compensation and benefits recognized when calculating benefits under the qualified Pension Plan. The Supplemental Pension Plan covers all employees of the Company who participate in the Pension Plan and who are impacted by the Code compensation and benefits limits. A participant must meet the vesting requirements of the qualified Pension Plan to vest in benefits under the Supplemental Pension Plan. Benefits under the Supplemental Pension Plan are available only as a lump sum distribution after termination and paid in accordance with Section 409A of the Code. As a result of the 2012 changes to the Pension Plan, the Supplemental Pension Plan was closed to employees hired on or after June 30, 2012, and no further benefits will accrue to any Supplemental Plan participant for service performed after December 31, 2022.

52
Prox
y St
atem
ent
EXECUTIVE COMPENSATION
The EOSP, which was closed to new participants effective April 2011, is an unfunded, nonqualified, non-contributory defined benefit plan designed to replace a percentage of an officer’s final average pay based on his or her age and years of service at the time of retirement. Final average pay is defined as the sum of the officer’s current annual base salary plus the average of his or her three highest AIM awards during the most recent six years. No other elements of compensation (other than base salary and AIM awards) are included in final average pay. The EOSP provides a benefit pursuant to a formula in which 1.9% of an officer’s final average pay is multiplied by the officer’s years of service (up to a maximum of 35 years) and then reduced by the value of other retirement benefits the officer will receive from the Company under certain qualified and nonqualified retirement plans as well as Social Security. If additional years of service were granted to an officer as part of his or her employment agreement, those additional years of service are reflected in the Pension Benefits table below. Vesting occurs, while the officer is employed by the Company, at the earlier of the attainment of age 55 and the completion of 5 years of service or age 62. Unreduced benefits under the EOSP are available at age 62 and benefits are only available as a lump sum after termination and paid in accordance with Section 409A of the Code. Messrs. Lamach, Teirlinck and Zafari and Ms. Avedon participate in the EOSP.
The KMP is an unfunded, nonqualified, non-contributory defined benefit plan available to certain key management employees on a highly selective basis. The KMP is designed to replace a percentage of a key employee’s final average pay based on his or her age and years of service at the time of retirement. Final average pay is defined as the sum of the key employee’s current annual base salary plus the average of the employee’s three highest AIM awards during the most recent six years. No other elements of compensation (other than base salary and AIM awards) are included in final average pay. The KMP provides a benefit pursuant to a formula in which 1.7% of a key employee’s final average pay is multiplied by years of service (up to a maximum of 30 years) and then reduced by the value of other retirement benefits the key employee will receive that are provided by the Company under certain qualified and nonqualified retirement plans as well as Social Security. Vesting occurs at the earlier of the attainment of age 55 and the completion of 5 years of service or age 65. For employees who begin participating on or after June 2015, there is a minimum 5 year service requirement from date of participation to date of retirement. Benefits are only available as a lump sum after termination and paid in accordance with Section 409A of the Code. Ms. Carter is the only NEO who participates in the KMP.
The table below represents the estimated present value of defined benefits for the plans in which each NEO participates. Ms. Green does not participate in a defined benefit plan.
Name Plan Name
Numberof Years
CreditedService
(#) (a)
PresentValue of
AccumulatedBenefit
($) (b)
PaymentsDuring
Last FiscalYear
($)
M.W. Lamach (c) Pension Plan 12.917 159,512 –
Supplemental Pension Plan 12.917 1,726,110 –
EOSP 30 24,909,358 –
S.K. Carter KMP 3.333 765,818 –
D.P.M. Teirlinck (d),(e) Pension Plan 8.33 132,851 –
Supplemental Pension Plan 8.33 488,089 –
EOSP 12 5,132,637 –
R. G. Zafari (d),(e) Pension Plan 6.42 95,307 –
Supplemental Pension Plan 6.42 226,892 –
EOSP 16.75 4,732,802 –
M. J. Avedon (f) Pension Plan 9.92 136,644 –
Supplemental Pension Plan 9.92 358,456 –
EOSP 10.00 4,056,600 –
(a) Under the EOSP or the KMP, for officers covered prior to May 19, 2009, a full year of service is credited for any year in which they work at least one day. In the Pension Plan, the Supplemental Pension Plan as well as the EOSP and the KMP for officers covered on or after May 19, 2009, the number of years of credited service is based on elapsed time (i.e., credit is given for each month in which a participant works at least one day). The years of credited service used for calculating benefits under all plans are the years of credited service through December 31, 2016.
(b) The amounts in this column reflect the estimated present value of each NEO’s accumulated benefit under the plans indicated. The calculations reflect the value of the benefits assuming that each NEO was fully vested under each plan. The benefits were computed as of December 31, 2016, consistent with the assumptions described in Note 10, “Pensions and Postretirement Benefits Other than Pensions,” to the consolidated financial statements in the 2016 Form 10-K.
(c) Mr. Lamach’s credited years of service exceed his actual years of service by 17 years pursuant to the provisions of his employment arrangement. Crediting additional years of service to a nonqualified pension program such as the EOSP was not uncommon in 2004 when Mr. Lamach joined the Company and was used to compensate him for benefits he was forfeiting at his prior employer. Mr. Lamach’s benefit under the EOSP is reduced by the pension benefit he received from his former employer in July 2013, updated with interest. The increase in present value of benefits due to those additional years of credited service is $15,023,882.
(d) Service in the Pension Plan and the Supplemental Pension Plan for Messrs. Teirlinck and Zafari began in September 2008 and August 2010, respectively, when they transferred to the United States.

Ingersoll Rand 2017 Proxy Statement 53
Proxy Statement
EXECUTIVE COMPENSATION
(e) Benefits for Messrs. Teirlinck and Zafari under the EOSP use all their service with the Company, not just the service in the United States. The benefit will be reduced by any and all benefits accrued or accumulated while covered under any non-U.S. plan in respect to any period of service that is counted as a year of service in this plan. The value of these non-U.S. benefits is not readily accessible until retirement, and therefore the amount shown for EOSP reflects the value of this benefit prior to these reductions.
(f) Ms. Avedon, pursuant to the provisions of her employment arrangement, receives double credit for the first five years of employment (3.8% versus 1.9%) in determining her benefit. The increase in present value of benefits due to this provision is $1,543,493.
2016 NONQUALIFIED DEFERRED COMPENSATIONThe Company’s EDCP Plan is an unfunded, nonqualified plan that permit certain employees, including the NEOs, to defer receipt of up to 50% of their annual salary and up to 100% of their AIM awards, PSP awards and RSUs received upon commencement of employment. Elections to defer must be made prior to the beginning of the performance period. The Company has established a nonqualified grantor trust with a bank as the trustee to hold certain assets as a funding vehicle for the Company’s obligations under the EDCP Plan. These assets are considered general assets of the Company and are available to its creditors in the event of the Company’s insolvency. Amounts held in the trust are invested by the trustee using various investment vehicles.
Participants are offered certain investment options (approximately 60 mutual fund investments and ordinary share equivalents), and can choose how they wish to allocate their cash deferrals among those investment options. Participants are 100% vested in all amounts deferred, and bear the risk of any earnings and losses on such deferred amounts.
Generally, deferred amounts may be distributed following termination of employment or at the time of a scheduled in-service distribution date chosen by the participant. If a participant has completed five or more years of service at the time of termination, or is terminated due to long-term disability, death or retirement, the distribution is paid in accordance with the participant’s election. If a participant terminates without meeting these requirements, the account balance for all plan years will be paid in a lump sum in the year following the year of termination. A participant can elect to receive distributions at termination over a period of 5, 10, or 15 annual installments, or in a single lump sum. A participant can elect to receive scheduled in-service distributions in future years that are at least two years after the end of the plan year for which they are deferring. In-service distributions can be received in two to five annual installments, or if no election is made, in a lump sum. For those participants who have investments in ordinary shares, the distribution of these assets will be in the form of ordinary shares, not cash.
The following table provides information regarding contributions, distributions, earnings and balances for each NEO under our nonqualified deferred compensation plans.
Name
ExecutiveContributionsin Last Fiscal
Year ($) (a)
RegistrantContributionsin Last Fiscal
Year ($) (b)
AggregateEarnings inLast FiscalYear ($) (c)
AggregateWithdrawals/Distributions
($)
AggregateBalance atLast Fiscal
Year End ($) (d)
M. W. Lamach
EDCP Plan – – 1,280,688 – 4,608,299
Supplemental ESP – 183,300 629,715 – 2,543,697
S. K. Carter
Supplemental ESP – 88,951 23,006 – 240,937
D. P. M. Teirlinck
EDCP Plan – – 1,836,151 – 6,607,020
Supplemental ESP – 66,723 64,128 – 662,161
R. G. Zafari
EDCP Plan 31,938 – 130,524 – 597,356
Supplemental ESP – 31,075 71,670 – 349,513
M. J. Avedon
EDCP Plan – – 1,427,187 – 5,135,445
Supplemental ESP – 49,566 41,719 – 504,420
M. C. Green
EDCP Plan 52,500 – 2,390 54,890
Supplemental ESP – 20,800 1,639 – 22,439
(a) The annual deferrals (salary, AIM & PSP) are all reflected in the Salary column, the Non-Equity Incentive Plan column and the Stock Awards column, respectively of the Summary Compensation Table.

54
Prox
y St
atem
ent
EXECUTIVE COMPENSATION
(b) All of the amounts reflected in this column are included in the All Other Compensation column of the Summary Compensation Table.
(c) Amounts in this column include gains and losses on investments, as well as dividends on ordinary shares or ordinary share equivalents. None of the earnings or losses reported in this column are included in the Summary Compensation Table.
(d) The following table reflects the amounts reported in this column as compensation to the NEOs in the Company’s Summary Compensation Table in proxy statements for prior years. Each of Messrs. Lamach, Teirlinck and Zafari and Ms. Carter, Ms. Green and Ms. Avedon first became NEOs and therefore had their compensation reported in the Company’s proxy statements beginning with fiscal years 2005 (Lamach), 2014 (Carter), 2010 (Teirlinck), 2012 (Zafari), 2010 (Avedon), and 2016 (Green).
Name EDCP Plan ($) Supplemental ESP ($)
M. W. Lamach 1,529,086 1,173,675
S. K. Carter – 134,545
D. P. M. Teirlinck 3,213,525 318,162
R. G. Zafari 443,637 196,147
M. J. Avedon 376,016 250,442
M. C. Green – –
POST-EMPLOYMENT BENEFITSThe following discussion describes the compensation to which each NEO would be entitled in the event of termination of such executive’s employment, including termination following a change in control.
EMPLOYMENT ARRANGEMENTS AND SEVERANCEMr. Lamach, Ms. Carter and Ms. Avedon are entitled to severance in the event of their involuntary termination without cause pursuant to the terms of their employment agreements. Under the terms of his employment agreement, Mr. Lamach is eligible for 24 months of base annual salary plus a prorated AIM award earned for the year of termination as determined and paid at the conclusion of the full performance year in accordance with the terms of the AIM program. In addition, Mr. Lamach would receive prorated PSP awards (up to target) for the outstanding performance periods. These pro-rated awards would be earned based on actual performance and delivered in accordance with the terms of the PSP program. Under the terms of her employment agreement, Ms. Carter is eligible for 12 months of base salary plus a prorated AIM award (not to exceed target) earned for the year of termination as determined and paid at the conclusion of the full performance year in accordance with the terms of the AIM program. Ms. Avedon is eligible for 12 months of base salary and an AIM award equal to her target.
Although the Company does not have a formal severance policy for officers, NEOs who do not have employment agreements providing for severance and who are terminated by the Company other than for cause will generally be considered for severance benefits up to 12 months’ base salary. Depending on the circumstances and timing of the termination, they may also be eligible for a pro-rated portion of their AIM award earned for the year of termination as determined and paid at the conclusion of the full performance year in accordance with the terms of the AIM program. For an NEO who qualifies under one of these scenarios, the value of the award would be equal to the amount shown on the Summary Compensation Table under the heading Non-Equity Compensation.

Ingersoll Rand 2017 Proxy Statement 55
Proxy Statement
EXECUTIVE COMPENSATION
In addition, the Company’s equity award agreements provide for the following treatment upon the occurrence of one of the specified events in the table below:
Stocks Options RSUs PSUs
Retirement Continue to vest on the same basis as active employees and remain exercisable for a period of up to five years following retirement.
Continue to vest on the same basis as active employees.
Vest pro-rata based on the time worked during the performance period and the achievement of performance goals through the end of the performance period.
Group Termination Immediately vest in the portion of the awards that would have vested within twelve months of termination and remain exercisable for a period of up to three years following job elimination.
Immediately vest in the portion of the awards that would have vested within twelve months of termination.
Job Elimination Unvested awards are forfeited and vested awards remain exercisable for a period of up to one year following termination.
Unvested awards are forfeited.
Death or Disability Either vest or continue to vest on the same basis as active employees and the stock options remain exercisable for a period of up to three years following death or disability.
Either vest or continue to vest on the same basis as active employees.
Vest pro-rata based on the time worked during the performance period and the achievement of performance goals from the beginning of the performance period through the end of the calendar quarter in which employment terminated.
In the event of a change in control or termination due to a Major Restructuring, severance would be determined pursuant to the terms of the change-in-control agreements or the Major Restructuring Severance Plan described below in lieu of severance under the terms of the employment agreements or the severance guidelines described above.
CHANGE IN CONTROLThe Company has entered into a change-in-control agreement with each NEO. The change-in-control agreement provides for certain payments if the employment is terminated by the Company without “cause” (as defined in the change-in-control agreements) or by the NEO for “good reason” (as defined in the change-in-control agreements), in each case, within two years following a change in control of the Company. For officers who first became eligible for a change-in-control agreement on or after May 19, 2009, including Ms. Carter, Ms. Green and Mr. Zafari, the Company eliminated a severance payment based on outstanding PSP awards and eliminated a payment to cover the impact to the executive of certain incremental taxes incurred in connection with the payments made following a change in control.
Following a change in control, each NEO is entitled to continue receiving his or her current base salary and is entitled to an annual bonus in an amount not less than the highest annual bonus paid during the prior three full fiscal years.
If an NEO’s employment is terminated “without cause” or by the NEO for “good reason” within two years following a change in control, the NEO is entitled to the following:
• any base salary and annual bonus for a completed fiscal year that had not been paid;
• an amount equal to the NEO’s annual bonus for the last completed fiscal year pro-rated for the number of full months employed in the current fiscal year;
• an amount equal to the NEO’s base salary pro-rated for any unused vacation days;

56
Prox
y St
atem
ent
EXECUTIVE COMPENSATION
• a lump sum severance payment from the Company equal to the three times (for the CEO) or two and one-half times (for other NEOs) the sum of:
- the NEO’s annual salary in effect on the termination date, or, if higher, the annual salary in effect immediately prior to the reduction of the NEO’s annual salary after the change in control; and
- the NEO’s target AIM award for the year of termination or, if higher, the average of the AIM award amounts beginning three years immediately preceding the change in control and ending on the termination date; and
- for Messrs. Lamach and Teirlinck and Ms. Avedon, a lump sum payment equal to three times for Mr. Lamach and two and one-half times for Ms. Avedon and Mr. Teirlinck of: (a) the cash value of the target amount of the most recent PSU award; or (b) if higher, the average amounts of the last three PSU awards granted and paid to the NEO immediately preceding termination. This payment is in lieu of any rights the individual might have with respect to unvested PSU awards.
In addition to the foregoing, the NEOs would also be eligible to participate in the Company’s welfare employee benefit programs for the severance period (three years for the CEO and two and one-half years for the other NEOs). For purposes of determining eligibility for applicable post-retirement welfare benefits, the NEO would be credited with any combination of additional years of service and age, not exceeding 10 years, to the extent necessary to qualify for such benefits. The Company would also provide each NEO up to $100,000 of outplacement services.
In the event of a change in control, participants in the EOSP and KMP would be immediately vested. A termination within two years following a change in control also triggers the payment of an enhanced benefit, whereby three years would be added to both age and service with the Company under the EOSP or KMP. In addition, the “final average pay” under the EOSP or KMP would be calculated as 33.33% of his or her severance benefit under the change-in-control agreement in the case of Mr. Lamach and 40% of the severance benefit under the applicable change-in-control agreement in the case of Ms. Carter, Mr. Teirlinck, Mr. Zafari, and Ms. Avedon. These percentages reflect an annualized value of severance payments that would be provided in accordance with their respective agreements. Ms. Green who does not participate in either the EOSP or KMP.
Under the Company’s incentive plans, outstanding unvested stock options and RSUs immediately vest and become exercisable or payable, as applicable, following a change in control. PSUs will be deemed to have earned a pro-rata award based on the target award opportunity and total number of months worked in the applicable performance period.
A “change in control” is defined as the occurrence of any of the following events: (i) any person unrelated to the Company becomes the beneficial owner of 30% or more of the combined voting power of the Company’s voting stock; (ii) the directors serving at the time the change-in-control agreements were executed (or the directors subsequently elected by the shareholders of the Company whose election or nomination was duly approved by at least two-thirds of the then serving directors) fail to constitute a majority of the Board of Directors; (iii) the consummation of a merger or consolidation of the Company with any other corporation in which the Company’s voting securities outstanding immediately prior to such merger or consolidation represent 50% or less of the combined voting securities of the Company immediately after such merger or consolidation; (iv) any sale or transfer of all or substantially all of the Company’s assets, other than a sale or transfer with a corporation where the Company owns at least 80% of the combined voting power of such corporation or its parent after such transfer; or (v) any other event that the continuing directors determine to be a change in control; provided however, with respect to (i), (iii) and (iv) above, there shall be no change in control if shareholders of the Company own more than 50% of the combined voting power of the voting securities of the Company or the surviving entity or any parent immediately following such transaction in substantially the same proportion to each other as prior to such transaction.
MAJOR RESTRUCTURINGThe Company has adopted a Severance Plan that provides a cash severance payment in the event a participant’s employment is terminated due to an involuntary loss of job without Cause (as defined in the Severance Plan) or a Good Reason (as defined in the Severance Plan), provided that the termination is substantially related to or a result of a Major Restructuring. The cash severance payment would be equal to two and one-half times (for the CEO) or two times (for other NEOs) (a) current base salary, and (b) current target AIM award. As of December 31, 2016, the value of cash severance for NEOs was: Mr. Lamach, $8,450,000; Ms. Carter, $2,780,000; Mr. Teirlinck, $2,730,000; Mr. Zafari, $2,109,000; Ms. Avedon, $2,220,000; and Ms. Green, $1,890,000.
Participants would also receive a pro-rated portion of their target AIM award, based on actual Company and individual performance during the fiscal year in which termination of employment occurred. Participants in the EOSP or KMP who are not vested in such plans would also receive a cash payment equal to the amount of the benefit to which they would have been entitled if they were vested.

Ingersoll Rand 2017 Proxy Statement 57
Proxy Statement
EXECUTIVE COMPENSATION
In addition, the Company’s equity awards provide that employees who terminate employment due to an involuntary loss of job without Cause (as defined in the applicable award agreement) or for Good Reason (as defined in the applicable award agreement) within one year of completion of a Major Restructuring will, provided that the termination is substantially related to the Major Restructuring, (i) immediately vest in all unvested stock options and may exercise all vested stock options at any time within the following three-year period (five years if retirement eligible) or the remaining term of the stock option, if shorter, (ii) immediately vest in all RSUs, except that retirement eligible participants with at least five years of service would continue their existing vesting schedule, and (iii) receive a prorated payout of outstanding PSUs based on actual performance at the end of performance period. As of December 31, 2016, the value of unvested equity awards was: Mr. Lamach, $25,546,123; Ms. Carter, $5,341,717; Mr. Teirlinck, $4,818,690; Mr. Zafari, $3,432,374; Ms. Avedon, $3,192,157 and Ms. Green, $2,759,942.
A “Major Restructuring” is defined as a reorganization, recapitalization, extraordinary stock dividend, merger, sale, spin-off or other similar transaction or series of transactions, which individually or in the aggregate, has the effect of resulting in the elimination of all, or the majority of, any one or more of the Company’s two business segments (i.e., Climate and Industrial), so long as such transaction or transactions do not constitute a Change in Control (as defined in the applicable plan).
2016 POST-EMPLOYMENT BENEFITS TABLEThe following table describes the compensation to which each of the NEOs would be entitled in the event of termination of such executive’s employment on December 31, 2016, including termination following a change in control. The potential payments were determined under the terms of our plans and arrangements in effect on December 31, 2016. The table does not include the pension benefits or nonqualified deferred compensation amounts that would be paid to an NEO, which are set forth in the Pension Benefits table and the Nonqualified Deferred Compensation table above, except to the extent that the NEO is entitled to an additional benefit as a result of the termination.
Name
Voluntary Resignation/
Retirement ($)
Involuntary without
Cause ($)
Involuntary with Cause
($)
Change in Control
($)Disability
($)Death
($)
M. W. Lamach
Severance (a) – 2,600,000 – 10,618,200 – –
Earned but Unpaid AIM Award(s) (b) – 2,500,000 – 2,500,000 – –
PSP Award Payout (c) – 11,633,976 – 33,184,705 11,633,976 11,633,976
Value of Unvested Equity Awards (d) – – – 13,912,147 13,912,147 13,912,147
Enhanced Retirement Benefits (e) – – – 9,272,001 – –
Outplacement (f) – 11,400 – 100,000 – –
Health Benefits (g) – – – 25,966 – –
Tax Assistance (h) – – – 28,140,468 – –
Total – 16,745,376 – 97,753,487 25,546,123 25,546,123
S. K. Carter
Severance (a) – 695,000 – 3,475,000 – –
Earned but Unpaid AIM Award(s) (b) – 695,000 – 817,862 – –
PSP Award Payout (c) – – – 2,419,440 2,420,715 2.420,715
Value of Unvested Equity Awards (d) – – – 2,921,002 2,921,002 2,921,002
Enhanced Retirement Benefits (e) – – – 1,650,457 – –
Outplacement (f) – 11,400 – 100,000 – –
Health Benefits (g) – – – 21,696 – –
Tax Assistance (h) – – – – – –
Total – 1,401,400 – 11,405,457 5,341,717 5,341,717

58
Prox
y St
atem
ent
EXECUTIVE COMPENSATION
Name
Voluntary Resignation/
Retirement ($)
Involuntary without
Cause ($)
Involuntary with Cause
($)
Change in Control
($)Disability
($)Death
($)
D. P. M. Teirlinck
Severance (a) – 700,000 – 3,686,158 – –
Earned but Unpaid AIM Award(s) (b) – 665,000 – 814,718 – –
PSP Award Payout (c) 2,151,622 2,151,622 – 5,239,176 2,151,622 2,151,622
Value of Unvested Equity Awards (d) 2,667,068 2,667,068 – 2,667,068 2,667,068 2,667,068
Enhanced Retirement Benefits (e) – – – 2,098,560 – –
Outplacement (f) – 11,400 – 100,000 – –
Health Benefits (g) – – – 21,696 – –
Tax Assistance (h) – – – – – –
Total 4,818,690 6,195,090 – 14,627,376 4,818,690 4,818,690
R. G. Zafari
Severance (a) – 570,000 – 2,636,250 – –
Earned but Unpaid AIM Award(s) (b) – 358,244 – 358,244 – –
PSP Award Payout (c) 1,544,999 1,544,999 – 1,544,173 1,544,999 1,544,999
Value of Unvested Equity Awards (d) 1,887,375 1,887,375 – 1,887,375 1,887,375 1,887,375
Enhanced Retirement Benefits (e) – – – 2,544,539 – –
Outplacement (f) – 11,400 – 100,000 – –
Health Benefits (g) – – – 21,696 – –
Tax Assistance (h) – – – – – –
Total 3,432,374 4,372,018 – 9,092,277 3,432,374 3,432,374
M. J. Avedon
Severance (a) – 600,000 – 2,829,668 – –
Earned but Unpaid AIM Award(s) (b) – 510,000 – 600,158 – –
PSP Award Payout (c) 1,438,592 1,438,592 – 4,134,237 1,438,592 1,438,592
Value of Unvested Equity Awards (d) 1,753,566 1,753,566 – 1,753,566 1,753,566 1,753,566
Enhanced Retirement Benefits (e) – – – 2,177,490 – –
Outplacement (f) – 11,400 – 100,000 – –
Health Benefits (g) – – – 21,696 – –
Tax Assistance (h) – – – – – –
Total 3,192,158 4,313,558 – 11,616,815 3,192,158 3,192,158
M. C. Green
Severance (a) – 413,942 – 2,362,500 – –
Earned but Unpaid AIM Award(s) (b) – 420,000 – 494,248 – –
PSP Award Payout (c) – – – 946,480 947,230 947,230
Value of Unvested Equity Awards (d) – – – 1,812,712 1,812,712 1,812,712
Enhanced Retirement Benefits (e) – – – – – –
Outplacement (f) – 11,400 – 100,000 – –
Health Benefits (g) – – – 21,696 – –
Tax Assistance (h) – – – – – –
Total – 845,342 – 5,737,636 2,759,942 2,759,942
(a) For the “Involuntary without Cause” column, for those NEOs who do not have a formal separation agreement, the current severance guidelines permit payment of up to one year’s base salary provided that such termination was not eligible for severance benefits under the Major Restructuring Severance Plan. Because of her service, Ms. Green’s severance is equal to 41 weeks rather than 52. For the amounts shown under the “Change in Control” columns, refer to the description of how severance is calculated in the section above, entitled Post-Employment Benefits. For Mr. Teirlinck and Ms. Avedon, severance amounts in 2016 would be reduced per the cut-back provision in their change-in-control agreement. The reduction in severance would have been $1,072,160 for Mr. Teirlinck and $913,643 for Ms. Avedon. The amounts shown above reflect the severance prior to these reductions.

Ingersoll Rand 2017 Proxy Statement 59
Proxy Statement
EXECUTIVE COMPENSATION
(b) For the “Involuntary without Cause” column, these amounts represent the (i) AIM award earned by Mr. Lamach, Ms. Carter and Ms. Avedon in 2016 and paid pursuant to the terms of their employment agreements and (ii) prorated AIM awards (up to target) that may be paid to the other NEOs depending on the circumstances and timing of the termination. For the amounts under “Change in Control,” these amounts represent the actual award earned for the 2016 performance period, which may be more or less than the target award.
(c) For the “Involuntary without Cause” column, these amounts represent the cash value of the prorated PSU award payout to (i) Mr. Lamach pursuant to the terms of his employment agreement and (ii) Messrs. Teirlinck and Zafari and Ms. Avedon because they were retirement eligible at December 31, 2016. For the “Change in Control” column for Messrs. Lamach and Teirlinck and Ms. Avedon, these amounts represent the cash value of the PSU award payout, based on the appropriate multiple. For the “Change in Control” column for Mr. Zafari, Ms. Carter and Ms. Green, these values represent what would be provided under the terms of the 2013 Plan, which provide a pro-rated payment for all outstanding awards at target. For the “Retirement,” “Disability” and “Death” columns, amounts represent the cash value of the prorated portion of their PSUs that vest upon such events assuming performance at target. Amounts for each column are based on the closing stock price of the ordinary shares on December 31, 2016 ($75.04).
(d) The amounts shown for “Retirement,” “Involuntary without Cause,” “Change in Control,” “Death” and “Disability” represent (i) the value of the unvested RSUs, which is calculated based on the number of unvested RSUs multiplied by the closing stock price of the ordinary shares on December 31, 2016 ($75.04), and (ii) the intrinsic value of the unvested stock options, which is calculated based on the difference between the closing stock price of the ordinary shares on December 31, 2016 ($75.04) and the relevant exercise price. However, only in the event of termination following a “Change in Control” or, beginning with the 2013 awards, termination due to “Death” or “Disability” is there accelerated vesting of unvested awards. For “Retirement,” “Disability” (before 2013 grant) and “Death” (before 2013 grant), the awards do not accelerate but continue to vest on the same basis as active employees. Because Messrs. Teirlinck and Zafari and Ms. Avedon were retirement eligible, they would continue to vest in stock options and RSUs after termination of employment for any reason other than cause.
(e) In the event of a change in control of the Company and termination of the NEOs, the present value of the pension benefits under the EOSP, KMP and Supplemental Pension Plan would be paid out as lump sums. While there is no additional benefit to the NEOs as a result of either voluntary retirement/resignation and/or involuntary resignation without cause, there are differences (based on the methodology mandated by the SEC) between the numbers that are shown in the Pension Benefits Table and those that would actually be payable to the NEO under these termination scenarios.
(f) For the “Involuntary without Cause” column, each NEO is eligible for outplacement services for a twelve month period, not to exceed $11,400. For the “Change in Control” column, the amount represents the maximum expenses the Company would reimburse the NEO for professional outplacement services.
(g) Represents the Company cost of health and welfare coverage. The cost for “Change in Control” represents continued active coverage for the severance period.
(h) Pursuant to the change-in-control agreements for Messrs. Lamach and Teirlinck and Ms. Avedon, if any payment or distribution by the Company to these NEOs creates certain incremental taxes, they would be entitled to receive from the Company a payment in an amount sufficient to place them in the same after-tax financial position as if such taxes had not been imposed. For 2016, as a result of a cut-back provision in the change-in-control agreements, neither Mr. Teirlinck nor Ms. Avedon would have been eligible for this payment, and therefore no value is shown in the table above.
60
Prox
y St
atem
ent
INFORMATION CONCERNING VOTING AND SOLICITATION
WHY DID I RECEIVE THIS PROXY STATEMENT?We sent you this Proxy Statement or a Notice of Internet Availability of Proxy Materials (”Notice”) because our Board of Directors is soliciting your proxy to vote at the Annual General Meeting. This Proxy Statement summarizes the information you need to know to vote on an informed basis.
WHY ARE THERE TWO SETS OF FINANCIAL STATEMENTS COVERING THE SAME FISCAL PERIOD?U.S. securities laws require us to send you our 2016 Form 10-K, which includes our financial statements prepared in accordance with GAAP. These financial statements are included in the mailing of this Proxy Statement. Irish law also requires us to provide you with our Irish Financial Statements for our 2016 fiscal year, including the reports of our Directors and auditors thereon, which accounts have been prepared in accordance with Irish law. The Irish Financial Statements are available on the Company’s website at www.ingersollrand.com/irishstatutoryaccounts and will be laid before the Annual General Meeting.
HOW DO I ATTEND THE ANNUAL GENERAL MEETING?All shareholders are invited to attend the Annual General Meeting. In order to be admitted, you must present a form of personal identification and evidence of share ownership.
If you are a shareholder of record, evidence of share ownership will be either (1) an admission ticket, which is attached to the proxy card and must be separated from the proxy card and kept for presentation at the meeting if you vote your proxy by mail, or (2) a Notice.
If you own your shares through a bank, broker or other holder of record (“street name holders”), evidence of share ownership will be either (1) your most recent bank or brokerage account statement, or (2) a Notice. If you would rather have an admission ticket, you can obtain one in advance by mailing a written request, along with proof of your ownership of the Company’s ordinary shares, to:
Secretary Ingersoll-Rand plc 170/175 Lakeview Dr. Airside Business Park Swords, Co. Dublin Ireland
No cameras, recording equipment, electronic devices, large bags, briefcases or packages will be permitted at the Annual General Meeting.
WHO MAY VOTE?You are entitled to vote if you beneficially owned the Company’s ordinary shares at the close of business on April 11, 2017, the Record Date. At that time, there were 256,500,353 of the Company’s ordinary shares outstanding and entitled to vote. Each ordinary share that you own entitles you to one vote on all matters to be voted on a poll at the Annual General Meeting.
HOW DO I VOTE?Shareholders of record can cast their votes by proxy by:
• using the Internet and voting at www.proxyvote.com;
• calling 1-800-690-6903 and following the telephone prompts; or
• completing, signing and returning a proxy card by mail. If you received a Notice and did not receive a proxy card, you may request one at [email protected].
The Notice is not a proxy card and it cannot be used to vote your shares.

Ingersoll Rand 2017 Proxy Statement 61
INFORMATION CONCERNING VOTING AND SOLICITATION
Proxy Statement
If you are a shareholder of record and you choose to submit your proxy by telephone by calling the toll-free number on your proxy card, your use of that telephone system and in particular the entry of your pin number/other unique identifier, will be deemed to constitute your appointment, in writing and under hand, and for all purposes of the Companies Act 2014, of the persons named on the proxy card as your proxy to vote your shares on your behalf in accordance with your telephone instructions.
Shareholders of record may also vote their shares directly by attending the Annual General Meeting and casting their vote in person or appointing a proxy (who does not have to be a shareholder) to attend the Annual General Meeting and casting votes on their behalf in accordance with their instructions.
Street name holders must vote their shares in the manner prescribed by their bank, brokerage firm or nominee. Street name holders who wish to vote in person at the Annual General Meeting must obtain a legal proxy from their bank, brokerage firm or nominee. Street name holders will need to bring the legal proxy with them to the Annual General Meeting and hand it in with a signed ballot that is available upon request at the meeting. Street name holders will not be able to vote their shares at the Annual General Meeting without a legal proxy and a signed ballot.
Even if you plan to attend the Annual General Meeting, we recommend that you vote by proxy as described above so that your vote will be counted if you later decide not to attend the meeting.
In order to be timely processed, your vote must be received by 11:59 p.m. Eastern Time on June 7, 2017 (or, if you are a street name holder, such earlier time as your bank, brokerage firm or nominee may require).
HOW MAY EMPLOYEES VOTE UNDER OUR EMPLOYEE PLANS?If you participate in the ESP, the Ingersoll-Rand Company Employee Savings Plan for Bargained Employees, the Ingersoll-Rand Retirement Savings Plan for Participating Affiliates in Puerto Rico, the Ingersoll-Rand Individual Account Retirement Plan for Bargaining Unit Employees at the Buffalo, New York Plant or the Trane 401(k) and Thrift Plan, then you may be receiving these materials because of shares held for you in those plans. In that case, you may use the enclosed proxy card to instruct the plan trustees of those plans how to vote your shares, or give those instructions by telephone or over the Internet. They will vote these shares in accordance with your instructions and the terms of the plan.
To allow plan administrators to properly process your vote, your voting instructions must be received by 11:59 p.m. Eastern Time on June 4, 2017.
If you do not provide voting instructions for shares held for you in any of these plans, the plan trustees will vote these shares in the same ratio as the shares for which voting instructions are provided.
MAY I REVOKE MY PROXY?You may revoke your proxy at any time before it is voted at the Annual General Meeting in any of the following ways:
• by notifying the Company’s Secretary in writing: c/o Ingersoll-Rand plc, 170/175 Lakeview Dr., Airside Business Park, Swords, Co. Dublin, Ireland;
• by submitting another properly signed proxy card with a later date or another Internet or telephone proxy at a later date but prior to the close of voting described above; or
• by voting in person at the Annual General Meeting.
Merely attending the Annual General Meeting does not revoke your proxy. To revoke a proxy, you must take one of the actions described above.
HOW WILL MY PROXY GET VOTED?If your proxy is properly submitted, your proxy holder (one of the individuals named on the proxy card) will vote your shares as you have directed. If you are a street name holder, the rules of the NYSE permit your bank, brokerage firm or nominee to vote your shares on Items 4, 5, 6 and 7 (routine matters) if it does not receive instructions from you. However, your bank, brokerage firm or nominee may not vote your shares on Items 1, 2 and 3 (non-routine matters) if it does not receive instructions from you (“broker non-votes”). Broker non-votes will not be counted as votes for or against the non-routine matters, but rather will be regarded as votes withheld and will not be counted in the calculation of votes for or against the resolution.
If you are a shareholder of record and you do not specify on the proxy card you send to the Company (or when giving your proxy over the Internet or telephone) how you want to vote your shares, then the Company-designated proxy holders will vote your shares in the manner recommended by our Board of Directors on all matters presented in this
Proxy Statement and as the proxy holders may determine in their discretion regarding any other matters properly presented for a vote at the meeting.

62
INFORMATION CONCERNING VOTING AND SOLICITATIONPr
oxy
Stat
emen
t
WHAT CONSTITUTES A QUORUM?The presence (in person or by proxy) of shareholders entitled to exercise a majority of the voting power of the Company on the Record Date is necessary to constitute a quorum for the conduct of business. Abstentions and broker non-votes are treated as “shares present” for the purposes of determining whether a quorum exists.
WHAT VOTE IS REQUIRED TO APPROVE EACH PROPOSAL?A majority of the votes cast at the Annual General Meeting is required to approve each of Items 1, 2, 3, 4 and 5. A majority of the votes cast means that the number of votes cast “for” an Item must exceed the number of votes cast “against” that Item. Items 6 and 7 are considered special resolutions under Irish law and require 75% of the votes cast for approval.
Although abstentions and broker non-votes are counted as “shares present” at the Annual General Meeting for the purpose of determining whether a quorum exists, they are not counted as votes cast either “for” or “against” the resolution and, accordingly, will not affect the outcome of the vote.
WHO PAYS THE EXPENSES OF THIS PROXY STATEMENT?We have hired Alliance Advisors, LLC to assist in the distribution of proxy materials and the solicitation of proxies for a fee estimated at $15,000 plus out-of-pocket expenses. Proxies will be solicited on behalf of our Board of Directors by mail, in person, by telephone and through the Internet. We will bear the cost of soliciting proxies. We will also reimburse brokers and other custodians, nominees and fiduciaries for their reasonable out-of-pocket expenses for forwarding proxy materials to the persons for whom they hold shares.
HOW WILL VOTING ON ANY OTHER MATTER BE CONDUCTED?Although we do not know of any matters to be presented or acted upon at the Annual General Meeting other than the items described in this Proxy Statement, if any other matter is proposed and properly presented at the Annual General Meeting, the proxy holders will vote on such matters in accordance with their best judgment.

Ingersoll Rand 2017 Proxy Statement 63
Proxy Statement
SECURITY OWNERSHIP OF CERTAIN BENEFICIAL OWNERS AND MANAGEMENT
The following table sets forth as of the Record Date, the beneficial ownership of our ordinary shares by (i) each director of the Company, (ii) each executive officer of the Company named in the Summary Compensation Table below, and (iii) all directors and executive officers of the Company as a group:
Name Ordinary Shares (1) Notional Shares (2)
Options Exercisable
Within 60 Days (3)
A. C. Berzin 25,937 33,440 –
J. Bruton 7,921 – –
J. L. Cohon 27,494 – –
G. D. Forsee 26,770 – –
C. J. Horner 6,330 45,087 –
L. P. Hudson 3,309 – –
M. P. Lee 3,146 – –
J. P. Surma 7,567 – –
R. J. Swift 5,239 62,332 –
T. L. White 26,227 47,222 –
M.W. Lamach 154,622 61,713 710,096
S.K. Carter 53,878 – 73,439
D. P. M. Teirlinck 6,919 88,480 61,896
R. G. Zafari 56,472 7,595 65,526
M. J. Avedon 44,490 56,952 86,302
M. C. Green 6,357 – 17,939
All directors and executive officers as a group (20 persons) (4) 516,146 454,543 1,102,890
(1) Represents (i) ordinary shares held directly; (ii) ordinary shares held indirectly through a trust; (iii) unvested shares, including any RSUs or PSUs, and ordinary shares and ordinary share equivalents notionally held under the Trane Deferred Compensation Plan (the “TDCP”) that may vest or are distributable within 60 days of the Record Date; and (iv) ordinary shares held by the trustee under the ESP for the benefit of executive officers. No director or executive officer of the Company beneficially owns 1% or more of the Company’s ordinary shares.
(2) Represents ordinary shares and ordinary share equivalents notionally held under the Ingersoll Rand Directors Deferred Compensation Plan (the “DDCP I”) and the Ingersoll Rand Directors Deferred Compensation and Stock Award Plan II (the “DDCP II” and, together with the DDCP I, referred to as the “DDCP Plans”), and the EDCP Plans that are not distributable within 60 days of the Record Date.
(3) Represents ordinary shares as to which directors and executive officers had stock options or SARs exercisable within 60 days of the Record Date, under the Company’s Incentive Stock Plans.
(4) The Company’s ordinary shares beneficially owned by all directors and executive officers as a group (including shares issuable under exercisable options) aggregated approximately 0.63% of the total outstanding ordinary shares. Ordinary shares and ordinary share equivalents notionally held under the DDCP Plans, the EDCP Plans and the TDCP and ordinary share equivalents resulting from dividends on deferred stock awards are not counted as outstanding shares in calculating these percentages because they are not beneficially owned; the directors and executive officers have no voting or investment power with respect to these shares or share equivalents.

64
Prox
y St
atem
ent
The following table sets forth each shareholder which is known by us to be the beneficial owner of more than 5% of the outstanding ordinary shares of the Company based solely on the information filed by such shareholder on Schedule 13D or filed by such shareholder in 2016 for the year ended December 31, 2016 on Schedule 13G under the Securities Exchange Act of 1934:
Name and Address of Beneficial OwnerAmount and Nature of Beneficial Ownership
Percent of Class (1)
BlackRock, Inc. (2) 40 East 52nd Street New York, New York 10022 17,748,009 6.9%
Vanguard Group (3) 100 Vanguard Blvd. Malvern, PA 19355 16,193,109 6.3%
State Street Corporation (4)
State Street Financial CenterOne Lincoln StreetBoston, MA 02111 14,058,764 5.5%
(1) The ownership percentages set forth in this column are based on the Company’s outstanding ordinary shares on the Record Date and assumes that each of the beneficial owners continued to own the number of shares reflected in the table above on such date.
(2) Information regarding BlackRock, Inc. and its stockholdings was obtained from a Schedule 13G filed with the SEC on January 25, 2017. The filing indicated that, as of December 31, 2016, BlackRock, Inc. had sole voting power as to 14,627,576 of such shares and sole dispositive power as to 17,735,346 of such shares.
(3) Information regarding Vanguard Group and its stockholdings was obtained from a Schedule 13G filed with the SEC on February 10, 2017. The filing indicated that, as of December 31, 2016, Vanguard Group Inc. had sole voting power as to 404,954 of such shares and sole dispositive power as to 15,746,177 of such shares.
(4) Information regarding State Street Corporation and its stockholdings was obtained from a Schedule 13G filed with the SEC on February 7, 2017. The filing indicated that, as of December 31, 2016, State Street Corporation had sole voting and dispositive power as to 0 of such shares.
EQUITY COMPENSATION PLAN INFORMATION
The following table provides information as of December 31, 2016, with respect to the Company’s ordinary shares that may be issued under equity compensation plans:
Plan Category
Number of Securities to be Issued upon
Exercise of Outstanding Options, Warrants
and Rights
Weighted- Average
Exercise Price of Outstanding
Options, Warrants and
Rights
Number of Securities Remaining Available for
Future Issuance Under Equity Compensation
Plans (Excluding Securities Reflected in
First Column)
Equity compensation plans approved by security holders (1) 9,106,440 $47.81 9,012,531
Equity compensation plans not approved by security holders (2) 910,176 – –
Total 10,016,616 $47.81 9,012,531
(1) Consists of the Incentive Stock Plan of 1998, the 2007 Plan, the 2013 Plan and the Trane 2002 Omnibus Incentive Plan.
(2) Consists of EDCP Plans, DDCP Plans and the TDCP. Plan participants acquire Company shares under these plans as a result of the deferral of salary, AIM awards and PSUs.
CERTAIN RELATIONSHIPS AND RELATED PERSON TRANSACTIONS
The Company does not generally engage in transactions in which its executive officers, directors or nominees for directors, any of their immediate family members or any of its 5% shareholders have a material interest. Pursuant to the Company’s written related person transaction policy, any such transaction must be reported to management, which will prepare a summary of the transaction and refer it to the Corporate Governance and Nominating Committee for consideration and approval by the disinterested directors. The Corporate Governance and Nominating Committee reviews the material terms of the related person transaction, including the dollar values involved, the relationships and interests of the parties to the transaction and the impact, if any, to a director’s independence. The Corporate Governance and Nominating Committee only approves those transactions that are in the best interest

Ingersoll Rand 2017 Proxy Statement 65
Proxy Statement
of the Company. In addition, the Company’s Code of Conduct, which sets forth standards applicable to all employees, officers and directors of the Company, generally proscribes transactions that could result in a conflict of interest for the Company. Any waiver of the Code of Conduct for any executive officer or director requires the approval of the Company’s Board of Directors. Any such waiver will, to the extent required by law or the NYSE, be disclosed on the Company’s website at www.ingersollrand.com or on a current report on Form 8-K. No such waivers were requested or granted in 2016.
We have not made payments to directors other than the fees to which they are entitled as directors (described under the heading “Compensation of Directors”) and the reimbursement of expenses related to their services as directors. We have made no loans to any director or officer nor have we purchased any shares of the Company from any director or officer.
SECTION 16(a) BENEFICIAL OWNERSHIP REPORTING COMPLIANCE
Section 16(a) of the Securities Exchange Act of 1934, as amended, requires our directors and officers, and persons who beneficially own more than ten percent of the Company’s ordinary shares, to file reports of ownership and reports of changes in ownership with the SEC and the NYSE. To the Company’s knowledge, based solely on its review of such forms received by the Company and written representations that no other reports were required, all Section 16(a) filing requirements were complied with for the year 2016 other than with respect to one Form 4 filing for Mr. Chris Kuehn due to administrative error.
SHAREHOLDER PROPOSALS AND NOMINATIONS
Any proposal by a shareholder intended to be presented at the 2018 Annual General Meeting of shareholders of the Company must be received by the Company at its registered office at 170/175 Lakeview Drive, Airside Business Park, Swords, Co. Dublin, Ireland, Attn: Secretary, no later than December 25, 2017, for inclusion in the proxy materials relating to that meeting. Any such proposal must meet the requirements set forth in the rules and regulations of the SEC, including Rule 14a-8, in order for such proposals to be eligible for inclusion in our 2018 proxy statement.
The Company’s Articles of Association set forth procedures to be followed by shareholders who wish to nominate candidates for election to the Board of Directors in connection with Annual General Meetings of shareholders or pursuant to written shareholder consents or who wish to bring other business before a shareholders’ general meeting. All such nominations must be accompanied by certain background and other information specified in the Articles of Association. In connection with the 2018 Annual General Meeting, written notice of a shareholder’s intention to make such nominations or bring business before the Annual General Meeting must be given to the Secretary of the Company not later than March 10, 2018. If the date of the 2018 Annual General Meeting occurs more than 30 days before, or 60 days after, the anniversary of the 2017 Annual General Meeting, then the written notice must be provided to the Secretary of the Company not later than the seventh day after the date on which notice of such Annual General Meeting is given.
In addition, the Company’s Articles of Association separately provide shareholders representing 3% or more of the voting power of the Company’s shares with the right, subject to certain terms and conditions, to nominate candidates for election to the Board of Directors and have such candidate included in our proxy materials for the applicable Annual General Meeting (“proxy access”). All such nominations must be accompanied by certain background and other information specified in the Articles of Association. In connection with the 2018 Annual General Meeting, written notice of proxy access nominations must be given to the Secretary of the Company not earlier than November, 25, 2017 and not later than later than December 25, 2017. If the date of the 2018 Annual General Meeting occurs more than 30 days before, or 60 days after, the anniversary of the 2017 Annual General Meeting, then the written notice must be provided to the Secretary of the Company not earlier than 120 days prior to the 2018 Annual General Meeting and not later than the close of business on the later of (x) the 90th day prior to the 2018 Annual General Meeting or (y) the 10th day following the day on which public announcement of the date of the 2018 Annual General Meeting is first made.
The Corporate Governance and Nominating Committee will consider all shareholder recommendations for candidates for Board membership, which should be sent to the Committee, care of the Secretary of the Company, at the address set forth above. In addition to considering candidates recommended by shareholders, the Committee considers potential candidates recommended by current directors, Company officers, employees and others. As stated in the Company’s Corporate Governance Guidelines, all candidates for Board membership are selected based upon their judgment, character, achievements and experience in matters affecting business and industry. Candidates recommended by shareholders are evaluated in the same manner as director candidates identified by any other means.

66
Prox
y St
atem
ent
In order for you to bring other business before a shareholder general meeting, timely notice must be received by the Secretary of the Company within the time limits described above. The notice must include a description of the proposed item, the reasons you believe support your position concerning the item, and other specified matters. These requirements are separate from and in addition to the requirements you must meet to have a proposal included in our Proxy Statement. The foregoing time limits also apply in determining whether notice is timely for purposes of rules adopted by the SEC relating to the exercise of discretionary voting authority.
If a shareholder wishes to communicate with the Board of Directors for any other reason, all such communications should be sent in writing, care of the Secretary of the Company, or by email at [email protected].
HOUSEHOLDING
SEC rules permit a single set of annual reports and proxy statements to be sent to any household at which two or more shareholders reside if they appear to be members of the same family. Each shareholder continues to receive a separate proxy card. This procedure is referred to as householding. While the Company does not household in mailings to its shareholders of record, a number of brokerage firms with account holders who are Company shareholders have instituted householding. In these cases, a single proxy statement and annual report will be delivered to multiple shareholders sharing an address unless contrary instructions have been received from the affected shareholders. Once a shareholder has received notice from his or her broker that the broker will be householding communications to the shareholder’s address, householding will continue until the shareholder is notified otherwise or until the shareholder revokes his or her consent. If at any time a shareholder no longer wishes to participate in householding and would prefer to receive a separate proxy statement and annual report, he or she should notify his or her broker. Any shareholder can receive a copy of the Company’s proxy statement and annual report by contacting the Company at its registered office at 170/175 Lakeview Drive, Airside Business Park, Swords, Co. Dublin, Ireland, Attention: Secretary or by accessing it on the Company’s website at www.ingersollrand.com.
Shareholders who hold their shares through a broker or other nominee who currently receive multiple copies of the proxy statement and annual report at their address and would like to request householding of their communications should contact their broker.
Dated: April 24, 2017

Ingersoll Rand 2017 Proxy Statement A-1
Proxy Statement
Appendix A
Directions to the Annual General Meeting
DIRECTIONS FROM DUBLIN AIRPORT• Take the M1 from the Dublin Airport and follow the signs for the M50 to the Westlink Toll Bridge.
• Immediately after coming off toll bridge, exit at junction 7 and head right to N4- Galway/Sligo & The West.
• Continue on this road past the Lucan Spa Hotel and on to the M4 Motorway.
• Exit Motorway at Naas/Maynooth signpost and at junction take left for Naas.
• Continue for approximately 5 miles/8km - cross Clane Road and follow sign for Straffan
• Past Barberstown Castle and into Straffan Village - continue through village - entrance to K Club ½ mile/800 m on right hand side.
• Satellite Navigation Co-Ordinates: 53.308056- Latitude, -6.625050- Longitude


2016 Financials


UNITED STATES SECURITIES AND EXCHANGE COMMISSIONWashington, D.C. 20549
FORM 10-K(Mark One)
ANNUAL REPORT PURSUANT TO SECTION 13 OR 15(d) OF THE SECURITIES EXCHANGE ACT OF 1934
For the fiscal year ended December 31, 2016
or
TRANSITION REPORT PURSUANT TO SECTION 13 OR 15(d) OF THE SECURITIES EXCHANGE ACT OF 1934
For the transition period from to
Commission File No. 001-34400
INGERSOLL-RAND PUBLIC LIMITED COMPANY(Exact name of registrant as specified in its charter)
Ireland 98-0626632
(State or other jurisdiction of incorporation or organization)
(I.R.S. Employer Identification No.)
170/175 Lakeview Dr. Airside Business Park Swords, Co. Dublin
Ireland
(Address of principal executive offices) Registrant’s telephone number, including area code: +(353) (0) 18707400
Securities registered pursuant to Section 12(b) of the Act:
Title of each class Name of each exchange on which registeredOrdinary Shares,
Par Value $1.00 per ShareNew York Stock Exchange
Securities registered pursuant to Section 12(g) of the Act: None
Indicate by check mark if the registrant is a well-known seasoned issuer, as defined in Rule 405 of the Securities Act. YES NO
Indicate by check mark if the registrant is not required to file reports pursuant to Section 13 or Section 15(d) of the Act. YES NO
Indicate by check mark whether the registrant (1) has filed all reports required to be filed by Section 13 or 15(d) of the Securities Exchange Act of 1934 during the preceding 12 months (or for such shorter period that the registrant was required to file such reports), and (2) has been subject to such filing requirements for the past 90 days. YES NO
Indicate by check mark whether the registrant has submitted electronically and posted on its corporate Web site, if any, every Interactive Data File required to be submitted and posted pursuant to Rule 405 of Regulation S-T (§232.405 of this chapter) during the preceding 12 months (or for such shorter period that the registrant was required to submit and post such files). YES NO
Indicate by check mark if disclosure of delinquent filers pursuant to Item 405 of Regulation S-K (§229.405 of this chapter) is not contained herein, and will not be contained, to the best of registrant’s knowledge, in definitive proxy or information statements incorporated by reference in Part III of this Form 10-K or any amendment to this Form 10-K.
Indicate by check mark whether the registrant is a large accelerated filer, an accelerated filer, a non-accelerated filer, or a smaller reporting company. See the definitions of “large accelerated filer,” “accelerated filer” and “smaller reporting company” in Rule 12b-2 of the Exchange Act.:
Large accelerated filer Accelerated filer
Non-accelerated filer Smaller reporting company
(Do not check if a smaller reporting company)
Indicate by check mark whether the registrant is a shell company (as defined in Rule 12b-2 of the Act). YES NO
The aggregate market value of ordinary shares held by nonaffiliates on June 30, 2016 was approximately $16.4 billion based on the closing price of such stock on the New York Stock Exchange.
The number of ordinary shares outstanding as of February 1, 2017 was 259,508,972.
DOCUMENTS INCORPORATED BY REFERENCE
Portions of the registrant’s proxy statement to be filed within 120 days of the close of the registrant’s fiscal year in connection with the registrant’s Annual General Meeting of Shareholders to be held June 8, 2017 are incorporated by reference into Part II and Part III of this Form 10-K.


2016 ANNUAL REPORT | PAGE 3
2016 Annual Report
INGERSOLL-RAND PLC
Form 10-K For the Fiscal Year Ended December 31, 2016
TABLE OF CONTENTS
Page
Part I Item 1. Business 5
Item 1A. Risk Factors 11
Item 1B. Unresolved Staff Comments 18
Item 2. Properties 18
Item 3. Legal Proceedings 19
Item 4. Mine Safety Disclosures 19
Part II Item 5. Market for Registrant’s Common Equity, Related Stockholder Matters and Issuer Purchases of Equity Securities 20
Item 6. Selected Financial Data 22
Item 7. Management’s Discussion and Analysis of Financial Condition and Results of Operations 22
Item 7A. Quantitative and Qualitative Disclosure About Market Risk 37
Item 8. Financial Statements and Supplementary Data 38
Item 9. Changes in and Disagreements with Accountants on Accounting and Financial Disclosure 39
Item 9A. Controls and Procedures 39
Item 9B. Other Information 39
Part III Item 10. Directors, Executive Officers and Corporate Governance 40
Item 11. Executive Compensation 40
Item 12. Security Ownership of Certain Beneficial Owners and Management and Related Stockholder Matters 40
Item 13. Certain Relationships and Related Transactions, and Director Independence 40
Item 14. Principal Accountant Fees and Services 40
Part IV Item 15. Exhibits and Financial Statement Schedules 41
Item 16. Form 10-K Summary 49
Signatures 49

PAGE 4 | INGERSOLL RAND
2016
Ann
ual R
epor
t
CAUTIONARY STATEMENT FOR FORWARD LOOKING STATEMENTS
Certain statements in this report, other than purely historical information, are “forward-looking statements” within the meaning of the Private Securities Litigation Reform Act of 1995, Section 27A of the Securities Act of 1933 and Section 21E of the Securities Exchange Act of 1934. These forward-looking statements generally are identified by the words “believe,” “project,” “expect,” “anticipate,” “estimate,” “forecast,” “outlook,” “intend,” “strategy,” “plan,” “may,” “could,” “should,” “will,” “would,” “will be,” “will continue,” “will likely result,” or the negative thereof or variations thereon or similar terminology generally intended to identify forward-looking statements.
Forward-looking statements may relate to such matters as projections of revenue, margins, expenses, tax provisions, earnings, cash flows, benefit obligations, share or debt repurchases or other financial items; any statements of the plans, strategies and objectives of management for future operations, including those relating to any statements concerning expected development, performance or market share relating to our products and services; any statements regarding future economic conditions or our performance; any statements regarding pending investigations, claims or disputes; any statements of expectation or belief; and any statements of assumptions underlying any of the foregoing. These statements are based on currently available information and our current assumptions, expectations and projections about future events. While we believe that our assumptions, expectations and projections are reasonable in view of the currently available information, you are cautioned not to place undue reliance on our forward-looking statements. You are advised to review any further disclosures we make on related subjects in materials we file with or furnish to the SEC. Forward-looking statements speak only as of the date they are made and are not guarantees of future performance. They are subject to future events, risks and uncertainties - many of which are beyond our control - as well as potentially inaccurate assumptions, that could cause actual results to differ materially from our expectations and projections. We do not undertake to update any forward-looking statements.
Factors that might affect our forward-looking statements include, among other things:
• overall economic, political and business conditions in the markets in which we operate;
• the demand for our products and services;
• competitive factors in the industries in which we compete;
• changes in tax requirements (including tax rate changes, new tax laws and revised tax law interpretations);
• the outcome of any litigation, governmental investigations, claims or proceedings;
• the outcome of any income tax audits or settlements;
• interest rate fluctuations and other changes in borrowing costs;
• other capital market conditions, including availability of funding sources;
• currency exchange rate fluctuations, exchange controls and currency devaluations;
• availability of and fluctuations in the prices of key commodities and the impact of higher energy prices;
• impairment of our goodwill, indefinite-lived intangible assets and/or our long-lived assets;
• climate change, changes in weather patterns and seasonal fluctuations;
• the impact of potential information technology or data security breaches;
• the strategic acquisition of businesses, product lines and joint ventures; and
• the possible effects on us of future tax and other legislation (including legislation that may limit or eliminate potential tax benefits resulting from our incorporation in a non-U.S. jurisdiction, such as Ireland).
Some of the significant risks and uncertainties that could cause actual results to differ materially from our expectations and projections are described more fully in Part I, Item 1A “Risk Factors.” You should read that information in conjunction with “Management’s Discussion and Analysis of Financial Condition and Results of Operations” in Part II, Item 7 of this report and our Consolidated Financial Statements and related notes in Part II, Item 8 “Financial Statements and Supplementary Data” of this report. We note such information for investors as permitted by the Private Securities Litigation Reform Act of 1995.

2016 ANNUAL REPORT | PAGE 5
2016 Annual Report
PART I
ITEM 1. BUSINESSOVERVIEWIngersoll-Rand plc (Plc or Parent Company), a public limited company incorporated in Ireland in 2009, and its consolidated subsidiaries (collectively, we, our, the Company) is a diversified, global company that provides products, services and solutions to enhance the quality, energy efficiency and comfort of air in homes and buildings, transport and protect food and perishables and increase industrial productivity and efficiency. Our business segments consist of Climate and Industrial, both with strong brands and leading positions within their respective markets. We generate revenue and cash primarily through the design, manufacture, sale and service of a diverse portfolio of industrial and commercial products that include well-recognized, premium brand names such as Ingersoll-Rand®, Trane®, Thermo King®, American Standard®, ARO®, and Club Car®.
To achieve our mission of being a world leader in creating comfortable, sustainable and efficient environments, we continue to focus on growth by increasing our recurring revenue stream from parts, service, controls, used equipment and rentals; and to continuously improve the efficiencies and capabilities of the products and services of our businesses. We also continue to focus on operational excellence strategies as a central theme to improving our earnings and cash flows.
BUSINESS SEGMENTSOur business segments provide products, services and solutions used to increase the efficiency and productivity of both industrial and commercial operations and homes, as well as improve the health and comfort of people around the world.
Our business segments are as follows:
Climate
Our Climate segment globally delivers energy-efficient products and innovative energy services. It includes Trane® and American Standard® Heating & Air Conditioning which provide heating, ventilation and air conditioning (HVAC) systems, and commercial and residential building services, parts, support and controls; energy services and building automation through Trane Building Advantage and Nexia; and Thermo King® transport temperature control solutions. This segment had 2016 net revenues of $10.5 billion.
Industrial
Our Industrial segment delivers products and services that enhance energy efficiency, productivity and operations. It includes compressed air and gas systems and services, power tools, material handling systems, ARO® fluid management equipment, as well as Club Car® golf, utility and consumer low-speed vehicles. This segment had 2016 net revenues of $3.0 billion.
Segment Revenue and profit information and additional financial data and commentary on recent financial results for operating segments are provided in the Results of Operations section in Part II, Item 7. “Management’s Discussion and Analysis of Financial Condition and Results of Operations” and in Note 18 to the Consolidated Financial Statements in Part II, Item 8 “Financial Statements and Supplementary Data” of this Annual Report on Form 10-K.

PART I
PAGE 6 | INGERSOLL RAND
2016
Ann
ual R
epor
t
PRODUCTS AND SERVICESOur principal products and services by business segment include the following:
Climate
Aftermarket and OEM parts and supplies Hybrid and non-diesel transport refrigeration solutions
Air conditioners Indoor air quality
Air exchangers Industrial refrigeration
Air handlers Installation contracting
Airside and terminal devices Large commercial unitary
Auxiliary power units Light commercial unitary
Building management systems Motor replacements
Bus and rail HVAC systems Package heating and cooling systems
Chillers Performance contracting
Coils and condensers Rail refrigeration systems
Container refrigeration systems and gensets Refrigerant reclamation
Control systems Repair and maintenance services
Cryogenic refrigeration systems Rental services
Diesel-powered refrigeration systems Self-powered truck refrigeration systems
Ductless systems Service agreements
Energy management services Temporary heating and cooling systems
Facility management services Thermostats/controls
Furnaces Trailer refrigeration systems
Geothermal systems Transport heater products
Heat pumps Unitary systems (light and large)
Home automation Vehicle-powered truck refrigeration systems
Humidifiers Water source heat pumps
Industrial
Compressors (centrifugal, reciprocating, and rotary) Fluid power components
Air treatment and air separation systems Installation contracting
Aftermarket controls, parts, accessories and consumables Power tools (air, cordless and electric)
Airends Precision fastening systems
Blowers Pumps (diaphragm and piston)
Dryers Rental services
Engine starting systems Rough terrain (AWD) vehicles
Ergonomic material handling systems Service agreements
Filters Service break/fix
Fluid handling systems Utility and consumer low-speed vehicles
Golf vehicles Visage® mobile golf information systems
Hoists (air, electric and manual) Winches (air, electric and hydraulic)
These products are sold primarily under our name and under other names including American Standard, ARO, Club Car, Nexia, Thermo King and Trane.
ACQUISITIONSOn January 1, 2015, we completed the acquisition of the assets of Cameron International Corporation’s Centrifugal Compression (Engineered Centrifugal Compression) business for approximately $850 million. The acquired business manufactures centrifugal compression equipment and provides aftermarket parts and services for global industrial applications, air separation, gas transmission and process gas. The acquisition was funded through a combination of cash on hand and debt. The results of the Engineered Centrifugal Compression business have been included in our consolidated financial statements since the date of the acquisition and reported within our Industrial segment.
On March 4, 2015, we acquired 100% of the outstanding stock of FRIGOBLOCK for approximately ¤100 million (approximately $113 million). The acquisition was funded through a combination of cash on hand and debt. The acquired business manufactures and designs transport refrigeration units for trucks and trailers, which it sells primarily in Western Europe. The results of the FRIGOBLOCK business have been included in our consolidated financial statements since the date of the acquisition and reported within our Climate segment.

PART I
2016 ANNUAL REPORT | PAGE 7
2016 Annual Report
COMPETITIVE CONDITIONSOur products and services are sold in highly competitive markets throughout the world. Due to the diversity of these products and services and the variety of markets served, we encounter a wide variety of competitors that vary by product line and services. They include well-established regional or specialized competitors, as well as larger U.S. and non-U.S. corporations or divisions of larger companies.
The principal methods of competition in these markets relate to price, quality, delivery, service and support, technology and innovation. We believe that we are one of the leading manufacturers in the world of HVAC systems and services, air compression systems, transport temperature control products, power tools, and golf, utility and consumer low-speed vehicles.
DISTRIBUTIONOur products are distributed by a number of methods, which we believe are appropriate to the type of product. U.S. sales are made through branch sales offices, distributors and dealers across the country. Non-U.S. sales are made through numerous subsidiary sales and service companies with a supporting chain of distributors throughout the world.
OPERATIONS BY GEOGRAPHIC AREAApproximately 35% of our net revenues in 2016 were derived outside the U.S. and we sold products in more than 100 countries. Therefore, the attendant risks of manufacturing or selling in a particular country, such as currency devaluation, nationalization and establishment of common markets, may have an adverse impact on our non-U.S. operations. For a discussion of risks associated with our non-U.S. operations, see “Risk Factors – Our global operations subject us to economic risks,” and “Risk Factors – Currency exchange rate fluctuations and other related risks may adversely affect our results,” in Item 1A and “Quantitative and Qualitative Disclosure about Market Risk” in Item 7A. Additional geographic data is provided in Note 18 to the Consolidated Financial Statements.
CUSTOMERSWe have no customer that accounted for more than 10% of our consolidated net revenues in 2016, 2015 or 2014. No material part of our business is dependent upon a single customer or a small group of customers; therefore, the loss of any one customer would not have a material adverse effect on our results of operations or cash flows.
RAW MATERIALSWe manufacture many of the components included in our products, which requires us to employ a wide variety of commodities. Principal commodities, such as steel, copper and aluminum, are purchased from a large number of independent sources around the world. In the past, variability in prices for some commodities, particularly steel and non-ferrous metals, have caused margin pressure in some of our businesses. We have historically been able to adjust pricing with customers to maintain our margins; however, we may not always be able to offset these cost changes with price changes.
We believe that available sources of supply will generally be sufficient for the foreseeable future. There have been no commodity shortages which have had a material adverse effect on our businesses. However, significant changes in certain material costs may have an adverse impact on our costs and operating margins. To mitigate this potential impact, we enter into long-term supply contracts in order to manage our exposure to potential supply disruptions.
WORKING CAPITALWe manufacture products that must be readily available to meet our customers’ rapid delivery requirements. Therefore, we maintain an adequate level of working capital to support our business needs and our customers’ requirements. Such working capital requirements are not, however, in the opinion of management, materially different from those experienced by our major competitors. We believe our sales and payment terms are competitive in and appropriate for the markets in which we compete.
SEASONALITYDemand for certain of our products and services is influenced by weather conditions. For instance, sales in our commercial and residential HVAC businesses historically tend to be seasonally higher in the second and third quarters of the year because this represents summer in the U.S. and other northern hemisphere markets, which is the peak season for sales of air conditioning systems and services. Therefore, results of any quarterly period may not be indicative of expected results for a full year and unexpected cool trends or unseasonably warm trends during the summer season could negatively or positively affect certain segments of our business and impact overall results of operations.

PART I
PAGE 8 | INGERSOLL RAND
2016
Ann
ual R
epor
t
RESEARCH AND DEVELOPMENTWe engage in research and development activities in an effort to introduce new products, enhance existing product effectiveness, improve ease of use and reliability as well as expand the various applications for which our products may be appropriate. In addition, we continually evaluate developing technologies in areas that we believe will enhance our business for possible investment or acquisition. We anticipate that we will continue to make significant expenditures for research and development activities as we look to maintain and improve our competitive position.
PATENTS AND LICENSESWe own numerous patents and patent applications, and are licensed under others. Although in aggregate we consider our patents and licenses to be valuable to our operations, we do not believe that our business is materially dependent on a single patent or license or any group of them. In our opinion, engineering, production skills and experience are more responsible for our market position than our patents and/or licenses.
BACKLOGOur approximate backlog of orders, believed to be firm, at December 31, was as follows:
In millions 2016 2015
Climate $ 1,754.4 $ 1,557.0
Industrial 443.2 574.0
Total $2,197.6 $2,131.0
These backlog figures are based on orders received. While the major portion of our products are built in advance of order and either shipped or assembled from stock, orders for specialized machinery or specific customer application are submitted with extensive lead times and are often subject to revision and deferral, and to a lesser extent cancellation or termination. We expect to ship substantially all the December 31, 2016 backlog during 2017.
ENVIRONMENTAL MATTERSWe continue to be dedicated to an environmental program to reduce the utilization and generation of hazardous materials during the manufacturing process and to remediate identified environmental concerns. As to the latter, we are currently engaged in site investigations and remediation activities to address environmental cleanup from past operations at current and former manufacturing facilities.
We are sometimes a party to environmental lawsuits and claims and have received notices of potential violations of environmental laws and regulations from the Environmental Protection Agency and similar state authorities. We have also been identified as a potentially responsible party (PRP) for cleanup costs associated with off-site waste disposal at federal Superfund and state remediation sites. For all such sites, there are other PRPs and, in most instances, our involvement is minimal.
In estimating our liability, we have assumed that we will not bear the entire cost of remediation of any site to the exclusion of other PRPs who may be jointly and severally liable. The ability of other PRPs to participate has been taken into account, based on our understanding of the parties’ financial condition and probable contributions on a per site basis. Additional lawsuits and claims involving environmental matters are likely to arise from time to time in the future.
For a further discussion of our potential environmental liabilities, see Note 19 to the Consolidated Financial Statements.

PART I
2016 ANNUAL REPORT | PAGE 9
2016 Annual Report
ASBESTOS RELATED MATTERSCertain of our wholly-owned subsidiaries are named as defendants in asbestos-related lawsuits in state and federal courts. In many of the lawsuits, a large number of other companies have also been named as defendants. The vast majority of those claims allege injury caused by exposure to asbestos contained in certain historical products, primarily pumps, boilers and railroad brake shoes. None of our existing or previously-owned businesses were a producer or manufacturer of asbestos.
See also the discussion under Part I, Item 3, “Legal Proceedings,” and Part II, Item 7, “Management’s Discussion and Analysis of Financial Condition and Results of Operations,” “Contingent Liabilities,” as well as further detail in Note 19 to the Consolidated Financial Statements.
EMPLOYEESAs of December 31, 2016, we employed approximately 45,000 people throughout the world.
AVAILABLE INFORMATIONWe file annual, quarterly, and current reports, proxy statements, and other documents with the SEC under the Securities Exchange Act of 1934.
This Annual Report on Form 10-K, as well as our quarterly reports on Form 10-Q, current reports on Form 8-K and any amendments to all of the foregoing reports, are made available free of charge on our Internet website (http://www.ingersollrand.com) as soon as reasonably practicable after such reports are electronically filed with or furnished to the SEC. The Board of Directors of the Company has also adopted and posted in the Investor Relations section of the Company’s website our Corporate Governance Guidelines and charters for each of the Board’s standing committees. The contents of the Company’s website are not incorporated by reference in this report.

PART I
PAGE 10 | INGERSOLL RAND
2016
Ann
ual R
epor
t
EXECUTIVE OFFICERS OF THE REGISTRANTThe following is a list of executive officers of the Company as of February 13, 2017.
Name and Age
Date of Service as
an Executive Officer
Principal Occupation and Other Information for Past Five Years
Michael W. Lamach (53) 2/16/2004
Chairman of the Board (since June 2010) and Chief Executive Officer (since February 2010); President and Chief Operating Officer (2009-2010); Senior Vice President and President, Trane Commercial Systems (2008-2009); Senior Vice President and President, Security Technologies (2004-2008)
Susan K. Carter (58) 10/2/2013
Senior Vice President and Chief Financial Officer (since October 2013); Executive Vice President and Chief Financial Officer, KBR Inc. (a global engineering, construction and services business), (2009-2013); Executive Vice President and Chief Financial Officer, Lennox International Inc. (a heating, air conditioning and refrigeration company), (2004 to 2009)
Marcia J. Avedon (55) 2/7/2007Senior Vice President, Human Resources, Communications and Corporate Affairs (since June 2013); Senior Vice President, Human Resources and Communications (2007 - 2013)
Paul A. Camuti (55) 8/1/2011
Senior Vice President, Innovation and Chief Technology Officer (since August 2011); President, Smart Grid Applications, Siemens Energy, Inc. (an energy technology subsidiary of Siemens Corporation) (2010 -2011); President, Research Division, Siemens Corporation (a diversified global technology company) (2009 - 2010); President and Chief Executive Officer, Siemens Corporate Research, Inc. (the research subsidiary of Siemens Corporation) (2005 - 2009)
Maria C. Green (64) 11/2/2015
Senior Vice President and General Counsel (since November 2015); Senior Vice President, General Counsel and Secretary, Illinois Tool Works Inc. (a global manufacturer of a diversified range of industrial products and equipment), (2012-2015); Vice President, General Counsel & Secretary, Illinois Tool Works Inc. (2011-2012)
Gary S. Michel (54) 8/1/2011Senior Vice President and President, Residential HVAC and Supply (since December 2013); Senior Vice President and President, Residential Solutions (2011-2013); President and Chief Executive Officer, Club Car (2007 - 2011)
Didier Teirlinck (60) 6/4/2008Executive Vice President, Climate Segment (since December 2013); Senior Vice President and President, Climate Solutions (2009-2013); President, Climate Control Technologies (2008-2009); President, Climate Control Europe (2005-2008)
Keith A. Sultana (47) 10/12/2015Senior Vice President, Global Operations and Integrated Supply Chain (since October 2015); Vice President, Global Procurement (January 2015 to October 2015); Vice President, Global Integrated Supply Chain (GISC) for Climate Solutions (2010 to 2014)
Robert G. Zafari (58) 7/1/2010Executive Vice President, Industrial Segment (since December 2013); Senior Vice President and President, Industrial Technologies (2010-2013); President, TCS and Climate Solutions EMEIA (2009-2010); President, Security Technologies ESA (2007-2008)
Christopher J. Kuehn (44) 6/1/2015
Vice President and Chief Accounting Officer (since June 2015); Vice President and Corporate Controller, Whirlpool Corporation (a global manufacturer and marketer of major home appliances), (2012-2015); Vice President, Global CFO Thermal Equipment and Services Segment, SPX Corporation (a global supplier of infrastructure equipment platforms in heating, ventilation and air conditioning (HVAC), (2008-2012)
No family relationship exists between any of the above-listed executive officers of the Company. All officers are elected to hold office for one year or until their successors are elected and qualified.

PART I
2016 ANNUAL REPORT | PAGE 11
2016 Annual Report
ITEM 1A. RISK FACTORSOur business, financial condition, results of operations, and cash flows are subject to a number of risks that could cause the actual results and conditions to differ materially from those projected in forward-looking statements contained in this Annual Report on Form 10-K. The risks set forth below are those we consider most significant. We face other risks, however, that we do not currently perceive to be material but could cause actual results and conditions to differ materially from our expectations. You should evaluate all risks before you invest in our securities. If any of the risks actually occur, our business, financial condition, results of operations or cash flows could be adversely impacted. In that case, the trading price of our ordinary shares could decline, and you may lose all or part of your investment.
Our global operations subject us to economic risks.
Our global operations are dependent upon products manufactured, purchased and sold in the U.S. and internationally, including Europe, China, Brazil, Venezuela, Middle East, Africa, India, Argentina, Mexico and Russia. These activities are subject to risks that are inherent in operating globally, including:
• changes in local laws and regulations or imposition of currency restrictions and other restraints;
• limitation of ownership rights, including expropriation of assets by a local government, and limitation on the ability to repatriate earnings;
• sovereign debt crises and currency instability in developed and developing countries;
• trade protection measures such as import or export restrictions and requirements, the imposition of burdensome tariffs and quotas or revocation or material modification of trade agreements;
• difficulty in staffing and managing global operations;
• difficulty of enforcing agreements, collecting receivables and protecting assets through non-U.S. legal systems;
• national and international conflict, including war, civil disturbances and terrorist acts; and
• recessions, economic downturns, slowing economic growth and social and political instability.
These risks could increase our cost of doing business internationally, increase our counterparty risk, disrupt our operations, disrupt the ability of suppliers and customers to fulfill their obligations, limit our ability to sell products in certain markets and have a material adverse impact on our results of operations, financial condition, and cash flows.
We face significant competition in the markets that we serve and our growth is dependent, in part, on the development, commercialization and acceptance of new products and services.
The markets that we serve are highly competitive. We compete worldwide with a number of other manufacturers and distributors that produce and sell similar products. There has been consolidation and new entrants within our industries and there may be future consolidation and new entrants which could result in increased competition and significantly alter the dynamics of the competitive landscape in which we operate. Due to our global footprint we are competing worldwide with large companies and with smaller, local operators who may have customer, regulatory or economic advantages in the geographies in which they are located.
In addition, we must develop and commercialize new products and services in a rapidly changing technological and business environment in order to remain competitive in our current and future markets and in order to continue to grow our business. The development and commercialization of new products and services require a significant investment of resources and an anticipation of the impact of new technologies and the ability to compete with others who may have superior resources. We cannot provide any assurance that any new product or service will be successfully commercialized in a timely manner, if ever, or, if commercialized, will result in returns greater than our investment. Investment in a product or service could divert our attention and resources from other projects that become more commercially viable in the market. We also cannot provide any assurance that any new product or service will be accepted by our current and future markets. Failure to develop new products and services that are accepted by these markets could have a material adverse impact on our competitive position, results of operations, financial condition, and cash flows.
The capital and credit markets are important to our business.
Instability in U.S. and global capital and credit markets, including market disruptions, limited liquidity and interest rate volatility, or reductions in the credit ratings assigned to us by independent rating agencies could reduce our access to capital markets or increase the cost of funding our short and long term credit requirements. In particular, if we are unable to access capital and credit markets on terms that are acceptable to us, we may not be able to make certain investments or fully execute our business plans and strategies.

PART I
PAGE 12 | INGERSOLL RAND
2016
Ann
ual R
epor
t
Our suppliers and customers are also dependent upon the capital and credit markets. Limitations on the ability of customers, suppliers or financial counterparties to access credit at interest rates and on terms that are acceptable to them could lead to insolvencies of key suppliers and customers, limit or prevent customers from obtaining credit to finance purchases of our products and services and cause delays in the delivery of key products from suppliers.
Currency exchange rate fluctuations and other related risks may adversely affect our results.
We are exposed to a variety of market risks, including the effects of changes in currency exchange rates. See Part II Item 7A, “Quantitative and Qualitative Disclosure About Market Risk.”
We have operations throughout the world that manufacture and sell products in various international markets. As a result, we are exposed to movements in exchange rates of various currencies against the U.S. dollar as well as against other currencies throughout the world.
Many of our non-U.S. operations have a functional currency other than the U.S. dollar, and their results are translated into U.S. dollars for reporting purposes. Therefore, our reported results will be higher or lower depending on the weakening or strengthening of the U.S. dollar against the respective foreign currency.
We use derivative instruments to hedge those material exposures that cannot be naturally offset. The instruments utilized are viewed as risk management tools, involve little complexity and are not used for trading or speculative purposes. To minimize the risk of counter party non-performance, derivative instrument agreements are made only through major financial institutions with significant experience in such derivative instruments.
We also face risks arising from the imposition of exchange controls and currency devaluations. Exchange controls may limit our ability to convert foreign currencies into U.S. dollars or to remit dividends and other payments by our foreign subsidiaries or businesses located in or conducted within a country imposing controls. Currency devaluations result in a diminished value of funds denominated in the currency of the country instituting the devaluation.
Material adverse legal judgments, fines, penalties or settlements could adversely affect our results of operations or financial condition.
We are currently and may in the future become involved in legal proceedings and disputes incidental to the operation of our business or the business operations of previously-owned entities. Our business may be adversely affected by the outcome of these proceedings and other contingencies (including, without limitation, contract claims or other commercial disputes, product liability, product defects and asbestos-related matters) that cannot be predicted with certainty. Moreover, any insurance or indemnification rights that we may have may be insufficient or unavailable to protect us against the total aggregate amount of losses sustained as a result of such proceedings and contingencies. As required by generally accepted accounting principles in the United States, we establish reserves based on our assessment of contingencies. Subsequent developments in legal proceedings and other events could affect our assessment and estimates of the loss contingency recorded as a reserve and we may be required to make additional material payments, which could have a material adverse impact on our liquidity, results of operations, financial condition, and cash flows.
Our reputation, ability to do business and results of operations could be impaired by improper conduct by any of our employees, agents or business partners.
We are subject to regulation under a wide variety of U.S. federal and state and non-U.S. laws, regulations and policies, including laws related to anti-corruption, export and import compliance, anti-trust and money laundering, due to our global operations. We cannot provide assurance our internal controls will always protect us from the improper conduct of our employees, agents and business partners. Any violations of law or improper conduct could damage our reputation and, depending on the circumstances, subject us to, among other things, civil and criminal penalties, material fines, equitable remedies (including profit disgorgement and injunctions on future conduct), securities litigation and a general loss of investor confidence, any one of which could have a material adverse impact on our business prospects, financial condition, results of operations, cash flows, and the market value of our stock.
We may be subject to risks relating to our information technology systems.
We rely extensively on information technology systems, some of which are supported by third party vendors including cloud services, to manage and operate our business. We are also investing in new information technology systems that are designed to continue improving our operations. If these systems cease to function properly, if these systems experience security breaches or disruptions or if these systems do not provide the anticipated benefits, our ability to manage our operations could be impaired, which could have a material adverse impact on our results of operations, financial condition, and cash flows.

PART I
2016 ANNUAL REPORT | PAGE 13
2016 Annual Report
Security breaches or disruptions of our technology systems, infrastructure or products could negatively impact our business and financial results.
Our information technology systems and infrastructure and technology embedded in certain of our control products may be subject to cyber attacks and unauthorized security intrusions. It is possible for such vulnerabilities to remain undetected for an extended period. In addition, hardware, software or applications we develop or obtain from third parties may contain defects in design or manufacture or other problems that could unexpectedly result in security breaches or disruptions. The methods used to obtain unauthorized access, disable or degrade service, or sabotage systems are constantly changing and evolving. Despite having instituted security policies and business continuity plans, and implementing and regularly reviewing and updating processes and procedures to protect against unauthorized access, the ever-evolving threats mean we must continually evaluate and adapt our systems and processes, and there is no guarantee that they will be adequate to safeguard against all data security breaches or misuses of data. Our systems, networks and certain of our control products may be vulnerable to system damage, malicious attacks from hackers, employee errors or misconduct, viruses, power and utility outages, and other catastrophic events that could cause significant harm to our business by negatively impacting our business operations, compromising the security of our proprietary information or the personally identifiable data relating to our customers, employees and business partners and exposing us to litigation that could adversely affect our reputation. Such events could have a material adverse impact on our results of operations, financial condition and cash flows. Our insurance coverage may not be adequate to cover all the costs related to a cybersecurity attack or disruptions resulting from such attacks.
Commodity shortages and price increases and higher energy prices could adversely affect our financial results.
We rely on suppliers to secure commodities, particularly steel and non-ferrous metals, required for the manufacture of our products. A disruption in deliveries from our suppliers or decreased availability of commodities could have an adverse effect on our ability to meet our commitments to customers or increase our operating costs. We believe that available sources of supply will generally be sufficient for our needs for the foreseeable future. Nonetheless, the unavailability of some commodities could have a material adverse impact on our results of operations and cash flows.
Volatility in the prices of these commodities or the impact of inflationary increases could increase the costs of our products and services. We may not be able to pass on these costs to our customers and this could have a material adverse impact on our results of operations and cash flows. Conversely, in the event there is deflation, we may experience pressure from our customers to reduce prices. There can be no assurance that we would be able to reduce our costs (through negotiations with suppliers or other measures) to offset any such price concessions which could adversely impact results of operations and cash flows. We do not currently use financial derivatives to hedge against this volatility. While we use fixed price contracts to mitigate this exposure, we expect any future hedging activity to seek to minimize near-term volatility of the commodity prices which would not protect us from long-term commodity price increases.
Additionally, we are exposed to large fluctuations in the price of petroleum-based fuel due to the instability of current market prices. Higher energy costs increase our operating costs and the cost of shipping our products, and supplying services, to customers around the world. Consequently, sharp price increases, the imposition of taxes or an interruption of supply, could cause us to lose the ability to effectively manage the risk of rising fuel prices and may have a material adverse impact on our results of operations and cash flows.
We may be required to recognize impairment charges for our goodwill and other indefinite-lived intangible assets.
At December 31, 2016, the net carrying value of our goodwill and other indefinite-lived intangible assets totaled $5.7 billion and $2.7 billion, respectively. In accordance with generally accepted accounting principles, we periodically assess these assets to determine if they are impaired. Significant negative industry or economic trends, disruptions to our business, unexpected significant changes or planned changes in use of the assets, divestitures and sustained market capitalization declines may result in recognition of impairments to goodwill or other indefinite-lived assets. Any charges relating to such impairments could have a material adverse impact on our results of operations in the periods recognized.
Global climate change and related regulations could negatively affect our business.
Refrigerants are essential to many of our products and there is a growing awareness and concern regarding global warming potential of such materials. As such, national, regional and international regulations and policies are being considered to curtail their use. As we begin to see regulations impeding the use of the current class of widely used refrigerants we are planning for, and managing transitions to, sustainable solutions. We have committed to increase energy efficiency and reduce our climate impact with operational and product-related climate targets, including among other initiatives: (i) 50 percent reduction in the greenhouse gas emissions refrigerant footprint of our products for our customers by 2020 and lower global warming potential alternatives across our portfolio by 2030; (ii) $500 million investment in product-related research and development from 2015-2020 to fund the long-term reduction of greenhouse gas emissions; and (iii) 35 percent reduction in the greenhouse gas footprint of our office buildings, manufacturing facilities and fleet by 2020. While we are committed to pursuing these sustainable solutions, there can be no assurance that our commitments will be successful, that our products will be accepted by the market, that proposed regulation or deregulation will not have a negative competitive impact or that economic returns will match the investment that we are making in new product development.

PART I
PAGE 14 | INGERSOLL RAND
2016
Ann
ual R
epor
t
Concerns regarding global climate change may result in more international, regional and/or federal requirements to reduce or mitigate global warming and these regulations could mandate even more restrictive standards than the voluntary commitments that we have made or require such changes on a more accelerated timeframe. There continues to be a lack of consistent climate legislation, which creates economic and regulatory uncertainty. In addition, there are discussions regarding potential defunding of climate-related international agreements and/or initiatives that could affect our competitiveness in certain markets. Such regulatory uncertainty extends to future incentives for energy efficient buildings and vehicles and costs of compliance, which may impact the demand for our products, obsolescence of our products and our results of operations.
In addition, to the extent climate change influences weather patterns, such changes could also disrupt our operations by causing business interruptions or by impacting the availability and cost of materials needed for manufacturing and could increase insurance and other operating costs. These factors may impact our decisions to construct new facilities or maintain existing facilities in areas most prone to physical climate risks.
Some of the markets in which we operate are cyclical and seasonal and demand for our products and services could be adversely affected by downturns in these industries.
Demand for most of our products and services depends on the level of new capital investment and planned maintenance expenditures by our customers. The level of capital expenditures by our customers fluctuates based on planned expansions, new builds, repairs, commodity prices, general economic conditions, availability of credit, inflation, interest rates, market forecasts, regulatory developments, trade policies, fiscal spending and sociopolitcal factors among others.
Our commercial and residential HVAC businesses, which collectively represent 63% of our net revenues, provide products and services to a wide range of markets, including significant sales to the commercial and residential construction markets. Weakness in either or both of these construction markets may negatively impact the demand for our products and services.
Demand for our commercial and residential HVAC business is also influenced by weather conditions. For instance, sales in our commercial and residential HVAC businesses historically tend to be seasonally higher in the second and third quarters of the year because, in the U.S. and other northern hemisphere markets, summer is the peak season for sales of air conditioning systems and services. The results of any quarterly period may not be indicative of expected results for a full year and unexpected cool trends or unseasonably warm trends during the summer season could negatively or positively affect our business and impact overall results of operations.
The business of many of our industrial customers, particularly oil and gas companies are to varying degrees cyclical and have experienced periodic downturns. During such economic downturns, customers in these industries historically have tended to delay major capital projects, maintenance projects and upgrades.
Decrease in the demand or our products and services could have a material adverse impact on our results of operations and cash flow.
Our business strategy includes acquiring companies, entering into joint ventures and making investments that complement our existing businesses. We may not identify acquisition or joint venture candidates at the same rate as the past. Acquisitions, joint ventures and investments that we identify could be unsuccessful or consume significant resources, which could adversely affect our operating results.
We continue to analyze and evaluate the acquisition of strategic businesses and product lines, joint ventures and investments with the potential to strengthen our industry position, enhance our existing set of product and services offerings or grow revenues, earnings and cash flow. There can be no assurance that we will identify or successfully complete transactions with suitable candidates in the future, that we will consummate these transactions at rates similar to the past or that completed transactions will be successful. Acquisitions, joint ventures and investments may involve significant cash expenditures, debt incurrence, operating losses and expenses that could have a material adverse effect on our business, financial condition, results of operations and cash flows. Such transactions involve numerous other risks, including:
• diversion of management time and attention from daily operations;
• difficulties integrating acquired businesses, technologies and personnel into our business;
• difficulties in obtaining and verifying the financial statements and other business information of acquired businesses;
• inability to obtain required regulatory approvals and/or required financing on favorable terms;
• potential loss of key employees, key contractual relationships or key customers of either acquired businesses or our business;
• assumption of the liabilities and exposure to unforeseen or undisclosed liabilities of acquired businesses;
• dilution of interests of holders of our common shares through the issuance of equity securities or equity-linked securities; and
• in the case of joint ventures and other investments, interests that diverge from those of our partners without the ability to direct the management and operations of the joint venture or investment in the manner we believe most appropriate.

PART I
2016 ANNUAL REPORT | PAGE 15
2016 Annual Report
It may be difficult for us to complete transactions quickly and to integrate acquired operations efficiently into our business operations. Any acquisitions, joint ventures or investments may ultimately harm our business, financial condition, results of operations and cash flows, as such transactions may not be successful and may ultimately result in impairment charges.
Our operations are subject to regulatory risks.
Our U.S. and non-U.S. operations are subject to a number of laws and regulations, including among others, laws related to the environment and health and safety. We have made, and will be required to continue to make, significant expenditures to comply with these laws and regulations. Any violations of applicable laws and regulations could lead to significant penalties, fines or other sanctions. Changes in current laws and regulations could require us to increase our compliance expenditures, cause us to significantly alter or discontinue offering existing products and services or cause us to develop new products and services. Altering current products and services or developing new products and services to comply with changes in the applicable laws and regulations could require significant research and development investments, increase the cost of providing the products and services and adversely affect the demand for our products and services. The U.S. federal government and various states and municipalities have enacted or may enact legislation intended to deny government contracts to U.S. companies that reincorporate outside of the U.S. or have reincorporated outside of the U.S or may take other actions negatively impacting such companies. If we are unable to effectively respond to changes to applicable laws and regulations, interpretations of applicable laws and regulations, or comply with existing and future laws and regulations, our competitive position, results of operations, financial condition and cash flows could be materially adversely impacted.
RISKS RELATING TO OUR PAST SPIN-OFF TRANSACTIONIn December 2013, we completed the spin-off of our former commercial and residential security businesses to our shareholders (the spin-off) pursuant to which each shareholder as of the record date for the spin-off received one ordinary share of Allegion plc (Allegion) for every three Ingersoll-Rand plc ordinary shares. Allegion is now an independent public company. This spin-off exposed us and our shareholders to the risks described below. In addition, we cannot be assured that all of the anticipated benefits of the spin-off and subsequent to the spin-off will be realized.
If the distribution or certain internal transactions undertaken in anticipation of the spin-off are determined to be taxable for U.S. federal income tax purposes, we, our shareholders as of the time of the distribution that are subject to U.S. federal income tax and/or Allegion could incur significant U.S. federal income tax liabilities.
We received a ruling from the U.S. Internal Revenue Service (IRS) substantially to the effect that, among other things, the distribution of Allegion plc’s ordinary shares, together with certain related transactions, will qualify for tax-free treatment under Sections 355 and 368(a) of the U.S. Internal Revenue Code of 1986, as amended (the Code), with the result that we and our shareholders will not recognize any taxable income, gain or loss for U.S. federal income tax purposes as a result of the spin-off, except to the extent of cash received in lieu of fractional shares (the IRS Ruling). The IRS Ruling also provides that specified internal transactions undertaken in anticipation of the distribution will qualify for favorable treatment under the Code. In addition, we received opinions from the law firm of Simpson Thacher & Bartlett LLP substantially to the effect that specified requirements, including certain requirements that the IRS will not rule on, necessary to obtain tax-free treatment have been satisfied, such that the distribution for U.S. federal income tax purposes and certain other matters relating to the distribution, including certain internal transactions undertaken in anticipation of the distribution, will receive tax-free treatment under Section 355 of the Code. The IRS Ruling and the opinions relied on certain facts and assumptions and certain representations and undertakings from us and Allegion regarding the past and future conduct of our respective businesses and other matters.
Notwithstanding the IRS Ruling and the opinions, the IRS could determine on audit that the distribution or the internal transactions should be treated as taxable transactions if it determines that any of these facts, assumptions, representations or undertakings is not correct or has been violated, or that the distribution or the internal transactions should be taxable for other reasons, including as a result of significant changes in shares or asset ownership after the distribution. A legal opinion represents the tax adviser’s best legal judgment and is not binding on the IRS or the courts, and the IRS or the courts may not agree with the opinion. In addition, the opinion is based on current law and cannot be relied upon if current law changes with retroactive effect. If the distribution, and/or internal transactions, ultimately is determined to be taxable, we or Allegion could incur significant U.S. federal income tax liabilities, which could cause a material adverse impact on our business, financial condition, results of operations and cash flows in future reporting periods.
Furthermore, if, notwithstanding receipt of the IRS Ruling and opinions, the spin-off were determined to be a taxable transaction, each shareholder subject to U.S. federal income tax who received shares of Allegion in the spin-off would generally be treated as receiving a taxable distribution of property in an amount equal to the fair market value of the Allegion shares received. That distribution would be taxable as a dividend to the extent of our then-current and accumulated earnings and profits. Any amount that exceeded our earnings and profits would be treated first as a non-taxable return of capital to the extent of the applicable shareholder’s tax basis in our ordinary shares with any remaining amount being taxed as a capital gain.
PART I
PAGE 16 | INGERSOLL RAND
2016
Ann
ual R
epor
t
Under the terms of the Tax Matters Agreement between us and Allegion executed in connection with the spin-off, in the event the distribution or the internal transactions were determined to be taxable as a result of actions taken after the distribution by us or Allegion, the party responsible for such failure would be responsible for all taxes imposed on us or Allegion as a result thereof. If such failure is not the result of actions taken after the distribution by us or Allegion, then Allegion would be responsible for any taxes imposed on us or Allegion as a result of such determination. Such tax amounts could be significant. If Allegion were to default in its obligation to us to pay such taxes, we could be legally liable under applicable tax law for such liabilities and required to make additional tax payments. Accordingly, under certain circumstances, we may be obligated to pay amounts in excess of our agreed-upon share of tax liabilities. To the extent we are responsible for any liability under the Tax Matters Agreement, there could be a material adverse impact on our business, financial condition, results of operations and cash flows in future reporting periods.
If the distribution is determined to be taxable for Irish tax purposes, significant Irish tax liabilities may arise.
We received an opinion of the Irish Revenue regarding the Irish tax consequences of the distribution to the effect that certain reliefs and exemptions for corporate reorganizations apply. In addition to obtaining the opinion from Irish Revenue, we also received opinions from the law firm of Arthur Cox confirming the applicability of the relevant exemptions and reliefs to the distribution as well as received opinions from other external advisers that certain internal transactions will not trigger Irish tax costs as well. These opinions relied on certain facts and assumptions and certain representations and undertakings from us and Allegion regarding the past and future conduct of our respective businesses and other matters. Notwithstanding the opinions, Irish Revenue could determine on audit that the distribution or the internal transactions do not qualify for the relevant exemptions or reliefs if it determines that any of these facts, assumptions, representations or undertakings is not correct or has been violated. A legal opinion represents the tax adviser’s best legal judgment and is not binding on Irish Revenue or the courts and Irish Revenue or the courts may not agree with the legal opinion. In addition, the legal opinion is based on current law and cannot be relied upon if current law changes with retroactive effect. If the distribution ultimately is determined not to fall within certain exemptions or reliefs, the distribution could result in certain of our shareholders having an Irish tax liability as a result of the distribution, or we or Allegion could incur Irish tax liabilities. To the extent we are responsible for any such liability under the Tax Matters Agreement, there could be a material adverse impact on our business, financial condition, results of operations and cash flows in future reporting periods.
RISKS RELATING TO OUR OPERATIONS AND CORPORATE STRUCTUREOur corporate structure has resulted from prior corporate reorganizations and related transactions, including our corporate reorganization in December 2001 to become a Bermuda company (the Bermuda Reorganization) and subsequent corporate reorganization in July 2009 to become an Irish public limited company. These various transactions exposed us and our shareholders to the risks described below. In addition, we cannot be assured that all of the anticipated benefits of our operations and corporate structure will be realized.
Changes in tax or other laws, regulations or treaties, changes in our status under U.S. or non-U.S. laws or adverse determinations by taxing or other governmental authorities could increase our tax burden or otherwise affect our financial condition or operating results, as well as subject our shareholders to additional taxes.
The realization of any tax benefit related to our operations and corporate structure could be impacted by changes in tax or other laws, treaties or regulations or the interpretation or enforcement thereof by the U.S. or non-U.S. tax or other governmental authorities. From time to time, proposals have been made and/or legislation has been introduced to change the tax laws, regulations or interpretations thereof of various jurisdictions or limit tax treaty benefits that if enacted or implemented could materially increase our tax burden and/or effective tax rate and could have a material adverse impact on our financial condition and results of operations. For instance, certain U.S. legislative proposals would broaden the circumstances under which we would be considered a U.S. resident for U.S. tax purposes, which would significantly diminish the realization of any tax benefit related to our operations and corporate structure. There are other U.S. legislative proposals that could modify or eliminate the tax deductibility of various currently deductible payments, which could materially and adversely affect our effective tax rate and cash tax position. In addition, other U.S. legislative proposals could have a material adverse impact on us by overriding certain tax treaties and limiting the treaty benefits on certain payments by our U.S. subsidiaries to our non-U.S. affiliates, which could increase our tax liability. In addition, there are current proposals and active discussions regarding fundamental changes to the U.S. tax law; for example, repatriation of non-U.S. earnings with respect to which we have not previously provided for U.S. taxes. Moreover, the Organization for Economic Co-operation and Development has released proposals to create an agreed set of international rules for fighting base erosion and profit shifting, such that tax laws in countries in which we do business could change on a prospective or retroactive basis, and any such changes could adversely impact us. Finally, the European Commission has been very active in investigating whether various tax regimes or private tax rulings provided by a country to particular taxpayers may constitute State Aid. We cannot predict the outcome of any of these potential changes or investigations in any of the jurisdictions, but if any of the above occurs and impacts us, this could materially increase our tax burden and/or effective tax rate and could have a material adverse impact on our financial condition and results of operations.

PART I
2016 ANNUAL REPORT | PAGE 17
2016 Annual Report
While we monitor proposals and other developments that would materially impact our tax burden and/or effective tax rate and investigate our options, we could still be subject to increased taxation on a going forward basis no matter what action we undertake if certain legislative proposals or regulatory changes are enacted, certain tax treaties are amended and/or our interpretation of applicable tax or other laws is challenged and determined to be incorrect. In particular, any changes and/or differing interpretations of applicable tax law that have the effect of disregarding the Ireland Reorganization, limiting our ability to take advantage of tax treaties between jurisdictions, modifying or eliminating the deductibility of various currently deductible payments, or increasing the tax burden of operating or being resident in a particular country, could subject us to increased taxation.
While our U.S. operations are subject to U.S. tax, we believe that a significant portion of our non-U.S. operations are generally not subject to U.S. tax other than withholding taxes. The IRS or a court, however, may not concur with our conclusions including our determination that we, and a significant number of our foreign subsidiaries, are not controlled foreign corporations (CFC) within the meaning of the U.S. tax laws. A contrary determination, which could also arise through significant future acquisitions of our stock by U.S. persons, could also potentially cause U.S. holders (direct, indirect or constructive owners) of 10% or more of our stock (or the voting stock of our non-U.S. subsidiaries) to include in their gross income their pro rata share of certain of our and our non-U.S. subsidiary income for the period during which we (and our non-U.S. subsidiaries) were a CFC. In addition, gain (or a portion of such gain) realized on CFC shares sold by such shareholders may be treated as ordinary income depending on certain facts. Treatment of us or any of our non-U.S. subsidiaries as a CFC could have a material adverse impact on our results of operations, financial condition, and cash flows.
The inability to realize any anticipated tax benefits related to our operations and corporate structure could have a material adverse impact on our results of operations, financial condition, and cash flows.
Irish law differs from the laws in effect in the United States and may afford less protection to holders of our securities.
The United States currently does not have a treaty with Ireland providing for the reciprocal recognition and enforcement of judgments in civil and commercial matters. As such, there is some uncertainty as to whether the courts of Ireland would recognize or enforce judgments of U.S. courts obtained against us or our directors or officers based on U.S. federal or state civil liability laws, including the civil liability provisions of the U.S. federal or state securities laws, or hear actions against us or those persons based on those laws.
As an Irish company, we are governed by the Irish Companies Act, which differs in some material respects from laws generally applicable to U.S. corporations and shareholders, including, among others, differences relating to interested director and officer transactions and shareholder lawsuits. Likewise, the duties of directors and officers of an Irish company generally are owed to the company only. Shareholders of Irish companies generally do not have a personal right of action against directors or officers of the company and may exercise such rights of action on behalf of the company only in limited circumstances. Accordingly, holders of our securities may have more difficulty protecting their interests than would holders of securities of a corporation incorporated in a jurisdiction of the United States.
In addition, Irish law allows shareholders to authorize share capital which then can be issued by a board of directors without shareholder approval. Also, subject to specified exceptions, Irish law grants statutory pre-emptive rights to existing shareholders to subscribe for new issuances of shares for cash, but allows shareholders to authorize the waiver of the statutory pre-emptive rights with respect to any particular allotment of shares. Under Irish law, we must have authority from our shareholders to issue any shares, including shares that are part of the Company’s authorized but unissued share capital. In addition, unless otherwise authorized by its shareholders, when an Irish company issues shares for cash to new shareholders, it is required first to offer those shares on the same or more favorable terms to existing shareholders on a pro-rata basis. If we are unable to obtain these authorizations from our shareholders, or are otherwise limited by the terms of our authorizations, our ability to issue shares or otherwise raise capital could be adversely affected.
Dividends received by our shareholders may be subject to Irish dividend withholding tax.
In certain circumstances, we are required to deduct Irish dividend withholding tax (currently at the rate of 20%) from dividends paid to our shareholders. In the majority of cases, shareholders resident in the United States will not be subject to Irish withholding tax, and shareholders resident in a number of other countries will not be subject to Irish withholding tax provided that they complete certain Irish dividend withholding tax forms. However, some shareholders may be subject to withholding tax, which could have an adverse impact on the price of our shares.

PART I
PAGE 18 | INGERSOLL RAND
2016
Ann
ual R
epor
t
Dividends received by our shareholders could be subject to Irish income tax.
Dividends paid in respect of our shares will generally not be subject to Irish income tax where the beneficial owner of these dividends is exempt from dividend withholding tax, unless the beneficial owner of the dividend has some connection with Ireland other than his or her shareholding in Ingersoll-Rand plc.
Our shareholders who receive their dividends subject to Irish dividend withholding tax will generally have no further liability to Irish income tax on the dividends unless the beneficial owner of the dividend has some connection with Ireland other than his or her shareholding in Ingersoll-Rand plc.
ITEM 1B. UNRESOLVED STAFF COMMENTSNone.
ITEM 2. PROPERTIESAs of December 31, 2016, we owned or leased a total of approximately 31 million square feet of space worldwide. Manufacturing and assembly operations are conducted in 51 plants across the world. We also maintain various warehouses, offices and repair centers throughout the world. The majority of our plant facilities are owned by us with the remainder under long-term lease arrangements. We believe that our plants have been well maintained, are generally in good condition and are suitable for the conduct of our business.
The locations by segment of our principal plant facilities at December 31, 2016 were as follows:
Climate
Americas Europe Asia Pacific and India
Curitiba, Brazil Kolin, Czech Republic Zhong Shan, China
Monterrey, Mexico Charmes, France Taicang, China
Arecibo, Puerto Rico Golbey, France Bangkok, Thailand
Fort Smith, Arkansas * Galway, Ireland Penang, Malaysia
Pueblo, Colorado Barcelona, Spain
Lynn Haven, Florida Essen, Germany
Macon, Georgia
Vidalia, Georgia
Rushville, Indiana
Lexington, Kentucky
St. Paul, Minnesota
Hastings, Nebraska
Trenton, New Jersey
Columbia, South Carolina
Clarksville, Tennessee
Tyler, Texas
Waco, Texas
La Crosse, Wisconsin
Charlotte, North Carolina
* The Fort Smith, Arkansas location has two plants.
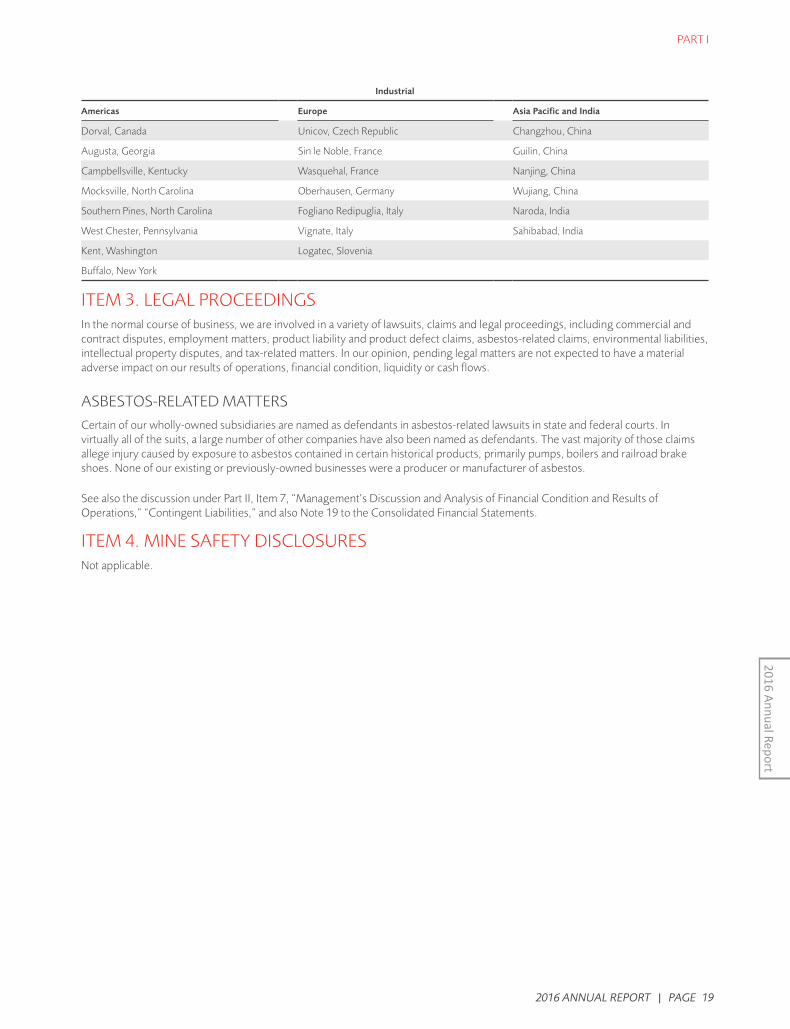
PART I
2016 ANNUAL REPORT | PAGE 19
2016 Annual Report
Industrial
Americas Europe Asia Pacific and India
Dorval, Canada Unicov, Czech Republic Changzhou, China
Augusta, Georgia Sin le Noble, France Guilin, China
Campbellsville, Kentucky Wasquehal, France Nanjing, China
Mocksville, North Carolina Oberhausen, Germany Wujiang, China
Southern Pines, North Carolina Fogliano Redipuglia, Italy Naroda, India
West Chester, Pennsylvania Vignate, Italy Sahibabad, India
Kent, Washington Logatec, Slovenia
Buffalo, New York
ITEM 3. LEGAL PROCEEDINGSIn the normal course of business, we are involved in a variety of lawsuits, claims and legal proceedings, including commercial and contract disputes, employment matters, product liability and product defect claims, asbestos-related claims, environmental liabilities, intellectual property disputes, and tax-related matters. In our opinion, pending legal matters are not expected to have a material adverse impact on our results of operations, financial condition, liquidity or cash flows.
ASBESTOS-RELATED MATTERSCertain of our wholly-owned subsidiaries are named as defendants in asbestos-related lawsuits in state and federal courts. In virtually all of the suits, a large number of other companies have also been named as defendants. The vast majority of those claims allege injury caused by exposure to asbestos contained in certain historical products, primarily pumps, boilers and railroad brake shoes. None of our existing or previously-owned businesses were a producer or manufacturer of asbestos.
See also the discussion under Part II, Item 7, “Management’s Discussion and Analysis of Financial Condition and Results of Operations,” “Contingent Liabilities,” and also Note 19 to the Consolidated Financial Statements.
ITEM 4. MINE SAFETY DISCLOSURESNot applicable.

PAGE 20 | INGERSOLL RAND
2016
Ann
ual R
epor
t
PART II
ITEM 5. MARKET FOR REGISTRANT’S COMMON EQUITY, RELATED STOCKHOLDER MATTERS AND ISSUER PURCHASES OF EQUITY SECURITIESInformation regarding the principal market for our ordinary shares and related shareholder matters is as follows:
Our ordinary shares are traded on the New York Stock Exchange under the symbol IR. As of February 1, 2017, the approximate number of record holders of ordinary shares was 3,451.
The high and low sales price per share and the dividend declared per share for the following periods were as follows:
Ordinary shares
2016 High Low Dividend
First quarter $62.48 $47.08 $0.32
Second quarter 67.48 59.10 0.32
Third quarter 68.97 62.40 0.32
Fourth quarter 79.21 63.87 0.40
2015 High Low Dividend
First quarter $69.01 $60.15 $0.29
Second quarter 70.93 65.47 0.29
Third quarter 69.28 49.80 0.29
Fourth quarter 60.43 49.74 0.29
Future dividends on our ordinary shares, if any, will be at the discretion of our Board of Directors and will depend on, among other things, our results of operations, cash requirements and surplus, financial condition, contractual restrictions and other factors that the Board of Directors may deem relevant, as well as our ability to pay dividends in compliance with the Irish Companies Act 2014. Under the Irish Companies Act 2014, dividends and distributions may only be made from distributable reserves. Distributable reserves, broadly, means the accumulated realized profits (so far as not previously distributed or capitalized) less its accumulated, realized losses (so far as not previously written off in a reduction or reorganization of its share capital) of Ingersoll-Rand plc. In addition, no distribution or dividend may be made unless the net assets of Ingersoll-Rand plc are equal to, or in excess of, the aggregate of Ingersoll-Rand plc’s called up share capital plus undistributable reserves and the distribution does not reduce Ingersoll-Rand plc’s net assets below such aggregate.
Information regarding equity compensation plans required to be disclosed pursuant to this Item is incorporated by reference from our definitive proxy statement for the Annual General Meeting of Shareholders.
ISSUER PURCHASES OF EQUITY SECURITIESThe following table provides information with respect to purchases by us of our ordinary shares during the quarter ended December 31, 2016:
Period
Total number of shares purchased
(000’s) (a) (b)
Average price paid per share (a) (b)
Total number of shares purchased
as part of program (000’s) (a)
Approximate dollar value of shares still available to
be purchased under the program
($000’s) (a) (c)
October 1 - October 31 10.5 $ 67.72 – $416,639
November 1 - November 30 0.1 75.56 – $416,639
December 1 - December 31 34.4 75.38 – $416,639
Total 45.0 $73.59 –
(a) In February 2014, our Board of Directors authorized the repurchase of up to $1.5 billion of our ordinary shares under a share repurchase program, which began in April 2014. Share repurchases will be made from time to time at the discretion of management subject to market conditions, regulatory requirements and other considerations. The repurchase program does not have a prescribed expiration date.

PART II
2016 ANNUAL REPORT | PAGE 21
2016 Annual Report
(b) We may also reacquire shares outside of the repurchase program from time to time in connection with the surrender of shares to cover taxes on vesting of share based awards. We reacquired 10,474 shares in October, 83 shares in November and 34,354 shares in December in transactions outside the repurchase programs.
(c) In February 2017, our Board of Directors authorized the repurchase of up to $1.5 billion of our ordinary shares under a new share repurchase program upon completion of the current share repurchase program. Share repurchases will be made from time to time at the discretion of management subject to market conditions, regulatory requirements and other considerations. The repurchase program does not have a prescribed expiration date. The authorized shares under the new share repurchase program are not included in the approximate dollar value of shares still available to be purchased in the table above.
PERFORMANCE GRAPHThe following graph compares the cumulative total shareholder return on our ordinary shares with the cumulative total return on (i) the Standard & Poor’s 500 Stock Index and (ii) the Standard & Poor’s 500 Industrial Index for the five years ended December 31, 2016. The graph assumes an investment of $100 in our ordinary shares, the Standard & Poor’s 500 Stock Index and the Standard & Poor’s 500 Industrial Index on December 31, 2011 and assumes the reinvestment of dividends.
Ingersoll Rand S&P 500 S&P 500 Industrials Index
50
100
150
200
250
300
350
2011 2012 2013 20152014 2016
Inde
x Va
lue
100
160
259
271
242
334
Company/Index 2011 2012 2013 2014 2015 2016
Ingersoll Rand 100 160 259 271 242 334
S&P 500 100 116 153 174 176 197
S&P 500 Industrials Index 100 115 161 177 173 205

PART II
PAGE 22 | INGERSOLL RAND
2016
Ann
ual R
epor
t
ITEM 6. SELECTED FINANCIAL DATAIn millions, except per share amounts:
At and for the years ended December 31, 2016 2015 2014 2013 2012
Net revenues $ 13,508.9 $ 13,300.7 $ 12,891.4 $ 12,350.5 $ 11,988.3
Net earnings (loss) attributable to Ingersoll-Rand plc ordinary shareholders:
Continuing operations 1,443.3 688.9 897.0 620.1 772.4
Discontinued operations 32.9 (24.3) 34.7 (1.3) 246.2
Total assets 17,397.4 16,717.6 17,274.6 17,641.5 18,475.2
Total debt 4,070.2 4,217.8 4,200.5 3,504.6 3,222.5
Total Ingersoll-Rand plc shareholders’ equity 6,643.8 5,816.7 5,987.4 7,068.9 7,147.8
Earnings (loss) per share attributable to Ingersoll-Rand plc ordinary shareholders:
Basic:
Continuing operations $ 5.57 $ 2.60 $ 3.32 $ 2.11 $ 2.54
Discontinued operations 0.13 (0.09) 0.12 — 0.81
Diluted:
Continuing operations $ 5.52 $ 2.57 $ 3.27 $ 2.08 $ 2.49
Discontinued operations 0.13 (0.09) 0.13 (0.01) 0.79
Dividends declared per ordinary share $ 1.36 $ 1.16 $ 1.00 $ 0.63 $ 0.69
1. 2012 Dividends declared per ordinary share includes a dividend of $0.21 per ordinary share, declared in December 2012, and payable on March 28, 2013 to shareholders of record on March 12, 2013.
2. Total assets and Total debt for all periods presented were updated for the adoption of ASU 2015-03. See Note 2 to the Consolidated Financial Statement for a discussion of recently adopted accounting pronouncements.
ITEM 7. MANAGEMENT’S DISCUSSION AND ANALYSIS OF FINANCIAL CONDITION AND RESULTS OF OPERATIONSThe following Management’s Discussion and Analysis of Financial Condition and Results of Operations contains forward-looking statements that involve risks and uncertainties. Our actual results may differ materially from the results discussed in the forward-looking statements. Factors that might cause a difference include, but are not limited to, those discussed under Item 1A. Risk Factors in this Annual Report on Form 10-K. The following section is qualified in its entirety by the more detailed information, including our financial statements and the notes thereto, which appears elsewhere in this Annual Report.
OVERVIEWOrganization
We are a diversified, global company that provides products, services and solutions to enhance the quality, energy efficiency and comfort of air in homes and buildings, transport and protect food and perishables and increase industrial productivity and efficiency. Our business segments consist of Climate and Industrial, both with strong brands and leading positions within their respective markets. We generate revenue and cash primarily through the design, manufacture, sale and service of a diverse portfolio of industrial and commercial products that include well-recognized, premium brand names such as Ingersoll-Rand®, Trane®, Thermo King®, American Standard®, ARO®, and Club Car®.
To achieve our mission of being a world leader in creating comfortable, sustainable and efficient environments, we continue to focus on growth by increasing our recurring revenue stream from parts, service, controls, used equipment and rentals; and to continuously improve the efficiencies and capabilities of the products and services of our businesses. We also continue to focus on operational excellence strategies as a central theme to improving our earnings and cash flows.
Trends and Economic Events
We are a global corporation with worldwide operations. As a global business, our operations are affected by worldwide, regional and industry-specific economic factors, as well as political factors, wherever we operate or do business. Our geographic and industry diversity, and the breadth of our product and services portfolios, have helped mitigate the impact of any one industry or the economy of any single country on our consolidated operating results.

PART II
2016 ANNUAL REPORT | PAGE 23
2016 Annual Report
Given the broad range of products manufactured and geographic markets served, management uses a variety of factors to predict the outlook for the Company. We monitor key competitors and customers in order to gauge relative performance and the outlook for the future. We regularly perform detailed evaluations of the different market segments we are serving to proactively detect trends and to adapt our strategies accordingly. In addition, we believe our order rates are indicative of future revenue and thus a key measure of anticipated performance. In those industry segments where we are a capital equipment provider, revenues depend on the capital expenditure budgets and spending patterns of our customers, who may delay or accelerate purchases in reaction to changes in their businesses and in the economy.
Current economic conditions continue to show mixed trends in each of the segments in which we participate. Heating, Ventilation, and Air Conditioning (HVAC) equipment replacement and aftermarket continue to experience strong demand. In addition, Residential and Commercial new construction have seen continued momentum in the United States which is positively impacting the results of our HVAC businesses. However, non-residential markets in both Europe and Asia remain challenged and global Industrial markets remain flat, with some positive signs in our shorter-cycle businesses. Going forward, we expect moderate growth within our Climate segment and continued soft markets in our Industrial segment, each benefiting from operational excellence initiatives, new product launches and continued productivity programs.
Despite the current market environment, we believe we have a solid foundation of global brands and leading market shares in all of our major product lines. Our growing geographic and industry diversity coupled with our large installed product base provides growth opportunities within our service, parts and replacement revenue streams. In addition, we are investing substantial resources to innovate and develop new products and services which we expect will drive our future growth.
Significant Events
2016 Dividend Increase and Share Repurchase Program
In October 2016, we announced an increase in our quarterly share dividend from $0.32 to $0.40 per ordinary share. This reflects a 25% increase that began with our December 2016 payment. In February 2016, we increased our quarterly share dividend from $0.29 to $0.32 per ordinary share.
In February 2014, our Board of Directors authorized the repurchase of up to $1.5 billion of our ordinary shares under a share repurchase program that began in April 2014. Share repurchases are made from time to time at the discretion of management subject to market conditions, regulatory requirements and other considerations. Since the program’s inception, we have repurchased and settled 19.1 million shares for $1.1 billion. We have approximately $417 million remaining on the authorized plan.
In February 2017, our Board of Directors authorized the repurchase of up to $1.5 billion of our ordinary shares under a new share repurchase program upon completion of the current share repurchase program. Share repurchases will be made from time to time at the discretion of management subject to market conditions, regulatory requirements and other considerations.
Sale of Hussmann Minority Interest
During 2011, we completed the sale of a controlling interest of our Hussmann refrigerated display case business (Hussmann) to a newly-formed affiliate (Hussmann Parent) of private equity firm Clayton Dubilier & Rice, LLC (CD&R). Per the terms of the agreement, CD&R’s ownership interest in Hussmann at the acquisition date was 60% with the remaining 40% being retained by us. As a result, we accounted for our interest in Hussmann using the equity method of accounting.
On December 21, 2015, we announced we would sell our remaining equity interest in Hussmann as part of a transaction in which Panasonic Corporation would acquire 100 percent of Hussmann’s outstanding shares. The transaction was completed on April 1, 2016. We received net proceeds of $422.5 million, including closing settlement amounts, for our interest and recognized a gain of $397.8 million on the sale.
IRS Exam Results
In July 2015, we entered into an agreement with the U.S. Internal Revenue Service (IRS) to resolve disputes related to withholding and income taxes for years 2002 through 2011 (the IRS Agreement). The IRS had previously disagreed with our tax treatment of intercompany debt and distributions and asserted we owed income and withholding tax relating to the 2002-2006 period totaling $774 million, not including interest and penalties. We also provided a substantial amount of information to the IRS in connection with its audit of the 2007-2011 tax periods. We expected the IRS to propose similar adjustments to these periods, although it was not known how the IRS would apply its position to the different facts presented in these years or whether the IRS would take a similar position to intercompany debt instruments not outstanding in prior years.

PART II
PAGE 24 | INGERSOLL RAND
2016
Ann
ual R
epor
t
The resolution reached in July 2015 covered intercompany debt and related issues for the entire period from 2002 through 2011 and includes all aspects of the dispute with the U.S. Tax Court, the Appeals Division and the Examination Division of the IRS. The resolution was subsequently reported to the Congressional Joint Committee on Taxation (JCT), as required, for its review. The JCT concluded its review without objection in December 2015 and the settlement was finalized with the IRS in December 2015.
Pursuant to the agreement with the IRS, we agreed to pay withholding tax and interest of $412 million in respect to the 2002-2006 years. We owed no additional tax with respect to intercompany debt and related matters for the years 2007-2011. No penalties were applied to any of the tax years 2002 through 2011. The resolution resulted in a net cash outflow in 2015 of approximately $364 million, consisting of $230 million in tax and $134 million of interest, net of a tax benefit of $48 million.
Acquisitions
On January 1, 2015, we completed the acquisition of the assets of Cameron International Corporation’s Centrifugal Compression (Engineered Centrifugal Compression) business for approximately $850 million. The acquired business manufactures centrifugal compression equipment and provides aftermarket parts and services for global industrial applications, air separation, gas transmission and process gas. The acquisition was funded through a combination of cash on hand and debt. The results of the Engineered Centrifugal Compression business have been included in our consolidated financial statements since the date of the acquisition and reported within our Industrial segment.
On March 4, 2015, we acquired 100% of the outstanding stock of FRIGOBLOCK for approximately ¤100 million (approximately $113 million). The acquisition was funded through a combination of cash on hand and debt. The acquired business manufactures and designs transport refrigeration units for trucks and trailers, which it sells primarily in Western Europe. The results of the FRIGOBLOCK business have been included in our consolidated financial statements since the date of the acquisition and reported within our Climate segment.
RESULTS OF OPERATIONSOur Climate segment globally delivers energy-efficient products and innovative energy services. It includes Trane® and American Standard® Heating & Air Conditioning which provide heating, ventilation and air conditioning (HVAC) systems, and commercial and residential building services, parts, support and controls; energy services and building automation through Trane Building Advantage and Nexia; and Thermo King® transport temperature control solutions.
Our Industrial segment delivers products and services that enhance energy efficiency, productivity and operations. It includes compressed air and gas systems and services, power tools, material handling systems, ARO® fluid management equipment, as well as Club Car® golf, utility and consumer low-speed vehicles.
Segment operating income is the measure of profit and loss that our chief operating decision maker uses to evaluate the financial performance of the business and as the basis for performance reviews, compensation and resource allocation. For these reasons, we believe that Segment operating income represents the most relevant measure of segment profit and loss. We define Segment operating margin as Segment operating income as a percentage of Net revenues.
Year Ended December 31, 2016 Compared to the Year Ended December 31, 2015
Dollar amounts in millions 2016 2015 Period Change2016
% of Revenues2015
% of Revenues
Net revenues $13,508.9 $13,300.7 $ 208.2
Cost of goods sold (9,329.3) (9,301.6) (27.7) 69.1% 69.9%
Selling and administrative expenses (2,606.5) (2,541.1) (65.4) 19.3% 19.1%
Operating income 1,573.1 1,458.0 115.1 11.6% 11.0%
Interest expense (221.5) (223.0) 1.5
Other income/(expense), net 389.7 12.9 376.8
Earnings before income taxes 1,741.3 1,247.9 493.4
Provision for income taxes (281.5) (540.8) 259.3
Earnings from continuing operations 1,459.8 707.1 752.7
Gain (loss) from discontinued operations, net of tax 32.9 (24.3) 57.2
Net earnings $ 1,492.7 $ 682.8 $ 809.9

PART II
2016 ANNUAL REPORT | PAGE 25
2016 Annual Report
Net Revenues
Net revenues for the year ended December 31, 2016 increased by 1.6%, or $208.2 million, compared with the same period of 2015. The components of the period change are as follows:
Volume/product mix 2.2%
Acquisitions 0.1%
Pricing 0.3%
Currency translation (1.0)%
Total 1.6%
The increase was primarily driven by higher volumes in our Climate segment. Improved pricing, along with incremental revenues from acquisitions, further contributed to the year-over-year increase. These amounts were partially offset by lower volumes in our Industrial segment and overall unfavorable foreign currency exchange rate movements.
Our Revenues by segment are as follows:
Dollar amounts in millions 2016 2015 % change
Climate $ 10,545.0 $ 10,224.3 3.1%
Industrial 2,963.9 3,076.4 (3.7)%
Total $13,508.9 $13,300.7
Climate
Net revenues for the year ended December 31, 2016 increased by 3.1% or $320.7 million, compared with the same period of 2015 The components of the period change are as follows:
Volume/product mix 3.8%
Acquisitions 0.1%
Pricing 0.2%
Currency translation (1.0)%
Total 3.1%
The primary driver of the increase related to incremental volumes in both the Commercial HVAC and Residential HVAC businesses. Commercial HVAC results reflect continued improvements in equipment, parts and service while Residential HVAC results increased with strong order growth and improved pricing. In addition, revenues associated with acquisitions added incremental volume during the current period. Improvements in price across the majority of our businesses further contributed to segment results. However, overall revenue improvements were partially offset by unfavorable foreign currency exchange rate movements.
Industrial
Net revenues for the year ended December 31, 2016 decreased by 3.7% or $112.5 million, compared with the same period of 2015. The components of the period change are as follows:
Volume/product mix (3.2)%
Acquisitions 0.1%
Pricing 0.6%
Currency translation (1.2)%
Total (3.7)%
The primary driver of the decrease related to lower overall volumes in the majority of our businesses due to continued weakness in the industrial markets. Segment results were also negatively impacted by unfavorable foreign currency exchange rate movements. However, the decline was partially offset by improvements in pricing within the majority of our businesses as well as incremental revenue provided by acquisitions.

PART II
PAGE 26 | INGERSOLL RAND
2016
Ann
ual R
epor
t
Operating Income/Margin
Operating margin improved to 11.6% for the year ended December 31, 2016, compared to 11.0% for the same period of 2015. The increase was primarily the result of pricing improvements in excess of material inflation (0.7%), favorable volume and product mix (0.2%), non-recurrence of acquisition related step-up amortization (0.1%) and productivity benefits in excess of other inflation (0.1%) . These amounts were partially offset by a combination of investment and restructuring spending (0.3%), capitalized costs related to new product engineering and development that were reclassified to the income statement (0.1%) and unfavorable foreign currency exchange rate movements (0.1%).
Our Operating income and Operating margin by segment are as follows:
Dollar amounts in millions2016 Operating
Income (Expense)2015 Operating
Income (Expense)Period
Change2016
Operating Margin2015
Operating Margin
Climate $ 1,527.4 $ 1,302.5 $ 224.9 14.5% 12.7%
Industrial 294.9 372.4 (77.5) 10.0% 12.1%
Unallocated corporate expense (249.2) (216.9) (32.3) N/A N/A
Total $1,573.1 $1,458.0 $115.1 11.6% 11.0%
Climate
Operating margin improved to 14.5% for the year ended December 31, 2016, compared to 12.7% for the same period of 2015. The improvement was primarily the result of pricing improvements in excess of material inflation (0.7%), favorable volume and product mix (0.7%) and productivity benefits in excess of other inflation (0.6%). These amounts were partially offset by increased investment and restructuring spending (0.2%).
Industrial
Operating margin decreased to 10.0% for the year ended December 31, 2016 compared to 12.1% for the same period of 2015. The decrease was primarily due to unfavorable volume and product mix (2.1%), increased investment and restructuring spending (0.4%), decreased productivity in excess of other inflation (0.3%), capitalized costs related to new product engineering and development that were reclassified to the income statement (0.3%), and unfavorable foreign currency exchange rate movements (0.2%). These amounts were partially offset by non-recurrence of acquisition related step-up amortization (0.6%) and pricing improvements in excess of material inflation (0.6%).
Unallocated Corporate Expense
Unallocated corporate expense for the year ended December 31, 2016 increased by 14.9% or $32.3 million, compared with the same period of 2015. The increase in expenses primarily relates to higher compensation and benefit charges related to variable compensation during 2016. In addition, higher restructuring charges impacted the current period.
Interest Expense
Interest expense for the year ended December 31, 2016 decreased by $1.5 million compared with the same period of 2015. The decrease relates primarily to changes in short term financing arrangements and other items.
Other income/(expense), net
The components of Other income/(expense), net, for the years ended December 31 are as follows:
In millions 2016 2015Period
Change
Interest income $ 8.0 $ 10.6 $ (2.6)
Foreign exchange gain (loss) (2.0) (36.2) 34.2
Income (loss) from Hussmann equity investment (0.8) 12.6 (13.4)
Gain on sale of Hussmann equity investment 397.8 — 397.8
Other activity, net (13.3) 25.9 (39.2)
Other income/(expense), net $389.7 $ 12.9 $376.8
During the year ended December 31, 2015, we recognized a loss on foreign currency exchange of $36.2 million. This loss is comprised of a $42.6 million pre-tax charge recorded in the first quarter related to the remeasurement of net monetary assets denominated in Venezuelan bolivar. This loss was partially offset by $6.4 million of foreign currency transaction gains resulting from the remeasurement of non-functional balance sheet positions into their functional currency.

PART II
2016 ANNUAL REPORT | PAGE 27
2016 Annual Report
Other activity, net in each period presented, primarily consists of insurance settlements on asbestos related matters and the revaluation of asbestos recoveries. In addition, other activity, net for the year ended December 31, 2016 includes a charge of $16.4 million for the settlement of a lawsuit originally filed by a customer in 2012. The lawsuit related to a commercial HVAC contract entered into in 2001, prior to our acquisition of Trane U.S. Inc. (Trane). The charge represents the settlement and related legal costs recognized during the fourth quarter of 2016.
Provision for Income Taxes
The 2016 effective tax rate was 16.2% which is lower than the U.S. Statutory rate of 35% primarily due to the tax treatment of the Hussmann gain. The gain, which is not subject to tax under the relevant local tax laws, decreased the effective tax rate by 4.8%. In addition, the reduction was also driven by earnings in non-U.S. jurisdictions, which in aggregate, have a lower effective tax rate. Revenues from non-U.S. jurisdictions account for approximately 35% of our total revenues, such that a material portion of our pretax income is earned and taxed outside the U.S. at rates ranging from 0% to 38%. When comparing the results of multiple reporting periods, among other factors, the mix of earnings between U.S. and foreign jurisdictions can cause variability on our overall effective tax rate.
The 2015 effective tax rate was 43.3% which is higher than the U.S. Statutory rate of 35% primarily due to the $227 million charge taken to settle the IRS Agreement, which increased our effective tax rate by 18.1%. This effect was partially offset by a $65 million benefit from the settlement of an audit in a major tax jurisdiction, less a tax charge of $52 million from a change in permanent reinvestment assertions on earnings from certain of our subsidiaries in non-U.S. jurisdictions.
Discontinued Operations
The components of Gain (loss) from discontinued operations, net of tax for the years ended December 31 are as follows:
In millions 2016 2015 Period Change
Pre-tax earnings (loss) from discontinued operations 28.1 (23.2) 51.3
Tax benefit (expense) 4.8 (1.1) 5.9
Gain (loss) from discontinued operations, net of tax $32.9 $(24.3) $ 57.2
Discontinued operations for the years ended December 31, 2016 and 2015 are primarily related to postretirement benefits, product liability, worker’s compensation, tax and legal costs (mostly asbestos-related) from previously sold businesses. In addition, we include amounts related to the 2013 spin-off of our commercial and residential security business, now an independent public company operating under the name of Allegion plc (Allegion). Pre-tax earnings from discontinued operations for the year ended December 31, 2016 includes income realized from settlements with insurance carriers related to asbestos policies. Amounts related to Allegion in both periods primarily represent adjustments for certain tax matters.
Year Ended December 31, 2015 Compared to the Year Ended December 31, 2014
Dollar amounts in millions 2015 2014 Period Change2015
% of Revenues2014
% of Revenues
Net revenues $13,300.7 $12,891.4 $ 409.3
Cost of goods sold (9,301.6) (8,982.8) (318.8) 69.9% 69.8%
Selling and administrative expenses (2,541.1) (2,503.9) (37.2) 19.1% 19.4%
Operating income 1,458.0 1,404.7 53.3 11.0% 10.9%
Interest expense (223.0) (225.3) 2.3
Other income/(expense), net 12.9 30.0 (17.1)
Earnings before income taxes 1,247.9 1,209.4 38.5
Provision for income taxes (540.8) (293.7) (247.1)
Earnings from continuing operations 707.1 915.7 (208.6)
Gain (loss) from discontinued operations, net of tax (24.3) 34.7 (59.0)
Net earnings $ 682.8 $ 950.4 $(267.6)

PART II
PAGE 28 | INGERSOLL RAND
2016
Ann
ual R
epor
t
Net Revenues
Net revenues for the year ended December 31, 2015 increased by 3.2%, or $409.3 million, compared with the same period of 2014, which primarily resulted from the following:
Volume/product mix 4.5%
Acquisitions 2.4%
Pricing 0.2%
Currency translation (3.9)%
Total 3.2%
The increase was primarily driven by higher volumes in our Climate segment. In addition, improved pricing and incremental revenues associated with acquisitions within each segment contributed to the year-over-year increase. These amounts were partially offset by lower volumes in our Industrial segment and overall unfavorable foreign currency exchange rate movements.
Our Revenues by segment are as follows:
Dollar amounts in millions 2015 2014 % change
Climate $ 10,224.3 $ 9,879.7 3.5%
Industrial 3,076.4 3,011.7 2.1%
Total $ 13,300.7 $ 12,891.4
Climate
Net revenues for the year ended December 31, 2015 increased by 3.5% or $344.6 million, compared with the same period of 2014. The components of the period change are as follows:
Volume/product mix 6.4%
Acquisitions 0.4%
Pricing 0.1%
Currency translation (3.4)%
Total 3.5%
The primary driver of the increase related to higher volumes in both the Commercial HVAC and Residential HVAC businesses. Commercial HVAC results reflect continued improvements in equipment, parts and services while Residential HVAC results increased through moderate market growth. In addition, revenues in our Thermo King refrigeration transport business improved through organic growth in North America and Europe. Revenues associated with acquisitions added incremental volume during the current period. However, these improvements were partially offset by unfavorable foreign currency exchange rate movements.
Industrial
Net revenues for the year ended December 31, 2015 increased by 2.1%, or $64.7 million, compared with the same period of 2014. The components of the period change are as follows:
Volume/product mix (1.6)%
Acquisitions 8.9%
Pricing 0.4%
Currency translation (5.6)%
Total 2.1%
The primary driver of the increase related to the acquisition of the Engineered Centrifugal Compression business during the year. In addition, Club Car revenues increased as a result of gains in golf cars, utility vehicles and aftermarket sales. However, overall organic revenues decreased due to weak Industrial markets. Segment results were also negatively impacted by unfavorable foreign currency exchange rate movements.

PART II
2016 ANNUAL REPORT | PAGE 29
2016 Annual Report
Operating Income/Margin
Operating margin improved to 11.0% for the year ended December 31, 2015, compared to 10.9% for the same period of 2014. The increase was primarily due to productivity benefits in excess of other inflation (0.9%), pricing improvements in excess of material inflation (0.3%) and favorable product mix and volume (0.3%). These amounts were partially offset by increased investment and restructuring spending (0.5%), unfavorable foreign currency exchange rate movements (0.5%), primarily from the Euro, and the inclusion of the Engineered Centrifugal Compression business and related step-up amortization (0.4%).
Our Operating income and Operating margin by segment are as follows:
Dollar amounts in millions2015 Operating
Income (Expense)2014 Operating
Income (Expense)Period
Change2015
Operating Margin2014
Operating Margin
Climate $ 1,302.5 $ 1,195.6 $106.9 12.7% 12.1%
Industrial 372.4 443.0 (70.6) 12.1% 14.7%
Unallocated corporate expense (216.9) (233.9) $ 17.0 N/A N/A
Total $1,458.0 $1,404.7 $53.3 11.0% 10.9%
Climate
Operating margin improved to 12.7% for the year ended December 31, 2015, compared to 12.1% for the same period of 2014. The improvement was primarily due to favorable product mix and volume (0.7%) and productivity benefits in excess of other inflation (0.5%). These amounts were partially offset by increased investment spending (0.3%) and unfavorable foreign currency exchange rate movements (0.3%), primarily from the Euro.
Industrial
Operating margin decreased to 12.1% for the year ended December 31, 2015, compared to 14.7% for the same period of 2014. The decrease was primarily due to the inclusion of the Engineered Centrifugal Compression business and related step-up amortization (1.9%), unfavorable volume/product mix (1.4%), increased investment and restructuring spending (0.9%) and unfavorable foreign currency exchange rate movements (0.8%). These amounts were partially offset by productivity benefits in excess of other inflation (1.8%) and pricing improvements in excess of material inflation (0.6%).
Unallocated Corporate Expense
Unallocated corporate expense for the year ended December 31, 2015 decreased by 7.3% or $17.0 million, compared with the same period of 2014 primarily due to lower professional expenses.
Interest Expense
Interest expense for the year ended December 31, 2015 increased by $2.3 million compared with the same period of 2014, primarily as a result of higher average debt balances during 2015, partially offset by a lower weighted-average interest rate during the period.
Other income/(expense), net
The components of Other income/(expense), net, for the years ended December 31 are as follows:
In millions 2015 2014 Period Change
Interest income $ 10.6 $ 13.2 $ (2.6)
Foreign exchange gain (loss) (36.2) (0.1) (36.1)
Income (loss) from Hussmann equity investment 12.6 7.8 4.8
Other activity, net 25.9 9.1 16.8
Other income/(expense), net $ 12.9 $ 30.0 $(17.1)
During the year ended December 31, 2015, we recognized a loss on foreign currency exchange of $36.2 million. This loss is comprised of a $42.6 million pre-tax charge recorded in the first quarter related to the remeasurement of net monetary assets denominated in Venezuelan bolivar. This loss was partially offset by $6.4 million of foreign currency transaction gains resulting from the remeasurement of non-functional balance sheet positions into their functional currency.
Other activity, net in each period presented, primarily consists of insurance settlements on asbestos-related matters and the revaluation of asbestos recoveries. In addition, other activity, net for the year ended December 31, 2014 includes a $6.0 million gain on the sale of an investment.

PART II
PAGE 30 | INGERSOLL RAND
2016
Ann
ual R
epor
t
Provision for Income Taxes
The 2015 effective tax rate was 43.3% which is higher than the U.S. Statutory rate of 35% primarily due to the $227 million charge taken to settle the IRS Agreement, which increased our effective tax rate by 18.1%. This effect was partially offset by a $65 million benefit from the settlement of an audit in a major tax jurisdiction, less a tax charge of $52 million from a change in permanent reinvestment assertions on earnings from certain of our subsidiaries in non-U.S. jurisdictions.
The 2014 effective tax rate was 24.3%. The 2014 effective tax rate is lower than the U.S. Statutory rate of 35% primarily due to earnings in non-U.S. jurisdictions, which in aggregate have a lower effective rate partially offset by U.S. State and Local income taxes and U.S. tax on non-U.S. earnings.
Discontinued Operations
The components of Gain (loss) from discontinued operations, net of tax for the years ended December 31 are as follows:
In millions 2015 2014 Period Change
Pre-tax earnings (loss) from discontinued operations (23.2) 41.2 (64.4)
Tax benefit (expense) (1.1) (6.5) 5.4
Gain (loss) from discontinued operations, net of tax $(24.3) $ 34.7 $(59.0)
Discontinued operations for the years ended December 31, 2015 and 2014 are primarily related to postretirement benefits, product liability, worker’s compensation, tax and legal costs (mostly asbestos-related) from previously sold businesses. In addition, we include amounts related to the 2013 spin-off of our commercial and residential security business, now an independent public company operating under the name of Allegion. Amounts related to Allegion in both periods primarily represent adjustments for certain tax matters. Pre-tax earnings (loss) from discontinued operations for the year ended December 31, 2014 includes income realized from a settlement with an insurance carrier related to asbestos policies.
LIQUIDITY AND CAPITAL RESOURCESWe assess our liquidity in terms of our ability to generate cash to fund our operating, investing and financing activities. In doing so, we review and analyze our current cash on hand, the number of days our sales are outstanding, inventory turns, capital expenditure commitments and income tax payments. Our cash requirements primarily consist of the following:
• Funding of working capital
• Funding of capital expenditures
• Debt service requirements
Our primary sources of liquidity include cash balances on hand, cash flows from operations, proceeds from debt offerings, commercial paper, and borrowing availability under our existing credit facilities. We earn a significant amount of our operating income in jurisdictions where it is deemed to be permanently reinvested. Our most prominent jurisdiction of operation is the U.S. We expect existing cash and cash equivalents available to the U.S., the cash generated by our U.S. operations, our committed credit lines as well as our expected ability to access the capital and debt markets will be sufficient to fund our U.S. operating and capital needs for at least the next twelve months and thereafter for the foreseeable future. In addition, we expect existing non-U.S. cash and cash equivalents and the cash generated by our non-U.S. operations will be sufficient to fund our non-U.S. operating and capital needs for at least the next twelve months and thereafter for the foreseeable future.
As of December 31, 2016, we had $1,714.7 million of cash and cash equivalents on hand, of which $980.4 million was held by non-U.S. subsidiaries. Cash and cash equivalents held by our non-U.S. subsidiaries are either generally available for use in our U.S. operations via intercompany loans or equity infusions or we intend to permanently reinvest them in our non-U.S. operations. We currently have no plans to repatriate permanently reinvested funds to fund our U.S. operations. However, if we decided to repatriate such funds to our U.S. operations, we would be required to accrue and pay applicable U.S. (and non-U.S.) taxes.
In October 2016, we announced an increase in our quarterly share dividend from $0.32 to $0.40 per ordinary share. This reflects a 25% increase that began with our December 2016 payment. In February 2016, we increased our quarterly share dividend from $0.29 to $0.32 per ordinary share. In February 2014, our Board of Directors authorized the repurchase of up to $1.5 billion of our ordinary shares under a share repurchase program that began in April 2014. Share repurchases are made from time to time at the discretion of management subject to market conditions, regulatory requirements and other considerations. Since the program’s inception, we have repurchased and settled 19.1 million shares for $1.1 billion. We have approximately $417 million remaining on the authorized plan. In February 2017, our Board of Directors authorized the repurchase of up to $1.5 billion of our ordinary shares under a new share repurchase program upon completion of the current share repurchase program. Share repurchases will be made from time to time at the discretion of management subject to market conditions, regulatory requirements and other considerations. We expect our available cash flow, committed credit lines and access to the capital markets will be sufficient to fund the increased dividend and share repurchases.

PART II
2016 ANNUAL REPORT | PAGE 31
2016 Annual Report
Liquidity
The following table contains several key measures of our financial condition and liquidity at the periods ended December 31:
In millions 2016 2015 2014
Cash and cash equivalents $1,714.7 $ 736.8 $1,705.2
Short-term borrowings and current maturities of long-term debt 360.8 504.2 482.7
Long-term debt 3,709.4 3,713.6 3,717.8
Total debt 4,070.2 4,217.8 4,200.5
Total Ingersoll-Rand plc shareholders’ equity 6,643.8 5,816.7 5,987.4
Total equity 6,718.3 5,879.2 6,045.4
Debt-to-total capital ratio 37.7% 41.8% 41.0%
Debt and Credit Facilities
Our short-term obligations primarily consists of current maturities of long-term debt. In addition, we have outstanding $343.0 million of fixed rate debentures that contain a put feature that the holders may exercise on each anniversary of the issuance date. If exercised, we are obligated to repay in whole or in part, at the holder’s option, the outstanding principal amount (plus accrued and unpaid interest) of the debentures held by the holder. We also maintain a commercial paper program which has been used for general corporate purposes. Under the program, the maximum aggregate amount of unsecured commercial paper notes available to be issued, on a private placement basis, is $2 billion as of December 31, 2016. We had no commercial paper outstanding at December 31, 2016. For additional information regarding the terms of our short-term obligations, see Note 7 to the Consolidated Financial Statements.
Our long-term obligations primarily consist of long-term debt with final maturity dates ranging between 2018 and 2044. In addition, we maintain two 5-year, $1.0 billion revolving credit facilities. Each senior unsecured credit facility, one of which matures in March 2019 and the other in March 2021, provides support for our commercial paper program and can be used for working capital and other general corporate purposes. Total commitments of $2.0 billion were unused at December 31, 2016 and December 31, 2015. For additional information regarding the terms of our long-term obligations and their related guarantees, see Note 7 and Note 20 to the Consolidated Financial Statements.
Pension Plans
Our investment objective in managing defined benefit plan assets is to ensure that all present and future benefit obligations are met as they come due. We seek to achieve this goal while trying to mitigate volatility in plan funded status, contribution and expense by better matching the characteristics of the plan assets to that of the plan liabilities. Our approach to asset allocation is to increase fixed income assets as the plan’s funded status improves. We monitor plan funded status and asset allocation regularly in addition to investment manager performance.
We monitor the impact of market conditions on our defined benefit plans on a regular basis. None of our defined benefit pension plans have experienced a significant impact on their liquidity due to the volatility in the markets. For further details on pension plan activity, see Note 10 to the Consolidated Financial Statements.
Cash Flows
The following table reflects the major categories of cash flows for the years ended December 31, respectively. For additional details, please see the Consolidated Statements of Cash Flows in the Consolidated Financial Statements.
In millions 2016 2015 2014
Net cash provided by (used in) continuing operating activities $1,411.3 $ 886.2 $ 991.7
Net cash provided by (used in) continuing investing activities 240.1 (1,192.9) (197.0)
Net cash provided by (used in) continuing financing activities (705.2) (490.3) (859.5)

PART II
PAGE 32 | INGERSOLL RAND
2016
Ann
ual R
epor
t
Operating Activities
Net cash provided by continuing operating activities for the year ended December 31, 2016 was $1,411.3 million, of which net income provided $1,449.8 million after adjusting for non-cash transactions. Changes in assets and liabilities, net used $38.5 million. Improvements in accounts payable were offset by higher accounts receivable balances. Net cash provided by continuing operating activities for the year ended December 31, 2015 was $886.2 million, of which net income provided $1,228.9 million after adjusting for non-cash transactions. Changes in assets and liabilities, net used $342.7 million which was primarily driven by the net cash outflow for the IRS Agreement of approximately $364 million and higher working capital balances. Net cash provided by continuing operating activities for the year ended December 31, 2014 was $991.7 million, of which net income provided $1,213.0 million after adjusting for non-cash transactions. Changes in assets and liabilities, net used $221.3 million which was primarily driven by increases in working capital amounts. Operating cash flow improvements are a result of improved earnings and our continued focus on working capital management.
Investing Activities
Cash flows from investing activities represents inflows and outflows regarding the purchase and sale of assets. Primary activities associated with these items include capital expenditures, proceeds from the sale of property, plant and equipment, acquisitions and divestitures. During the year ended December 31, 2016, net cash provided by investing activities from continuing operations was $240.1 million. The primary driver of the balance is attributable to the proceeds of $422.5 million received from the sale of our Hussmann equity interest during the year. This amount was partially offset by capital expenditures during the year. Net cash used in investing activities from continuing operations for the year ended December 31, 2015 was $1,192.9 million. The primary driver of the outflow related to the acquisition of the Engineered Centrifugal Compression business for approximately $850 million and the acquisition of FRIGOBLOCK for approximately ¤100 million (approximately $113 million). In addition, capital expenditures contributed to the outflow during the year. Net cash used in investing activities from continuing operations for the year ended December 31, 2014 was $197.0 million and primarily related to capital expenditures.
Financing Activities
Cash flows from financing activities represent inflows and outflows that account for external activities affecting equity and debt. Primary activities associated with these actions include paying dividends to shareholders, repurchasing our own shares, issuing our stock and debt transactions. During the year ended December 31, 2016, net cash used in financing activities from continuing operations was $705.2 million. Primary drivers of the cash outflow includes dividends paid to ordinary shareholders and the repurchase of 4.9 million ordinary shares. In addition, we repaid our outstanding commercial paper balance. During the year ended December 31, 2015, net cash used in financing activities from continuing operations was $490.3 million. Primary drivers of the cash outflow includes dividends paid to ordinary shareholders and the repurchase of 4.4 million ordinary shares. During the year ended December 31, 2014, net cash used in financing activities from continuing operations was $859.5 million. Primary drivers of the cash outflow includes dividends paid to ordinary shareholders and the repurchase of 23.0 million ordinary shares. These amounts were partially offset by the net proceeds from the issuance of debt.
Discontinued Operations
Cash flows from discontinued operations primarily represent costs associated with postretirement benefits, product liability, worker’s compensation and legal costs (mostly asbestos-related) from previously sold businesses. Net cash provided by discontinued operating activities during the year ended December 31, 2016 was $88.9 million and included settlements reached with various insurance carriers related to asbestos matters during the year. Net cash used in discontinued operating activities for the years ended December 31, 2015 and December 31, 2014 relate to ongoing costs from previously sold businesses.
Capital Resources
Based on historical performance and current expectations, we believe our cash and cash equivalents balance, the cash generated from our operations, our committed credit lines and our expected ability to access capital markets will satisfy our working capital needs, capital expenditures, dividends, share repurchase programs, upcoming debt maturities, and other liquidity requirements associated with our operations for the foreseeable future.
Capital expenditures were $182.7 million, $249.6 million and $233.5 million for the years ended December 31, 2016, 2015 and 2014, respectively. Our investments continue to improve manufacturing productivity, reduce costs, provide environmental enhancements, upgrade information technology infrastructure and security and advanced technologies for existing facilities. The capital expenditure program for 2017 is estimated to be approximately $250 million, including amounts approved in prior periods. Many of these projects are subject to review and cancellation at our option without incurring substantial charges.
For financial market risk impacting the Company, see Item 7A. “Quantitative and Qualitative Disclosure About Market Risk.”

PART II
2016 ANNUAL REPORT | PAGE 33
2016 Annual Report
Capitalization
In addition to cash on hand and operating cash flow, we maintain significant credit availability under our Commercial Paper Program. Our ability to borrow at a cost-effective rate under the Commercial Paper Program is contingent upon maintaining an investment-grade credit rating. As of December 31, 2016, our credit ratings were as follows:
Short-term Long-term
Moody’s P-2 Baa2
Standard and Poor’s A-2 BBB
The credit ratings set forth above are not a recommendation to buy, sell or hold securities and may be subject to revision or withdrawal by the assigning rating organization. Each rating should be evaluated independently of any other rating.
Our public debt does not contain financial covenants and our revolving credit lines have a debt-to-total capital covenant of 65%. As of December 31, 2016, our debt-to-total capital ratio was significantly beneath this limit.
CONTRACTUAL OBLIGATIONSThe following table summarizes our contractual cash obligations by required payment period:
In millionsLess than
1 year1 - 3
years3 - 5
yearsMore than
5 years Total
Short-term debt $ 10.1 $ – $ – $ – $ 10.1
Long-term debt 350.7 (a) 1,115.4 440.1 2,179.7 $4,085.9
Interest payments on long-term debt 207.8 (b) 355.6 274.9 1,206.2 2,044.5
Purchase obligations 788.0 – – – 788.0
Operating leases 152.9 197.5 112.3 46.2 508.9
Total contractual cash obligations $1,509.5 $1,668.5 $827.3 $3,432.1 $7,437.4
(a) Includes $343.0 million of debt redeemable at the option of the holder. The scheduled maturities of these bonds range between 2027 and 2028. See Note 7 to the Consolidated Financial Statements for additional information.
(b) Includes nominal amount related to interest of short-term debt.
Future expected obligations under our pension and postretirement benefit plans, income taxes, environmental, asbestos-related, and product liability matters have not been included in the contractual cash obligations table above.
Pensions
At December 31, 2016, we had net obligations of $734.8 million, which consist of noncurrent pension assets of $19.2 million and current and non-current pension benefit liabilities of $754.0 million. It is our objective to contribute to the pension plans to ensure adequate funds are available in the plans to make benefit payments to plan participants and beneficiaries when required. We currently project that we will contribute approximately $97.5 million to our plans worldwide in 2017. The timing and amounts of future contributions are dependent upon the funding status of the plan, which is expected to vary as a result of changes in interest rates, returns on underlying assets, and other factors. Therefore, pension contributions have been excluded from the preceding table. See Note 10 to the Consolidated Financial Statements for additional information.
Postretirement Benefits Other than Pensions
At December 31, 2016, we had postretirement benefit obligations of $578.6 million. We fund postretirement benefit costs principally on a pay-as-you-go basis as medical costs are incurred by covered retiree populations. Benefit payments, which are net of expected plan participant contributions and Medicare Part D subsidy, are expected to be approximately $54.2 million in 2017. Because benefit payments are not required to be funded in advance, and the timing and amounts of future payments are dependent on the cost of benefits for retirees covered by the plan, they have been excluded from the preceding table. See Note 10 to the Consolidated Financial Statements for additional information.
Income Taxes
At December 31, 2016, we have total unrecognized tax benefits for uncertain tax positions of $107.1 million and $33.7 million of related accrued interest and penalties, net of tax. The liability has been excluded from the preceding table as we are unable to reasonably estimate the amount and period in which these liabilities might be paid. See Note 15 to the Consolidated Financial Statements for additional information regarding matters relating to income taxes, including unrecognized tax benefits.

PART II
PAGE 34 | INGERSOLL RAND
2016
Ann
ual R
epor
t
Contingent Liabilities
We are involved in various litigation, claims and administrative proceedings, including those related to environmental, asbestos-related, and product liability matters. We believe that these liabilities are subject to the uncertainties inherent in estimating future costs for contingent liabilities, and will likely be resolved over an extended period of time. Because the timing and amounts of potential future cash flows are uncertain, they have been excluded from the preceding table. See Note 19 to the Consolidated Financial Statements for additional information.
See Note 7 and Note 19 to the Consolidated Financial Statements for additional information on matters affecting our liquidity.
CRITICAL ACCOUNTING POLICIESManagement’s Discussion and Analysis of Financial Condition and Results of Operations are based upon our Consolidated Financial Statements, which have been prepared in accordance with accounting principles generally accepted in the United States (GAAP). The preparation of financial statements in conformity with those accounting principles requires management to use judgment in making estimates and assumptions based on the relevant information available at the end of each period. These estimates and assumptions have a significant effect on reported amounts of assets and liabilities, revenue and expenses as well as the disclosure of contingent assets and liabilities because they result primarily from the need to make estimates and assumptions on matters that are inherently uncertain. Actual results may differ from estimates. If updated information or actual amounts are different from previous estimates, the revisions are included in our results for the period in which they become known.
The following is a summary of certain accounting estimates and assumptions made by management that we consider critical.
• Allowance for doubtful accounts – We maintain an allowance for doubtful accounts receivable which represents our best estimate of probable loss inherent in our accounts receivable portfolio. This estimate is based upon our two step policy that results in the total recorded allowance for doubtful accounts. The first step is to record a portfolio reserve based on the aging of the outstanding accounts receivable portfolio and our historical experience with our end markets, customer base and products. The second step is to create a specific reserve for significant accounts as to which the customer’s ability to satisfy their financial obligation to us is in doubt due to circumstances such as bankruptcy, deteriorating operating results or financial position. In these circumstances, management uses its judgment to record an allowance based on the best estimate of probable loss, factoring in such considerations as the market value of collateral, if applicable. Actual results could differ from those estimates. These estimates and assumptions are reviewed periodically, and the effects of changes, if any, are reflected in the statement of operations in the period that they are determined.
• Goodwill and indefinite-lived intangible assets – We have significant goodwill and indefinite-lived intangible assets on our balance sheet related to acquisitions. Our goodwill and other indefinite-lived intangible assets are tested and reviewed annually during the fourth quarter for impairment or when there is a significant change in events or circumstances that indicate that the fair value of an asset is more likely than not less than the carrying amount of the asset.
Recoverability of goodwill is measured at the reporting unit level and begins with a qualitative assessment to determine if it is more likely than not that the fair value of each reporting unit is less than its carrying amount as a basis for determining whether it is necessary to perform the two-step goodwill impairment test included in U.S. GAAP. For those reporting units where it is required, the first step compares the carrying amount of the reporting unit to its estimated fair value. If the estimated fair value of a reporting unit exceeds its carrying amount, goodwill of the reporting unit is not impaired and the second step of the impairment test is not necessary. To the extent that the carrying value of the reporting unit exceeds its estimated fair value, a second step is performed, wherein the reporting unit’s carrying value of goodwill is compared to the implied fair value of goodwill. To the extent that the carrying value exceeds the implied fair value, impairment exists and must be recognized.
As quoted market prices are not available for our reporting units, the calculation of their estimated fair value in step one is determined using three valuation techniques: a discounted cash flow model (an income approach), a market-adjusted multiple of earnings and revenues (a market approach), and a similar transactions method (also a market approach). The discounted cash flow approach relies on our estimates of future cash flows and explicitly addresses factors such as timing, growth and margins, with due consideration given to forecasting risk. The earnings and revenue multiple approach reflects the market’s expectations for future growth and risk, with adjustments to account for differences between the guideline publicly traded companies and the subject reporting units. The similar transactions method considers prices paid in transactions that have recently occurred in our industry or in related industries. These methods are weighted 50%, 40% and 10%, respectively.
In the second step, the implied fair value of goodwill is determined in the same manner as the amount of goodwill recognized in a business combination. The estimated fair value of the reporting unit is allocated to all of the assets and liabilities of the reporting unit (including any unrecognized intangible assets) as if the reporting unit had been acquired in a business combination and the fair value of the reporting unit, as determined in the first step of the goodwill impairment test, was the price paid to acquire that reporting unit.
PART II
2016 ANNUAL REPORT | PAGE 35
2016 Annual Report
Recoverability of other intangible assets with indefinite useful lives is first assessed using a qualitative assessment to determine whether it is more likely than not that an indefinite-lived intangible asset is impaired. This assessment is used as a basis for determining whether it is necessary to calculate the fair value of an indefinite-lived intangible asset. For those indefinite-lived assets where it is required, a fair value is determined on a relief from royalty methodology (income approach) which is based on the implied royalty paid, at an appropriate discount rate, to license the use of an asset rather than owning the asset. The present value of the after-tax cost savings (i.e. royalty relief) indicates the estimated fair value of the asset. Any excess of the carrying value over the estimated fair value is recognized as an impairment loss equal to that excess.
The determination of the estimated fair value and the implied fair value of goodwill and other indefinite-lived intangible assets requires us to make assumptions about estimated cash flows, including profit margins, long-term forecasts, discount rates and terminal growth rates. We developed these assumptions based on the market and geographic risks unique to each reporting unit.
For our annual impairment testing performed during the fourth quarter of 2016, we calculated the fair value for each of the reporting units and indefinite-lived intangibles. Based on the results of these calculations, we determined that the fair value of the reporting units and indefinite-lived intangible assets exceeded their respective carrying values. The estimates of fair value are based on the best information available as of the date of the assessment, which primarily incorporates management assumptions about expected future cash flows.
Goodwill - Under the income approach, we assumed a forecasted cash flow period of five years with discount rates ranging from 10.5% to 13.5% and terminal growth rates ranging from 3.0% to 3.5%. Under the guideline public company method, we used an adjusted multiple ranging from 7.0 to 13.0 of projected earnings before interest, taxes, depreciation and amortization (EBITDA) based on the market information of comparable companies. Additionally, we compared the estimated aggregate fair value of our reporting units to our overall market capitalization. For all reporting units, the excess of the estimated fair value over carrying value (expressed as a percentage of carrying value) was a minimum of 26%. A significant increase in the discount rate, decrease in the long-term growth rate, or substantial reductions in our end markets and volume assumptions could have a negative impact on the estimated fair value of these reporting units.
Other Indefinite-lived intangible assets - In testing our other indefinite-lived intangible assets for impairment, we assumed forecasted revenues for a period of five years with discount rates ranging from 10.0% to 12.0%, terminal growth rate of 3.0%, and royalty rates ranging from 1.0% to 4.5%. For all tradenames, the excess of the estimated fair value over carrying value (expressed as a percentage of carrying value) was a minimum of 46%, with the exception of two recently acquired tradenames. The first tradename, reported within our Climate segment, had an excess of the estimated fair value over carrying value of approximately 5% and an approximate carrying value of $15 million at December 31, 2016. The second tradename, reported within our Industrial segment, had an excess of the estimated fair value over carrying value of approximately 4% and an approximate carrying value of $28 million at December 31, 2016. A significant increase in the discount rate, decrease in the long-term growth rate, decrease in the royalty rate or substantial reductions in our end markets and volume assumptions could have a negative impact on the estimated fair values of any of our tradenames.
• Long-lived assets and finite-lived intangibles – Long-lived assets and finite-lived intangibles are reviewed for impairment whenever events or changes in business circumstances indicate that the carrying amount of an asset may not be fully recoverable. Assets are grouped with other assets and liabilities at the lowest level for which identifiable cash flows can be generated. Impairment in the carrying value of an asset would be recognized whenever anticipated future undiscounted cash flows from an asset are less than its carrying value. The impairment is measured as the amount by which the carrying value exceeds the fair value of the asset as determined by an estimate of discounted cash flows. We believe that our use of estimates and assumptions are reasonable and comply with generally accepted accounting principles. Changes in business conditions could potentially require future adjustments to these valuations.
• Loss contingencies – Liabilities are recorded for various contingencies arising in the normal course of business, including litigation and administrative proceedings, environmental and asbestos matters and product liability, product warranty, worker’s compensation and other claims. We have recorded reserves in the financial statements related to these matters, which are developed using input derived from actuarial estimates and historical and anticipated experience data depending on the nature of the reserve, and in certain instances with consultation of legal counsel, internal and external consultants and engineers. Subject to the uncertainties inherent in estimating future costs for these types of liabilities, we believe our estimated reserves are reasonable and do not believe the final determination of the liabilities with respect to these matters would have a material effect on our financial condition, results of operations, liquidity or cash flows for any year.
• Asbestos matters – Certain of our wholly-owned subsidiaries are named as defendants in asbestos-related lawsuits in state and federal courts. We record a liability for our actual and anticipated future claims as well as an asset for anticipated insurance settlements. Asbestos related defense costs are excluded from the asbestos claims liability and are recorded separately as services are incurred. None of our existing or previously-owned businesses were a producer or manufacturer of asbestos. We record certain income and expenses associated with our asbestos liabilities and corresponding insurance recoveries within discontinued operations, net of tax, as they relate to previously divested businesses, except for amounts associated with Trane U.S. Inc.’s asbestos liabilities and corresponding insurance recoveries which are recorded within continuing operations. Refer to Note 19 to the Consolidated Financial Statements for further details of asbestos-related matters.

PART II
PAGE 36 | INGERSOLL RAND
2016
Ann
ual R
epor
t
• Revenue recognition – Revenue is recognized and earned when all of the following criteria are satisfied: (a) persuasive evidence of a sales arrangement exists; (b) the price is fixed or determinable; (c) collectability is reasonably assured; and (d) delivery has occurred or service has been rendered. Delivery generally occurs when the title and the risks and rewards of ownership have substantially transferred to the customer. Both the persuasive evidence of a sales arrangement and fixed or determinable price criteria are deemed to be satisfied upon receipt of an executed and legally binding sales agreement or contract that clearly defines the terms and conditions of the transaction including the respective obligations of the parties. If the defined terms and conditions allow variability in all or a component of the price, revenue is not recognized until such time that the price becomes fixed or determinable. At the point of sale, we validate that existence of an enforceable claim that requires payment within a reasonable amount of time and assess the collectability of that claim. If collectability is not deemed to be reasonably assured, then revenue recognition is deferred until such time that collectability becomes probable or cash is received. Delivery is not considered to have occurred until the customer has taken title and assumed the risks and rewards of ownership. Service and installation revenue are recognized when earned. In some instances, customer acceptance provisions are included in sales arrangements to give the buyer the ability to ensure the delivered product or service meets the criteria established in the order. In these instances, revenue recognition is deferred until the acceptance terms specified in the arrangement are fulfilled through customer acceptance or a demonstration that established criteria have been satisfied. If uncertainty exists about customer acceptance, revenue is not recognized until acceptance has occurred.
We offer various sales incentive programs to our customers, dealers, and distributors. Sales incentive programs do not preclude revenue recognition, but do require an accrual for the Company’s best estimate of expected activity. Examples of the sales incentives that are accrued for as a contra receivable and sales deduction at the point of sale include, but are not limited to, discounts (i.e. net 30 type), coupons, and rebates where the customer does not have to provide any additional requirements to receive the discount. Sales returns and customer disputes involving a question of quantity or price are also accounted for as a reduction in revenue and a contra receivable. At December 31, 2016 and 2015, we had a customer claim accrual (contra receivable) of $3.7 million and $4.0 million, respectively. All other incentives or incentive programs where the customer is required to reach a certain sales level, remain a customer for a certain period of time, provide a rebate form or is subject to additional requirements are accounted for as a reduction of revenue and establishment of a liability. At December 31, 2016 and 2015, we had a sales incentive accrual of $87.5 million and $83.2 million, respectively. Each of these accruals represents the best estimate we expect to pay related to previously sold units. These estimates are reviewed regularly for accuracy. If updated information or actual amounts are different from previous estimates, the revisions are included in our results for the period in which they become known. Historically, the aggregate differences, if any, between our estimates and actual amounts in any year have not had a material impact on the Consolidated Financial Statements.
We enter into maintenance and extended warranty contracts with customers. Revenue related to these services is recognized on a straight-line basis over the life of the contract, unless sufficient historical evidence indicates that the cost of providing these services is incurred on an other than straight-line basis. In these circumstances, revenue is recognized over the contract period in proportion to the costs expected to be incurred in performing the service.
We, primarily through our Climate segment, provide equipment (e.g. HVAC, controls), integrated solutions, and installation designed to customer specifications through construction-type contracts. The term of these types of contracts is typically less than one year, but can be as long as three years. Revenues related to these contracts are recognized using the percentage-of-completion method in accordance with GAAP. This measure of progress toward completion, utilized to recognize sales and profits, is based on the proportion of actual cost incurred to date as compared to the total estimate of contract costs at completion. The timing of revenue recognition often differs from the invoicing schedule to the customer, with revenue recognition in advance of customer invoicing recorded to unbilled accounts receivable and invoicing in advance of revenue recognition recorded to deferred revenue. At December 31, 2016, all recorded receivables (billed and unbilled) are due within one year. We re-evaluate our contract estimates periodically and reflect changes in estimates in the current period using the cumulative catch-up method. These periodic reviews have not historically resulted in significant adjustments. If estimated contract costs are in excess of contract revenues, then the excess costs are accrued.
We enter into sales arrangements that contain multiple elements, such as equipment, installation and service revenue. For multiple element arrangements, each element is evaluated to determine the separate units of accounting. The total arrangement consideration is then allocated to the separate units of accounting based on their relative selling price at the inception of the arrangement. The relative selling price is determined using vendor specific objective evidence (VSOE) of selling price, if it exists; otherwise, third-party evidence (TPE) of selling price is used. If neither VSOE nor TPE of selling price exists for a deliverable, a best estimate of the selling price is developed for that deliverable. We primarily utilize VSOE to determine its relative selling price. We recognize revenue for delivered elements when the delivered item has stand-alone value to the customer, the basic revenue recognition criteria have been met, and only customary refund or return rights related to the delivered elements exist.
• Income taxes – Deferred tax assets and liabilities are determined based on temporary differences between financial reporting and tax bases of assets and liabilities, applying enacted tax rates expected to be in effect for the year in which the differences are expected to reverse. We recognize future tax benefits, such as net operating losses and non-U.S. tax credits, to the extent that realizing these benefits is considered in our judgment to be more likely than not. We regularly review the recoverability of our deferred tax assets considering our historic profitability, projected future taxable income, timing of the reversals of existing temporary differences and the feasibility of our tax planning strategies. Where appropriate, we record a valuation allowance with respect to a future tax benefit.

PART II
2016 ANNUAL REPORT | PAGE 37
2016 Annual Report
We have certain deferred tax assets in Brazil, primarily comprised of net operating loss carryfowards, with a tax effected value of approximately $32 million at December 31, 2016. The operating results of this business have experienced sharp declines in 2016 and 2015 due to market slowdowns in Brazil. We concluded that these deferred tax assets, which have an indefinite life, did not require a valuation allowance as of December 31, 2016 due to forecasted profitability and to-be implemented tax planning actions. However, further deterioration in operating results in this business may require us to recognize a valuation allowance in the future.
The provision for income taxes involves a significant amount of management judgment regarding interpretation of relevant facts and laws in the jurisdictions in which we operate. Future changes in applicable laws, projected levels of taxable income, and tax planning could change the effective tax rate and tax balances recorded by us. In addition, tax authorities periodically review income tax returns filed by us and can raise issues regarding our filing positions, timing and amount of income or deductions, and the allocation of income among the jurisdictions in which we operate. A significant period of time may elapse between the filing of an income tax return and the ultimate resolution of an issue raised by a revenue authority with respect to that return. We believe that we have adequately provided for any reasonably foreseeable resolution of these matters. We will adjust our estimate if significant events so dictate. To the extent that the ultimate results differ from our original or adjusted estimates, the effect will be recorded in the provision for income taxes in the period that the matter is finally resolved.
• Employee benefit plans – We provide a range of benefits to eligible employees and retirees, including pensions, postretirement and postemployment benefits. Determining the cost associated with such benefits is dependent on various actuarial assumptions including discount rates, expected return on plan assets, compensation increases, employee mortality, turnover rates and healthcare cost trend rates. Actuarial valuations are performed to determine expense in accordance with GAAP. Actual results may differ from the actuarial assumptions and are generally accumulated and amortized into earnings over future periods. We review our actuarial assumptions at each measurement date and make modifications to the assumptions based on current rates and trends, if appropriate. The discount rate, the rate of compensation increase and the expected long-term rates of return on plan assets are determined as of each measurement date.
The rate of compensation increase is dependent on expected future compensation levels. The expected long-term rate of return on plan assets reflects the average rate of returns expected on the funds invested or to be invested to provide for the benefits included in the projected benefit obligation. The expected long-term rate of return on plan assets is based on what is achievable given the plan’s investment policy, the types of assets held and the target asset allocation. The expected long-term rate of return is determined as of each measurement date. We believe that the assumptions utilized in recording our obligations under our plans are reasonable based on input from our actuaries, outside investment advisors and information as to assumptions used by plan sponsors.
Changes in any of the assumptions can have an impact on the net periodic pension cost or postretirement benefit cost. Estimated sensitivities to the expected 2017 net periodic pension cost of a 0.25% rate decline in the two basic assumptions are as follows: the decline in the discount rate would increase expense by approximately $7.7 million and the decline in the estimated return on assets would increase expense by approximately $6.9 million. A 0.25% rate decrease in the discount rate for postretirement benefits would decrease expected 2017 net periodic postretirement benefit cost by $0.9 million and a 1.0% increase in the healthcare cost trend rate would increase the service and interest cost by approximately $0.7 million.
RECENT ACCOUNTING PRONOUNCEMENTSSee Note 2 to the Consolidated Financial Statements for a discussion of recent accounting pronouncements.
ITEM 7A. QUANTITATIVE AND QUALITATIVE DISCLOSURE ABOUT MARKET RISKWe are exposed to fluctuations in currency exchange rates, interest rates and commodity prices which could impact our results of operations and financial condition.
FOREIGN CURRENCY EXPOSURESWe have operations throughout the world that manufacture and sell products in various international markets. As a result, we are exposed to movements in exchange rates of various currencies against the U.S. dollar as well as against other currencies throughout the world.
Many of our non-U.S. operations have a functional currency other than the U.S. dollar, and their results are translated into U.S. dollars for reporting purposes. Therefore, our reported results will be higher or lower depending on the weakening or strengthening of the U.S. dollar against the respective foreign currency. Our largest concentration of revenues from non-U.S. operations as of December 31, 2016 are in Euros and Chinese Yuan. A hypothetical 10% unfavorable change in the average exchange rate used to translate Net revenues as of December 31, 2016 from either Euros or Chinese Yuan-based operations into U.S. dollars would not have a material impact on our financial statements.
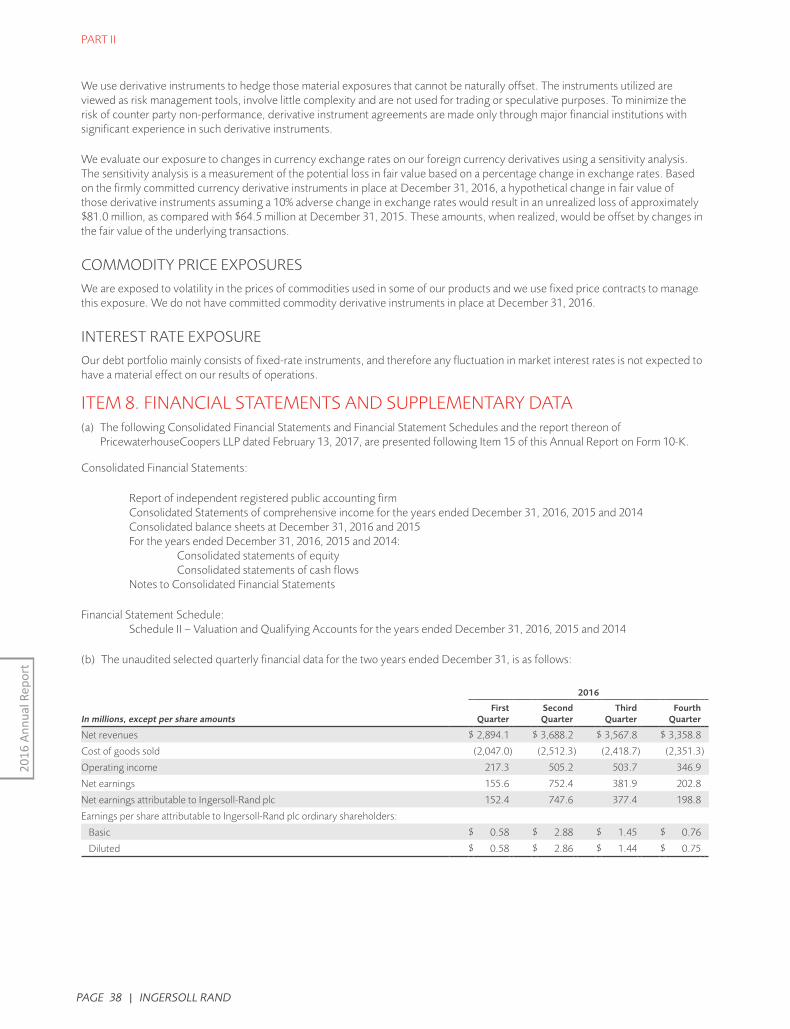
PART II
PAGE 38 | INGERSOLL RAND
2016
Ann
ual R
epor
t
We use derivative instruments to hedge those material exposures that cannot be naturally offset. The instruments utilized are viewed as risk management tools, involve little complexity and are not used for trading or speculative purposes. To minimize the risk of counter party non-performance, derivative instrument agreements are made only through major financial institutions with significant experience in such derivative instruments.
We evaluate our exposure to changes in currency exchange rates on our foreign currency derivatives using a sensitivity analysis. The sensitivity analysis is a measurement of the potential loss in fair value based on a percentage change in exchange rates. Based on the firmly committed currency derivative instruments in place at December 31, 2016, a hypothetical change in fair value of those derivative instruments assuming a 10% adverse change in exchange rates would result in an unrealized loss of approximately $81.0 million, as compared with $64.5 million at December 31, 2015. These amounts, when realized, would be offset by changes in the fair value of the underlying transactions.
COMMODITY PRICE EXPOSURESWe are exposed to volatility in the prices of commodities used in some of our products and we use fixed price contracts to manage this exposure. We do not have committed commodity derivative instruments in place at December 31, 2016.
INTEREST RATE EXPOSUREOur debt portfolio mainly consists of fixed-rate instruments, and therefore any fluctuation in market interest rates is not expected to have a material effect on our results of operations.
ITEM 8. FINANCIAL STATEMENTS AND SUPPLEMENTARY DATA(a) The following Consolidated Financial Statements and Financial Statement Schedules and the report thereon of
PricewaterhouseCoopers LLP dated February 13, 2017, are presented following Item 15 of this Annual Report on Form 10-K.
Consolidated Financial Statements:
Report of independent registered public accounting firm Consolidated Statements of comprehensive income for the years ended December 31, 2016, 2015 and 2014 Consolidated balance sheets at December 31, 2016 and 2015 For the years ended December 31, 2016, 2015 and 2014: Consolidated statements of equity Consolidated statements of cash flows Notes to Consolidated Financial Statements
Financial Statement Schedule: Schedule II – Valuation and Qualifying Accounts for the years ended December 31, 2016, 2015 and 2014
(b) The unaudited selected quarterly financial data for the two years ended December 31, is as follows:
2016
In millions, except per share amountsFirst
QuarterSecondQuarter
ThirdQuarter
FourthQuarter
Net revenues $ 2,894.1 $ 3,688.2 $ 3,567.8 $ 3,358.8
Cost of goods sold (2,047.0) (2,512.3) (2,418.7) (2,351.3)
Operating income 217.3 505.2 503.7 346.9
Net earnings 155.6 752.4 381.9 202.8
Net earnings attributable to Ingersoll-Rand plc 152.4 747.6 377.4 198.8
Earnings per share attributable to Ingersoll-Rand plc ordinary shareholders:
Basic $ 0.58 $ 2.88 $ 1.45 $ 0.76
Diluted $ 0.58 $ 2.86 $ 1.44 $ 0.75

PART II
2016 ANNUAL REPORT | PAGE 39
2016 Annual Report
2015
FirstQuarter
SecondQuarter
ThirdQuarter
FourthQuarter
Net revenues $ 2,887.8 $ 3,600.2 $ 3,486.9 $ 3,325.8
Cost of goods sold (2,086.7) (2,494.5) (2,379.4) (2,341.0)
Operating income 171.1 452.2 475.4 359.3
Net earnings 55.4 82.9 306.0 238.5
Net earnings attributable to Ingersoll-Rand plc 51.3 78.9 300.9 233.5
Earnings per share attributable to Ingersoll-Rand plc ordinary shareholders:
Basic $ 0.19 $ 0.29 $ 1.13 $ 0.90
Diluted $ 0.19 $ 0.29 $ 1.12 $ 0.88
ITEM 9. CHANGES IN AND DISAGREEMENTS WITH ACCOUNTANTS ON ACCOUNTING AND FINANCIAL DISCLOSURENone.
ITEM 9A. CONTROLS AND PROCEDURES(a) Evaluation of Disclosure Controls and Procedures
The Company’s management, including its Chief Executive Officer and Chief Financial Officer, have conducted an evaluation of the effectiveness of the Company’s disclosure controls and procedures (as such term is defined in Rules 13a-15(e) and 15d-15(e) under the Securities Exchange Act of 1934, as amended (the Exchange Act)), as of the end of the period covered by this Annual Report on Form 10-K. Based on that evaluation, the Chief Executive Officer and Chief Financial Officer concluded as of December 31, 2016, that the Company’s disclosure controls and procedures were effective in ensuring that information required to be disclosed by the Company in reports that it files or submits under the Exchange Act has been recorded, processed, summarized and reported, within the time periods specified in the Commission’s rules and forms, and that such information has been accumulated and communicated to the Company’s management including its Chief Executive Officer and Chief Financial Officer, as appropriate, to allow timely decisions regarding required disclosure.
(b) Management’s Report on Internal Control Over Financial Reporting
The Company’s management is responsible for establishing and maintaining adequate internal control over financial reporting as such term is defined under Exchange Act Rules 13a-15(f) and 15d-15(f). Internal control over financial reporting is a process designed by, or under the supervision of, the Chief Executive Officer and Chief Financial Officer and effected by the Company’s Board of Directors to provide reasonable assurance regarding the reliability of financial reporting and the preparation of financial statements for external purposes in accordance with generally accepted accounting principles.
Because of its inherent limitations, internal control over financial reporting may not prevent or detect misstatements. Also, projections of any evaluation of effectiveness to future periods are subject to the risk that controls may become inadequate because of changes in conditions, or that the degree of compliance with the policies and procedures may deteriorate.
Management has assessed the effectiveness of internal control over financial reporting as of December 31, 2016. In making its assessment, management has utilized the criteria set forth by the Committee of Sponsoring Organizations (COSO) of the Treadway Commission in Internal Control - Integrated Framework (2013). Management concluded that based on its assessment, the Company’s internal control over financial reporting was effective as of December 31, 2016.
The effectiveness of the Company’s internal control over financial reporting as of December 31, 2016 has been audited by PricewaterhouseCoopers LLP, an independent registered public accounting firm, as stated in their report which appears herein.
(c) Changes in Internal Control Over Financial Reporting
There were no changes in internal control over financial reporting (as defined by Rules 13a-15(f) and 15d-15(f) under the Exchange Act) that occurred during the quarter ended December 31, 2016 that have materially affected, or are reasonably likely to materially affect, the Company’s internal control over financial reporting.
ITEM 9B. OTHER INFORMATIONNone.

PAGE 40 | INGERSOLL RAND
2016
Ann
ual R
epor
t
PART III
ITEM 10. DIRECTORS, EXECUTIVE OFFICERS AND CORPORATE GOVERNANCEThe information regarding our executive officers is included in Part I under the caption “Executive Officers of Registrant.”
The other information required by this item is incorporated herein by reference to the information contained under the headings “Item 1. Election of Directors”, “Section 16(a) Beneficial Ownership Reporting Compliance” and “Corporate Governance” in our definitive proxy statement for the 2017 annual general meeting of shareholders (2017 Proxy Statement).
ITEM 11. EXECUTIVE COMPENSATIONThe other information required by this item is incorporated herein by reference to the information contained under the headings “Compensation Discussion and Analysis,” “Compensation of Directors,” “Executive Compensation,” “Compensation Committee Report” and “Compensation Committee Interlocks and Insider Participation” in our 2017 Proxy Statement.
ITEM 12. SECURITY OWNERSHIP OF CERTAIN BENEFICIAL OWNERS AND MANAGEMENT AND RELATED STOCKHOLDER MATTERSThe other information required by this item is incorporated herein by reference to the information contained under the headings “Security Ownership of Certain Beneficial Owners and Management” and “Equity Compensation Plan Information” of our 2017 Proxy Statement.
ITEM 13. CERTAIN RELATIONSHIPS AND RELATED TRANSACTIONS, AND DIRECTOR INDEPENDENCEThe other information required by this item is incorporated herein by reference to the information contained under the headings “Corporate Governance” and “Certain Relationships and Related Person Transactions” of our 2017 Proxy Statement.
ITEM 14. PRINCIPAL ACCOUNTANT FEES AND SERVICESThe information required by this item is incorporated herein by reference to the information contained under the caption “Fees of the Independent Auditors” in our 2017 Proxy Statement.

2016 ANNUAL REPORT | PAGE 41
2016 Annual Report
PART IV
ITEM 15. EXHIBITS AND FINANCIAL STATEMENT SCHEDULES(a) 1. and 2. Financial statements and financial statement schedule See Item 8.
3. ExhibitsThe exhibits listed on the accompanying index to exhibits are filed as part of this Annual Report on Form 10-K.

PART IV
PAGE 42 | INGERSOLL RAND
2016
Ann
ual R
epor
t
INGERSOLL-RAND PLCINDEX TO EXHIBITS(ITEM 15(a))DESCRIPTIONPursuant to the rules and regulations of the Securities and Exchange Commission (“SEC”), Ingersoll-Rand plc (the “Company”) has filed certain agreements as exhibits to this Annual Report on Form 10-K. These agreements may contain representations and warranties by the parties. These representations and warranties have been made solely for the benefit of the other party or parties to such agreements and (i) may have been qualified by disclosures made to such other party or parties, (ii) were made only as of the date of such agreements or such other date(s) as may be specified in such agreements and are subject to more recent developments, which may not be fully reflected in our public disclosure, (iii) may reflect the allocation of risk among the parties to such agreements and (iv) may apply materiality standards different from what may be viewed as material to investors. Accordingly, these representations and warranties may not describe our actual state of affairs at the date hereof and should not be relied upon.
On July 1, 2009, Ingersoll-Rand Company Limited, a Bermuda company, completed a reorganization to change the jurisdiction of incorporation of the parent company from Bermuda to Ireland. As a result, Ingersoll-Rand plc replaced Ingersoll-Rand Company Limited as the ultimate parent company effective July 1, 2009. All references related to the Company prior to July 1, 2009 relate to Ingersoll-Rand Company Limited.
(a) Exhibits
Exhibit No. Description Method of Filing
2.1 Asset and Stock Purchase Agreement, dated as of July 29, 2007, among Ingersoll-Rand Company Limited, on behalf of itself and certain of its subsidiaries, and Doosan Infracore Co., Ltd. and Doosan Engine Co., Ltd., on behalf of themselves and certain of their subsidiaries.
Incorporated by reference to Exhibit 2.1 to the Company’s Form 8-K (File No. 001-16831) filed with the SEC on July 31, 2007.
2.2 Separation and Distribution Agreement, dated as of July 16, 2007, by and between Trane Inc. (formerly American Standard Companies Inc.) and WABCO Holdings Inc.
Incorporated by reference to Exhibit 2.1 to Trane Inc.’s Form 8-K (File No. 001-11415) filed with the SEC on July 20, 2007.
2.3 Separation and Distribution Agreement between Ingersoll-Rand plc and Allegion plc, dated November 29, 2013.
Incorporated by reference to Exhibit 3.1 to the Company’s Form 8-K (File No. 001-34400) filed with the SEC on December 2, 2013.
3.1 Constitution of the Company, as amended and restated on June 2, 2016The Company and its subsidiaries are parties to several long-term debt instruments under which, in each case, the total amount of securities authorized does not exceed 10% of the total assets of the Company and its subsidiaries on a consolidated basis.
Incorporated by reference to Exhibit 3.1 to the Company’s Form 8-K (File No. 001-34400) filed with the SEC on June 7, 2016.Pursuant to paragraph 4 (iii)(A) of Item 601 (b) of Regulation S-K, the Company agrees to furnish a copy of such instruments to the Securities and Exchange Commission upon request.
4.1 Indenture, dated as of August 12, 2008, among the Company, Ingersoll-Rand Global Holding Company Limited and Wells Fargo Bank, N.A., as Trustee (replacing the Indenture originally filed as Exhibit 4.1 to the Company’s Form 10-Q (File No. 001-16831) for the period ended September 30, 2008 as filed with the SEC on November 7, 2008).
Incorporated by reference to Exhibit 4.4 to the Company’s Form 10-K for the fiscal year ended 2008 (File No. 001-16831) filed with the SEC on March 2, 2009.
4.2 First Supplemental Indenture, dated as of August 15, 2008, among the Company, Ingersoll-Rand Global Holding Company Limited and Wells Fargo Bank, N.A., as trustee, to that certain Indenture, dated as of August 12, 2008, among the Company, Ingersoll-Rand Global Holding Company Limited and Wells Fargo Bank, N.A., as trustee.
Incorporated by reference to Exhibit 1.1 to the Company’s Form 8-K (File No. 001-16831) filed with the SEC on August 18, 2008.
4.3 Second Supplemental Indenture, dated as of April 3, 2009, among the Company, Ingersoll-Rand Global Holding Company Limited and Wells Fargo Bank, N.A., as trustee, to that certain Indenture, dated as of August 12, 2008, among the Company, Ingersoll-Rand Global Holding Company Limited and Wells Fargo Bank, N.A., as trustee.
Incorporated by reference to Exhibit 4.1 to the Company’s Form 8-K (File No. 001-16831) filed with the SEC on April 6, 2009.

PART IV
2016 ANNUAL REPORT | PAGE 43
2016 Annual Report
Exhibit No. Description Method of Filing
4.4 Third Supplemental Indenture, dated as of April 6, 2009, among the Company, Ingersoll-Rand Global Holding Company Limited and Wells Fargo Bank, N.A., as trustee, to that certain Indenture, dated as of August 12, 2008, among the Company, Ingersoll-Rand Global Holding Company Limited and Wells Fargo Bank, N.A., as trustee.
Incorporated by reference to Exhibit 4.2 to the Company’s Form 8-K (File No. 001-16831) filed with the SEC on April 6, 2009.
4.5 Fourth Supplemental Indenture, dated as of June 29, 2009, among Ingersoll-Rand Global Holding Company Limited, a Bermuda exempted company, Ingersoll-Rand Company Limited, a Bermuda exempted company, Ingersoll-Rand International Holding Limited, a Bermuda exempted company, Ingersoll-Rand plc, an Irish public limited company, and Wells Fargo Bank, N.A., as Trustee, to the Indenture dated as of August 12, 2008.
Incorporated by reference to Exhibit 4.1 to the Company’s Form 8-K (File No. 001-34400) filed with the SEC on July 1, 2009.
4.6 Fifth Supplemental Indenture dated as of November 20, 2013, among Ingersoll-Rand Global Holding Company Limited, a Bermuda company, Ingersoll-Rand International Holding Limited, a Bermuda company, Ingersoll-Rand Company, a New Jersey corporation, and Wells Fargo Bank, N.A., as Trustee, to the Indenture dated as of August 12, 2008.
Incorporated by reference to Exhibit 4.2 to the Company’s Form 8-K (File No. 001-34400) filed with the SEC on November 26, 2013.
4.7 Sixth Supplemental Indenture, dated as of October 28, 2014, by and among Ingersoll-Rand Global Holding Company Limited, as issuer, Ingersoll-Rand Company, as co-obligor, Ingersoll-Rand plc, Ingersoll-Rand International Holding Limited, Ingersoll-Rand Luxembourg Finance S.A., as guarantors, and Wells Fargo Bank, N.A., as Trustee, to an Indenture, dated as of August 12, 2008.
Incorporated by reference to Exhibit 4.6 to the Company’s Form 8-K (File No. 001-34400) filed with the SEC on November 26, 2013.
4.8 Seventh Supplemental Indenture, dated as of December 18, 2015, by and among Ingersoll-Rand Global Holding Company Limited, as issuer, Ingersoll-Rand Company, Ingersoll-Rand plc, Ingersoll-Rand International Holding Limited, Ingersoll-Rand Luxembourg Finance S.A., and Ingersoll-Rand Lux International Holding Company S.à.r.l. as guarantors, and Wells Fargo Bank, N.A., as Trustee, to an Indenture, dated as of August 12, 2008.
Incorporated by reference to Exhibit 4.8 to the Company’s Form 10-K for the fiscal years ended 2015 (File No. 001-34400) filed with the SEC on February 12, 2016.
4.9 Eighth Supplemental Indenture, dated as of April 5, 2016, among Ingersoll-Rand Global Holding Company Limited, as issuer, Ingersoll-Rand Company, Ingersoll-Rand plc, Ingersoll-Rand International Holding Limited, Ingersoll-Rand Luxembourg Finance S.A., and Ingersoll-Rand Lux International Holding Company S.à r.l., Ingersoll-Rand Irish Holdings Unlimited Company, as guarantors, and Wells Fargo Bank, N.A., as Trustee, to an Indenture, dated as of August 12, 2008.
Filed herewith.
4.10 Fifth Supplemental Indenture, dated as of June 29, 2009, among Ingersoll-Rand Company, a New Jersey corporation, Ingersoll-Rand plc, an Irish public limited company, Ingersoll-Rand International Holding Limited, a Bermuda exempted company, and The Bank of New York Mellon, as Trustee, to the Indenture dated as of August 1, 1986.
Incorporated by reference to Exhibit 4.3 to the Company’s Form 8-K (File No. 001-34400) filed with the SEC on July 1, 2009.
4.11 Sixth Supplemental Indenture, dated as of October 28, 2014, by and among Ingersoll-Rand Company, as issuer, Ingersoll-Rand plc, Ingersoll-Rand International Holding Limited, Ingersoll-Rand Company Limited, Ingersoll-Rand Luxembourg Finance S.A., as guarantors, and The Bank of New York Mellon, as Trustee, to an Indenture, dated as of August 1, 1986.
Incorporated by reference to Exhibit 4.7 to the Company’s Form 8-K (File No. 001-34400) filed with the SEC on November 26, 2013.
4.12 Indenture, dated as of June 20, 2013, by and among Ingersoll-Rand Global Holding Company Limited, as issuer, Ingersoll-Rand plc, Ingersoll-Rand Company Limited and Ingersoll-Rand International Holding Limited, as guarantors and The Bank of New York Mellon, as Trustee.
Incorporated by reference to Exhibit 4.1 to the Company’s Form 8-K (File No. 001-34400) filed with the SEC on June 26, 2013.

PART IV
PAGE 44 | INGERSOLL RAND
2016
Ann
ual R
epor
t
Exhibit No. Description Method of Filing
4.13 First Supplemental Indenture, dated as of June 20, 2013, by and among Ingersoll-Rand Global Holding Company Limited, as issuer, Ingersoll-Rand plc, Ingersoll-Rand Company Limited and Ingersoll-Rand International Holding Limited, as guarantors and The Bank of New York Mellon, as Trustee, relating to the 2.875% Senior Notes due 2019.
Incorporated by reference to Exhibit 4.2 to the Company’s Form 8-K (File No. 001-34400) filed with the SEC on June 26, 2013.
4.14 Second Supplemental Indenture, dated as of June 20, 2013, by and among Ingersoll-Rand Global Holding Company Limited, as issuer, Ingersoll-Rand plc, Ingersoll-Rand Company Limited and Ingersoll-Rand International Holding Limited, as guarantors and The Bank of New York Mellon, as Trustee, relating to the 4.250% Senior Notes due 2023.
Incorporated by reference to Exhibit 4.3 to the Company’s Form 8-K (File No. 001-34400) filed with the SEC on June 26, 2013.
4.15 Third Supplemental Indenture, dated as of June 20, 2013, by and among Ingersoll-Rand Global Holding Company Limited, as issuer, Ingersoll-Rand plc, Ingersoll-Rand Company Limited and Ingersoll-Rand International Holding Limited, as guarantors and The Bank of New York Mellon, as Trustee, relating to the 5.750% Senior Notes due 2043.
Incorporated by reference to Exhibit 4.4 to the Company’s Form 8-K (File No. 001-34400) filed with the SEC on June 26, 2013.
4.16 Fourth Supplemental Indenture, dated as of November 20, 2013, among Ingersoll-Rand Global Holding Company Limited, a Bermuda company, Ingersoll-Rand Company Limited, a Bermuda company, Ingersoll-Rand International Holding Limited, a Bermuda company, Ingersoll-Rand plc, an Irish public limited company, Ingersoll-Rand Company, a New Jersey corporation, and The Bank of New York Mellon, as Trustee, to the Indenture dated as of June 20, 2013.
Incorporated by reference to Exhibit 4.1 to the Company’s Form 8-K (File No. 001-34400) filed with the SEC on November 26, 2013.
4.17 Fifth Supplemental Indenture, dated as of October 28, 2014, by and among Ingersoll-Rand Global Holding Company Limited, as issuer, Ingersoll-Rand Company, as co-obligor, Ingersoll-Rand plc, Ingersoll-Rand Company Limited, Ingersoll-Rand International Holding Limited, Ingersoll-Rand Luxembourg Finance S.A., as guarantors, and The Bank of New York Mellon, as Trustee, to an Indenture, dated as of June 20, 2013.
Incorporated by reference to Exhibit 4.5 to the Company’s Form 8-K (File No. 001-34400) filed with the SEC on October 29, 2014.
4.18 Sixth Supplemental Indenture, dated as of December 18, 2015, by and among Ingersoll-Rand Global Holding Company Limited, as issuer, Ingersoll-Rand Company, as co-obligor, Ingersoll-Rand plc, Ingersoll-Rand International Holding Limited, Ingersoll-Rand Luxembourg Finance S.A., and Ingersoll-Rand Lux International Holding Company S.à.r.l. as guarantors, and The Bank of New York Mellon, as Trustee, to an Indenture, dated as of June 20, 2013.
Incorporated by reference to Exhibit 4.21 to the Company’s Form 10-K for the fiscal year ended 2015 (File No. 001-34400) filed with the SEC on February 12, 2016.
4.19 Seventh Supplemental Indenture, dated as of April 5, 2016, by and among Ingersoll-Rand Global Holding company Limited, as issuer, Ingersoll-Rand Company, as co-obligor, Ingersoll-Rand plc, Ingersoll-Rand International Holding Limited, Ingersoll-Rand Luxembourg Finance S.A., Ingersoll-Rand Lux International Holding Company S.à r.l., and Ingersoll-Rand Irish Holdings Unlimited Company, as guarantors, and The Bank of New York Mellon, as Trustee, to an indenture, dated as of June 20, 2013.
Filed herewith.
4.20 Indenture, dated as of October 28, 2014, by and among Ingersoll-Rand Luxembourg Finance S.A., as issuer, and Ingersoll-Rand plc, Ingersoll-Rand Company Limited, Ingersoll-Rand International Holding Limited, Ingersoll-Rand Company and Ingersoll-Rand Global Holding Company Limited, as guarantors, and The Bank of New York Mellon, as Trustee.
Incorporated by reference to Exhibit 4.1 to the Company’s Form 8-K (File No. 001-34400) filed with the SEC on October 29, 2014.

PART IV
2016 ANNUAL REPORT | PAGE 45
2016 Annual Report
Exhibit No. Description Method of Filing
4.21 First Supplemental Indenture, dated as of October 28, 2014, by and among Ingersoll-Rand Luxembourg Finance S.A., as issuer, and Ingersoll-Rand plc, Ingersoll-Rand Company Limited, Ingersoll-Rand International Holding Limited, Ingersoll-Rand Company and Ingersoll-Rand Global Holding Company Limited, as guarantors, and The Bank of New York Mellon, as Trustee, relating to the 2.625% Senior Notes due 2020.
Incorporated by reference to Exhibit 4.2 to the Company’s Form 8-K (File No. 001-34400) filed with the SEC on October 29, 2014.
4.22 Second Supplemental Indenture, dated as of October 28, 2014, by and among Ingersoll-Rand Luxembourg Finance S.A., as issuer, and Ingersoll-Rand plc, Ingersoll-Rand Company Limited, Ingersoll-Rand International Holding Limited, Ingersoll-Rand Company and Ingersoll-Rand Global Holding Company Limited, as guarantors, and The Bank of New York Mellon, as Trustee, relating to the 3.550% Senior Notes due 2024.
Incorporated by reference to Exhibit 4.3 to the Company’s Form 8-K (File No. 001-34400) filed with the SEC on October 29, 2014.
4.23 Third Supplemental Indenture, dated as of October 28, 2014, by and among Ingersoll-Rand Luxembourg Finance S.A., as issuer, and Ingersoll-Rand plc, Ingersoll-Rand Company Limited, Ingersoll-Rand International Holding Limited, Ingersoll-Rand Company and Ingersoll-Rand Global Holding Company Limited, as guarantors, and The Bank of New York Mellon, as Trustee, relating to the 4.650% Senior Notes due 2044.
Incorporated by reference to Exhibit 4.3 to the Company’s Form 8-K (File No. 001-34400) filed with the SEC on October 29, 2014.
4.24 Fourth Supplemental Indenture, dated as of December 18, 2015, by and among Ingersoll-Rand Luxembourg Finance S.A., as issuer, and Ingersoll-Rand plc, Ingersoll-Rand International Holding Limited, Ingersoll-Rand Company, Ingersoll-Rand Global Holding Company Limited, and Ingersoll-Rand Lux International Holding Company S.à.r.l. as guarantors, and The Bank of New York Mellon, as Trustee.
Incorporated by reference to Exhibit 4.27 to the Company’s Form 10-K for the fiscal year ended 2015 (File No. 001-34400) filed with the SEC on February 12, 2016.
4.25 Fifth Supplemental Indenture, dated as of April 5, 2016, by and among Ingersoll-Rand Luxembourg Finance S.A., as Issuer, and Ingersoll-Rand plc, Ingersoll-Rand Company Limited, Ingersoll-Rand Company, Ingersoll-Rand International Holding Limited, Ingersoll-Rand Lux International Holding Company S.à r.l., Ingersoll-Rand Irish Holdings Unlimited Company, as guarantors, and The Bank of New York Mellon, as Trustee.
Filed herewith.
4.26 Form of Ordinary Share Certificate of Ingersoll-Rand plc. Incorporated by reference to Exhibit 4.6 to the Company’s Form S-3 (File No. 333-161334) filed with the SEC on August 13, 2009.
10.1* Form of IR Stock Option Grant Agreement (February 2015). Incorporated by reference to Exhibit 10.1 to the Company’s Form 10-K for the fiscal year ended 2014 (File No. 001-34400) filed with the SEC on February 13, 2015.
10.2* Form of IR Restricted Stock Unit Grant Agreement (February 2015).
Incorporated by reference to Exhibit 10.2 to the Company’s Form 10-K for the fiscal year ended 2014 (File No. 001-34400) filed with the SEC on February 13, 2015.
10.3* Form of IR Performance Stock Unit Grant Agreement (February 2015).
Incorporated by reference to Exhibit 10.3 to the Company’s Form 10-K for the fiscal year ended 2014 (File No. 001-34400) filed with the SEC on February 13, 2015.
10.4 Credit Agreement dated March 20, 2014 among Ingersoll-Rand Global Holding Company Limited, Ingersoll-Rand plc, Ingersoll-Rand Company Limited, Ingersoll-Rand International Holding Limited, Ingersoll-Rand Company, JPMorgan Chase Bank, N.A., as Administrative Agent, Citibank, N.A., as Syndication Agent, Bank of America, N.A., BNP Paribas, Deutsche Bank Securities Inc., Goldman Sachs Bank USA, Mizuho Bank, Ltd., and The Bank of Tokyo-Mitsubishi UFJ, Ltd. as Documentation Agents, and J.P. Morgan Securities LLC and Citigroup Global Markets Inc., as joint lead arrangers and joint bookrunners, and certain lending institutions from time to time parties thereto.
Incorporated by reference to Exhibit 10.1 to the Company’s Form 8-K (File No. 001-34400) filed with the SEC on March 26, 2014.

PART IV
PAGE 46 | INGERSOLL RAND
2016
Ann
ual R
epor
t
Exhibit No. Description Method of Filing
10.5 Supplemental Guarantee dated as of December 18, 2015 made by Ingersoll-Rand Lux International Holding Company S.à.r.l. in favor of JPMorgan Chase Bank, N.A., as Administrative Agent for the Banks that are parties to the Credit Agreement dated as of March 20, 2014.
Incorporated by reference to Exhibit 10.8 to the Company’s Form 10-K ended 2015 (File No. 001-34400) filed with the SEC on February 12, 2016.
10.6 Supplemental Guarantee dated as of April 5, 2016 made by Ingersoll-Rand Irish Holdings Unlimited Company in favor of JPMorgan Chase Bank, N.A., as Administrative Agent for the Banks that are parties to the Credit Agreement dated as of March 20, 2014.
Filed herewith.
10.7 Credit Agreement dated March 15, 2016 among Ingersoll-Rand Global Holding Company Limited, Ingersoll-Rand plc, Ingersoll-Rand Luxembourg Finance S.A., Ingersoll-Rand Lux International Holding Company S.à r.l., Ingersoll-Rand International Holding Limited, Ingersoll-Rand Company, JPMorgan Chase Bank, N.A., as Administrative Agent, Citibank, N.A., as Syndication Agent, Bank of America, N.A., BNP Paribas, Deutsche Bank Securities, Inc., Goldman Sachs Bank USA, Mizuho Bank, Ltd., and The Bank of Tokyo-Mitsubishi UFJ, Ltd. as Documentation Agents, and JPMorgan Chase Bank, N.A. and Citigroup Global Markets Inc., as joint lead arrangers and joint bookrunners, and certain lending institutions from time to time parties thereto.
Incorporated by reference to Exhibit 10.1 to the Company’s Form 8-K (File No. 001-34400) filed with the SEC on March 17, 2016.
10.8 Supplemental Guarantee dated as of April 5, 2016 made by Ingersoll-Rand Irish Holdings Unlimited Company in favor of JPMorgan Chase Bank, N.A., as Administrative Agent for the Banks that are parties to the Credit Agreement dated as of March 15, 2016.
Filed herewith.
10.9 Deed Poll Indemnity of Ingersoll-Rand plc, an Irish public limited company, as to the directors, secretary and officers and senior executives of Ingersoll-Rand plc and the directors and officers of Ingersoll-Rand plc’s subsidiaries.
Incorporated by reference to Exhibit 10.5 to the Company’s Form 8-K (File No. 001-34400) filed with the SEC on July 1, 2009.
10.10 Tax Sharing Agreement, dated as of July 16, 2007, by and among American Standard Companies Inc. and certain of its subsidiaries and WABCO Holdings Inc. and certain of its subsidiaries.
Incorporated by reference to Exhibit 10.1 to Trane Inc.’s Form 8-K (File No. 001-11415) filed with the SEC on July 20, 2007.
10.11 Tax Matters Agreement between Ingersoll-Rand plc and Allegion plc, dated November 30, 2013.
Incorporated by reference to Exhibit 10.2 to the Company’s Form 8-K (File No. 001-34400) filed with the SEC on December 2, 2013.
10.12* Ingersoll-Rand plc Incentive Stock Plan of 2013. Incorporated by reference to Exhibit 4.5 to the Company’s Form S-8 (File No. 333-189446) filed with the SEC on June 19, 2013.
10.13* Ingersoll-Rand plc Incentive Stock Plan of 2007 (amended and restated as of December 1, 2010).
Incorporated by reference to Exhibit 10.18 to the Company’s Form 10-K for the fiscal year ended 2010 (File No. 001-34400) filed with the SEC on February 22, 2011.
10.14* Ingersoll-Rand plc Incentive Stock Plan of 1998 (amended and restated as of July 1, 2009).
Incorporated by reference to Exhibit 10.8 to the Company’s Form 8-K (File No. 001-34400) filed with the SEC on July 1, 2009.
10.15* Ingersoll-Rand Company Incentive Stock Plan of 1995 (amended and restated effective July 1, 2009).
Incorporated by reference to Exhibit 10.7 to the Company’s Form 8-K (File No. 001-34400) filed with the SEC on July 1, 2009.
10.16* IR Executive Deferred Compensation Plan (as amended and restated effective July 1, 2009).
Incorporated by reference to Exhibit 10.9 to the Company’s Form 8-K (File No. 001-34400) filed with the SEC on July 1, 2009.
10.17* IR Executive Deferred Compensation Plan II (as amended and restated effective July 1, 2009).
Incorporated by reference to Exhibit 10.10 to the Company’s Form 8-K (File No. 001-34400) filed with the SEC on July 1, 2009.
10.18* First Amendment to IR Executive Deferred Compensation Plan II (dated December 22, 2009).
Incorporated by reference to Exhibit 10.19 to the Company’s Form 10-K for the fiscal year ended 2011 (File No. 001-34400) filed with the SEC on February 21, 2012.

PART IV
2016 ANNUAL REPORT | PAGE 47
2016 Annual Report
Exhibit No. Description Method of Filing
10.19* Second Amendment to IR Executive Deferred Compensation Plan II (dated December 23, 2010).
Incorporated by reference to Exhibit 10.20 to the Company’s Form 10-K for the fiscal year ended 2011 (File No. 001-16831) filed with the SEC on February 21, 2012.
10.20* IR-plc Director Deferred Compensation and Stock Award Plan (as amended and restated effective July 1, 2009).
Incorporated by reference to Exhibit 10.11 to the Company’s Form 8-K (File No. 001-34400) filed with the SEC on July 1, 2009.
10.21* IR-plc Director Deferred Compensation and Stock Award Plan II (as amended and restated effective July 1, 2009).
Incorporated by reference to Exhibit 10.12 to the Company’s Form 8-K (File No. 001-34400) filed with the SEC on July 1, 2009.
10.22* Ingersoll-Rand Company Supplemental Employee Savings Plan (amended and restated effective October 1, 2012).
Incorporated by reference to exhibit 10.23 to the Company’s Form 10-K for the fiscal year ended 2012 (File No. 001-34400) filed with the SEC on February 14, 2013.
10.23* Ingersoll-Rand Company Supplemental Employee Savings Plan II (effective January 1, 2005 and amended and restated through October 1, 2012).
Incorporated by reference to exhibit 10.24 to the Company’s Form 10-K for the fiscal year ended 2012 (File No. 001-34400) filed with the SEC on February 14, 2013.
10.24* Trane Inc. 2002 Omnibus Incentive Plan (restated to include all amendments through July 1, 2009).
Incorporated by reference to Exhibit 10.17 to the Company’s Form 8-K (File No. 001-34400) filed with the SEC on July 1, 2009.
10.25* Trane Inc. Deferred Compensation Plan (as amended and restated as of July 1, 2009, except where otherwise stated).
Incorporated by reference to Exhibit 10.19 to the Company’s Form 8-K (File No. 001-34400) filed with the SEC on July 1, 2009.
10.26* Ingersoll-Rand Company Supplemental Pension Plan (Amended and Restated Effective January 1, 2005).
Incorporated by reference to Exhibit 10.28 to the Company’s Form 10-K for the fiscal year ended 2008 (File No. 001-16831) filed with the SEC on March 2, 2009.
10.27* First Amendment to the Ingersoll-Rand Company Supplemental Pension Plan, dated as of July 1, 2009.
Incorporated by reference to Exhibit 10.21 to the Company’s Form 8-K (File No. 001-34400) filed with the SEC on July 1, 2009.
10.28* Ingersoll-Rand Company Supplemental Pension Plan II (Effective January 1, 2005 and Amended and Restated effective October 1, 2012).
Incorporated by reference to exhibit 10.31 to the Company’s Form 10-K for the fiscal year ended 2012 (File No. 001-34400) filed with the SEC on February 14, 2013.
10.29* Ingersoll-Rand Company Elected Officers Supplemental Plan II (Effective January 1, 2005 and Amended and Restated effective October 1, 2012).
Incorporated by reference to exhibit 10.32 to the Company’s Form 10-K for the fiscal year ended 2012 (File No. 001-34400) filed with the SEC on February 14, 2013.
10.30* Senior Executive Performance Plan. Incorporated by reference to Exhibit 10.39 to the Company’s Form 10-K for the fiscal year ended 2011 (File No. 001-34400) filed with the SEC on February 21, 2012.
10.31* Description of Annual Incentive Matrix Program. Incorporated by reference to Exhibit 10.40 to the Company’s Form 10-K for the fiscal year ended 2011 (File No. 001-34400) filed with the SEC on February 21, 2012.
10.32* Form of Tier 1 Change in Control Agreement (Officers before May 19, 2009).
Incorporated by reference to Exhibit 99.1 to the Company’s Form 8-K (File No. 001-16831) filed with the SEC on December 4, 2006.
10.33* Form of Tier 2 Change in Control Agreement (Officers before May 19, 2009).
Incorporated by reference to Exhibit 99.2 to the Company’s Form 8-K (File No. 001-16831) filed with the SEC on December 4, 2006.
10.34* Form of Tier 1 Change in Control Agreement (New Officers on or after May 19, 2009).
Incorporated by reference to Exhibit 10.32 to the Company’s Form 10-Q for the period ended June 30, 2009 (File No. 001-34400) filed with the SEC on August 6, 2009.
10.35* Form of Tier 2 Change in Control Agreement (New Officers on or after May 19, 2009).
Incorporated by reference to Exhibit 10.33 to the Company’s Form 10-Q for the period ended June 30, 2009 (File No. 001-34400) filed with the SEC on August 6, 2009.
10.36* Amended and Restated Major Restructuring Severance Plan (as amended and restated effective December 31, 2014).
Incorporated by reference to Exhibit 10.35 to the Company’s Form 10-K for the fiscal year ended 2014 (File No. 001-34400) filed with the SEC on February 13, 2015.
10.37* Didier Teirlinck Offer Letter, dated June 5, 2008. Incorporated by reference to Exhibit 10.4 to the Company’s Form 8-K (File No. 001-16831) filed with the SEC on June 10, 2008.
10.38* Addendum to Didier Teirlinck Offer Letter, dated July 17, 2008.
Incorporated by reference to Exhibit 10.13 to the Company’s Form 10-Q for the period ended June 30, 2008 (File No. 001-16831) filed with the SEC on August 8, 2008.

PART IV
PAGE 48 | INGERSOLL RAND
2016
Ann
ual R
epor
t
Exhibit No. Description Method of Filing
10.39* Addendum to Didier Teirlinck Offer Letter, dated December 9, 2013.
Incorporated by reference to exhibit 10.48 to the Company’s Form 10-K for the fiscal year ended 2013 (File No. 001-34400) filed with the SEC on February 14, 2014
10.40* Michael W. Lamach Letter, dated December 24, 2003. Incorporated by reference to Exhibit 10.23 to the Company’s Form 10-K for the fiscal year ended 2003 (File No. 001-16831) filed with the SEC on February 27, 2004.
10.41* Michael W. Lamach Letter, dated June 4, 2008. Incorporated by reference to Exhibit 10.2 to the Company’s Form 8-K (File No. 001-16831) filed with the SEC on June 10, 2008.
10.42* Michael W. Lamach Letter, dated February 4, 2009. Incorporated by reference to Exhibit 10.43 to the Company’s Form 10-K for the fiscal year ended 2008 (File No. 001-16831) filed with the SEC on March 2, 2009.
10.43* Michael W. Lamach Letter, dated February 3, 2010. Incorporated by reference to Exhibit 10.1 to the Company’s Form 8-K (File No. 001-34400) filed with the SEC on February 5, 2010.
10.44* Michael W. Lamach Letter, dated December 23, 2012. Incorporated by reference to exhibit 10.48 to the Company’s Form 10-K for the fiscal year ended 2012 (File No. 001-34400) filed with the SEC on February 14, 2013.
10.45* Robert Zafari Letter and Addendum, dated August 25, 2010. Incorporated by reference to Exhibit 10.1 to the Company’s Form 10-Q for the period ended September 30, 2010 (File No. 001-34400) filed with the SEC on November 1, 2010.
10.46* Addendum to Robert Zafari Offer Letter, dated December 9, 2013.
Incorporated by reference to exhibit 10.55 to the Company’s Form 10-K for the fiscal year ended 2013 (File No. 001-34400) filed with the SEC on February 14, 2014.
10.47* Employment Agreement with Marcia J. Avedon, Senior Vice President, dated January 8, 2007.
Incorporated by reference to Exhibit 10.45 to the Company’s Form 10-K for the fiscal year ended December 31, 2006 (File No. 001-16831) filed with the SEC on March 1, 2007.
10.48* Marcia J. Avedon Letter, dated December 20, 2012. Incorporated by reference to exhibit 10.53 to the Company’s Form 10-K for the fiscal year ended 2012 (File No. 001-34400) filed with the SEC on February 14, 2013.
10.49* Susan K. Carter Employment Agreement, dated as of August 19, 2013.
Incorporated by reference to Exhibit 10.1 to the Company’s Form 8-K (File No. 001-34400) filed with the SEC on October 2, 2013.
10.50 Employee Matters Agreement between Ingersoll-Rand plc and Allegion plc, dated November 30, 2013.
Incorporated by reference to Exhibit 10.1 to the Company’s Form 8-K (File No. 001-34400) filed with the SEC on December 2, 2013.
12 Computations of Ratios of Earnings to Fixed Charges. Filed herewith.
21 List of Subsidiaries of Ingersoll-Rand plc. Filed herewith.
23.1 Consent of Independent Registered Public Accounting Firm. Filed herewith.
31.1 Certification of Chief Executive Officer Pursuant to Rule 13a-14(a) or Rule 15d-14(a), as Adopted Pursuant to Section 302 of the Sarbanes-Oxley Act of 2002.
Filed herewith.
31.2 Certification of Chief Financial Officer Pursuant to Rule 13a-14(a) or Rule 15d-14(a), as Adopted Pursuant to Section 302 of the Sarbanes-Oxley Act of 2002.
Filed herewith.
32 Certifications of Chief Executive Officer and Chief Financial Officer Pursuant to Rule 13a-14(b) or Rule 15d-14(b) and 18 U.S.C. Section 1350, as Adopted Pursuant to Section 906 of the Sarbanes-Oxley Act of 2002.
Furnished herewith.
101 The following materials from the Company’s Annual Report on Form 10-K for the year ended December 31, 2016, formatted in XBRL (Extensible Business Reporting Language): (i) the Consolidated Statements of Comprehensive Income, (ii) the Consolidated Balance Sheets, (iii) the Consolidated Statements of Equity, (iv) the Consolidated Statements of Cash Flows, and (v) Notes to Consolidated Financial Statements.
Furnished herewith.
* Management contract or compensatory plan or arrangement.

PART IV
2016 ANNUAL REPORT | PAGE 49
2016 Annual Report
ITEM 16. FORM 10-K SUMMARYNot applicable.

PAGE 50 | INGERSOLL RAND
2016
Ann
ual R
epor
t
SIGNATURESPursuant to the requirements of Section 13 or 15(d) of the Securities Exchange Act of 1934, the registrant has duly caused this report to be signed on its behalf by the undersigned, thereunto duly authorized.
INGERSOLL-RAND PLC (Registrant)
By: /s/ Michael W. Lamach
Michael W. Lamach
Chief Executive Officer
Date: February 13, 2017
Pursuant to the requirement of the Securities Exchange Act of 1934, this report has been signed by the following persons on behalf of the registrant and in the capacities and on the dates indicated.
Signature Title Date
/s/ Michael W. Lamach Chairman of the Board and Chief Executive Officer (Principal Executive Officer)
February 13, 2017
(Michael W. Lamach)
/s/ Susan K. Carter Senior Vice President and Chief Financial Officer (Principal Financial Officer)
February 13, 2017
(Susan K. Carter)
/s/ Christopher J. Kuehn Vice President and Chief Accounting Officer (Principal Accounting Officer)
February 13, 2017
(Christopher J. Kuehn)
/s/ Ann C. Berzin Director February 13, 2017
(Ann C. Berzin)
/s/ John Bruton Director February 13, 2017
(John Bruton)
/s/ Jared L. Cohon Director February 13, 2017
(Jared L. Cohon)
/s/ Gary D. Forsee Director February 13, 2017
(Gary D. Forsee)
/s/ Constance J. Horner Director February 13, 2017
(Constance J. Horner)
/s/ Linda P. Hudson Director February 13, 2017
(Linda P. Hudson)
/s/ Myles P. Lee Director February 13, 2017
(Myles P. Lee)
/s/ John P. Surma Director February 13, 2017
(John P. Surma)
/s/ Richard J. Swift Director February 13, 2017
(Richard J. Swift)
/s/ Tony L. White Director February 13, 2017
(Tony L. White)

2016 ANNUAL REPORT | PAGE F-1
2016 Annual Report
INGERSOLL-RAND PLC Index to Consolidated Financial Statements
Report of Independent Registered Public Accounting Firm F-2
Consolidated Statements of Comprehensive Income F-3
Consolidated Balance Sheets F-4
Consolidated Statements of Equity F-5
Consolidated Statements of Cash Flows F-6
Notes to Consolidated Financial Statements F-7
Schedule II – Valuation and Qualifying Accounts F-50

PAGE F-2 | INGERSOLL RAND
2016
Ann
ual R
epor
t
REPORT OF INDEPENDENT REGISTERED PUBLIC ACCOUNTING FIRMTo the Shareholders and Board of Directors of Ingersoll-Rand plc:
In our opinion, the Consolidated Financial Statements listed in the accompanying index present fairly, in all material respects, the financial position of Ingersoll-Rand plc and its subsidiaries (the “Company”) at December 31, 2016 and 2015, and the results of their operations and their cash flows for each of the three years in the period ended December 31, 2016 in conformity with accounting principles generally accepted in the United States of America. In addition, in our opinion, the financial statement schedule listed in the accompanying index presents fairly, in all material respects, the information set forth therein when read in conjunction with the related consolidated financial statements. Also in our opinion, the Company maintained, in all material respects, effective internal control over financial reporting as of December 31, 2016, based on criteria established in Internal Control - Integrated Framework (2013) issued by the Committee of Sponsoring Organizations of the Treadway Commission (COSO). The Company’s management is responsible for these financial statements and financial statement schedule, for maintaining effective internal control over financial reporting and for its assessment of the effectiveness of internal control over financial reporting, included in the accompanying “Management’s Report on Internal Control over Financial Reporting.” Our responsibility is to express opinions on these financial statements, on the financial statement schedule, and on the Company’s internal control over financial reporting based on our integrated audits. We conducted our audits in accordance with the standards of the Public Company Accounting Oversight Board (United States). Those standards require that we plan and perform the audits to obtain reasonable assurance about whether the financial statements are free of material misstatement and whether effective internal control over financial reporting was maintained in all material respects. Our audits of the financial statements included examining, on a test basis, evidence supporting the amounts and disclosures in the financial statements, assessing the accounting principles used and significant estimates made by management, and evaluating the overall financial statement presentation. Our audit of internal control over financial reporting included obtaining an understanding of internal control over financial reporting, assessing the risk that a material weakness exists, and testing and evaluating the design and operating effectiveness of internal control based on the assessed risk. Our audits also included performing such other procedures as we considered necessary in the circumstances. We believe that our audits provide a reasonable basis for our opinions.
A company’s internal control over financial reporting is a process designed to provide reasonable assurance regarding the reliability of financial reporting and the preparation of financial statements for external purposes in accordance with generally accepted accounting principles. A company’s internal control over financial reporting includes those policies and procedures that (i) pertain to the maintenance of records that, in reasonable detail, accurately and fairly reflect the transactions and dispositions of the assets of the company; (ii) provide reasonable assurance that transactions are recorded as necessary to permit preparation of financial statements in accordance with generally accepted accounting principles, and that receipts and expenditures of the company are being made only in accordance with authorizations of management and directors of the company; and (iii) provide reasonable assurance regarding prevention or timely detection of unauthorized acquisition, use, or disposition of the company’s assets that could have a material effect on the financial statements.
Because of its inherent limitations, internal control over financial reporting may not prevent or detect misstatements. Also, projections of any evaluation of effectiveness to future periods are subject to the risk that controls may become inadequate because of changes in conditions, or that the degree of compliance with the policies or procedures may deteriorate.
/s/ PricewaterhouseCoopers LLP Charlotte, North Carolina February 13, 2017

2016 ANNUAL REPORT | PAGE F-3
2016 Annual Report
INGERSOLL-RAND PLC CONSOLIDATED STATEMENTS OF COMPREHENSIVE INCOMEIn millions, except per share amounts
For the years ended December 31, 2016 2015 2014
Net revenues $13,508.9 $13,300.7 $12,891.4
Cost of goods sold (9,329.3) (9,301.6) (8,982.8)
Selling and administrative expenses (2,606.5) (2,541.1) (2,503.9)
Operating income 1,573.1 1,458.0 1,404.7
Interest expense (221.5) (223.0) (225.3)
Other income/(expense), net 389.7 12.9 30.0
Earnings before income taxes 1,741.3 1,247.9 1,209.4
Provision for income taxes (281.5) (540.8) (293.7)
Earnings from continuing operations 1,459.8 707.1 915.7
Gain (loss) from discontinued operations, net of tax 32.9 (24.3) 34.7
Net earnings 1,492.7 682.8 950.4
Less: Net earnings attributable to noncontrolling interests (16.5) (18.2) (18.7)
Net earnings attributable to Ingersoll-Rand plc $ 1,476.2 $ 664.6 $ 931.7
Amounts attributable to Ingersoll-Rand plc ordinary shareholders:
Continuing operations $ 1,443.3 $ 688.9 $ 897.0
Discontinued operations 32.9 (24.3) 34.7
Net earnings $ 1,476.2 $ 664.6 $ 931.7
Earnings (loss) per share attributable to Ingersoll-Rand plc ordinary shareholders:
Basic:
Continuing operations $ 5.57 $ 2.60 $ 3.32
Discontinued operations 0.13 (0.09) 0.12
Net earnings $ 5.70 $ 2.51 $ 3.44
Diluted:
Continuing operations $ 5.52 $ 2.57 $ 3.27
Discontinued operations 0.13 (0.09) 0.13
Net earnings $ 5.65 $ 2.48 $ 3.40
Net earnings $ 1,492.7 $ 682.8 $ 950.4
Other comprehensive income (loss):
Currency translation (233.8) (447.6) (450.2)
Cash flow hedges
Unrealized net gains (losses) arising during period 2.2 1.2 (3.1)
Net gains (losses) reclassified into earnings (4.8) 2.6 5.7
Tax (expense) benefit 0.4 (1.8) 0.1
Total cash flow hedges, net of tax (2.2) 2.0 2.7
Pension and OPEB adjustments:
Prior service costs for the period (6.2) (6.8) (9.2)
Net actuarial gains (losses) for the period 23.6 1.8 (220.9)
Amortization reclassified into earnings 57.5 55.1 31.6
Settlements/curtailments reclassified to earnings 2.1 0.7 7.1
Currency translation and other 22.5 15.9 16.1
Tax (expense) benefit (23.5) (32.0) 73.0
Total pension and OPEB adjustments, net of tax 76.0 34.7 (102.3)
Other comprehensive income (loss), net of tax (160.0) (410.9) (549.8)
Comprehensive income, net of tax $ 1,332.7 $ 271.9 $ 400.6
Less: Comprehensive income attributable to noncontrolling interests (26.1) (13.9) (16.5)
Comprehensive income attributable to Ingersoll-Rand plc $ 1,306.6 $ 258.0 $ 384.1
See accompanying notes to Consolidated Financial Statements.

PAGE F-4 | INGERSOLL RAND
2016
Ann
ual R
epor
t
INGERSOLL-RAND PLC CONSOLIDATED BALANCE SHEETSIn millions, except share amounts
December 31, 2016 2015
ASSETS
Current assets:
Cash and cash equivalents $ 1,714.7 $ 736.8
Accounts and notes receivable, net 2,223.0 2,150.6
Inventories, net 1,385.8 1,410.7
Other current assets 255.8 311.3
Total current assets 5,579.3 4,609.4
Property, plant and equipment, net 1,511.0 1,575.1
Goodwill 5,658.4 5,730.2
Intangible assets, net 3,785.1 3,926.1
Other noncurrent assets 863.6 876.8
Total assets $17,397.4 $16,717.6
LIABILITIES AND EQUITY
Current liabilities:
Accounts payable $ 1,334.0 $ 1,249.3
Accrued compensation and benefits 469.8 437.4
Accrued expenses and other current liabilities 1,425.7 1,457.5
Short-term borrowings and current maturities of long-term debt 360.8 504.2
Total current liabilities 3,590.3 3,648.4
Long-term debt 3,709.4 3,713.6
Postemployment and other benefit liabilities 1,356.5 1,409.9
Deferred and noncurrent income taxes 884.9 896.1
Other noncurrent liabilities 1,138.0 1,170.4
Total liabilities 10,679.1 10,838.4
Equity:
Ingersoll-Rand plc shareholders’ equity
Ordinary shares, $1 par value (271,673,124 and 269,029,003 shares issued at December 31, 2016 and 2015, respectively)
271.7 269.0
Ordinary shares held in treasury, at cost (12,666,804 and 7,777,486 shares at December 31, 2016 and 2015, respectively)
(702.7) (452.6)
Capital in excess of par value 346.5 223.3
Retained earnings 8,018.8 6,897.9
Accumulated other comprehensive loss (1,290.5) (1,120.9)
Total Ingersoll-Rand plc shareholders’ equity 6,643.8 5,816.7
Noncontrolling interest 74.5 62.5
Total equity 6,718.3 5,879.2
Total liabilities and equity $17,397.4 $16,717.6
See accompanying notes to Consolidated Financial Statements.

2016 ANNUAL REPORT | PAGE F-5
2016 Annual Report
INGERSOLL-RAND PLC CONSOLIDATED STATEMENTS OF EQUITY
Ingersoll-Rand plc shareholders’ equity
In millions, except per share amountsTotal
equity
Ordinary shares
Ordinary shares held in treasury,
at cost
Capital inexcess ofpar value
Retainedearnings
Accumulated other
comprehensiveincome (loss)
Noncontrolling InterestAmount Shares
Balance at December 31, 2013 $ 7,131.3 $282.7 282.7 $ (0.8) $ 159.2 $6,794.5 $ (166.7) $ 62.4
Net earnings 950.4 – – – – 931.7 – 18.7
Other comprehensive income (549.8) – – – – – (547.6) (2.2)
Shares issued under incentive stock plans 113.1 3.2 3.2 – 109.9 – – –
Repurchase of ordinary shares (1,374.9) (19.6) (19.6) (202.0) (235.5) (917.8) – –
Share-based compensation 63.8 – – – 63.8 – – –
Dividends declared to noncontrolling interest (20.9) – – – – – – (20.9)
Cash dividends, declared ($1.00 per share) (267.6) – – – – (267.6) – –
Other – – – 0.3 (0.3) – – –
Balance at December 31, 2014 $ 6,045.4 $266.3 266.3 $(202.5) $ 97.1 $6,540.8 $ (714.3) $ 58.0
Net earnings 682.8 – – – – 664.6 – 18.2
Other comprehensive loss (410.9) – – – – – (406.6) (4.3)
Shares issued under incentive stock plans 65.9 2.7 2.7 – 63.2 – – –
Repurchase of ordinary shares (250.1) – – (250.1) – – – –
Share-based compensation 61.8 – – – 63.0 (1.2) – –
Dividends declared to noncontrolling interest (9.4) – – – – – – (9.4)
Cash dividends declared ($1.16 per share) (305.6) – – – – (305.6) – –
Other (0.7) – – – – (0.7) – –
Balance at December 31, 2015 $ 5,879.2 $269.0 269.0 $(452.6) $ 223.3 $6,897.9 $ (1,120.9) $ 62.5
Net earnings 1,492.7 – – – – 1,476.2 – 16.5
Other comprehensive loss (160.0) – – – – – (169.6) 9.6
Shares issued under incentive stock plans 60.4 2.7 2.7 – 57.7 – – –
Repurchase of ordinary shares (250.1) – – (250.1) – – – –
Share-based compensation 61.6 – – – 66.0 (4.4) – –
Dividends declared to noncontrolling interest (14.1) – – – – – – (14.1)
Cash dividends declared ($1.36 per share) (351.0) – – – – (351.0) – –
Other (0.4) – – – (0.5) 0.1 – –
Balance at December 31, 2016 $ 6,718.3 $271.7 271.7 $(702.7) $ 346.5 $8,018.8 $ (1,290.5) $ 74.5
See accompanying notes to Consolidated Financial Statements.

PAGE F-6 | INGERSOLL RAND
2016
Ann
ual R
epor
t
INGERSOLL-RAND PLC CONSOLIDATED STATEMENTS OF CASH FLOWSIn millions
For the years ended December 31, 2016 2015 2014
Cash flows from operating activities:
Net earnings $1,492.7 $ 682.8 $ 950.4
Discontinued operations, net of tax (32.9) 24.3 (34.7)
Adjustments for non-cash transactions:
Depreciation and amortization 352.2 364.1 332.4
Gain on sale of Hussmann equity investment (397.8) – –
Other non-cash items, net 35.6 157.7 (35.1)
Changes in other assets and liabilities
Accounts and notes receivable (101.3) (79.8) (119.9)
Inventories 26.8 (6.3) (230.0)
Other current and noncurrent assets (24.5) 248.8 83.0
Accounts payable 103.6 (41.0) 157.2
Other current and noncurrent liabilities (43.1) (464.4) (111.6)
Net cash provided by (used in) continuing operating activities 1,411.3 886.2 991.7
Net cash provided by (used in) provided by discontinued operating activities 88.9 (35.1) (18.5)
Net cash provided by (used in) operating activities 1,500.2 851.1 973.2
Cash flows from investing activities:
Capital expenditures (182.7) (249.6) (233.5)
Acquisition of businesses, net of cash acquired (9.2) (961.8) (10.2)
Proceeds from sale of property, plant and equipment 9.5 18.5 14.4
Proceeds from business and equity investment dispositions 422.5 – 2.0
Dividends received from equity investments – – 30.3
Net cash provided by (used in) investing activities 240.1 (1,192.9) (197.0)
Cash flows from financing activities:
Short-term borrowings (payments), net (150.7) 30.3 99.6
Proceeds from long-term debt – – 1,108.6
Payments of long-term debt – (23.9) (508.0)
Net proceeds (repayments) of debt (150.7) 6.4 700.2
Debt issuance costs (2.1) – (12.3)
Dividends paid to ordinary shareholders (348.6) (303.3) (264.7)
Dividends paid to noncontrolling interests (14.1) (9.3) (20.9)
Proceeds from shares issued under incentive plans 62.9 61.3 113.1
Repurchase of ordinary shares (250.1) (250.1) (1,374.9)
Other financing activities, net (2.5) 4.7 –
Net cash provided by (used in) continuing financing activities (705.2) (490.3) (859.5)
Effect of exchange rate changes on cash and cash equivalents (57.2) (136.3) (148.7)
Net increase (decrease) in cash and cash equivalents 977.9 (968.4) (232.0)
Cash and cash equivalents – beginning of period 736.8 1,705.2 1,937.2
Cash and cash equivalents – end of period $1,714.7 $ 736.8 $ 1,705.2
Cash paid during the year for:
Interest $ 169.7 $ 172.4 $ 193.5
Income taxes, net of refunds $ 334.3 $ 408.6 $ 159.8
See accompanying notes to Consolidated Financial Statements.

2016 ANNUAL REPORT | PAGE F-7
2016 Annual Report
NOTES TO CONSOLIDATED FINANCIAL STATEMENTSNOTE 1. DESCRIPTION OF COMPANYIngersoll-Rand plc (Plc or Parent Company), a public limited company incorporated in Ireland in 2009, and its consolidated subsidiaries (collectively, we, our, the Company) is a diversified, global company that provides products, services and solutions to enhance the quality, energy efficiency and comfort of air in homes and buildings, transport and protect food and perishables and increase industrial productivity and efficiency. The Company’s business segments consist of Climate and Industrial, both with strong brands and leading positions within their respective markets. The Company generates revenue and cash primarily through the design, manufacture, sale and service of a diverse portfolio of industrial and commercial products that include well-recognized, premium brand names such as Ingersoll-Rand®, Trane®, Thermo King®, American Standard®, ARO®, and Club Car®.
NOTE 2. SUMMARY OF SIGNIFICANT ACCOUNTING POLICIESA summary of significant accounting policies used in the preparation of the accompanying Consolidated Financial Statements follows:
Basis of Presentation: The accompanying Consolidated Financial Statements reflect the consolidated operations of the Company and have been prepared in accordance with U.S. Generally Accepted Accounting Principles (GAAP) as defined by the Financial Accounting Standards Board (FASB) within the FASB Accounting Standards Codification (ASC). Intercompany accounts and transactions have been eliminated. The assets, liabilities, results of operations and cash flows of all discontinued operations have been separately reported as discontinued operations for all periods presented. Certain reclassifications of amounts reported in prior periods have been made to conform with the current period presentation.
The Consolidated Financial Statements include all majority-owned subsidiaries of the Company. A noncontrolling interest in a subsidiary is considered an ownership interest in a majority-owned subsidiary that is not attributable to the parent. The Company includes Noncontrolling interest as a component of Total equity in the Consolidated Balance Sheet and the Net earnings attributable to noncontrolling interests are presented as an adjustment from Net earnings used to arrive at Net earnings attributable to Ingersoll-Rand plc in the Consolidated Statement of Comprehensive Income. Partially-owned equity affiliates represent 20-50% ownership interests in investments where the Company demonstrates significant influence, but does not have a controlling financial interest. Partially-owned equity affiliates are accounted for under the equity method.
Use of Estimates: The preparation of financial statements in conformity with GAAP requires management to make estimates and assumptions that affect the reported amounts of assets and liabilities and the disclosures of contingent assets and liabilities at the date of the financial statements as well as the reported amounts of revenues and expenses during the reporting period. Estimates are based on several factors including the facts and circumstances available at the time the estimates are made, historical experience, risk of loss, general economic conditions and trends, and the assessment of the probable future outcome. Actual results could differ from those estimates. Estimates and assumptions are reviewed periodically, and the effects of changes, if any, are reflected in the statement of operations in the period that they are determined.
Currency Translation: Assets and liabilities of non-U.S. subsidiaries, where the functional currency is not the U.S. dollar, have been translated at year-end exchange rates, and income and expense accounts have been translated using average exchange rates throughout the year. Adjustments resulting from the process of translating an entity’s financial statements into the U.S. dollar have been recorded in the equity section of the Consolidated Balance Sheet within Accumulated other comprehensive income (loss). Transactions that are denominated in a currency other than an entity’s functional currency are subject to changes in exchange rates with the resulting gains and losses recorded within Net earnings.
Cash and Cash Equivalents: Cash and cash equivalents include cash on hand, demand deposits and all highly liquid investments with original maturities at the time of purchase of three months or less. The Company maintains amounts on deposit at various financial institutions, which may at times exceed federally insured limits. However, management periodically evaluates the credit-worthiness of those institutions and has not experienced any losses on such deposits.
Inventories: Depending on the business, U.S. inventories are stated at the lower of cost or market using the last-in, first-out (LIFO) method or the lower of cost or market using the first-in, first-out (FIFO) method. Non-U.S. inventories are primarily stated at the lower of cost or market using the FIFO method. At both December 31, 2016 and 2015, approximately 51% of all inventory utilized the LIFO method.

PAGE F-8 | INGERSOLL RAND
2016
Ann
ual R
epor
t
Allowance for Doubtful Accounts: The Company maintains an allowance for doubtful accounts receivable which represents the best estimate of probable loss inherent in the Company’s accounts receivable portfolio. This estimate is based upon a two-step policy that results in the total recorded allowance for doubtful accounts. The first step is to record a portfolio reserve based on the aging of the outstanding accounts receivable portfolio and the Company’s historical experience with the Company’s end markets, customer base and products. The second step is to create a specific reserve for significant accounts as to which the customer’s ability to satisfy their financial obligation to the Company is in doubt due to circumstances such as bankruptcy, deteriorating operating results or financial position. In these circumstances, management uses its judgment to record an allowance based on the best estimate of probable loss, factoring in such considerations as the market value of collateral, if applicable. Actual results could differ from those estimates. These estimates and assumptions are reviewed periodically, and the effects of changes, if any, are reflected in the Consolidated Statement of Comprehensive Income in the period that they are determined. The Company reserved $26.0 million and $28.3 million for doubtful accounts as of December 31, 2016 and 2015, respectively.
Property, Plant and Equipment: Property, plant and equipment are stated at cost, less accumulated depreciation. Assets placed in service are recorded at cost and depreciated using the straight-line method over the estimated useful life of the asset except for leasehold improvements, which are depreciated over the shorter of their economic useful life or their lease term. The range of useful lives used to depreciate property, plant and equipment is as follows:
Buildings 10 to 50 years
Machinery and equipment 2 to 12 years
Software 2 to 7 years
Major expenditures for replacements and significant improvements that increase asset values and extend useful lives are also capitalized. Capitalized costs are amortized over their estimated useful lives using the straight-line method. Repairs and maintenance expenditures that do not extend the useful life of the asset are charged to expense as incurred. The carrying amounts of assets that are sold or retired and the related accumulated depreciation are removed from the accounts in the year of disposal, and any resulting gain or loss is reflected within current earnings.
Per ASC 360, “Property, Plant, and Equipment,” (ASC 360) the Company assesses the recoverability of the carrying value of its property, plant and equipment whenever events or changes in circumstances indicate that the carrying amount of the asset may not be recoverable. Recoverability is measured by a comparison of the carrying amount of an asset to the future net undiscounted cash flows expected to be generated by the asset. If the undiscounted cash flows are less than the carrying amount of the asset, an impairment loss is recognized for the amount by which the carrying value of the asset exceeds the fair value of the assets.
Goodwill and Intangible Assets: The Company records as goodwill the excess of the purchase price over the fair value of the net assets acquired. In accordance with ASC 350, “Intangibles-Goodwill and Other,” (ASC 350) goodwill and other indefinite-lived intangible assets are tested and reviewed annually for impairment during the fourth quarter or whenever there is a significant change in events or circumstances that indicate that the fair value of the asset is more likely than not less than the carrying amount of the asset.
Recoverability of goodwill is measured at the reporting unit level and begins with a qualitative assessment to determine, if it is more likely than not that the fair value of each reporting unit is less than its carrying amount as a basis for determining whether it is necessary to perform the two-step goodwill impairment test under ASC 350. For those reporting units where it is required, the first step compares the carrying amount of the reporting unit to its estimated fair value. If the estimated fair value of a reporting unit exceeds its carrying amount, goodwill of the reporting unit is not impaired and the second step of the impairment test is not necessary. To the extent that the carrying value of the reporting unit exceeds its estimated fair value, a second step is performed, wherein the reporting unit’s carrying value of goodwill is compared to the implied fair value of goodwill. To the extent that the carrying value exceeds the implied fair value, impairment exists and must be recognized.
Intangible assets such as patents, customer-related intangible assets and other intangible assets with finite useful lives are amortized on a straight-line basis over their estimated economic lives. The weighted-average useful lives approximate the following:
Customer relationships 20 years
Completed technology/patents 10 years
Other 20 years

2016 ANNUAL REPORT | PAGE F-9
2016 Annual Report
The Company assesses the recoverability of the carrying value of its intangible assets with finite useful lives whenever events or changes in circumstances indicate that the carrying amount of the asset may not be recoverable. Recoverability is measured by a comparison of the carrying amount of an asset to the future net undiscounted cash flows expected to be generated by the asset. If the undiscounted cash flows are less than the carrying amount of the asset, an impairment loss is recognized for the amount by which the carrying value of the asset exceeds the fair value of the assets.
Income Taxes: Deferred tax assets and liabilities are determined based on temporary differences between financial reporting and tax bases of assets and liabilities, applying enacted tax rates expected to be in effect for the year in which the differences are expected to reverse. The Company recognizes future tax benefits, such as net operating losses and non-U.S. tax credits, to the extent that realizing these benefits is considered in its judgment to be more likely than not. The Company regularly reviews the recoverability of its deferred tax assets considering its historic profitability, projected future taxable income, timing of the reversals of existing temporary differences and the feasibility of its tax planning strategies. Where appropriate, the Company records a valuation allowance with respect to a future tax benefit.
Product Warranties: Standard product warranty accruals are recorded at the time of sale and are estimated based upon product warranty terms and historical experience. The Company assesses the adequacy of its liabilities and will make adjustments as necessary based on known or anticipated warranty claims, or as new information becomes available. The Company’s extended warranty liability represents the deferred revenue associated with its extended warranty contracts and is amortized into Revenue on a straight-line basis over the life of the contract, unless another method is more representative of the costs incurred. The Company assesses the adequacy of its liability by evaluating the expected costs under its existing contracts to ensure these expected costs do not exceed the extended warranty liability.
Treasury Stock: The Parent Company has repurchased its common shares from time to time as authorized by the Board of Directors. These repurchases are at the discretion of management subject to market conditions, regulatory requirements and other considerations. Amounts are recorded at cost and included within the Equity section of the Consolidated Balance Sheet.
Revenue Recognition: Revenue is recognized and earned when all of the following criteria are satisfied: (a) persuasive evidence of a sales arrangement exists; (b) the price is fixed or determinable; (c) collectability is reasonably assured; and (d) delivery has occurred or service has been rendered. Delivery generally occurs when the title and the risks and rewards of ownership have substantially transferred to the customer. Both the persuasive evidence of a sales arrangement and fixed or determinable price criteria are deemed to be satisfied upon receipt of an executed and legally binding sales agreement or contract that clearly defines the terms and conditions of the transaction including the respective obligations of the parties. If the defined terms and conditions allow variability in all or a component of the price, revenue is not recognized until such time that the price becomes fixed or determinable. At the point of sale, the Company validates that existence of an enforceable claim that requires payment within a reasonable amount of time and assesses the collectability of that claim. If collectability is not deemed to be reasonably assured, then revenue recognition is deferred until such time that collectability becomes probable or cash is received. Delivery is not considered to have occurred until the customer has taken title and assumed the risks and rewards of ownership. Service and installation revenue are recognized when earned. In some instances, customer acceptance provisions are included in sales arrangements to give the buyer the ability to ensure the delivered product or service meets the criteria established in the order. In these instances, revenue recognition is deferred until the acceptance terms specified in the arrangement are fulfilled through customer acceptance or a demonstration that established criteria have been satisfied. If uncertainty exists about customer acceptance, revenue is not recognized until acceptance has occurred.
The Company offers various sales incentive programs to customers, dealers, and distributors. Sales incentive programs do not preclude revenue recognition, but do require an accrual for the Company’s best estimate of expected activity. Examples of the sales incentives that are accrued for as a contra receivable and sales deduction at the point of sale include, but are not limited to, discounts (i.e., net 30 type), coupons, and rebates where the customer does not have to provide any additional requirements to receive the discount. Sales returns and customer disputes involving a question of quantity or price are also accounted for as a reduction in revenue and a contra receivable. At December 31, 2016 and 2015, the Company had a customer claim accrual (contra receivable) of $3.7 million and $4.0 million, respectively. All other incentives or incentive programs where the customer is required to reach a certain sales level, remain a customer for a certain period of time, provide a rebate form or is subject to additional requirements are accounted for as a reduction of revenue and establishment of a liability. At December 31, 2016 and 2015, the Company had a sales incentive accrual of $87.5 million and $83.2 million, respectively. Each of these accruals represents the best estimate the Company expects to pay related to previously sold units. These estimates are reviewed regularly for appropriateness. If updated information or actual amounts are different from previous estimates, the revisions are included in the results for the period in which they become known. Historically, the aggregate differences, if any, between the Company’s estimates and actual amounts in any year have not had a material impact on the Consolidated Financial Statements.

PAGE F-10 | INGERSOLL RAND
2016
Ann
ual R
epor
t
The Company enters into maintenance and extended warranty contracts with customers. Revenue related to these services is recognized on a straight-line basis over the life of the contract, unless sufficient historical evidence indicates that the cost of providing these services is incurred on an other than straight-line basis. In these circumstances, revenue is recognized over the contract period in proportion to the costs expected to be incurred in performing the service.
The Company, primarily through its Climate segment, enters into construction-type contracts to design, deliver and build integrated HVAC solutions to meet customer specifications. The term of these types of contracts is typically less than one year, but can be as long as three years. Revenues related to these contracts are recognized using the percentage-of-completion method in accordance with GAAP. This measure of progress toward completion, utilized to recognize sales and profits, is based on the proportion of actual cost incurred to date as compared to the total estimate of contract costs at completion. The timing of revenue recognition often differs from the invoicing schedule to the customer, with revenue recognition in advance of customer invoicing recorded to unbilled accounts receivable and invoicing in advance of revenue recognition recorded to deferred revenue. At December 31, 2016, all recorded receivables (billed and unbilled) are due within one year. The Company re-evaluates its contract estimates periodically and reflects changes in estimates in the current period using the cumulative catch-up method. These periodic reviews have not historically resulted in significant adjustments. If estimated contract costs are in excess of contract revenues, then the excess costs are accrued.
The Company enters into sales arrangements that contain multiple elements, such as equipment, installation and service revenue. For multiple element arrangements, each element is evaluated to determine the separate units of accounting. The total arrangement consideration is then allocated to the separate units of accounting based on their relative selling price at the inception of the arrangement. The relative selling price is determined using vendor specific objective evidence (VSOE) of selling price, if it exists; otherwise, third-party evidence (TPE) of selling price is used. If neither VSOE nor TPE of selling price exists for a deliverable, a best estimate of the selling price is developed for that deliverable. The Company primarily utilizes VSOE to determine its relative selling price. The Company recognizes revenue for delivered elements when the delivered item has stand-alone value to the customer, the basic revenue recognition criteria have been met, and only customary refund or return rights related to the delivered elements exist.
Environmental Costs: The Company is subject to laws and regulations relating to protecting the environment. Environmental expenditures relating to current operations are expensed or capitalized as appropriate. Expenditures relating to existing conditions caused by past operations, which do not contribute to current or future revenues, are expensed. Liabilities for remediation costs are recorded when they are probable and can be reasonably estimated, generally no later than the completion of feasibility studies or the Company’s commitment to a plan of action. The assessment of this liability, which is calculated based on existing technology, does not reflect any offset for possible recoveries from insurance companies, and is not discounted.
Asbestos Matters: Certain of our wholly-owned subsidiaries are named as defendants in asbestos-related lawsuits in state and federal courts. The Company records a liability for our actual and anticipated future claims as well as an asset for anticipated insurance settlements. Asbestos related defense costs are excluded from the asbestos claims liability and are recorded separately as services are incurred. None of the Company’s existing or previously-owned businesses were a producer or manufacturer of asbestos. The Company records certain income and expenses associated with our asbestos liabilities and corresponding insurance recoveries within discontinued operations, net of tax, as they relate to previously divested businesses, except for amounts associated with Trane U.S. Inc.’s asbestos liabilities and corresponding insurance recoveries which are recorded within continuing operations.
Research and Development Costs: The Company conducts research and development activities for the purpose of developing and improving new products and services. These expenditures are expensed when incurred. For the years ended December 31, 2016, 2015 and 2014, these expenditures amounted to approximately $207.9 million, $205.9 million and $212.3 million, respectively.
Software Costs: The Company capitalizes certain qualified internal-use software costs during the application development stage and subsequently amortizes those costs over the software’s useful life, which ranges from 2 to 7 years. The Company capitalizes costs, including interest, incurred to develop or acquire internal-use software. These costs are capitalized subsequent to the preliminary project stage once specific criteria are met. Costs incurred in the preliminary project planning stage are expensed. Other costs, such as maintenance and training, are also expensed as incurred. Capitalized costs are amortized over their estimated useful lives using the straight-line method.
Employee Benefit Plans: The Company provides a range of benefits, including pensions, postretirement and postemployment benefits to eligible current and former employees. Determining the cost associated with such benefits is dependent on various actuarial assumptions, including discount rates, expected return on plan assets, compensation increases, employee mortality, turnover rates, and healthcare cost trend rates. Actuaries perform the required calculations to determine expense in accordance with GAAP. Actual results may differ from the actuarial assumptions and are generally accumulated into Accumulated other comprehensive income (loss) and amortized into Net earnings over future periods. The Company reviews its actuarial assumptions at each measurement date and makes modifications to the assumptions based on current rates and trends, if appropriate.

2016 ANNUAL REPORT | PAGE F-11
2016 Annual Report
Loss Contingencies: Liabilities are recorded for various contingencies arising in the normal course of business, including litigation and administrative proceedings, environmental matters, product liability, product warranty, worker’s compensation and other claims. The Company has recorded reserves in the financial statements related to these matters, which are developed using input derived from actuarial estimates and historical and anticipated experience data depending on the nature of the reserve, and in certain instances with consultation of legal counsel, internal and external consultants and engineers. Subject to the uncertainties inherent in estimating future costs for these types of liabilities, the Company believes its estimated reserves are reasonable and does not believe the final determination of the liabilities with respect to these matters would have a material effect on the financial condition, results of operations, liquidity or cash flows of the Company for any year.
Derivative Instruments: The Company periodically enters into cash flow and other derivative transactions to specifically hedge exposure to various risks related to interest rates and currency rates. The Company recognizes all derivatives on the Consolidated Balance Sheet at their fair value as either assets or liabilities. For cash flow designated hedges, the effective portion of the changes in fair value of the derivative contract are recorded in Accumulated other comprehensive income (loss), net of taxes, and are recognized in Net earnings at the time earnings are affected by the hedged transaction. For other derivative transactions, the changes in the fair value of the derivative contract are immediately recognized in Net earnings.
Recent Accounting Pronouncements
The FASB ASC is the sole source of authoritative GAAP other than the Securities and Exchange Commission (SEC) issued rules and regulations that apply only to SEC registrants. The FASB issues an Accounting Standards Update (ASU) to communicate changes to the codification. The Company considers the applicability and impact of all ASU’s. ASU’s not listed below were assessed and determined to be either not applicable or are not expected to have a material impact on the consolidated financial statements.
Recently Adopted Accounting Pronouncements
In November 2015, the FASB issued ASU 2015-17, “Balance Sheet Classification of Deferred Taxes” (ASU 2015-17). ASU 2015-17 requires that deferred income tax liabilities and assets be classified as noncurrent in a classified statement of financial position. The standard is effective for annual periods beginning after December 15, 2016 and interim periods within those annual periods, with early adoption permitted. The amendments may be applied either prospectively to all deferred tax liabilities and assets or retrospectively to all periods presented. The Company elected to early adopt this standard prospectively to all deferred tax assets and liabilities beginning with the December 31, 2015 amounts presented.
In September 2015, the FASB issued ASU 2015-16, “Business Combinations (Topic 805): Simplifying the Accounting for Measurement Period Adjustments” (ASU 2015-16) which eliminates the requirement for an acquirer in a business combination to account for measurement period adjustments retrospectively. As a result, adjustments to provisional amounts that are identified during the measurement period are recognized in the reporting period in which the adjustment amounts are determined. ASU 2015-16 is effective for fiscal years beginning after December 15, 2015, including interim periods within those fiscal years, with early adoption permitted. The Company adopted this standard on January 1, 2016 and will apply provisions, as applicable, to future acquisitions.
In April 2015, the FASB issued ASU 2015-03, “Simplifying the Presentation of Debt Issuance Costs” (ASU 2015-03) which amends the current presentation of debt issuance costs in the financial statements. ASU 2015-03 requires an entity to present debt issuance costs related to a recognized debt liability in the balance sheet as a direct deduction from the carrying amount of the debt liability, consistent with debt discounts. The recognition and measurement guidance for debt issuance costs are not affected by the amendments in this update. ASU 2015-03 is effective on a retrospective basis for financial statements issued for fiscal years beginning after December 15, 2015 and interim periods within those annual periods. The Company adopted this standard on January 1, 2016 and has retrospectively adjusted the prior period presented. This change in classification resulted in a net $21.2 million decrease to Other noncurrent assets with a corresponding decrease to Long-term debt as of December 31, 2015.
In April 2015, the FASB issued ASU 2015-05, “Customer’s Accounting for Fees Paid in a Cloud Computing Arrangement” (ASU 2015-05) which provides guidance about whether a cloud computing arrangement includes a software license and how to account for the license under each scenario. The standard is effective for annual periods beginning after December 15, 2015, including interim periods within those annual periods. A reporting entity may apply the standard prospectively to all arrangements entered into or materially modified after the effective date, or retrospectively to all prior periods presented in the financial statements. Early adoption is permitted. The Company adopted this standard on January 1, 2016. The adoption of the new standard did not have an impact on the Company’s financial statements.
In April 2014, the FASB issued Accounting Standards Update (ASU) 2014-08, “Presentation of Financial Statements and Property, Plant, and Equipment - Reporting Discontinued Operations and Disclosures of Disposals of Components of an Entity” (ASU 2014-08). ASU 2014-08 provides new guidance related to the definition of a discontinued operation and requires new disclosures of both discontinued operations and certain other disposals that do not meet the definition of a discontinued operation. This standard is effective for annual periods beginning on or after December 15, 2014 and interim periods within those years. The Company will apply this standard, as applicable, to future disposals of components or classifications as held for sale.

PAGE F-12 | INGERSOLL RAND
2016
Ann
ual R
epor
t
Recently Issued Accounting Pronouncements
In October 2016, the FASB issued ASU 2016-16, “Income Taxes (Topic 740): Intra-Entity Transfers of Assets Other Than Inventory” (ASU 2016-16) which removes the prohibition in Topic 740 against the immediate recognition of the current and deferred income tax effects of intra-entity transfers of assets other than inventory. ASU 2016-16 is effective for annual reporting periods beginning after December 15, 2017, including interim periods within those annual periods, with early adoption permitted. The amendments are to be applied on a modified retrospective basis through a cumulative-effect adjustment directly to Retained earnings as of the beginning of the period of adoption. The Company is still assessing the impact to the financial statements and intends to adopt the standard on January 1, 2018.
In March 2016, the FASB issued ASU No. 2016-09, “Compensation-Stock Compensation (Topic 718): Improvements to Employee Share-Based Payment Accounting” (ASU 2016-09) which simplifies several aspects of the accounting for employee share-based payment transactions. The standard makes several modifications to the accounting for forfeitures, employer tax withholding on share-based compensation and the financial statement presentation of excess tax benefits or deficiencies. In addition, ASU 2016-09 clarifies the statement of cash flows presentation for certain components of share-based awards. The standard is effective for interim and annual reporting periods beginning after December 15, 2016, although early adoption is permitted. The Company will adopt this standard on January 1, 2017 and expects the primary impact to be the prospective financial presentation of excess tax benefits or deficiencies in the income statement as a component of Provision for income taxes rather than in the Equity section of the Balance Sheet. In addition, these amounts will be presented as an operating activity on the statement of cash flows rather than as a financing activity. Had this ASU been adopted at January 1, 2016, the Provision for income taxes would have been reduced by approximately $20 million for the year ended December 31, 2016. The actual amounts realized in future periods are inherently uncertain and will vary based on the timing and relative value realized for future share-based transactions. As part of the adoption of the standard on January 1, 2017, the Company will reclassify $15.1 million of excess tax benefits previously unrecognized on a modified retrospective basis through a cumulative-effect adjustment to Retained earnings.
In February 2016, the FASB issued ASU 2016-02, “Leases” (ASU 2016-02) which requires the lease rights and obligations arising from lease contracts, including existing and new arrangements, to be recognized as assets and liabilities on the balance sheet. The standard also requires additional disclosures by lessees and contains targeted changes to accounting by lessors. ASU 2016-02 is effective for annual periods beginning after December 15, 2018, including interim periods within those annual periods, with early adoption permitted. The standard is required to be adopted at the earliest period presented using a modified retrospective approach. The Company is currently assessing the impact of the ASU on its financial statements but anticipates the adoption to have a material impact on its assets and liabilities due to the recognition of lease rights and obligations to the Balance Sheet. However, the Company does not expect the adoption on January 1, 2019 to have a material impacts to its Statements of Cash Flows or Statements of Comprehensive Income.
In May 2014, the FASB issued ASU No. 2014-09, “Revenue from Contracts with Customers” (ASC 606), which creates a comprehensive, five-step model for revenue recognition that requires a company to recognize revenue to depict the transfer of promised goods or services to a customer at an amount that reflects the consideration it expects to receive in exchange for those goods or services. Under the new standard, a company will be required to use more judgment and make more estimates when considering contract terms as well as relevant facts and circumstances when identifying performance obligations, estimating the amount of variable consideration in the transaction price and allocating the transaction price to each separate performance obligation. In addition, ASC 606 enhances disclosures about revenue, provides guidance for transactions that were not previously addressed comprehensively and improves guidance for multiple-element arrangements. ASC 606 is effective for annual reporting periods beginning after December 15, 2017 and is required to be applied retrospectively to each prior reporting period presented or retrospectively with the cumulative effect of initially applying it recognized at the date of initial application. Early adoption is permitted, but not before the original effective date of the standard.
In 2014, the Company began to assess the impact of adopting ASC 606 on its revenue recognition practices. Utilizing working sessions and document reviews with each of its reporting units as well as with appropriate functions such as legal and tax, the Company identified potential differences that would result from applying the requirements of the new standard on our revenue contracts. During 2015, the Company drafted preliminary accounting positions addressing identified potential differences and later determined that certain highly engineered products sold to customers within the Industrial segment and which revenue is currently recognized at a point in time, will meet the criteria of a performance obligation satisfied over time under the new standard. Total applicable revenues represent approximately 4% of the Industrial segment revenue and less than 1% of total Company revenue. While the Company is still in the process of assessing the impact to the financial statements, management believes the adoption of ASC 606 will not have a material impact to Net revenues, Operating income or the Balance Sheet. In addition, the Company is still determining whether to apply the guidance retrospectively or recognizing the cumulative effect of initially applying the standard as an opening balance sheet adjustment to equity in the period of initial adoption.

2016 ANNUAL REPORT | PAGE F-13
2016 Annual Report
In July 2015, the FASB issued ASU 2015-11, “Simplifying the Measurement of Inventory” (ASU 2015-11). ASU 2015-11 requires inventory that is recorded using the first in, first out method to be measured at the lower of cost or net realizable value. The standard is effective for annual periods beginning after December 15, 2016 and interim periods within those annual periods. The amendments are to be applied prospectively with earlier application permitted as of the beginning of an interim or annual reporting period. The adoption of the new standard is not expected to have a material impact on the Company’s financial statements.
NOTE 3. INVENTORIESDepending on the business, U.S. inventories are stated at the lower of cost or market using the last-in, first-out (LIFO) method or the lower of cost or market using the first-in, first-out (FIFO) method. Non-U.S. inventories are primarily stated at the lower of cost or market using the FIFO method.
At December 31, the major classes of inventory were as follows:
In millions 2016 2015
Raw materials $ 448.5 $ 514.9
Work-in-process 154.0 131.0
Finished goods 845.6 825.7
1,448.1 1,471.6
LIFO reserve (62.3) (60.9)
Total $1,385.8 $1,410.7
The Company performs periodic assessments to determine the existence of obsolete, slow-moving and non-saleable inventories and records necessary provisions to reduce such inventories to net realizable value. Reserve balances, primarily related to obsolete and slow-moving inventories, were $111.7 million and $100.4 million at December 31, 2016 and December 31, 2015, respectively.
NOTE 4. PROPERTY, PLANT AND EQUIPMENTAt December 31, the major classes of property, plant and equipment were as follows:
In millions 2016 2015
Land $ 49.2 $ 61.7
Buildings 708.9 699.1
Machinery and equipment 1,831.1 1,749.6
Software 778.5 723.4
3,367.7 3,233.8
Accumulated depreciation (1,856.7) (1,658.7)
Total $1,511.0 $1,575.1
Depreciation expense for the years ended December 31, 2016, 2015 and 2014 was $216.7 million, $209.5 million and $199.9 million, which include amounts for software amortization of $35.9 million, $41.9 million and $40.1 million, respectively.

PAGE F-14 | INGERSOLL RAND
2016
Ann
ual R
epor
t
NOTE 5. GOODWILLThe Company records as goodwill the excess of the purchase price over the fair value of the net assets acquired. Once the final valuation has been performed for each acquisition, adjustments may be recorded. Goodwill is tested and reviewed annually for impairment during the fourth quarter or whenever there is a significant change in events or circumstances that indicate that the fair value of the asset may be less than the carrying amount of the asset.
The changes in the carrying amount of Goodwill are as follows:
In millions Climate Industrial Total
Net balance as of December 31, 2014 $5,022.9 $366.9 $5,389.8
Acquisitions (1) 79.1 432.8 511.9
Currency translation (149.4) (22.1) (171.5)
Net balance as of December 31, 2015 $4,952.6 $777.6 $5,730.2
Acquisitions (2) 0.4 12.5 12.9
Currency translation (73.9) (10.8) (84.7)
Net balance as of December 31, 2016 $4,879.1 $779.3 $5,658.4
(1) The increase in Climate segment goodwill is primarily related to the acquisition of FRIGOBLOCK in March 2015; the increase in Industrial segment goodwill is primarily related to the acquisition of the Engineered Centrifugal Compression business in January 2015. See Note 16 for further discussion of these acquisitions.
(2) In the second quarter of 2016, the Company acquired distributors of Industrial products that were previously independently owned. These acquisitions are not considered material for further disclosure.
The net goodwill balances at December 31, 2016, 2015 and 2014 include $2,496.0 million of accumulated impairment. The accumulated impairment relates entirely to a charge in the fourth quarter of 2008 associated with the Climate segment.
NOTE 6. INTANGIBLE ASSETSIndefinite-lived intangible assets are tested and reviewed annually for impairment during the fourth quarter or whenever there is a significant change in events or circumstances that indicate that the fair value of the asset may be less than the carrying amount of the asset. All other intangible assets with finite useful lives are being amortized on a straight-line basis over their estimated useful lives.
The following table sets forth the gross amount and related accumulated amortization of the Company’s intangible assets at December 31:
2016 2015
In millions
Gross carrying amount
Accumulated amortization
Net carrying amount
Gross carrying amount
Accumulated amortization
Net carrying amount
Completed technologies/patents $ 203.0 $ (165.6) $ 37.4 $ 214.9 $ (168.7) $ 46.2
Customer relationships 2,008.9 (926.1) 1,082.8 2,019.8 (811.5) 1,208.3
Other 61.1 (48.5) 12.6 63.5 (45.7) 17.8
Total finite-lived intangible assets $2,273.0 $(1,140.2) $1,132.8 $2,298.2 $(1,025.9) $1,272.3
Trademarks (indefinite-lived) 2,652.3 – 2,652.3 2,653.8 – 2,653.8
Total $4,925.3 $(1,140.2) $3,785.1 $4,952.0 $(1,025.9) $3,926.1
Intangible asset amortization expense for 2016, 2015 and 2014 was $132.0 million, $150.2 million and $128.3 million, respectively. Future estimated amortization expense on existing intangible assets in each of the next five years amounts to approximately $127 million for 2017, $127 million for 2018, $126 million for 2019, $124 million for 2020, and $124 million for 2021.

2016 ANNUAL REPORT | PAGE F-15
2016 Annual Report
NOTE 7. DEBT AND CREDIT FACILITIESAt December 31, short-term borrowings and current maturities of long-term debt consisted of the following:
In millions 2016 2015
Debentures with put feature $343.0 $ 343.0
Commercial Paper – 143.0
Other current maturities of long-term debt 7.7 7.8
Short-term borrowings 10.1 10.4
Total $360.8 $ 504.2
The weighted-average interest rate for total short-term borrowings and current maturities of long-term debt at December 31, 2016 and 2015 was 6.4% and 4.8%, respectively.
Commercial Paper Program
The Company uses borrowings under its commercial paper program for general corporate purposes. The maximum aggregate amount of unsecured commercial paper notes available to be issued, on a private placement basis, under the commercial paper program is $2 billion as of December 31, 2016. Under the commercial paper program, we may issue notes from time to time through Ingersoll-Rand Global Holding Company Limited or Ingersoll-Rand Luxembourg Finance S.A. Each of Ingersoll-Rand plc, Ingersoll-Rand Irish Holdings Unlimited Company, Ingersoll-Rand Lux International Holding Company S.à.r.l., Ingersoll-Rand Global Holding Company Limited and Ingersoll-Rand Company provided irrevocable and unconditional guarantees for any notes issued under the commercial paper program.
Debentures with Put Feature
At December 31, 2016 and December 31, 2015, the Company had $343.0 million of fixed rate debentures outstanding which contain a put feature that the holders may exercise on each anniversary of the issuance date. If exercised, the Company is obligated to repay in whole or in part, at the holder’s option, the outstanding principal amount of the debentures plus accrued interest. If these options are not exercised, the final contractual maturity dates would range between 2027 and 2028. Holders of these debentures had the option to exercise the put feature on each of the outstanding debentures in 2016, subject to the notice requirement. No material exercises were made.
At December 31, long-term debt excluding current maturities consisted of:
In millions 2016 2015
6.875% Senior notes due 2018 $ 748.6 $ 748.0
2.875% Senior notes due 2019 348.6 348.1
2.625% Senior notes due 2020 298.5 298.0
9.000% Debentures due 2021 124.8 124.8
4.250% Senior notes due 2023 695.6 695.0
7.200% Debentures due 2016-2025 59.7 67.1
3.550% Senior notes due 2024 494.5 493.7
6.48% Debentures due 2025 149.7 149.7
5.750% Senior notes due 2043 493.6 493.4
4.650% Senior notes due 2044 295.4 295.2
Other loans and notes, at end-of-year average interest rates of 6.79% in 2016 and 2.58% in 2015, maturing in various amounts to 2021 0.4 0.6
Total $3,709.4 $3,713.6

PAGE F-16 | INGERSOLL RAND
2016
Ann
ual R
epor
t
Scheduled maturities of short-term and long-term debt as of December 31, 2016 are as follows:
In millions
2017 $ 350.7
2018 756.3
2019 356.3
2020 306.0
2021 132.3
Thereafter 2,158.5
Total $4,060.1
Other Credit Facilities
The Company maintains two 5-year, $1.0 billion revolving credit facilities (the Facilities) through its wholly-owned subsidiaries, Ingersoll-Rand Global Holding Company Limited and Ingersoll-Rand Luxembourg Finance S.A. (collectively, the Borrowers). Each senior unsecured credit facility, one of which matures in March 2019 and the other in March 2021, provides support for the Company's commercial paper program and can be used for working capital and other general corporate purposes. Ingersoll-Rand plc, Ingersoll-Rand Irish Holdings Unlimited Company, Ingersoll-Rand Lux International Holding Company S.à.r.l. and Ingersoll-Rand Company each provide irrevocable and unconditional guarantees for these Facilities. In addition, each Borrower will guarantee the obligations under the Facilities of the other Borrower. Total commitments of $2.0 billion were unused at December 31, 2016 and December 31, 2015.
The Company also has various non-U.S. lines of credit that provide aggregate borrowing capacity of $886.9 million, of which $619.8 million was unused at December 31, 2016. These lines provide support for bank guarantees, letters of credit and other general corporate purposes.
Fair Value of Debt
The carrying value of the Company's short-term borrowings is a reasonable estimate of fair value due to the short-term nature of the instruments. The fair value of the Company's debt instruments at December 31, 2016 and December 31, 2015 was $4,428.9 million and $4,494.3 million, respectively. The Company measures the fair value of its long-term debt instruments for disclosure purposes based upon observable market prices quoted on public exchanges for similar assets. These fair value inputs are considered Level 2 within the fair value hierarchy. The methodologies used by the Company to determine the fair value of its long-term debt instruments at December 31, 2016 are the same as those used at December 31, 2015.
Guarantees
Along with Ingersoll-Rand plc, certain of the Company's 100% directly or indirectly owned subsidiaries have fully and unconditionally guaranteed, on a joint and several basis, public debt issued by other 100% directly or indirectly owned subsidiaries. Refer to Note 20 for the Company's current guarantor structure.
NOTE 8. FINANCIAL INSTRUMENTSIn the normal course of business, the Company is exposed to certain risks arising from business operations and economic factors. These fluctuations can increase the cost of financing, investing and operating the business. The Company may use various financial instruments, including derivative instruments, to manage the risks associated with interest rate and currency rate exposures. These financial instruments are not used for trading or speculative purposes.
On the date a derivative contract is entered into, the Company designates the derivative instrument as a cash flow hedge of a forecasted transaction or as an undesignated derivative. The Company formally documents its hedge relationships, including identification of the derivative instruments and the hedged items, as well as its risk management objectives and strategies for undertaking the hedge transaction. This process includes linking derivative instruments that are designated as hedges to specific assets, liabilities or forecasted transactions.
The Company assesses at inception and at least quarterly thereafter, whether the derivatives used in cash flow hedging transactions are highly effective in offsetting the changes in the cash flows of the hedged item. To the extent the derivative is deemed to be a highly effective hedge, the fair market value changes of the instrument are recorded to Accumulated other comprehensive income (AOCI). Any ineffective portion of a derivative instrument’s change in fair value is recorded in Net earnings in the period of change. If the hedging relationship ceases to be highly effective, or it becomes probable that a forecasted transaction is no longer expected to occur, the hedging relationship will be undesignated and any future gains and losses on the derivative instrument will be recorded in Net earnings.

2016 ANNUAL REPORT | PAGE F-17
2016 Annual Report
The fair values of derivative instruments included within the Consolidated Balance Sheet as of December 31 were as follows:
Derivative assets
Derivative liabilities
In millions 2016 2015 2016 2015
Derivatives designated as hedges:
Currency derivatives $ 0.3 $ 0.6 $ 2.9 $ 0.2
Derivatives not designated as hedges:
Currency derivatives 0.3 4.4 17.9 12.4
Total derivatives $0.6 $5.0 $20.8 $12.6
Asset and liability derivatives included in the table above are recorded within Other current assets and Accrued expenses and other current liabilities, respectively.
Currency Hedging Instruments
The notional amount of the Company’s currency derivatives was $1.1 billion at both December 31, 2016 and 2015. At December 31, 2016 and 2015, a net gain of $2.4 million and $0.5 million, net of tax, respectively, was included in AOCI related to the fair value of the Company’s currency derivatives designated as accounting hedges. The amount expected to be reclassified into Net earnings over the next twelve months is a gain of $2.4 million. The actual amounts that will be reclassified to Net earnings may vary from this amount as a result of changes in market conditions. Gains and losses associated with the Company’s currency derivatives not designated as hedges are recorded in Net earnings as changes in fair value occur. At December 31, 2016, the maximum term of the Company’s currency derivatives was approximately 12 months.
Other Derivative Instruments
The Company has utilized forward-starting interest rate swaps and interest rate locks to manage interest rate exposure in periods prior to the anticipated issuance of fixed-rate debt. These instruments were designated as cash flow hedges and had a notional amount of $1.3 billion at December 31, 2016 and 2015. Consequently, when the contracts were settled upon the issuance of the underlying debt, any realized gains or losses in the fair values of the instruments were deferred into Accumulated other comprehensive income. These deferred gains or losses are subsequently recognized into Interest expense over the term of the related notes. The net unrecognized gain in AOCI was $6.0 million and $5.5 million at December 31, 2016 and at December 31, 2015. The deferred gain at December 31, 2016 will be amortized over the term of notes with maturities ranging from 2018 to 2044. The amount expected to be amortized over the next twelve months is a net loss of $0.5 million. The Company has no forward-starting interest rate swaps or interest rate lock contracts outstanding at December 31, 2016 or 2015.
The following table represents the amounts associated with derivatives designated as hedges affecting Net earnings and AOCI for the years ended December 31:
Amount of gain (loss)recognized in AOCI
Location of gain (loss) reclassified from AOCI and
recognized into Net earnings
Amount of gain (loss) reclassified from AOCI and
recognized into Net earnings
In millions 2016 2015 2014 2016 2015 2014
Currency derivatives designated as hedges $ 2.2 $ 1.2 $ (3.0) Cost of goods sold $ 5.3 $ (2.1) $ (3.4)
Interest rate swaps & locks – – (0.1) Interest expense (0.5) (0.5) (2.3)
Total $2.2 $1.2 $(3.1) $ 4.8 $(2.6) $(5.7)
The following table represents the amounts associated with derivatives not designated as hedges affecting Net earnings for the years ended December 31:
In millionsLocation of gain (loss) recognized in
Net earnings
Amount of gain (loss) recognized in Net earnings
2016 2015 2014
Currency derivatives Other income/(expense), net $ (39.2) $ 0.1 $ (31.5)
Total $(39.2) $0.1 $(31.5)
The gains and losses associated with the Company’s undesignated currency derivatives are materially offset in Other income/(expense), net by changes in the fair value of the underlying transactions.

PAGE F-18 | INGERSOLL RAND
2016
Ann
ual R
epor
t
Concentration of Credit Risk
The counterparties to the Company’s forward contracts consist of a number of investment grade major international financial institutions. The Company could be exposed to losses in the event of nonperformance by the counterparties. However, the credit ratings and the concentration of risk in these financial institutions are monitored on a continuous basis and present no significant credit risk to the Company.
NOTE 9. FAIR VALUE MEASUREMENTSASC 820, "Fair Value Measurement," (ASC 820) defines fair value as the price that would be received to sell an asset or paid to transfer a liability in an orderly transaction between market participants at the measurement date. ASC 820 also establishes a three-level fair value hierarchy that prioritizes information used in developing assumptions when pricing an asset or liability as follows:
• Level 1: Observable inputs such as quoted prices in active markets;
• Level 2: Inputs, other than quoted prices in active markets, that are observable either directly or indirectly; and
• Level 3: Unobservable inputs where there is little or no market data, which requires the reporting entity to develop its own assumptions.
ASC 820 requires the use of observable market data, when available, in making fair value measurements. When inputs used to measure fair value fall within different levels of the hierarchy, the level within which the fair value measurement is categorized is based on the lowest level input that is significant to the fair value measurement.
The following table presents the Company’s fair value hierarchy for those assets and liabilities measured at fair value on a recurring basis as of December 31, 2016:
Fair value measurements
In millions Fair Value Level 1 Level 2 Level 3
Assets:
Derivative instruments $ 0.6 $– $ 0.6 $–
Liabilities:
Derivative instruments $20.8 $– $20.8 $–
The following table presents the Company’s fair value hierarchy for those assets and liabilities measured at fair value on a recurring basis as of December 31, 2015:
Fair value measurements
In Millions Fair Value Level 1 Level 2 Level 3
Assets:
Derivative instruments $ 5.0 $– $ 5.0 $–
Liabilities:
Derivative instruments $12.6 $– $12.6 $–
Derivative instruments include forward foreign currency contracts and instruments related to non-functional currency balance sheet exposures. The fair value of the derivative instruments are determined based on a pricing model that uses spot rates and forward prices from actively quoted currency markets that are readily accessible and observable.
The carrying values of cash and cash equivalents, accounts receivable and accounts payable are a reasonable estimate of their fair value due to the short-term nature of these instruments. These methodologies used by the Company to determine the fair value of its financial assets and liabilities at December 31, 2016 are the same as those used at December 31, 2015. There have been no transfers between levels of the fair value hierarchy.
NOTE 10. PENSIONS AND POSTRETIREMENT BENEFITS OTHER THAN PENSIONSThe Company sponsors several U.S. defined benefit and defined contribution plans covering substantially all of the Company’s U.S. employees. Additionally, the Company has many non-U.S. defined benefit and defined contribution plans covering eligible non-U.S. employees. Postretirement benefits, other than pensions (OPEB), provide healthcare benefits, and in some instances, life insurance benefits for certain eligible employees.

2016 ANNUAL REPORT | PAGE F-19
2016 Annual Report
At December 31, 2015, the Company refined the measurement approach used to calculate service and interest costs for both pension and OPEB obligations to utilize multiple specific spot rates, along the same hypothetical yield curve, that correlate with the timing of the relevant projected cash flows. The Company concluded that this refinement is a change in accounting estimate.
Pension Plans
The noncontributory defined benefit pension plans covering eligible non-collectively bargained U.S. employees provide benefits on a final average pay formula while plans for most collectively bargained U.S. employees provide benefits on a flat dollar benefit formula or a percentage of pay formula. The non-U.S. pension plans generally provide benefits based on earnings and years of service. The Company also maintains additional other supplemental plans for officers and other key or highly compensated employees.
The following table details information regarding the Company’s pension plans at December 31:
In millions 2016 2015
Change in benefit obligations:
Benefit obligation at beginning of year $3,523.8 $3,719.6
Service cost 72.1 75.2
Interest cost 110.2 129.5
Employee contributions 1.0 1.0
Amendments 6.2 6.8
Actuarial (gains) losses 129.6 (153.4)
Benefits paid (203.5) (191.8)
Currency translation (89.4) (50.0)
Curtailments and settlements (1.6) (3.5)
Other, including expenses paid (16.5) (9.6)
Benefit obligation at end of year $3,531.9 $3,523.8
Change in plan assets:
Fair value at beginning of year $2,772.0 $3,018.6
Actual return on assets 274.9 (43.0)
Company contributions 56.4 35.6
Employee contributions 1.0 1.0
Benefits paid (203.5) (191.8)
Currency translation (85.6) (33.8)
Settlements (1.6) (3.5)
Other, including expenses paid (16.5) (11.1)
Fair value of assets end of year $2,797.1 $2,772.0
Net unfunded liability $ (734.8) $ (751.8)
Amounts included in the balance sheet:
Other noncurrent assets $ 19.2 $ 2.7
Accrued compensation and benefits (6.4) (11.0)
Postemployment and other benefit liabilities (747.6) (743.5)
Net amount recognized $ (734.8) $ (751.8)
It is the Company’s objective to contribute to the pension plans to ensure adequate funds, and no less than required by law, are available in the plans to make benefit payments to plan participants and beneficiaries when required. However, certain plans are not or cannot be funded due to either legal, accounting, or tax requirements in certain jurisdictions. As of December 31, 2016, approximately six percent of the Company’s projected benefit obligation relates to plans that cannot be funded.

PAGE F-20 | INGERSOLL RAND
2016
Ann
ual R
epor
t
The pretax amounts recognized in Accumulated other comprehensive income (loss) are as follows:
In millions Prior service cost Net actuarial losses Total
December 31, 2015 $(25.8) $(970.5) $(996.3)
Current year changes recorded to Accumulated other comprehensive income (loss) (6.2) (0.8) (7.0)
Amortization reclassified to earnings 4.7 61.6 66.3
Settlements/curtailments reclassified to earnings 2.0 0.1 2.1
Currency translation and other (0.2) 22.8 22.6
December 31, 2016 $(25.5) $(886.8) $(912.3)
Weighted-average assumptions used to determine the benefit obligation at December 31 are as follows:
2016 2015
Discount rate:
U.S. plans 3.97% 4.17%
Non-U.S. plans 2.40% 3.27%
Rate of compensation increase:
U.S. plans 4.00% 4.00%
Non-U.S. plans 4.00% 4.00%
The accumulated benefit obligation for all defined benefit pension plans was $3,418.2 million and $3,391.8 million at December 31, 2016 and 2015, respectively. The projected benefit obligation, accumulated benefit obligation, and fair value of plan assets for pension plans with accumulated benefit obligations more than plan assets were $3,095.1 million, $3,002.0 million and $2,346.4 million, respectively, as of December 31, 2016, and $3,052.2 million, $2,941.7 million and $2,312.7 million, respectively, as of December 31, 2015.
Pension benefit payments are expected to be paid as follows:
In millions
2017 $ 199.5
2018 206.9
2019 206.6
2020 215.9
2021 215.1
2022 — 2026 1,120.0
The components of the Company’s net periodic pension benefit costs for the years ended December 31 include the following:
In millions 2016 2015 2014
Service cost $ 72.1 $ 75.2 $ 68.7
Interest cost 110.2 129.5 147.2
Expected return on plan assets (146.1) (158.3) (156.1)
Net amortization of:
Prior service costs 4.7 3.2 4.4
Plan net actuarial losses 61.6 60.7 36.1
Net periodic pension benefit cost 102.5 110.3 100.3
Net curtailment and settlement (gains) losses 2.1 0.7 7.1
Net periodic pension benefit cost after net curtailment and settlement (gains) losses $ 104.6 $ 111.0 $ 107.4
Amounts recorded in continuing operations $ 94.8 $ 100.7 $ 100.2
Amounts recorded in discontinued operations 9.8 10.3 7.2
Total $104.6 $111.0 $ 107.4
The curtailment and settlement losses in 2014 are associated with lump sum distributions under supplemental benefit plans for officers and other key employees.

2016 ANNUAL REPORT | PAGE F-21
2016 Annual Report
Net periodic pension benefit cost for 2017 is projected to be approximately $97.4 million. The amounts expected to be recognized in net periodic pension benefit cost during the year ended 2017 for prior service cost and plan net actuarial losses are $4.0 million and $54.4 million, respectively.
Weighted-average assumptions used to determine net periodic pension cost for the years ended December 31 are as follows:
2016 2015 2014
Discount rate:
U.S. plans
Service cost 4.25% 3.75% 4.75%
Interest cost 3.29% 3.75% 4.75%
Non-U.S. plans
Service cost 3.05% 3.25% 4.25%
Interest cost 3.18% 3.25% 4.25%
Rate of compensation increase:
U.S. plans 4.00% 4.00% 4.00%
Non-U.S. plans 4.00% 4.00% 4.25%
Expected return on plan assets:
U.S. plans 5.75% 5.75% 6.00%
Non-U.S. plans 3.75% 4.25% 5.00%
The expected long-term rate of return on plan assets reflects the average rate of returns expected on the funds invested or to be invested to provide for the benefits included in the projected benefit obligation. The expected long-term rate of return on plan assets is based on what is achievable given the plan’s investment policy, the types of assets held and target asset allocations. The expected long-term rate of return is determined as of the measurement date. The Company reviews each plan and its historical returns and target asset allocations to determine the appropriate expected long-term rate of return on plan assets to be used.
The Company’s objective in managing its defined benefit plan assets is to ensure that all present and future benefit obligations are met as they come due. It seeks to achieve this goal while trying to mitigate volatility in plan funded status, contribution, and expense by better matching the characteristics of the plan assets to that of the plan liabilities. The Company utilizes a dynamic approach to asset allocation whereby a plan’s allocation to fixed income assets increases as the plan’s funded status improves. The Company monitors plan funded status and asset allocation regularly in addition to investment manager performance.
The fair values of the Company’s pension plan assets at December 31, 2016 by asset category are as follows:
Fair value measurements Totalfair valueIn millions Level 1 Level 2 Level 3
Cash and cash equivalents $ 11.8 $ 17.0 $ – $ 28.8
Equity investments:
Registered mutual funds – equity specialty 73.9 – – 73.9
Commingled funds – equity specialty – 640.8 – 640.8
73.9 640.8 – 714.7
Fixed income investments:
U.S. government and agency obligations – 460.0 – 460.0
Corporate and non-U.S. bonds (a) – 1,178.3 – 1,178.3
Asset-backed and mortgage-backed securities – 74.0 – 74.0
Registered mutual funds – fixed income specialty 30.2 102.2 – 132.4
Commingled funds – fixed income specialty – 96.0 – 96.0
Other fixed income (b) – – 25.4 25.4
30.2 1,910.5 25.4 1,966.1
Derivatives – (0.9) – (0.9)
Real estate (c) – – 7.3 7.3
Other (d) – – 64.3 64.3
Total assets at fair value $ 115.9 $ 2,567.4 $97.0 $ 2,780.3
Receivables and payables, net 16.8
Net assets available for benefits $ 2,797.1

PAGE F-22 | INGERSOLL RAND
2016
Ann
ual R
epor
t
The fair values of the Company’s pension plan assets at December 31, 2015 by asset category are as follows:
Fair value measurements Totalfair valueIn millions Level 1 Level 2 Level 3
Cash and cash equivalents $ 17.6 $ 19.7 $ – $ 37.3
Equity investments:
Registered mutual funds – equity specialty 69.0 – – 69.0
Commingled funds – equity specialty – 637.8 – 637.8
69.0 637.8 – 706.8
Fixed income investments:
U.S. government and agency obligations – 478.4 – 478.4
Corporate and non-U.S. bonds (a) – 1,168.0 – 1,168.0
Asset-backed and mortgage-backed securities – 20.3 – 20.3
Registered mutual funds – fixed income specialty 30.7 108.7 – 139.4
Commingled funds – fixed income specialty – 111.6 – 111.6
Other fixed income (b) – – 24.6 24.6
30.7 1,887.0 24.6 1,942.3
Real estate (c) – – 10.8 10.8
Other (d) – – 61.2 61.2
Total assets at fair value $117.3 $2,544.5 $96.6 $2,758.4
Receivables and payables, net 13.6
Net assets available for benefits $2,772.0
(a) This class includes state and municipal bonds.
(b) This class includes group annuity and guaranteed interest contracts.
(c) This class includes a private equity fund that invests in real estate.
(d) This investment comprises the Company’s non-US pension plan assets. It primarily includes insurance contracts.
Cash equivalents are valued using a market approach with inputs including quoted market prices for either identical or similar instruments. Fixed income securities are valued through a market approach with inputs including, but not limited to, benchmark yields, reported trades, broker quotes and issuer spreads. Commingled funds are valued at their daily net asset value (NAV) per share or the equivalent. NAV per share or the equivalent is used for fair value purposes as a practical expedient. NAVs are calculated by the investment manager or sponsor of the fund. Private real estate fund values are reported by the fund manager and are based on valuation or appraisal of the underlying investments. See Note 9 for additional information related to the fair value hierarchy defined by ASC 820, Fair Value Measurement. There have been no significant transfers between levels of the fair value hierarchy.
The Company made required and discretionary contributions to its pension plans of $56.4 million in 2016, $35.6 million in 2015, and $116.5 million in 2014. The Company currently projects that it will contribute approximately $97.5 million to its plans worldwide in 2017. The Company’s policy allows it to fund an amount, which could be in excess of or less than the pension cost expensed, subject to the limitations imposed by current tax regulations. The Company anticipates funding the plans in 2017 in accordance with contributions required by funding regulations or the laws of each jurisdiction.
Most of the Company’s U.S. employees are covered by defined contribution plans. Employer contributions are determined based on criteria specific to the individual plans and amounted to approximately $108.3 million, $98.1 million, and $88.7 million in 2016, 2015 and 2014, respectively. The Company’s contributions relating to non-U.S. defined contribution plans and other non-U.S. benefit plans were $39.9 million, $30.5 million and $32.1 million in 2016, 2015 and 2014, respectively.

2016 ANNUAL REPORT | PAGE F-23
2016 Annual Report
Multiemployer Pension Plans
The Company also participates in a number of multiemployer defined benefit pension plans related to collectively bargained U.S. employees of Trane. The Company’s contributions, and the administration of the fixed retirement payments, are determined by the terms of the related collective-bargaining agreements. These multiemployer plans pose different risks to the Company than single-employer plans, including:
1. The Company’s contributions to multiemployer plans may be used to provide benefits to all participating employees of the program, including employees of other employers.
2. In the event that another participating employer ceases contributions to a plan, the Company may be responsible for any unfunded obligations along with the remaining participating employers.
3. If the Company chooses to withdraw from any of the multiemployer plans, the Company may be required to pay a withdrawal liability, based on the underfunded status of the plan.
As of December 31, 2016, the Company does not participate in any plans that are individually significant, nor is the Company an individually significant participant to any of these plans. Total contributions to multiemployer plans for the years ended December 31 were as follows:
In millions 2016 2015 2014
Total contributions $7.7 $6.7 $6.3
Contributions to these plans may increase in the event that any of these plans are underfunded.
Postretirement Benefits Other Than Pensions
The Company sponsors several postretirement plans that provide for healthcare benefits, and in some instances, life insurance benefits that cover certain eligible employees. These plans are unfunded and have no plan assets, but are instead funded by the Company on a pay-as-you-go basis in the form of direct benefit payments. Generally, postretirement health benefits are contributory with contributions adjusted annually. Life insurance plans for retirees are primarily noncontributory.

PAGE F-24 | INGERSOLL RAND
2016
Ann
ual R
epor
t
The following table details changes in the Company’s postretirement plan benefit obligations for the years ended December 31:
In millions 2016 2015
Benefit obligation at beginning of year $ 624.1 $ 700.7
Service cost 3.7 4.4
Interest cost 17.5 22.6
Plan participants’ contributions 10.2 10.3
Actuarial (gains) losses (24.4) (49.7)
Benefits paid, net of Medicare Part D subsidy * (55.7) (60.2)
Other 3.2 (4.0)
Benefit obligations at end of year $ 578.6 $ 624.1
* Amounts are net of Medicare Part D subsidy of $2.5 million and $2.7 million in 2016 and 2015, respectively
The benefit plan obligations are reflected in the Consolidated Balance Sheets as follows:
In millions December 31, 2016 December 31, 2015
Accrued compensation and benefits $ (53.3) $ (56.1)
Postemployment and other benefit liabilities (525.3) (568.0)
Total $ (578.6) $ (624.1)
The pre-tax amounts recognized in Accumulated other comprehensive income (loss) were as follows:
In millions Prior service gains Net actuarial (losses)/gains Total
Balance at December 31, 2015 $ 21.6 $(23.6) $ (2.0)
Gain (loss) in current period – 24.4 24.4
Amortization reclassified to earnings (8.9) 0.1 (8.8)
Currency translation and other – (0.1) (0.1)
Balance at December 31, 2016 $ 12.7 $ 0.8 $ 13.5
The components of net periodic postretirement benefit (income) cost for the years ended December 31 were as follows:
In millions 2016 2015 2014
Service cost $ 3.7 $ 4.4 $ 5.1
Interest cost 17.5 22.6 28.1
Net amortization of:
Prior service gains (8.9) (8.9) (8.9)
Net actuarial losses 0.1 0.1 –
Net periodic postretirement benefit cost $ 12.4 $ 18.2 $ 24.3
Amounts recorded in continuing operations $ 8.3 $ 11.0 $ 16.2
Amounts recorded in discontinued operations 4.1 7.2 8.1
Total $12.4 $18.2 $24.3
Postretirement cost for 2017 is projected to be $11.5 million. The amount expected to be recognized in net periodic postretirement benefits cost in 2017 for prior service gains is $7.5 million.

2016 ANNUAL REPORT | PAGE F-25
2016 Annual Report
Weighted-average assumptions used to determine net periodic benefit cost for the years ended December 31 are as follows:
2016 2015 2014
Discount rate:
Benefit obligations at December 31 3.73% 3.88% 3.50%
Net periodic benefit cost
Service cost 3.97% 3.50% 4.25%
Interest cost 2.99% 3.50% 4.25%
Assumed health-care cost trend rates at December 31:
Current year medical inflation 7.25% 7.25% 7.25%
Ultimate inflation rate 5.00% 5.00% 5.00%
Year that the rate reaches the ultimate trend rate 2023 2023 2021
A 1% change in the assumed medical trend rate would have the following effects as of and for the year ended December 31, 2016:
In millions1%
Increase1%
Decrease
Effect on total of service and interest cost components of current year benefit cost $ 0.7 $ (0.6)
Effect on benefit obligation at year-end 22.4 (19.7)
Benefit payments for postretirement benefits, which are net of expected plan participant contributions and Medicare Part D subsidy, are expected to be paid as follows:
In millions
2017 $ 54.2
2018 52.6
2019 50.6
2020 48.6
2021 46.7
2022 — 2026 200.1
NOTE 11. EQUITYThe authorized share capital of Ingersoll Rand plc is 1,185,040,000 shares, consisting of (1) 1,175,000,000 ordinary shares, par value $1.00 per share, (2) 40,000 ordinary shares, par value EUR 1.00 and (3) 10,000,000 preference shares, par value $0.001 per share. There were no preference shares or Euro-denominated ordinary shares outstanding at December 31, 2016 or 2015.
The changes in ordinary shares and treasury shares for the year ended December 31, 2016 are as follows:
In millionsOrdinary shares
issuedOrdinary shares held in treasury
December 31, 2015 269.0 7.8
Shares issued under incentive plans 2.7 –
Repurchase of ordinary shares – 4.9
December 31, 2016 271.7 12.7
In February 2014, our Board of Directors authorized the repurchase of up to $1.5 billion of our ordinary shares under a share repurchase program that began in April 2014. Share repurchases are made from time to time at the discretion of management subject to market conditions, regulatory requirements and other considerations. Shares repurchased prior to October 2014 were canceled upon repurchase and accounted for as a reduction of Ordinary shares and Capital in excess of par value, or Retained earnings to the extent Capital in excess of par value was exhausted. Beginning in October 2014, repurchased shares were held in treasury and recognized at cost. Ordinary shares held in treasury are presented separately on the balance sheet as a reduction to Equity.

PAGE F-26 | INGERSOLL RAND
2016
Ann
ual R
epor
t
Other Comprehensive Income (Loss)
The changes in Accumulated other comprehensive income (loss) are as follows:
In millionsDerivative
InstrumentsPension and OPEB Items
Foreign Currency Translation Total
December 31, 2014 $ 3.1 $(665.1) $ (52.3) $ (714.3)
Other comprehensive income (loss) attributable to Ingersoll-Rand plc 2.0 34.7 (443.3) (406.6)
December 31, 2015 $ 5.1 $(630.4) $(495.6) $(1,120.9)
Other comprehensive income (loss) attributable to Ingersoll-Rand plc (2.2) 76.0 (243.4) (169.6)
December 31, 2016 $ 2.9 $(554.4) $(739.0) $(1,290.5)
The amounts of Other comprehensive income (loss) attributable to noncontrolling interests for 2016, 2015 and 2014 were $9.6 million, ($4.3 million) and ($2.2 million), respectively, related to currency translation.
NOTE 12. SHARE-BASED COMPENSATIONThe Company accounts for stock-based compensation plans in accordance with ASC 718, “Compensation - Stock Compensation” (ASC 718), which requires a fair-value based method for measuring the value of stock-based compensation. Fair value is measured once at the date of grant and is not adjusted for subsequent changes. The Company’s share-based compensation plans include programs for stock options, restricted stock units (RSUs), performance share units (PSUs), and deferred compensation. Under the Company’s incentive stock plan, the total number of ordinary shares authorized by the shareholders is 20.0 million, of which 9.0 million remains available as of December 31, 2016 for future incentive awards.
Compensation Expense
Share-based compensation expense related to continuing operations is included in Selling and administrative expenses. The following table summarizes the expenses recognized:
In millions 2016 2015 2014
Stock options $ 18.1 $ 16.3 $ 16.4
RSUs 26.3 24.7 24.6
PSUs 19.9 20.5 24.2
Deferred compensation 3.2 1.7 1.9
Other 2.1 (0.5) 0.6
Pre-tax expense 69.6 62.7 67.7
Tax benefit 26.6 24.0 25.9
After-tax expense $ 43.0 $ 38.7 $ 41.8
Amounts recorded in continuing operations $ 43.0 $ 38.7 $ 41.8
Amounts recorded in discontinued operations – – –
Total $43.0 $38.7 $41.8
Stock Options / RSUs
Eligible participants may receive (i) stock options, (ii) RSUs or (iii) a combination of both stock options and RSUs. The fair value of each of the Company’s stock option and RSU awards is expensed on a straight-line basis over the required service period, which is generally the 3-year vesting period. However, for stock options and RSUs granted to retirement eligible employees, the Company recognizes expense for the fair value at the grant date.

2016 ANNUAL REPORT | PAGE F-27
2016 Annual Report
The weighted average fair value of the stock options granted for the year ended December 31, 2016 and 2015 was estimated to be $9.42 per share and $13.98 per share, respectively, using the Black-Scholes option-pricing model. The following assumptions were used:
2016 2015
Dividend yield 2.55% 1.73%
Volatility 28.60% 28.56%
Risk-free rate of return 1.12% 1.24%
Expected life in years 4.8 4.9
A description of the significant assumptions used to estimate the fair value of the stock option awards is as follows:
• Volatility - The expected volatility is based on a weighted average of the Company’s implied volatility and the most recent historical volatility of the Company’s stock commensurate with the expected life.
• Risk-free rate of return -The Company applies a yield curve of continuous risk-free rates based upon the published US Treasury spot rates on the grant date.
• Expected life - The expected life of the Company’s stock option awards represents the weighted-average of the actual period since the grant date for all exercised or cancelled options and an expected period for all outstanding options.
• Dividend yield - The Company determines the dividend yield based upon the expected quarterly dividend payments as of the grant date and the current fair market value of the Company’s stock.
• Forfeiture Rate - The Company analyzes historical data of forfeited options to develop a reasonable expectation of the number of options to forfeit prior to vesting per year. This expected forfeiture rate is applied to the Company’s ongoing compensation expense; however, all expense is adjusted to reflect actual vestings and forfeitures.
Changes in options outstanding under the plans for the years 2016, 2015 and 2014 are as follows:
Sharessubject
to option
Weighted-average
exercise price
Aggregateintrinsic
value (millions)
Weighted-average
remaining life(years)
December 31, 2013 8,700,028 $31.87
Granted 1,160,057 59.82
Exercised (2,253,094) 31.04
Cancelled (104,378) 47.85
December 31, 2014 7,502,613 36.21
Granted 1,457,523 66.25
Exercised (1,968,725) 31.33
Cancelled (155,382) 61.03
December 31, 2015 6,836,029 43.46
Granted 1,958,476 50.04
Exercised (1,854,058) 33.71
Cancelled (93,552) 56.22
Outstanding December 31, 2016 6,846,895 $47.81 $186.4 6.5
Exercisable December 31, 2016 3,698,133 $41.10 $125.5 4.8

PAGE F-28 | INGERSOLL RAND
2016
Ann
ual R
epor
t
The following table summarizes information concerning currently outstanding and exercisable options as adjusted for the spin-off as discussed above:
Range ofexercise price
Options outstanding Options exercisable
Numberoutstanding at
December 31, 2016
Weighted-average
remaininglife (years)
Weighted-averageexercise
price
Numberoutstanding at
December 31, 2016
Weighted-average
remaininglife (years)
Weighted-averageexercise
price
$10.01 – $20.00 201,338 1.9 $13.16 201,338 1.9 $13.16
20.01 – 30.00 413,248 2.9 25.75 413,248 2.9 25.75
30.01 – 40.00 1,378,500 3.7 34.52 1,378,500 3.7 34.52
40.01 – 50.00 2,641,516 8.1 47.69 756,245 5.6 41.92
50.01 – 60.00 1,033,888 7.1 59.47 575,237 6.8 59.73
60.01 – 70.00 1,178,405 7.9 67.06 373,565 7.8 67.08
$10.74 – $68.70 6,846,895 6.5 $47.81 3,698,133 4.8 $41.10
At December 31, 2016, there was $13.2 million of total unrecognized compensation cost from stock option arrangements granted under the plan, which is primarily related to unvested shares of non-retirement eligible employees. The aggregate intrinsic value of options exercised during the year ended December 31, 2016 and 2015 was $61.4 million and $67.9 million, respectively. Generally, stock options expire ten years from their date of grant.
The following table summarizes RSU activity for the years 2016, 2015 and 2014:
RSUs
Weighted-average grantdate fair value
Outstanding and unvested at December 31, 2013 1,340,982 $ 38.49
Granted 378,873 59.79
Vested (630,185) 35.73
Cancelled (41,921) 45.14
Outstanding and unvested at December 31, 2014 1,047,749 $ 47.60
Granted 429,828 66.42
Vested (510,600) 43.32
Cancelled (44,366) 59.98
Outstanding and unvested at December 31, 2015 922,611 $ 58.14
Granted 486,401 51.28
Vested (545,437) 53.84
Cancelled (27,826) 58.19
Outstanding and unvested at December 31, 2016 835,749 $ 56.95
At December 31, 2016, there was $18.0 million of total unrecognized compensation cost from RSU arrangements granted under the plan, which is related to unvested shares of non-retirement eligible employees.
Performance Shares
The Company has a Performance Share Program (PSP) for key employees. The program provides awards in the form of PSUs based on performance against pre-established objectives. The annual target award level is expressed as a number of the Company’s ordinary shares. All PSUs are settled in the form of ordinary shares.
Beginning with the 2012 grant year, PSU awards are earned based 50% upon a performance condition, measured at each reporting period by relative EPS growth to the industrial group of companies in the S&P 500 Index and the fair market value of the Company’s stock on the date of grant, and 50% upon a market condition, measured by the Company’s relative total shareholder return (TSR) as compared to the TSR of the industrial group of companies in the S&P 500 Index over the 3-year performance period. The fair value of the market condition is estimated using a Monte Carlo Simulation approach in a risk-neutral framework based upon historical volatility, risk-free rates and correlation matrix. Awards granted prior to 2012 were earned based upon the Company’s relative earnings-per-share (EPS) growth as compared to the industrial group of companies in the S&P 500 Index over the 3-year performance period.

2016 ANNUAL REPORT | PAGE F-29
2016 Annual Report
The following table summarizes PSU activity for the maximum number of shares that may be issued for the years 2016, 2015 and 2014:
PSUs
Weighted-average grant date fair
value
Outstanding and unvested at December 31, 2013 1,952,650 $39.20
Granted 473,988 66.22
Vested (604,649) 27.84
Forfeited (36,991) 44.33
Outstanding and unvested at December 31, 2014 1,784,998 $50.12
Granted 456,592 79.09
Vested (723,250) 41.03
Forfeited (70,108) 62.76
Outstanding and unvested at December 31, 2015 1,448,232 $63.18
Granted 597,088 53.82
Vested (462,035) 46.81
Forfeited (159,489) 56.25
Outstanding and unvested at December 31, 2016 1,423,796 $65.34
At December 31, 2016, there was $16.9 million of total unrecognized compensation cost from PSU arrangements based on current performance, which is related to unvested shares. This compensation will be recognized over the required service period, which is generally the three-year vesting period.
Deferred Compensation
The Company allows key employees to defer a portion of their eligible compensation into a number of investment choices, including its ordinary share equivalents. Any amounts invested in ordinary share equivalents will be settled in ordinary shares of the Company at the time of distribution.
NOTE 13. RESTRUCTURING ACTIVITIESThe Company incurs costs associated with restructuring initiatives intended to result in improved operating performance, profitability and working capital levels. Actions associated with these initiatives include workforce reduction, improving manufacturing productivity, realignment of management structures, and rationalizing certain assets. The following table details restructuring charges recorded during the years ended December 31 were as follows:
In millions 2016 2015 2014
Climate $ 6.2 $ 11.9 $ 5.2
Industrial 20.5 15.6 4.0
Corporate and Other 8.8 6.6 3.3
Total $ 35.5 $ 34.1 $ 12.5
Cost of goods sold $ 9.8 $ 12.5 $ 2.7
Selling and administrative expenses 25.7 21.6 9.8
Total $35.5 $34.1 $12.5
The changes in the restructuring reserve were as follows:
In millions Climate IndustrialCorporateand Other Total
December 31, 2014 $ 2.9 $ 0.9 $ 0.6 $ 4.4
Additions, net of reversals (1) 7.4 13.1 0.5 21.0
Cash paid (6.6) (12.1) (0.9) (19.6)
December 31, 2015 3.7 1.9 0.2 5.8
Additions, net of reversals (1) 6.8 20.5 2.8 30.1
Cash paid (7.1) (18.1) (2.4) (27.6)
December 31, 2016 $ 3.4 $ 4.3 $ 0.6 $ 8.3
(1) Excludes the costs of asset rationalization.

PAGE F-30 | INGERSOLL RAND
2016
Ann
ual R
epor
t
Ongoing restructuring actions include workforce reductions as well as the closure and consolidation of manufacturing facilities in an effort to improve the Company's cost structure. As of December 31, 2016, the Company had $8.3 million accrued for costs associated with its ongoing restructuring actions, of which a majority is expected to be paid within one year.
In addition to the 2016 restructuring charges described above, the Company incurred $0.4 million of non-qualified restructuring charges, which represent costs that are directly attributable to restructuring activities, but do not fall into the severance, exit or disposal category. These non-qualified restructuring charges were incurred to improve the Company's cost structure.
In February 2017, the Company announced plans to close a U.S. manufacturing facility within its Climate segment and relocate production to other U.S. facilities. The cost of this restructuring action is not expected to have a material impact on the Company’s financial statements.
NOTE 14. OTHER INCOME/(EXPENSE), NETThe components of Other income/(expense), net for the years ended December 31, 2016, 2015 and 2014 are as follows:
In millions 2016 2015 2014
Interest income $ 8.0 $ 10.6 $13.2
Foreign exchange gain (loss) (2.0) (36.2) (0.1)
Income (loss) from Hussmann equity investment (0.8) 12.6 7.8
Gain on sale of Hussmann equity investment 397.8 – –
Other activity, net (13.3) 25.9 9.1
Other income/(expense), net $389.7 $ 12.9 $30.0
During the year ended December 31, 2015, the Company recognized a loss on foreign currency exchange of $36.2 million. This loss is comprised of a $42.6 million pre-tax charge recorded in the first quarter related to the remeasurement of net monetary assets denominated in Venezuelan bolivar. This loss was partially offset by $6.4 million of foreign currency transaction gains resulting from the remeasurement of non-functional balance sheet positions into their functional currency.
Other activity, net in each period presented, primarily consists of insurance settlements on asbestos related matters and the revaluation of asbestos recoveries. In addition, other activity, net for the year ended December 31, 2016 includes $16.4 million for the settlement of a lawsuit originally filed by a customer in 2012. The lawsuit related to a commercial HVAC contract entered into in 2001, prior to our acquisition of Trane U.S. Inc. (Trane). The charge represents the settlement and related legal costs recognized during the fourth quarter of 2016. Other activity, net for the year ended December 31, 2014 includes a $6.0 million gain on the sale of an investment.
Sale of Hussmann Equity Investment
During 2011, the Company completed the sale of a controlling interest of its Hussmann refrigerated display case business (“Hussmann”) to a newly-formed affiliate (“Hussmann Parent”) of private equity firm Clayton Dubilier & Rice, LLC (“CD&R”). Per the terms of the agreement, CD&R’s ownership interest in Hussmann at the acquisition date was 60% with the remaining 40% being retained by the Company. As a result, the Company accounted for its interest in Hussmann using the equity method of accounting.
On December 21, 2015, the Company announced it would sell its remaining equity interest in Hussmann as part of a transaction in which Panasonic Corporation would acquire 100 percent of Hussmann's outstanding shares. The transaction was completed on April 1, 2016. The Company received net proceeds of $422.5 million, including closing settlement amounts, for its interest and recognized a gain of $397.8 million on the sale.
NOTE 15. INCOME TAXESCurrent and deferred provision for income taxes
Earnings before income taxes for the years ended December 31 were taxed within the following jurisdictions:
In millions 2016 2015 2014
United States $ 419.8 $ 451.6 $ 276.5
Non-U.S. 1,321.5 796.3 932.9
Total $1,741.3 $1,247.9 $1,209.4
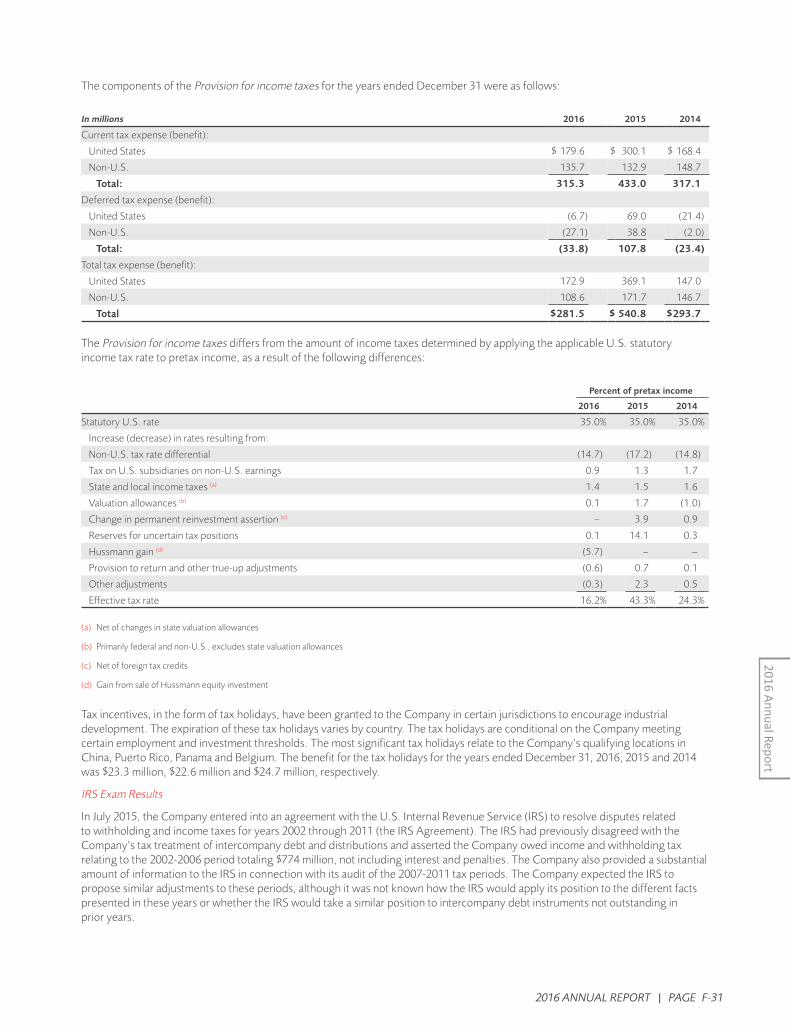
2016 ANNUAL REPORT | PAGE F-31
2016 Annual Report
The components of the Provision for income taxes for the years ended December 31 were as follows:
In millions 2016 2015 2014
Current tax expense (benefit):
United States $ 179.6 $ 300.1 $ 168.4
Non-U.S. 135.7 132.9 148.7
Total: 315.3 433.0 317.1
Deferred tax expense (benefit):
United States (6.7) 69.0 (21.4)
Non-U.S. (27.1) 38.8 (2.0)
Total: (33.8) 107.8 (23.4)
Total tax expense (benefit):
United States 172.9 369.1 147.0
Non-U.S. 108.6 171.7 146.7
Total $281.5 $ 540.8 $293.7
The Provision for income taxes differs from the amount of income taxes determined by applying the applicable U.S. statutory income tax rate to pretax income, as a result of the following differences:
Percent of pretax income
2016 2015 2014
Statutory U.S. rate 35.0% 35.0% 35.0%
Increase (decrease) in rates resulting from:
Non-U.S. tax rate differential (14.7) (17.2) (14.8)
Tax on U.S. subsidiaries on non-U.S. earnings 0.9 1.3 1.7
State and local income taxes (a) 1.4 1.5 1.6
Valuation allowances (b) 0.1 1.7 (1.0)
Change in permanent reinvestment assertion (c) – 3.9 0.9
Reserves for uncertain tax positions 0.1 14.1 0.3
Hussmann gain (d) (5.7) – –
Provision to return and other true-up adjustments (0.6) 0.7 0.1
Other adjustments (0.3) 2.3 0.5
Effective tax rate 16.2% 43.3% 24.3%
(a) Net of changes in state valuation allowances
(b) Primarily federal and non-U.S., excludes state valuation allowances
(c) Net of foreign tax credits
(d) Gain from sale of Hussmann equity investment
Tax incentives, in the form of tax holidays, have been granted to the Company in certain jurisdictions to encourage industrial development. The expiration of these tax holidays varies by country. The tax holidays are conditional on the Company meeting certain employment and investment thresholds. The most significant tax holidays relate to the Company’s qualifying locations in China, Puerto Rico, Panama and Belgium. The benefit for the tax holidays for the years ended December 31, 2016, 2015 and 2014 was $23.3 million, $22.6 million and $24.7 million, respectively.
IRS Exam Results
In July 2015, the Company entered into an agreement with the U.S. Internal Revenue Service (IRS) to resolve disputes related to withholding and income taxes for years 2002 through 2011 (the IRS Agreement). The IRS had previously disagreed with the Company’s tax treatment of intercompany debt and distributions and asserted the Company owed income and withholding tax relating to the 2002-2006 period totaling $774 million, not including interest and penalties. The Company also provided a substantial amount of information to the IRS in connection with its audit of the 2007-2011 tax periods. The Company expected the IRS to propose similar adjustments to these periods, although it was not known how the IRS would apply its position to the different facts presented in these years or whether the IRS would take a similar position to intercompany debt instruments not outstanding in prior years.

PAGE F-32 | INGERSOLL RAND
2016
Ann
ual R
epor
t
The resolution reached in July 2015 covered intercompany debt and related issues for the entire period from 2002 through 2011 and includes all aspects of the dispute with the U.S. Tax Court, the Appeals Division and the Examination Division of the IRS. The resolution was subsequently reported to the Congressional Joint Committee on Taxation (JCT), as required, for its review. The JCT concluded its review without objection in December 2015 and the settlement was finalized with the IRS in December 2015.
Pursuant to the agreement with the IRS, the Company agreed to pay withholding tax and interest of $412 million in respect to the 2002-2006 years. The Company owed no additional tax with respect to intercompany debt and related matters for the years 2007-2011. No penalties were applied to any of the tax years 2002 through 2011. The resolution resulted in a net cash outflow in 2015 of approximately $364 million, consisting of $230 million in tax and $134 million of interest, net of a tax benefit of $48 million.
Deferred tax assets and liabilities
A summary of the deferred tax accounts at December 31 are as follows:
In millions 2016 2015
Deferred tax assets:
Inventory and accounts receivable $ 18.2 $ 17.4
Fixed assets and intangibles 16.2 17.5
Postemployment and other benefit liabilities 652.5 672.6
Product liability 151.3 169.5
Other reserves and accruals 192.8 190.9
Net operating losses and credit carryforwards 528.5 562.7
Other 38.6 65.0
Gross deferred tax assets 1,598.1 1,695.6
Less: deferred tax valuation allowances (184.5) (213.1)
Deferred tax assets net of valuation allowances $ 1,413.6 $ 1,482.5
Deferred tax liabilities:
Inventory and accounts receivable $ (38.8) $ (43.3)
Fixed assets and intangibles (1,949.7) (1,993.7)
Postemployment and other benefit liabilities (7.0) (6.8)
Other reserves and accruals (1.9) (2.5)
Other (32.4) (53.5)
Gross deferred tax liabilities (2,029.8) (2,099.8)
Net deferred tax assets (liabilities) $ (616.2) $ (617.3)
At December 31, 2016, no deferred taxes have been provided for any portion of the approximately $12.9 billion of undistributed earnings of the Company’s subsidiaries, since these earnings have been, and under current plans will continue to be, permanently reinvested in these subsidiaries. Due to the number of legal entities and jurisdictions involved, the complexity of the legal entity structure of the Company, the complexity of the tax laws in the relevant jurisdictions, including, but not limited to the rules pertaining to the utilization of foreign tax credits in the United States and the impact of projections of income for future years to any calculations, the Company believes it is not practicable to estimate, within any reasonable range, the amount of additional taxes which may be payable upon distribution of these earnings.
In 2015, the Company changed its permanent reinvestment assertion on prior and current year’s earnings on certain of its subsidiaries. The Company recorded the tax effects of this change in the fourth quarter of 2015, which resulted in a tax charge of $52 million.
At December 31, 2016, the Company had the following operating loss and tax credit carryforwards available to offset taxable income in prior and future years:
In millions AmountExpiration
Period
U.S. Federal net operating loss carryforwards $ 678.9 2020-2034
U.S. Federal credit carryforwards 11.6 2022-2028
U.S. State net operating loss carryforwards 3,070.7 2017-2036
U.S. State credit carryforwards 36.3 2017-Unlimited
Non-U.S. net operating loss carryforwards 1,399.6 2017-Unlimited
Non-U.S. credit carryforwards 8.6 Unlimited

2016 ANNUAL REPORT | PAGE F-33
2016 Annual Report
The gross amount of net operating loss carryforwards for which a benefit would be recorded in Capital in excess of par value when realized is $38.2 million. As a result of the adoption of ASU 2016-09, $15.1 million of excess tax benefits previously unrecognized will be recorded on a modified retrospective basis through a cumulative-effect adjustment to Retained earnings on January 1, 2017. See Note 2 for a discussion of recently issued accounting pronouncements.
The U.S. state net operating loss carryforwards were incurred in various jurisdictions. The non-U.S. net operating loss carryforwards were incurred in various jurisdictions, predominantly in Belgium, Brazil, India, Luxembourg, Spain, and the United Kingdom.
Activity associated with the Company’s valuation allowance is as follows:
In millions 2016 2015 2014
Beginning balance $213.1 $210.7 $218.5
Increase to valuation allowance 19.4 40.7 35.2
Decrease to valuation allowance (43.5) (34.0) (38.8)
Accumulated other comprehensive income (loss) (4.5) (4.3) (4.2)
Ending balance $184.5 $213.1 $210.7
The Company has certain deferred tax assets in Brazil, primarily comprised of net operating loss carryfowards, with a tax effected value of approximately $32 million at December 31, 2016. The operating results of this business have experienced sharp declines in 2016 and 2015 due to market slowdowns in Brazil. The Company concluded that these deferred tax assets, which have an indefinite life, did not require a valuation allowance as of December 31, 2016 due to forecasted profitability and to-be implemented tax planning actions. However, further deterioration in operating results in this business may require the Company to recognize a valuation allowance in the future.
Unrecognized tax benefits
The Company has total unrecognized tax benefits of $107.1 million and $174.9 million as of December 31, 2016, and December 31, 2015, respectively. The amount of unrecognized tax benefits that, if recognized, would affect the continuing operations effective tax rate are $71.2 million as of December 31, 2016. A reconciliation of the beginning and ending amount of unrecognized tax benefits is as follows:
In millions 2016 2015 2014
Beginning balance $174.9 $ 343.8 $363.3
Additions based on tax positions related to the current year 5.9 8.7 6.7
Additions based on tax positions related to prior years 29.1 186.5 49.8
Reductions based on tax positions related to prior years (37.6) (102.2) (52.4)
Reductions related to settlements with tax authorities (60.9) (251.0) (8.0)
Reductions related to lapses of statute of limitations (2.8) (3.7) (7.1)
Translation (gain) loss (1.5) (7.2) (8.5)
Ending balance $107.1 $ 174.9 $343.8
The Company records interest and penalties associated with the uncertain tax positions within its Provision for income taxes. The Company had reserves associated with interest and penalties, net of tax, of $33.7 million and $55.5 million at December 31, 2016 and December 31, 2015, respectively. For the year ended December 31, 2016 and December 31, 2015, the Company recognized $2.3 million and $77.8 million, respectively, in interest and penalties net of tax in continuing operations related to these uncertain tax positions.
In the second quarter of 2015, the Company recorded a tax charge of approximately $227 million to continuing operations related to the increase in the liability for unrecognized tax benefits as a result of the proposed IRS settlement. Pursuant to the agreement with the IRS, the Company reduced its liability for unrecognized tax benefits for all related amounts at December 31, 2015. In addition, the Company recorded a tax benefit of approximately $65 million within continuing operations as a result of the settlement of an audit in a major tax jurisdiction.
The total amount of unrecognized tax benefits relating to the Company's tax positions is subject to change based on future events including, but not limited to, the settlements of ongoing audits and/or the expiration of applicable statutes of limitations. Although the outcomes and timing of such events are highly uncertain, it is reasonably possible that the balance of gross unrecognized tax benefits, excluding interest and penalties, could potentially be reduced by up to approximately $5.0 million during the next 12 months.
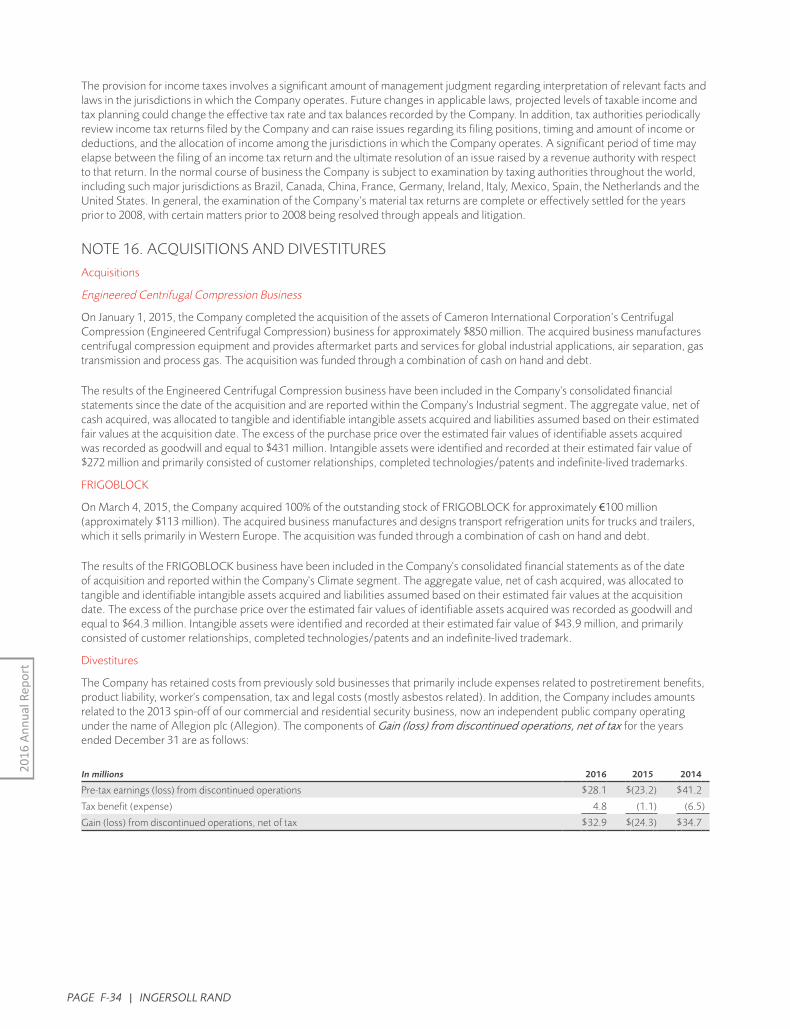
PAGE F-34 | INGERSOLL RAND
2016
Ann
ual R
epor
t
The provision for income taxes involves a significant amount of management judgment regarding interpretation of relevant facts and laws in the jurisdictions in which the Company operates. Future changes in applicable laws, projected levels of taxable income and tax planning could change the effective tax rate and tax balances recorded by the Company. In addition, tax authorities periodically review income tax returns filed by the Company and can raise issues regarding its filing positions, timing and amount of income or deductions, and the allocation of income among the jurisdictions in which the Company operates. A significant period of time may elapse between the filing of an income tax return and the ultimate resolution of an issue raised by a revenue authority with respect to that return. In the normal course of business the Company is subject to examination by taxing authorities throughout the world, including such major jurisdictions as Brazil, Canada, China, France, Germany, Ireland, Italy, Mexico, Spain, the Netherlands and the United States. In general, the examination of the Company’s material tax returns are complete or effectively settled for the years prior to 2008, with certain matters prior to 2008 being resolved through appeals and litigation.
NOTE 16. ACQUISITIONS AND DIVESTITURESAcquisitions
Engineered Centrifugal Compression Business
On January 1, 2015, the Company completed the acquisition of the assets of Cameron International Corporation’s Centrifugal Compression (Engineered Centrifugal Compression) business for approximately $850 million. The acquired business manufactures centrifugal compression equipment and provides aftermarket parts and services for global industrial applications, air separation, gas transmission and process gas. The acquisition was funded through a combination of cash on hand and debt.
The results of the Engineered Centrifugal Compression business have been included in the Company's consolidated financial statements since the date of the acquisition and are reported within the Company's Industrial segment. The aggregate value, net of cash acquired, was allocated to tangible and identifiable intangible assets acquired and liabilities assumed based on their estimated fair values at the acquisition date. The excess of the purchase price over the estimated fair values of identifiable assets acquired was recorded as goodwill and equal to $431 million. Intangible assets were identified and recorded at their estimated fair value of $272 million and primarily consisted of customer relationships, completed technologies/patents and indefinite-lived trademarks.
FRIGOBLOCK
On March 4, 2015, the Company acquired 100% of the outstanding stock of FRIGOBLOCK for approximately €100 million (approximately $113 million). The acquired business manufactures and designs transport refrigeration units for trucks and trailers, which it sells primarily in Western Europe. The acquisition was funded through a combination of cash on hand and debt.
The results of the FRIGOBLOCK business have been included in the Company's consolidated financial statements as of the date of acquisition and reported within the Company's Climate segment. The aggregate value, net of cash acquired, was allocated to tangible and identifiable intangible assets acquired and liabilities assumed based on their estimated fair values at the acquisition date. The excess of the purchase price over the estimated fair values of identifiable assets acquired was recorded as goodwill and equal to $64.3 million. Intangible assets were identified and recorded at their estimated fair value of $43.9 million, and primarily consisted of customer relationships, completed technologies/patents and an indefinite-lived trademark.
Divestitures
The Company has retained costs from previously sold businesses that primarily include expenses related to postretirement benefits, product liability, worker's compensation, tax and legal costs (mostly asbestos related). In addition, the Company includes amounts related to the 2013 spin-off of our commercial and residential security business, now an independent public company operating under the name of Allegion plc (Allegion). The components of Gain (loss) from discontinued operations, net of tax for the years ended December 31 are as follows:
In millions 2016 2015 2014
Pre-tax earnings (loss) from discontinued operations $28.1 $(23.2) $41.2
Tax benefit (expense) 4.8 (1.1) (6.5)
Gain (loss) from discontinued operations, net of tax $32.9 $(24.3) $34.7

2016 ANNUAL REPORT | PAGE F-35
2016 Annual Report
Pre-tax earnings (loss) from discontinued operations for the year ended December 31, 2016 includes income realized from settlements with insurance carriers related to asbestos policies. In addition, the year ended December 31, 2014 includes income realized from a settlement with an insurance carrier related to an asbestos policy. Refer to Note 19, "Commitments and Contingencies," for more information related to asbestos. Amounts related to Allegion in each period primarily represent adjustments for certain tax matters.
NOTE 17. EARNINGS PER SHARE (EPS)Basic EPS is calculated by dividing Net earnings attributable to Ingersoll-Rand plc by the weighted-average number of ordinary shares outstanding for the applicable period. Diluted EPS is calculated after adjusting the denominator of the basic EPS calculation for the effect of all potentially dilutive ordinary shares, which in the Company’s case, includes shares issuable under share-based compensation plans. The following table summarizes the weighted-average number of ordinary shares outstanding for basic and diluted earnings per share calculations:
In millions 2016 2015 2014
Weighted-average number of basic shares outstanding 259.2 265.1 270.5
Shares issuable under incentive stock plans 2.5 2.7 3.8
Weighted-average number of diluted shares outstanding 261.7 267.8 274.3
Anti-dilutive shares 1.2 2.1 1.1
NOTE 18. BUSINESS SEGMENT INFORMATIONThe accounting policies of the operating segments are the same as those described in the summary of significant accounting policies except that the operating segments’ results are prepared on a management basis that is consistent with the manner in which the Company prepares financial information for internal review and decision making. The Company largely evaluates performance based on Segment operating income and Segment operating margins. Intercompany sales between segments are considered immaterial.
The Company's Climate segment globally delivers energy-efficient products and innovative energy services. It includes Trane®
and American Standard® Heating & Air Conditioning which provide heating, ventilation and air conditioning (HVAC) systems, and commercial and residential building services, parts, support and controls; energy services and building automation through Trane Building Advantage and Nexia; and Thermo King® transport temperature control solutions.
The Company's Industrial segment delivers products and services that enhance energy efficiency, productivity and operations. It includes compressed air and gas systems and services, power tools, material handling systems, ARO® fluid management equipment, as well as Club Car ® golf, utility and rough terrain vehicles.
Segment operating income is the measure of profit and loss that the Company's chief operating decision maker uses to evaluate the financial performance of the business and as the basis for performance reviews, compensation and resource allocation. For these reasons, the Company believes that Segment operating income represents the most relevant measure of segment profit and loss.

PAGE F-36 | INGERSOLL RAND
2016
Ann
ual R
epor
t
A summary of operations by reportable segments for the years ended December 31 were as follows:
Dollar amounts in millions 2016 2015 2014
Climate
Net revenues $ 10,545.0 $ 10,224.3 $ 9,879.7
Segment operating income 1,527.4 1,302.5 1,195.6
Segment operating income as a percentage of revenues 14.5% 12.7% 12.1%
Depreciation and amortization 225.2 246.3 247.1
Capital expenditures 78.2 83.9 107.8
Industrial
Net revenues 2,963.9 3,076.4 3,011.7
Segment operating income 294.9 372.4 443.0
Segment operating income as a percentage of revenues 10.0% 12.1% 14.7%
Depreciation and amortization 67.2 67.5 44.2
Capital expenditures 36.3 51.8 33.1
Total net revenues $13,508.9 $13,300.7 $12,891.4
Reconciliation to Operating Income
Segment operating income from reportable segments 1,822.3 1,674.9 1,638.6
Unallocated corporate expense (249.2) (216.9) (233.9)
Total operating income $ 1,573.1 $ 1,458.0 $ 1,404.7
Total operating income as a percentage of revenues 11.6% 11.0% 10.9%
Depreciation and Amortization
Depreciation and amortization from reportable segments 292.4 313.8 291.3
Unallocated depreciation and amortization 59.8 50.3 41.1
Total depreciation and amortization $ 352.2 $ 364.1 $ 332.4
Capital Expenditures
Capital expenditures from reportable segments 114.5 135.7 140.9
Corporate capital expenditures 68.2 113.9 92.6
Total capital expenditures $ 182.7 $ 249.6 $ 233.5
A summary of Net revenues by destination and by major product/solution for the years ended December 31 were as follows:
In millions 2016 2015 2014
United States $ 8,720.7 $ 8,291.2 $ 7,693.0Non-U.S. 4,788.2 5,009.5 5,198.4
Total $13,508.9 $13,300.7 $12,891.4
In millions 2016 2015 2014
Commercial HVAC $ 6,479.4 $ 6,233.8 $ 6,049.8
Transport Refrigeration 2,050.1 2,147.8 2,089.2
Residential HVAC 2,015.5 1,842.6 1,740.7
Compression Technologies and Services 1,885.1 1,932.5 1,812.3
Other Industrial 1,078.8 1,144.0 1,199.4
Total $13,508.9 $13,300.7 $12,891.4
In fiscal years 2016, 2015 and 2014, no customer exceeded 10% of consolidated net sales.

2016 ANNUAL REPORT | PAGE F-37
2016 Annual Report
At December 31, summary of long-lived assets by geographic area were as follows:
In millions 2016 2015
United States $2,040.7 $2,196.1
Non-U.S. 603.1 651.3
Total $2,643.8 $2,847.4
NOTE 19. COMMITMENTS AND CONTINGENCIESThe Company is involved in various litigations, claims and administrative proceedings, including those related to environmental, asbestos, and product liability matters. In accordance with ASC 450, "Contingencies," the Company records accruals for loss contingencies when it is both probable that a liability will be incurred and the amount of the loss can be reasonably estimated. Amounts recorded for identified contingent liabilities are estimates, which are reviewed periodically and adjusted to reflect additional information when it becomes available. Subject to the uncertainties inherent in estimating future costs for contingent liabilities, except as expressly set forth in this note, management believes that any liability which may result from these legal matters would not have a material adverse effect on the financial condition, results of operations, liquidity or cash flows of the Company.
Environmental Matters
The Company continues to be dedicated to an environmental program to reduce the utilization and generation of hazardous materials during the manufacturing process and to remediate identified environmental concerns. As to the latter, the Company is currently engaged in site investigations and remediation activities to address environmental cleanup from past operations at current and former manufacturing facilities.
The Company is sometimes a party to environmental lawsuits and claims and has received notices of potential violations of environmental laws and regulations from the Environmental Protection Agency and similar state authorities. It has also been identified as a potentially responsible party (PRP) for cleanup costs associated with off-site waste disposal at federal Superfund and state remediation sites. For all such sites, there are other PRPs and, in most instances, the Company’s involvement is minimal.
In estimating its liability, the Company has assumed it will not bear the entire cost of remediation of any site to the exclusion of other PRPs who may be jointly and severally liable. The ability of other PRPs to participate has been taken into account, based on the Company's understanding of the parties’ financial condition and probable contributions on a per site basis. Additional lawsuits and claims involving environmental matters are likely to arise from time to time in the future.
As of December 31, 2016 and 2015, the Company has recorded reserves for environmental matters of $41.3 million and $43.8 million, respectively. Of these amounts $37.2 million and $35.5 million, respectively, relate to remediation of sites previously disposed by the Company.
Asbestos-Related Matters
Certain wholly-owned subsidiaries of the Company are named as defendants in asbestos-related lawsuits in state and federal courts. In virtually all of the suits, a large number of other companies have also been named as defendants. The vast majority of those claims have been filed against either Ingersoll-Rand Company or Trane U.S. Inc. (Trane) and generally allege injury caused by exposure to asbestos contained in certain historical products sold by Ingersoll-Rand Company or Trane, primarily pumps, boilers and railroad brake shoes. None of our existing or previously-owned businesses were a producer or manufacturer of asbestos.
The Company engages an outside expert to assist in calculating an estimate of the Company’s total liability for pending and unasserted future asbestos-related claims and annually performs a detailed analysis with the assistance of an outside expert to update its estimated asbestos-related liability. The methodology used to project the Company’s total liability for pending and unasserted potential future asbestos-related claims relied upon and included the following factors, among others:
• the outside expert’s interpretation of a widely accepted forecast of the population likely to have been occupationally exposed to asbestos;
• epidemiological studies estimating the number of people likely to develop asbestos-related diseases such as mesothelioma and lung cancer;
• the Company’s historical experience with the filing of non-malignancy claims and claims alleging other types of malignant diseases filed against the Company relative to the number of lung cancer claims filed against the Company;
• the outside expert’s analysis of the number of people likely to file an asbestos-related personal injury claim against the Company based on such epidemiological and historical data and the Company’s most recent three-year claims history;

PAGE F-38 | INGERSOLL RAND
2016
Ann
ual R
epor
t
• an analysis of the Company’s pending cases, by type of disease claimed and by year filed;
• an analysis of the Company’s most recent three-year history to determine the average settlement and resolution value of claims, by type of disease claimed;
• an adjustment for inflation in the future average settlement value of claims, at a 2.5% annual inflation rate, adjusted downward to 1.5% to take account of the declining value of claims resulting from the aging of the claimant population; and
• an analysis of the period over which the Company has and is likely to resolve asbestos-related claims against it in the future.
At December 31, 2016, over 80 percent of the open claims against the Company are non-malignancy or unspecified disease claims, many of which have been placed on inactive or deferral dockets and the vast majority of which have little or no settlement value against the Company, particularly in light of recent changes in the legal and judicial treatment of such claims.
The Company’s liability for asbestos-related matters and the asset for probable asbestos-related insurance recoveries are included in the following balance sheet accounts:
In millionsDecember 31,
2016December 31,
2015
Accrued expenses and other current liabilities $ 61.5 $ 65.7
Other noncurrent liabilities 569.7 648.0
Total asbestos-related liabilities $631.2 $713.7
Other current assets $ 54.0 $ 51.3
Other noncurrent assets 218.5 264.3
Total asset for probable asbestos-related insurance recoveries $272.5 $315.6
The Company's asbestos insurance receivable related to Ingersoll-Rand Company and Trane was $129.6 million and $142.9 million at December 31, 2016, and $166.4 million and $149.2 million at December 31, 2015, respectively.
The (costs) income associated with the settlement and defense of asbestos-related claims after insurance recoveries, for the years ended December 31, were as follows:
In millions 2016 2015 2014
Continuing operations $ 2.7 $ 21.0 $ 1.7
Discontinued operations 46.3 (8.8) 63.2
Total $49.0 $12.2 $64.9
Income and expenses associated with Ingersoll-Rand Company's asbestos liabilities and corresponding insurance recoveries are recorded within discontinued operations, as they relate to previously divested businesses, primarily Ingersoll-Dresser Pump, which was sold by the Company in 2000. During the year ended December 31, 2016, the Company reached settlements with various insurance carriers related to Ingersoll-Rand Company asbestos matters. Income and expenses associated with Trane’s asbestos liabilities and corresponding insurance recoveries are recorded within Other income/(expense), net as part of continuing operations. During the second quarter of 2015, the Company reached a settlement with an insurance carrier related to Trane asbestos matters.
The receivable attributable to Trane for probable insurance recoveries as of December 31, 2016 is entirely supported by settlement agreements between Trane and the respective insurance carriers. Most of these settlement agreements constitute “coverage-in-place” arrangements, in which the insurer signatories agree to reimburse Trane for specified portions of its costs for asbestos bodily injury claims and Trane agrees to certain claims-handling protocols and grants to the insurer signatories certain releases and indemnifications.
In 2012 and 2013, Ingersoll-Rand Company filed actions in the Superior Court of New Jersey, Middlesex County, seeking a declaratory judgment and other relief regarding the Company's rights to defense and indemnity for asbestos claims. The defendants were several dozen solvent insurance companies, including companies that had been paying a portion of Ingersoll-Rand Company's asbestos claim defense and indemnity costs. The responding defendants generally challenged the Company's right to recovery, and raised various coverage defenses. Since filing the actions, Ingersoll Rand Company has settled with half of the insurer defendants, and has dismissed one of the actions in its entirety.

2016 ANNUAL REPORT | PAGE F-39
2016 Annual Report
The Company continually monitors the status of pending litigation that could impact the allocation of asbestos claims against the Company's various insurance policies. The Company has concluded that its Ingersoll-Rand Company insurance receivable is probable of recovery because of the following factors:
• Ingersoll-Rand Company has reached favorable settlements regarding asbestos coverage claims for the majority of its recorded asbestos-related insurance receivable;
• a review of other companies in circumstances comparable to Ingersoll-Rand Company, including Trane, and the success of other companies in recovering under their insurance policies, including Trane's favorable settlement discussed above;
• the Company's confidence in its right to recovery under the terms of its policies and pursuant to applicable law; and
• the Company's history of receiving payments under the Ingersoll-Rand Company insurance program, including under policies that had been the subject of prior litigation.
The amounts recorded by the Company for asbestos-related liabilities and insurance-related assets are based on currently available information. The Company’s actual liabilities or insurance recoveries could be significantly higher or lower than those recorded if assumptions used in the calculations vary significantly from actual results. Key variables in these assumptions include the number and type of new claims to be filed each year, the average cost of resolution of each such new claim, the resolution of coverage issues with insurance carriers, and the solvency risk with respect to the Company’s insurance carriers. Furthermore, predictions with respect to these variables are subject to greater uncertainty as the projection period lengthens. Other factors that may affect the Company’s liability include uncertainties surrounding the litigation process from jurisdiction to jurisdiction and from case to case, reforms that may be made by state and federal courts, and the passage of state or federal tort reform legislation.
The aggregate amount of the stated limits in insurance policies available to the Company for asbestos-related claims acquired, over many years and from many different carriers, is substantial. However, limitations in that coverage, primarily due to the considerations described above, are expected to result in the projected total liability to claimants substantially exceeding the probable insurance recovery.
Warranty Liability
Standard product warranty accruals are recorded at the time of sale and are estimated based upon product warranty terms and historical experience. The Company assesses the adequacy of its liabilities and will make adjustments as necessary based on known or anticipated warranty claims, or as new information becomes available.
The changes in the standard product warranty liability for the year ended December 31, were as follows:
In millions 2016 2015
Balance at beginning of period $ 262.0 $ 253.6
Reductions for payments (142.3) (128.8)
Accruals for warranties issued during the current period 141.4 127.8
Accruals for warranties assumed from acquisitions during the current period – 9.7
Changes to accruals related to preexisting warranties 2.5 4.5
Translation (2.0) (4.8)
Balance at end of period $ 261.6 $ 262.0
Standard product warranty liabilities are classified as Accrued expenses and other current liabilities, or Other noncurrent liabilities based on their expected term. The Company's total current standard product warranty reserve at December 31, 2016 and December 31, 2015 was $148.7 million and $152.6 million, respectively.
The Company's extended warranty liability represents the deferred revenue associated with its extended warranty contracts and is amortized into Net revenues on a straight-line basis over the life of the contract, unless another method is more representative of the costs incurred. The Company assesses the adequacy of its liability by evaluating the expected costs under its existing contracts to ensure these expected costs do not exceed the extended warranty liability.
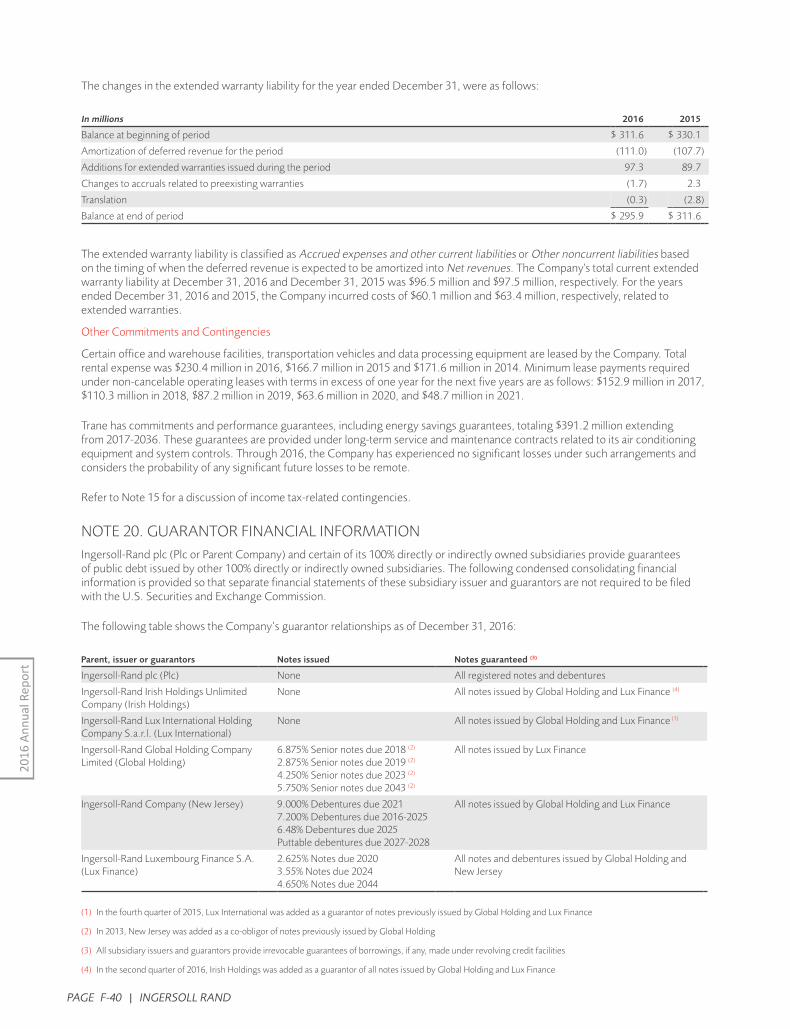
PAGE F-40 | INGERSOLL RAND
2016
Ann
ual R
epor
t
The changes in the extended warranty liability for the year ended December 31, were as follows:
In millions 2016 2015
Balance at beginning of period $ 311.6 $ 330.1
Amortization of deferred revenue for the period (111.0) (107.7)
Additions for extended warranties issued during the period 97.3 89.7
Changes to accruals related to preexisting warranties (1.7) 2.3
Translation (0.3) (2.8)
Balance at end of period $ 295.9 $ 311.6
The extended warranty liability is classified as Accrued expenses and other current liabilities or Other noncurrent liabilities based on the timing of when the deferred revenue is expected to be amortized into Net revenues. The Company's total current extended warranty liability at December 31, 2016 and December 31, 2015 was $96.5 million and $97.5 million, respectively. For the years ended December 31, 2016 and 2015, the Company incurred costs of $60.1 million and $63.4 million, respectively, related to extended warranties.
Other Commitments and Contingencies
Certain office and warehouse facilities, transportation vehicles and data processing equipment are leased by the Company. Total rental expense was $230.4 million in 2016, $166.7 million in 2015 and $171.6 million in 2014. Minimum lease payments required under non-cancelable operating leases with terms in excess of one year for the next five years are as follows: $152.9 million in 2017, $110.3 million in 2018, $87.2 million in 2019, $63.6 million in 2020, and $48.7 million in 2021.
Trane has commitments and performance guarantees, including energy savings guarantees, totaling $391.2 million extending from 2017-2036. These guarantees are provided under long-term service and maintenance contracts related to its air conditioning equipment and system controls. Through 2016, the Company has experienced no significant losses under such arrangements and considers the probability of any significant future losses to be remote.
Refer to Note 15 for a discussion of income tax-related contingencies.
NOTE 20. GUARANTOR FINANCIAL INFORMATIONIngersoll-Rand plc (Plc or Parent Company) and certain of its 100% directly or indirectly owned subsidiaries provide guarantees of public debt issued by other 100% directly or indirectly owned subsidiaries. The following condensed consolidating financial information is provided so that separate financial statements of these subsidiary issuer and guarantors are not required to be filed with the U.S. Securities and Exchange Commission.
The following table shows the Company’s guarantor relationships as of December 31, 2016:
Parent, issuer or guarantors Notes issued Notes guaranteed (3)
Ingersoll-Rand plc (Plc) None All registered notes and debentures
Ingersoll-Rand Irish Holdings Unlimited Company (Irish Holdings)
None All notes issued by Global Holding and Lux Finance (4)
Ingersoll-Rand Lux International Holding Company S.a.r.l. (Lux International)
None All notes issued by Global Holding and Lux Finance (1)
Ingersoll-Rand Global Holding Company Limited (Global Holding)
6.875% Senior notes due 2018 (2) 2.875% Senior notes due 2019 (2) 4.250% Senior notes due 2023 (2) 5.750% Senior notes due 2043 (2)
All notes issued by Lux Finance
Ingersoll-Rand Company (New Jersey) 9.000% Debentures due 20217.200% Debentures due 2016-20256.48% Debentures due 2025Puttable debentures due 2027-2028
All notes issued by Global Holding and Lux Finance
Ingersoll-Rand Luxembourg Finance S.A. (Lux Finance)
2.625% Notes due 20203.55% Notes due 20244.650% Notes due 2044
All notes and debentures issued by Global Holding and New Jersey
(1) In the fourth quarter of 2015, Lux International was added as a guarantor of notes previously issued by Global Holding and Lux Finance
(2) In 2013, New Jersey was added as a co-obligor of notes previously issued by Global Holding
(3) All subsidiary issuers and guarantors provide irrevocable guarantees of borrowings, if any, made under revolving credit facilities
(4) In the second quarter of 2016, Irish Holdings was added as a guarantor of all notes issued by Global Holding and Lux Finance

2016 ANNUAL REPORT | PAGE F-41
2016 Annual Report
Each subsidiary debt issuer and guarantor is owned 100% directly or indirectly by the Parent Company. Each guarantee is full and unconditional, and provided on a joint and several basis. There are no significant restrictions of the Parent Company, or any guarantor, to obtain funds from its subsidiaries, such as provisions in debt agreements that prohibit dividend payments, loans or advances to the parent by a subsidiary.
Basis of presentation
The following Condensed Consolidating Financial Statements present the financial position, results of operations and cash flows of each issuer or guarantor on a legal entity basis. The financial information for all periods has been presented based on the Company’s legal entity ownerships and guarantees outstanding at December 31, 2016. Assets and liabilities are attributed to each issuer and guarantor generally based on legal entity ownership. Investments in subsidiaries of the Parent Company, subsidiary guarantors and issuers represent the proportionate share of their subsidiaries’ net assets. Certain adjustments are needed to consolidate the Parent Company and its subsidiaries, including the elimination of investments in subsidiaries and related activity that occurs between entities in different columns. These adjustments are presented in the Consolidating Adjustments column. This basis of presentation is intended to comply with the specific reporting requirements for subsidiary issuers and guarantors, and is not intended to present the Company’s financial position or results of operations or cash flows for any other purpose.
Revisions of prior year financial information to reflect changes in guarantor subsidiaries
The Condensed Consolidated Financial Statements were revised to present the financial statements as of and for the years ended December 31, 2014 and 2015 for the following changes in the composition of issuer and guarantor subsidiaries that occurred during 2016:
• Irish Holdings was added as a guarantor of all notes and debentures issued by Global Holding and Lux Finance;
• Ingersoll-Rand International Holding Limited (International Holding), previously a guarantor, transferred all of its remaining assets, including ownership of Lux International, to Irish Holdings and was dissolved;
• An intercompany loan of $19.5 billion was made from Irish Holdings to Lux International, effectively replacing the $19.5 billion intercompany loan made from International Holding to Lux International;
• Through a series of internal refinancing transactions, this $19.5 billion note was subsequently reduced to $6.4 billion owed by Lux International with a remaining $6.2 billion owed by a Luxembourg subsidiary of Lux International to Irish Holdings; and,
• As a result of internal transactions, Lux Finance’s indirect minority interest in various non-U.S. finance and operating subsidiaries was converted into an indirect wholly-owned interest in various non-U.S. operating subsidiaries.
These transactions had no impact on the composition of the Company’s consolidated group and had no effect on the Consolidated Financial Statements for any period.
Revisions of prior year financial information to correct the presentation of intercompany activity
The Condensed Consolidating Statement of Comprehensive Income and the Condensed Consolidating Statement of Cash Flows for the years ended December 31, 2014 and 2015 were revised to correct the errors previously disclosed in the Company’s 2016 first quarter Form 10-Q related to the presentation of certain intercompany activity. These adjustments had no impact on the Company’s Condensed Consolidated Statements. The Company assessed the materiality of these revisions on previously issued financial statements and concluded that the revisions were not material to the Consolidated Financial Statements taken as a whole.

PAGE F-42 | INGERSOLL RAND
2016
Ann
ual R
epor
t
Con
den
sed
Con
solid
atin
g St
atem
ent
of C
omp
rehe
nsiv
e In
com
e
For t
he y
ear e
nded
Dec
embe
r 31,
201
6
In m
illio
nsPl
cIr
ish
Hol
din
gsLu
x In
tern
atio
nal
Glo
bal
Hol
din
gN
ew
Jers
eyLu
x Fi
nanc
eO
ther
Su
bsid
iari
esC
onso
lidat
ing
Ad
just
men
ts
Con
solid
ated
Net
reve
nues
$–
$–
$–
$–
$1,
327.
2$
–$1
2,53
3.9
$(3
52.2
)$1
3,50
8.9
Cos
t of g
oods
sol
d–
––
–(9
82.2
)–
(8,6
99.3
)35
2.2
(9,3
29.3
)
Selli
ng a
nd a
dmin
istr
ativ
e ex
pens
es(1
6.9)
–(0
.2)
(0.1
)(3
52.5
)(0
.5)
(2,2
36.3
)–
(2,6
06.5
)
Ope
ratin
g in
com
e (lo
ss)
(16.
9)–
(0.2
)(0
.1)
(7.5
)(0
.5)
1,59
8.3
–1,
573.
1
Equi
ty e
arni
ngs
(loss
) in
subs
idia
ries,
net
of t
ax1,
559.
71,
544.
01,
463.
460
9.4
808.
71,
521.
1–
(7,5
06.3
)–
Inte
rest
exp
ense
––
–(1
27.0
)(4
7.9)
(42.
6)(4
.0)
–(2
21.5
)
Inte
rcom
pany
inte
rest
and
fees
(69.
2)–
(46.
4)(1
64.5
)(2
77.2
)(6
.8)
564.
1–
–
Oth
er in
com
e/(e
xpen
se),
net
0.9
––
–(1
3.8)
–40
2.6
–38
9.7
Earn
ings
(los
s) b
efor
e in
com
e ta
xes
1,47
4.5
1,54
4.0
1,41
6.8
317.
846
2.3
1,47
1.2
2,56
1.0
(7,5
06.3
)1,
741.
3
Bene
fit (p
rovi
sion
) for
inco
me
taxe
s1.
7–
3.0
115.
611
7.3
–(5
19.1
)–
(281
.5)
Earn
ings
(los
s) fr
om c
ontin
uing
ope
ratio
ns1,
476.
21,
544.
01,
419.
843
3.4
579.
61,
471.
22,
041.
9(7
,506
.3)
1,45
9.8
Gai
n (lo
ss) f
rom
dis
cont
inue
d op
erat
ions
, net
of t
ax–
––
–30
.4–
2.5
–32
.9
Net
ear
ning
s (lo
ss)
1,47
6.2
1,54
4.0
1,41
9.8
433.
461
0.0
1,47
1.2
2,04
4.4
(7,5
06.3
)1,
492.
7
Less
: Net
ear
ning
s at
trib
utab
le to
non
cont
rolli
ng in
tere
sts
––
––
––
(16.
5)–
(16.
5)
Net
ear
ning
s at
trib
utab
le to
Inge
rsol
l-Ran
d pl
c$1
,476
.2$1
,544
.0$1
,419
.8$
433.
4$
610.
0$1
,471
.2$
2,02
7.9
$(7,
506.
3)$
1,47
6.2
Oth
er c
ompr
ehen
sive
inco
me
(loss
), ne
t of t
ax(1
69.6
)(1
68.5
)(1
66.8
)(1
61.1
)(1
61.5
)5.
033
.361
9.6
(169
.6)
Com
preh
ensi
ve in
com
e at
trib
utab
le to
Inge
rsol
l-Ran
d pl
c$1
,306
.6$1
,375
.5$1
,253
.0$
272.
3$
448.
5$1
,476
.2$
2,06
1.2
$(6,
886.
7)$
1,30
6.6

2016 ANNUAL REPORT | PAGE F-43
2016 Annual Report
Con
den
sed
Con
solid
atin
g St
atem
ent
of C
omp
rehe
nsiv
e In
com
e
For t
he y
ear e
nded
Dec
embe
r 31,
201
5
In m
illio
nsPl
cIr
ish
Hol
din
gsLu
x
Inte
rnat
iona
lG
loba
lH
old
ing
New
Je
rsey
Lux
Fina
nce
Oth
er
Subs
idia
ries
Con
solid
atin
g A
dju
stm
ents
Con
solid
ated
Net
reve
nues
$–
$–
$–
$–
$1,
427.
9$
–$1
2,25
9.0
$(3
86.2
)$1
3,30
0.7
Cos
t of g
oods
sol
d–
––
–(1
,031
.7)
–(8
,656
.1)
386.
2(9
,301
.6)
Selli
ng a
nd a
dmin
istr
ativ
e ex
pens
es(1
8.9)
–(0
.1)
(0.1
)(3
03.5
)(0
.6)
(2,2
17.9
)–
(2,5
41.1
)
Ope
ratin
g in
com
e (lo
ss)
(18.
9)–
(0.1
)(0
.1)
92.7
(0.6
)1,
385.
0–
1,45
8.0
Equi
ty e
arni
ngs
(loss
) in
subs
idia
ries,
net
of t
ax70
6.8
710.
657
0.6
301.
769
3.7
359.
2–
(3,3
42.6
)–
Inte
rest
exp
ense
––
–(1
27.6
)(4
8.3)
(42.
8)(4
.3)
–(2
23.0
)
Inte
rcom
pany
inte
rest
and
fees
(26.
7)(0
.2)
(21.
4)(2
8.6)
(270
.6)
(2.4
)34
9.9
––
Oth
er in
com
e/(e
xpen
se),
net
1.4
–0.
1–
(9.1
)–
20.5
–12
.9
Earn
ings
(los
s) b
efor
e in
com
e ta
xes
662.
671
0.4
549.
214
5.4
458.
431
3.4
1,75
1.1
(3,3
42.6
)1,
247.
9
Bene
fit (p
rovi
sion
) for
inco
me
taxe
s2.
0–
(9.1
)58
.0(1
25.5
)–
(466
.2)
–(5
40.8
)
Earn
ings
(los
s) fr
om c
ontin
uing
ope
ratio
ns66
4.6
710.
454
0.1
203.
433
2.9
313.
41,
284.
9(3
,342
.6)
707.
1
Gai
n (lo
ss) f
rom
dis
cont
inue
d op
erat
ions
, net
of t
ax–
––
–(3
1.4)
–7.
1–
(24.
3)
Net
ear
ning
s (lo
ss)
664.
671
0.4
540.
120
3.4
301.
531
3.4
1,29
2.0
(3,3
42.6
)68
2.8
Less
: Net
ear
ning
s at
trib
utab
le to
non
cont
rolli
ng in
tere
sts
––
––
––
(18.
2)–
(18.
2)
Net
ear
ning
s at
trib
utab
le to
Inge
rsol
l-Ran
d pl
c$
664.
6$
710.
4$
540.
1$
203.
4$
301.
5$
313.
4$
1,27
3.8
$(3,
342.
6)$
664.
6
Oth
er c
ompr
ehen
sive
inco
me
(loss
), ne
t of t
ax(4
06.6
)(4
06.0
)(2
29.1
)(9
1.4)
(91.
9)(8
8.0)
(411
.7)
1,31
8.1
(406
.6)
Com
preh
ensi
ve in
com
e at
trib
utab
le to
Inge
rsol
l-Ran
d pl
c$
258.
0$
304.
4$
311.
0$
112.
0$
209.
6$
225.
4$
862.
1$(
2,02
4.5)
$25
8.0

PAGE F-44 | INGERSOLL RAND
2016
Ann
ual R
epor
t
Con
den
sed
Con
solid
atin
g St
atem
ent
of C
omp
rehe
nsiv
e In
com
e
For t
he y
ear e
nded
Dec
embe
r 31,
201
4
In m
illio
nsPl
cIr
ish
Hol
din
gsLu
x
Inte
rnat
iona
lG
loba
lH
old
ing
New
Je
rsey
Lux
Fina
nce
Oth
er
Subs
idia
ries
Con
solid
atin
g A
dju
stm
ents
Con
solid
ated
Net
reve
nues
$–
$–
$–
$–
$1,2
57.3
$–
$12,
021.
9$
(387
.8)
$12,
891.
4
Cos
t of g
oods
sol
d–
––
–(8
91.8
)–
(8,4
78.8
)38
7.8
(8,9
82.8
)
Selli
ng a
nd a
dmin
istr
ativ
e ex
pens
es(3
4.9)
–(0
.1)
(0.6
)(3
08.8
)–
(2,1
59.5
)–
(2,5
03.9
)
Ope
ratin
g in
com
e (lo
ss)
(34.
9)–
(0.1
)(0
.6)
56.7
–1,
383.
6–
1,40
4.7
Equi
ty e
arni
ngs
(loss
) in
subs
idia
ries,
net
of t
ax98
5.9
1,39
8.5
1,26
9.3
465.
755
9.6
352.
9–
(5,0
31.9
)–
Inte
rest
exp
ense
––
–(1
27.9
)(4
8.9)
(7.1
)(4
1.4)
–(2
25.3
)
Inte
rcom
pany
inte
rest
and
fees
(18.
2)–
(17.
8)(2
.5)
(208
.4)
(0.6
)24
7.5
––
Oth
er in
com
e/(e
xpen
se),
net
0.9
––
–2.
9–
26.2
–30
.0
Earn
ings
(los
s) b
efor
e in
com
e ta
xes
933.
71,
398.
51,
251.
433
4.7
361.
934
5.2
1,61
5.9
(5,0
31.9
)1,
209.
4
Bene
fit (p
rovi
sion
) for
inco
me
taxe
s0.
2–
–44
.658
.5–
(397
.0)
–(2
93.7
)
Earn
ings
(los
s) fr
om c
ontin
uing
ope
ratio
ns93
3.9
1,39
8.5
1,25
1.4
379.
342
0.4
345.
21,
218.
9(5
,031
.9)
915.
7
Gai
n (lo
ss) f
rom
dis
cont
inue
d op
erat
ions
, net
of t
ax(2
.2)
––
–37
.2–
(0.3
)–
34.7
Net
ear
ning
s (lo
ss)
931.
71,
398.
51,
251.
437
9.3
457.
634
5.2
1,21
8.6
(5,0
31.9
)95
0.4
Less
: Net
ear
ning
s at
trib
utab
le to
non
cont
rolli
ng in
tere
sts
––
––
––
(18.
7)–
(18.
7)
Net
ear
ning
s at
trib
utab
le to
Inge
rsol
l-Ran
d pl
c$
931.
7$
1,39
8.5
$1,
251.
4$
379.
3$
457.
6$
345.
2$
1,19
9.9
$(5,
031.
9)$
931.
7
Oth
er c
ompr
ehen
sive
inco
me
(loss
), ne
t of t
ax(5
47.6
)(5
47.6
)(5
17.8
)(2
59.4
)(2
59.7
)(1
82.2
)(4
36.6
)2,
203.
3(5
47.6
)
Com
preh
ensi
ve in
com
e at
trib
utab
le to
Inge
rsol
l-Ran
d pl
c$
384.
1$
850.
9$
733.
6$
119.
9$
197.
9$
163.
0$
763.
3$(
2,82
8.6)
$38
4.1

2016 ANNUAL REPORT | PAGE F-45
2016 Annual Report
Con
den
sed
Con
solid
atin
g B
alan
ce S
heet
Dec
embe
r 31,
201
6
In m
illio
nsPl
cIr
ish
Hol
din
gsLu
x In
tern
atio
nal
Glo
bal
Hol
din
gN
ew
Jers
eyLu
x Fi
nanc
eO
ther
Su
bsid
iari
esC
onso
lidat
ing
Ad
just
men
ts
Con
solid
ated
ASS
ETS
Cur
rent
ass
ets:
Cas
h an
d ca
sh e
quiv
alen
ts$
–$
–$
–$
–$
634.
6$
–$
1,08
0.1
$–
$1,
714.
7
Acc
ount
s an
d no
tes
rece
ivab
le, n
et–
––
–17
1.0
–2,
052.
0–
2,22
3.0
Inve
ntor
ies,
net
––
––
165.
3–
1,22
0.5
–1,
385.
8
Oth
er c
urre
nt a
sset
s0.
2–
5.3
0.7
69.4
–18
9.3
(9.1
)25
5.8
Inte
rcom
pany
rece
ivab
les
122.
3–
5.6
271.
622
0.5
–11
,747
.9(1
2,36
7.9)
–
Tota
l cur
rent
ass
ets
122.
5–
10.9
272.
31,
260.
8–
16,2
89.8
(12,
377.
0)5,
579.
3
Prop
erty
, pla
nt a
nd e
quip
men
t, ne
t–
––
–44
5.9
–1,
065.
1–
1,51
1.0
Goo
dwill
and
oth
er in
tang
ible
ass
ets,
net
––
––
414.
7–
9,02
8.8
–9,
443.
5
Oth
er n
oncu
rren
t ass
ets
0.2
––
262.
467
6.3
–58
0.1
(655
.4)
863.
6
Inve
stm
ents
in c
onso
lidat
ed s
ubsi
diar
ies
7,58
8.1
1,50
0.4
3,26
7.1
7,27
0.2
15,2
73.4
1,09
0.4
–(3
5,98
9.6)
–
Inte
rcom
pany
not
es re
ceiv
able
–12
,560
.2–
––
–3,
851.
8(1
6,41
2.0)
–
Tota
l ass
ets
$7,
710.
8$
14,0
60.6
$3,
278.
0$
7,80
4.9
$18
,071
.1$
1,09
0.4
$30
,815
.6$(
65,4
34.0
)$
17,3
97.4
LIA
BIL
ITIE
S A
ND
EQ
UIT
Y
Cur
rent
liab
ilitie
s:
Acc
ount
s pa
yabl
e an
d ac
crue
d ex
pens
es$
7.7
$–
$0.
2$
36.3
$52
5.1
$7.
0$
2,66
2.3
$(9
.1)
$3,
229.
5
Shor
t-te
rm b
orro
win
gs a
nd c
urre
nt m
atur
ities
of l
ong-
term
deb
t–
––
–35
0.4
–10
.4–
360.
8
Inte
rcom
pany
pay
able
s1,
059.
3–
3,40
0.1
1,06
8.2
6,28
5.6
486.
967
.8(1
2,36
7.9)
–
Tota
l cur
rent
liab
ilitie
s1,
067.
0–
3,40
0.3
1,10
4.5
7,16
1.1
493.
92,
740.
5(1
2,37
7.0)
3,59
0.3
Long
-ter
m d
ebt
––
–2,
286.
333
4.2
1,08
8.3
0.6
–3,
709.
4
Oth
er n
oncu
rren
t lia
bilit
ies
––
–18
.21,
280.
8–
2,73
5.8
(655
.4)
3,37
9.4
Inte
rcom
pany
not
es p
ayab
le–
–6,
376.
31,
817.
22,
034.
6–
6,18
3.9
(16,
412.
0)–
Tota
l lia
bilit
ies
1,06
7.0
–9,
776.
65,
226.
210
,810
.71,
582.
211
,660
.8(2
9,44
4.4)
10,6
79.1
Equi
ty:
Tota
l equ
ity6,
643.
814
,060
.6(6
,498
.6)
2,57
8.7
7,26
0.4
(491
.8)
19,1
54.8
(35,
989.
6)6,
718.
3
Tota
l lia
bilit
ies
and
equi
ty$
7,71
0.8
$14
,060
.6$
3,27
8.0
$7,
804.
9$
18,0
71.1
$1,
090.
4$
30,8
15.6
$(65
,434
.0)
$17
,397
.4

PAGE F-46 | INGERSOLL RAND
2016
Ann
ual R
epor
t
Con
den
sed
Con
solid
atin
g B
alan
ce S
heet
Dec
embe
r 31,
201
5
In m
illio
nsPl
cIr
ish
Hol
din
gsLu
x In
tern
atio
nal
Glo
bal
Hol
din
gN
ew
Jers
eyLu
x Fi
nanc
eO
ther
Su
bsid
iari
esC
onso
lidat
ing
Ad
just
men
ts
Con
solid
ated
ASS
ETS
Cur
rent
ass
ets:
Cas
h an
d ca
sh e
quiv
alen
ts$
–$
–$
–$
11.4
$–
$0.
1$
725.
3$
–$
736.
8
Acc
ount
s an
d no
tes
rece
ivab
le, n
et–
––
–16
0.7
–1,
989.
9–
2,15
0.6
Inve
ntor
ies,
net
––
––
192.
0–
1,21
8.7
–1,
410.
7
Oth
er c
urre
nt a
sset
s0.
1–
–6.
483
.3–
237.
5(1
6.0)
311.
3
Inte
rcom
pany
rece
ivab
le13
6.8
–3.
310
2.2
1,41
3.9
–35
,404
.3(3
7,06
0.5)
–
Tota
l cur
rent
ass
ets
136.
9–
3.3
120.
01,
849.
90.
139
,575
.7(3
7,07
6.5)
4,60
9.4
Prop
erty
, pla
nt a
nd e
quip
men
t, ne
t–
––
–46
3.0
–1,
112.
1–
1,57
5.1
Goo
dwill
and
oth
er in
tang
ible
ass
ets,
net
––
––
411.
6–
9,24
4.7
–9,
656.
3
Oth
er n
oncu
rren
t ass
ets
0.2
––
283.
873
3.4
–56
8.4
(709
.0)
876.
8
Inve
stm
ents
in c
onso
lidat
ed s
ubsi
diar
ies
10,1
39.0
20,3
73.9
13,4
06.9
6,47
8.2
13,9
67.0
11,0
59.7
–(7
5,42
4.7)
–
Inte
rcom
pany
not
es re
ceiv
able
––
––
––
2,87
6.7
(2,8
76.7
)–
Tota
l ass
ets
$10
,276
.1$
20,3
73.9
$13
,410
.2$
6,88
2.0
$17
,424
.9$
11,0
59.8
$53
,377
.6$(
116,
086.
9)$
16,7
17.6
LIA
BIL
ITIE
S A
ND
EQ
UIT
Y
Cur
rent
liab
ilitie
s:
Acc
ount
s pa
yabl
e an
d ac
crue
d ex
pens
es$
7.1
$–
$0.
1$
30.7
$59
9.7
$6.
3$
2,51
8.3
$(1
8.0)
$3,
144.
2
Shor
t-te
rm b
orro
win
gs a
nd c
urre
nt m
atur
ities
of l
ong-
term
deb
t–
––
–35
0.4
143.
010
.8–
504.
2
Inte
rcom
pany
pay
able
4,45
2.3
143.
623
,529
.01,
997.
85,
858.
374
5.5
334.
0(3
7,06
0.5)
–
Tota
l cur
rent
liab
ilitie
s4,
459.
414
3.6
23,5
29.1
2,02
8.5
6,80
8.4
894.
82,
863.
1(3
7,07
8.5)
3,64
8.4
Long
-ter
m d
ebt
––
–2,
284.
434
1.6
1,08
6.9
0.7
–3,
713.
6
Oth
er n
oncu
rren
t lia
bilit
ies
–3.
8–
8.3
1,36
7.9
–2,
805.
3(7
08.9
)3,
476.
4
Inte
rcom
pany
not
es p
ayab
le–
––
429.
02,
447.
7–
–(2
,876
.7)
–
Tota
l lia
bilit
ies
4,45
9.4
147.
423
,529
.14,
750.
210
,965
.61,
981.
75,
669.
1(4
0,66
4.1)
10,8
38.4
Equi
ty:
Tota
l equ
ity5,
816.
720
,226
.5(1
0,11
8.9)
2,13
1.8
6,45
9.3
9,07
8.1
47,7
08.5
(75,
422.
8)5,
879.
2
Tota
l lia
bilit
ies
and
equi
ty$
10,2
76.1
$20
,373
.9$
13,4
10.2
$6,
882.
0$
17,4
24.9
$11
,059
.8$
53,3
77.6
$(11
6,08
6.9)
$16
,717
.6

2016 ANNUAL REPORT | PAGE F-47
2016 Annual Report
Con
den
sed
Con
solid
atin
g St
atem
ent
of C
ash
Flow
s
For t
he y
ear e
nded
Dec
embe
r 31,
201
6
In m
illio
nsPl
cIr
ish
Hol
din
gsLu
x In
tern
atio
nal
Glo
bal
Hol
din
gN
ew
Jers
eyLu
x Fi
nanc
eO
ther
Su
bsid
iari
esC
onso
lidat
ing
Ad
just
men
ts
Con
solid
ated
CA
SH F
LOW
S FR
OM
OPE
RA
TIN
G A
CTI
VIT
IES:
Net
cas
h pr
ovid
ed b
y (u
sed
in) c
ontin
uing
ope
ratin
g ac
tiviti
es$(
102.
1)$
–$
(42.
0)$(
276.
6)$
823.
4$
(47.
3)$
1,05
5.9
$–
$1,
411.
3
Net
cas
h pr
ovid
ed b
y (u
sed
in) d
isco
ntin
ued
oper
atin
g ac
tiviti
es–
––
–86
.4–
2.5
–88
.9
Net
cas
h pr
ovid
ed b
y (u
sed
in) o
pera
ting
activ
ities
(102
.1)
–(4
2.0)
(276
.6)
909.
8(4
7.3)
1,05
8.4
–1,
500.
2
CA
SH F
LOW
S FR
OM
INV
ESTI
NG
AC
TIV
ITIE
S:
Cap
ital e
xpen
ditu
res
––
––
(73.
7)–
(109
.0)
–(1
82.7
)
Acq
uisi
tion
of b
usin
esse
s, n
et o
f cas
h ac
quire
d–
––
–(9
.2)
––
–(9
.2)
Proc
eeds
from
sal
e of
pro
pert
y, p
lant
and
equ
ipm
ent
––
––
––
9.5
–9.
5
Proc
eeds
from
bus
ines
s an
d eq
uity
inve
stm
ent d
ispo
sitio
ns–
––
––
–42
2.5
–42
2.5
Inte
rcom
pany
inve
stin
g ac
tiviti
es, n
et(9
0.1)
(19,
465.
7)6,
181.
4(1
72.9
)65
.833
6.1
(2,2
26.8
)15
,372
.2–
Net
cas
h pr
ovid
ed b
y (u
sed
in) i
nves
ting
activ
ities
(90.
1)(1
9,46
5.7)
6,18
1.4
(172
.9)
(17.
1)33
6.1
(1,9
03.8
)15
,372
.224
0.1
CA
SH F
LOW
S FR
OM
FIN
AN
CIN
G A
CTI
VIT
IES:
Net
pro
ceed
s (r
epay
men
ts) o
f deb
t–
––
–(7
.7)
(143
.0)
––
(150
.7)
Deb
t iss
uanc
e co
sts
––
–(2
.1)
––
––
(2.1
)
Div
iden
ds p
aid
to o
rdin
ary
shar
ehol
ders
(348
.6)
––
––
––
–(3
48.6
)
Div
iden
ds p
aid
to n
onco
ntro
lling
inte
rest
s–
––
––
–(1
4.1)
–(1
4.1)
Proc
eeds
from
sha
res
issu
ed u
nder
ince
ntiv
e pl
ans
62.9
––
––
––
–62
.9
Repu
rcha
se o
f ord
inar
y sh
ares
(250
.1)
––
––
––
–(2
50.1
)
Oth
er fi
nanc
ing
activ
ities
, net
(2.5
)–
––
––
––
(2.5
)
Inte
rcom
pany
fina
ncin
g ac
tiviti
es, n
et73
0.5
19,4
65.7
(6,1
39.4
)44
0.2
(250
.4)
(145
.9)
1,27
1.5
(15,
372.
2)–
Net
cas
h pr
ovid
ed b
y (u
sed
in) f
inan
cing
act
iviti
es19
2.2
19,4
65.7
(6,1
39.4
)43
8.1
(258
.1)
(288
.9)
1,25
7.4
(15,
372.
2)(7
05.2
)
Effe
ct o
f exc
hang
e ra
te c
hang
es o
n ca
sh a
nd c
ash
equi
vale
nts
––
––
––
(57.
2)–
(57.
2)
Net
incr
ease
(dec
reas
e) in
cas
h an
d ca
sh e
quiv
alen
ts–
––
(11.
4)63
4.6
(0.1
)35
4.8
–97
7.9
Cas
h an
d ca
sh e
quiv
alen
ts -
begi
nnin
g of
per
iod
––
–11
.4–
0.1
725.
3–
736.
8
Cas
h an
d ca
sh e
quiv
alen
ts -
end
of p
erio
d$
–$
–$
–$
–$
634.
6$
–$
1,08
0.1
$–
$1,
714.
7

PAGE F-48 | INGERSOLL RAND
2016
Ann
ual R
epor
t
Con
den
sed
Con
solid
atin
g St
atem
ent
of C
ash
Flow
s
For t
he y
ear e
nded
Dec
embe
r 31,
201
5
In m
illio
nsPl
cIr
ish
Hol
din
gsLu
x In
tern
atio
nal
Glo
bal
Hol
din
gN
ew
Jers
eyLu
x Fi
nanc
eO
ther
Su
bsid
iari
esC
onso
lidat
ing
Ad
just
men
ts
Con
solid
ated
CA
SH F
LOW
S FR
OM
OPE
RA
TIN
G A
CTI
VIT
IES:
Net
cas
h pr
ovid
ed b
y (u
sed
in) c
ontin
uing
ope
ratin
g ac
tiviti
es$
(60.
2)$(
1.2)
$(3
3.6)
$(12
2.9)
$(29
4.3)
$(4
5.8)
$1,
444.
2$
–$
886.
2
Net
cas
h pr
ovid
ed b
y (u
sed
in) d
isco
ntin
ued
oper
atin
g ac
tiviti
es–
––
–(3
0.6)
–(4
.5)
–(3
5.1)
Net
cas
h pr
ovid
ed b
y (u
sed
in) o
pera
ting
activ
ities
(60.
2)(1
.2)
(33.
6)(1
22.9
)(3
24.9
)(4
5.8)
1,43
9.7
–85
1.1
CA
SH F
LOW
S FR
OM
INV
ESTI
NG
AC
TIV
ITIE
S:
Cap
ital e
xpen
ditu
res
––
––
(122
.9)
–(1
26.7
)–
(249
.6)
Acq
uisi
tion
of b
usin
esse
s, n
et o
f cas
h ac
quire
d–
––
–(4
43.5
)–
(518
.3)
–(9
61.8
)
Proc
eeds
from
sal
e of
pro
pert
y, p
lant
and
equ
ipm
ent
––
––
3.0
–15
.5–
18.5
Inte
rcom
pany
inve
stin
g ac
tiviti
es, n
et–
3.5
1,96
3.3
339.
012
5.4
(228
.0)
(1,0
12.6
)(1
,190
.6)
–
Net
cas
h pr
ovid
ed b
y (u
sed
in) i
nves
ting
activ
ities
–3.
51,
963.
333
9.0
(438
.0)
(228
.0)
(1,6
42.1
)(1
,190
.6)
(1,1
92.9
)
CA
SH F
LOW
S FR
OM
FIN
AN
CIN
G A
CTI
VIT
IES:
Net
pro
ceed
s (r
epay
men
ts) o
f deb
t–
––
(0.1
)(7
.6)
43.0
(28.
9)–
6.4
Div
iden
ds p
aid
to o
rdin
ary
shar
ehol
ders
(303
.3)
––
––
––
–(3
03.3
)
Div
iden
ds p
aid
to n
onco
ntro
lling
inte
rest
s–
––
––
–(9
.3)
–(9
.3)
Proc
eeds
from
sha
res
issu
ed u
nder
ince
ntiv
e pl
ans
61.3
––
––
––
–61
.3
Repu
rcha
se o
f ord
inar
y sh
ares
(250
.1)
––
––
––
–(2
50.1
)
Oth
er fi
nanc
ing
activ
ities
, net
4.7
––
––
––
–4.
7
Net
inte
rcom
pany
fina
ncin
g ac
tiviti
es54
7.6
(2.3
)(1
,930
.8)
(204
.6)
345.
123
0.9
(176
.5)
1,19
0.6
–
Net
cas
h pr
ovid
ed b
y (u
sed
in) f
inan
cing
act
iviti
es60
.2(2
.3)
(1,9
30.8
)(2
04.7
)33
7.5
273.
9(2
14.7
)1,
190.
6(4
90.3
)
Effe
ct o
f exc
hang
e ra
te c
hang
es o
n ca
sh a
nd c
ash
equi
vale
nts
––
––
––
(136
.3)
–(1
36.3
)
Net
incr
ease
(dec
reas
e) in
cas
h an
d ca
sh e
quiv
alen
ts–
–(1
.1)
11.4
(425
.4)
0.1
(553
.4)
–(9
68.4
)
Cas
h an
d ca
sh e
quiv
alen
ts –
beg
inni
ng o
f per
iod
––
1.1
–42
5.4
–1,
278.
7–
1,70
5.2
Cas
h an
d ca
sh e
quiv
alen
ts –
end
of p
erio
d$
–$
–$
–$
11.4
$–
$0.
1$
725.
3$
–$
736.
8
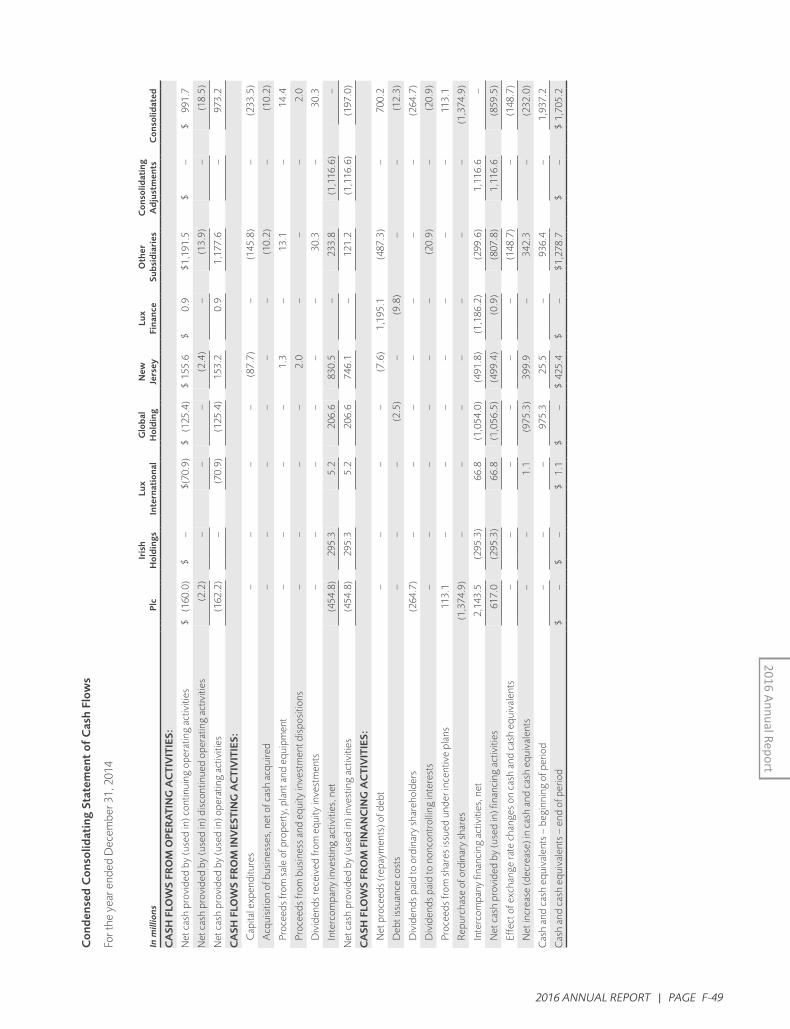
2016 ANNUAL REPORT | PAGE F-49
2016 Annual Report
Con
den
sed
Con
solid
atin
g St
atem
ent
of C
ash
Flow
s
For t
he y
ear e
nded
Dec
embe
r 31,
201
4
In m
illio
nsPl
cIr
ish
Hol
din
gsLu
x In
tern
atio
nal
Glo
bal
Hol
din
gN
ew
Jers
eyLu
x Fi
nanc
eO
ther
Su
bsid
iari
esC
onso
lidat
ing
Ad
just
men
ts
Con
solid
ated
CA
SH F
LOW
S FR
OM
OPE
RA
TIN
G A
CTI
VIT
IES:
Net
cas
h pr
ovid
ed b
y (u
sed
in) c
ontin
uing
ope
ratin
g ac
tiviti
es$
(160
.0)
$–
$(70
.9)
$(1
25.4
)$
155.
6$
0.9
$1,1
91.5
$–
$99
1.7
Net
cas
h pr
ovid
ed b
y (u
sed
in) d
isco
ntin
ued
oper
atin
g ac
tiviti
es(2
.2)
––
–(2
.4)
–(1
3.9)
–(1
8.5)
Net
cas
h pr
ovid
ed b
y (u
sed
in) o
pera
ting
activ
ities
(162
.2)
–(7
0.9)
(125
.4)
153.
20.
91,
177.
6–
973.
2
CA
SH F
LOW
S FR
OM
INV
ESTI
NG
AC
TIV
ITIE
S:
Cap
ital e
xpen
ditu
res
––
––
(87.
7)–
(145
.8)
–(2
33.5
)
Acq
uisi
tion
of b
usin
esse
s, n
et o
f cas
h ac
quire
d–
––
––
–(1
0.2)
–(1
0.2)
Proc
eeds
from
sal
e of
pro
pert
y, p
lant
and
equ
ipm
ent
––
––
1.3
–13
.1–
14.4
Proc
eeds
from
bus
ines
s an
d eq
uity
inve
stm
ent d
ispo
sitio
ns–
––
–2.
0–
––
2.0
Div
iden
ds re
ceiv
ed fr
om e
quity
inve
stm
ents
––
––
––
30.3
–30
.3
Inte
rcom
pany
inve
stin
g ac
tiviti
es, n
et(4
54.8
)29
5.3
5.2
206.
683
0.5
–23
3.8
(1,1
16.6
)–
Net
cas
h pr
ovid
ed b
y (u
sed
in) i
nves
ting
activ
ities
(454
.8)
295.
35.
220
6.6
746.
1–
121.
2(1
,116
.6)
(197
.0)
CA
SH F
LOW
S FR
OM
FIN
AN
CIN
G A
CTI
VIT
IES:
Net
pro
ceed
s (r
epay
men
ts) o
f deb
t–
––
–(7
.6)
1,19
5.1
(487
.3)
–70
0.2
Deb
t iss
uanc
e co
sts
––
–(2
.5)
–(9
.8)
––
(12.
3)
Div
iden
ds p
aid
to o
rdin
ary
shar
ehol
ders
(264
.7)
––
––
––
–(2
64.7
)
Div
iden
ds p
aid
to n
onco
ntro
lling
inte
rest
s–
––
––
–(2
0.9)
–(2
0.9)
Proc
eeds
from
sha
res
issu
ed u
nder
ince
ntiv
e pl
ans
113.
1–
––
––
––
113.
1
Repu
rcha
se o
f ord
inar
y sh
ares
(1,3
74.9
)–
––
––
––
(1,3
74.9
)
Inte
rcom
pany
fina
ncin
g ac
tiviti
es, n
et2,
143.
5(2
95.3
)66
.8(1
,054
.0)
(491
.8)
(1,1
86.2
)(2
99.6
)1,
116.
6–
Net
cas
h pr
ovid
ed b
y (u
sed
in) f
inan
cing
act
iviti
es61
7.0
(295
.3)
66.8
(1,0
56.5
)(4
99.4
)(0
.9)
(807
.8)
1,11
6.6
(859
.5)
Effe
ct o
f exc
hang
e ra
te c
hang
es o
n ca
sh a
nd c
ash
equi
vale
nts
––
––
––
(148
.7)
–(1
48.7
)
Net
incr
ease
(dec
reas
e) in
cas
h an
d ca
sh e
quiv
alen
ts–
–1.
1(9
75.3
)39
9.9
–34
2.3
–(2
32.0
)
Cas
h an
d ca
sh e
quiv
alen
ts –
beg
inni
ng o
f per
iod
––
–97
5.3
25.5
–93
6.4
–1,
937.
2
Cas
h an
d ca
sh e
quiv
alen
ts –
end
of p
erio
d$
–$
–$
1.1
$–
$42
5.4
$–
$1,2
78.7
$–
$1,
705.
2

PAGE F-50 | INGERSOLL RAND
2016
Ann
ual R
epor
t
SCHEDULE II
INGERSOLL-RAND PLC VALUATION AND QUALIFYING ACCOUNTS FOR THE YEARS ENDED DECEMBER 31, 2016, 2015 AND 2014 (Amounts in millions)
Allowances for Doubtful Accounts:
Balance December 31, 2013 $35.4
Additions charged to costs and expenses 7.4
Deductions (a) (7.5)
Business acquisitions and divestitures, net 0.1
Currency translation (1.3)
Balance December 31, 2014 34.1
Additions charged to costs and expenses 1.4
Deductions (a) (5.3)
Business acquisitions and divestitures, net 0.3
Currency translation (2.2)
Balance December 31, 2015 28.3
Additions charged to costs and expenses 7.9
Deductions (a) (9.5)
Business acquisitions and divestitures, net –
Currency translation (0.7)
Balance December 31, 2016 $26.0
(a) “Deductions” include accounts and advances written off, less recoveries.

We heat, cool and automate homes and buildings;
enhance commercial and industrial productivity;
keep transported food and perishables safe
and fresh; and deliver fun, efficient and reliable
transportation solutions. Diversity, engagement
and teamwork drive innovation and fuel our
passion for exceeding customer expectations.
Together with principled leadership and ethical
business practices, our high-engagement
culture delivers enduring results that lead to a
sustainable world.
SUSTAINING GLOBAL LEADERSHIP
Ingersoll Rand (NYSE: IR) creates comfortable, sustainable and efficient environments that advance the quality of life across the globe.
At Ingersoll Rand, sustainability is the very foundation of our business.
CONTENTS
GLOBAL MARKET-LEADING BRANDS 1
LETTER FROM OUR CEO 2
DELIVERING EXCELLENCE 5
WINNING TOGETHER 8
MAKING A DIFFERENCE 12
LEADERSHIP 16
Macro trends such as climate change, urbanization
and resource constraints are changing the world.
We are making our strategic choices against this
backdrop. We have assembled the right mix of
businesses, products and services, and our scale
and scope make us capable of transforming what
it means to be an industry leader. Living our
commitment to responsible leadership, we are
strategically investing our 146-year heritage of
success and talent to create a more sustainable
future for our business, society and the
environment.
CORPORATE DATA | 17
This integrated annual report and the 2016 online sustainability supplement at www.ingersollrand.com/sustainabilitysupplement is produced in accordance with the G4 framework established by the Global Reporting Initiative (GRI) and reports on our financial and non-financial performance for the 2016 fiscal year. For more information on GRI, please visit www.globalreporting.org. To ensure the quality of our environmental, health and safety data, we assure selected data with a third-party provider. The results of this assurance can be found in our online sustainability supplement at www.ingersollrand.com/sustainabilitysupplement. At the time of publication, assurance of our environmental and safety data from operations was not yet complete and the data presented in this document is subject to change. This annual report, including the letter to shareholders, contains “forward-looking statements,” which are statements that are not historical facts, including our ability to address environmental and social challenges, the future success of our operational excellence initiatives, our future financial performance, our growth and our positioning in and the performance of the markets in which we operate. These statements are based on currently available information and our current assumptions, expectations and projections about future events. While we believe that our assumptions, expectations and projections are reasonable in view of the currently available information, you are cautioned not to place undue dependence on our forward-looking statements. Forward-looking statements speak only as of the date they are made and are not guarantees of future performance. They are subject to future events, risks and uncertainties — many of which are beyond our control — as well as potentially inaccurate assumptions that could cause actual results to differ materially from our expectations and projections. You are advised to review the factors described under the captions “Risk Factors” and “Management’s Discussion and Analysis of Financial Conditions and Results of Operations” in our Form 10-K for the fiscal year ended December 31, 2016, and any further disclosures we make on related subjects in materials we file with or furnish to the SEC. We do not undertake to update any forward-looking statements.
SHAREHOLDER INFORMATION SERVICES
The company’s 2016 Annual Report on Form 10-K
as filed with the United States Securities and Exchange
Commission, and other company information, is
available through Ingersoll Rand’s website,
www.ingersollrand.com. Securities analysts, portfolio
managers and representatives of institutional
investors seeking information about the company
should contact:
Joe Fimbianti
Director, Investor Relations
704-655-4721
ANNUAL GENERAL MEETING
June 8, 2017, 2:30 p.m.
The K Club
Straffan, Co. Kildare
Ireland
NEW YORK STOCK EXCHANGE
TRANSFER AGENT AND REGISTRAR
Computershare
Telephone Inquiries: 866-229-8405
Website: www.computershare.com/Investor
Address shareholder inquiries with standard priority:
Computershare
P.O. Box 43006
Providence, RI 02940-3006
Address shareholder inquiries with overnight priority:
Computershare
250 Royall Street
Canton, MA 02021
CORPORATE DATA

1 | TABLE OF CONTENTS
SustainingGlobal Leadership2016 ANNUAL REPORT
2017 NOTICE AND PROXY STATEMENT
4 | CORPORATE DATA
Ingersoll Rand (NYSE:IR) advances the quality of life by creating comfortable, sustainable and efficient
environments. Our people and our family of brands—including Club Car®, Ingersoll Rand®, Thermo King® and
Trane®—work together to enhance the quality and comfort of air in homes and buildings; transport and protect
food and perishables; and increase industrial productivity and efficiency. We are a $13 billion global business
working together for enduring results.
We are committed to using environmentally conscious print practices. ©2017 Ingersoll Rand
Ing
ersoll R
and
Sustain
ing
Glo
bal Lead
ership
20
16
AN
NU
AL R
EP
OR
T2
01
7 N
OT
ICE
AN
D P
RO
XY
STAT
EM
EN
T