inheritances and inequality of opportunity · pdf fileinheritances and inequality of...
TRANSCRIPT

INHERITANCES AND INEQUALITY OF OPPORTUNITY IN
WEALTH∗
Juan C. PalominoUniversidad Complutense de Madrid (Spain) EQUALITAS and CEDESOG
Tel. +34 916 710 784 E-mail: [email protected]
Gustavo A. MarreroUniversidad de la Laguna (Spain), EQUALITAS and CEDESOG
Tel. +34 922 277 798 E-mail: [email protected]
Juan G. RodrıguezUniversidad Complutense de Madrid (Spain), EQUALITAS and CEDESOG
Tel. +34 913 942 515 E-mail: [email protected]
March 5, 2017
“There’s nothing wrong with inherited wealth... if you melt the silver yourself”The upper classes. Luke Haines (The Auteurs)
Abstract
While the analysis of inequality of opportunity (IO) in income has flourished in recent years, the study ofwealth opportunity has not seen the same development. Recent findings about the historical trends andlevels of wealth inequality have not been accompanied by advances in the study of the ’unfairness’ of thatinequality.
This paper tries to contribute to that task using unique data from Spain that contain informationabout income, wealth and external circumstances (gender, parental occupation and inheritances) andapplying a non-parametric version of the ex-post IO method proposed by Lasso de la Vega et al. (2017)to compute IO in wealth and income for Spain in 2011.
We find wealth IO to be higher than IO in income, even in terms relative to their respective totalinequality (IO ratio). IO in wealth can represent up to 48.97% of wealth inequality, compared to a 33.46%IO ratio in income. Our results also show that this higher level of IO in wealth is mostly caused by theeffect of inheritances, who can be associated to more than one third of overall IO in wealth.
JEL classification: D31, D63, I24 Keywords: Inequality; Inequality of opportunity; Income; Wealth ; Inher-itances; Spain
∗The authors acknowledge the financial support of the Ministerio de Economıa y Competitividad of Spain (Palomino andRodrıguez through project ECO2013-46516-C4-4-R and Marrero through project ECO2013-48884-C3-3-P), from Comunidad deMadrid (Spain) under project S2015/HUM-3416-DEPOPORCM and from Fundacion Caja Canarias (Spain).)
1

1 Introduction
The debate about inequality has traditionally focused on the analysis of income. Originally, centered
only on the levels and trends of inequality of the income distribution and, more recently, also on
the ’unfair’ part of income inequality associated with initial circumstances and not with individual
decisions or effort, i.e., inequality of opportunity (IO). In inequality and IO analysis wealth has
traditionally played a rather minor role. Firstly because statistics on income, both at the macro
level (from national accounts) and at the micro level (from the relatively abundant income surveys)
were more accessible to researchers than those on wealth. And, secondly, because the impact of
income on subjective well-being was thought to be far more important than that of wealth.1
However, in the last few years, wealth inequality is attracting the attention of researchers and the
general public. New administrative datasets including historic data of national wealth have recently
begun to be exploited, revealing unsettling findings about wealth inequality and its dynamics. Saez
and Zucman (2016) show that wealth inequality in the United States has been increasing since the
late 1970s, after having had a decreasing trend since the 1930s, while Piketty and Zucman (2014)
find that, in the main western economies (U.S., U.K., Germany and France), the wealth-income ratio
has also began to increase steadily since the 1970s, reaching back the levels of the XVIIIth and XIXth
centuries. At the same time, the link between wealth and well-being is being revisited, and some
advantages derived from a higher wealth level are now being explicitly acknowledged. Hochman and
Skopek (2013) show that there is a subjective well-being premium for wealthier individuals, even
within rich countries like Germany or Israel. Shapiro (2004) and Oliver and Shapiro (2006) point
at the far more important and persistent racial wealth gap between whites and blacks in the U.S.
-compared to the income racial gap- linking this gap to access to loans or to education. In this line,
Johnson (2014) highlights the importance that family wealth has in the United States educational
system, for it can -among other things- provide access to better schools located in more expensive
neighborhoods or secure funding for higher education. Finally, global statistics on wealth inequality
and on the accumulated share of wealth owned by the top 1% of the world’s population [Davies
1In the classic discussion about the relative or the absolute nature of subjective well-being, economists and soci-ologists have always used income as the proxy for fulfillment of material needs [Easterlin (1974), Veenhoven (1991),Diener et al. (1993)].
2

et al. (2016)] have had a shocking impact on social media (partly due to their diffusion through the
Oxfam’s report on [Hardoon (2017)) and have put wealth inequality in the spotlight.
Similarly to what has happened in the study of income inequality, a natural evolution of the concern
about the distribution of wealth is to move from the mere analysis of inequality to the analysis of
inequality of opportunity. It is relevant to know not only how unevenly wealth is distributed, but
to what extent that inequality is the consequence of effort and talent or, else, is related to external
prior circumstances that the individual is not responsible for. However, the scarcity of joint data
of wealth and circumstances has probably caused such analysis to be overlooked by researchers and
practitioners up to date. To the best of our knowledge, no systematic work has yet analyzed IO in
wealth using the theoretical framework [Roemer (1993), Fleurbaey (2008), Roemer (2009)] that is
already being used extensively for IO in income [e.g. Lefranc et al. (2008), Checchi and Peragine
(2010), Ferreira and Gignoux (2011), Marrero and Rodrıguez (2012)].
Aiming to fill that gap, in this paper we take advantage of the unique data collected by the Spanish
Central Bank in the Spanish Survey of Household Finances (which, in addition to wealth, includes
the parental occupational category and the inheritances received by the household) and we apply
a non-parametric smoothing method to calculate IO, recently proposed by Lasso de la Vega et al.
(2017). This method allows for a more precise measurement of IO compared to the traditional
ex-post methodology based on fixed intervals (see Section 2).
Our results show that -even with a limited set of circumstances- IO in wealth can represent 50%
of total wealth inequality. Differences gender, parental occupation and the amount of inheritances
received imply different levels of expected wealth, and all of these circumstances matter to inequality
of opportunity. In particular, we find that -controlling for gender and for parental occupation-
considering inheritances can double the measure of inequality of opportunity in wealth.
The rest of the paper is structured as follows. In Section 2, we present the non-parametric method-
ology that we will use to estimate IO. Section 3 describes the properties of our database and our
choices in the selection of circumstances and in the aggregation of wealth and income. In Section 4
we show the results of our IO estimations using different choices and methods. Finally, Section 5
concludes.
3

2 Methodology
The literature has approached the concept of inequality of opportunity from two different perspec-
tives: the ex-ante and the ex post [Fleurbaey (2008)]. The ex-ante approach refers to equality of
opportunity if all individuals face the same set of opportunities regardless of their circumstances,
that is, if the expected outcome for individuals with different sets of circumstances is the same. The
ex-post approach, on the other hand, states that there is equality of opportunity if all individuals
who exert the same degree of effort obtain the same outcome.2 In our analysis, we will implement
a non-parametric version of the ex-post approach proposed by Lasso de la Vega et al. (2017), which
tries to overcome some conflicts in the ex-post estimation generally overlooked by the literature.
In the IO literature, a type is defined as a subset of the population that shares the same set
of circumstances.3 According to Roemer’s pragmatic approach (1993), two people belonging to
different types have tried equally hard if and only if they are on the same rank of their respective
effort distributions. As a consequence, there will be no IO in society when there is not dispersion
of outcome across types for all degrees of effort.
The first step of the ex-post approach is identifying individuals who are comparable in terms of
their degree of effort. Traditionally, scholars have adopted the quantile or tranche criterion, which
assumes that all individuals belonging to different types but in the same tranche (section of the
outcome distribution ordered by effort) exert the same degree of effort. However, the probability of
considering individuals with different degrees of effort as close-equals increases with the size of the
tranche considered. Inversely, choosing narrower tranches ranges reduces the number of individuals
that can be considered close-equals in terms of effort (and, ultimately, the tranche can be so small
that all individuals could be considered essentially different and, therefore, there will be no close-
equals to compare with.) To find a satisfactory solution for this problem is not easy, but it seems
reasonable to look for a statistical criterion instead of using a discretional division in standard
2The results obtained using one of the other approach are not always equal and in certain scenarios could beformally inconsistent (see Fleurbaey and Peragine (2013) and Ramos et al. (2015)).
3As we will see in Sections 2 and 4 in our application, if we consider only gender, parental occupational class(low, medium or high) and having or not having received inheritance we would have a total of twelve types, and oneof them would be, for instance, men whose parental occupational class was medium and who have not received anyinheritance.
4

tranches like deciles, ventiles or centiles is as often the case in the literature.
A second related issue arises from the fact that researchers typically consider as the scale of the dis-
persion of outcomes among individuals belonging to the same type and tranche normative irrelevant
(Checchi and Peragine, 2010). Thus, the outcomes of observations in the same type and tranche
are collapsed to their unweighted mean value. By doing this, however, dispersion among those
individuals belonging to the same type and tranche -which implicitly contains potential information
about ’effort’- is ignored.
To deal with these problems, the non-parametric regression framework proposed by Lasso de la
Vega et al. (2017) uses the overlapping optimal bandwidth h to determine which individuals exert
a similar degree of effort. Technically, h is chosen to minimize a distance measure like the Mean
Integrated Squared Error (MISE) in the non-parametric regression of outcome Y on effort (rank)
E. But, what is the economic rationale behind it? Non-parametric regression takes into account
two elements: first, a good fit to the ’true’ curve, which means a low bias (the difference between
the actual and the expected estimated value); and second, the reduction of the volatility of the
estimates (the variance is the standard criterion to measure volatility). These two elements have a
conflicting interpretation in terms of equality of opportunity. The smaller the size of the tranches
or the bandwidth h, the lower the bias. In this case, as we mentioned above, the probability of
considering individuals with similar degrees of effort as different, increases. At the limit, there are
no close-equals and if there is any IO, it is due only to the exact equals (if there is any). On the
contrary, the larger the size of the tranche, the lower the variance. In this case, the probability of
considering individuals with quite different degrees of effort to be similar, increases. At the limit,
all individuals are close-equals and the IO is at its maximum. Optimal bandwidth is computed as
a balance between both elements. Hence, despite that there is no normatively superior criterion
to identify close-equals, using a statistically-optimal based criterion that balances variance and
bias seems better than the ad hoc subjective researcher’s criterion that is typically applied in the
literature. Also, the fact that the non-parametric regression works with overlapping intervals avoids
the paradox that two close observations in terms of effort be considered as different levels of effort
just because they fall at two different sides of the ad-hoc tranche threshold (deciles, centiles, etc.).
In the non-parametric regression, the influence of each observation in determining the expected
5
value of the outcome variable for each level of effort only depends on the distance to the estimation
point and the kernel function used, and no longer on whether it falls in or out of a discretional
tranche division.
Essentially, a non-parametric regression estimates Z = Y |X, a vector comprising all the weighted
local averages of Y at each point x ∈ X. These averages are obtained using neighboring observations,
which are weighted using a smoothing function that relates negatively to the distance (measured in
terms of X) that separates them from the evaluated observation. At each point x ∈ X:
z(x) =
n∑i=1
Wi(x) · Yi (1)
Among the possible smoothing functions, we will use the classic Nadaraya–Watson estimator [Nadaraya
(1964), Watson (1964)]. The Nadaraya–Watson (NW) weighting estimator is:
Zi = WNWi (x) =
∑ni=1Kh(x− xi) · yi∑n
i=1Kh(x− xi)(2)
where Kh is a kernel function K with a bandwidth h. The shape of the kernel weights is determined
by K, whereas the size of the estimation is parameterized by h. We will use the NW estimator with
a normal or gaussian kernel function and an optimal bandwidth h. Lasso de la Vega et al. (2017)
show that the Nadayara-Watson non-parametric regression smoothing has the desirable property
of dominance: the theoretical outcome distribution Z = Y |E Lorenz-dominates the original Y dis-
tribution, avoiding any misinterpretation of the difference in inequality between both distributions.
To obtain the optimal bandwidth h we minimize the mean integrated squared error using a normal
operator for the kernel weighting, and including also the sampling weights of the survey in the
computation.4
The optimal bandwidth and the overlapping intervals allow to the non-parametric regression method
to tackle the problem of discretional tranche selection and to account for the dispersion of the
4We have used the npksum function in the R ’np’ package [Hayfield et al. (2008)] in order to obtain the optimalbandwidth using cross-validation and, in the second step, to produce our non-parametric regressions. We are gratefulfor technical advice to Jean Opsomer and, in particular, to Luc Clair and Jeffrey Racine for their valuable help inprogramming the optimal bandwidth and regressions computation accounting for the sampling weights.
6

effort, while still being able to decompose overall inequality in inequality of effort and inequality
of opportunity. In fact, Lasso de la Vega et al. (2017) show that this method generalizes previous
standard ex-post decompositions used in the literature, and that the traditional ex-post method
could be a considered a particular case of non-parametric regression (the regressogram) in which
the weighting function is a constant that gives all observations in the tranche the same importance
(thus obtaining the mean value as an estimate) and that considers non-overlapping ad-hoc intervals
(deciles, centiles, etc.). 5
Applying non-parametric regression to our data, the smoothed distribution Z = Y |E is obtained
conditioning the outcome variable to our effort proxy (the outcome rank of the individual within
circumstance-peers). This distribution can therefore be considered circumstance-free, and its in-
equality can be considered inequality of effort (IE):
IE = I(Z), (3)
where I(Z) is the inequality index of our choice applied to variable Z. Subsequently, inequality of
opportunity will be the remaining part of total inequality obtained subtracting I(Z) from overall
inequality of the outcome variable I(Y ):
IO = I(Y )− I(Z), (4)
In relative terms, dividing all the expression by I(Y ) we can decompose total inequality into its
effort and opportunity components:
1 =IE)
I(Y )+
IO
I(Y ), (5)
5For reference, we have in the results section included the estimations with this type of estimation (regressogram)together with our non-parametric regression estimates. We have used two ad-hoc tranches division: deciles and theoptimal bandwidth tranche. Note that the regressogram, even when it uses the optimal bandwidth tranche, missestwo key features of the non-parametric regression estimation: accounting for the dispersion of effort via the weightingfunction, and considering overlapping intervals. See Tables 5 to 8 for the estimations of the non-parametric regressionmethod, Tables 9 to 12 for the estimation using the regressogram with deciles, and Tables 13 to 16 for the estimationusing fixed tranches with the optimal bandwidth range.
7

3 Database
The 2011 Spanish Survey of Household Finances (Encuesta Financiera de las Familias or EFF) is
the fourth wave of a series of surveys run by the Spanish Central Bank, which collects detailed
information on consumption, income and wealth from a representative sample of the Spanish pop-
ulation. A remarkable feature of this survey is that, thanks to the collaboration of the Tax Office
and the National Statistics Institute (INE), the EFF is able to oversample wealthy households on
the basis of individual wealth tax records. Since the distribution of wealth is strongly skewed and
certain types of assess are held by only a small share of the population, oversampling is crucial for
the representativeness of the population and of aggregate wealth [Bover et al. (2014)]. In addition,
the Spanish EFF gathers unique information on parental occupation and on received inheritances
and gifts, which is fundamental in the analysis of inequality of opportunity.6
We have included in our sample all households whose head -defined in the survey as the ‘reference
person’ responsible of the economic affairs of the household- is over 30 years old, leaving out younger
families who could still not be fully integrated in the labor market. Aiming to gather all possible
information about inheritances, we have not established an upper threshold for age. Moreover, since
receiving or not an inheritance depends not only on your parental wealth but also on your age, we
have replicated our analysis in a subsample of only individuals older than 60, in order to account
for the effect of inheritances among comparable individuals that are old enough to be very likely to
inherit.
Our main target variable is net household wealth, which we compute aggregating wealth from
different sources: historic value of real state (including main house and other properties), actual
value of durable goods (equipment and transportation means), jewelry, businesses and financial
assets (stocks, shares in funds, public and private bonds, pension plans). We subtract the pending
value of outstanding loans in order to obtain net wealth (see descriptives for the net wealth variable
in Table 2). Our secondary target variable is income, which we have computed adding different
6The EFF is included in the European Household Finance and Consumption Survey (HFCS) run by the Eurosystem.Unfortunately, questions about parental occupation have not been included in the core homogeneous questionnaire ofthe European survey and is not available for all the other European countries. As long as these variables are available,our analysis could be extended to other countries in the Eurosystem.
8

sources of annual income referring to the previous year: labor income (both monetary and in
kind), unemployment benefits, income from self-employment, income from retirement benefits or
other pensions, interests from accounts, net profits from business managed and participated by
household members, and dividends from stocks. In order to better approach to the ’permanent’
income and avoid transitory shocks, we have excluded extraordinary sources of income, such as
lottery, inheritances, prizes, job-firing compensations or transfers received from third parties or the
government that were not included in the concepts stated above. The basic descriptives for the
income distribution are in Table 3.7
Out of the 6106 households in the EFF, 5996 had a head over 30 years old. From that sample we
also leave out households that had negative wealth or income, which represent 162 observations
(2.7% of the sample). This excludes atypic observations of wealth and income in the bottom part
of the distribution, and allows us to use inequality indices that only admit positive values (such as
the Mean Logarithmic Deviation or Theil-0 index). Thus, our main sample will then be formed of
5834 observations, while the subsample of individuals older than 60 will include 3198 observations
(see Table 1).
The circumstances that we consider are the gender, the highest parental occupational class of the
household head, and the inheritances received by the household. Since having too many values for
a certain circumstance would produce a high number ’types’ with an reduced number of observa-
tions per type, we obtain three occupational classes collapsing the broad occupational categories
of the Spanish Clasificacion Nacional de Ocupaciones (CNO).8 The first group is formed by the
categories 1, 2 and 3 of the CNO, that include management, scientific and intellectual technicians
and professionals, and support technicians and professionals. The second group includes an ample
range of middle occupational class categories: clerical workers, sales workers, skilled agricultural
workers, qualified handcraft workers, machine operators, and armed forces. The low occupational
7We found that equivalizing wealth and income with the squared root scale did not alter significantly our results.Consistently with what Bover (2010) finds for inequality measures, wealth distribution is affected by householdstructure, but it is not sensitive to considering the size of the household. We have therefore used household as theunit of analysis throughout.
8The CNO is based on the International Standard of Occupations (ISCO-08). Our aggregation in three occupationalgroups is similar to the one proposed by Erikson et al. (1979) when collapsing their occupational class schema intothree occupational levels.
9
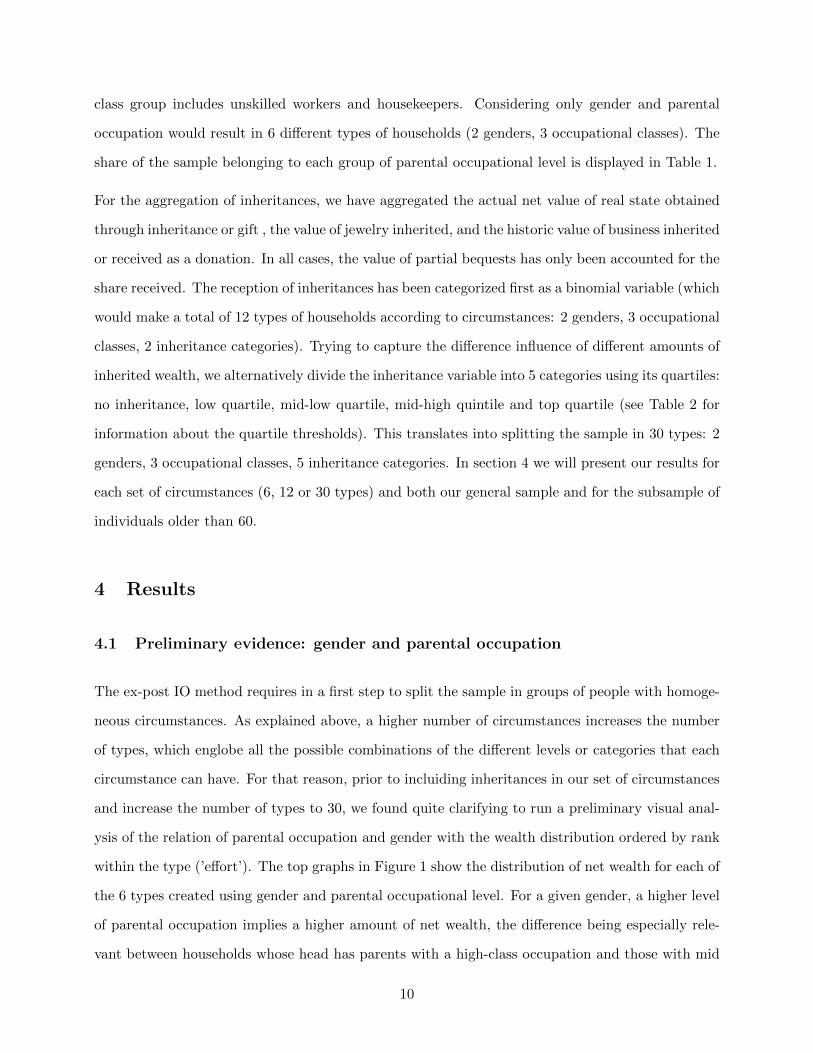
class group includes unskilled workers and housekeepers. Considering only gender and parental
occupation would result in 6 different types of households (2 genders, 3 occupational classes). The
share of the sample belonging to each group of parental occupational level is displayed in Table 1.
For the aggregation of inheritances, we have aggregated the actual net value of real state obtained
through inheritance or gift , the value of jewelry inherited, and the historic value of business inherited
or received as a donation. In all cases, the value of partial bequests has only been accounted for the
share received. The reception of inheritances has been categorized first as a binomial variable (which
would make a total of 12 types of households according to circumstances: 2 genders, 3 occupational
classes, 2 inheritance categories). Trying to capture the difference influence of different amounts of
inherited wealth, we alternatively divide the inheritance variable into 5 categories using its quartiles:
no inheritance, low quartile, mid-low quartile, mid-high quintile and top quartile (see Table 2 for
information about the quartile thresholds). This translates into splitting the sample in 30 types: 2
genders, 3 occupational classes, 5 inheritance categories. In section 4 we will present our results for
each set of circumstances (6, 12 or 30 types) and both our general sample and for the subsample of
individuals older than 60.
4 Results
4.1 Preliminary evidence: gender and parental occupation
The ex-post IO method requires in a first step to split the sample in groups of people with homoge-
neous circumstances. As explained above, a higher number of circumstances increases the number
of types, which englobe all the possible combinations of the different levels or categories that each
circumstance can have. For that reason, prior to incluiding inheritances in our set of circumstances
and increase the number of types to 30, we found quite clarifying to run a preliminary visual anal-
ysis of the relation of parental occupation and gender with the wealth distribution ordered by rank
within the type (’effort’). The top graphs in Figure 1 show the distribution of net wealth for each of
the 6 types created using gender and parental occupational level. For a given gender, a higher level
of parental occupation implies a higher amount of net wealth, the difference being especially rele-
vant between households whose head has parents with a high-class occupation and those with mid
10
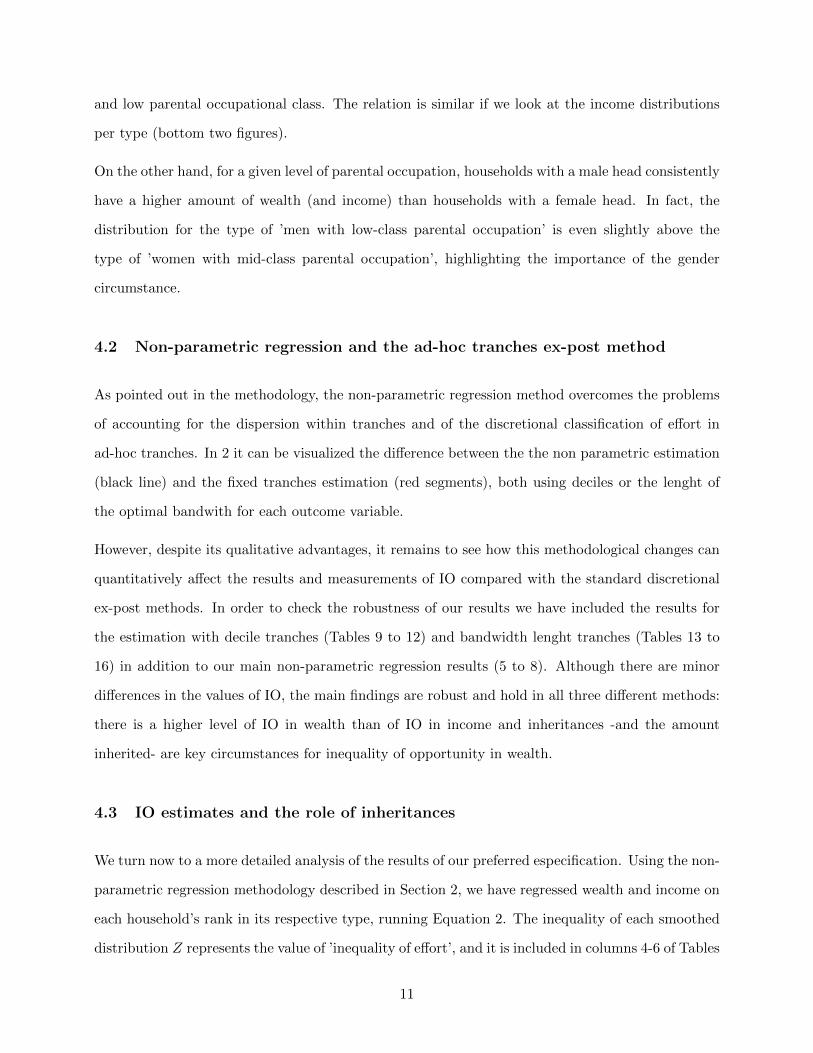
and low parental occupational class. The relation is similar if we look at the income distributions
per type (bottom two figures).
On the other hand, for a given level of parental occupation, households with a male head consistently
have a higher amount of wealth (and income) than households with a female head. In fact, the
distribution for the type of ’men with low-class parental occupation’ is even slightly above the
type of ’women with mid-class parental occupation’, highlighting the importance of the gender
circumstance.
4.2 Non-parametric regression and the ad-hoc tranches ex-post method
As pointed out in the methodology, the non-parametric regression method overcomes the problems
of accounting for the dispersion within tranches and of the discretional classification of effort in
ad-hoc tranches. In 2 it can be visualized the difference between the the non parametric estimation
(black line) and the fixed tranches estimation (red segments), both using deciles or the lenght of
the optimal bandwith for each outcome variable.
However, despite its qualitative advantages, it remains to see how this methodological changes can
quantitatively affect the results and measurements of IO compared with the standard discretional
ex-post methods. In order to check the robustness of our results we have included the results for
the estimation with decile tranches (Tables 9 to 12) and bandwidth lenght tranches (Tables 13 to
16) in addition to our main non-parametric regression results (5 to 8). Although there are minor
differences in the values of IO, the main findings are robust and hold in all three different methods:
there is a higher level of IO in wealth than of IO in income and inheritances -and the amount
inherited- are key circumstances for inequality of opportunity in wealth.
4.3 IO estimates and the role of inheritances
We turn now to a more detailed analysis of the results of our preferred especification. Using the non-
parametric regression methodology described in Section 2, we have regressed wealth and income on
each household’s rank in its respective type, running Equation 2. The inequality of each smoothed
distribution Z represents the value of ’inequality of effort’, and it is included in columns 4-6 of Tables
11

5 and 7. These tables also include total inequality (IT) of the wealth and income distributions in
the first three columns (Theil-0, Atkinson and Gini indices), while the final three columns reflect
the inequality of opportunity level (IO), obtained using Equation 4. Finally, tables 6 and 8 reflect
the IO ratios for wealth and income respectively obtained using Equation 5.
As explained in Section 2, the whole analysis has been run on two different subsets of the population
depending on age. Our baseline estimation (first three rows of each table) includes all individuals
of age 30 or older, while our second estimation (three bottom rows of each table) considers only
individuals of age 60 or older, excluding there younger population less likely to receive inheritances
due to age reasons, regardless of any rationale about their dynastic economic conditions. Also,
in order to capture the contribution of inherited wealth to inequality of opportunity, we have
run our estimations sequentially, considering three different groups of circumstances that produce
different partitions of the population in types. In a first instance, we have excluded inheritances
and used only gender (two categories) an parental occupational class (three categories), obtaining
six different types for the population. In a second iteration, we have included inheritances as a
dichotomic variable, splitting the previous 6 types depending on whether individuals had or had
not received any inheritance, and therefore analysing 12 types. In the last iteration, we also consider
the amount inherited and, using the quartiles of the distribution of inheritance amounts- we split
each of the original 6 types in five (no inheritance, low, mid-low, mid-high and high inheritance),
obtaining a total of 30 types. Each division corresponds to a different row in each table.
A first glance at the first two columns of tables 5 and 7 reveals that, consistently with many other
studies, wealth inequality is greater than income inequality for both of the samples considered and
for all the three inequality indices used. The level of IO is also higher for wealth than for income,
which not surprising given a higher level of total inequality in the distribution. What is more
revealing, however, is the comparison of the IO ratios (6 and 8): in the 6 types specification that
does not include inheritances in the circumstances, the share that IO represents over total inequality
is very similar or even higher for income. When we include inheritances, in the 12 types specification
and, especially in the 30 types (that consider different inheritance sizes), the IO ratio for wealth
increases much more than the IO ratio for income. As we can see in the results, it is the Theil-0 index
which presents the highest variations between the results with different data specifications, followed
12

by the Atkinson (1) index, and with the Gini index (less sensitive to inequality concentrated in the
tails of the distribution) showing smaller and steadier values. Although the results are qualitatively
consistent with all three indices used, we will focus on the analysis of the Theil-0 index values,
which is the most broadly used index in IO literature.
Using the Theil-0 inequality index, in the global sample the IO ratio when considering only gender
and parental occupation is 21.63% for wealth and 23.56% for income; in contrast, when we consider
the size of the inheritance received (30 types) the IO ratio for wealth (38.09%) is far bigger than
the ratio for income (24.66%) which is only very slightly higher. It seems that the possible ’income
effect’ of inheritances is smaller than the direct ’wealth effect’. The importance of the amount of
the inheritance received in the wealth of the household and be graphically visualized in Figures 3
and 3 where are depicted the distributions of wealth and income for each different inheritance type
(by amount), given the other circumstances (men with mid-level parental education in Figure 3 and
men with high-level parental education in 4). The type with higher amounts of inheritances received
(in the top quartile) clearly show a higher net wealth than any other type (even those that have
received a inheritance for a smaller amount) and, to a lesser extent, a higher income. The effect of
a high amount inherited on income is smaller among men with high-class parental education, but
remains relevant when net wealth is the outcome considered.
The age threshold of the subsample has a clear effect on the results. In general, all measures of
IO (tables 5 and 7) and of IO Ratio (tables 6 and 8) are higher for the restricted sample than
for the whole sample counterpart. We believe the results of the older subsample reflect better the
potential effect of inheritances on inequality of opportunity in wealth, for it compares equivalent
individuals who are all potential receivers of bequests.9 This increase is again really significant
when we consider our richest set of circumstances (30 types) that includes inheritance sizes, making
the IO ratio for wealth go up from 38.09% to 48.97%.
9Analysing the effect of inheritances in relatively young people’s wealth is like analysing the effect of tertiaryeducation on the income of people under 30. Some of them may already be working and earning according to theireducational level, but most of them will not.
13

5 Concluding Remarks
It is a well established fact that wealth inequality is higher than income inequality, but little is
known about inequality of opportunity in wealth. Our analysis reveals a higher level of IO in
wealth than in income, even in terms relative to their respective total inequality (IO ratio). In
our preferred specification (excluding younger individuals unlikely to receive potential inheritance,
and considering the size of the inheritance) IO in wealth can represent up to half of total wealth
inequality (48.97%), compared to a 33.46% IO ratio in income.
This higher level of IO in wealth is mostly caused by the effect of inheritances. Without taking them
into account (6 types specification) the IO ratios of wealth and income are very similar (27.55% and
25.77%). The relatively small increase in IO in wealth when including the variable of inheritance
as a ’yes/no’ binary (from 27.55% to 33.11%), compared to the bigger increase when the amount
of the inheritances is taken into account (up to 48.97%) points at the crucial role of the amount
inherited in wealth inequality of opportunity.
We believe these results add another relevant ingredient to debate about inequality in the wealth
distribution. They show that, even with a limited set of circumstances, up to one half of wealth
inequality can be considered beyond the responsibility sphere of the individual, and that inheritances
-especially those of a relatively high amount- represent a key component of inequality of opportunity
in wealth.
14

References
Bover, O. (2010). Wealth inequality and household structure: Us vs. spain. Review of Income and
Wealth, 56(2):259–290.
Bover, O., Coronado, E., and Velilla, P. (2014). The spanish survey of household finances (eff):
description and methods of the 2011 wave. Technical report, Banco de Espana.
Checchi, D. and Peragine, V. (2010). Inequality of opportunity in italy. Journal of Economic
Inequality, 8(4):429–450.
Davies, J. B., Lluberas, R., and Shorrocks, A. F. (2016). Estimating the level and distribution of
global wealth, 2000-14. Technical report, WIDER Working Paper.
Diener, E., Sandvik, E., Seidlitz, L., and Diener, M. (1993). The relationship between income and
subjective well-being: Relative or absolute? Social Indicators Research, 28(3):195–223.
Easterlin, R. A. (1974). Does economic growth improve the human lot? some empirical evidence.
Nations and households in economic growth, 89:89–125.
Erikson, R., Goldthorpe, J. H., and Portocarero, L. (1979). Intergenerational class mobility in
three western european societies: England, france and sweden. The British Journal of Sociology,
30(4):415–441.
Ferreira, F. H. and Gignoux, J. (2011). The measurement of inequality of opportunity: Theory and
an application to latin america. Review of Income and Wealth, 57(4):622–657.
Fleurbaey, M. (2008). Fairness, responsibility, and welfare. Oxford University Press.
Fleurbaey, M. and Peragine, V. (2013). Ex ante versus ex post equality of opportunity. Economica,
80(317):118–130.
Hardoon, D. (2017). An economy for the 99%.
Hayfield, T., Racine, J. S., et al. (2008). Nonparametric econometrics: The np package. Journal of
statistical software, 27(5):1–32.
15
Hochman, O. and Skopek, N. (2013). The impact of wealth on subjective well-being: A comparison
of three welfare-state regimes. Research in Social Stratification and Mobility, 34:127–141.
Johnson, H. B. (2014). The American dream and the power of wealth: Choosing schools and inher-
iting inequality in the land of opportunity. Routledge.
Lasso de la Vega, C., Rodrıguez, J., and Salas, R. (2017). Inequality of opportunity measurement:
the role of effort progressive transfers. Mimeo.
Lefranc, A., Pistolesi, N., and Trannoy, A. (2008). Inequality of opportunities vs. inequality of
outcomes: Are western societies all alike? Review of Income and Wealth, 54(4):513–546.
Marrero, G. A. and Rodrıguez, J. G. (2012). Inequality of opportunity in europe. Review of Income
and Wealth, 58(4):597–621.
Nadaraya, E. A. (1964). On estimating regression. Theory of Probability & Its Applications,
9(1):141–142.
Oliver, M. L. and Shapiro, T. M. (2006). Black wealth, white wealth: A new perspective on racial
inequality. Taylor & Francis.
Piketty, T. and Zucman, G. (2014). Capital is back: Wealth-income ratios in rich countries 1700–
2010. The Quarterly Journal of Economics, 129(3):1255–1310.
Ramos, X. et al. (2015). Approaches to inequality of opportunity: Principles, measures and evidence.
Journal of Economic Surveys.
Roemer, J. E. (1993). A pragmatic theory of responsibility for the egalitarian planner. Philosophy
& Public Affairs, pages 146–166.
Roemer, J. E. (2009). Equality of opportunity. Harvard University Press.
Saez, E. and Zucman, G. (2016). Wealth inequality in the united states since 1913: Evidence from
capitalized income tax data. The Quarterly Journal of Economics, 131(2):519–578.
Shapiro, T. M. (2004). The hidden cost of being African American: How wealth perpetuates inequal-
ity. Oxford University Press, USA.
Veenhoven, R. (1991). Is happiness relative? Social indicators research, 24(1):1–34.
16

Watson, G. S. (1964). Smooth regression analysis. Sankhya: The Indian Journal of Statistics,
Series A, pages 359–372.
17

6 Tables and Figures
Table 1: Database Descriptive Statistics
Sample over 30 years old Sample over 60 years oldObservations 5834 3198
Share of women (%) 39.68 37.52Share with high parental occupational class (%) 27.37 28.02Share with mid parental occupational class (%) 62.34 62.07Share with low parental occupational class (%) 10.28 9.91
Share receiving inheritance (%) 33.77 37.71Age (Mean) 61.01 72.01
Age (Standard Deviation) 14.26 7.36
Table 2: Net Wealth Descriptive Statistics - Euros (rounded to the unit)
Sample over 30 years old Sample over 60 years oldMean 1 317 590 1 560 973SD 4 850 618 4 944 354q10 56 733 84 893q25 150 526 186 889q50 336 457 443 145q75 883 566 1 118 776q90 2 193 514 2 770 527
Table 3: Regular Income Descriptive Statistics - Euros (rounded to the unit)
Sample over 30 years old Sample over 60 years oldMean 71 336 69 851SD 289 936 297 680q10 9 234 8 400q25 16 392 14 000q50 30 800 27 010q75 60 071 56 000q90 119 070 113 278
Table 4: Inheritances Descriptive Statistics - Euros (rounded to the unit)
Sample over 30 years old Sample over 60 years oldMean 415 996 262 179SD 2 501 372 924 025q10 3 543 4 874q25 17 000 18 030q50 80 000 90 076q75 217 450 240 405q90 510 974 500 000
18

Figure 1: Distribution of Wealth and Income for each type (6 types) conditioned torank within type (’effort’)
●
●
●
●●
●● ●●
●
●
●●
● ● ●●● ● ●●
●
● ●●●●
●
●●●
●
●●
●●
●
●●●● ●
●●
●
●●
●
● ●●●● ●
● ● ●●●●●● ● ● ●●●●
●●
●
●●● ●●●●
●●
●●
●● ●● ●●●●●
● ● ●●
●●● ●● ●●
●● ●●
●●●●
●
● ● ●●
●● ●
●●●●●
●
●●●
●
●
●
●
●● ● ● ●
●
● ●●
●● ●●● ●
● ●●
●●●●
●
●●
●● ●● ●● ● ●●
●
●●●
●● ●●
●
●
●●● ●
●●
●
●●
●●
●
●● ●●
●
●●
●
●
● ●●●
●●● ● ●
●
●● ●●●●●
●
● ●●●
●
●
●●
●
●
● ●● ●●● ●
●
●●
●● ●● ●● ●● ●●●
●
●
●
●●
●
●
●●
● ●
●
● ● ●●● ●●
●
●● ●
●●●
●
●● ●●
● ●●
●
●●● ●
●
●●
●
●
●●●● ● ●●●● ●●
●●
● ●● ●
●● ●●●●
●●
● ●●● ●●● ●
●●
●●
●
●
●●
● ●●
●● ● ●● ●● ● ●●
● ●● ●
●
● ●●
●
● ● ●
●
●●
●
● ● ●●●
●
●
●●
●
●
●● ●●●●
●
●● ●●
●
●
●
●
● ●
●
●●●
●
●● ●
●
●●●●
●●● ●● ●
●●
●
●
●● ●
● ●●● ●●
●
●● ●
●
●●●●● ● ●●●
●●●
●
●●●●
●
●●●●
●
●
●● ●●● ● ●● ●
●
● ●
●
●●●
●● ●● ●
●
● ●
●
● ●● ●●● ●●
● ● ●● ●●● ●●●
● ●
●
●●● ● ● ●
●
●
●●● ●● ● ●● ● ● ●●● ●● ●●
●
●
●
●
● ● ●●●
●● ●●
●
●● ●
●
● ●●
●●
●
●
●● ●
●●●●●
●
● ●● ● ●●●●
●● ●● ●●
●
●●● ●●
●
●
●
●
●
●● ●
●
● ●●●● ●
●● ● ●●
●●
● ● ● ●●●●●● ●
● ●●●●
●●
●
●
●●● ●● ●●●● ●●●● ● ●●
●
●● ●● ●
●
●
●
● ●
●
●●
●● ●
●
● ●
●
● ● ●
●
●●
●
●●●●●●
●
●●
●●●●● ● ● ● ●
●●●
●● ●● ●●
●
●●
●
●
●
●●●● ●● ●
●
●●●●
● ●●
●
● ●●●
● ●●●
●●
● ●●
●
●
●
● ●● ●● ●●● ●
●
●●
●●
●● ● ● ●●●●
●
●●
●
●●
●●
● ●●● ●
●
●
●
●● ●●● ●●
●● ●● ●
●
●● ● ● ●●●● ●
●
● ●●●●●
● ●●●●● ●●●
●
●●
● ●●
● ●● ●● ● ●● ● ●●● ● ●●● ● ●● ●●
●●
●
●● ●●
●●
●
●●●●
●●
●● ●●● ●● ●●
●
●
● ●
●
● ●
●
● ●● ●
●
●●●●
●
● ●● ●●
●
●
●●
●●●
●
● ●●● ●●● ●●
●
● ● ●● ●
●
●● ●
●
● ●●
●
●
●●
●●●
●● ●● ● ●●●●
●
●
●
●●
●● ●● ● ●●● ●
● ●●● ●● ●
● ●●
● ●●●
● ●
●
●
●
● ● ●●● ●●●
●●
●●●
●●● ●●●
●●● ●
●● ●●
● ●●
●
●
● ● ●●●●
●
●●●
●●● ● ●
●
●●●●● ● ●
●
●
●
●
●
●●●
●●●
●●
●
●●● ●●●●
●●● ● ● ●
●
● ●●
●
●●
●●
●
● ●
●●
●●● ●●●
●●●
●
●●
●
●
●
●
●●
●
●●●
●●
●
● ●
●
● ●
●
●● ●● ●●●
●
●
●
●●
●
●●
● ●
●
●●
●
●●●
●●●
●●●●● ●
● ●●●●
●
●
●
●● ● ●●
●
●
●
●
●●●
●
●●●●●
●● ●
●
● ●●
●
●
●
●
● ●●
●
●
●●●●●●
●
●●●●
●
● ●●●
●●
● ●●
●
●
●●●
●● ● ●●
●
●● ●●
●
●
●●
●
●●●
●
●●
●●● ●●● ●● ●●● ●●
●
●
●●● ●● ●● ●
●
●● ●
●
●●● ●
●●● ●
● ●
●
●●●●● ●
●●
●
●
● ●
●
●●
●
●●
●●
●●●●
●●
●●
●
●●●
●
●● ● ●
● ●●●●● ● ●
●
●
●●
●●
●
●
●
● ●
● ●●●
●
●
● ●●
●
●
●
●
● ●●
●
● ●●
●
●●●●●
● ●●● ●●●
●
●
●
● ●
●
●
●●
●●●
●
●● ●●
●●
●
●●
●●● ●
●●
●●
●●●
●
●● ●● ●
●
●●
● ● ● ●●
●●● ●
●
●●
● ● ●●
●
●
●● ●
● ●●● ●●● ● ● ●● ●●●● ●●
● ●●●●●●
●●●
●
●● ●●●● ●● ●●
●●●
●
●●●
●
●
●
●
● ●●
●
●●
●●
●●●●
●
●●
●●●
●
●
●
●●
●● ●●
●●
●●
●
●●
●●● ● ●●● ●
●
● ●●
●
●●●
●
●
●●
●● ● ●●● ●●● ●●
●
● ● ●
●● ●
●
●● ●
●
●
●
●●● ●
●
● ●● ● ●
●
● ● ● ●
●
●● ●●
●
●●
●●● ● ● ●
●
●●
●
●●
● ●●
●●● ●● ●●
●
●
●
●●
●
●● ● ●●● ●● ●
●
●●●● ●
●
●
●
●
●● ●
●
● ● ●●
●●●●
●
● ●● ●
●
●
●
●
●● ●● ●●●
●●
●
●● ● ●
●
●
●
●●
●
●●● ● ● ● ●●● ● ●● ● ●
●
●● ●●●
●● ● ●
●●●
●●●●
●
● ●●● ●
●
● ●● ● ●
●
●● ●
●
●
●
●●
● ●● ●● ●● ●● ● ●●●
●
● ● ●●●●
●●● ●●
● ●
●
●
●
● ●●
●
●●●
● ●●
●●
●
●●
●●●
●
●
●
● ●●
● ●● ● ●● ●
●
●
●
● ●●●● ● ●●●
●
● ●
●
●●● ● ●● ● ●● ●●
● ●●
●
● ●● ●
●●
●
●
●●
●●●●
●● ●
●
●
●
●
● ●● ●●● ● ● ●
● ●● ● ●
●
●●
●●
●
● ● ●●
●● ● ●
●
● ●●
● ●●
●
●
●
● ● ●●
●
●
●●●●●● ●
●●●●● ●
●●
●
●
●●
● ●●●
●
●
●
●
●●
●● ●
●●●
●
●
● ●●●● ●●
●
●
●●
●●
●●
●
●●
●
●
● ●●●● ●●● ●● ●●●
●
●●●●●●
●
●● ●
●
●●
●
●
●
● ● ●●●
● ●●
●
●●●
●
●
● ●● ●●
●●
●●●● ●
●● ●● ●
●●● ● ● ●
●●
●
●●
●●
●
●● ●●
●●
●
●● ●● ●●
●
●
●
●
●
● ●● ● ●● ●●
●
●● ●●●●
●
● ●● ●
●
●
●●
● ●
●
● ●● ●
●●
● ●●
●●●
●
●
● ●● ●●
●●
●
●
● ●●●
●● ●●●● ●●● ● ●
●● ●
●
●●●●
●●
●
●●●
●
●● ●●●
●● ●●
● ●●● ●
●
● ●●
●
●
●●●
●
● ●●●
●●●
●
●● ● ●●●● ● ●
●● ●
●
●●●
●
● ●●●●
●
●●● ●●
●●
●● ●●●
●●● ●●● ●● ●
●
● ● ● ●●● ●●
●● ●●
●
●
●
● ● ●● ●●
●
● ●●
●
● ● ●● ●●
●●
●●
●
●●●
●
●● ●● ●
●
●
●
●● ●● ●●●●
●●●●● ●● ●●● ● ●●
●●
● ●●
●
●
●●● ●●
●●●●●
●
●●●
● ●
●
●●●
●
●● ●
●
●●●
●
●
●● ● ●●●
●
● ●●● ●● ●
●
●●● ●
●
●● ●●
●●
● ●
●
●● ●●
●
●●● ●● ● ● ●●
●
●●●●
●● ●● ●
●
●
● ●●
● ●●●
●● ●● ● ● ●
●●
●
●
●●
●●
●
●
●●● ●● ●● ●● ●●● ●
●●●●● ●●● ● ● ●
●●
●● ●
●
●●●● ● ●
●
●● ● ●● ● ●● ● ● ●●
●
● ●
●
●●●●●
●●
●
●●●●
● ●● ●
●
● ●
●
●●●● ● ●●
●● ●●
●●●
● ●● ●●
●
●
●
● ●● ●● ●●
●
●●
●
●
●● ●●
●
●● ●
●
●
●
● ●●
●
●
●
● ●●
●●
●
●
●
●
●●●●● ●●
●●●
●
●
● ●●●●●●
●
● ●●● ●● ●
●●
●●
●●
●
●●
●●
●● ●●●● ●● ●
●●
● ●● ●●
●● ●●
● ●● ●●
●●●●
●
● ●● ●●●●● ●●●
●●● ●● ●●
●● ●●
●●●●● ●
●
●
● ●● ●●●
●●
●
●
●
●● ●●●
●
●● ●● ●●
●●●
●
●● ●●
●● ●●●●
●● ●
●
● ●
●
● ●● ●●●
●
●●● ●●●● ●●● ●
●●
● ●● ● ●●●
●
●●
●●
●●●
●
●
●● ●● ●
●● ● ●● ●●
● ●● ●●
●
● ● ●●● ●
●● ●
●
●
●●● ●● ●
●● ●● ● ● ●
●
●●●● ● ●●
●●● ●
●
●
●●●●● ●●●
● ●
●●● ● ●
●●●●
●
●
●●
●
●●●
●
●
●
●●
● ●
●
●●
●
●●● ●
●
●●
●● ●
●
● ●● ●
●
●
●
●●● ●● ●●
●
●●●
● ●● ●
●
●● ●●● ●
● ●●
●● ●●●●●
●●●● ●
●
● ●● ●●●
●●
● ●
●
● ●● ●● ●●●● ●● ●
●
●●●● ● ● ●● ● ●●● ●
●●
●
● ● ●● ●●
●●●●● ●●
●
● ● ●●● ●
●
●
●
● ●● ●
●
● ● ● ●●●●●
●
●
●●
●
●● ● ●
●
● ●
●
● ●
●
●
●
●●
● ●●
●
● ●●
●
●● ● ●●
●
●●● ●
●●●
●
●●●
●●●
●
●●
● ● ● ●● ● ●
●
●
● ●
●
●
●
● ●
●
● ●●
●
●
●●● ●●
●● ●● ●●● ●●
● ●●●
●
●●
●●
●
●
●● ● ●
●
●● ● ●● ●●
●
● ●●●
● ●● ●● ● ●●
●
●●● ●●
●●
●
●●●
●
●
●● ●
●
●
●
● ● ●● ●● ●●
●
●● ●●
●
● ●● ●
●●
●
●
●
●
●●● ●●
●● ● ●●
●
●
●
●
●
●●●●● ●●●●● ●● ●●● ●
●
● ● ●●●●●
● ●●●
● ●● ●● ●● ●●●
●● ● ●
●
●●
●
●●
●
●●●
●●●● ● ●●
● ●● ●● ●●● ●
●
●
●●● ●● ● ●
●
● ● ●●
●
● ●● ●● ●●● ●●●● ●
●●
●
●●
●
●●●
● ●●
●●
●●
●
●●
●
● ●●● ●● ●● ●●●●
● ● ● ●●
●
●●● ●● ●
●●●
●●
●
●●
●●
●
●●●
●
●
●
●●●
●
●
●● ●● ●● ●●● ● ●● ● ●●●●
●● ●●
●
●
●
●
●
●
● ● ●●●
●
●
●●
●
●●● ●●●●●● ●●●●
● ●● ●
●●
●
●●
● ● ● ●●
●
●●
●●
● ●● ● ●● ●
●
●
●
● ● ●● ●●
●
●● ● ●●
● ●●●●●
●
●
● ●●●●●●
● ●
●
● ●
●●●
● ●● ●
●
●● ●●
●●
●●
●●
● ● ●●●
●
●●●● ● ● ●● ●●
●
●● ●●●● ●● ●●
●● ●
●● ●
●●●●●●
●● ●● ●● ●●●
●
●
●
● ●● ● ●
●
●●●●
● ●●●●● ● ●●
●
●●
●●● ●● ● ●● ●●● ● ●●●● ●● ●●
●
●
●
●
●
●● ● ●●● ●● ●
●
●● ●● ●●●● ● ●
●●
●● ● ●●
● ●●
●
●● ● ●
●
●● ●● ●
●
● ● ●●●● ●● ●●
● ●●● ●●●
●● ●●●
●●●
●● ●● ● ●●
●●
●●
● ●●
●●
●
●● ● ●●● ● ●●●
●
● ●●
●●
●●
●●
●
●
●
●
●
● ●
●
●●●
●●
●
● ●●●
●
●● ● ●●
●
● ●
●
●●●● ● ●
●
● ●● ●●
● ●
●
●●●
● ●
●
●● ● ●●
●●
●
● ● ● ●●●
●
●●
●
●
●●●
●
●
●●●
●●
●
●
●●●●●
●
●
● ●●●
●●●
●
●●
●
●
●●
●●●●
● ●● ●●●
●
● ●●
●●
●
●●●●
●● ●●
●● ●
●
●●
●
●● ●
●● ● ●●●● ●●●●
●
● ●● ●● ● ●●
● ●●
●●
●
● ●
●
●●
●●●● ● ●●
●
●●●●
●
● ●● ●●● ●●●●● ●●
●
●●
●
● ●
●●
●● ● ● ●
●
●
●
●
●●
●●
●●●● ●●
●●● ●●
●●
●●●
●
●● ●●●
●
●
● ●
●
●
●
●●●
●●
●●
● ● ●●
●●
●
●
●●● ● ●
●
●
● ●● ●
●●
● ●●
● ●● ●
●
●●
●
● ● ● ● ●● ●●● ● ●
●
●●
●●●
● ●●●●
●● ●●
●●
● ● ●●●●● ●● ●● ● ● ●● ●●
●●
●
●●●●
●●●
●
●
●
●●
●
●
●● ●
●
●
●
●●● ●● ● ● ●
●
● ●● ●
●
● ●●●
●●
● ●● ●●
● ●●●●
● ● ●●
●● ●●●
●
●● ● ●●●
●
●
● ●●
●
●● ●
● ●
●
●● ●
●
●
●●
●●●●
●●
●● ●
●
●● ● ●● ●● ● ●
●●●
●● ● ●●●
●
●● ●● ●
●●●● ● ●● ●● ●●● ●● ● ● ●●
●
●
●● ●●●●●● ●● ●●
●
● ●● ●● ●● ●●●
●●
●
●●
●
●●
●
●● ● ●● ●● ●●●
●
●
●●
●●
● ●
●
●● ●●● ● ●●
●
●
●● ●● ●●
● ●●●●
●
●
●●●
●●●
● ● ●
●●
●●
●● ●
●●
● ●
●●
● ● ●●
●
● ●● ●● ● ●●
●●● ●
●
●● ●●●●●
● ●●● ●
●●
●●●
● ●●●
●
●●● ●● ●
●
●● ●● ●●
●●
●
●
●●
●●
●
●
● ●●
●●
●
● ● ● ●●
●
●●●
●
● ●●
● ●● ●● ●●
● ● ●● ●
●
● ●●●●
● ● ●
●
●● ●● ●
●
● ●●●
●●
●
●●●
●
●
●●
●
●
●●●
●
● ●●● ●
●
●
●
●
●●
●
●
●● ●●
●
● ● ●●
●
● ● ●●●●
●
●
●●
●
●●
●●
●
● ●● ●●
●● ● ● ●●● ●●
●
● ●●● ●●●
●● ●●
●●●
●
●● ● ●● ● ●●
●●●
●
● ●● ●● ●● ●●●●
● ●●
●
●
●
●
●●● ●
●●
●●●●
●
●
●
● ●● ●● ●● ●●●
● ●
●
● ●●
●● ●● ● ●●●●
●
● ●●●
●
● ●●●●
●●
● ● ●
●
● ● ●● ●
●
●● ● ●●● ● ●● ●
●
● ●● ●●●●
●
● ● ●●
●
●●
●
●●● ●● ● ●●
● ●●
● ● ●● ●● ●●●●
●
●●●
● ●● ● ●●●
● ●● ●●
●
●
●
●● ●
●●
●
●● ●●● ●
● ●
●
●
●
● ●
●● ●
● ● ●●
●
●
●● ●●●●
●
● ●● ●
●
●● ●●●
●
●
● ●● ●● ●●
●
●●
●
●●
●●●
●●
●
●●●● ●●
●●
●
●●
● ●●● ●●● ●
●
●●●
●
● ● ●●●
●●
●
●
●●
● ●
●● ●● ● ●● ● ●
●●●
●
●● ●● ●
●
●
●● ●● ● ●●
●●
●●
● ●●●
●
●● ●
●
●
●●●●
●
●●
●
● ●● ● ●●● ● ●
●
●●●● ●● ● ●● ●
●●
●●●
● ●
●●
●
●
●
●●
●
●● ●
●
●●●●
●● ●
●
●
●
●
●
● ●● ●● ● ● ●●● ●●
●
●
● ●● ●●●
●● ●●●●●
●●●
●
●
●
● ●●● ●●●
●
●
●● ●● ●●
● ●● ●●●●●
● ●●
●●●●
●●●● ●
●
●●●
●
●●●●
●●
●●
●●●
●
●
● ●●
●● ●● ●● ●●● ●● ●●
●
●●
●●● ●
● ● ●
●
● ●●● ●●
●
●
●●
●●
●
●●
● ●●
●
●●
●
●●
● ●● ●●●
●● ●●● ●●●●● ●●
●
●
●
●●●
●●●
●
●
●
●● ●
●
●
●
● ●
●
●●
●●● ●● ●●
●● ●● ●●
●
●● ●●● ● ● ●
● ● ●
●
●
●
●
●
●
●
●●●
●
●●
● ●●●●
●●● ● ●
● ● ● ●● ●● ●
●
●
●●●
●
●●●
●●
●
●
● ● ●● ●●
●
●
●
●●● ●●
● ●●
● ●●●●
●●●
●● ●
●
●●
●
●●●
● ●● ●
●● ●
●
● ●
●
●● ●●●● ● ● ●●
●
● ●●
● ●
●●
●
●
●●
● ●●● ●
●
●●
● ● ●●
●
●●
● ●● ●●
● ●● ●●● ●●
●●
●
●
●
●
●● ●●●● ●●● ●● ● ●●
●●
●
●
●●
●
●●●
●●● ● ● ●
●
● ●● ●●●● ●● ●●●
● ●
● ●● ●●
●● ●
●●● ●● ● ●
●●●
● ● ●●● ●
●● ●
●
●
●
●●
● ●● ● ● ●
●
●
●
●
●●
●
●
●
● ●●● ●● ●
●
●
●
●● ● ●● ●● ●●
● ●● ●● ● ● ●●
●
●● ●● ●●
●
●●
●● ●● ● ● ●●
● ●
●●
● ●●
●
●
● ● ●● ●●
●●●
●●
●
●● ●● ● ●
●
● ●●●●
● ●
●●
●
●
● ● ●
●
●●●
●
●●
●
●● ●●
● ●●●● ●● ●
●
● ●●●●
●● ●
●
●
●
● ●
●
●● ●●● ● ●●
●●●
●
●●
●
● ●● ●
●
● ●● ●●
●●● ● ● ●● ●●
●
●● ●● ●● ●●
●
●
●●
● ●●
●
●
●●●
● ● ●●
●●●
● ●● ●●● ●●●●
●● ●●
●
● ●●
●● ● ●● ●
●
●
●●● ●
●●
●
●● ●●●● ●● ●●
●
● ● ●
●
●●●
●●● ●●
●
●●
●
●●
● ●●●●
●
●● ●
●
●
●
● ●
●●●
●
●●● ●
●●●● ● ● ●
●●
●●
●
●●● ● ●
●●● ●●
●●●● ●● ●● ●
●●● ●●
●● ●
●● ● ●●
●●
● ●
●
● ●●
●
●
● ●●
● ● ●●
●
● ●
● ●●
●
● ●● ● ●●
●
●
●
● ●●● ●●
●
●
●
●● ● ● ●● ● ●● ●
●●● ●● ●
●
●●●●
●●
●
●
● ●●
● ●●●● ●●
●
●●● ●● ● ●●●●●● ●● ●
●
● ●●●● ● ●●● ● ● ●●
●●●
●
● ● ●
●
●
●
●●●
●●● ●
● ● ●●
●
●
●
● ●●●
●
●
●● ●● ●●
●●
●●●●
●
●
●
● ●● ●●
● ●●
● ●●
●
●
●
●
●
● ●●●
●●
●●
●
●●
● ●●
●
●●● ● ●
●
● ● ●●● ●●● ● ●●●●
●
●● ●●●
●●
●●● ●
● ●● ●●● ●●●
●
● ●● ●
●● ●●●●●● ●●
● ●●●
●●
●
●●● ●
●●●●
●
●
●● ●
●
●● ●●
●
●● ●●●
●●●●● ●
●● ● ●
●● ● ●●●
● ●●● ● ●
● ●● ●● ●●●
●
● ●●
●●
● ●●
●● ● ●●●● ● ●●
●●● ●
●● ●●●● ● ●● ●
●
● ●
●
● ●
●
●●
●● ●●●
●●
●
● ●●
●● ●
●
● ●● ●
●● ●●●●●
●● ●●●●
●●
●●● ● ●●
●
●●●● ● ●● ●● ●●
●
●0
10
20
30
40
50
0.00 0.25 0.50 0.75 1.00
Rank within Type
Wea
lth (
mill
ions
of E
uros
)
Types
●
●
●
●
●
●
1
2
3
4
5
6
Wealth/Effort distribution across 6 Types Obs. < 50 million euros
●
●
●
●
● ●
●
●
●
●●
●
●
●
●●
●
●
●
●
●
●
●●
●●
●
●
●
●
●
●●
●
●
●●
●
●
●
●
●
●●
●
●
●
●
●
●
●
●
●
●
●
●
●●
●
●
●●
●
●
●
●●
●
●●
●●
●
●
●
●
●
●
●
●●
●
●
●●
●
●
●
●
●●
● ●●
●
●
●
●
●
●
●
●
●
● ●
● ●
●
●
●
●
●
●
●
●●
●
●●
●
●
●
●
●
●●
●● ●
●●
●
●
●
●
●
●
●
●●
●
●●●
●
●
●
●
●
●●●
●
● ●●
●
●
●
●
●●
●
●
●
●
●
●
●
●
●
●
●
●
●
●
●
●
●
●●
●
●
●
●
●
●
●
●
●
●
●●
●
●
●
●●
●
●
●
●
●
●
●
●
●
●
●
●
●
●
●
●
●
●●
●●
●
●
●
●
●
●
● ●●
●
● ●
●
●
●
●
●●
●
●●
●
●
●
●
● ●●●●
●
●
●
●
● ●
●
●
●
●
●
●●
●
●
●
●
●
●●
●
●●
●
●
●
●●
●
●
●
●
●
●
●
●●
●
●
●●
●
●
●
●
●
●●
●
●
●
●
●
●
●
●●
●
●
●
●
●
●
●
●
●
●
●
●
●
●
●
●
●
●●
● ●●
●
● ●●
●
●
●
●
●
●
●
●●
●
●
●
●
●
●●
●
●
●
●
●
●
●
●●
●●●
●
●
●
●
●
●
●
●
●
●
●
●
●
●
●●
●
●
● ●
●
●●
●
●
●●
●●
●
●
●
●
● ●
●
●
●
●
●
●
●
●
●
●
●
●●
●
●
●
●
●●
●
●
●
●●
●
●
●●
●
●
●●
●
●
●
●
●
●
●●
●
●
●●
●
●
● ●
●
●
●●
●
●
●
●●
●
●
●
●
●
●
●
●
●
●
●
●●
●
●
●
●● ●●
●
●●
●
●
●●
●
●
●
●
●
●●●
●
●● ●
●●
●
●
●
●
●● ●●
●
●
●●
●
●
●
●●
●
●
●
●●
●
●
●●
●
●
●
●
●
●
●
●
●●
●
●
●●
●
●
●
●
●
●
●
●
●● ●●
●
●
●●
●
●
●
●
●
●
●
●
●
●
● ●
●
●
●●
●
●●
●
●
●
●
●●
● ●●
●
●
●
●●
●●●
●
●
●
●
●
●
●
● ●
●
●●●
●●●
●●●
●
● ●●
●
●●
●
●
●
●
●
●
●
●● ●●
●
●
●● ●
●
●●
●
●●
●●
●
●
●
●
●
●
●
●●●
●
●●
●
●
●
●
●●●
●
●
●
●
●
●
●
●
●
●
●
●●
●
●
●●●
●
●
●
●
●
●
●
●
●
●
●
●
●
●
● ●●
●
●
●
●●
● ●
●
●
●
●
●
●
●
●
●
●
● ●
●
●●
●
●
●
●
●
●
●
●
●
●
●
●
●
●
●
●
●
●●
●
●●
●
●
●
●●
●
●
●
●
●
●●
●
●●
●
●
●
●
●
●
●
●
●●
●
●●
●
●●
●
●
●
●
●
●
●
●
●
●
●
●
●
●
●●
●
●● ●
●●
●
●
●
●
●
●
●
●
●
●
●
●
●
●
●
●
●
●
●●
●
●
●●
●
●● ●
●
●
●
●
●
●
●
●
●
●
●
●
●
●●
●●●●
●
●●
●
●
●●
●
●
●
●
●
●
●
●
●●
●
●●
●●
●
● ●
●
●
●
●
●●
●
●
●
●
●
●
●
●
●
●
●●
●
●●
●●
●
●
●
●
●
●
●●
●
●
●
●
● ●
●
●
●●
●
●
●
●
●
●
●
●
●
●
●●
●
●
●
●
●
●
●●●
●
●
●
●
●
●
●
●
●
●
●
●●
●
●●
●
●● ●
●
●
●
●
●
●
●●
●
●
●
●
●
●
●
●
●
●●
●●
●
●
●
●
●
●
●
●
●
●
●
●
●
●
●
●
●
●
●
●
●
●●●
●●
●
●
●
●
●
● ● ●
●
●
●●
●
●
●
●●●
●
●
●
●●●●●
●
●
●●
●
●
●
●
●
●
●
●
●
●
●
●●
●
●
●
●●
●
●
●
●
●
● ●●
●
●
●●
●
●
●
●
●
●
●
●●
●
●
●
●
●
●
●
●
●
●
●
●
●
●●
●
●
●
●
●
●
●● ●
●
●
●
●
●
●
●
●
●
●
●
●●
●
●
●●
●
●
●
●
●
●
●●
●
●●
●
●●
●
●
●
●●
●
●
●
●●●
●
●
●
●
●
●
●
●
●
●
●
●●
●●
●
●
●
●
●
●
●
●
●
●
●
●
●
●
●
●
●●● ●●
●
●
●●
●
● ●
●
●
●
● ●●
●
●
●●●
●
●
●
●
●●
●
●
●
●
●
●
●
●
●
●
●●
●
●
●
●
●
●
●
●
●
●
●
●
●
●
●●●
●
●
●●
●
●●●
●
●
●
●
●
●
●
●
●
●● ●
●
●
●
●
●●
●
●
● ●
●
●
●
●
●
●
●
●
●
●
●
●
●
●
●
● ●●
●
●
●
●
●●
●
●
●
●
●
●
●
●
●
●
●
●
●
●
●
●
●
●●
●
●●
●
●
●
●
●
●
●
●
●
●
●
●
●
●
●
●
●
●
●
●●●
●
●
●
● ●
●
●
●
●
●
●●
●
●
●●
●
●
●
●
●
●
●
●
●
●
●
●● ●
●
●●
●
●
●●
●
●
●
●
●
●●
●
●
●
●●
●
●
●
●
●
●●
●●
●
●
●
●
●
●
●
●●
●
●
●
●
●●●
●●
●
●
●
●
●
●
●
●●
●
●●
●
●
●
●
●
●
●
●
●
●●
●
●
●
●●
●
●
●
●
●
●●
●
●
●
●
●
●
●
●
●●
●● ●
●
●
●
● ●
●
●
●
●
●
●
●
●
●
●
●
●
●
●●
●
●
●●
●
●
●
●
●
●
●
●
●
●●
●
●
●
●
●●
● ●
●
●
●
●
●
●
●
●●
●
●
●● ●● ●
● ●
●
●●●
● ●●●●
●
●●
●
●
●
●●
●
●
●
●
●
●
●
●
●
● ●
●
●
●
●
●
●
●
●
●
●
●
●
●
●●
●● ●●
●
●
●●●
● ●
●
●
●
●
●
●●
●
●
●
●
●
●
●
●
●
●●
●
●
●●●●
●
●
●
●●
●
●
●
●
●●
●
● ●
●●
●
●
●●
●●
●
●
●
●
●
●
●
●
●
●
●
●
●
●● ●
●●●
●
●
●
●
●
●
●
●
●●●
●
●●
●●
●
●
●
●
●
●
●
●
●
●
●
●
● ●
●
●
●
●
●●
●
●
●
●
●
●●
●
●
●
●
●
●
●●
●
●
●
●
●
●
●●
● ●
●●
●
● ● ●●●
●●
●
●
●
●
●
●
●
●●
●
●
●
●
●
●
●
●
●
●
●
●
●
●
●●
●
●
●
●
●
●
●
●
●●
●
●
●
●
●● ● ●
●
●
●
●
●
●
● ●
●
●
●
●●
●
●
●
●
●
●
●
●
●●
●
●
●
●
●
●
●
●●
●
●
●
●
●●●
●
●
●
●
●
●
●
●●
●
●
●
●
●
●
●
●
●
●
●
●
●
●
●
●●
●
●
●
●
●
●
●
●
●
●
●
●
●
●
●
●
●
●●
●
●
●
●
●
●
●●
●
●
●
●
●
●
●
●
●
●● ●
●
●
●
●
●
●
● ●
●
●
●
●
●●
●
●
●
●
●
●
●
●
●
●
●
●
●
●
●
●
●●
●
●●
●●
●
●
● ●● ●
●
●
●
●
●
●
●
●● ●
●
●●
●
●
●
●
●●
●
●
●
●
●
●
●
●
●
●
●
●● ●
●●
●
●
●
●
●
●
● ●
●
●
●
●●
●
● ●●
●
●
●
●
●
●
●
●
●
●
●
●
●
●
●
●
●
●
●
● ●
●●
●
●
●
●●●
●
●
●
● ●
●
●●
●
●
●
●
●
●
●
●
●
●
●
●
●●
●
●
●
●
●
●
●
●
●●
●
●
●
●
●
●
●
●
●
●
●
●●
●
●
●
●●
●
●
●
●
●●
●
●
●●●
●
●
●
●
●
●
●
●
●●
●
●
●●
●●
●
●
●●
●
●
●
●
●
●
●●
●
●●●
●
●
●
●
●
●
●
●
●
●●●
●
●
●
●
●●
● ●●
●
●●●
●
● ●●●
●
●
●
●
●●
●
●
●
●
●
●●
●
●
●
●
●
●
●●
●●●
●
●●
●●
●
●
●
●●
●
●●
●
●●
●
●
●
●●
●
●
●●●
●
●
●
●●
●●
●
●●
●
●
●
●●
●
●
●●
●
●
●
●
●
●
●
●
●
●
●●
●●
●
●
●
●●
●
●
●●
●
●
●●●
●
●●
● ●
●
●
●
●
●
●
●
●
●
●
●
●
●
●
●
●
●
●
●
●
●● ●
●
●●
●
●
●●
●
●
●●
● ●●
●
●
●
●
●
●
●
●
●
●●
●●
●
●●
●
●
●
●
●
●
●
●
●●
●
●●
●
●
●
●
●
●
●
●
●
●
●
●
●
●
●
●
●
●●
●●
●
●
●●●
●
●●
●
●
●
●
●
●●
●
●
●
●
●
●
●
●
●
●
●
●
●
●
●
●
●●
●
●
●
●
●
●
●
●
●
●
●
●
●●●
●
●
●
●
●
●
●
●
●
●
●
●
●
●
●●●
●
●
●
●●
●●
●
●
●
●
●
●
●●
●
●
●
●
●
●●
●
●
●
●
●
●
●
●
●
●
●
●●
●●●●
●
●
●
●●●
●
● ●
●
●
●
●
●
●
●
●
●
●
●
●
●
●
●● ●
●●
●
●
●
●
●
●
●
●
●
●
●
●
●
●
●
●
●
●
●
●
●
●
●
●●
●
●
●●
●●
●
●
●●
●
●
●
●
●
●
●
●
●
●
●● ●
●
●
●
● ●●
●
●
●
●
●
●
●
●
●
●
●
●
●
●
●
●
●
●
●●
●
●
●
●
●
●●
●●●
●
●
●●
●
●
●
●
●
●
●
●
●
●
●
●
●
●
●●
●
●
●
●●
●
●
●
●
●
●
●
●●
●
●
●
●
●●
●
●
●
●
●
●
●
●
●●
●
●
●●
●
●
●
●
●
●
●
●●
●
●●
●
●●
●●
●
●● ●
●
●
●
●
●
● ●●
●
●
●
●●
●
●
●
●
●●
●
●
●
●●
●●● ●
●●
●●
●
●
●
●
●
●
●
●
●
●
●
●
●
●
●
●
●●
●
● ●
●
●
●
●
●
●●
●
●
●
●
●●
●
●
●
●
●
●
●
●
●
● ●
●
●●
●
●
●
●
●
●
●●
●
●
●●
●
● ●
●●
●
●
●
●
●●
●
●
●●
●●
●●
●
●
●
●●
●
●
● ●
●
●
●
●●● ●
●●●
●
●●
●
●●●
●
●
● ●
● ●
●
●
●
●
●
●
●
●
●
●
●
●
●
●
●
●●
●
●●
●
● ●
●
●
●
●
●
●
●
●●
●
●
●
●●
● ●
●
●●●
●
●
●
●
●
●
●
●
●
●
●
●
●
●●
●
●
●
●
●
●
●
● ●●
●
● ●
●
●
●
●
●
● ●
●
●
●
●
●●
●
●
●
●
●
● ●
●
●
●
● ●
●
●
●
●
●
●
●●
●
● ●
●
●
●
●
●●
●
●
●●
●
●
●
●●
●
●
●●
●
●
●
●
●
●
●
●
●
●
●
●
●
●●
●
●
●
●●
●
●
●●
●
●
●
●
●
●
●
●
●
●
●
●
● ●
●
●
●
●
●
●
●
●
●
● ●
●
●●
●
●
●
●
● ●
●
●
●●
●●●
●
●
●
●
●
●
●
●
●
●
●
●
●●
●
●
●
●
●
●
●
●
●
●
●●●
●
●●
●●
●
●●
●
●
●
●
●
●●●
●
●●
●
●●
●
● ●
●
●
●●
● ●●
●
●● ●
●
●
●
●
●
●
●
●
●●
●
●
●
●● ●
●
●
●●
●● ●
●
●
●
●
●
●● ●
●
●●
●
●● ●
●
●●●
●
●●
●
●
●
●
●●
●
●
●
●
●
●
●
●
●
●
●
●
●
●
●
●●
●
●●
●
●●
●
●
●
●
●
●●
●
●●
●● ●
●
●
●
●
●●
●
●
●
●
●●
●
●
●
●
●
●
●
●
●
●
●
●
●
●
●
●
●
●
●
●●
●
●●●●
●●
●
●●
●
●●
●●
●
●
●
●
●
●
●
●
●
●●
●●
●
●
●
●
●●●●
●● ●
●●
●
●●
●●
●
●
●
●
●
● ●●
●
●
●
●
●
●
●
● ●
● ● ●● ●●
●
●
●
●
●
●
●
●
●●
●
●
●
●
●●
●●
●
●● ●
●
●
●●
●
● ●
●
●
●
●●
●
●
●●
●●●
●
●
●
●
●●
●
●
●●
●●
●
●
●
●●
●●
●
●
●
●
●
●
●
●
●
●
●●
●
●
●
●
●
●
●
●
●
●
●
●
●●
●
●
●
●
●●
●
●
●
●
●
●
●
●
● ●
● ●●
●
●
●●
●
●
●●
●
●●
●
●
●
●
●
●●
●
●
●●
●●
●
●● ●
●
●●
●●
●
●
●
●
●
●
●
●●●
●●
●
●
●●
●
●
●●
●●
●● ●
●
●
●
●
●
● ●
●
●
●
●
●
●●
●
●
●
●
●
●
●
●● ●
●●●●
●
●
●
●
●
●● ●
●
●
●
● ●●●
●
●
●
●
●
●
●
●
●
●
●
●
●
●
●
●
●
●
●
●
●
●
●
●
●
●●
●
●
●
●
●
●
●
●
●
●
●
●
● ●
●
●
●
●
●
●●
●
●●
●
● ●
●
●
●
●
●
● ●●
●
●
●
●
●
●●
●
●
●
●
●●●
●
●
●●
●
●
●
●
●
●
●
●
●
●
●
●
●●
●
● ●●
●
●●
●
●●
●
●
●
●
●
●
●
●
●
●
●
●
●
●
●
●●
●
●
●
●
●
●●
●
●
●
●
●
●
●
●
●
●●
●
●
● ●
●●
●
●
●
●
●
●
●
●
●
●●
●
●
●
●
●
●
●●
●
●
●
●
●●
●●
●●
●
●●
●
●
●●
●
●
● ●
●
●
●
●
●
●
●
●
●
●●
●
●
●●
● ●●
●
●
●
●
●
●
●
●
●●
●
●● ●
●●●
●
●
●●
●
●
●
●
●
●
●
●●
●
●●
●
●
●
●
●
●
●
●
●●
●●
●
●
●
●
●
●
●
●
●●
●
●
●
●
●
●
●
●
●
●
●
●●
●
●
●
●
●
●●
●
●
●
●
●
●
●
●
●
●
●
●
●
●
●
●
●
●
●
●
●
●
●
●
●
●
●
●
●
●●
●
●
●
●
●
●
● ●●
●●
●
●
●
●
●
●
●
●
●●
●
●
●
●
● ●
●
●
●
●
●●● ●
●
●
●
●
●
●
●
●
●
●
●
●●
●
●
●
●
●
●
●●
●
●
●● ●
●
●
●
●
●●
●
●
● ●
●●●
●●
●
●
●
●
●
●
●
●
●
●
●
●
●●
●●
●
● ●
●
●
●
●
●
●
●
●
●●
●●
●
●
●
●
●
●
●
●
●
●
●
●
●
●
●
●
●
●
●
●
●●●●
●
●
●
● ●
●
●
●
● ●●
●
●
● ●
●
●
●
●
● ●
●
●●
●
●●
●
●
●
●●
●● ●● ●●
●
●●
●
●
● ●
●
●
●
●
●
●●
●
●
●●
●
●
●
●
●
●●
●●
●
●
●
●
●
●
●
●
●
●
●
●
●
●
●●●
●
●
●
●
●
●●
●
●
●
●
●
●
●
●
●
●●
●● ●
●
●
●
●
●
●
●
● ●
●
●●
●●
●
●
●
●
●
●
●
●
●
● ●
●
●
●
●
●
●
●
●
●
●
●
●
●
●
●●
●●
●
●
●●
●
● ●
●
●
●●●
●
●
●●
●●
●
●
●
●
●●
●●
●
●
●
●
●
●●●
●
●
●●
●
●
●
●
●●
●●
●
●
●●
●
●
●
●
●
●
●
● ●
●
●●
●
●
●
●●
●
●
●
●
●
●
●
●
●
●
●
●
●●
●
●
● ●
●
●
●
●
●
●
●
● ●
●
●●
●
●
●
●
●
●
●
●
●
●
●
●
●
●
●
●
●
●
●
●
●
●
●
●
●●●
●
●
●
●
●
●
●
●
●
● ●
●
●
● ●●
●
●
●●
●
●
●●
●
●
●
●
●
●
●●
●
●●
●●
●
●
●
● ●
●
●
●
●
●
●●●● ●
●
●
●
● ●
●
●
●●
●
●
●●
●
●●
●
●
●
●●
●
●
●
●
●●●
●
●
●
●
●
●
●
●
●
●
●
●
●
●●
●
●
●
●
●
●
●
●
●
●
●
●●
●
●
●
●
●
●●
●
●
●
●
●
●
●●
●
●
●
●
●
●
●
●
●
●
● ●
●
●●
●
●
●●
●
●
● ●●
●
●●
● ●
●
●
●●
●●
●
●
●●
●●●●
●
●
●
●
●
●
●
●●
● ●● ●●
●
●●
●
● ●
●
●
●
●
●
●
●●
●
●
●
●
●
●
●
●
●●
●
●
●
●
●●
●
●
●
●
●
●
●
●
●●
●●
●
●
●
●
●
●
●
●
●
●
●
●
●
●
●
●
●●
●
●
●
●
●
●
●
●
●
●
●
●
●
●
●
●
●
●
●●
●●
●
●
● ●
●
●
●
●
●
● ●
●
●●●●
●
●
●
●
●
●
●●
●
●
●
●
●
●
●
●●
●
●
●
●●
●
●
●
●
●
●
●
●
●
●
●
●
●
●●●
●●
●
●
●
●
●
●●
●
●
●
●
●
●
●
●
●●
●
●
●
●
●
●
●
●●
●
●
●
●
●
●
●●●
●
●
●
●●
●●●
● ●●
●
●●
●●
●
●
●
●
●
●
●
●
●
●
●
●
●
●
●
●
●
●●
●
●
●
●
●
●
●●
●
●●
●●
●
●
● ●
●
●●
●
●
●
●
●
●
●
●
●
●●
● ●
●●
●
●●
●●
●
●
●
●
●
●
●
●
●
●
●●
●
●
●
●
●
●
●●
● ●
●
●
●
●●●
●
●
●
●
●
●
●
●
●
●
●
●
●
●
●
●
●
●
●
●
●
●
●
●
●
●
●
●
●
●
●
●
●
●
●
●
●
●●
●
●
●
●
●
●●
●
●
●
●
●
●
●●
●●
●
●
●
●●
●
●
●●
●
●
●
●
●
●
●
●
●
●
●
●
●
●
●
●
●
●
●
●
●
●●
●
●
●
●●●
●●
●
●
●
●
●
●
●
●●
●●
●
●●●
●
●
●
●
●
●
●
●
●●
●
●
●
●
●
●
●●
●
●
●●
●
●
● ●
●
●
●
●
●●
●
●
●
●
●
●●
●
●
●
●
● ●
●●
●
●●
●
●
●
●
●
●●
●
●●
●
●
●
●●
●
●
●
●
●
●
●
●
●
●
●
●
●
●
●
●
●
●●
●
●
●●
●
●
●
●
●
●
●
●●
●
●●
●
●
●
●
●
●
●
●
●
●
●
●
● ●
●
●
●
●
●
●●
●
●
● ●●
●
●
●
●
●
●
●
●
●
●
●
●
●
●
●●
●
●
●
●
●
● ●
●
●
●
●
●●
●
●
●●
●●
●●
●
●
●●
●
●
●
●
●
●
●
●●
●
●
● ●●
●●
●
●
●
●
●
●
●
●
●
●
●
●
●
● ●●
●
●
●●
●●
●●
●●●
●●
●
●
●
●
●
●
●
●
●●
●
●
●●
●
●
●
●
●
●
● ●
●●
●
●
●
●
●
●
●
●
●
●
●
●
●
●
●
●
●●
●
●
●
●
●
●● ●
●
●
●
●
●●●
●●
●●●
●
●
●
●
●
● ●●
●●
●●●
●
●
●
●
●
●
●
●
●
●
● ●
●●
●
●
●
●
●●
●
●●●
●
●
●
●
●
●
●
●●
●
●
●
●
●
●
●
●
●
●
●
●
●
●
●
●
●
●
●
● ●●
●
●●
●
●●
●
●●
●
●
● ●
●
●●
●●
●
●
●●
●
●
●● ●
●
●
●
●
●
●
●
●
●●●
●
●
●
●
●●
●
●
●
●●●
●
●
●
●
●
●
●
●
● ●● ●
●
●
●
●
●
●
●
●
●●
●
●
●
●
●
●
●
●
●
●
●
●●
●
●
●
●
●
●
●
●
●
●
●
●
●●
●●
●
●
●
● ●
●
●
● ●
●
●●
●
●
●
●
●
●●
●
●
●
●
●
●●
●●●
●
●
●●
●
●
●
●
●
●
●●
●
●
●
●
●●
●
●
●
●
●
●
●
●
●
●●●
●
●
●
●
●
●●
●
●
●●
●
●●
●
●
●
●
●
●
●
●●●
●
●●
●
●
●
●
●
●
●●
●
●●
●
●●
●
●●●
●
●
●
●
●
●●
●
●
●
●
●
●
●
●
●
●
●●
●
●
● ●
●
●
●
●
●
●
●
●
●
●
●
●
●●
●
●
●
●
●●●
●
●
●
●
●●●
●
●
●●
●
●
●
●
●●
●
●
● ●
●
●
●
●
●
●
●
●
●
●
●
●●
●●
●
●
●
●
●
●
●
●
●
●
●
●●
●
●●
●
●
●●
●
●
●●
●
●●
●
● ●
●
●●
●
●
●
●
●
●
●
●●
●
●
●
●●
●●
●
●
●
●
●
●
●●
●
●
●
●
●
●●●
●
●
●
●
●
●
●
●
●
●
● ●
●
●
●
●
●
●
● ●
●
●
●
●
●
●
●●
●
●
●
●
●
●
●
●
●
●
●
●
●
●
●
●
●●
●
●●
●
●●
●
●●
●
●
●
●●
●
●
●
●
●
●●
●●
●●
●
●●
●
●
●●
●
●
●
●●
●
● ●●●
●●●
●
●
●
●
●
●
●
●
●
●
● ●
●
●●●
●
●●
●
●
●
●
●
●●●
●
●
●
●
●
●●● ●
●
●
●
●
●
● ●
●
●
●
● ●
●
●
●
●
●
●
●●
●
●●●
●
● ●
●
●
●
●
●
●
●
●
●●
●
●
●
●
●●
●
●●
●
●
●
●
●
●● ●●
●●
●
●
●
●
●
●
●
●
●
●●
●
●
●
●
● ●
●
●
●●
●
●
●
●●
●
●
●
●●
●
●
●
●
●
●●
●
●
●
●●
●●
●
●
●
●
●●●
●●
●
●
●
●
●
●
0
1
2
3
4
5
0.00 0.25 0.50 0.75 1.00
Rank within Type
Wea
lth (
mill
ions
of E
uros
)
Types
●
●
●
●
●
●
1
2
3
4
5
6
Wealth/Effort distribution across 6 Types Obs. < 5 million euros
●
●
●●
●● ●●
● ●● ●
●●● ●●
● ●●
●●
●
●● ●
●
●●
●●
●
●
●●
●●●
●● ● ●
●
●
●
●
●
●●
●● ●
●
● ●● ●● ● ●● ● ●● ●●●
●●
●
●●● ●● ●
●
● ● ●●●
●● ●● ●●
●
●●
●
●●
●●●●● ●●●
●●●
●● ●●
●
●●●●●●●
●
●●● ●
●
●● ● ● ● ●
●
●● ●●
●
●
●● ●●●
●
●●
● ●● ●●● ●●
●●
●● ● ●
●
● ●
●●
●● ● ●●● ●
●
●
●
●
●● ●
●
●●
●
●
●
●●
●●
●● ●●
●
●●
●●
●●●
●
●●●
●●
●
● ●
●
●
●
●●
●
●●
●●●
●●
●
●●
● ●● ●
●
●●●
● ●● ●●●
●● ●
●
● ●
●
●
●
●
●●
●
●
●●
●●
●
●●
●
●
●
●
●
● ●● ●
● ●●
●
●●●●●
●●
●
●●
●●
●
●
●
●
●
●● ●● ●
●●●● ●●
●●●●
● ●●●●● ●
● ●●●
●
●● ●
●
●
●●
●●
●●●
●
●●● ●●
● ●●●
●●
●●
●
●● ●●
●●
●●
●
●● ●
● ●●
●
●
●●
●
●
●
●●
●●●
● ●● ● ●●
●
●● ●● ●●
●●
●●
●
● ● ●
●
●●●
●
●
●
●●●
●● ●● ●●
●
●
●
●
●
● ●
●● ●●●
●
● ● ●
●
●● ●
●● ●●●
●● ●
●
●
● ●●
●
●
●●●
●
●●
●●
● ● ● ●● ●●● ● ●●
●
●●
●●
● ● ●●
●
● ●
●
●●
●
●
●
●
●
●
● ●●● ●
● ●●● ● ●●
●●
●●●●
●●
●●
●● ●
●● ●● ●●
●
● ●●
●●
●●
●
●●
●● ● ●●
●● ●
●
●
● ●●
●
● ●●
● ●●
●
● ●●
● ●●●●
●
● ●●● ●●
●
●
●●●
●
●●
●● ●●●
●●●
●
●
●●●
●●● ●
●
●
●●● ●
●●●
●
●
●● ● ●●● ●●
●●
● ●●●● ●●
●
●●●
●●
●●●● ●● ● ●● ●●●
●
●●
●● ●
●●
●●
●
●● ●●●
●
● ●● ●● ●
●
●●
●● ●●
●● ●●●
●
●●●
●●
●●●
●●
●
●
●
● ●● ● ●
●
●
●● ●
●
●●● ●
●●●
●
●
●●
●
●●
●
●
●●●●
● ●
●
●●
●
●●●
●
●
● ●● ●
●● ● ●●
●
●●
●
●
● ●● ●
●
●● ●●
●
●
●
●
●
●
●
●
●●● ●
●●
●
●
●●
●
●●
●●
● ●● ●●
●●
●●
●
●●
●
● ●●
●
● ●●
●●
●●●
●●●
● ●
●●●
●●
●●●
●●
●●
●●
● ●● ● ●●● ●● ● ●●●
●
●
●●
●
●● ●
●●
●
●
●●
●
● ●
●
●●
●
●● ●
●●
● ●
●
● ●
●
●●
●
●● ●●
●
● ●●
●
●
●● ● ●●
●
●
●● ●●●
●
●
●
● ●● ●●●
●
●
● ●●● ●
●
●●
●
●
● ●●●
●
●
●
●● ● ●● ●
●
● ●●●
● ● ●
●
●● ●●
●●
●●● ●●
●●●●● ●
●● ●
●
● ●●
●
●●
●
●
●●●● ●● ● ● ●● ●●●●
●●
●●
●
●● ●●●
●
●●
●●
●●● ●
●●●● ● ●
●
●
●●
●
●● ● ●
●
●●●●
●●●● ●
●
●
●
●●
●●●
●
●
● ●●● ●
● ●●
● ●●● ●●●
●
● ● ●
●
●
●
● ●
●
●
●
●
●
●●
●●
● ● ●
●●●
●●●
●
●● ● ●
●
●● ●● ● ●●
●
● ●●●
●●
●●●●
●
●
●●●●
●
●
●
●●
●
●
●●●
● ●●●
●
●●●
● ●●●
●●●● ● ●
●
●
●
●●●
●
●
●
●●
●
●●
●●
●●●
●●
●
●
● ●●
●●
●●
● ●●
●
●
●●
●●
● ●
●
●●
●
●●●
● ●●●
●
●
●●●
●
●●
●●● ● ●● ●
●
●
●●
●
●●
●
●● ●
●
●
●
●
● ●● ● ●●
● ● ●
●
●
● ●
●●
●
●
●●●●
●●
●
●●
●
●●
● ● ●
●
● ●●
●●
●
● ●●
●
● ●●
● ●
●
● ●
●
●●
● ●
●● ● ● ●●
●●●
●●
●
●●
●
●
●●
●●● ●
●
●
●● ●●
●
●
●● ● ●
●
●●
●
●
●●
●
●
●
●●●
●●
●
●
●
●●●
●
● ●●● ● ●
● ●●
●
●●●
●●
●
●
●
●
●●
●
●●
●● ●
●●
●● ●●●●
●
●
●●●
●
●●
●
●
●●
●
●
●
●● ●
● ●
●
●●
●●
●
●●● ●
● ●
●
●●
● ●● ●
●
●
● ●●●
●
●● ● ●
●●
●
●● ●●
●●
● ●●
●● ●
●
●
● ●
●●
●●
●
● ●
● ●●● ●●
●●
●● ●
●●
●
●
●
●
●●
●
●
●● ●
●●
●●●
●●
●●
●●
●
●●
●●
●
●●
●
● ●●●● ●●
●
●●●
●
●
●
●●
●●
●
●
●●●●
●
● ●●
●
●●
●●●● ●
●●
●
●● ●
●●●
●
●● ●● ●
●
●● ● ● ●
● ●●
●●
●
●● ● ●● ●●
●
●
●
●● ●
●●● ●
●
●
●
●
● ●
●
● ●●●● ●
●●
● ●
●
●●
●
●●
●● ● ●●
● ●● ●
●
●●
● ●●
●
●
●
●
●● ●
●
● ● ●
●
●● ●
●● ●●● ●
●
● ●●
●● ● ● ●●●
●●
●
●●
●
●
●
●● ●●●
● ● ● ●●
●
●● ●
●
●
● ●●
●
● ●● ● ● ●
●
●●
●
●●
●●●●
●
●● ● ●●
●
●●●
●●●
●●●
●
●
●
●●
●● ●●●●
● ●●●
●
●
●
●
● ●
●
●●●
● ● ● ●●
●
●
●
● ●●
● ●
●
●● ●●
●
●
●
●
●
●
●
●●
●
●●
●
● ●
●
●
●
● ● ●●●
●
●
●●
●●
● ●●
● ●●
●
● ●
●
●●● ●●● ●
● ●●
●
●
●● ●●
●●●
●●
●
●
●
●
●
●
● ●●
● ●
●● ●
●
●●●
●
●●●
●●● ●
● ●
●
● ●●
●
●
●
●
●
●●
●●● ●
●
●
●
●●●
●
●●●
●●●●
●
●●
●
● ●● ●
●●
● ●●●
●●●●
●
●
●
●● ●●●
●
●
●● ●●
● ●● ●●
●
●
● ●
●
●● ●
●
●●
●●●
●●●
●●
●
●
●
●●
● ●
●
●●●● ●
● ● ●
●
●●●
●●
●
●
●● ●
●
●●
● ●
●
●●●
●
●
● ● ●
●
●●●
●
●●●
●
●
●
●●● ●
● ●●
●
●
●
●●
●
● ● ●●●● ●
●
●
●●
●●
●●
●
●
●●
●
●● ●● ● ●
●
●●
●● ●●●
●
●●●●
●
●
●
●
●● ●
●
●●●
●● ●
●
●
● ●
●
●● ●●
●
● ●
●
● ●●●
●
●
●
● ●●
●●● ●
●
● ●● ●●
● ●●●
●● ● ●
● ●●
●
●
●
●
●
● ● ● ●
●
●●
●
●● ●●
●●
●● ●●● ● ●
●●●
●●●
●
●●
●●
●
●● ●●●
●
●
●
●
●●●
●● ●
●
●
●● ●● ●
●●
●
●●●● ●
●
● ●●
● ●●
●
●
●●
●●
●●
● ●●
●●● ●
●
●●●●●●
●
●
●●
●●
●
● ●
●●
●
●
●●●
●●
● ● ●●● ●
●●●●●
●●●
●● ●●●
● ● ●●
●
●
●●●
●● ● ●● ●●● ●●
●● ●●●●
●● ●
●●
●●
●
●
●●● ● ●
●●●
●●
●
●●● ●
●●
●●
●
●
●
●●
●
●●●
●
●
●● ●●
●
●
●
●
●●
●●
● ●
●
●
●●●● ●● ● ●
●●
●
●
●
●● ● ●●
●
●
●
●
●● ●●
●
●
●● ●●● ● ●● ●
●●
● ●●
●
●● ●● ●●●
●●●
●
●●
●
●●
●●
●
●
● ●● ●
● ●
●●●
●●●●●● ●●
●● ●●
●
●
●●
●
●●●●
●
●
●●
●
●
●● ●
●
● ●
●
●●
● ●●●
●● ●● ●● ●●●
●
●
●
●
●●
●
●●
●
●●
●●
● ●
●●
● ● ●●
●●●
● ●●
● ●● ●
●
●
●●
●
●●
●●
●
●●
●
●●
●
●
● ●● ●
●
●●●
●
●
●
●●
●●
●
●
● ●●
● ●●
●
●●
● ● ● ●●●
●●● ●
●
●
● ●● ● ● ●
●
●
● ●●●
● ●●
●●●
● ●●
●
●●
●
●●
● ● ● ●●●●●
●
●●
●● ●
●
●● ●●
●●● ●●
●
●●●
●
●●
●●●
●●● ●●● ●
●●
●●●
●
● ●● ●● ● ●●
● ●
●
●
●●● ●● ●
●
●
●●
●
● ●●● ●●
●●
●● ●
●●
●●
●
● ● ●● ●● ●●
●●
●
●●
●
● ●●●
● ●●●
● ●
●●
●● ●
●●●● ●●
●
●
●
●●
● ●●●
●
●
●● ●
●●
●
●
●
●●
●● ●
●●●●●
●●
●
●
●
●●
● ● ●●
●
●
●●
●●
●
●
●●●● ●● ● ●
●●●●
●
●
● ●●
●●
●●● ● ●
●
●
●
●●● ●● ●
● ●● ● ●
●
● ●●●● ●● ●
●
●●
●
● ●●
●
●
●
●● ● ●
●
●●
●
●
●● ●
●
●
●
● ●●
●
●●
●●●
●
●
●
●
● ●● ●
●
● ● ●
●
●
●●
●
●
●
●● ●
●
●●● ●
●●
● ●●
●●
●
● ●
●●
●● ●●●
●
●●
●●●
●●
●● ●
● ●●● ●● ●
●
●● ●
●
●●●
● ●●●●● ● ●
●
●
●
●●
●● ●●
●
●●
●●●●
●
● ● ●●● ●
●
●
●
● ● ●●
●
● ●●
●
●●● ●
●
●
● ●●
●
●
● ●
●
●●
●
● ●
●
●
●●●
●
● ●
●
● ●●●
●●●●
●
●
●● ●●●●
●●
●
●●
●
●●
●●● ●● ●●
●
●
●
●●
●●
●●
●●●
● ●
●●
●●
●●
●
●●●
●●
●●●
●●●● ●●
●●
●●
●●
●
● ●
●
●
●
●●
●●● ●
●
●
●●
●
●
● ●●
●●● ●● ●
●
●● ●
●●
● ●●
●●
●
● ●
●●●
●
●
●● ●●●
●●
●
●
●●● ●
●
●●● ●●
●●
●
●
●
●
●● ●●
●●
●●
●●●
●
●●
●● ●●●
●●●●● ●●
●
●
● ●● ●
●●● ● ●
●
●●●●● ●● ●
● ●● ●●● ●● ●
●●
●●
●
●●
●
●
●●●
●●●●
●●●● ●
●●●●●
●
●
●
● ●● ●●●
●
●●
● ●
● ●
● ●● ●● ●●●●
●●●●
●●
●
●
●●
●●
●
●●
● ●●● ●
●
●●
●● ●● ● ●●
●
●●●●●
● ●● ●●
●
●●● ●●●
●
● ● ●
●
●
● ●●
●
●
●●●
●
●
●
●●●
●
●
●● ● ●●● ●●
●●
●●
● ●●●
●
● ●
●
●●
●
●
●
●
●
●●
●● ●
●
●
●●
●
●●●● ●●●●
●●
●●
●●
●● ●
●●●
●
●●
●●
●●
●
●● ●
●●
●●
●● ●●
●
●●
●
●●●
●● ●●●
●●
●●●●● ● ●
●●
●
● ●
●
● ●●
●●
●
●
●●
●
●
●
●● ●
●
●●● ●●
●
●●●
●
●●
●●
●●
●●● ● ●
●
● ●●
● ●● ● ●● ●
● ●●
●
● ●● ●
●
●●
●● ●●
●●
●●●
●●
●●
●●
●
●
●●
●●● ●
●
● ● ●●
●
●●
●●● ● ● ●●
●
●●●
●
●●●
● ●
●● ● ●●●● ●●● ● ● ●
●●
●●●
●●●
●
●
● ●●
●
●●● ●●
●●●●
●
●
●●●
●● ●●
●
●
●
● ●●
●
●
● ●●●
●
● ●● ● ●●●●
●
●●
●●●
● ●●●
●● ●●
●
●
●●
● ●●●●●
●
●
●●●
●●
●
●
● ●●
●● ●● ●
●●
●
●
●
●●
●● ●
●
● ●
●
● ●
●
●● ●
●
●●
●●●
●
●● ● ●
●
●●●●
●●
●●●
● ● ●● ●
●
●
●●●●
●●●
●
●●●
●●● ●●
●●
●
● ●
●
●●
●●
●●
●●●
●
●
●● ●●
●
●●● ●
●●● ●● ●●●
●
● ●●●
●
● ●●
●
● ●
●
●
●
●●● ●
●
●
●●
● ●●
●
●●●●●
●
● ●
●
●
● ●●
●
● ●● ●●●
●
●
●
●
●● ● ● ●●
●●●●
●
●
● ● ● ●● ● ●
●●
●●
●
●● ●●
●
●●
●
●●● ●● ●●●
●
● ●
●
●●●●
●●
●● ●●
●
●●
●
●●●
●●
●●
●●
●
●●
●
●
●
● ●●●
● ●●●●●
●●●
●
●●
●
●●●●
●
●
●●● ●
●
●
●
●
●
●
●
● ●
●●
●●●
●
●●
● ● ●
●
●
●
●
●
●
●●●
●●● ●
●
●● ●
●● ●●
●
●
●●
●
●● ●● ●● ●
●
●
● ●● ●●●●
●
●
●
●
●
●● ●
●
●
●
● ●●
●
●●
●●
●
●●● ●
●●
● ● ● ●●
●
●
●
●● ● ●● ●●
●●
● ●
●
●
●●●
●
● ● ● ●●●
●●●●
●
●●● ● ●●
●●
● ●●
●● ●●● ●● ●● ● ●
●
●●
●●●●
●● ●
●● ●●
● ●● ●●
●
●
●● ●
●●
●
●●
●●
●● ●●● ●●
●
●
●●
●
●
●●●
●●●● ● ●
●●●
●●
●
●●●
●
● ● ●●●
●
●
●● ● ● ●●
●●
●●
●
●●●
●●
●●
● ● ●●
● ●● ●
●
●●
●
●
●●● ●●●●
●●
●
●●●● ●
●
● ●
●
● ● ● ●
●
●●
●●●
●
●
●
●
●
●
● ●
●
●● ●●
●●
●●
●●
●●
●● ●●●
●● ●● ●
●
● ●●●
●●● ●
●
●
● ●
●
●
●
●●
●
●●
●
●
● ●●●● ●
●● ●
●● ●●
●●● ●
●
●● ●●●●
●
●●
●
● ●
●
●●
●
●● ● ●●
●
●●
● ●● ●
●●
●●● ●
● ● ●●
●
●●●●●
●●●
●●●●
● ●● ●
●
●
●●●
●
● ●● ● ●
●
●
●●●
● ●●●
●
●
● ●● ●
●
●● ●
●
●●● ●●
●●
● ●
●
●●●
● ●●
●
●
●●
●
●
● ●●●
●●●●
●
●
●●
●
●●●
●
●●●
●
●
●● ●●
●●● ●
●
● ●
●
●
●
●●
● ●
●
● ●●●
●● ● ● ● ●● ●
●
●●●
●
●
●
●●●
●● ●●● ●●● ●●
●
●● ●
●
● ● ●●
●●
●
●
● ●●●● ●●● ●●
●●
●●●
●
●●
●●
● ●
●
●●
●●
●●
●
●
● ●● ●● ●
● ●
●●
● ●●
●●
●
●● ●● ●
●●● ●
●
●●
●●
●
● ●
●●●
●
●● ●●●●●●
●●
●
●● ●●
●
●●
●● ●
●
●●● ● ●●●●
● ● ● ●● ●
●●
●●●●● ●
●●
●●
●
● ● ●●
●●●●
●●
●
●●
●●●●● ● ●
●
●●●
●●
●
●
●
●●
●●
● ● ●●●
●●
●
●●●
●
●
●●
●
●●
●
●●
●● ●●●
●
● ●●
●
●●● ●
●
●
●●●●
●
●
●●
●●●●●
●
●●
●●
● ●●
●●
●
●
●
●
●
●
● ●
●
●
●●
●
●●●●●●
●●
●
●●●
●●
●●
●●● ●
●
●● ●● ● ●
●●
●● ●
●
●
● ●● ●
●
● ●●
●●●
●●
●●●
● ●● ●●
●
●
●
●●●
●
● ●●
●
●
● ●●●
●
●●
●
● ● ●● ● ●
●
●●●
● ●● ● ●● ● ●
●
●●
● ●● ●
●●
●
●
●
●
●
● ●
●
●●
●
●
●●●●
●●●
●●●
●
●
● ●● ●● ●●●● ●●
●
●●●
●● ●
●
●
●●● ●● ●
●
●●●
●
●
●
●●● ●●●●
●
●
●●● ●●
● ●
●● ●●
●
●
●●
● ●
●●
●●
●●●●●
●
● ●
●●
●●●●
●
●
●
● ●
●
●
●
●●
●
●
●● ●●
●
● ●
●
●● ●●
●
●
●
●
● ●● ● ●● ●
●
●●
●
●
●●
●
●
●
●● ●
●
● ●●
●●
●
●●
●
●●●
●
●●●
● ●●
●● ●● ● ●●
● ●
●
●
●
●
●●●●●
●
●
●●
●
● ●●●
●
●
●●
●
●●
●●●●●
●
●
●●
●●
●
●
●●
●●
●
●●●●●
●
●
●
●
●
●
●● ●
●
●
●● ●● ●
● ●
●
●●
●
●●
● ●●
●●
●
● ●●
●
●
●
●● ●
●●
●
●
●
●●
● ●●●
●
●
●
●
●● ●●
●
●●●●
●● ●● ●
●
●
●
●●●
●
●●
●●● ●
●
● ●●● ●
●
●
●●●
●●
●●
●● ● ●●●
●● ●
●
●
●
●
●
●
●
●
●
●● ●●
●
●●
●●●●
●
● ●● ●
●● ●●
●●●●
●● ●●●
●● ●
●
●●
●●●●
● ●
●●
●●●●
●●● ● ●● ●● ●●
●●
●●●
●
●
● ●●●
●●● ● ●●●●
●
●
●●● ●● ●
● ● ●
●
●● ●● ● ●●
●
●●
●
●●●
●●● ●
●
●
●●
● ●●
●
●●
●
●
●
●
● ●●
●
● ●●
●●
●
●
●
●
●●
●●
● ●
●
●● ●●
● ● ●
●
●●
●● ●● ●
●●
●
●●
●
● ●
●●
●
● ● ● ●
●●
●●
●● ●
●●
●
●● ●●
●●
●●●
●●
●
●●
● ●●●
●
●●
●●
●
● ●
●
●●
●
● ● ●●
●●
●
●
● ●
●
●● ●
●
● ●●●●
●
●●
●
●●
●●
●
●●●
●
●●
●
●● ●●
●●●
●●●
●●●
●
●●
●
●● ●●
●
● ●●
●
●
●●
●● ● ●●● ●●
●●●●
●● ●●
●●
● ●●
●●
●
●
●●●
● ●●
●●●●
●●
●●
●●● ●
●
●
●
●●●
●
● ●
●
● ●●●● ●
●
●
●
●●●
●
●
●
● ●● ● ● ●● ●●
●
●
●●
●
●
● ●
●
●●● ●●
●
●
●●
● ●●●
●
● ●● ● ●●
●
●●●
●
●● ●●
●● ● ●
●
●
● ●● ●
●
●●●●
● ● ●●●
●
●
● ● ●
●
● ● ●● ●
●●
●
●
●●● ●● ●●●●● ●
●●
●
●
●●
●
●●●
●
●
● ● ●●
● ●●
●
●
●
●●
●
●
●
●
●●
●●● ●
●
●●●● ●
●
●
●●
●
●
● ●●
●●
●
● ●● ●● ●●●
●
●●● ● ●
●
●
●
●●●
● ● ●●
●
●●
●●
●● ●●●
●● ●
●● ● ● ●● ●
●
●●
●●● ●
●●
●● ●●
●●●
●
●●
●●●
●
● ● ●● ● ● ●● ● ●●
●
●
●
●●
●●● ●
●
●●● ●
●
●
●
● ●●●
●●
●
●●●●●
● ● ●●
● ●
●
●
●
●
●
● ●●●
●● ●●
●
●
●
●●
●●
●● ●
●
●
●
●●●
●
●●
●●
● ● ●●●
●
●● ●● ●●
●
●●
●
●
●● ● ●●●
●
●●
●
●●
●●
●
●
●●
●●
●●● ●● ●●
● ●●
●
●●
●●
●
●●
●●
●
●●●
●
● ●●●
●
●● ●●
●●
●
●●● ● ●● ●●
●
● ●●
● ●● ●●
●●●
●
●
●●●●● ●
●
● ●●
●
●
●●●
●
● ●● ●●●
●
●●
●
●● ●
●●●
●●
●● ●● ●
●
● ●
●
●●
●
●
● ●●●
●●●
●
●
● ●●
●● ●
●
● ●●
●●● ● ●●●
●
●● ● ●●
●●●●●● ●●
●
●
●●● ●●
●●●
●●
● ●
●0
0.5
1
1.5
2
0.00 0.25 0.50 0.75 1.00
Rank within Type
Inco
me
(tho
usan
ds o
f Eur
os)
Types
●
●
●
●
●
●
1
2
3
4
5
6
Income/Effort distribution across 6 Types (Obs. < 2 million euros)
●
●
●
●
●
●
●
●
●
●
●
●●●
●
●
●
●
●
●
●
●
●●●
●
●
●
●
●
●
●
●●
●
●
●
● ●
●
●
●●
●
●
●
●
●
●
●
●
●
●●
●
●
●
●
●
●
●●
●
● ●
●
●
●
●
●
●
● ●
●
●
●● ●
●
●●
●
●
●
●
●
●
●
●
●
●●
●
●
●●
●
●
●●
●
●
●●
●
●
●●●
●
●
●
●
●
●
●●
●● ●
●
●
●
●
●●
●
●●
●
●●
●
●
●
●
●
●
●
●● ●●
●
●
●
●
●
●
●
●
●
●
●
●
●
●
●
●
●
●
●
●
●
●
●
●
●
●
●
●
●
●
●
●
●
●
●
●●
●
●
●
●
●
●
●
●
●●
●
●
●
●
●
●
●
●
●
●
●
●
●
●
●
●
●
●
●
●
●
●●
●
●
●
●
●●
●
●
●
●
●
●
●
●
●
●
●●
●
●
●
●
●
●
●
●
●
●
●
●
●
●
●
●
●
●
●
●
●
●
●
●
●
●
●
●
●
●
●
●
●
●
●
●
●
●
●
●
●
●
●
●
●●
●
●
●
●
●
●
●
●
●
●
●
●
●
●
●
●
●
●●
●●
●
●
●
●
●●
●
●
●
●
●
●
●
●
●
●
●
●
●●
●
●
●
●
●
●
●
●
●
●
●
●
●
●
●
●
●
●
● ●
●
●
●
●
●
●
●
●
●
●
●
●
●
●
● ●
●
●
●
●
●
●
●
●
●
●
●
●
●
●●
●
●●
●●
●
●
●
●
●
●
●
●
●
● ●
●
●●
●
●
●
●●
●
●
●●
●
●
●
●
●
●
●
●
●
●●
●
●
●
●
●
●
●
●
●
●
●
●
●
●●
●
●
●
●
●
●
●
● ●
●
●
●●
●
●
●
●
●
●
●
●
●●
●
●
●
●
●
●
●
●
●
●
●
●
●
●
●
●
●
●
●
●
●●
●
●
●
●
●
●
●
●
●
●
●
●
●
●
●
●
●●
●
●
●●
●
●●
●
●
●
●
●
●
●
●●●
●
●
●●
●
●
●●●
●
●
●
●
●
●
●
●
●●
●
●
●
●●
●
●
●
●
●
●
●
●
●
●
●
●
●
●
●
●
●
●
●●
●
●
●
●
●
●●
●
●
●●
●
●
●
●
●
●
●
●
●
●
●
●
●
●
●
●
●●
●
●
●
●
●●
●
●●
●
●
●
●
●
●
●●
●
●●
●●
●
●
●●
●
●
●
●
●
●
●
●
●
●●
●
●
●
●●
●
●
●
●
● ●
●
●●
●
●
●
●
●
●
●●
●
●
●
●
●
●●
●
●●
●
●
●
●
●
● ●●
●
●
●
●
●
●
●
●
●
● ●
●●
●●
●
●
●
●
●
●
●
●
●
●
●
●
●
●
●
●
●
●
●
●●
●
●
●●
●
●
●
●
●
●
●
●
●
●
●
●
●
●
●
●
●
●
●
●
●
●
●
●
●●
●
●
●
●
●
●●
●
●
●
●
●
● ●● ●
●
●
●
●
●
●
●●
●
●●
●
●
●
●
●
●
●
●
●
●
●
●●
●
●
●
●
●
●
●
●●
●
●
●
●
●
●
●
● ●
●●
●
●●
●●
● ●
●
●
●
●
●●
●
●●
●
●
●
●
●
●
●
●
●
●
●
●
●
●
●
●
●
●
●
●
●
●
●
●
●
●
●
●
●
●
●
●
●
●
●
●
●
●
●
●
●
●
●
●
●●
●
●
●
●
●● ●
●
●
●●
●
●
●●
●
●
●
●●
●
●
●
●
●
●
●
●
●
●
●
●
●
●
●
●
● ●
●
●
●
●
●
●
●
●
●
●●
●
●
●
●
●●
●
●
● ●●
●
●
●
●
●
●
●
●●
●●
● ●●
●
●●
●
●
●
●
●
●
●
●● ●●
●
●
●
●
●
●
●●
●
●
●
●
●
●
●
●
●
●
●
●
●
●●
●
●●●
●●
●
●
●
●●
●
●
●
●
●
●●
●
●
●
●
●●
●
●
●
●
●
●
●
●
●
●
●
●●
●
●
●
●
●
●
●
●
●
●
●
●
●
●
●
●
●
●
●
●
●
●
●
●
●
●
●
●
●
●
●
●
●
●
●
●
●
●
●●
●
●
●
●
●
●
●
●●
●●
●
●
●●
●
●●
●
●
●●
●
●
●
●
●
●
●
●
●
●
●
●
●
●
●
●
●
●
●
●
●
●
●
●
●
●
●
●
●
●
●
●
●
●
●
●
●
●
●
●
●
●
●
●
●
●
●
●
●
●
●
●
●
●
●
●
●
●●
●
● ●
●
●
●
●
●
●
●
●
●
●
●
●
●
●
●
●
●
●
●
●
●
●
●
●
●
●●
●
●
●
●
●
●
●
●
●
●
● ●
●
●
●
● ●
●
●
●
●
●
●
●
●
●
●
●
●
●
●
●
●
●
●
●
●
●
●
●
●
●
●
●
●
●
●
●
●
●
●
●
●
●
●
● ●
●
●
●
●
●
●
●●
●
●
●
●
●
●
●
●
●
●
●
●
●
●
●
●
●
●
●
●
●
●
●
●
●
●●
●
●
●
●
●
●
●
●
●
●
●
●
●
●●
●
●
●
●
●
●
●
●
●
●
●
●
●
●
●
●
●
●
●
●
●
●●
●
●
●
● ●
●
●
●
●
●
●
●
●
●
●●
●
●
●
●
●
●
●
●
●
●●
●
●
●
●●
●
●
●●
●
● ●
●
●
● ●
●●
●
●
●
●●
●
●
●●
●
●
●
●
●
● ●
●
●
●
●
●
●
●
●
●
●
●
●
●
●
●
●●
●
●
●
● ●
●
●
●
●
●
●
●
●
●
●
●
●
●
●
●
●
●
●●
●
●
●
●
●
●
●
●
●
●
●
●
●
●
●
●
●
●
●
●
●●
●
●
● ●
●
●
●●
●
●
●
●
●
●
●
●
●
●
●
●
●
●
●
●
●
●●
●
●
●●●
●●
●
●
●
●
●
●
●
●
●
●
●
●
●
●
●
●
●
●
●
●
●
●
●
●
●
●
●
●●
●
●
●
●
●
● ●
●
●
●●
●
●
●
●
●
●
●
●
●
●
●
●
●
●
●
●
●
●
●
●
●
●
●
●●
●
●
●
●
●
●
●
●
●
●
●
●
●
●
●
●
●
●
●
●
●
●
●
● ●
●
●
●
●
●
●
●
●
●
●●
●
●
●
●
●
●●
●
●
●
●
●
●
●
● ●
●
●
●
●
●
●
●
●
●
●●
●
●
●
●
●
●
●
●
●
●
●
●
●
●
●
●
●
●
●●
●
●
●
●
● ●
●
●
●
●
●
●
●●
●
●
●
●
●
●
●
●
●●
●
●
●
●
●●
●●
●
●
●
●
●
●
●
●
●
●
●
●
●
●
●
●
●
●
●
●
●
●●
●
●
●
●
●
●
●
●
●
●
●
●
●
●
●
●
●
●
●●
●
●
●
●
●
●
●
●
●
●
●
●
●
●
●
●
●
●
●●
●
●
●●
●
●●
●
●
●
●●
●
●
●
●
●
●
●
●●
●
●
●
●
●
●
●
●
●
●
●
● ●
●
●
●
●●
●
●
●
●
●
●
●
●
●
●
●
●
●
●
●
●
●
●
●●
●
●
● ●
●
●
●
●
●
●
●
●
●
●
●
●
●●
●
●
●
●
●
●●
●
●
●
●
●
●
●
●●
●
●
●
●●
●●
●
●
●
●●
●
●
●
●
●
●
●
●
●
●
●●
●
●
●
●
●
●
●
●
●
●
●
●
●
●
●
●
●
●
●
●
●●
●
●
●
●
●
●
●
●
●
●
●
●
●
●●
●
●
●
●
●
●
●
●
●
●
●
●
●
●
●●
●
●
●
●
●
●
●
●
●
●●
●
●
●
●
●
●
●
●
●
●●
●
●
●
●
●
●
●
●
●
●
●
●
●
●
●
●
●
●
●
●
●
●
●●
●
●
●
●
●
●
●●
●
●
●
●
●
●
●
●●
●
●
●
●
●
●
●
●
●
●
●
●●
●
● ●
●
●
●
●
●
●
●
●
●
●
●
●
●●
●
●●
●
●
●
●
●
●
●
●
●
● ●
●
●
●
●
●
●
●
●
● ●
● ●●
●
●
●
●
●
●
●
●
●
● ●
●
●
●
●
●●
●
●
●
●
●
●
●
●
●
●
●●
●
●
●
●
●
●
●
●
●
●
●
●
●
●
●
●
●●
●
●
●●
●
● ●
●
●
●
●
●
●
●
●
●
●
●
●
●
●
● ●
●
●
●
● ●
●
●
●
●
●
●
●
●
●
●
●
●●
●
●
●
●
●
●
●
●
●
●
●
●
●
●
●
●●●
●
●●●●
●
●
●
●
●
●●
●
●
●●
●
●
●
●
●
●
● ●
●
●
●
●
●●
●
●
●●
●
●
●
●
●
●
●
●
●
●
●
●●
●●
●
●
●●
●●
●
●
●
●
●
●
●
●
●
●
●
●●
●
●
●
●●
●
●
●
●
●
●
●
●
●
●
●
●
●●
●
●
●●
●
●
●
●
●
●
●
●
●
●
●
●
●
●
●
●
●
●
●
●
●
●
●
●
●
●● ●
● ●
●
●
●
●
●
●
●
●
●
●
●
●●
●
●
●
●
●
●
●
●
●
●
●
● ●
●
●
●
●●
●●
●
●●
●●
●●
●
●
●
●
●●
●
●
●
●
●
●
●
●
●
●
●
●
●
●
●
●●
●
●
●
●
●
●
●
●
●
●
●●
●
●
●●
●
●
●
●
●
●
●
●
●
●
●
●
●
●
●
●
● ●
●
●
●
●
●
●
●
●
●
●
●
●
●
●
●
●
● ●
●
●
●
●
●
●
●
●
●
●
●
●
● ●●●
●
●
●
●
●●
●
●
●
●●
●
●
●
● ●
●
●
●
●
●
●
●
●
●
●
●
●
● ●
●
●
●
●
●
●●
●
●
●
●
●
●
●
●
●
●
●
●
●
●
●
●
●
●
●
● ●
●
●
●
●●●
●
●
●
●
●●
●
●●
●
●
●
●
●
●
●
●
●
●
●
●
●
●
●
●
●
●
●●
●
● ●
●
●
●●
●
●
●
●
●●
●
●
●
●
●●
●
●
●
●
●
●
●
●
●
●
●
●
●
●
●
●●
●
●
●
●
●
●
●
●
●
●
●
●
●
●●
●●
●
●●
●
●
●
●
●
●●●
●
●
●●
●
● ●
●
●
●
●
●
●●
●●
●●
●
●
●
●
●
●
●
●
●
●
●
●
●
●
●
●
●
●
●
●
●
●
●
●●
●●
●
●
●
●
●
●
●●
●
●
●
●
●
●
●
●
●
●
●
●●
● ●●
●
●
●
●
●●
●
●
●
●
●
●
●
●
●
●
●
●
●
●
●
●●
● ●
●
●
●
●●
●
●
●
●
●
●
●
●
●
●
●
●
●
●
●
●
●
●
●
●
●
●
●
●
●
●
●
●
●
●
●
●
●
●
●
●
●
●
●
●
●
●
●
●
●
●●
●
●
●
●
●
●
●
●
●
●
●
●
●
●
●
●
●
●
●
●
●●
●
●
●
●
●
●
●●
●●
●
●
●
●
●
●
●
●
●
●
●
●
●
●●
●
●
●
●
●
●
●
●
●
●
●
●
●●
●
●
●
●
●
●
●
●
●
●
●
●
●
●
●
●
●
●
●
●
●
● ●●
●
●
●
●●
●●
●
● ●
●
●
●
●
●
●
●
●
●
●
●
●
●
●●
●
●
●●
●
●
●
●
●
●
●
●
●
● ●
●
●
●
●●
●
●
●
●
●
●
●
●
●
●
●
●
●
●
●
●
●
●
●●●
●
●
●
●
●
●
●
●
●
●●
●
●
●
● ●
●
●
●
●
●
●
●
●
●
●
●
●
●
●
●
●
●
●
●
●
●
●
●
●
●
●
●●
●
●
●
●
●
●
●
●●
●
●
●
●
●
●
●
●
●
●
●
●
● ●
●
●
● ●
●
●
●
●
●
●
●
●
●
●
●
●
●
●●●
●
●
●
●
●
●
●
●
●●
●
●●
●
●
●
●
●
●
●
●
●
●●
●
●
●
●
●
●●
●
●
●
●
●●
●
●
●
●
●
●
●
●
●
●
●
●
● ●
●
●
●
●
●
●
●
●
●
●●
●
●
●
●
●
●
●
●
●●
●
●
●
●
●
●
●
●
●
●
●
●
●
●●
●
●●
●
●
●
●●
●
●
●
●
●
●
●
●
●
●●
●
●
●●
●
●
●
● ●
●
●
●
●
●
●
● ●
●
●
●
●
●●
●
●
●
●
●
●
●
●
●
●
●
●
●●
●
●●
●
●
●●
●
●●●
●
●
●
●
●
●
●●
●
●
●
●
●
●●
●
●
●
●
●
●●
●
●
●
●
●
●●
●
●
●
●
●
●
●
●
●●
●
●
● ●
●
●
●
●
●
●
●
●●
●
● ●
●
●
●
●
●
●
●
●
●
●●
●
●
●
●
●
●
●
●
●
●●
●
●
●
●
●
●
●
●
●
●
●
●
●
●
●
●
●
●
●
●
●
●
●
●
●
●
●
●
●●
●
●
●
●
●
●
●
●
●
●
●
●
●
●
●
●
●
●
●●
●●
●
●
●
●
●
●
●
●●
●
●
●
●
●
●
●
●
●
●
●
●
●
●
●●●
●
●●
●
●
●●
●
●
●
●
●
●● ●
●
●
●
●
●
●
●●
●●
●●
●●
●
●
●
●
●
●
●
●
●
●
●
●
●
●
●
●
●
●
●
●
●
●
●
●
●
●
●
●●●
●
●
●
● ●
●
●
●
●
●
●
●
●●
●●
●
●
●
●
●
●
●
●
●
●
●● ●
●
●
●
●
●
●●
●●
●
●
●
●
●●
●
●
●
●
●
●
●
●
●
●
●
●●
●
●●
●
●
●
●
●●
●
●
●
●
●
●
●
●
●
●
●
●
●
●
●
●
●●
● ●
●●●
●
●
●
●
●
●●
●
●
●
●
●●●
●
●
●
●
●
●
●
●●
●
●
●
●
●
●
●
●
●
●
●
●
●
●
●
●
●●
●
●
●
●
●
●
●
●
● ●
●
● ●●
●
●
●
●
●●
●
●
●
●
●
●●
●
●
●●
●
●
●
●
●
●
●
● ●
●
●
●
●
●●
●●
●
●
●
●
●
●
●
●
●●
●
●
●
●
●
●●
●
●
●
●
●
●
●
●
●
●
●
●
●
●
● ●
●●
●
●
●
●
●
●
●
●
●
●
●
●
●
●
●
●●
●
●●
●
●
●
●●
●
●
●
●
●
●
●
●
●
●
●
●
●
●
● ●
●
● ●●
●
●●
●
●
●
●
●
●
●
●
●
●●
●●
●
●
●
●
●
●
●
●
●
●
● ●
●
●
●
●
●
●
●
●
●
●
●●
●
●
●
●
●
●
●
●●
●
●
●
●
●
●
●
●
●
●●
●●
●
●●
●
●
●
●
●
●
●
●
●
●
●
●
●
●
●
●
●
●
●●
●
●
●
●
●●
●
●
●
●
●
●
●●
●
●
●
●
●
●
●
●
●
●
●
●
●
●
●
●
●
●
●
●
●
●
● ●
●
●
●
●
●
●
●
●
●
●
●
●●
●
●
●
●
●
●
●
●
●
●
●
●
●
●
●●
●
●
●
●
●
●
● ●
●●
●
●
●
●
●
●
●
●●
●
●
●
●
●
●
●
●
●
●
●
●
●●
●
●
●
●
●
● ●
●
●
●
●
●
●●
●
●
●
●
●
●
●
●
●
●
●
●
●
●
●
●
●
●●
●
●
●
●
●
●
●
●
●
●
●
●
●
●
●
●
●
●●
●
●
●●
●●●
●
●
●
●
●
●●
●
●
●
●●
●
●
●
●
●
●
●●
●
●
●
●
●
●
●
●
●
●
●
●
●●
●
●
●
●
●
●
●
●
●
●
●
●
●
●
●●●●●
●
●
●
●
●
●
●
●
●
●●● ●
●
●
●
●
●
● ●
●
●
●
●
●
●●
●
●
●
●
●
●
●
●
●
●
●
●
●
●
●
●
●
●●
●
●
●
●
●●
●●
●
●
●
●●
●●
●
●
● ●
●
●
●●
●
●
●
●
●
●
●
●
●
●
●
●
●
●
●
●
●
●
●
●
●
●
●
●
●
●
●
●
●
●
●
●
●
●
●
●
● ●
●
●
●
●
●
●
●
●●
●
● ●
●
●
●
●
●
●
●
●
●
● ●
●
●
● ●
●
●●
●
●●
●
●●
●●
●
●
●●
●
●
●
●
●
●
●
●
●
●
●
●
●
●
● ●
●
●
●
●
●
●
●
●
●
●
●
●●
●
● ●
●
●
●
●●
●
●
●
●
●
●
●
●
●
●
● ●
●●
●
●
●
●
●
●●
●
●
●
●
●
●
●
●
●
●
●
●
●
●
●
●●
●
●●
●
●
●
●
●
●
●
●
● ●
●
●
●
●
●
●
●
●
●
●
●
●
●
●
●
●
●
●
●●
●
●
●
●
●
●
●
●●
●
●
●
●
●
●
●
●
●
●
●
●
●
●
●
●
●
●
●
●
●
●
●
●●
●
●
●
●
●●
●●
●
●
●
●
●
●
●
●
●
●
●
●●
●
●
●
●●
●
●
●
●
● ●
●
●
●
●
●
●
●
●
●
●●
●
●
●
●
●
●
●
●
●
●
●
●
●
●
●
●
●
●
●●
●
●
●
●
●
●
●
●
●
●
●
●
●●
●
●
●
●
●
●
●
●
●
●
●
●
●
●●●
●
●
●
●
●
●
●
●
●
●
●
●
●●
●
●●
●
●●●
●
●
●●
●
● ●●
●
●
●
●● ●
●●●
●●
●●
●
● ●●
●
●●
●
●
●
●
●
●
●
●
●
●
●
●
●
●● ●
●
●
●
●
●
●
●
●
●
●
●
●
●
●●
●●
●
●●
●
●
●
●
●
●
●
●
●
●
● ●●
●
●
●
●
●●
●
●
●
●
●
●
●
●
●
●
●
●
●
●
● ●
●
●
●●
●
●
●●
●
●
●
●
●
●
●●●
●●
●
●
●
●
● ●
●
●
●
●
●
●
●
●
●
●
●
●
●
●
●
●
●●
●
●
●
●
●
●
●
●
●
●
●
●
●
●
●
●
●
●
●
●
●
●
●
●
●
●
●
●
●
●
●
●
●
●
●
●
●●
●
●●
●
●
●
●
●
●
●●
●
●
●
●
●
●
●●
●
● ●
●
●
●
●
●
●●
●
●
●
●
●
● ●
●
●
●
●●
●
●
● ●
●
●
●
●
●
●
●
●
●
●●
●
●
●
●
●
●
●
●
●
●
●
●
●
●
●
●●
●
●
●
●
●
●
●
●
●
●
●
●
●
●
●
●
●
●
●
●
●
●
●●
●
●
●
●
●●
●
●
●
●
●
●
●
●
●
●
●
●
●
●
●
●
●
●
●
●
●
●
●
●
●
●
●
●
●
●●
●
●
●
●
●
●
●
●●●
●
●
● ●
●
●
●
●●
●
●
●
●
●
●
●
●
●
●
●
●
●
●
●
●
●
●
●
●
●
●
●
●
●
●
●
●
●●
●
●●
●
●
●
●
●
●
●
●
●
●
●
●
●
●●
●
●
●
●
●
●
●
●
●
●●
●
●
●
●
●
●●
●
●
●
●
●●
●
●
●
●
●
●
●
●
●
●
●●
●
●
●
●
●
●
●
●
●
●
●
●
●
●
●
●
●
●●
●
●
●
●
●
●
●
●
●
●
●
●
●
●
●
●●
●
●
●
●
●
●
●
●
●
●●
●
●
●
● ●
●
●
●
●
●
●
●
●
●
●
●
●
●
●
●
●
●
●
●
●
●
●
●
●
●
●
●
●
●●
●
●
●
●
●
●●
●
●
●
●
●
●
●
●
●
●
●●
●
●
●
●
●
●
●
●
●
●
●
●
●
●
●
●●
●
●
●
●
●
●
●
●
●
●
● ● ●
●
●
●
●
●
●
●
●
●
●
●
●
●
●
●
●
●
●
●
●
●●
●●
●
●
●
●
●
●
●
●
●●
●
●
●
●
●
●
● ●
●
●
●
●
●●
●
●
●
●
●●
●
●
●
●
●
●●
●●
●
●
●
●
●
●●
●
●
●
●
●
●
●
●
●●
●
●●
●
●
●
●
●
●
●
●
●
●
●
●
●
●
●
●
●
●●
●
●
●
●
●
●
●
●
●●
●
●
●
●
●
● ●
●
●
●
●
●
●
●
●
●
●
●●
●
●
●
●
●
●
●
●
●
●
●
●
●
●
●
●
●
●
●
●●
●
●
●
●
●
●●
●
●
●
●
●
●
●
●
●
●
●
●
●
●
● ●
●
●
●
●
●
●
●
●
●●
●
●
●
●●
●
●●
●
●
●
●
●
●
●
●●●
●
●
●
●
●
●
●
●
●●
●
●
●
●
●
●
●
●
●●
●
●
●
●●
●●
●●
●
●
●
●
●
●
●
●
●
●
●
●
●
●
●
●
●
●●
●
●
●
●
●
●
●
●
●
●
●●●
●
●
●
●
●
●
●
●
●
●
●
●●
●
●
●
●●
●
●
●
●
●
●
●
●
●
●
●
●
●
●●
●
●
●
●
●
●
●
●
●
●
●
●
●●
●
●
●
●
●
●
●
●
●
●
●
●
●●
●
●●
●
●
●●
●
●
●
●
●●
●
●
●●
●
●
●
●
●
●
●
●
●
●
●●
●
●
●
●
●
●
●
●
●●
●
●
●
●
●
●
●
●
●
●
●
●
●●
●
●
●
●
●●
●
●
●●
●
●
●
●
●
●
●
● ●
●●
●
●
●
●
●
●
●
●
●
●
● ●
●
●
●
●
●●
●
●
●
●●
●
●
● ●
●
●
●
●
●
●
●
●
●
●
●
●●
●
●
●
●
●
●
●
●
●
●
●
●
●
●
●
●●
●
●
●
●
●
●
● ●
●
●
●
●
●
●
●
●
●
●
●
●
●
●
●
●
●
●
●●
●●
●
●
●
●
●
●
●
●
●
●●
●
●
●
●
●
●
●
●
●
●
●
●
●
●●
●
●●
●
●
●
●
●
●
●
●
●
●
●
●
●
●
●
●
●
●
●
●
●
●
●
●
●●
●
●●
●
●
●
●
●● ●●
●
●
●
●
●
●
●
●
●
●
●
●
●
●
●
●
●
●
●
●
●
●
●
●
●
●
●
●●
●
●
●
●
●●
●
●
●
●
●
●
●
●
●
●
●
●
●
●●
●●
●
●
●
●
●
●
●
●
●
●
●
●
●
●
●
●
●●
●
●
●
●
●
●
●
●
●
●
●
●
●●
●●●
●
●
●
●
●
●
●
●
●
●
●
●
●
●
●●
●
●
●
●
●
●
●
●
●
●●
●
●
●
●
●
●●
●
●
●
●
●●
●
●●
●
●
●
●
●
●
●
●●
●
●
●
●
●
●
● ●
●
●●
●
●
●
●
●
●
●
●
●
●●
●
●
●
●
●
●
●
●
●
●
●
●
●
●
●
●
●
●
●
●
●
●
●
●
●
●
●
●
●
●
●
●
●
●
●
●
●
●
●●
●
●
●
●
●
●
●
●
●
●
●
●
●
●●
●
●
●
●
●
●
● ●
●
●
●
●
●
●
●●
●
●
●
●●
●●
●
●
● ●
●
●
●
●
●
●
●
●●
●
●
●
0
50
100
150
200
0.00 0.25 0.50 0.75 1.00
Rank within Type
Inco
me
(tho
usan
ds o
f Eur
os)
Types
●
●
●
●
●
●
1
2
3
4
5
6
Income/Effort distribution across 6 Types (Obs. < 200.000 euros)
Figure 1: Type 1: Men with low parental occupation; Type 2: Women with low parental occupation; Type3: Men with mid parental occupation; Type 4: Women with mid parental occupation; Type 5: Men withhigh parental occupation; Type 6: Women with parental occupation. Database: Household heads 30 yearsold or older.
19
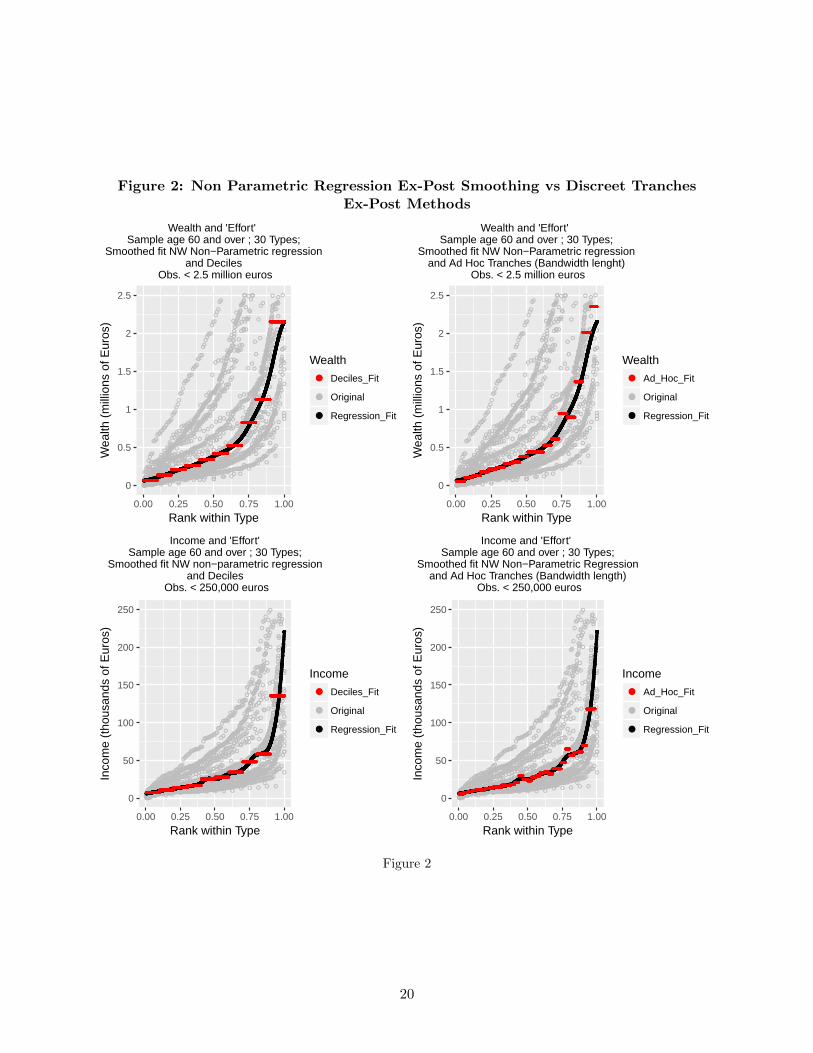
Figure 2: Non Parametric Regression Ex-Post Smoothing vs Discreet TranchesEx-Post Methods
●
●
●
● ●
●
●
●
●
●
●
●
●
●
●
●
●
●
●
●
●
●
●
●
●
●●
●
●
●
●
●
●
●
●
●
●
●
●
●
●
●
●
●
●
●
●
●●
●
●
●
●●
●
●
●
●
●
●
●
●
●
●
●
●●●
●
●
●
●
●
● ●
●●
●
●●
●
●
●
●
●
●
●
●
●
●
●
●
●
●
●●
●
●
●
●
●
●
●
●
●●
●
●
●
●
●
●
●
●
●
●
●
●●
●
●
●
●
●
●
●
●
●
●
●
●
●
●
● ●●
●
●
●
●●
●
●
●
●●
●
●
●
●
●
●
●
●
●
●
●
●
●
●
●
●
●
●
●
●
●
●●
●
●
●
●
●
●
●
●
●
●
●
●
● ●●
●
●
●
●
●
●
●
●●
●
●
●
●
●
●
●
●
●
●
●
●
●●
●
●
●
●
●
●
●
●
●
●
●
●
●
●
●
●
● ●
●
●
●
●
●
●
●
●
●
●
●
●
●
●
●
●
●●
●
●
●
●
●
●
●●●
●
●
●
●●
●
●
●
●●
●
●
●
●
●
●
●
●
●
●
●
●●●
●
●
●
●
●
●
●
●
●
●
●
●
●
●
●
●
●
●●
●
●
●
●
● ●●
●
●●
●
●
●
●
●
● ●
●●
●
●
●
●
●●
●
●
●
●
●
●
●●
●
●
●
●●
●
●
● ●
●
●
●
●
●●
●
●
●
●
●
●
●
●
●●
●●
●
●
●
●
●
●●
●
●
●
●
●
●
●
●
●
●
●
●
● ●
●
●
●
●
●
●
●
●
●
●
●
●
●
●
●
●
●
●
●
●
●●
●
●
●
●
●
●
●
●
●
●
●
●
●
●
●●
●
●
●
●
●
●
●
●
●
●
●
●
●
● ●
●
●
● ●
●
●
●
●
●
●
●
●
●
●
●
●
●
●
●
●
●
●
●
●
●
●
●
●
●
●
●
●
●
●
●
●
●
●
●
●
●
●
●
●
●● ●
●
●
●
●
●
●
●
●
●
●
●
●
●
●
●
●●
●
●
●
●
●
●
●●
●
●●
●
●
●
●
●
●
●
●
●
●
●●●
●
●
●
●
●
●
●
●
●
●
●
●
●
●
●
● ●
●
●
●
●
●
●
●
●
●
●●
●
●
●
●
●
●
●
●
●
●●
●
●
●
●
●
●●
●
●
●
●
●
●●
●
●
●
●
●
●
●
●
●
●
●
●
●
●
●
●
●
●
●
●●
●
●
●
● ●
●
● ●●
●
●
●
●
●
●
●
●
●
●
●
●
●
●
●
●
●●
●
●
●
●
●
●
●
●
●
●
●
●
●
●
●
●
●
●
●
●
●
●
●
●●
●
●
●
●
●
●
●
●
●
●
●
●
●
●
●
●
●
●
●
●
●
●
●
●
●
●
●
●
●
●
●●
●
●
●
●
●
●
●
●
●
●
●
●
●
●
●
●
●●
●
●
●
●
●
●
●
●
●●
●
●
●
●
●
●
●
●
●
●
●
●
●
●
●
●
●
●
●
●
●
●
●
●
●
●
●
●●●
●
●
●
●
●
●
●
●
●
●
●
●
●
●
●
●
●
●
●
●
●
●
●
●
●
●
● ●●
●●
●
●
●
●
●
●
●
●
●
●●
●
●
●
●
●
●
●
●
●
●
●●
●
●
●
●
●●
●
●
●
●●
●●
●
●
●
●
●●
●
●
●
●
● ●
●●
●●
●
●
●
●
●
●
●
●
●
●
●
●
●
●
● ●
●
●
●
●
●
●
●
●
●
●
●
●
●
●
●●
●
●●
●●
●
●
●
●
●
●
●
●
●
●
●●
●●
●
●●
●
●
●
●
●
●
●
●
●
●
●
●
●
●
●
●
●
●
●
●●
●
●
●
●●
●
●
●
●
●●
●
●
●
●
●
●
●
●
●
●
●●●
●
●
●
●
●
●
●
●
●
●
●
●
●
●
●
●
●
●
●
●
●
●
●
●
●
●
●
●
●
●
●
●●
●
●●
●
●
●
●
●
●
●
●●
●
●
●
●
●
●
●●
●
●
●
●
●
●
●●
●
●
●
●
●
●
●
●
●
●
●
●
●
●
●
●
●
●
●●
●
●
●
●
●
●
●
●
●
●
●
●●
●
●
●
●
●
●
●
●
●
●
●
●
●
●●●
●
●
●
●
●
●
●
●
●●
●
●
●
●
●
●
●
●
●
●
●
●
●
●●
●●
●
●
●
●
●
●
●
●
●
●
●
●
●
●
●
●
●
●
●
●●
●
● ●
●
●
●
●
●
●
●
●
●
●●
●
●
●●
●●
●
●
●
●
●
● ●
●
●
●
●●
●
●
●
●
●
●
●
●
●
●
●
●
●
●
●
●
●
●
●
●●
●
●
●
●
●
●
●
●●
●
● ●
●
●
●
●
●
●
●
●
●
●
●
●
●
●
●
●
●
●
●
●
●
●●
●
●
●
●
●
●
●
●
●
●●
●
●
●
●
●
●
●
●●
●
●
●
●●
●
●
●
●
●
●
●
●●
●
●
●●
●
●
●
●
●
●
●
●
●
●
●
●
●
●
●
●
●
●●
●
● ●
●
●●
●
●
●
●
●
●
●
●
●
●
●
●
●
●●
●●
●
●
●
●●
●
●
●
●
●
●
●
●
●
●
●
●
●
●
●
● ●
●
●
●
●
●
●
●
●
●
●
●
●
●●
●
●
●
●
●
●●●
●
●
●
●
●
●
●
●
●
●
●
●
●
●
●
●
●
●●
●
●
●
●
●
●
●
●
●
●
●●
●
●
●●
●
●
●
●
●
●
●
●
●
●
●
●
●
●
●
●●
●
●
●●
●
●
●
●
●
●
●●
●●●
●
●
●●
●
●
●
●
●
●
●
●
●
●
●●
●
●
●
●
●
●
●
●
●
●
●
●
●
●
●
●
● ●
●
●
●
●
●
●
●
●●
●
●
●
●
●
●
●
●
●
●
●
●
●
●
●
●● ●
●●
●
●
●
●
●
●
●
●
●
●
●
●
●
●
●
●
●
●
●
●
●
●
●
●
●
●
●
●
● ●
●●
● ●●
● ●●
●
●
●
●
●
●
●
●
●
●
●
●
●●
●
●
●●
●
●
●●
●
●
●
●
●
●●●
●
●
●
●
●
●
●
●
●
●
●● ●
●
●
●
●
●
●
●
●
●●
●●
●
●
●
●
●
●
●
●
●
●
●
●
●
●
●
●
●
●
●
●
●
●
●
● ●
●
●●
●
●
●
●
●
●
●
●
●
●
●
●
●
●
●●●
●●
●●
●
●●
●
●
●
●
●
●
●
●●
●
●
●
●
●
●
●
●
●●
●
●
●
●
●
●● ●
●
●
●
●
●
●
●
●
●
●
●
●
●
●
●
●
●
●
●
●
●
●
●
●
●●
●
●
●
●
●
●
●
●●
●
●
●
●
●
●
●
●
●
●
●
●
●
●
●
●
●●
●
●
●
●
●
●●
●
●●
●
●
●
●
●
●
● ●
●
●
●●
●
●
●
●
●●
●●
●
●
●
●
●
●
●
● ●
●
●
●
●●
●
●
●
● ●
●
●
●
●
●●
●
●
● ●
●
●
●
●
●
●
●
●
●
●
●
●
●
●
●
●
●
●
●
●
●
●
●
●
●
●
●
● ●
●●
●
●
●
●
●
●●
●
●
●●
●
●
●
●
●
●
●
●●
●
●
●
●
●
●
●
●
●
●
●●
●
●
●
●
●
●
●
●●
●
●
●
●
●
●
●
●
●
●
●●
●
●
●
●
●
●
●
●
●
● ●
●
●
●
●
● ●
●
●
●
●●
●
●
●
●
●●
●
●
●●
●
●
●
●
●
●
●
●
●
●●
●
●
●
●
●
●
●
●
●
●
●
●
●
●
●
●
●
●
●
●
●
●
●
●
●
●
●
●
●
●
●
●
●
●
●
●
●
●
●
●
●
●
●●
●
●
●
●
●
●
●
●
●
●
●
●●
●
●
●
●●
●
● ●
●
●
●
●
●
●
●●●
●●
●
●
●
●
●
●
●
●
●
●
●
●
●●
●
●
●
●
●
●●●
●
●
●
●●
●
●
●
●
●
●● ●
●
●
●
●●
●
●
●
●
●●
●
●
●
●
●
●●
●
●
●
●●
●
●
●
●
●
●
●
●
●
●●
● ●
●
●
●
●●
●
●
●
●
●
●
●
●
●
●
●
●
●
●
●
●
●
●
●
●●
●
●
●
●
●●
●
●
●
●
●
●●
●●
●
●
●
●●
●
●
●
●
●●
●
●●
●
●
●
●
●
●●
●
●●
●
●
●
●
●
●
●
●
●
●
●
●
●
●
●
● ●
●
●●
●
●
●
●
●
●
●
●
●
●
●
●
●
●
●
●
●
●
●
●
●
●
●●
●
●
●
●
●
●●
●
●
●
●
●
●
●
●
●
●
●
●●
●
●●
●
●
●
●
●
●
●●
●
●
●
●
●
●
●
●
●
●
●
●
●●
●
●
● ●
●
●
●
●●
●
●●
●
●
●●
● ●
●
●
●
● ●
●
●●
●
●
●
●
●
●
●
●
●
●
●
●
●
●
●
●
●
●
●
●
●
●
●
●
●
●
●
●
●
●
●
●●
●
●
●
●
●
● ●
●
●●
●
●
●
●●
●
●
●
●
●
●
●●
●
●
●
●
●
●
●
●
●
●●
●
●
●
●
●●
●
●
●
●
●
●●●
●
●
●
●
●
●
●
●
●
●
●
●
●
●
●
●
●
●
●
●●
●
●
● ●
●
●
●
●
●
●
●
●
●
●
●
●●
●
●
●
●
●
●
●
●
●
●
●
● ●
●
●●
●
●
●
●
●
●
●
●
●●
●
●
●
●
●
●
●
●●
●
●
●
●
●
●
●
●●
●
●
●
●
●
●
●
●
●
●
●
●
●
●
●
●
●
●
●
●
●
●●
●
●
●
●
●
●
●
●
●
●
●
●
●
●
●
●●
●
●
●
●
●
●
●
●●
●
●
●
●
●
●
●
●
●
●
●
●
●
●
●
●
●●
●
●
●
●
●
●
●
●
●
●●
●
●
●
●
●
●
●●
●
●
●
●
●
●
●
●
●
●
●
●
●
●
●
●
●
●
●
●
●
●●
●
●
●
●
●
●
●
●
●
●
●
●
●
●
●
●
●
●
●
● ●
●●
●
●●
●
●
●
●
●
●
●
●
●
●
●
● ● ●
●
●
●
●
●
●●
●
●
●
●
● ●
●
●
●
●
●
●
●
●
●●
●
●●
●
●
●
●
●
●
●
●
●
●
●
●●
●
●
●
●
●
●
●
●
●
●
●
●
●
●
●
●
●●
●
●
●
●
●
●
●●
●
●●
●
●
●●
●
●
●
●
●
●
●
●
●●
●
● ●
●
●
●
●
●
●●
●
●
●
●
●
●
●
●
●
●
●
●
●
●
●
●
●
●
●
●
●
●●
●
●
●
●●
●
●
●
●●
●
●
●●
●
●●
●
●
●
●
●
●
●
●
●
●
●●●
●●
●●
●
●●
●
●
●
●
●
●
●
●●
●
●
●
●●●
●
●
●●●
●
●
●
●
●
●
●
●
●
●
●
●
●
●
●
●
●
●
●●
●
●
●
●
●
● ●
●
●
●
●●
●
●
●
●
●
●
●
●
●
●●
●
●
●
●
●
●
●
●
●
●
●
●
●
●
●
●
●
●
●
●
●
●
●
●
●
●
●
●●
●
●
●
●
●
●
●
●●
●
●
●
●● ●
●
●
●
●
●
●
●
●
●
●
●
●
●
●
●
●
●
●
●●
●
●
●
●
●
●
●
●
●
●
●
●
●●
●
●
●●
●
●
●
●
●
●
●
●
●
●
●
●
●
●
●
●
●
●
●
●
●
●●
●
●
●
●
●
●
●
●
●
●
●
● ●
●
●
●
●
●
●
●
●
● ●●
●
●
●
●
●
●
●
●
●
●
●
●
●
●●
●
●
●
●
●
●
●
●
●
●
●
●
●●
●●
●
●●
●●
●●
●
●
●
●
●
●●
●
●
●
●
●
●
●
●
●
●●
●
●
●
●
●
●
●●
●
●
●
●
●
●
●
●
●●
●
●
●●
●
●
●
●
●
●
●
●
●
●
●
●
●
●●
●
●
●
●
●
●
●
●
●●
●
●
●
●
●
●●
●
●●
●
●
●
●●
●
●
●
●
●
●●
●
●
●
●
●
●
●
●
●
●
●
●
●
●
●
●
●
●
●●
●
●●
●
●●
●●
●●
●
●
●
●
●
●
●
●●
●●
●
●
●
●
●
●●
●
●
●
●
●
●
●
●
●
●
●
●
●
●
●
●
●
●
●
●
●●
●
●●
●
●
●
●●
●
●
●
●
●
●●
●
●
●
●
●
●
●
●
●
●
●
●●●
●
●●
●●
●
●●
●
●
●
●
●
●
●●
●
●
●
●
●
●
●
●
●●
●
●
●
●
●
●●
●
●●
●
●
●●
●
●
●
●
●
●
●●
●
●
●
●
●●
●●
●
●
● ●
●●
●
●
●
●
●
●
●
●
●
●
●
●
●●
●
● ●
●
●●
●
●●
●
●
●
●
●
●
●
●
●
●
●
●
●
●
●
●
●
●
●
●
●
●
●●
●●
●
●
●
●
●
●
●●
●
●
●
●
●
●
●●
●
●
●
●
●
●
●
●
●
●●
●
●
●
●
●●
●
●
●
●
●
●
●
●
●
●
●●
●
●
●●
●
●
●
●
●
●
●
●
●
●
●
●
●●
●
●
● ●
●
●
●
●
●
●
●●
●
●●
●
●
●
●
●
●
●
●
●
●●
●
●
●●
●
●
●
●
●
●
●
●
●
●
●
●
●
●
●
●
●
●
●
●
●
●
●
●
●
●
●
●
●
●
●
●
●
●●
●
●
●●
●
●
●
●
●
●●
●
●
●
●
●
●
●
●
●
●
●
●
●
●●●●
●
●
●●
●
●
●
●
●
●
●
●
●
●
●
●
●
●●●
●
●
●●
●
●
●
●
●
●
●●
●
●
●
●●
●
●
●
●
●
●
●●
●
●
●●
●
●
●●
●
●
●
●
●
●
●
●
●
●
●●
●
●
●●
●
●
●
●●
●
●
●
●
●
●
●
●●
●
●
●
●●
●
●●
●
●
●
●
●
●
●
●●
●
●
●
●
●
●
●
●
● ●
●
●●
●
●●●
●
●
●
●
●
●
●
●
●
●
●
●
●
●●
●
● ●
●
●
●
●
●
●
●
●
●
●
●
●
●
●
●
●
●
●
●
●
●●
●
●
●
●
●
●
●
●●
●●
●
●
●
●
●
●
●
●
●
●
●● ●
●
●
●
●
●
●●
●
●
●
●
●
●
●
●
●
●
●
●
●●
●
●
●
●●
●
●
●
●
●
●
●
●
●●
●●
●
●●●●
●
●
●
●
●
●
●
●
●
●
●●
●
●
●
●
●
●●
●
●
●
●
●
●
●
●
●●
●
●
●
●
●
●●
●
●
●
●●
●
●
●
●
●
●
●
●
●
●
●
●
●
●
●
●
●
●
●
●
●
●
●●
●
●
●
●
●
●
●
●
●
●
●
●
●
●
●
●●
●
●
●
●
●
●
●
●
●●
●
●●
●
●
●
●●
●
●
●
●
●●
●
●
●
●
●
●
●
●
●
●
●
●
●
●
●●
●
●
●
●
●
●
●
●
●
●
●
●
●
●
●
●
●
●
●
●
●
●
●
●
●
●
●
●
●
●
●
●
●
●
●
●
●
●
●
●
●
●
●
●
●●
●
●
●
●
●
●
● ●
●
●
●
●
●
●
●
●
●
●
●
●
●●
●●●
●
●
●
●
●
●
●
●
●
●
●
●
●
●●
●
●
●
●
●
●
●●
●●
●
●
●
●
●
●
●
●
●
●
●
●
●
●
●
●
● ●
● ●
●
●
●
●
●●
●
●●
●
●
●
●●
●
●
●
●
●
●
●
●
●
●
●
●
●
●●
●
●
●
●
●
●
●●
●
●●
●
●
●
●●
●
●
●
●
●●
●
●
●
●
●
●
●●
●
●
●
●
●
●
●
●
●
●
●
●
●
●
●
●
●
●●
●
●●
●
●
●
●
●
●
●●
●●
●
●
●●
●
●●
●
●
●
●
●
●
●
●
●
●
●●
●
●
●
●
●
●
●
●
●
●
●
●
●
●
●●
●
●
●
●
●
●
●
●
●
●
●
●
●
●
●
●
●●
●
●
●●
●
●
●
●
●
●
●
●
●
●●●
●
●
●
●
●
●
●
●
●
●
●● ●
●
●
●
●
●●
●●
●
●
●●
●
●
●
●
●●
●
●
●
●
●
●
●●
●
●
●
●
●
●
●●
●
●
●
●
●
●
●
●●
●
●
●
●
●
●
●
●
●
●
●
●
●
●
●
●
●
●●
●●
●
●
●
●
●
●
●●
●
●
●●
●
●
●
●
●
●
●
●
●
●
●
●
●
●
●
●
●
●
●
●●
●
●
●
●●
●
● ●
●
●
●
●
●
●
●●
●
●
●
●
●
●
●
●
●
●
●
●
●
●
●
●
●
●
●
●
●
●
●
●
●
●
●
●
●
●
●
●
●
●
●
●
●●
●
●
●
●
●
●
●
●●
●
●
●
●
●
●
●
●
●
●
●
●
●
●
●
●●
●
●●
●
●
●●●
●
●
●●
●
●
●
●
●●
●
●
●
●
●
●
●
●
●
●
●●
●●
●
●
●
●●
●
●●
●
●
●
●
●
●
●
●
●
●
●●
●
●●
●●
●
●
●
●
●
●
●
●
●
●
●
●
●
●
●
●
●
●
●
●●
●
●
●
●●
●
●
●
●
●
●
●
●●
●
●
●●
●
●
●●
●
●
●
●
●
●
●●
●
●
●
●
●●
●
●
●
●
●
●
●
●
●
●
●
●
●
●
●
●
●
●
●
●
●
●
●
●
●
●
●
● ●
●
●
●
●
●
●
●
●
●
●
●
●
●
●
●
●
●
●
●
●
●
●
●
●
●
●
●
●
●
●
●
●
●●
●
●
●
●
●
●●●
●
●
●
●
●
●
●
●
●
●●
●
●
●
●
●
●
●
●
●
●
●
●
●
●
●
●
●
●
●
●●
●
●
●
●
●
●
●
●
●
●
●
●●
●
●
●
●
●
●
●
●●
●
●
●●
●
●
●
●
●
●
●
●
●●
●
●
●●
●●
●
●
●
●
●
●
●
●
●
●
●
●
●
●
●
●
●
●
●
●
●●
●
●
●
●●
●
●
●
●
●
●
●
●
●
●
●
●
●
●
●
●
●
●
●
●
●● ●●
●
●
●
●
●
●
●
●
●
●
●
●
●
●
●
●
●●
●
●
●●
●
●
●
●
●
●
●
●
●
●
●
●
●
●
●
●
●
●
●
●
●
●
●
●
●
●
●
●
●
●
●
●
●●
●
●
●
●
●
●
●
● ●
●
●
●
●
●
●
●
●●
●
●
●
●
●
●
●●
●
●
●●
●
●
●
●
●
●
●
●
●
●
●
●
●
●●●
●
●●
●
●
●
●
●
●
●
●
●
●
●
●
●
●●
●
●
●
●
●
●
●●
●●
●
●
●
●
●
●
●
●
●
●
●
●
●
●
●
●
●
●
●
●
●
●
●
●
●
●
●
●
●
●
●
●
●
●
●
●
●
●
●●●
●
●
●
●
●
●
● ●
●●
●
●
●
●
●
●
●
●
●
●
●
●
●
●
●
●
●
●
●
●
●
●
●
●
●
●
●
●
●
●
●
●
●●
●
●
●●
●
●
●
●
●
●
●
●
●
●
●
●
●
●
●
●
●
●
●●
●●
●●
●
●
●
●
●
●
●
●
●
●●
●
●
●
●●
●
●
●
●
●
●
●
●
●
●●
●
●
●
●
●
●
●
●
●
●
● ●●
●
●
●
●
●
●
●
●
●
●
●●
●
●
●
●
●
●●
●
●
●
●
●
●
●
●
●
●
●
●
●
●
●●
●
●●
●
●
●●
●●
●
●
●
●
●
●●
●
●● ●
●
●
●
●●
●
●
●
●
●
●●
●
●
●
●
●●
●
●
●
●
●●
●
●
●
●
●●
●
●
●
●
●
●
●
●
● ●●●
●
●
●
●
●
●
●
●
●●
●
●
●
●
●
●
●
●
●
●
●
●
●
●
●
●
●
●
●
●
●
●
●●
●
●●
●
●●
●
●
●
●
●
●●
●●
●
●
●
●
●
●
●
●●
●
●
●
●●
● ●
●
●
●
●
●
●
●
●
●
●
●
●
●
●
●
●
●
●
●
●
●●●
●
●
●
●
●
●
●
●
●
●
●
●
●
●
●
●
●
●
●
●
●
●
●
●
●
●
●
●
●
●
●
●
●
●
●
●
●
●
●
●●
●
●
●
●
●
●
●●
●
●
●●
●
●
●
●
●
●
●
●
●
●
●●
●
●
●
●
●
●
●
●
●
●
●
●
●
●●
●
●
●
●●
●●
●
●●
●
●●
●●
●
●
●
●
●●
●
●
●
●
●
●
●●
●
●
●
●
●
●
●
●
●
●
●
●
●
●
●
●
●
●●●
●
●●●
●
●
●
●
●
●●
●
●
●
●
●●●
●●
●
●
●
●
●
●
●
●
●
●
●●
●
●
●
●
●●●
●
●
●
●
●
●
●
●
●
●●
●
●
●
●
●
●
●
●
●●●
●
●
●
●
●●
●
●
●
●
●
●
●
●
●
●
●
●
●
●
●
●
●
●
●
●●
●
●
●
●●
●
●●
●
●
●
●
●
●
●
●
●
●
●
●
●
●
●
●
●
●
●●●
●
●
●●
●
●
●
●
●
●
●
●
●
●●
●
●
●
●
●
●
●
●
●
●
●
●●
●
●
●
●●
●
●
●
●
●
●
●●
●
●
●
●
●
●
●
●●
●
●
●
●
●
●
●
●
●●
●●
●
●
●
●●
●
●
● ●
●
●
●
●
●
●
●
●
●
●
●
●
●
●●
●
●
●
●
●
●
●
●
●
●
●
●
●
●
●
●
●
●
●
●
●
●
●
●
●
●●
●●
●
●●
●
●
●
●
●●
●●
●
●
●
●
●
●
●
●
●
●
●
●
●
●
●
●
●
●
●
●
●
●
●
●●
●
●
●
●
●
●
●
●
●
●
●
●
●
●
●
●
●
●
●
●
●
●●
●
●
●
●
●
●
●
●
●
●●
●
●
●
●
●
●
●
●
●
●
●
●
●
●
●
●
●
●
●
●●
●
●
●
●
●
●
●
●
●
●
●●
●
●
●
●
●
●
●
●
●
●●
●
●●
●●
●
●
●
●●
●
●
●
●
●
●
●
●
●
●
●
●
●●
●
●
●
●
●
●●
●
●
●
●
●●●
●
●
●
●
●●
●
●
●
●
●
●
●
●
●
●
●
●
●
●
●
●
●●
●
●
●
●
●
●
●
●
●
●
●
●
●
●
●
●
●
●
●●
●
●
●
●
●
●
●
●
●
●
●
●
●
●
●
●
●
●
●
●
●
●
●
●
●
●
●
●
●●
●
●
●
●
●
●
●
●●
●
●
●
●
●
●●
●
●
●
●
●
●
●
●
●
●
●
●●
●
●
●
●
●
●
●
●●
●
●
●
●
●
●●
●
●
●
●
●
●
●
●
●
●●
●
●●
●
●
●
●
●
●
●
●
●
●
●
●
●
●
●
●
●
●
●
●
●
●
●
●
●
●
●
●
●
●
●
●
●
●
●
●
●
●
●
●
●
●
●
●
●
●
●●
●
●
●
●
●
●
●
●
●
●
●
● ●
●
●
●
●
●
●
●
●
●
●
●
●
●
●●
●
●
●
●
●
●
●
●●
●
●
●
●
●
●
●●
●
●
●
●
●
●
●
●
●
●
●
●
●
●
●
●●
●
●
●●
●
●
●
●
●
●
●
●
●
●
●
●●
●
●
●
●
●
●
●
●
●
●
●
●
●
●
●
●
●
●
●●
●
●
●
●
●
●
●
●
●●
●
●
●
●●
●●
●●
●●
●
●
●
●
●●
●
●
●
●
●
●
●
●
●
●●
●
●
●
●
●
●
●●
●
●
●
●
●●●
●
●
●
●
●
●
●
●
●
●
●
●
●
●
●
●
●
●
●
●
●
●
●
●
●
●
●
●
●
●
●
●
●
●
●
●
●
●
●
●
●
●
●
●
●
●
●
●●
●
●
●
●
●●
●
●
●●
●●
●
●
●
●
●●●
●
●
●
●
●
●
●
●
●
●●
●
●
●
●
●
●
●
●
●
●
●
●
●
●
●
●
●
●
●●
●
●
●
●
●●
●
●
●
●
●
●
●
●
●
● ●
●
●
●
●
●
●
●
●
●
●
●
●
●●●
●
●
●
●
●
●
●
●
●
●
●
●●
●
●
●
●
●●
●
●
●
●
●
●
●
●
●
●●
●
●
●
●
●●
●
●
●
●
●
●
●
●
●
●
●
●
●
●
●
●
●
●
●
●
●
●
●
●
●
●
●
●
●
●
●
●
●
●
●
●●
●●
●
●
●
●
●
●
●
●
●
●
●●●
●
●●●
●
●
●
●
●
●
●
●
●
●
●
●
●
●●
●
●
●
●
●
●
●
●
●
●
●
●
●
●
●●
●
●
●
●
●
●
●
●
●
●
●
● ●
●●
●
●
●
●
●
●
●
●
●
●●
●●
●
●
●●
●
●
●
●●
●
●
●●
●
●
●
●●
●●
●
●●
●●●
●
●
●●
●
●
● ●
●
●
●
●
●
●
●
●
●
●
●
●
●
●
●
●
●
●●
●
●
●
●
●
●
●
●
●
●
●
●
● ●
●
●
●
●
●
●
●
●
●
●
●
●
●
●●
●
●
●
●
●
●
●
●
●●
●
●
●
●
●
●
●
●
●
●
●
●
●●
●
●
●
●
●
●
●●
●
●
●
●
●
●
●
●
●
●
●
●
●
●
●
●
●
●
●
●
●
●
●
●
●
●
●●
●●
●
●
●
●
●
●
●
●●
●●
●
●
●
●
●
●●
●
●
●
●
●
●
●
●
●
●
●
● ●
●
●
●
●
●
● ●
●●
●
●●
●
●
●
● ●
●
●
●
●
●
●
●
●
●
●
●
●
●
●
●
●
●
●
●●
●
●
●
●
●
●
●
●●
●
● ●
●
●
●
●●
●
●
●
●
●●
●
●
●
●
●●
●
●
●
●●
●
●
●
●
●
●
●
●
●
●
●
●
●
●●
●
●
●
●
●
●
●●
●
●
● ●
●●
●
●
●
●●
●
●
●
●
●
●
●
●
●
●
● ●
●
● ●
●
●●
●
●
●
●
●
●
●
●
●
●
●
●
●
●
●
●
●
●
●
●
●
●
●●
●●
●
●
●
● ●
●
● ●
●
●
●
●
●
●
●●
●
●
●
●
●
●
●
●
●
●
●
●
●
●
●
●●
●
●
●
●
●
●
●
●
● ●
●●
●
●
●●
●
●
●
●
●
●
●
●
●
●
●
●
●●
●
●
● ●
●
●
●
●
●
●●●
● ●●
●
●
●
●
●
●
●
●
●
●●
● ●
●
●
●
●
●
●
●
●
●
●
●
●
●
●
●
●
●
●
●
●●
●
●
●
●
●
●
●
●
●
●
●
●
●
●
●
●
●
●
●●
●
●
●
●
●
●
●
●
●
●
●
●
●
●
●
●
●
●
●
●
●●● ●
●
●
●●
●
●
●
●
●
●
●
●
●
●
●
●
●
● ●●
●
●
● ●
●
●
●
●
●
●
● ●
●
●
●
●●
●
●
● ●
●
●
●●
●
●
●
●
●
●
●
●
●
●
●
●
●
●
●
●
●
●
● ●
●
●
●●
●
●●
●●
●
●
●
●
●
●
●
●
●
●
●
●
●●
●
●●
●
●
●
●
●
●
●●●
●
●
●
●
●
●
●
●
● ●
●
●●
●
●●
●
●●
●
●
●●
●
●●
●
●
●
●
●
●
●
● ●
●
●
●
●
●
●
●
●
●
●
●
●
●
●
●
●
●●
●
●
●●
●
●
●
●
●
●
●●
●
●● ●
●
●
●
●
●
●
●
●
●
●
● ●
●
●
●
●
●
●
●
●
●
●
●
●
●
●
●
●
●
●
●
●●●
●
●
●
●
●
●
●
●
●
●
●
●
●
●
● ●
●
●
●●
●
●
● ●●
●
●
●
●
●
●
●●
●
●
●
●
●
●●
●
●
●
●
●
●
● ●
●
●
●
●
●●
●
● ●
●
●
●
●
●
●
●
●●
●
●
●
●
●
●
●
●
●
●
●
●
●
●
●
●
●
●
●●
●
●
●
●
●
●
●
●
●
●
●
●
●
●●
●
●
●
●
●
●
●
●
●
●
●
●
●
●●
●
●
●
●●
●
●●
●
●
●
●
●
●
●
●
●
●
●●
●
●
●
●
●
●●
●
●
●
●
●
●
●
●
●
●
●
●
●
●
●
●
●
●
●
●
●●
●
●
●
●
● ●
●
●
●
●
●
●
●
●
●
●
●
●
●
●
●
●
●●
●
●
●
●
●
●
●●
●
●
●
●
●
●
●
●
●
●
●
●
●●
●●
●
●
●
●
●
●
●
●
●
●
●
●
●
●
●
●
●
●
●
●
●
●
●
●
●●
●
●
●
●
●
●
●
●
●
●
●
●
●
●
●
●
●
●
●●
●
●
●
●
●
●
●
●●
●
●
●
●●
●
●
●
●
●
●
●
●
●
●
●
●
●
● ●
●
●
●
●
●
●
●●
●
●●
●
●
●
●
●
●
●
●
●
●
●
●
●
●
●
●
●
●●
●
●
●
●●
●
●
●
●●
●
●
●
●
●
●
●
● ●
●
●●
●
●
●
●
●
●
●●
●●
●
●
●
●
●
●●
●
●
●
●
●
●
●
●
●
●
●
●
●
●
●
●
●
●
●
●
●
●
●
●
●
●
●●
●
●
●
●
● ●
●
●
●
●
●
●
●
●
●
●
●●
●
●
●
●
●
●
●
●
●
●
●
●
●
●●●
●
●
●
●
●
●
●
●
●
●
●● ●
●
●
●
●
●
●
●●
●
●
●●
●
●
●
●
●●
●●
●
●
●
●
●
●
●
●
●
●
●
●
●●
●
●
●
●
●
●
●
●
●
●
●
●
●
●
●●
●
●
●
●
●
●
●
●
●
●
● ●
●●
●
●
●
●
●
●
●
●
●
●
●●
●
●
●
●
●
●
●
●
●
●
●
●
●
●
●
●
●
●
●
●●
●
●
●
●
●
●
●●
●
●
●
●
●
●
●
●
●
●
●
●
●
●
●
●
●
●
●
●
●
●
●
●
●
●
●
●●
●
●
●
●
●
●
●
● ●
●
●
●
●
●
●
●● ●●
●
●
●
●
●
●●
●
●
●
●
●
●
●
●
●
●
●
●
●
●
●
●●
●
●
●
●
●
●
●
●
●
●●●
●
●
●
●
●
●
●
●
●
●
●
●
●
●
●
●
●●
●●
●
●
●
●●
●
●●
●
● ● ●
●
●
●
●
●
●
● ●
●
●
●
●●
●
●
●
●
●
●
●
●
●
●
●
●
●
●
●
●
●
●
●
●●
●
●
●
●●
●
●
●
●
●
●
●
● ●
●
●
●
●●
●
●●
●
●
●
●
●
●
● ●
●
●
●
●
●
●
●
●
●
●
●
●
●
●
●
●
●
●
●
●
●
●
●
●
● ●
●
●
●
●
●
●
●
● ●
●
●
●
●
●
●
●
●
●
●
●
●
●
●
●
●
●
●
●
●
●
●
●
●
●
●
●
●
●
●●
●
●
●
●
●
●
●
●
●
●●
●
●
●
●
●
●
●
●
●
●●
●
●
●
●
●
●
●
●
●
●
●
●
●
●
●
●
●
●
●
●
●
●
●
●
●
●
●
●
●
●
●
●
●
●
●
●
●
●
●
●
●
●
●
●
●
●●
●
●
●
●
●
●
●
●
●●
●
●
●●
●
●
●
●
●
●
●
●
●
●
●
●
●
●
●●
●
●
●
●
●
●
●●
●
●
●
● ●
●
●
●
●
●
●
●
● ●
●
●
●
●
●
●
●
●
●
●
●
●
● ●●
●
●
●
●
●
●
●
●
●
●
●
●
●
●
●
●
●
●
●
●
●
●
●
● ●
●
●
●
●
●
●
●
●
●
●
●
●
●
●
●
●
●
●
●
●
●
●
●
●
●
●
●
●
●
●
●
●
●
●
●
●
●
●●
●
●
●
●
●●
●
●
●●
●
●
●
●
●●
●●
●
●
● ●
●
●
●
●
●
●
●
●
●
●
●
●
●
●
● ●
●
●●
●
●
●
●
●
●
●
●
●
●
●
●
●
●
●
●
●
●
●
●
●
● ●
●●
●
●
●
●
●
●
●
●
●
●
●
●
●
●
●
●
●
●
●
●
●
●
●
●
●
●
●
●
●
●
●
●
●
●
●
●
●
●
● ●●
●
●
●
●
●
●
●●
●●
●
●
●
●
●●
●
●
●
●
●
●
●
●
●
●
●
●
●
●
●
●
●
●
●
●
●
●
●
●
●
●
●
●
●
●
●●
●
●
●
●
●
●
●
●
●
●
●
●
●
●
●
●
●
●
●●
● ●●
●
●
●
●
●
●
●
●
●
●
●●●
●
●
●●
●
●
●
●●
●
● ●
●
●
●●
●
●
●
●
●
●
●
●
●
● ●
●
●
●
●
●
●
●
●
●
●
●
●●
● ●
●
●
●
●●
●
●
●
●
●
●
● ●
●
●
● ●
●
●●
●
●
●
●
●
●
●
●
●
●
●
●
●
●
●●
●
●
● ●●
●
●
●
●●
●
●
●
●
●
●
●
●
●
●
●
●●
●●
●
●
●
●
●
●
●
●
●
●
●
●
●
●
●
●
●
●
● ●
●●
●
●
●
●
●
●
●
●
●
●
●
●
●
● ●
●
●
●
●
●
●
●
●
●
●
●
●
●
●
●
●
●
●●
●
●●
●
●
●
●
●
●
●
●
●●
●●
●
●
●
●●
●●
●●
●
● ●
●●
● ●
●
●
●
●
●
●
●
●
●●
●
●
●
●
●
●
●
●
●
●
●
●●
●
●
●
●
●
●
●
●
●
●
●
●
●
●
●
●
●
●
●
●
●
●
●
●
●
●
●
●
●
●
●●
●
●
●
●
●●
●
●●
●
●
●
●
●
●
●
●
●
●
●
●
●
●
●●
●
●
●
●
● ●
●
●
●
●
●
●
●
●
●
●
●
●
●●
●
●
●
●
●
●
●●
●
●
●
●●
●
● ●
●●
●
●
●
●
● ●
●
●
●
●
●
●
●●
●
●
●
●
●
●
●
●
●
●
●
●
●
●
●
●
●
●●●
●
●
●●
●
●
●
●
●
●
●●
●
●
●
●●
●
●●●
●
●
●
●
●
●
●
●
●
●
●
●
●
●
●
●● ●
●
●
●
●
●
●
●
●
●
●
●
●
●
●
●
●
●
●
●
●
● ●
●
●●
●
●
●●
●
●
●
●
●
●
●
●
●
●
●
●
●
●
●
●
●
●
●●
●
●
●
●
●
●
●
●
●
●
●
●●
●
●
●
●
●
●
●
●
●
●
●●
●
●●●
●
●
●
●
● ●
●
●
●
●
●
●
●
●
●
●
●●
●
●
●
●
●
●
●
●
●●
●
●
●
●●
●
●
●
●
●
●
●●
●
●
●
●
●
●
●
●
●
●
●
●
●
●
●
●
●
●●
●
●
●
●
●
●●
●
●
● ●
●
●
●
●
●
●
●
●
●
●
●
●
●
●●
●
●
●
●
●
●
●
●
●
●
●
●
●
●
●
●●
●
●
●
●
●
●
●
●
● ●
●●
●
●
●
●
●
●
●●●
●●
●
●
●
●
●
●
●
●
●
●
●
●
●
●
●
●●
●
●
●
●
●
●
●●
●
●
●
●
●
●
●
●
●
●
●
●
●
●
●
●
●
●
●
●
●
●
●
●
●
●
●
●
●
●
●
●
●●
●
●
●
●
●
●
●
●
●
●
● ●
●
●
●
●
●
●
●
●●
●
●
●
●
●
●
●
●
●
●
●●
●
●
●
●
●
●
●
●
● ●●
●
●●
●
●
●
●
●
●●
●
●
●
● ●
●
●
●
●●
●
●
●
●
●
●●
●
●
●
●
●
●
●
●
●
●●
●
●
●
●
● ●
●
●
●
●
●
●
●
●
●
●
●
●
●
●
●
●
●
●●
●
●
●
●
●
●
●
●
●
●
●
●
●
●
●
●
●
●●
●
●
●
●
●
●
●
●
●
●
●
●
●
●
●
●
●
●
●
●
●
●
●
●
●
●
●
●
●
●
●
●
●
●
●
●
●
●●
●
●
●
●
●
●●
●
●
●
●
●
●
●
●
●
●
●
●●
●
●
●
●
●
●
●
●●
●
●
●
●
●
●●
●
●●
●
●
●
●
●
●
●●
●
●
●
●
●
●
●
●
●
●
●
●
●
●
●
●
●
●
●
●
●
●
●
●
●
●
●
●
●
●
●
●
●
●
●
●
●
●
●
●
●
●
●
●
●
●
●
●
●
●●
●
●
●
●
●
●
●
●
●
●
●
● ●
●
●
●
●
●
●
●
●
●
●
●
●
●
●●
●
●
●
●
●
●
●
●
●
●
●
●
●
●
●
●● ●
●
●
●
●
●
●
●
●
●
●
●
●
●
●
●
●
●
●
●●
●
●
●
●
●
●
●
●
●
●
●
●
●
●
●
●
●
●
●
●
●
●
●
●
●
●
●
●
●
●
●
●●
●
●
●
●
●
●
●
●
●●
●
●
●
●●
●
●
●●
● ●
●
●
●
●
●●
●
●
●
●
●
●
●
●
●
●●
●
●
●
●
●
●
● ●
●●
●
●●●●
●
●
●
●
●
●
●
●
●
●
●
●
●
●
●
●
●
●
●
●
●
●
●
●
●
●●
●
●
●
●
●
●
●
●
●
●
●
●
●
●
●
●
●
●
●
●
●
●
●
●
●
●
●●
●
●
●●
●
●
●
●
●
●
●
● ●
●
●●
●
●
●
●
●
●
●●
●
●
●
●
●
●●
●
●
●
●
●
●
●
●
●
●
●
●● ●
●
●
●
●
●
●
●
●
●
●
●
●
●
●
● ●
●
●
●
●
●
●●
●
●
● ●
●
●●
●
●
●
●
●
●
●
●
●
●
●
●
●●
●
●
●
●
●●
●
●
●
●
●
●
●
●
●
●
●
●
●
●
●
●●
●
●
●
●
● ●
●
●
●
●
●
●
●
●
●
●
●
●
●●
●
●
●
●
●
●
●
●
●
●
●
●
●
●
●
●
●
●
●
●
●
●
●
●
●
●
●
●
●
●
●●●
●
●●
●
●
●
●
●
●
●
●
●
●
●
●
●
●
●
●●
●
●●
●
●
●
●
●
●
●
●
●
●●
●
●
●
●
●
●
●
●●
●
●
●
●
●●
●●
●
●
●
●●
●
●
●
●
●
●
●
●
●
●
●
●
●
●●
●
●
●
●
●
●
●
●●
●●
●
●
●
●
●
●
●
0
0.5
1
1.5
2
2.5
0.00 0.25 0.50 0.75 1.00
Rank within Type
Wea
lth (
mill
ions
of E
uros
)
Wealth●●●
●●●
●●●
Deciles_Fit
Original
Regression_Fit
Wealth and 'Effort' Sample age 60 and over ; 30 Types;
Smoothed fit NW Non−Parametric regression and Deciles
Obs. < 2.5 million euros
●
●
●
● ●
●
●
●
●
●
●
●
●
●
●
●
●
●
●
●
●
●
●
●
●
●●
●
●
●
●
●
●
●
●
●
●
●
●
●
●
●
●
●
●
●
●
●●
●
●
●
●●
●
●
●
●
●
●
●
●
●
●
●
●●●
●
●
●
●
●
● ●
●●
●
●●
●
●
●
●
●
●
●
●
●
●
●
●
●
●
●●
●
●
●
●
●
●
●
●
●●
●
●
●
●
●
●
●
●
●
●
●
●●
●
●
●
●
●
●
●
●
●
●
●
●
●
●
● ●●
●
●
●
●●
●
●
●
●●
●
●
●
●
●
●
●
●
●
●
●
●
●
●
●
●
●
●
●
●
●
●●
●
●
●
●
●
●
●
●
●
●
●
●
● ●●
●
●
●
●
●
●
●
●●
●
●
●
●
●
●
●
●
●
●
●
●
●●
●
●
●
●
●
●
●
●
●
●
●
●
●
●
●
●
● ●
●
●
●
●
●
●
●
●
●
●
●
●
●
●
●
●
●●
●
●
●
●
●
●
●●●
●
●
●
●●
●
●
●
●●
●
●
●
●
●
●
●
●
●
●
●
●●●
●
●
●
●
●
●
●
●
●
●
●
●
●
●
●
●
●
●●
●
●
●
●
● ●●
●
●●
●
●
●
●
●
● ●
●●
●
●
●
●
●●
●
●
●
●
●
●
●●
●
●
●
●●
●
●
● ●
●
●
●
●
●●
●
●
●
●
●
●
●
●
●●
●●
●
●
●
●
●
●●
●
●
●
●
●
●
●
●
●
●
●
●
● ●
●
●
●
●
●
●
●
●
●
●
●
●
●
●
●
●
●
●
●
●
●●
●
●
●
●
●
●
●
●
●
●
●
●
●
●
●●
●
●
●
●
●
●
●
●
●
●
●
●
●
● ●
●
●
● ●
●
●
●
●
●
●
●
●
●
●
●
●
●
●
●
●
●
●
●
●
●
●
●
●
●
●
●
●
●
●
●
●
●
●
●
●
●
●
●
●
●● ●
●
●
●
●
●
●
●
●
●
●
●
●
●
●
●
●●
●
●
●
●
●
●
●●
●
●●
●
●
●
●
●
●
●
●
●
●
●●●
●
●
●
●
●
●
●
●
●
●
●
●
●
●
●
● ●
●
●
●
●
●
●
●
●
●
●●
●
●
●
●
●
●
●
●
●
●●
●
●
●
●
●
●●
●
●
●
●
●
●●
●
●
●
●
●
●
●
●
●
●
●
●
●
●
●
●
●
●
●
●●
●
●
●
● ●
●
● ●●
●
●
●
●
●
●
●
●
●
●
●
●
●
●
●
●
●●
●
●
●
●
●
●
●
●
●
●
●
●
●
●
●
●
●
●
●
●
●
●
●
●●
●
●
●
●
●
●
●
●
●
●
●
●
●
●
●
●
●
●
●
●
●
●
●
●
●
●
●
●
●
●
●●
●
●
●
●
●
●
●
●
●
●
●
●
●
●
●
●
●●
●
●
●
●
●
●
●
●
●●
●
●
●
●
●
●
●
●
●
●
●
●
●
●
●
●
●
●
●
●
●
●
●
●
●
●
●
●●●
●
●
●
●
●
●
●
●
●
●
●
●
●
●
●
●
●
●
●
●
●
●
●
●
●
●
● ●●
●●
●
●
●
●
●
●
●
●
●
●●
●
●
●
●
●
●
●
●
●
●
●●
●
●
●
●
●●
●
●
●
●●
●●
●
●
●
●
●●
●
●
●
●
● ●
●●
●●
●
●
●
●
●
●
●
●
●
●
●
●
●
●
● ●
●
●
●
●
●
●
●
●
●
●
●
●
●
●
●●
●
●●
●●
●
●
●
●
●
●
●
●
●
●
●●
●●
●
●●
●
●
●
●
●
●
●
●
●
●
●
●
●
●
●
●
●
●
●
●●
●
●
●
●●
●
●
●
●
●●
●
●
●
●
●
●
●
●
●
●
●●●
●
●
●
●
●
●
●
●
●
●
●
●
●
●
●
●
●
●
●
●
●
●
●
●
●
●
●
●
●
●
●
●●
●
●●
●
●
●
●
●
●
●
●●
●
●
●
●
●
●
●●
●
●
●
●
●
●
●●
●
●
●
●
●
●
●
●
●
●
●
●
●
●
●
●
●
●
●●
●
●
●
●
●
●
●
●
●
●
●
●●
●
●
●
●
●
●
●
●
●
●
●
●
●
●●●
●
●
●
●
●
●
●
●
●●
●
●
●
●
●
●
●
●
●
●
●
●
●
●●
●●
●
●
●
●
●
●
●
●
●
●
●
●
●
●
●
●
●
●
●
●●
●
● ●
●
●
●
●
●
●
●
●
●
●●
●
●
●●
●●
●
●
●
●
●
● ●
●
●
●
●●
●
●
●
●
●
●
●
●
●
●
●
●
●
●
●
●
●
●
●
●●
●
●
●
●
●
●
●
●●
●
● ●
●
●
●
●
●
●
●
●
●
●
●
●
●
●
●
●
●
●
●
●
●
●●
●
●
●
●
●
●
●
●
●
●●
●
●
●
●
●
●
●
●●
●
●
●
●●
●
●
●
●
●
●
●
●●
●
●
●●
●
●
●
●
●
●
●
●
●
●
●
●
●
●
●
●
●
●●
●
● ●
●
●●
●
●
●
●
●
●
●
●
●
●
●
●
●
●●
●●
●
●
●
●●
●
●
●
●
●
●
●
●
●
●
●
●
●
●
●
● ●
●
●
●
●
●
●
●
●
●
●
●
●
●●
●
●
●
●
●
●●●
●
●
●
●
●
●
●
●
●
●
●
●
●
●
●
●
●
●●
●
●
●
●
●
●
●
●
●
●
●●
●
●
●●
●
●
●
●
●
●
●
●
●
●
●
●
●
●
●
●●
●
●
●●
●
●
●
●
●
●
●●
●●●
●
●
●●
●
●
●
●
●
●
●
●
●
●
●●
●
●
●
●
●
●
●
●
●
●
●
●
●
●
●
●
● ●
●
●
●
●
●
●
●
●●
●
●
●
●
●
●
●
●
●
●
●
●
●
●
●
●● ●
●●
●
●
●
●
●
●
●
●
●
●
●
●
●
●
●
●
●
●
●
●
●
●
●
●
●
●
●
●
● ●
●●
● ●●
● ●●
●
●
●
●
●
●
●
●
●
●
●
●
●●
●
●
●●
●
●
●●
●
●
●
●
●
●●●
●
●
●
●
●
●
●
●
●
●
●● ●
●
●
●
●
●
●
●
●
●●
●●
●
●
●
●
●
●
●
●
●
●
●
●
●
●
●
●
●
●
●
●
●
●
●
● ●
●
●●
●
●
●
●
●
●
●
●
●
●
●
●
●
●
●●●
●●
●●
●
●●
●
●
●
●
●
●
●
●●
●
●
●
●
●
●
●
●
●●
●
●
●
●
●
●● ●
●
●
●
●
●
●
●
●
●
●
●
●
●
●
●
●
●
●
●
●
●
●
●
●
●●
●
●
●
●
●
●
●
●●
●
●
●
●
●
●
●
●
●
●
●
●
●
●
●
●
●●
●
●
●
●
●
●●
●
●●
●
●
●
●
●
●
● ●
●
●
●●
●
●
●
●
●●
●●
●
●
●
●
●
●
●
● ●
●
●
●
●●
●
●
●
● ●
●
●
●
●
●●
●
●
● ●
●
●
●
●
●
●
●
●
●
●
●
●
●
●
●
●
●
●
●
●
●
●
●
●
●
●
●
● ●
●●
●
●
●
●
●
●●
●
●
●●
●
●
●
●
●
●
●
●●
●
●
●
●
●
●
●
●
●
●
●●
●
●
●
●
●
●
●
●●
●
●
●
●
●
●
●
●
●
●
●●
●
●
●
●
●
●
●
●
●
● ●
●
●
●
●
● ●
●
●
●
●●
●
●
●
●
●●
●
●
●●
●
●
●
●
●
●
●
●
●
●●
●
●
●
●
●
●
●
●
●
●
●
●
●
●
●
●
●
●
●
●
●
●
●
●
●
●
●
●
●
●
●
●
●
●
●
●
●
●
●
●
●
●
●●
●
●
●
●
●
●
●
●
●
●
●
●●
●
●
●
●●
●
● ●
●
●
●
●
●
●
●●●
●●
●
●
●
●
●
●
●
●
●
●
●
●
●●
●
●
●
●
●
●●●
●
●
●
●●
●
●
●
●
●
●● ●
●
●
●
●●
●
●
●
●
●●
●
●
●
●
●
●●
●
●
●
●●
●
●
●
●
●
●
●
●
●
●●
● ●
●
●
●
●●
●
●
●
●
●
●
●
●
●
●
●
●
●
●
●
●
●
●
●
●●
●
●
●
●
●●
●
●
●
●
●
●●
●●
●
●
●
●●
●
●
●
●
●●
●
●●
●
●
●
●
●
●●
●
●●
●
●
●
●
●
●
●
●
●
●
●
●
●
●
●
● ●
●
●●
●
●
●
●
●
●
●
●
●
●
●
●
●
●
●
●
●
●
●
●
●
●
●●
●
●
●
●
●
●●
●
●
●
●
●
●
●
●
●
●
●
●●
●
●●
●
●
●
●
●
●
●●
●
●
●
●
●
●
●
●
●
●
●
●
●●
●
●
● ●
●
●
●
●●
●
●●
●
●
●●
● ●
●
●
●
● ●
●
●●
●
●
●
●
●
●
●
●
●
●
●
●
●
●
●
●
●
●
●
●
●
●
●
●
●
●
●
●
●
●
●
●●
●
●
●
●
●
● ●
●
●●
●
●
●
●●
●
●
●
●
●
●
●●
●
●
●
●
●
●
●
●
●
●●
●
●
●
●
●●
●
●
●
●
●
●●●
●
●
●
●
●
●
●
●
●
●
●
●
●
●
●
●
●
●
●
●●
●
●
● ●
●
●
●
●
●
●
●
●
●
●
●
●●
●
●
●
●
●
●
●
●
●
●
●
● ●
●
●●
●
●
●
●
●
●
●
●
●●
●
●
●
●
●
●
●
●●
●
●
●
●
●
●
●
●●
●
●
●
●
●
●
●
●
●
●
●
●
●
●
●
●
●
●
●
●
●
●●
●
●
●
●
●
●
●
●
●
●
●
●
●
●
●
●●
●
●
●
●
●
●
●
●●
●
●
●
●
●
●
●
●
●
●
●
●
●
●
●
●
●●
●
●
●
●
●
●
●
●
●
●●
●
●
●
●
●
●
●●
●
●
●
●
●
●
●
●
●
●
●
●
●
●
●
●
●
●
●
●
●
●●
●
●
●
●
●
●
●
●
●
●
●
●
●
●
●
●
●
●
●
● ●
●●
●
●●
●
●
●
●
●
●
●
●
●
●
●
● ● ●
●
●
●
●
●
●●
●
●
●
●
● ●
●
●
●
●
●
●
●
●
●●
●
●●
●
●
●
●
●
●
●
●
●
●
●
●●
●
●
●
●
●
●
●
●
●
●
●
●
●
●
●
●
●●
●
●
●
●
●
●
●●
●
●●
●
●
●●
●
●
●
●
●
●
●
●
●●
●
● ●
●
●
●
●
●
●●
●
●
●
●
●
●
●
●
●
●
●
●
●
●
●
●
●
●
●
●
●
●●
●
●
●
●●
●
●
●
●●
●
●
●●
●
●●
●
●
●
●
●
●
●
●
●
●
●●●
●●
●●
●
●●
●
●
●
●
●
●
●
●●
●
●
●
●●●
●
●
●●●
●
●
●
●
●
●
●
●
●
●
●
●
●
●
●
●
●
●
●●
●
●
●
●
●
● ●
●
●
●
●●
●
●
●
●
●
●
●
●
●
●●
●
●
●
●
●
●
●
●
●
●
●
●
●
●
●
●
●
●
●
●
●
●
●
●
●
●
●
●●
●
●
●
●
●
●
●
●●
●
●
●
●● ●
●
●
●
●
●
●
●
●
●
●
●
●
●
●
●
●
●
●
●●
●
●
●
●
●
●
●
●
●
●
●
●
●●
●
●
●●
●
●
●
●
●
●
●
●
●
●
●
●
●
●
●
●
●
●
●
●
●
●●
●
●
●
●
●
●
●
●
●
●
●
● ●
●
●
●
●
●
●
●
●
● ●●
●
●
●
●
●
●
●
●
●
●
●
●
●
●●
●
●
●
●
●
●
●
●
●
●
●
●
●●
●●
●
●●
●●
●●
●
●
●
●
●
●●
●
●
●
●
●
●
●
●
●
●●
●
●
●
●
●
●
●●
●
●
●
●
●
●
●
●
●●
●
●
●●
●
●
●
●
●
●
●
●
●
●
●
●
●
●●
●
●
●
●
●
●
●
●
●●
●
●
●
●
●
●●
●
●●
●
●
●
●●
●
●
●
●
●
●●
●
●
●
●
●
●
●
●
●
●
●
●
●
●
●
●
●
●
●●
●
●●
●
●●
●●
●●
●
●
●
●
●
●
●
●●
●●
●
●
●
●
●
●●
●
●
●
●
●
●
●
●
●
●
●
●
●
●
●
●
●
●
●
●
●●
●
●●
●
●
●
●●
●
●
●
●
●
●●
●
●
●
●
●
●
●
●
●
●
●
●●●
●
●●
●●
●
●●
●
●
●
●
●
●
●●
●
●
●
●
●
●
●
●
●●
●
●
●
●
●
●●
●
●●
●
●
●●
●
●
●
●
●
●
●●
●
●
●
●
●●
●●
●
●
● ●
●●
●
●
●
●
●
●
●
●
●
●
●
●
●●
●
● ●
●
●●
●
●●
●
●
●
●
●
●
●
●
●
●
●
●
●
●
●
●
●
●
●
●
●
●
●●
●●
●
●
●
●
●
●
●●
●
●
●
●
●
●
●●
●
●
●
●
●
●
●
●
●
●●
●
●
●
●
●●
●
●
●
●
●
●
●
●
●
●
●●
●
●
●●
●
●
●
●
●
●
●
●
●
●
●
●
●●
●
●
● ●
●
●
●
●
●
●
●●
●
●●
●
●
●
●
●
●
●
●
●
●●
●
●
●●
●
●
●
●
●
●
●
●
●
●
●
●
●
●
●
●
●
●
●
●
●
●
●
●
●
●
●
●
●
●
●
●
●
●●
●
●
●●
●
●
●
●
●
●●
●
●
●
●
●
●
●
●
●
●
●
●
●
●●●●
●
●
●●
●
●
●
●
●
●
●
●
●
●
●
●
●
●●●
●
●
●●
●
●
●
●
●
●
●●
●
●
●
●●
●
●
●
●
●
●
●●
●
●
●●
●
●
●●
●
●
●
●
●
●
●
●
●
●
●●
●
●
●●
●
●
●
●●
●
●
●
●
●
●
●
●●
●
●
●
●●
●
●●
●
●
●
●
●
●
●
●●
●
●
●
●
●
●
●
●
● ●
●
●●
●
●●●
●
●
●
●
●
●
●
●
●
●
●
●
●
●●
●
● ●
●
●
●
●
●
●
●
●
●
●
●
●
●
●
●
●
●
●
●
●
●●
●
●
●
●
●
●
●
●●
●●
●
●
●
●
●
●
●
●
●
●
●● ●
●
●
●
●
●
●●
●
●
●
●
●
●
●
●
●
●
●
●
●●
●
●
●
●●
●
●
●
●
●
●
●
●
●●
●●
●
●●●●
●
●
●
●
●
●
●
●
●
●
●●
●
●
●
●
●
●●
●
●
●
●
●
●
●
●
●●
●
●
●
●
●
●●
●
●
●
●●
●
●
●
●
●
●
●
●
●
●
●
●
●
●
●
●
●
●
●
●
●
●
●●
●
●
●
●
●
●
●
●
●
●
●
●
●
●
●
●●
●
●
●
●
●
●
●
●
●●
●
●●
●
●
●
●●
●
●
●
●
●●
●
●
●
●
●
●
●
●
●
●
●
●
●
●
●●
●
●
●
●
●
●
●
●
●
●
●
●
●
●
●
●
●
●
●
●
●
●
●
●
●
●
●
●
●
●
●
●
●
●
●
●
●
●
●
●
●
●
●
●
●●
●
●
●
●
●
●
● ●
●
●
●
●
●
●
●
●
●
●
●
●
●●
●●●
●
●
●
●
●
●
●
●
●
●
●
●
●
●●
●
●
●
●
●
●
●●
●●
●
●
●
●
●
●
●
●
●
●
●
●
●
●
●
●
● ●
● ●
●
●
●
●
●●
●
●●
●
●
●
●●
●
●
●
●
●
●
●
●
●
●
●
●
●
●●
●
●
●
●
●
●
●●
●
●●
●
●
●
●●
●
●
●
●
●●
●
●
●
●
●
●
●●
●
●
●
●
●
●
●
●
●
●
●
●
●
●
●
●
●
●●
●
●●
●
●
●
●
●
●
●●
●●
●
●
●●
●
●●
●
●
●
●
●
●
●
●
●
●
●●
●
●
●
●
●
●
●
●
●
●
●
●
●
●
●●
●
●
●
●
●
●
●
●
●
●
●
●
●
●
●
●
●●
●
●
●●
●
●
●
●
●
●
●
●
●
●●●
●
●
●
●
●
●
●
●
●
●
●● ●
●
●
●
●
●●
●●
●
●
●●
●
●
●
●
●●
●
●
●
●
●
●
●●
●
●
●
●
●
●
●●
●
●
●
●
●
●
●
●●
●
●
●
●
●
●
●
●
●
●
●
●
●
●
●
●
●
●●
●●
●
●
●
●
●
●
●●
●
●
●●
●
●
●
●
●
●
●
●
●
●
●
●
●
●
●
●
●
●
●
●●
●
●
●
●●
●
● ●
●
●
●
●
●
●
●●
●
●
●
●
●
●
●
●
●
●
●
●
●
●
●
●
●
●
●
●
●
●
●
●
●
●
●
●
●
●
●
●
●
●
●
●
●●
●
●
●
●
●
●
●
●●
●
●
●
●
●
●
●
●
●
●
●
●
●
●
●
●●
●
●●
●
●
●●●
●
●
●●
●
●
●
●
●●
●
●
●
●
●
●
●
●
●
●
●●
●●
●
●
●
●●
●
●●
●
●
●
●
●
●
●
●
●
●
●●
●
●●
●●
●
●
●
●
●
●
●
●
●
●
●
●
●
●
●
●
●
●
●
●●
●
●
●
●●
●
●
●
●
●
●
●
●●
●
●
●●
●
●
●●
●
●
●
●
●
●
●●
●
●
●
●
●●
●
●
●
●
●
●
●
●
●
●
●
●
●
●
●
●
●
●
●
●
●
●
●
●
●
●
●
● ●
●
●
●
●
●
●
●
●
●
●
●
●
●
●
●
●
●
●
●
●
●
●
●
●
●
●
●
●
●
●
●
●
●●
●
●
●
●
●
●●●
●
●
●
●
●
●
●
●
●
●●
●
●
●
●
●
●
●
●
●
●
●
●
●
●
●
●
●
●
●
●●
●
●
●
●
●
●
●
●
●
●
●
●●
●
●
●
●
●
●
●
●●
●
●
●●
●
●
●
●
●
●
●
●
●●
●
●
●●
●●
●
●
●
●
●
●
●
●
●
●
●
●
●
●
●
●
●
●
●
●
●●
●
●
●
●●
●
●
●
●
●
●
●
●
●
●
●
●
●
●
●
●
●
●
●
●
●● ●●
●
●
●
●
●
●
●
●
●
●
●
●
●
●
●
●
●●
●
●
●●
●
●
●
●
●
●
●
●
●
●
●
●
●
●
●
●
●
●
●
●
●
●
●
●
●
●
●
●
●
●
●
●
●●
●
●
●
●
●
●
●
● ●
●
●
●
●
●
●
●
●●
●
●
●
●
●
●
●●
●
●
●●
●
●
●
●
●
●
●
●
●
●
●
●
●
●●●
●
●●
●
●
●
●
●
●
●
●
●
●
●
●
●
●●
●
●
●
●
●
●
●●
●●
●
●
●
●
●
●
●
●
●
●
●
●
●
●
●
●
●
●
●
●
●
●
●
●
●
●
●
●
●
●
●
●
●
●
●
●
●
●
●●●
●
●
●
●
●
●
● ●
●●
●
●
●
●
●
●
●
●
●
●
●
●
●
●
●
●
●
●
●
●
●
●
●
●
●
●
●
●
●
●
●
●
●●
●
●
●●
●
●
●
●
●
●
●
●
●
●
●
●
●
●
●
●
●
●
●●
●●
●●
●
●
●
●
●
●
●
●
●
●●
●
●
●
●●
●
●
●
●
●
●
●
●
●
●●
●
●
●
●
●
●
●
●
●
●
● ●●
●
●
●
●
●
●
●
●
●
●
●●
●
●
●
●
●
●●
●
●
●
●
●
●
●
●
●
●
●
●
●
●
●●
●
●●
●
●
●●
●●
●
●
●
●
●
●●
●
●● ●
●
●
●
●●
●
●
●
●
●
●●
●
●
●
●
●●
●
●
●
●
●●
●
●
●
●
●●
●
●
●
●
●
●
●
●
● ●●●
●
●
●
●
●
●
●
●
●●
●
●
●
●
●
●
●
●
●
●
●
●
●
●
●
●
●
●
●
●
●
●
●●
●
●●
●
●●
●
●
●
●
●
●●
●●
●
●
●
●
●
●
●
●●
●
●
●
●●
● ●
●
●
●
●
●
●
●
●
●
●
●
●
●
●
●
●
●
●
●
●
●●●
●
●
●
●
●
●
●
●
●
●
●
●
●
●
●
●
●
●
●
●
●
●
●
●
●
●
●
●
●
●
●
●
●
●
●
●
●
●
●
●●
●
●
●
●
●
●
●●
●
●
●●
●
●
●
●
●
●
●
●
●
●
●●
●
●
●
●
●
●
●
●
●
●
●
●
●
●●
●
●
●
●●
●●
●
●●
●
●●
●●
●
●
●
●
●●
●
●
●
●
●
●
●●
●
●
●
●
●
●
●
●
●
●
●
●
●
●
●
●
●
●●●
●
●●●
●
●
●
●
●
●●
●
●
●
●
●●●
●●
●
●
●
●
●
●
●
●
●
●
●●
●
●
●
●
●●●
●
●
●
●
●
●
●
●
●
●●
●
●
●
●
●
●
●
●
●●●
●
●
●
●
●●
●
●
●
●
●
●
●
●
●
●
●
●
●
●
●
●
●
●
●
●●
●
●
●
●●
●
●●
●
●
●
●
●
●
●
●
●
●
●
●
●
●
●
●
●
●
●●●
●
●
●●
●
●
●
●
●
●
●
●
●
●●
●
●
●
●
●
●
●
●
●
●
●
●●
●
●
●
●●
●
●
●
●
●
●
●●
●
●
●
●
●
●
●
●●
●
●
●
●
●
●
●
●
●●
●●
●
●
●
●●
●
●
● ●
●
●
●
●
●
●
●
●
●
●
●
●
●
●●
●
●
●
●
●
●
●
●
●
●
●
●
●
●
●
●
●
●
●
●
●
●
●
●
●
●●
●●
●
●●
●
●
●
●
●●
●●
●
●
●
●
●
●
●
●
●
●
●
●
●
●
●
●
●
●
●
●
●
●
●
●●
●
●
●
●
●
●
●
●
●
●
●
●
●
●
●
●
●
●
●
●
●
●●
●
●
●
●
●
●
●
●
●
●●
●
●
●
●
●
●
●
●
●
●
●
●
●
●
●
●
●
●
●
●●
●
●
●
●
●
●
●
●
●
●
●●
●
●
●
●
●
●
●
●
●
●●
●
●●
●●
●
●
●
●●
●
●
●
●
●
●
●
●
●
●
●
●
●●
●
●
●
●
●
●●
●
●
●
●
●●●
●
●
●
●
●●
●
●
●
●
●
●
●
●
●
●
●
●
●
●
●
●
●●
●
●
●
●
●
●
●
●
●
●
●
●
●
●
●
●
●
●
●●
●
●
●
●
●
●
●
●
●
●
●
●
●
●
●
●
●
●
●
●
●
●
●
●
●
●
●
●
●●
●
●
●
●
●
●
●
●●
●
●
●
●
●
●●
●
●
●
●
●
●
●
●
●
●
●
●●
●
●
●
●
●
●
●
●●
●
●
●
●
●
●●
●
●
●
●
●
●
●
●
●
●●
●
●●
●
●
●
●
●
●
●
●
●
●
●
●
●
●
●
●
●
●
●
●
●
●
●
●
●
●
●
●
●
●
●
●
●
●
●
●
●
●
●
●
●
●
●
●
●
●
●●
●
●
●
●
●
●
●
●
●
●
●
● ●
●
●
●
●
●
●
●
●
●
●
●
●
●
●●
●
●
●
●
●
●
●
●●
●
●
●
●
●
●
●●
●
●
●
●
●
●
●
●
●
●
●
●
●
●
●
●●
●
●
●●
●
●
●
●
●
●
●
●
●
●
●
●●
●
●
●
●
●
●
●
●
●
●
●
●
●
●
●
●
●
●
●●
●
●
●
●
●
●
●
●
●●
●
●
●
●●
●●
●●
●●
●
●
●
●
●●
●
●
●
●
●
●
●
●
●
●●
●
●
●
●
●
●
●●
●
●
●
●
●●●
●
●
●
●
●
●
●
●
●
●
●
●
●
●
●
●
●
●
●
●
●
●
●
●
●
●
●
●
●
●
●
●
●
●
●
●
●
●
●
●
●
●
●
●
●
●
●
●●
●
●
●
●
●●
●
●
●●
●●
●
●
●
●
●●●
●
●
●
●
●
●
●
●
●
●●
●
●
●
●
●
●
●
●
●
●
●
●
●
●
●
●
●
●
●●
●
●
●
●
●●
●
●
●
●
●
●
●
●
●
● ●
●
●
●
●
●
●
●
●
●
●
●
●
●●●
●
●
●
●
●
●
●
●
●
●
●
●●
●
●
●
●
●●
●
●
●
●
●
●
●
●
●
●●
●
●
●
●
●●
●
●
●
●
●
●
●
●
●
●
●
●
●
●
●
●
●
●
●
●
●
●
●
●
●
●
●
●
●
●
●
●
●
●
●
●●
●●
●
●
●
●
●
●
●
●
●
●
●●●
●
●●●
●
●
●
●
●
●
●
●
●
●
●
●
●
●●
●
●
●
●
●
●
●
●
●
●
●
●
●
●
●●
●
●
●
●
●
●
●
●
●
●
●
● ●
●●
●
●
●
●
●
●
●
●
●
●●
●●
●
●
●●
●
●
●
●●
●
●
●●
●
●
●
●●
●●
●
●●
●●●
●
●
●●
●
●
●
●
●
●
●
●
●
●
●
●
●
●
●
●
●
●
●
●
●
●●
●
●
●
●
●
●
●
●
●
●
●
●
●●
●
●
●
●
●
●
●
●
●
●
●
●
●
●●
●
●
●
●
●
●
●
●
●●
●
●
●
●
●
●●
●
●
●
●
●
●
● ●
●
●
●
●
●
●●
●
●
●
●
●
●
●
●
●
●
●
●
●
●
●
●
●
●
●●
●
●
●
●
●
●
●●
●●
●
●
●
●
●
●
●
●●
●●
●
●
●
●
●
●●
●
●
●
●
●
●
●
●
●
●
●
● ●
●
●
●
●
●
●
●
●●
●
●●
●
●
●
●
●
●
●
●
●
●
●
●
●
●
●
●
●
●
●
●
●
●
●
●●●
●
●
●
●
●
●
●●
●
● ●
●
●
●
●●
●
●
●
●
●
●
●●
●●
●
●
●
●
●
●●
●
●
●
●
●
●
●
●
●
●
●
●
●
●
●
●
●
●
●
●
●
●●
●●
●●
●
●
●
●
●
●
●
●
●
●
●
●
●
●
●●
●
● ●
●
● ●
●
●●
●
●
●
●
●
●
●
●
●
●
●
●
●
●
●
●
●
●
●
●
●
●
●●
●
●
●
●
●
●
●
●
●
●
●
●
●
●
●
●
●●
●
●
●
●
●
●
●
●
●
●
●
●
●
●
●
●
●
●
●
●
●
●
●
●
●
●
●
●
●
●
●
●●
●
●
●
●
●
●●
●
●
●
●
●
●●●
●
●●
●
●
●
●
●
●
●●
●
●
●
●
●
●
●
●
●
●
●
●
●
●
●
●
●
●
●
●
●
●
●
●
●
●
●
●
●
●
●
●
●
●
●
●
●
●
●
●
●
●
●
●
●
●
●
●
●
●
●
●
●
●
●
●
●
●
●
●
●
●
●●
●
●
●
●
●
●
●
●
●
●
●
●
●
●●●
●
●
●
●
●
●
●
●
●
●
●
●
●
●
●
●
●
●
●
●●
●
●
●
●
●
●
●
●
●
●
●●
●
●
●
●●
●
●
●
●
●
●
●●
●
●
●
●
●
●
●
●
●
●
●
●
●
●
●
●
●
●
● ●
●
●
●●
●
●
●
●●
●
●
●
●
●
●
●
●●
●
●
●
●●
●
●●
●
●
●
●
●
●
●
●●
●
●
●
●
●
●
●
●
●
●
●
●
●
●
●●●
●●
●
●
●
●
●
●●
●
●
●
●
●
●
●
●
●
●
●
●
●
●
●
●
●
●
●
●
●
●
●
●
●
●●
●
●
●●
●
●
●
●
●
●
●
●●
●
●
●
●
●
●
●
●
●
●
●
●
●●●
●
●
●
●
●
●
●
●
●
●
●
●
●
●
●
●
●
●
●
●
●●
●
●
●
●
●
●
●
●
●
●
●
●
●●
● ●
●
●●●
●
●
●
●●
●
●
●
●
●
●
●
●
●
●
●
●
●
●●
●
●
●
●
●
●
●
●
●●
●
●
●●
●
● ●
●
●
●
●●
●
●
●
●
●
●
●
●
●
●
●
●
●
●
●
●
●
●
●
●
●
●
●
●
●
●
●
●
●
●
●
●
●
●
●
●
●
●
●
●●
●
● ●
●
●
●
●
●
●
●
●
●●
●
●
●
●●
●
●
●
●
●●
●
●
●
●
●
●
●
●
●
●
●
●
●
●
●●
●
●
●
●
●
●
●
●
●
●
●
●
●
●
●
●
●
●
●
●
●
●
●
●
●
●
●●
●
●
●
●
●
●
●
●
●
●
●
●●
●
●
●
●
●
●
●
●
●
●
●
● ●
●
●
●
●
●
●
●
●
●
●
●
●
●
●
●●
●
●
●
●
●
●
●
●
●
●
●
●
●
●
●
●
●
●
●
●
●
●
● ●●
●
●
●
●
●
●
●
●
●
●
●
●
●
●
●
●
●
●●
● ●
●
●
●
●
●●
●
●
●
●
●
●
●●
●
●
●
●
●
●
●
●
●
●
●
●
●
●●
●
●
●
●
●
●
●●
●
●●
●
●
●
●
●
●●
●
●
●●
●
●
●
●
●
●
●●
●
●
●
●
●
●
●
●
●●●
●
●
●
●
●
●
● ●
●
●●
●
●
●
●
●
●
●●
●●
●
●
●
●
●
●●
●
●
●
●
●
●
●
●
●
●
●●
●
●
●
●
●
●
●
●
●
●
●
●
●
●
●●
●
●
●
●
●●
●
●
●
●
●
●
●
●
●
●
●
●
●
●
●
●
●
●
●
●
●
●
●
●
●
●●●
●
●
●
●
●
●
●
●
●
●
●● ●
●
●
●
●
●
●
●●
●
●
●
●
●
●
●
●
●●
●
●
●
●
●
●
●●
●
●
●
●
●
●
●●
●
●
●
●
●
●
●
● ●
●
●
●
●
●
●
●
●
●
●
●
●
●
●
●●
●
●
●
●●
●
●
●
●
●
●
●●
●
●
●●
●
●
●
●
●
●
●
●
●
●
●
●
●
●
●
●
●
●
●
●
●
●
●
●
●
●
●
● ●
●
●
●
●
●
●
●
●
●
●
●
●
●
●
●
●
●
●
●
●
●
●
●
●
●
●
●
●●
●
●
●
●
●
●
●
●
●
●
●
●
●
●
●
●
●
●
●
●
●
●
●
●
●●
●
●
●
●
●
●
●
●
●
●
●
●
●
●
●
●●
●
●●
●
●
●●●
●
●
●●
●
●
●
●
●●
●
●
●
●
●
●
●
●
●
●
●●
●●
●
●
●
●●
●
●●
●
●
● ●
●
●
●
●
●
●
●
●
●
●●
●●
●
●
●
●
●
●
●
●
●
●
●
●
●
●
●
●
●
●
●
●●
●
●
●
●●
●
●
●
●
●
●
●
●
●
●
●
●● ●
●
●
●
●
●
●
●
●
●
● ●
●
●
●
●
●
●
●
●
●
●
●
●
●
●
●
●
●
●
●
●
●
●
●
●
●
●
●
●
●
●
●
●
●
●
●
●
●
●
●
●
●
●
●
●
●
●
●
●
●
●
●
●
●
●
●
●
●
●
●
●
●
●
●
●
●
●
●
●
●
●
●
●
●
●
●
●●
●
●
●
●
●
●
●
●
●
●●
●
●
●
●
●
●
●
●
●
●
●
●
●
●
●
●
●
●
●
● ●
●
●
●
●●
●
●
●
●
●
●
●
●
●
●
●
●
●
●
●
●
●
●
●
●●
●
●
●
●●
●
●
●
●●
●
●
●
●
●
●
●
●
●
●
●
●
●
●
●
●
●
●
●●
●
●
●
●
●
●
●●
●
●
●
●
●
●
●
●
●
●
●
● ●
●
●
●
●
●
●
●
●
●
●
●
●
●●
●●
●
●
●
●
●
●
●
●
●
●
●
●
●
●
●
●
●
●
●
●
●●
●
●
●
●
●
●
●
●
●
●
●
●
●
●
●
●
●
●
●
●
●
●
●●
●
●
●
●
●●
●
●
●
●
●
●
●
●
●
●
●
● ●
●
●
●
●
●
●
●
●●
●
●
●
●
●●
●●
●
●
●
●
●
●
●
●
●
●
●
●
●
●
●
●
●
●
●●
●
●
●
●
●
●
●
●
●
●
●
●
●
●
●
●
●●
●
●
●
●
●
●
●
●
●
●
●
●
●
●
●
●
●
●
●
●
●
●
●
●
●
●
●
●
●
●
●
●
●
●
●
●
●
●
●
●
●
●
●
●
●
●
●
●
●●●
●
●
●
●
●
●
● ●
●●
●
●
●
●
●
●
●
●
●
●
●
●
●
●
●
●
●
●
●
●
●
●
●
●
●
●
● ●
●
●
●
●
●●●
●
●
●
●
●
●
●
●
●
●
●
●
●
●
●
●
●●
●
●
●
●
●
● ●
●
●●
●
●
●
●
●
●
●
●
●●
●
●
●
●
●
●
●
●
●
●
●
●
●
●
●●
●
●
●
●
●
●
●
●
●
●
●●
●
●
●
●
●
●
●
●
●
●
●
●●
● ●
●
●
●
●●
●
●
●
●
●
●
●
●
●
●●
●
●
●
●●
●
●
●
●
●
●●
● ●
●
●
●
●
●
●●
●
●● ●
●
●
●
●●
●
●
●
●
●
●
●
●
●
●
●
●
●●
●
●
●
●●
●●
●
●
● ●●
●
●
●
●
●
●
●
●●●
●
●
●
●
●
●
●
●
●
●●
●
●
●
●
●
●
●
●
●
●
●
●
●
●
●
●
●
●
●
●
●
●
●●
●
●●
●
●
●
●
●
●
●
●
●●
●
●
●
●
●
●
●
●
●
● ●
●
●
●
●●
● ●
●●
●
●
●
●
●
●
●
●
●
●
●
●
●
●
●
●
●
●
●●●
●
●
●
●
●
●
●
●
●
●
●
●
●
●
●
●
●
●
●
●
●
●
●
●
●
●
●
●
●
●
●●
●
●
●●
●
●
●
●●
●
●
●
●
●
●
●
●●
●
●●
●
●
●
●
●
●
●
●
●
●
●●
●
●
●
●
●
●
●
●
●
●
●
●
●
●
●
●
●
●
●●
●
●
●
●●
●
●
●
●●
●
●
●
●
●
●
●
●
●
●
●
●
●
●
●
●
●
●
●
●
●
●
●
●
● ●
●
●
●
●
●
●●
●
●
●●●
●
●
●
●
●
●●
●
●
●
●
●●●
●●
●
●
●
●
●
●
●
●
●
●
●●
●
●
●
●
●●
●
●
●
●
●
●
●
●
●
●
●●
●
●
●
●
●
●
●
●
●●●
●
●●
●
● ●●
●
●
●
●
●
●
●
●
●
●
●
●
●
●
●
●
●
●
●
●
●
●
●
●●
●
●
●
●
●
●
●●
●
●
●
●
●
●
●
●
●
●
●
●
●
●●●
●
●
● ●
●
●
●
●
●
●
●
●
●
●●
●
●●
●
●
●
●
●
●
●
●
●●
●
●
●
●●
●
●
●
●
●
●
●●
●
●
●
●
●
●
●
●●
●
●
●
●
●
●
●
●
●●
●
●
●
●
●
●●
●
●
●
●
●
●
●
●
●
●
●
●
●
●
●
●
●
●
●
●
●
●
●
●
●
●
●
●
●
●
●
●
●
●
●
●
●
●
●
●
●
●
●
●
●
●
●
●
●
●
●
●
●
●
●
●●
●●
●
●
●
●
●
●
●
●
●
●
●
●
●
●
●
●
●
●
●
●
●
●
●
●●
●
●
●
●
●
●
●
●
●
●
●
●
●
●
●
●
●
●
●
●
●
●●
●
●
●
●
●
●
●
●
●
●●
●
●
●
●
●
●
●
●
●
●
●
●
●
●
●
●
●
●
●
●●
●
●
●
●
●
●
●
●
●
●
●●
●
●
●
●
●
●
●
●
●
●
●
●
●
●
●●
●
●
●
●
●
●
●
●
● ●
●
●
●
●
●
●
●
●
●
●
●
●
●
●
●
●
●
●
●
●
●
●
●
●
●
●
●
● ●
●
●
●
●
●
●
●
●
●
●
●
●
●
●
●
●
●●
●
●
●
●
●
●
●
●
●
●
●
●
●
●
●
●
●
●
●●
●
●
●
●
●
●
●
●
●
●
●
●
●
●
●
●
●
●
●
●
●
●
●
●
●
●
●
●
●●
●
●
●
●
●
●
●
● ●
●
●
●
●
●
●●
●
●
●
●
●
●
●
●
●
●
●
●
●
●
●
●
●
●
●
●
●●
●
●
●
●
●
●
●
●
●●
●
●
●
●
●
●
●●
●
●●
●
●
●
●
●
●
●
●
●
●
●
●
●
●
●
●
●
●
●
●
●
●
●
●
●
●
●
●
●
●
●
●
●
●
●
●
●
●
●
●
●
●
●
●
●
●
●
●
●
●
●
●
●
●
●
●
●
●
●
●
●
●
●
●
●
●
●
●
●
●
●
●
●
●
●●
●
●
●
●
●
●
●
●●
●
●
●
●
●
●
●
●●
●
●
●
●
●
●
●
●
●
●
●
●
●
●
●●
●
●
●●
●
●
●
●
●
●
●●
●
●
●
●●
●
●
●
●●
●
●
●
●
●
●
●
●
●
●
●
●
●
●●
●
●
●
●
●
●
●
●
●
●
●
●
●
●
●
●
●
●●
●
●
●
●
●
●
●●
●
●
●
●
●
●
●
●
●
●
●
●
●
●
●
●
●
● ●
●
●
●
●
●●
●
●
●
●●
●
●
●
●
●
●
●
●
● ●●
●
●
●
●
●
●
●
●
●
●
●●
●
●
●
●
●
●
●
●
●
●
●
●
●
●
●
●
●
●
●
●
●●
●
●
●
●
●
●
●
●
●
●
●
●
●
●
●
●
●●
●
●
●
●
●
●
●
● ●
●
●●
●
●
●
●
●
●●
●
●
●
●
●
●
●
●
●
●
●
● ●
●
●
●
●
●
●
●
●
●
●
●
●
●
●
●
● ●
●
●
●
●
●
●
●
●
●
●
●
●
●●●
●
●
●
●
●
●
●
●
● ●
●
●●
●
●
●●
●●
●
●
●
●
●
●
●
●
●
●
●
●
●
●
●
●●
●
●
●
●
●
●
●
●
●
●
●
●
●
●
●
●
●
●
●
●
●
●
●
●
●
●
●
●
●
●
●
●
●
●
●
●
●
●
●
●
●
●
●
●
●
●
●
●
●
●
●●
●
●●
●
●
●
●
●●
●
●
●
●
●
●
●
●
●
●
●
●
●
●
●
●
●
●
●
●
●
●
●
●
●●
●
●
●
●
●
●
●
●
●
●
●
● ●
●●
●●
●
●
●
●
●
●
●
● ●
●●
●
●
●●
●
●
●
●●
●
●
●
●
●
●
●
●●
●●
●
●●
●●●
●
0
0.5
1
1.5
2
2.5
0.00 0.25 0.50 0.75 1.00
Rank within Type
Wea
lth (
mill
ions
of E
uros
)
Wealth●●●
●●●
●●●
Ad_Hoc_Fit
Original
Regression_Fit
Wealth and 'Effort' Sample age 60 and over ; 30 Types;
Smoothed fit NW Non−Parametric regression and Ad Hoc Tranches (Bandwidth lenght)
Obs. < 2.5 million euros
●
●
●
●
●
●
●
●
●●
●
●
●
●
●
●●
●
●
●
●●
●
● ●
●●
●
●
●
●
●
●
●
● ●
●●●
●
●
●
● ●
●
●
●
●
●
●●
●
●
●
● ●
●
●
●
●
●
●●
●
●
●
●
●●●
●●●
●
●●
●●
●
●
●
●
●
●
●
●
●
●
●
●
●
●
●
●
●
●
●
●
● ●●
●
●
●
●
●
●
●
●
●●
●
● ●
●
●●
●●
●●
●
●● ●
●
●
●
●
●
●
●
●
●
●
●
●
●
●
●
●
●
●
●
●
●●
●
● ●
●
●
●
●
●
●●
●
●
●●●
●
●
●
●
●
●●
●●
●
●
●
●● ●●
●
●
●
●
●
●
●
●
●
●
●
●●
●
●●
●
●
●●
●
●
●
●
●
●
●
●
●
●
●
●
●● ●
●
●
●
●
●
●
●
●
●
●
●
●●
●
●
●
●
●
●
●●
●●
●
●
●
●●
●
●
●
●
●●
●
● ●●
●
●
●
●
●
●●
●
●●
●
●●●
●●
●
●
●
●● ●
●
●
●
●
●
●
●
●●
●
●
●
●
●●
●
●
●
●●
●
●
●
●
●
●
●
●
●
●●
●
●
●
●
●●
●
●
●
●
●●
●
●
●
●
●
●
●
●
●
●
●
●● ● ●
●●
●
●
●●
●
●
●
●
●
●●
●
●
●
●●
●●
●●
●
●● ●
●
●●
●
●
●
●
●
●
●
●
●
●
●
●
●
●
●
●
●
●
●
●
●
●
●
●
●●
●
●
●
●
●
●
●●●
●
●
●
●
●
●
●
●
●
●
●
●
●
●
●●
●
●
●
●
●
●
●● ●
●
●
●
●
●
●
●●
●
●
●
●
●
●
●
●●
●
●
●
●
●●
●●●
●
●
●
●
●
●●
●●
●
●
●●
●
●
●
●
●
●
●
●
●
●
●
●
●
●
● ●
●
●●
●
●
●
●● ●
●
●
●
●
●
●●
●●
●
●
●
●
●
●● ●
●
●
●
●●
●●
●
●
●
●
●●
●●
●
●●
●
●● ●
●
●
●
●●
●
●
●●
●
●
●
●
●
●
●
●
●
●
●
● ●
●
●
●
●●
●
●
●
●
●
●
●
●●
●
● ●
●●
● ●
●
●
●
●●●
●
●
●
●
●
●
●
●
●
●
●●
●
●
●●
●
●
●
●
●
●
●
●
●
●
●
●
●
●
● ●
●
●●●
●
●
●
●
●
●
●
●
●
●
●
●
●
●
●
●
●
● ●
●
●
●
●● ●
●
●
●
●
●
●
●●
●
●
●
●
●
●
●●
●
●
●
●
●
●
●
●
●●
●
●
●●
●
●
●
● ●
●
●
●
●
●
●●●
●
●
●
●
●
●
●
●
●
●●●
●
●
●
●
●
●
●
●●
●
●
●
●
●
●
●
●
●
●
●
●
●
●
●
●
●
●● ●
●
●●●●
●●
●
●●
●
●●
●
●
●
●
●
●●
●
●
● ●
●
●
●
●
●
●
●
●
●
●
●
●
●
●
●
●
●
●
●
●
●
●
●●
● ●
●
●
●
●
●
●
●
●
●
●
●
●
●
●
●●
●
●
●●
●
●
●
●
●
●
●
●
●
●
●
●
●●
●●
●
●
●
● ●● ●
●
●
●
●
●
●●
●
●
● ●
●
●
●
●
●
●
●
●
●
●●
●
●
●
●
●
●
●●
●
●
●
● ●
●
●
●
●
●
●
●●●
●
●
●
●
●
●
●
●
●
●
●
●
●
●
●
●
●
●
●
●
●
●
●●
●
●
●
●●
●
●
●
●
●
●●
●
●
●
●
●
●
●
●
●
●
●
●
●
●
●
●
●
●●
●
●
●
●
●
●
●
●
●● ●
●●
●
●
●
●
●●
●
●
●
●
●
●
●
● ●
●
●●
●
●
●
●●
●
●
●
●
●● ●
●
●
●
●
●
●●
●
●
●
●
●● ●
●
●
●
●
●●
●
●
●
●
●
●●
●
●
●●
●
●
●
●
●
●
●
●
●
●
●●
●
●
●
●
●
●
●
●
●
●
●
●
●
●
●
●●
●
● ●
●
●
●
●
● ●●
●
●
●
●
●
●
●
●
●
●●
●
●
● ●●●
●
●● ●
●
●
●●
●
●●
●
●
●
●
●
● ●
●
●
●
●
●●
●
●
●●
●●
●
●
●
●
●
●
●
●
●
● ●
●
●
●
●
●
●
●
●
●
●
●
●
●
●
●
●
●
●●
●
●●
●
●
●
●
●
●
●
●
●
●
● ●
●●
●
●
●
●
●
●
●●
●
●
●
●
●
●
●
●
●
●
●
●
●●
●
●
●
●
● ●
●●
●
●
●●●
●
●
●
● ●
●
●
●
●
●●
●●
●●
●
●
●
●
●
●
●
●
●
●
●
●
●●
●
●
●
●
●
●●
●
●●
●
●
●●
●●
●
●
●
●●●
●●
●
●
●
●
● ●
●
●
●●
●●
●
●
●
●
●●
●
●
●
●
●
●
●
●
●
●
●
●
●
●
●
●
●
●● ●
●
●
●
●
●
●
● ●
●
●●
●
●
●
●
●
●
●●
●
●
●
●
●
●
●
●
●●
●
●
●
●
●
●
●
●
●
●
●
●●
●
●
●
●●
●●
●
●
●
●
●
●● ●
●●●
●
●
●
●
●
●●
●
●
●
●
●
●
●
●
●●
●
●●
●
●
●
●
●
● ●
●
●
●
●●
●
●
●
●
●
●
●
●
●
●●
●
●●
●
●●
● ●
●
●
●●
●
●
●
●
●
●
●
●
●
●
●
●
●
●
●
●●
●
●
●
●
● ●
●
●
●
●●
●
●●
●●
●
●●
●
●
●
●
●
●
●
●
●●
●
●●
●●
●
●
●●
●●
●
●
●
●
●
● ●
●
●
●
●
●
●
●
●
●
●
●
●
●
●
●
●
●
●
●
●●
●
●
●
●
●
●
●
● ●
●●
●
●
●
●
●● ●
●
●
●
●●
●●
●
●
●
●● ●
●
●
●
●
●
●
●
●●●
●
●
●
●
●●
●
●
●
●
●●
●
●
●
●
●
●
●
●●
●
● ●
●
●●
●●
●
●
●
●●
●
●
●
●●
●
●
●
●
●
●
●
●
●
●
●●
●
●
●
●
● ●
●
●
●●
●
●
●
●●
●
●
●
●
●
●
●●
●
●
●
●
●
●
●
●
●
●●
●
●
●
●●●
●●
●
●
●
●
●
●
●
●
●
●
●●●
●
●●
●
● ●
●●
●●●
●
●
●
●
●
●●
●
●
●
●
●
●
●●
●
●
●
●
●
●
●
●
●●
●
●
●
●
●
●
●
● ● ●
●
●
●
●●
●
●
●
●●
●
●
●
●
●
●
●
●
●
●
●●
●
●●
●
●
●
●
●
●●●
●
●
●
●
●
●
●●
● ●●
●
●●
●
●
●
●
●
●
●
●
●●
●●
●
●●
●
●
●
●
●
●
●
●●
●
●
●
●
●
● ●●
●●
●●
●●
●
●
●
●
●
●
●
●
●●
●
●
●
●
●●
●
●
●
●
●
●
●
●
●
●●
●
●
●
●
●
●
●
●
●●
●
●
●
●
●
●
●
●
●●
●
●●
●● ●
●
●
●
●
●●
●
●●
●
●
●
●●
●
●
●
● ●
●
●
●
●
●●
●
●
●
●●
●
●
●
●
●
●
●
●
●
●●
●
●
●
●
●
●
● ●
●●
●
●
●●
● ●
●
●●
●
●
●
●
●
● ●
●
●
●●
●
●
●
●
●
●
● ●
●
●
●
●
●
●
●
●
●
●
●●
●
●
●
●●
●
●●
●
●●
●
●
●
●
●
●
●●
●
●
●
●
●
●●
●
●
●
● ●
●●
●●●
●
●
●
●
●●
●
●●
●
●
●
●
●
●
●
●●
●●
●
●
●
●●
●
●
●
●
●
●
●
●
●
●
● ●
●
●
●
●
●
●●
●
●●
●●
●● ●
●
●●●
●
●
●
●●
●
●
●
●
●
●
●
●
●
●
●
●
●
● ●
●
●
●
●●
●
●
●●
●
●
●
●
●
●
●
●●
●
●
●
●
●
●
●
●
●
●
●
●
●
●
●
●
●
●
●
●● ●●
●
●
● ●
●
●
●●
●
●
●
●
●
●
●
●
●
●
●●
●
●
●
●
●
●
●
●
●
●●
●
●
●
●
●
●
●
●
●
●
●
●
●
●
●
●●
●
●
●
●
● ● ●
●
●
●●
●
●
●
●
●
●●●●
●
●
●
●●●
●
●
●
●
●
●
●●●
●
●
●
●
●
●
●●
●
●
●
●●●
●
●
●
●
●
●●
●●
●
●
●
●
●
●
●
●
●
●
●● ●
●
●
●
●
●
●
●● ●
●
●
●
●
●
● ●
●
●
● ●
●
●
●
●
●
●●
●
●
●
●
●
●
●
●
●
●
●
● ●
●●
●
●
●●
●
●
●●
●
●
●
●
●
●
●
●●
●
●
●
●
●
●●
●
●
●
●
●
●
●
●
●
●
●
●●
●● ●
●
●
●
●
●
●
●
●
●
●
●
●
●
●
●
●
●
●
●
●
●
●●
●
●●
●
●
●
●
●
●
●
●●
●
● ●
●
●
●●
●
●
●●●
●
●
●
●
●
●
●
●
●
●
●
●
●
●●
●
●
●
●
●
●
●●
●
●
●
●
●
●
●
●
●
●
●●●
●●●
●
● ●●
●
●
● ●
●
●●
●●
●
●
●
●●●
●
●
● ●
●
●
●
●
●
●●
●
●
●
●
●
●
●
●
●
●●
●
●
●
●
●
●
●
●
●
●
●●
●
●●
●
●
● ●●●
●
●
●
●
●
●
●
●
●●● ●
●
●
●
●
●
●
●●
●
●
●
●
●
●●
●●
●
●
●
●
●
●
●●
●●
●●
●
●●
●
●
●
●
●
●
●
●
●●
●
●
●
●●
●
●
●
●
●
●
●
●
●
●
●●
●
●
●
● ●
●
●
●
●
●
●
●●
●
●
●
●●
●
●
●
●
●
●
●
●
●
●
●
●
●
●
●●
●
●
●
●
●
●
●
●●●
●
●
●
●
●
●
●
●
●
●
●
●●
●
●
●
●
●
●
●
●
●
●
●
●●
●
●
●
●
●
●
●
●
●
●
●
●
●
●
●
●
●
●
●
●
●●
●●
●
●
●
●
●
●
●●
●
●
●
●
●●
●
●●
●●
●
●
●
●
●
● ●●
●
●
● ●
●
●
●
●
●
●
●●
●
●
●
●
●
●
●
●●
●●
●
●
● ●
●
●
●
●
●
●
●●
●●
●
●●
●
●
●
●
●
●
●●
● ●
●
●
●
●●
●
●
●
●●
●
●
●
●●
●
●
●
● ●
●
●
●
●
●
●
●
●
●
●
●●
●●
●
● ●● ●
●
●
●●
● ● ●
●
●
●●
●
●
●
●
●
●
●●
●●
●
●
●
●●
●
● ●
●
●
●
●●
●
●
●
●
●
●
●
●
●
●●
●
●
● ●
●
●
●
●
●
●
●●
●●
●
●
●
●
●
●
●
●
●
●
●
●
●
●
●
●●
●
●
●
●
●●
●
●
●
●
●
●
●● ●
●
●
●
●
●
●
●
●●
●●
●●
●
●
●
●
●
●
●
●
●
●
●●
●
●
●●●
●
●
●
●●●
●
●
●
●●
●
●
●
●
●
●
●
●
●
●
●
●
●
●
●
●
●
●
●
●
●
●
●
●
●●
●
●
●
●
●
●
●
●
●
●
●
●
●
●
●
●
●
●
●
●
●
●
●
●
●
●
●
●
●●
●
●
●
●
●
●●
●
●
●
●
●
●
●
●
●
●●
●
●
●
● ●
●●
●
●
● ●
●
●
●
●●
●●
●
●
●
●
●
●
●
●
●
● ●
●
●
●
●
●
●
●
●●
●●
●
●
●
●
●
●
●●
●
●
●
●
●●
●
●
●
●●
●
●
●●
●
●
●
●
●
●
●
●
●
● ●●
● ●●
●
●
●
●
●
●
●
●
●●
●
●
●
●
●
●
●
●
●
●●
●
●
● ●
●
●
●
●
●
●
●
●
●●
●
●
●●
●
●
●
●
●
●
●
●
●
●
●
●
●
●
●
●● ●
●
●
●●
●
●
●●●
●
●
●
●
●●
●
●
●
●
●
●
●●
●
●
●
●
●
●●
● ●
●
●●●
●
●
●
●
● ●
●
●
●
●
●
●
●
●
● ●
●
●
●
●
●
● ●
●
●
●
●
●
●
●
●
● ●
●●
●
●
●
●
● ●
●
●●
●
●
●●
●●
●
●
●
●
●
●
●
●
●
●
●
●●
●
●
●
●
●●
●
●
●
●
●
●●
●
●
●
●
●●
●
● ●
●
●
●
●
●
●
●
●●
●● ●●●
●●
●●
●
●
●
●●
●
●
●
●
●
● ●
●●
●
●●
●
●
●
●●
●●●
●●
●
●● ●
●
●●
●
●
●
● ●
●●
●●
●
●
●●
●
●
●
●
●
●
●
●
●
●
●
●
●
●●
●
●
●
●
●●
●
●
●
●
●
●
●
●
●
● ●
●●
●●
●
●●
●
●
●
●
●
●
● ●
● ●
●
●
●
●●
●
●
●
●
●
●
●
●●
●
●● ●
●
●
●
●
●
●●
●
●●
●
●
●
●
●
●
●
● ●●
●
●
●
●●●●
●
●●●
●
●
●
●
●
●
●
●●
●
●●
● ●
●
●
●
●
●
●
●
●
●
●
●
●
●●
●●
●
●
●
●
●
●●●
●●●
●
●●
●
●
●
●●●●●
●●
●
●
●
●
●● ●
●
●● ●
●
●
●
●●●
●●
●
●
●
●●
●
●
●
●
●
●
●
●
●●
●
●
●
●
●●
●
●
●
●
●
●
●
●
●●
●
●
●
●
●
●
●●
●
●
●
●●
●
●
●
●
●
●
●
●●
●
●
●
●
●●
●●
●●
●
●●
●
●
●
●
●
●
●
●
●●
●
●●
●
●●●●
●
●
●
●
●
●
●
●
●
●
●
●
●
●
●●●●
●
●
●●
●
●
●
●
●
●
●
●
●
●
●
●●
●
●
●●
●
●
●
●
●
●
●
●
●●
●
●●
●
●
●●
●
●
●
●
●
●●●
●
●●
●
●
●
●●
●
●
●
●●
●
●●
●
●
●
●
●
●
●
● ●
●
●
●
●
●
●
● ●
●
●
●●
●
●
●
●●
●
●
●●
●
●●
●●
●
●
●
●
●
●
● ●●
●
●
●
●
●●
●
●
●
●
●
●●
●
● ●
●
●
●
●●●
●●
●●
●
●
●
●
●
●
●
●
●
●
●
●
●●
●●
●
●
●
●
●
●●
●
●
●
●
●●
●
●
●
●
●
●●
●
●
●●
●
●
●
●●
●
●
●
●
● ●
●
●
●●
●
●●
●
●
●
●
●
●
●
●
●
●
●
●
●
●
●
●
●
●
●
●
●
●
●
●●
●
●
●
●
●●
●
●
●
●
●
●●
●
●
●●
●
●
●
●
●
●●
●
●
●
●
●
●
●
●
●●
●
●
●
●
●
●●
●
●
●
●
●
●●
●
●●●
●
●
●
●
●
●●
●
●
●
●●●
●
●
●
●●
●
●
●
●
●● ●
●
●
●
●
●
●
●
●●
●
●
●
●
●
●
●
●
●
●●
●●
●
●
●
●●
●●
●
●
●●
●
●
●
●
●
●●
●
●
●
●
●
●
●
●
●●
●
●
●
●
●
●
●
●
●●
●
●
●
●
●
●
●
●●
●
●
●
●●
●
●●
●
●
●●
●
●●
●●
●
●●●
●
●
●●●
●● ●
●●
●●
●●
●
●
●
●
●
●
●
●
●
●●
●
●●
●
●
●
●
●
●
●
●
●
●●
●
●
●
●
●
●
●●
●
●●● ●
●●
●
●
●
●
●
●●
●
●
●
●
●●
●
●●
●
●
●
●
●●
●
●
●
●
●
●
●
●
●
●
●●
●
●●
●
●
●●
●
●
●
●
●
●
●
●●
●
●
●
●
●
●
●
●
●
●●
●
●
●
●
●
●
●
●
●
●
●
●
●
●
●
●
●
●
●●
●●
●
●●
●●
●
●
●
●
●
●
●
●●
●
●
●
●
●
●
●
●
● ●●
●
●
●●●
●
●●
●
●
●
●
●
●
●
●●
●
●
●
●
●●
●●
●
●
●
●
●
●
●
●
●
●●
●
●
●
●
●
●●●
●●
●
●
●
●●
●
●●
●
●
●
●
●
●
●●
●
●
●
●
●●
●
●
●
●
●
●
●
●
●
●
●
●●
●
●
●
●
●
●
●
●●
●
●
●
●● ●●
●
●
●
●
●
●
●
●
●
●
●
●
●
●
●
●
●
●
●
●
●
●
●
●
●
●●
●
●
●●
●
●
●
●
●
●
●
●
●
●
●
●
●
●
●
●
●
●●
●●
●
●
●
●
●
●●
●●
●
●
●●
●
●
●●
●
●●
●●
●
● ●●
●●●●
●
●
●
●
●
●●
●
●
●
●
●
●
●
●
●
●
●
●
●
●
●
●
●
●
●●●
●
●
●
●
●
●
●
●
● ●●
●
●●
●●●
●
●
●
●●
●
●
●
●
●
●
●
●
●
●
●●
●●
●
●
●
●
●
●
●
●
●
●
●●●●
●
●●
●
●
●
●
●
●
●●
●
●●
●
●
●●
●
●
●
●
●●
●
●
●
● ●
●
●●
●
●●●
● ●
●
●
●
●
●
●●
●
●
●
●●
●●
●
●
●
●
●
●
●
●
●
●
●
●
●●●
●
●
●
●
●
●●
●●
●
●
●●
●
●
●
●
●
●
●
●●●
●
●
●
●
●
● ●
●●●
●●
●
●
●
●
●
●
●
●
●
●
●
●
●
●
●
●
●
●
●●
●
●
●●
●
●
●
●●
●
●
●
●
●
●
●
●
●
●
●
●●
●●
●
●
●
●●
●
●
●
●
●●
●●●
●
●
●
●
●
●●
●
●
●
●
●
●
●
●
● ●
●
●
●
●
●
●
●
●
●●● ●●●
●
●●
●● ●
●●
●
●
●
●
●
●
●
●
●●●
●●
●
●
●●
●
●
●
●
●
●
●●●
●
●
●
●●
●●
●
●●
●
●
●
●
●
●●
●
●
●
●
●
●●
●●
●
●
●
●●
●●
●
●
●
●
●●
●
● ●
●
●
●
●
●
●
●
●●
●
●
●●●
●
●●
●
●
●
●
●
●
●
●
●
●
●
●
●
●
●●
●●
●
●●
●
●
●●
●
●●
●
●
●
●
●
●
●
●
●
●
●
●
●
●
●
●
●
●
●
●
●
●
●
●●
●
●
●
●
●
●
●
●
●
●●
●
●
●
●
●●
●
●
●● ●●
●●
●
●
●
●
●
●
●
●
●
●
●
●
●●
●●●
●●
●
●
●
●●
●
●
●
●
●
●
●
●
●
●●
●
●
●
●
●
●
●
●
●
●
●
●
●
●
●
●
●
●●
●
●
●●
●
●
●
●
●
●
●
●
●
●
●
●
●
●
●
●
●
●
●
●
●
●
●
●
●
●
●●
●● ●●
●
●
●
●●
●
●
●
●
●
●
●●
●
●
●
●
●
●
●
●
●
●
● ●●
●
●●
●
●
●●
●
●
●
●●●
●●
●●
●
●
●●
●●●
●
●
●
●
●●
●
●
●
●
●
●
●
●●●
●
●
●
●
●
●
●
●
●●
●
●
●
●●
●
●
●●
●
●●●●
●
●
●
●
●●
●●
●
●
●
●
● ●
●
●
●
●
●
●
●
●
●
●
●
●
●
●
●
●
●
●
●
●
●
●
●●
●
●
●●
●●●
●
●
●
●
●
●
●●
●
●
●
●●
●
●
●
●
●
●
●
●
●
●
●
●
●●
●
●●
●
●
●●
● ●●
●
●
●●
●
●
●●
●
●
●
●
●
●
●
●
●
●
●
●
●
●●
●
●●
●●
●●
●
●● ● ● ●●
●
●●
●
●
●
●
●
●
●
●●
●
●
●
●●
●●
●
●
●
●●
●
●
●●
●●●
●
●
●
●
●
●
●
●
●
●
●
●
●
●●●●
●●
●
●
●
●
●●
●
●
●●
●●
●
●
●
●
●
●
●
●
●
●
● ●●●
●
●●
●
●
●
●
●●
●
●●
●
●
●
●
●
●
●
●
●
●
●
●
●
●
●
●
●
●●
●
●
●
●
●●
●
●
●
●
●
●
●
●
●●
●
●●
●
●
●
●
●
●●
● ●●●
●
●
●
●
●
●●
●
●
●
●
●
●
●
●
●
●
●
●
●
●
●
●
●
●
●
●
●
●
●
●
●
●
●
●●
●
●●
●
●
●●
●
●
●
●
●
●
●
●
●
●
●
●
●
●
●
●●
●
●
●●
●
●
●
●● ●
●
●
●
●
●●
●
●●
●
●
●
●
●
●●●●
●
●
●
●
●
●●●
●●
●
●●
●
●
●
●
●
●
●
●
●
●
●●
●
●
●●
●
●
●
●●
●
●
●
●●
● ●
●
●
●●●
●
●●
●
●●
●
●
●
●
●
●
●
●
●
●
●●
●
●
●
●
●
●
●
●
●
●
●
●
●
●
●
●
●●
●
●
●
●
●
●
●●
●
●
●
●
●
●
●
●
●●
●
●
●
●●
●
●
●
●
●
●
●
●
●
●
●
●●●
●
●
●
● ●
●
●●● ●
●
●
●
●
●●
●
●
●
●
●
●
●
●
●
●
●
●
●● ●
●
●
●
●
●
●●●
●
●
●
●
●●●
●
●
●
●
●
● ●
●
●
●
●
●
●
●
● ●
●
●
●
●
●
●
●
●
●●
●●
●
● ● ●
●
●
●
●
●
●
●
●
●
●
●
●
●
●
●●
●
●
●
●
●
●●
●
●●
● ●
●
●
●
●● ●
●
●
●●
●
●
●
●
●●
●
●
●
●
●
●
●
●
●
●
●
●
●●●
●
●
●
●
●
●
●
●
● ●
●
●
●
●
●
●●
●
●
●
●
●
●
●
●
●●
●●●
●
●
●
●
●
●
●
●
●
●●
●
●
●●
●
●
●
●●●●
●
●
●
●
●
●
●
●
●
●
●
●
●
●
●
●
●
●●●
●●
●
●
●
●
●
●
●
●
●
● ●
● ●●
●
●
●
●●
●
●
●
●
●
●●
●
●
●
●
●●
●
●
●
●
●
●
●
●
●
●
●
●
●
●
●
●
●
●
●
●
●
●
●
●
●
●
●
●
●
●
●
●
●
●
●●
●●●
●
●●
●
●
●
●
●●
●
●
●
●
●
●
●
●
●●
●●
●●
●
●●
●
●
●●
●
●
●
●
●
●
●
●
●
●
●
●●
●
●
●●
●
●
●
●
●
●●
●
●●
●
●
●
●●●●
●
●
●
●
●
●
●
●
●
●●
●
●
●●
●
●●
●●●
●
●
●
●
●
●
●
●
●
●
●
●
●
●
●
●
●
●●
●
●
●
●
●
●
●
●
●
●
●
●
●
●
●
●
●
●
●●
●
●●
●
●●
●
●
●
●
●
● ●
●
●
●●
●
●
●
●
●
●●
●
●
●
●
●
●●
●
●
●
●●
●
●
●
●
●●
●
●
●
●
●
●
●
●
●
●
●●
●
●
●
●●
●
●
●●
●
●
●
●
●
●
●●
●●●●
●
●
●
●
●
●
●●
●●
●
●●
●
●
●
●
●
●
●●
● ●●
●
●
●
●
●
●
●
●
●●
●
●
●
●
●
●●
●
●
●
●●
●
● ●
●
●
●
●
●
●
●
●
●
●
●
●●
●
●
●
●
●
●
●
●
●
●
●
●
●
●
●
●
●
●
●
● ●
●
●
●
●
●●
●
●
●
●
●
● ● ●●●
●
●
●●
●
●● ●
●
●
●●
●
●
●
●●
●
●●
●●●
●
●
●
●
●
●
●
●
●
●
●
●●
●
●
●
●●
●
●
●
●
●●
●
●
● ●
●
●●
●
●
●
●
●
●
●
●
●●●
●
●
●
●
●
●
●
●
●
●
●
●●●
●
●
●
●●
●
●
●
●
●
●
●
●
●
●
●
●
●
●●
●
●
●●●
●
●
●
●
●
●
●
●●
●
●
●
●
●
●
●
●
●
●●
●
●
●
●
●●●
●●
●
●
●● ●
●
●●●
●
●
●●
●
●
●●
●
●
●
●
●
●
●
●
●●
●●
●
●
●
●
●
●
●
●
●
●
●
●
●
●
●
●
●
●●
●
●
●●
●
●
●
●
●
●
●●●
●
●
●
●
●
●
●●
●
●
●
●●
●
●●
●
●●
●
●
● ●
●●
●
●
● ●
●
●
●
●
●
●
●
●
●
●
●
●
●
●
●●
●●
●
●
●
●
●
●
●
●
●
●
●
●
●
●
●
●
●
●
●●
●
●
●
●
●
●●
●
●
●
●
● ●
●
●
●
●
●
●
●●
●
●●
●
●
●
●
●
●●
●
●
●
●
●
●
●
●●
●
●
●
●
●
●
●
●●
●
●
●
●●
●
●
●
●
●
●
● ●
●●
●
●
●●
●●
● ●
●
●
●
● ●
●
●
●
●
●
●
●
●
●
● ●
●
●
●
●●
●
●
●
●●
●
●
●
●
●●●
● ●
●
●
●
●
●●
●
● ●
●
●
●
●
●
●
●
●
●●
●
●●
●●●
●
●
●
●
●
●
●
●
●●
●●
●
●
●
●●
●
●
●
● ●●
●●
●
●
●
●
●●
●
●
●●●
●
●
●
●
●
●
●
●
●●
●
●
●●
●
● ●
●
●
● ●
●
●
●
●
●
●
●
●●
●
●
●
●
●
●
●
●
●
●
●
●
●
●●
●
●
●
●
●
●
●
● ●
●● ●●●
●●
●●
●
●
●
● ●
●
●
●
●
●
● ●
●●
●
●
●
●
●
●
●
●
●● ●
●●
●
●
●●
●
●●
●
●
●
●●
●
●
●
●
●
●●
●
●
●
●
●
●
●
●
●
●
●
●
●
●
●●
●
●
●
●
●●
●
●
●
●
●
●
●
●
●
●●
●●
●●
●
●●
●
●
●
●
●
●
●
●
●
●
●
●
●
●●
●
●
●
●
●
●
●
●●
●
●
● ●
●
●
●
●
●
●●
●
●●
●
●
●
●
●
●
●
●●
●
●
●
●
●●
●●
●
●●
●
●
●
●●
●
● ●
● ●
●
●
●●
●
●
●
●
●
●
●
●
●
●
●
●
●
●
●
●
●
●
●
●
●
●
●● ●
●
●●
●
● ●
●● ●
●●●
●●●●
●
●
●
●
●●
●
●
●● ●
●
●
●
●●
●
●●
●
●
●
●●
●
●
●
●
●
●
●
●
●
●
●
●
●
●
●
●
●
●
●
●
●
●
●
●
●●
●
●
●
●
●
●
●●
●
●
●
●
●
●
●
●
●
●
●
●
●
●
●●
●
●
●
●
●
●
●●
●
●
●
●
●
●
●
●
●
●
●
●
●
●
●●
●
●
● ●●
●
●
●
●
●
●
●
●
●
●
●
●
●
●
●●
●
●
●
● ●●
●
●
●
●
●
●
●
●
●
●
●
● ●
●
●
●
●
●
●
●
●
●
●
●
●
●●
●
●●
●
●
●●
●
●
●
●
●
●●●
●
●●
●
●
●
●
●
●
●
●
●
●
●
●●
●
●
●
●
●
●
●
● ●
●
●
●
●
●
●
● ●
●
●
●●
●
●
●
●●
●
●
●●
●
●●
●●
●
●
●
●
●
●
● ●●
●
●
●
●
●●
●●
●
●
●
●●
●
●●
●
●
●
●●●
●
●
●●
●
●
●
●
●
●
●
●
●
●
●
●
●
●
●
●
●
●
●
●
●
●
●
●
●
●
●
●
●
●
●
●
●
●
●●
●
●
●
●
●
●
●
●●
●
●
●
●
● ●
●
●
●●
●
●●
●
●
●
●
●
●
●
●
●
●
●
●
●
●
●
●
●
●
●
●
●
●
●
●●
●
●
●
●
● ●
●
●
●
●
●
●
●
●
●
●●
●
●
●
●
●
●●
●●
●
●
●
●
●
●
●●●
●
●
●
●
●●
●
●
●
●
●
●●
●
●●
●
●
●
●
●
●
●●
●
●
●●
●●
●
●
●
● ●
●
●
●
●
● ●●
●●
●●
●
●
●
●●
●
●
●
●
●
●
●
●
●
●●
●●
●●
●
●●
●
●
●
●
●●
●
●
●
●
●
●
●
●
●
●
●
●
●
●
●
●●
●
●
●
●
●
●
●
●
●●
●
●
●
●
●
●
●
●
●
●
●
●
●●
●
●●
●
●
●
●
●
●●
●
●
●
●●●
●
●
●●●
●
● ●●
●●
●
●●
●
●
●
●
●
●
●
●
●
●
●
●
●●
●
●
●
●
●
●
●
●
●
●
●
● ●●
●
●
●
●
●
●
●●●
●
●●
●
●
●
●
●
●
●
●
●
●
●
●
●
●
●
●
●
●
●
●
●●
●
●
●
●
●
●
●
●
●
●
●
●
●
●●
●
●
●
●
●
●
●
●●
●
●
●●
●
●
●
●
●
●
●
●
●
●
●
●
●
●
●
●
●
●
●
●
●
●
●
●
●
●
●
●
●
●
●
●
●
●
●●
●●
●
●
●
●
●
●
●
●●
●
●
●
●
●
●
●
●
●●●
●
●
●
●●
●
●
●
●
●
●
●
●
●
●
●●
●
●
●
●
● ●
●
●
●
●
●
●●
●
●
●
●
●
●
●
●
●
●
●
●●
●
●●
●●
●
● ●
●
●●
●
●
●
●
●
●
●●
●
●
●
●●
●●
●
●
●
●
●
●
●
●
●
●
●●
●
●
●
●
●
●
●
●
●
●
●
●
●● ●
●
●
●
●
●
●
●
●
●
● ●
●●
●
●
●
●
●
●
●
●
●
●
●
●
●
●
●
●
●
●●
●
●
●
●
●
●
●
●
●●
●
●
●
●
●
●
●
●
●
●●
●
●
●
●
●
●●
●
●
●
●
●●
●
●
●
●
●
●●
●
●
●
● ●●
●●
●●●
●
●
●
●
●
●
●
●
●
●
●
●
●
●
●
●
●
●
●
●
●
●
●
●
●
●●
●
●
●
●
●
●
●
●
● ●●
●
●●
●
●●
●
●
●
●●
●
●
●
●
●
●
●
●
●
●
●●
●
●
●
●
●
●●
●
●
●
●
●
●●●
●
●
● ●
●
●
●
●
●
●
● ●
●
●●
●
●
●●
●
●
●
●
● ●
●
●
●
●●
●
●●
●
●●●
●●
●
●
●
●
●
●
●
●
●
●
●
●
●●
●
●
●●
●●
●
●
●
●
●
●
●●●
●
●
●
●
●
●●
●●
●
●
●
●●
●
●
●
●
●
●
●●●
●
●
●
●
●
●●
●●●
●●
●
●
●
●
●
●
●
●
●
●
●
●
●
●
●
●
●
●
●●
●
●
●
● ●
●
●
●●
●
●
●
●
●
●
●
●
●
●
●
●
●
●
●●
●
●
●●
●
●
●
●
●●
●●●
●
●
●
●
●
●● ●
●
●
●
●
●
●
●
●●
●
●
●
●
●
●
●
●
●●● ●●
●
●
●●
●●●
●
●
●
●
●
●
●
●
●
●
●●●
●●
●
●
●●
●
●
●
●
●
●
●●
● ●
●
●
●
●
●●
●
●●
●
●●
●
●
●
●
●
●
●
●
●
●●
●●
●
●
●
●●
●●
●
●
●
●
●●
●
●●
●
●
●
●
●
●
●
●●
●
●
●●●
●
●●
●
●
●
●
●
●
●
●
●
●
●
●
●
●
●●
●●
●
●
●
●
●
●●
●
●
●
●
●
●
●
●
●
●
●
● ●
●
●
●
●
●
●
●
●
●
●
●
●
●
●●
●
●
●
●
●
●
●
●
●
●
●
●
●
●
●
●●
●
●
●●
●●
●●
●
●
●
●
●
●
●
●
●
●
●
●
●
●
●
●●
●●
●
●
●
●
●
●
●
●
●
●●
● ●
●
●
●
●
●
●
●
●
●
●
●
●
●
●
●
●
●
●
●●
●
●
●
●
●
●
●
●
● ●
●
●
●
●
●
●
●
●
● ●
●
●
●
●
●
●
●
●
●
●
●
●
●●
●●●
●
●
●
●
●●
● ●
●
●
● ●
●●
●
●
●
●
●
●
●
●
●
●
● ●●
●
●
●
●
●
●
●
●
●
●
●●●
●
●
●●
●
●
●●
●●●
●
●
●
●
●
●
●
●
●
●
●
●
●
●
●●
●
●
●
●
●
●
●
●
●
●
●
●
●
●
●
●
●
●
●
●
●●
●●
●
●
●
●
●●
●●
●
●
●
●
● ●
●
●
●
●
●
●
●
●
●
●
●
●
●
●
●
●●
●
●
●
●
●
●●
●
●
●
●●
●●
●
●
●
●
●
●
●●
●●
●
●●
●
●
●
●
●
●
●
●
●
●
●
●
●
●
●
●●
●
●
●●
●●●
● ●
●●
●
●
●●
●
●
●
● ●
●
●
●
●
●
●
●
●
●●
●
●●
●
●
●●
●
●● ●
● ●●
●
●●
●
●
●
●
●
●
●
●
●
●
●
●
●●
●●
●
●
●
●
●
●
●
●●
●●
●
●
●
●
●
●
●
●
●
●
●
●
●
●
●●●●
●●
●
●
●
●
●●
●
●
●
●
●●
●
●
●
●
●
●
●
●
●
●
●●
● ●
●
●
●
●
●
●
●
●●
●
●●
●
●
●
●
●
●
●
●
●
●
●
●
●
●
●
● ●
●
●●
●
●
●
●
●
●
●
●
●
●
●
●
●
●●●
●●
●
●
●
●
●
●
●
●●
●
●
●
●
●
●
●
●●
●
●
●
●
●
●
●
●
●
●
●
●
●
●
●
●
●
●
●
●
●
●
●
●
●
●
●
●●
●
●●
●
●
●●
● ●
●
●
●
●
●
●
●
●
●
●
●
●
●
●
●
●
●
●●
●
●
●
●● ●
●
●
● ●
●●
●
●●
● ●
●
●●
●●● ●
●
●
●
●
●
●
● ●
●●
●
● ●
●
●
●
●
●
●
●
●
●
●
●●
●
●
●●
●
●
●
● ●
●
●
●
●
●
●●
●
●
●●●
●
●●
●
●
●
●
●
●
●
●
●
●
●
● ●
●
●
●
●
●
●
●
●
●
●
●
●
●
●
●
●
●
●
●
●
●
●
●
●
●
●
●●
●
●
●
●
●
●
●
●
●
●
●
●
●
●●
●
●
●
●
●
●
●
●
●
●
●
●●●
●
●
●
●●
●
●●●
●
●●
●
●
●●
●
●
●
●
●
●
●
●
●
●
●
●
●●●
●
●
●
●
●
●●
●
●
●
●
●
●●
●
●
●
●
●
●
●●
●
●
●
●
●
●
●
● ●
●
●
●
●
●
●
●
●
●●
●
●
●
● ●●
●
●
●
●
●
●
●
●
●
●
●
●
●
●
●●
●
●
●
● ●
●●
●
●●
●●
●
●
●
●● ●
●
●●
●
●
●
●
●
●●
●
●
●
●
●
●
●
●
●
●
●
●
●
●●
●
●
●
● ●
●
●
●
● ●
●
●
●
●
●
●●
●
●
●
●
●
●
●
●
●●
●● ●●
●
●
●
●
●
●
●
●
●●
●
●
●●
●
●
●
●●●
●●
●
●
●
●
●
●
● ●
●
●
●
●
●
●
●
●
●●●
●
●
●
●
●
●
●
●
●
●
●
● ●
● ●
●●
●
●
●
●
●
●
●
●
●
●
●
●
●
●
●
●●
●
●
●
●
●
●
●
●
●
●
●
●
●
●
●
●
●
●
●
●
●
●
●
●
●
●●
●
●
●
●
●
●
●
●
●
●●●
●
●●
●
●
●
●
●●
●
●
●
●
●●
●
●
●●
●●
●●
●
●●
●
●
●●
●
●
●
●
●
●
●
●
●
●
●
●
●
●
●
●●
●
●
●
●
●
●●
●
●●
●
●
●
●●
●●
●
●
●
●
●
●
●
●
●
●●
●
●
●
●
●
●●
●● ●
●
●
●
●
●
●
●
●
●
●
●
●
●
●
●
●
●
●●
●
●●
●
●
●
●
●
●
●
●
●
●
●
●
●
●
●
●●
●
●●
●
●●
●
●
●
●
●
●●
●
●
●●
●
●
●
●
●
● ●●
●
●
●
●
●●
●
●
●
●●
●
●
●
●
●●
●
●
●
●
●
●
●
●
●
●
●●
● ●
●
●●
●
●
●●
●
●
●
●
●
●
●●
●●●●
●
●
●
●
●
●
●●
● ●
●
●
●
●
●
●
●
●
●
●●
●
●●
●
●
●
●
●
●
●
●
●●
●
●
●
●
●
●
●
●
●
●
●●
●
●●
●
●
●
●
●
●
●
●
●
●
●
●●
●
●
●
●
●
●
●
●
●
●
●
●
●
●
●
●
●
●
●
● ●
●
●
●
●
●●
●
●
●
●
●
●● ●
●
●
●
●
●●
●
●
● ●
●
●
●●
●
●
●
●●
●
●●
●●●
●
●
●
●
●
●
●
●
●
●
●
●
●
●
●
●
●●
●
●
●
●
●
●
●
●
●●
●
●●
●
●
●
●
●
●
●
●
●● ●
●
●
●
●●
●
●
●
●
●
●
●●●
●
●
●
●●
●
●
●
●
●
●
●
●
●
●
●●
●
● ●
●
●
●
●●
●
●
●
●
●
●
●
●●
●
●●
●
●
●
●
●
●
●
●
●
●
●
●
●●
●
●●
●
●
●● ●
●
●●●
●
●
●
●
●
●
●●
●
●
●
●
●
●
●
●
●●
●●
●
●
●
●
●
●
●
●
●
●
●
●
●
●
●
●
●
●●
●
●
●
●●
●
●
●
● ●
●●●
●
●
●
●
●
●
●
●
●
●
●
●
●
●
●
●
●
●
●
●
●
● ●
● ●
●
●
● ●
●
●
●
●
●
●
●
●
●
●
●
●
●
●
●●
●●
●
●
●
●
●
●
●
●
●
●
●
●
●
●
●
●
●
●
●●
●
●
●
●
●
●●
●
●
●
●
●
●
●
●
●
●
●
●
●●
●
●●
●
●
●
●
●
●●
●
●
●
●
●
●
●
●●
●
●
●
●
●
●
●
●●
●
●
●
●●
●
●
●
●
●
●
●●
●●
●
●
●●
●
●
● ●
●
●
●
● ●
●
●
●
●
●
●
●
●
●
● ●
●
●
●
●
●
●
●
●
●
●
●
●
●
●
● ●●
●●
●
●
●
●
●
●
●
● ●
●
●
●
●
●
●
●
●
●
●
●
●●
●●●
●
●
●
●
●
●
●
●
●●
●●
●
●
●
●●
●
●
●
●●
●
●●
● ●
●
●
●●
●
●
●●●
●
●
●
●
●
●
●
●
●●
●
●
●●
●
● ●
●
0
50
100
150
200
250
0.00 0.25 0.50 0.75 1.00
Rank within Type
Inco
me
(tho
usan
ds o
f Eur
os)
Income●●●
●●●
●●●
Deciles_Fit
Original
Regression_Fit
Income and 'Effort' Sample age 60 and over ; 30 Types;
Smoothed fit NW non−parametric regression and Deciles
Obs. < 250,000 euros
●
●
●
●
●
●
●
●
●●
●
●
●
●
●
●●
●
●
●
●●
●
● ●
●●
●
●
●
●
●
●
●
● ●
●●●
●
●
●
● ●
●
●
●
●
●
●●
●
●
●
● ●
●
●
●
●
●
●●
●
●
●
●
●●●
●●●
●
●●
●●
●
●
●
●
●
●
●
●
●
●
●
●
●
●
●
●
●
●
●
●
● ●●
●
●
●
●
●
●
●
●
●●
●
● ●
●
●●
●●
●●
●
●● ●
●
●
●
●
●
●
●
●
●
●
●
●
●
●
●
●
●
●
●
●
●●
●
● ●
●
●
●
●
●
●●
●
●
●●●
●
●
●
●
●
●●
●●
●
●
●
●● ●●
●
●
●
●
●
●
●
●
●
●
●
●●
●
●●
●
●
●●
●
●
●
●
●
●
●
●
●
●
●
●
●● ●
●
●
●
●
●
●
●
●
●
●
●
●●
●
●
●
●
●
●
●●
●●
●
●
●
●●
●
●
●
●
●●
●
● ●●
●
●
●
●
●
●●
●
●●
●
●●●
●●
●
●
●
●● ●
●
●
●
●
●
●
●
●●
●
●
●
●
●●
●
●
●
●●
●
●
●
●
●
●
●
●
●
●●
●
●
●
●
●●
●
●
●
●
●●
●
●
●
●
●
●
●
●
●
●
●
●● ● ●
●●
●
●
●●
●
●
●
●
●
●●
●
●
●
●●
●●
●●
●
●● ●
●
●●
●
●
●
●
●
●
●
●
●
●
●
●
●
●
●
●
●
●
●
●
●
●
●
●
●●
●
●
●
●
●
●
●●●
●
●
●
●
●
●
●
●
●
●
●
●
●
●
●●
●
●
●
●
●
●
●● ●
●
●
●
●
●
●
●●
●
●
●
●
●
●
●
●●
●
●
●
●
●●
●●●
●
●
●
●
●
●●
●●
●
●
●●
●
●
●
●
●
●
●
●
●
●
●
●
●
●
● ●
●
●●
●
●
●
●● ●
●
●
●
●
●
●●
●●
●
●
●
●
●
●● ●
●
●
●
●●
●●
●
●
●
●
●●
●●
●
●●
●
●● ●
●
●
●
●●
●
●
●●
●
●
●
●
●
●
●
●
●
●
●
● ●
●
●
●
●●
●
●
●
●
●
●
●
●●
●
● ●
●●
● ●
●
●
●
●●●
●
●
●
●
●
●
●
●
●
●
●●
●
●
●●
●
●
●
●
●
●
●
●
●
●
●
●
●
●
● ●
●
●●●
●
●
●
●
●
●
●
●
●
●
●
●
●
●
●
●
●
● ●
●
●
●
●● ●
●
●
●
●
●
●
●●
●
●
●
●
●
●
●●
●
●
●
●
●
●
●
●
●●
●
●
●●
●
●
●
● ●
●
●
●
●
●
●●●
●
●
●
●
●
●
●
●
●
●●●
●
●
●
●
●
●
●
●●
●
●
●
●
●
●
●
●
●
●
●
●
●
●
●
●
●
●● ●
●
●●●●
●●
●
●●
●
●●
●
●
●
●
●
●●
●
●
● ●
●
●
●
●
●
●
●
●
●
●
●
●
●
●
●
●
●
●
●
●
●
●
●●
● ●
●
●
●
●
●
●
●
●
●
●
●
●
●
●
●●
●
●
●●
●
●
●
●
●
●
●
●
●
●
●
●
●●
●●
●
●
●
● ●● ●
●
●
●
●
●
●●
●
●
● ●
●
●
●
●
●
●
●
●
●
●●
●
●
●
●
●
●
●●
●
●
●
● ●
●
●
●
●
●
●
●●●
●
●
●
●
●
●
●
●
●
●
●
●
●
●
●
●
●
●
●
●
●
●
●●
●
●
●
●●
●
●
●
●
●
●●
●
●
●
●
●
●
●
●
●
●
●
●
●
●
●
●
●
●●
●
●
●
●
●
●
●
●
●● ●
●●
●
●
●
●
●●
●
●
●
●
●
●
●
● ●
●
●●
●
●
●
●●
●
●
●
●
●● ●
●
●
●
●
●
●●
●
●
●
●
●● ●
●
●
●
●
●●
●
●
●
●
●
●●
●
●
●●
●
●
●
●
●
●
●
●
●
●
●●
●
●
●
●
●
●
●
●
●
●
●
●
●
●
●
●●
●
● ●
●
●
●
●
● ●●
●
●
●
●
●
●
●
●
●
●●
●
●
● ●●●
●
●● ●
●
●
●●
●
●●
●
●
●
●
●
● ●
●
●
●
●
●●
●
●
●●
●●
●
●
●
●
●
●
●
●
●
● ●
●
●
●
●
●
●
●
●
●
●
●
●
●
●
●
●
●
●●
●
●●
●
●
●
●
●
●
●
●
●
●
● ●
●●
●
●
●
●
●
●
●●
●
●
●
●
●
●
●
●
●
●
●
●
●●
●
●
●
●
● ●
●●
●
●
●●●
●
●
●
● ●
●
●
●
●
●●
●●
●●
●
●
●
●
●
●
●
●
●
●
●
●
●●
●
●
●
●
●
●●
●
●●
●
●
●●
●●
●
●
●
●●●
●●
●
●
●
●
● ●
●
●
●●
●●
●
●
●
●
●●
●
●
●
●
●
●
●
●
●
●
●
●
●
●
●
●
●
●● ●
●
●
●
●
●
●
● ●
●
●●
●
●
●
●
●
●
●●
●
●
●
●
●
●
●
●
●●
●
●
●
●
●
●
●
●
●
●
●
●●
●
●
●
●●
●●
●
●
●
●
●
●● ●
●●●
●
●
●
●
●
●●
●
●
●
●
●
●
●
●
●●
●
●●
●
●
●
●
●
● ●
●
●
●
●●
●
●
●
●
●
●
●
●
●
●●
●
●●
●
●●
● ●
●
●
●●
●
●
●
●
●
●
●
●
●
●
●
●
●
●
●
●●
●
●
●
●
● ●
●
●
●
●●
●
●●
●●
●
●●
●
●
●
●
●
●
●
●
●●
●
●●
●●
●
●
●●
●●
●
●
●
●
●
● ●
●
●
●
●
●
●
●
●
●
●
●
●
●
●
●
●
●
●
●
●●
●
●
●
●
●
●
●
● ●
●●
●
●
●
●
●● ●
●
●
●
●●
●●
●
●
●
●● ●
●
●
●
●
●
●
●
●●●
●
●
●
●
●●
●
●
●
●
●●
●
●
●
●
●
●
●
●●
●
● ●
●
●●
●●
●
●
●
●●
●
●
●
●●
●
●
●
●
●
●
●
●
●
●
●●
●
●
●
●
● ●
●
●
●●
●
●
●
●●
●
●
●
●
●
●
●●
●
●
●
●
●
●
●
●
●
●●
●
●
●
●●●
●●
●
●
●
●
●
●
●
●
●
●
●●●
●
●●
●
● ●
●●
●●●
●
●
●
●
●
●●
●
●
●
●
●
●
●●
●
●
●
●
●
●
●
●
●●
●
●
●
●
●
●
●
● ● ●
●
●
●
●●
●
●
●
●●
●
●
●
●
●
●
●
●
●
●
●●
●
●●
●
●
●
●
●
●●●
●
●
●
●
●
●
●●
● ●●
●
●●
●
●
●
●
●
●
●
●
●●
●●
●
●●
●
●
●
●
●
●
●
●●
●
●
●
●
●
● ●●
●●
●●
●●
●
●
●
●
●
●
●
●
●●
●
●
●
●
●●
●
●
●
●
●
●
●
●
●
●●
●
●
●
●
●
●
●
●
●●
●
●
●
●
●
●
●
●
●●
●
●●
●● ●
●
●
●
●
●●
●
●●
●
●
●
●●
●
●
●
● ●
●
●
●
●
●●
●
●
●
●●
●
●
●
●
●
●
●
●
●
●●
●
●
●
●
●
●
● ●
●●
●
●
●●
● ●
●
●●
●
●
●
●
●
● ●
●
●
●●
●
●
●
●
●
●
● ●
●
●
●
●
●
●
●
●
●
●
●●
●
●
●
●●
●
●●
●
●●
●
●
●
●
●
●
●●
●
●
●
●
●
●●
●
●
●
● ●
●●
●●●
●
●
●
●
●●
●
●●
●
●
●
●
●
●
●
●●
●●
●
●
●
●●
●
●
●
●
●
●
●
●
●
●
● ●
●
●
●
●
●
●●
●
●●
●●
●● ●
●
●●●
●
●
●
●●
●
●
●
●
●
●
●
●
●
●
●
●
●
● ●
●
●
●
●●
●
●
●●
●
●
●
●
●
●
●
●●
●
●
●
●
●
●
●
●
●
●
●
●
●
●
●
●
●
●
●
●● ●●
●
●
● ●
●
●
●●
●
●
●
●
●
●
●
●
●
●
●●
●
●
●
●
●
●
●
●
●
●●
●
●
●
●
●
●
●
●
●
●
●
●
●
●
●
●●
●
●
●
●
● ● ●
●
●
●●
●
●
●
●
●
●●●●
●
●
●
●●●
●
●
●
●
●
●
●●●
●
●
●
●
●
●
●●
●
●
●
●●●
●
●
●
●
●
●●
●●
●
●
●
●
●
●
●
●
●
●
●● ●
●
●
●
●
●
●
●● ●
●
●
●
●
●
● ●
●
●
● ●
●
●
●
●
●
●●
●
●
●
●
●
●
●
●
●
●
●
● ●
●●
●
●
●●
●
●
●●
●
●
●
●
●
●
●
●●
●
●
●
●
●
●●
●
●
●
●
●
●
●
●
●
●
●
●●
●● ●
●
●
●
●
●
●
●
●
●
●
●
●
●
●
●
●
●
●
●
●
●
●●
●
●●
●
●
●
●
●
●
●
●●
●
● ●
●
●
●●
●
●
●●●
●
●
●
●
●
●
●
●
●
●
●
●
●
●●
●
●
●
●
●
●
●●
●
●
●
●
●
●
●
●
●
●
●●●
●●●
●
● ●●
●
●
● ●
●
●●
●●
●
●
●
●●●
●
●
● ●
●
●
●
●
●
●●
●
●
●
●
●
●
●
●
●
●●
●
●
●
●
●
●
●
●
●
●
●●
●
●●
●
●
● ●●●
●
●
●
●
●
●
●
●
●●● ●
●
●
●
●
●
●
●●
●
●
●
●
●
●●
●●
●
●
●
●
●
●
●●
●●
●●
●
●●
●
●
●
●
●
●
●
●
●●
●
●
●
●●
●
●
●
●
●
●
●
●
●
●
●●
●
●
●
● ●
●
●
●
●
●
●
●●
●
●
●
●●
●
●
●
●
●
●
●
●
●
●
●
●
●
●
●●
●
●
●
●
●
●
●
●●●
●
●
●
●
●
●
●
●
●
●
●
●●
●
●
●
●
●
●
●
●
●
●
●
●●
●
●
●
●
●
●
●
●
●
●
●
●
●
●
●
●
●
●
●
●
●●
●●
●
●
●
●
●
●
●●
●
●
●
●
●●
●
●●
●●
●
●
●
●
●
● ●●
●
●
● ●
●
●
●
●
●
●
●●
●
●
●
●
●
●
●
●●
●●
●
●
● ●
●
●
●
●
●
●
●●
●●
●
●●
●
●
●
●
●
●
●●
● ●
●
●
●
●●
●
●
●
●●
●
●
●
●●
●
●
●
● ●
●
●
●
●
●
●
●
●
●
●
●●
●●
●
● ●● ●
●
●
●●
● ● ●
●
●
●●
●
●
●
●
●
●
●●
●●
●
●
●
●●
●
● ●
●
●
●
●●
●
●
●
●
●
●
●
●
●
●●
●
●
● ●
●
●
●
●
●
●
●●
●●
●
●
●
●
●
●
●
●
●
●
●
●
●
●
●
●●
●
●
●
●
●●
●
●
●
●
●
●
●● ●
●
●
●
●
●
●
●
●●
●●
●●
●
●
●
●
●
●
●
●
●
●
●●
●
●
●●●
●
●
●
●●●
●
●
●
●●
●
●
●
●
●
●
●
●
●
●
●
●
●
●
●
●
●
●
●
●
●
●
●
●
●●
●
●
●
●
●
●
●
●
●
●
●
●
●
●
●
●
●
●
●
●
●
●
●
●
●
●
●
●
●●
●
●
●
●
●
●●
●
●
●
●
●
●
●
●
●
●●
●
●
●
● ●
●●
●
●
● ●
●
●
●
●●
●●
●
●
●
●
●
●
●
●
●
● ●
●
●
●
●
●
●
●
●●
●●
●
●
●
●
●
●
●●
●
●
●
●
●●
●
●
●
●●
●
●
●●
●
●
●
●
●
●
●
●
●
● ●●
● ●●
●
●
●
●
●
●
●
●
●●
●
●
●
●
●
●
●
●
●
●●
●
●
● ●
●
●
●
●
●
●
●
●
●●
●
●
●●
●
●
●
●
●
●
●
●
●
●
●
●
●
●
●
●● ●
●
●
●●
●
●
●●●
●
●
●
●
●●
●
●
●
●
●
●
●●
●
●
●
●
●
●●
● ●
●
●●●
●
●
●
●
● ●
●
●
●
●
●
●
●
●
● ●
●
●
●
●
●
● ●
●
●
●
●
●
●
●
●
● ●
●●
●
●
●
●
● ●
●
●●
●
●
●●
●●
●
●
●
●
●
●
●
●
●
●
●
●●
●
●
●
●
●●
●
●
●
●
●
●●
●
●
●
●
●●
●
● ●
●
●
●
●
●
●
●
●●
●● ●●●
●●
●●
●
●
●
●●
●
●
●
●
●
● ●
●●
●
●●
●
●
●
●●
●●●
●●
●
●● ●
●
●●
●
●
●
● ●
●●
●●
●
●
●●
●
●
●
●
●
●
●
●
●
●
●
●
●
●●
●
●
●
●
●●
●
●
●
●
●
●
●
●
●
● ●
●●
●●
●
●●
●
●
●
●
●
●
● ●
● ●
●
●
●
●●
●
●
●
●
●
●
●
●●
●
●● ●
●
●
●
●
●
●●
●
●●
●
●
●
●
●
●
●
● ●●
●
●
●
●●●●
●
●●●
●
●
●
●
●
●
●
●●
●
●●
● ●
●
●
●
●
●
●
●
●
●
●
●
●
●●
●●
●
●
●
●
●
●●●
●●●
●
●●
●
●
●
●●●●●
●●
●
●
●
●
●● ●
●
●● ●
●
●
●
●●●
●●
●
●
●
●●
●
●
●
●
●
●
●
●
●●
●
●
●
●
●●
●
●
●
●
●
●
●
●
●●
●
●
●
●
●
●
●●
●
●
●
●●
●
●
●
●
●
●
●
●●
●
●
●
●
●●
●●
●●
●
●●
●
●
●
●
●
●
●
●
●●
●
●●
●
●●●●
●
●
●
●
●
●
●
●
●
●
●
●
●
●
●●●●
●
●
●●
●
●
●
●
●
●
●
●
●
●
●
●●
●
●
●●
●
●
●
●
●
●
●
●
●●
●
●●
●
●
●●
●
●
●
●
●
●●●
●
●●
●
●
●
●●
●
●
●
●●
●
●●
●
●
●
●
●
●
●
● ●
●
●
●
●
●
●
● ●
●
●
●●
●
●
●
●●
●
●
●●
●
●●
●●
●
●
●
●
●
●
● ●●
●
●
●
●
●●
●
●
●
●
●
●●
●
● ●
●
●
●
●●●
●●
●●
●
●
●
●
●
●
●
●
●
●
●
●
●●
●●
●
●
●
●
●
●●
●
●
●
●
●●
●
●
●
●
●
●●
●
●
●●
●
●
●
●●
●
●
●
●
● ●
●
●
●●
●
●●
●
●
●
●
●
●
●
●
●
●
●
●
●
●
●
●
●
●
●
●
●
●
●
●●
●
●
●
●
●●
●
●
●
●
●
●●
●
●
●●
●
●
●
●
●
●●
●
●
●
●
●
●
●
●
●●
●
●
●
●
●
●●
●
●
●
●
●
●●
●
●●●
●
●
●
●
●
●●
●
●
●
●●●
●
●
●
●●
●
●
●
●
●● ●
●
●
●
●
●
●
●
●●
●
●
●
●
●
●
●
●
●
●●
●●
●
●
●
●●
●●
●
●
●●
●
●
●
●
●
●●
●
●
●
●
●
●
●
●
●●
●
●
●
●
●
●
●
●
●●
●
●
●
●
●
●
●
●●
●
●
●
●●
●
●●
●
●
●●
●
●●
●●
●
●●●
●
●
●●●
●● ●
●●
●●
●●
●
●
●
●
●
●
●
●
●
●●
●
●●
●
●
●
●
●
●
●
●
●
●●
●
●
●
●
●
●
●●
●
●●● ●
●●
●
●
●
●
●
●●
●
●
●
●
●●
●
●●
●
●
●
●
●●
●
●
●
●
●
●
●
●
●
●
●●
●
●●
●
●
●●
●
●
●
●
●
●
●
●●
●
●
●
●
●
●
●
●
●
●●
●
●
●
●
●
●
●
●
●
●
●
●
●
●
●
●
●
●
●●
●●
●
●●
●●
●
●
●
●
●
●
●
●●
●
●
●
●
●
●
●
●
● ●●
●
●
●●●
●
●●
●
●
●
●
●
●
●
●●
●
●
●
●
●●
●●
●
●
●
●
●
●
●
●
●
●●
●
●
●
●
●
●●●
●●
●
●
●
●●
●
●●
●
●
●
●
●
●
●●
●
●
●
●
●●
●
●
●
●
●
●
●
●
●
●
●
●●
●
●
●
●
●
●
●
●●
●
●
●
●● ●●
●
●
●
●
●
●
●
●
●
●
●
●
●
●
●
●
●
●
●
●
●
●
●
●
●
●●
●
●
●●
●
●
●
●
●
●
●
●
●
●
●
●
●
●
●
●
●
●●
●●
●
●
●
●
●
●●
●●
●
●
●●
●
●
●●
●
●●
●●
●
● ●●
●●●●
●
●
●
●
●
●●
●
●
●
●
●
●
●
●
●
●
●
●
●
●
●
●
●
●
●●●
●
●
●
●
●
●
●
●
● ●●
●
●●
●●●
●
●
●
●●
●
●
●
●
●
●
●
●
●
●
●●
●●
●
●
●
●
●
●
●
●
●
●
●●●●
●
●●
●
●
●
●
●
●
●●
●
●●
●
●
●●
●
●
●
●
●●
●
●
●
● ●
●
●●
●
●●●
● ●
●
●
●
●
●
●●
●
●
●
●●
●●
●
●
●
●
●
●
●
●
●
●
●
●
●●●
●
●
●
●
●
●●
●●
●
●
●●
●
●
●
●
●
●
●
●●●
●
●
●
●
●
● ●
●●●
●●
●
●
●
●
●
●
●
●
●
●
●
●
●
●
●
●
●
●
●●
●
●
●●
●
●
●
●●
●
●
●
●
●
●
●
●
●
●
●
●●
●●
●
●
●
●●
●
●
●
●
●●
●●●
●
●
●
●
●
●●
●
●
●
●
●
●
●
●
● ●
●
●
●
●
●
●
●
●
●●● ●●●
●
●●
●● ●
●●
●
●
●
●
●
●
●
●
●●●
●●
●
●
●●
●
●
●
●
●
●
●●●
●
●
●
●●
●●
●
●●
●
●
●
●
●
●●
●
●
●
●
●
●●
●●
●
●
●
●●
●●
●
●
●
●
●●
●
● ●
●
●
●
●
●
●
●
●●
●
●
●●●
●
●●
●
●
●
●
●
●
●
●
●
●
●
●
●
●
●●
●●
●
●●
●
●
●●
●
●●
●
●
●
●
●
●
●
●
●
●
●
●
●
●
●
●
●
●
●
●
●
●
●
●●
●
●
●
●
●
●
●
●
●
●●
●
●
●
●
●●
●
●
●● ●●
●●
●
●
●
●
●
●
●
●
●
●
●
●
●●
●●●
●●
●
●
●
●●
●
●
●
●
●
●
●
●
●
●●
●
●
●
●
●
●
●
●
●
●
●
●
●
●
●
●
●
●●
●
●
●●
●
●
●
●
●
●
●
●
●
●
●
●
●
●
●
●
●
●
●
●
●
●
●
●
●
●
●●
●● ●●
●
●
●
●●
●
●
●
●
●
●
●●
●
●
●
●
●
●
●
●
●
●
● ●●
●
●●
●
●
●●
●
●
●
●●●
●●
●●
●
●
●●
●●●
●
●
●
●
●●
●
●
●
●
●
●
●
●●●
●
●
●
●
●
●
●
●
●●
●
●
●
●●
●
●
●●
●
●●●●
●
●
●
●
●●
●●
●
●
●
●
● ●
●
●
●
●
●
●
●
●
●
●
●
●
●
●
●
●
●
●
●
●
●
●
●●
●
●
●●
●●●
●
●
●
●
●
●
●●
●
●
●
●●
●
●
●
●
●
●
●
●
●
●
●
●
●●
●
●●
●
●
●●
● ●●
●
●
●●
●
●
●●
●
●
●
●
●
●
●
●
●
●
●
●
●
●●
●
●●
●●
●●
●
●● ● ● ●●
●
●●
●
●
●
●
●
●
●
●●
●
●
●
●●
●●
●
●
●
●●
●
●
●●
●●●
●
●
●
●
●
●
●
●
●
●
●
●
●
●●●●
●●
●
●
●
●
●●
●
●
●●
●●
●
●
●
●
●
●
●
●
●
●
● ●●●
●
●●
●
●
●
●
●●
●
●●
●
●
●
●
●
●
●
●
●
●
●
●
●
●
●
●
●
●●
●
●
●
●
●●
●
●
●
●
●
●
●
●
●●
●
●●
●
●
●
●
●
●●
● ●●●
●
●
●
●
●
●●
●
●
●
●
●
●
●
●
●
●
●
●
●
●
●
●
●
●
●
●
●
●
●
●
●
●
●
●●
●
●●
●
●
●●
●
●
●
●
●
●
●
●
●
●
●
●
●
●
●
●●
●
●
●●
●
●
●
●● ●
●
●
●
●
●●
●
●●
●
●
●
●
●
●●●●
●
●
●
●
●
●●●
●●
●
●●
●
●
●
●
●
●
●
●
●
●
●●
●
●
●●
●
●
●
●●
●
●
●
●●
● ●
●
●
●●●
●
●●
●
●●
●
●
●
●
●
●
●
●
●
●
●●
●
●
●
●
●
●
●
●
●
●
●
●
●
●
●
●
●●
●
●
●
●
●
●
●●
●
●
●
●
●
●
●
●
●●
●
●
●
●●
●
●
●
●
●
●
●
●
●
●
●
●●●
●
●
●
● ●
●
●●● ●
●
●
●
●
●●
●
●
●
●
●
●
●
●
●
●
●
●
●● ●
●
●
●
●
●
●●●
●
●
●
●
●●●
●
●
●
●
●
● ●
●
●
●
●
●
●
●
● ●
●
●
●
●
●
●
●
●
●●
●●
●
● ● ●
●
●
●
●
●
●
●
●
●
●
●
●
●
●
●●
●
●
●
●
●
●●
●
●●
● ●
●
●
●
●● ●
●
●
●●
●
●
●
●
●●
●
●
●
●
●
●
●
●
●
●
●
●
●●●
●
●
●
●
●
●
●
●
● ●
●
●
●
●
●
●●
●
●
●
●
●
●
●
●
●●
●●●
●
●
●
●
●
●
●
●
●
●●
●
●
●●
●
●
●
●●●●
●
●
●
●
●
●
●
●
●
●
●
●
●
●
●
●
●
●●●
●●
●
●
●
●
●
●
●
●
●
● ●
● ●●
●
●
●
●●
●
●
●
●
●
●●
●
●
●
●
●●
●
●
●
●
●
●
●
●
●
●
●
●
●
●
●
●
●
●
●
●
●
●
●
●
●
●
●
●
●
●
●
●
●
●
●●
●●●
●
●●
●
●
●
●
●●
●
●
●
●
●
●
●
●
●●
●●
●●
●
●●
●
●
●●
●
●
●
●
●
●
●
●
●
●
●
●●
●
●
●●
●
●
●
●
●
●●
●
●●
●
●
●
●●●●
●
●
●
●
●
●
●
●
●
●●
●
●
●●
●
●●
●●●
●
●
●
●
●
●
●
●
●
●
●
●
●
●
●
●
●
●●
●
●
●
●
●
●
●
●
●
●
●
●
●
●
●
●
●
●
●●
●
●●
●
●●
●
●
●
●
●
● ●
●
●
●●
●
●
●
●
●
●●
●
●
●
●
●
●●
●
●
●
●●
●
●
●
●
●●
●
●
●
●
●
●
●
●
●
●
●●
●
●
●
●●
●
●
●●
●
●
●
●
●
●
●●
●●●●
●
●
●
●
●
●
●●
●●
●
●●
●
●
●
●
●
●
●●
● ●●
●
●
●
●
●
●
●
●
●●
●
●
●
●
●
●●
●
●
●
●●
●
● ●
●
●
●
●
●
●
●
●
●
●
●
●●
●
●
●
●
●
●
●
●
●
●
●
●
●
●
●
●
●
●
●
● ●
●
●
●
●
●●
●
●
●
●
●
● ● ●●●
●
●
●●
●
●● ●
●
●
●●
●
●
●
●●
●
●●
●●●
●
●
●
●
●
●
●
●
●
●
●
●●
●
●
●
●●
●
●
●
●
●●
●
●
● ●
●
●●
●
●
●
●
●
●
●
●
●●●
●
●
●
●
●
●
●
●
●
●
●
●●●
●
●
●
●●
●
●
●
●
●
●
●
●
●
●
●
●
●
●●
●
●
●●●
●
●
●
●
●
●
●
●●
●
●
●
●
●
●
●
●
●
●●
●
●
●
●
●●●
●●
●
●
●● ●
●
●●●
●
●
●●
●
●
●●
●
●
●
●
●
●
●
●
●●
●●
●
●
●
●
●
●
●
●
●
●
●
●
●
●
●
●
●
●●
●
●
●●
●
●
●
●
●
●
●●●
●
●
●
●
●
●
●●
●
●
●
●●
●
●●
●
●●
●
●
● ●
●●
●
●
● ●
●
●
●
●
●
●
●
●
●
●
●
●
●
●
●●
●●
●
●
●
●
●
●
●
●
●
●
●
●
●
●
●
●
●
●
●●
●
●
●
●
●
●●
●
●
●
●
● ●
●
●
●
●
●
●
●●
●
●●
●
●
●
●
●
●●
●
●
●
●
●
●
●
●●
●
●
●
●
●
●
●
●●
●
●
●
●●
●
●
●
●
●
●
● ●
●●
●
●
●●
●●
● ●
●
●
●
● ●
●
●
●
●
●
●
●
●
●
● ●
●
●
●
●●
●
●
●
●●
●
●
●
●
●●●
● ●
●
●
●
●
●●
●
● ●
●
●
●
●
●
●
●
●
●●
●
●●
●●●
●
●
●
●
●
●
●
●
●●
●●
●
●
●
●●
●
●
●
● ●●
●●
●
●
●
●
●●
●
●
●●●
●
●
●
●
●
●
●
●
●●
●
●
●●
●
● ●
●
●
●
●
●
●
●
●
●
●
●
●
●
●
●
●
●
●
●
●
●
●●
●
●●
●
●
●●
●
●
●●
●●
●●
●
●●
●●
●
●
●
●
●
●
●
●
●
●●
●●
●
●
●
●
●
●
●●
●● ●
●●
●
●
●●
●
●●
●
●
●
●●
●●
●●
●
●
●
●
●
●
●
●
●
●
●
●
●
●
●
●
●
●●
●
●
●
●
●
●
●
●
●
●
●
●
●
●●
● ●
●●
●●
●
●●
●
●
●
●
●
●●
●●
●
●●
●●
●
●
●
●
●
●
●
●●
●
●
● ●
●●
●
●
●
●
●
●
●●
●
●
●
●
●
●
●
●●
●
●
●
●
●●
●●
●
●●
●●
●
●
●
●
●
●●
●
●
●● ●
●
●
●
●
●
●
●
●
●
●
●
●
●
●
● ●
●
●
●
●
●
●●
●
●
●●
●
● ●
●
●
●●●
●●●●
●
●
●
●
●●
●
●
●● ●
●●
●
● ●●
●●
●
●
●
●●
●
●
●
●
●
●
●
●
●
●
●
●
●
●
●
●
●
●
●
●
●
●
●
●
●●
●
●
●
●
●
●
●
●
●
●
●
●●
●
●
●
●
●
●
●
●●
●
●
●
●
●●
●
●
●●
●
●●
●
●
●
●
●●
●
●●
●
●●
●
●
● ●●
●
●
●
●
●
●
●
●
●
●
●
●
●
●
●●●
●
●
●
●●
●
●
●
●
●
●
●
●
●
●
●
●●
●
●
●●
●
●
●
●
●
●
●
●
●●
●
●●
●
●
●●
●●
●
●
●●●
●
●●
●
●
●
●
●
●
●
●
●
●
●
●●
●
●
●
●
●
●
●
●●
●
●
●
●
●
●
●●
●
●
●
●
●
●
●
●●
●
●
●●
●
●●
●●
●
●
●
●
●
●●
●
●
●
●
●
●
●●
●
●●
●
● ●
●
●
●
●●●
●●
●
●
●
●
●
●
●
●
●
●
●
●
●
●
●●
●
●
●
●
●
●
●●
●●
●
●
●
●
●●
●
●
●
●
●●
●
●
●
●
●
●
●
● ●
●
●
●
●
●●
●
●
●●
●
●●
●
●
●
●
●
●
●
●
●
●
●
●
●
●
●
●
●
●
●
●
●
●
●
●●
●
●
●
●
●●
●
●●
●
●●
●
●●
●
●
●
●
●
●
●●
●●
●
●
●
●
●
●
●
●
●
●
●
●
●
●●
●
●
●
●
●
● ●
●
●●
●●
●
●
●
●
●
●
●
●
●
●
●●
●
●
●
●●
●
●
●
● ● ●
●
●
●
●
●
●
●●
●
●
●
●
●
●
●
●
●●
●●
●
●
●
●
●
●
●
●
●●
●
●
●
●
●
●
●
●
●
●
●
●
●
●●●
●
●
●
●
●
●
●
●
●●
●
●
●
●
●
●
●
●
●
●
●
●
●●
●
●●
●
●
●●
●
●●
●●
●
●●●
●●●●
●
● ●●
●●
●
●●●
●
●
●
●
●
●
●
●
●
●
●
●●
●
●
●
●
●
●
●
●
●
●●
●
●
●
●
●
●
●
●
●●● ●
●●
●
●
●
●
●
●●
●
●
●
●
●
●
●
●
●
●
●
●
●
●●
●
●
●
●
●
●
●
●
●
●
●●
●
●●
●
●
●●
●
●
●
●
●
●
●
●●
●
●
●
●
●
●
●
●
●
●●
●
●●
●
●
●
●
●
●
●
●
●
●
●
●
●
●
●
●
●●
●
●●
●●
●
●
●
●
●
●
●
●●
●
●
●
●
●
●
●
●
●
●●
●
●
●
●●
●
●
●
●
●
●
●
●
●
●
●●
●
●
●
●
●
●
●
●
●
●
●
●
●
●
●
●
●
●
●
●
●
●
●
●
●●
●
●●
●●
●
●●
●
●●
●
●
●
●
●
●
●●
●
●
●
●
●
●
●
●
●
●
●
●
●
●
●
●
●
●●
●●
●
●
●
●
●
●
●
●
●
●
●● ●
● ●
●
●
●
●
●
●
●
●
●●
●
●
●
●
●
●
●
●
●
●
●
●
●
●
●●
●
●
●●
●
●
●
●
●
●
●
●
●
●
●
●
●
●
●●
●●
●
●
●
●
●
●●
●●
●
●● ●
●
●
●●
●●
●
●●
●
●●●●
●
●
●
●
●
●●
●
●
●
●
●
●
●
●
●
●
●
●
●
●
●
●
●
●
●●●
●
●
●
●
●
●
●
●
● ●●
●
●●
●
●●
●
●
●
●●
●
●
●
●
●
●
●
●
●
●
●●
●●
●
●
●
●
●
●
●●
●
●
●●● ●
●
●●
●
●
●
●
●
●
●●
●
●●
●
●
●
●
●
●
●
●
● ●
●
●
●
● ●
●
●●
●
●●●
● ●●
●
●
●
●
●
●
●
●
●
● ●●●
●
●
●●
●●
●
●
●
●
●
●
●●●
●
●
●
●
●
●●
●●
●
●
●
●●
●
●
●
●
●
●
●●●
●
●
●
●
●
●●
●●●
●●
●
●
●
●
●
●
●
●
●
●
●
●
●
●
●
●
●
●
●
●
●
●
● ●
●
●
●
●●
●
●
●
●
●
●●
●
●
●
●
●●
●
●●
●
●
●●
●
●
●
●
●●
●●●
●
●
●
●
●
●
●
●
●
●
●
●
●
●
●●
●
●
●
●
●
●
●
●
●●
●●●●
●
●●
●●●
●
●
●
●
●
●
●
●
●
●
●●
●
●●
●
●
●●
●
●
●
●
●
●
●●
●
●
●
●
●
●
●●
●
●●
●
●
●
●
●
●
●
●
●
●
●
●
●●
●●
●
●
●
●●
●●
●
●
●
●
●●
●
●
●
●
●
●
●
●
●
●
●●
●
●
●●
●
●
●●
●●
●
●
●
●
●
●
●
●
●
●
●
●●
●●
●
●
●
●
●
●●
●
●
●
●
●
●
●
●
●
●
●
●
●
●
●
●
●
●
●
●
●
●
●
●
●●
●
●
●
●
●
●
●
●
●
●
●
●
●
●
●
●●
●
●
●
● ●●
●●
●
●
●
●
●
●
●
●
●
●
●
●
●
●
●●●
● ●
●
●
●
●●
●
●
●
●
●
●
●
●
●
●●
●
●
●
●
●
●
●
●
●
●
●
●
●
●
●
●
●●
●
●
●
●
●
●
●
●
●
●
●
●
●
●
●
●
●
●
●
●
●
●
●
●
●
●
●
●
●
●●
●●
●●
●
●
●
●●
●
●
●
●
●
●
●●
●
●
●
●
●
●
●
●
●
●
●●
●
●
●
●
●
●
●
●
●
●
●
●●●
●●
●●
●
●
●●
●
●●●
●
●
●
●
●
●
●
●
●
●
●
●
●●●
●
●
●
●
●
●
●
●
●●
●
●
●
●
●
●
●
●
●
●
●●●
●
●
●
●
●
●●
●●
●●
●
●●
●
●
●
●
●
●
●
●
●
●
●
●
●
●
●●
●
●
●
●
●
●
●
●
●
●
●
●●
●●
●
●
●
●
●
●
●●
●●
●
●●
●
●
●
●
●
●
●
●
●
●
●●
●●
●
●●
●
●
●●
●●●
●
●●
●
●
●●
●
●
●
●
●
●
●
●
●
●
●
●
●●
●
●
●
●
●
●●
●
●●
●● ●●
●
●●
●
●
●
●
●
●
●
●
●
●
●
●
●●
●
●
●
●
●●
●
●
●
●●
●●
●
●
●●
●
●
●
●
●
●
●
●
●
●●●
●●
●
●
●
●
●●
●
●
●●
●●
●
●
●
●
●
●
●
●
●
●
● ●● ●
●
●●
●
●
●
●
●●
●
●●
●
●
●
●
●
●
●
●
●
●
●
●
●
●
●
●●
●
●●
●
●
●
●
●
●
●
●
●
●
●
●
●● ●
●●
●
●
●
●
●
●
●
● ●●
●
●
●
●
●
●
●●
●
●
●
●
●
●
●
●
●
●
●
●
●
●
●
●
●
●
●
●
●
●
●
●
●
●
●
●●
●
●●
●
●
●●
● ●
●
●
●
●
●
●
●
●
●
●
●
●
●
●
●
●
●
●●
●
●
●
●
●●
●
●
●
●●
●
●●
●
●
●
●
●●●
●
●
●
●
●
●
●●
● ●
●
●●
●
●
●
●
●
●
●
●
●
●
●●
●
●
●●
●
●
●
●
●
●
●
●
●●
● ●
●
●
●●
●
●
●
●
●
●●
●
●
●
●
●
●
●
●
●
●
●
●
●
●
●
●
●●
●
●
●
●
●
●
●
●
●
●
●●
●
●
●
●
●
●
●
●
●
●
●
●
●
●
●
●
●●
●
●
●
●●
●
●
●
●
●
●
●
●
●
●●
●●●
●
●
●
● ●
●
●● ●●
●
●
●
●
●●
●
●
●
●
●
●
●
●
●●
●
●
●●●
●
●
●
●
●●
●
●
●
●
●
●●
●
●
●
●
●
●
● ●
●
●
●
●
●
●
●
●●
●
●
●
●
●
●
●
●
●●
● ●
●
●●
●
●
●
●
●
●
●
●
●
●
●
●
●
●
●
●
●
●
●
●
●
●●
●
●●
● ●
●
●
●
●● ●
●
●
●●
●
●
●
●
●●
●
●
●●
●
●
●
●
●
●
●
●
●
●●
●
●
●
●
●
●
●
●●
●
●
●
●
●
●
●
●
●
●
●
●
●
●
●
●●
●●
●●
●
●
●
●
●
●
●
●
●●
●
●
●●
●
●
●
●●●
●●
●
●
●
●
●
●
●
●
●
●
●
●
●
●
●
●●●
●●
●
●
●
●
●
●
●
●
●
●●
●●
●●
●
●
●●
●
●
●
●
●
●●
●
●
●
●
● ●
●
●
●
●
●
●
●
●
●
●
●
●
●
●
●
●
●
●
●
●
●
●
●
●
●
●
●
●
●
●
●
●
●
●
●
●
●●●
●
●●
●
●
●
●
●●
●
●●
●●
●
●
●●
●●
●●
●
●● ●
●
●
●
●
●
●
●
●
●
●●
●
●
●
●●
●
●
●●
●
●
●
●
●
●●
●
●●
●
●
●
●●
●●
●
●
●
●
●
●
●
●
●
●●
●
●
●●
●
●●
●●●
●
●
●
●
●
●
●
●
●
●
●
●
●
●
●
●●
●
●●
●
●
●
●
●
●
●
●
●
●
●
●
●
●
●
●●
●
●●
●
●●
●
●
●
●
●
● ●
●
●
●●
●
●
●
●
●
●
●
●
●
●
●
●
●●
●
●●
●●
●
●
●
●
●●
●
●
●
●
●
●
●
●
●●●
●
●
●●
●
●
●
●
●
●
●
●
●
●
●
●●●●
●
●
●
●
●
●
●●
● ●
●
●●
●
●
●
●
●
●
●●
● ●●
●
●
●
●
●
●
●
●
●●
●
●
●
●
●
●●
●
●
●
●●
●●
●
●
●
●
●
●
●
●
●
●
●
●●
●
●
●
●
●
●
●
●
●●
●
●
●
●
●
●
●
●
●
● ●
●
●
●
●
●
●●
●
●
●
●
●●
●●
●
●
●
● ●
●
●
●●
●●
●●
●
●
●
●●
●
●●
●●
●
●
●
●
●●
●
●
●
●
●
●
●
●
●
●
●
●●
●
●
●
●
●●
●
●
● ●
●
●●
●
●
●
●
●●
●
●
●●
●
●
●
●
●
●
●
●
●
●
●
●
●●
●●
●
●●
●
●
●
●
●
●
●
●
●
●
●●
●
●
●
●
●
●
●●
●
●
●
●
●
●
● ●
●
●
●
●
●
●
●
●
●
●
●
●
●
●
●
●●
●
●●
●●
●●●
●
●●
●
●
●
●●
●
●
●●
●
●
●
●
●
●
●
●
●●
●●
●
●
●
●
●
●
●●
●
●
●
●
●
●
●
●
●
●
●
●●
●
●
●
●
●
●
●●
●
●
●
●
●
●
●
●
●
●
●
●
●●
●
●●
●
●
●
●
●●
● ●
●
●
● ●
●
●
●
●
●
●
●
●
●
●
●
●
●
●
●● ●
●
●
●
●
●
●
●
●
●
●
●
●
●
●
●
●
●
●
●
●●
●
●
●
●
●
● ●●
●
●
●
● ●
●
●
●
●
●
●
●●
●
●●
●
●
●
●
●
●●
●
●
●
●
●
●
●
●●
●
●
●
●
●
●
●
●●
●
●
●
●●
●
●●
●
●
●
●●
●●
●
●
●●●
●
● ●
●
●
●
● ●
●
●
●
●
●
●●
●
●
● ●
●
●
●
●
●
●
●
●
●●
●
●
●
●
●●●
● ●
●
●
●
●
● ●
●
● ●
●
●
●
●
●
●
●
●
●
●
●
●●
●●
●
●
●
●
●
●
●
●
●
●●
●●
●
●
●
●●
●●
●
● ●
●
●●
● ●
●
●
●●
●●
●●●
●
●
●
●
●
●
●
●
●●
●
●
●●
●
●
●
●
0
50
100
150
200
250
0.00 0.25 0.50 0.75 1.00
Rank within Type
Inco
me
(tho
usan
ds o
f Eur
os)
Income●●●
●●●
●●●
Ad_Hoc_Fit
Original
Regression_Fit
Income and 'Effort' Sample age 60 and over ; 30 Types;
Smoothed fit NW Non−Parametric Regression and Ad Hoc Tranches (Bandwidth length)
Obs. < 250,000 euros
Figure 2
20

Table 5: Inequality, IE and IO in Wealth - Non Parametric Regression - Different Data Choices and Indices
Inequality IE IOTheil-0 Atkinson (1) Gini Theil-0 Atkinson (1) Gini Theil-0 Atkinson (1) Gini
6 Types 0.691 0.499 0.553 0.541 0.418 0.493 0.149 0.081 0.06012 Types 0.691 0.499 0.553 0.491 0.388 0.487 0.200 0.111 0.06630 Types 0.691 0.499 0.553 0.428 0.348 0.475 0.263 0.151 0.0786 Types >60 0.669 0.488 0.555 0.485 0.384 0.482 0.184 0.104 0.07312 Types >60 0.669 0.488 0.555 0.447 0.361 0.478 0.221 0.127 0.07830 Types > 60 0.669 0.488 0.555 0.341 0.289 0.446 0.328 0.199 0.109
Table 6: IO Share in Wealth - Non Parametric Regression - Different Data Choices and Indices
IO Ratio (%)Theil-0 Atkinson (1) Gini
6 Types 21.63 16.19 10.9312 Types 28.93 22.22 11.9730 Types 38.09 30.24 14.176 Types >60 27.55 21.26 13.1612 Types >60 33.11 26.04 13.9930 Types > 60 48.97 40.71 19.65
Table 7: Inequality, IE and IO in Income - Non Parametric Regression - Different Data Choices and Indices
Inequality IE IOTheil-0 Atkinson (1) Gini Theil-0 Atkinson (1) Gini Theil-0 Atkinson (1) Gini
6 Types 0.386 0.320 0.459 0.295 0.256 0.409 0.091 0.065 0.05012 Types 0.386 0.320 0.459 0.294 0.255 0.408 0.092 0.065 0.05030 Types 0.386 0.320 0.459 0.291 0.252 0.407 0.095 0.068 0.0526 Types >60 0.433 0.351 0.497 0.321 0.275 0.438 0.112 0.077 0.05812 Types >60 0.433 0.351 0.497 0.314 0.269 0.433 0.119 0.082 0.06430 Types > 60 0.433 0.351 0.497 0.288 0.250 0.418 0.145 0.101 0.078
Table 8: IO Share in Income - Non Parametric Regression - Different Data Choices and Indices
IO Ratio (%)Theil-0 Atkinson (1) Gini
6 Types 23.56 20.21 10.8412 Types 23.75 20.38 10.9430 Types 24.66 21.20 11.246 Types >60 25.77 21.79 11.7812 Types >60 27.53 23.37 12.8630 Types > 60 33.46 28.77 15.80
21

Table 9: Inequality, IE and IO in Wealth - Regressogram Method - Deciles - Different Data Choices andIndices
Inequality IE IOTheil-0 Atkinson (1) Gini Theil-0 Atkinson (1) Gini Theil-0 Atkinson (1) Gini
6 Types 0.691 0.499 0.553 0.477 0.379 0.487 0.214 0.120 0.06612 Types 0.691 0.499 0.553 0.458 0.367 0.482 0.233 0.131 0.07230 Types 0.691 0.499 0.553 0.420 0.343 0.473 0.271 0.156 0.0806 Types >60 0.669 0.488 0.555 0.415 0.339 0.476 0.254 0.148 0.08012 Types >60 0.669 0.488 0.555 0.412 0.338 0.473 0.256 0.150 0.08230 Types > 60 0.669 0.488 0.555 0.375 0.313 0.458 0.294 0.175 0.098
Table 10: IO Share in Wealth - Regressogram Method - Deciles - Different Data Choices and Indices
IO Ratio (%)Theil-0 Atkinson (1) Gini
6 Types 31.01 24.00 12.0212 Types 33.71 26.35 12.9530 Types 39.23 31.27 14.546 Types >60 38.00 30.39 14.3512 Types >60 38.34 30.71 14.8430 Types > 60 43.89 35.84 17.58
Table 11: Inequality, IE and IO in Income - Regressogram Method - Deciles - Different Data Choices andIndices
Inequality IE IOTheil-0 Atkinson (1) Gini Theil-0 Atkinson (1) Gini Theil-0 Atkinson (1) Gini
6 Types 0.384 0.319 0.458 0.286 0.249 0.405 0.098 0.070 0.05312 Types 0.384 0.319 0.458 0.287 0.249 0.405 0.098 0.070 0.05330 Types 0.384 0.319 0.458 0.285 0.248 0.404 0.099 0.071 0.0546 Types >60 0.432 0.351 0.496 0.315 0.270 0.434 0.117 0.081 0.06212 Types >60 0.432 0.351 0.496 0.311 0.268 0.432 0.121 0.083 0.06430 Types > 60 0.432 0.351 0.496 0.301 0.260 0.424 0.131 0.091 0.072
Table 12: IO Share in Income - Regressogram Method - Deciles - Different Data Choices and Indices
IO Ratio (%)Theil-0 Atkinson (1) Gini
6 Types 25.50 21.97 11.4812 Types 25.43 21.91 11.5130 Types 25.77 22.22 11.736 Types >60 27.17 23.05 12.5312 Types >60 27.93 23.73 13.0030 Types > 60 30.36 25.94 14.49
22

Table 13: Inequality, IE and IO in Wealth - Regressogram Method - Bandwidth Tranche - Different DataChoices and Indices
Inequality IE IOTheil-0 Atkinson (1) Gini Theil-0 Atkinson (1) Gini Theil-0 Atkinson (1) Gini
6 Types 0.691 0.499 0.553 0.557 0.427 0.498 0.134 0.072 0.05512 Types 0.691 0.499 0.553 0.514 0.402 0.494 0.177 0.097 0.05930 Types 0.691 0.499 0.553 0.439 0.355 0.480 0.252 0.144 0.0746 Types >60 0.669 0.488 0.555 0.508 0.398 0.490 0.161 0.089 0.06612 Types >60 0.669 0.488 0.555 0.479 0.381 0.486 0.189 0.107 0.06930 Types > 60 0.669 0.488 0.555 0.384 0.319 0.462 0.285 0.169 0.093
Table 14: IO Share in Wealth - Regressogram Method - Bandwidth Tranche - Different Data Choices andIndices
IO Ratio (%)Theil-0 Atkinson (1) Gini
6 Types 19.37 14.39 9.9112 Types 25.67 19.49 10.6930 Types 36.45 28.77 13.326 Types >60 24.06 18.34 11.8412 Types >60 28.33 21.91 12.5130 Types > 60 42.55 34.59 16.77
Table 15: Inequality, IE and IO in Income - Regressogram Method - Bandwidth Tranche - Different DataChoices and Indices
Inequality IE IOTheil-0 Atkinson (1) Gini Theil-0 Atkinson (1) Gini Theil-0 Atkinson (1) Gini
6 Types 0.384 0.319 0.458 0.306 0.263 0.413 0.079 0.056 0.04512 Types 0.384 0.319 0.458 0.304 0.262 0.412 0.081 0.057 0.04530 Types 0.384 0.319 0.458 0.299 0.259 0.410 0.085 0.061 0.0476 Types >60 0.432 0.351 0.496 0.335 0.285 0.446 0.097 0.066 0.05012 Types >60 0.432 0.351 0.496 0.334 0.284 0.445 0.098 0.067 0.05130 Types > 60 0.432 0.351 0.496 0.316 0.271 0.434 0.116 0.080 0.062
Table 16: IO Share in Income - Regressogram Method - Bandwidth Tranche - Different Data Choices andIndices
IO Ratio (%)Theil-0 Atkinson (1) Gini
6 Types 20.44 17.43 9.7312 Types 21.00 17.94 9.9330 Types 22.18 18.99 10.296 Types >60 22.49 18.88 10.1512 Types >60 22.62 19.00 10.3630 Types > 60 26.86 22.77 12.56
23

Figure 3: Distribution of Wealth and Income conditioned to rank within type(’effort’). Men with mid-level parental occupation. Types obtained by amount of
inheritance.
● ● ●● ●
●
●
●●●
●
●●●
●●●
●●●
● ● ● ●●
● ●●●
●
●
● ● ●● ●●
●
●●● ●●
●
●
●●● ●
●●●●●
●
●● ●
●
●
●
● ●● ●
● ●● ●●● ●
●●
● ●●●
● ● ●
●
●● ●
●
●
●
●●
●●●
● ●● ●● ●
●
●●
● ●
●
●●● ● ●● ● ●● ●●
●
●
●●
●●● ●
●
●●●●●
●
●●●● ●●
● ●●
●
●● ●●●●●●
● ●
●
●● ●●
●● ●●
●●
●
●
●
●● ●
●
● ●●
●● ● ●● ●● ●●● ● ●●●
●
● ●
●
●
●
●● ● ● ● ●
●
●●●● ●●
●●● ●
●●● ●● ●● ● ●
●
●●●●●
● ●
●
●● ●● ●
●● ● ●●●●
●●
●●●●
●
●●
●
●
●●
● ●●● ●●●● ●
●
●●
●●
●
●
●
●●●
●
●●
● ● ●●●
●● ●
●
●●● ●●●● ● ●
● ●
●
●●
●
●
●●
●●●
●●
● ●●
●
●
●
●
● ●● ● ●
●
●
●
●●●
●
●●● ●●●
●
● ●●
●
●● ●●● ● ●● ● ●●●
● ● ●● ●●
● ●
●
●
●
●
●
●
●● ● ●●
●
●● ●● ● ●
●●
●
●
●
●●●
●
●● ●●
●
●
● ●● ●●●
●
●
●
●
● ●
●
● ●●
●
●●●●
●●
●
● ● ● ●●●
●●
●●
●●●
●
●
●● ●
●●● ●●●
●
●●●● ●
●
● ●
●
●●
●●
●
●
● ●●●
●
●
● ●●●
●
●
●●
●
●
●●●●
● ●● ●
●
● ●● ●● ●●
●●●
●●●
● ●
●
●
●●
●
●
●●
●●●
●
●●
●● ●● ●
●
●●
●● ●●●
● ● ● ● ●●● ●● ●● ●
● ●● ● ● ●● ●●●
●●
●●●
●
●●
●
●●●●●●
●●●● ● ●
● ● ●● ●●
●
●●
●●● ● ●● ●●
●●
●
●●
●●
●
●
●
● ● ●
●
●
●
●●●● ● ● ●
●
●
●
●
●
● ●●●
●
●●
● ●● ●●●●
● ●●●●
●●●● ● ●● ●● ●●
● ●● ● ●●●●
●●
●
●
●
●
● ● ●●● ●
●●●
●●●
● ●●●
●
●● ●● ● ●●●
●
●●
●
● ●●
●● ●
●●●
●
● ●
●
●●●●●
●
●● ●
●
●●
●
●●
● ●
●
●● ●● ● ●● ●●
●
●
●
●●●
●
● ●●
●
●
●
●
●● ●●● ●●●● ●●
●●●●● ●
●
●●●
●●
●● ●●
●●●
●●●
●●●
●
●●
●●
●
●
●
● ●● ●
●
●
●●
●●
● ●● ●
●
●●●
●●
●
● ●●
● ●●●
●
●●
●
●
● ● ●● ● ●●
●
● ●●
●●●●● ● ●●● ●●
●
●●●●●
● ●●● ● ●● ●● ●●●●●●● ●● ●● ●●● ●● ●
●
●●
● ●
●●
●●
●
●●
●●
●●● ●●●
● ●●
●
●● ●
●● ●
●●
●
●●
●●
● ●●●
●●
●● ●●
●
●●● ●
●●
●●
●●● ●● ●
●
●●
● ● ●●●
●
●
●●●
● ●●● ●● ●●● ●●
●
●● ● ●● ●●●
●
● ●●
●●
●
●●
●
●●● ●●
● ●●
●●●
●
●
●
●● ●
●
● ●● ●
●
●●●
● ●●
●●●● ●●●●
●● ● ● ●
●
●
●
●
●
●●
●
●●
● ●● ●●
●
●●●●●● ●●
●
●
●●
●●
●● ●● ●
● ●●●
●
●
●
●
●●●
●●●
●
●
●●
●
●●●
●●●
● ● ●●
●
● ● ●
●
●●●● ●●
●●
●
●●
● ●●
●
● ●●● ● ●● ● ●● ●● ●
●
● ●●●
●● ● ●
●
●●
● ●● ● ●●● ●● ●
●
●
●●
●
●●● ● ●●● ● ● ● ●●●
●●●●● ● ●●●●●
●
● ●
●
●●●
●
●●
●●●● ● ●
●
●● ●
●● ●● ● ●● ●●●● ● ●
●●● ●● ●
●● ●
●●●●● ●● ●
● ●●
●●●
● ●●●
●●● ●●0
10
20
30
40
50
0.00 0.25 0.50 0.75 1.00
Rank within Type
Wea
lth (
mill
ions
of E
uros
)
Inheritance
●
●
●
●
●
None
Low
Mid−Low
Mid−High
High
Wealth/Effort distribution across 5 Inheritance Types Men with mid parental occupational class
Obs. < 50 million euros
● ●●
●●
●
●
●
●
●●
●
●
●
●
●
●
●
●
●
●●
●
● ●●
●
●
●
●●
●●
●
●
●
●
●
●
●
●
●
●
●
●
●
●
●
●●
●
●
●●
●
●
●
●
●●
●
●
●●
●
●
●
●
●
●●
●
●
●
●
●
●
●
●
●
●
●
●
●
●
●●
●
●
●
●
●●
●
●
●
●
●
●
●
●
●
●
●
●
● ●
●
●
●●
●
●
●
●
●●
●
●
●
●
●
●
●
●
●
●
●
●
● ●●
●
●
●●
●
●
●
●
●
●
●
●●
●
●
●
●
●
●●
●
●
●
●
●●●
●
●
●
●
●
●
●
●
●
●
●
●
●●
●
●
●
●
●
●
●
●
●●
●
●
●●
●
●
●
●
●
●
●
●
●
●
●
●
●
●
●
●
●
●
●●
●
●
●●●
●●
●●
●
●● ●
●
●
●
●●
●
●
●
●
●●
●
●●
●●
●
●
●
●
●
●
●
●
● ●
●●
●
● ●
●
●●
●
●
●
●●●
●
●
●
●
●
●
●
●
●
● ●
●
●●
●
●●
●
●
●
●●●●
●
●
●
●
●
●
●
●
●
●●
●
●
●
●
●●●
●
●
●
●
●●
●
●
●
●
●
●●
●
●
●●●
●
●●
●●
●●
●
● ●●
●
●
●●
●
●
●
●
●●
●
●
●
●
●
●
●●
●
●
●
●
●
●
●●
●
●
●
●
●
●
●
●●
●
●
●
●
●
●
●
●
●
●
●
●
●
●
●
●
●
●●
●
●
●
●
●
●
●●
●
●
●
●
●●
●●
●
●
●
●
●
●
●
●
●
●
●
●
● ●
●
●●
●●
●
●
●
●●
●
●
●
●
●
●
●
●
●
●
●
●
●
●
●
●
●
●
●
●
●
●
●
●
●
●
●
●
●
●
●
●
●●
●
●
●
●
●
●
●
●
●
●
●●
●
●
●●
●
●
●
●
●
●
●
●●
●●
●
●
●
●
●
●
●
●
●
●
●
●
●
●
●
●
● ●
● ●
●●●
●
●
●
●
●
●
●
●
●
●
●
●
●
●
●
●
●
●
●
●
●
●
●
●
●
●
●●
●
●●
●
●
●
●
●●
●
●
●
●
●
●
●
●●●
●
●
●
●●
●
●
●
●
●
●
●
●
●
●● ●
●
●
●
●●●
●
●
●
●
●
●
●
●
●
●
●
●
●
●
●
●●
●
●●
●
●●
●
●
●
●
●
● ●●
●●
●
●
●
●
●●
●●
●●
●
●
●
●
●
●
●
●
●
●●
●
●
●
●
●
●
●●
●●
●
●
●
●
●
●
●
●
●●
●
●●
●
●
●
●
●
●●
●●
●
●
●●
●●●
●●
●
●●●
●●
●
●
●
●●
●
●
●
● ●
●
●
●
●
●
●
●
●
●
●
●
●
●
●
●
●
●
●
●
●●●
● ●
●
●
●●
●
●
●
●
●●
●
●
●
●●
●
●
●●●
●
●
●
●
●●
●
●
●
●
●
●
●●
●
●
●
● ●
●●
●●
●
●
●
●
●
●
●
●
●
●
●
●
●
●
●
●
●
●
●
●
●
●
●
●
●
●
●
●
●
●
●
●
●
●●
●
●
●●
●
●
●
●
●
●●
●
●●
●
●
●
●
●
●
●●
●
●
●●
●
●
●
●
●
●●●
●
●
●
●●
●●
● ●
●
●●
●
●
●
●
●
●
●
●
●
●
●
●●●
●
●
●
●
●
●●
●
●
●● ●
●
●
●
●
●
●
●
●
●●
●
●
●
●
● ●
●
●
●
●
●
●
●
●
●
●
●
● ●●
●
●
●
● ●
●
●
●
●
●
●
●●
● ●
●
●
●
●
●
●●
●
●
●
●
● ●
●●
●
●●
●
●
●
●
●
●
●●
●
●●
●
●
●
●
●
●
●
●
●
●
●
●
●
●
●
●●
●
●
●
●
●
●
●●
●
●
●
●●
●
●
●
●
●●
● ●●
●
●
●
●
●
●
●
●
●
●
●
●
●
● ●
●●
●
●● ●●
●
●
●●
●●
●
●
●
●
●
●
●
●
●
●
●
●
●●
●
●
●●
●
●●
●
●
●
●
●
●
●
●
●
●
●
● ●
●
●
●
●●●
●
●
●
●
●
●
●
●●
●
●
●
●●
●
●
●●
●
●
●●
●
●
●
●
●
●●
●
●
●
●
●
●
●
●
●
●
●
●
●
● ●
●
●
●
●
●
●●
●
●
●●
●● ●
●●
●
●
●
●
●●●
●●
●
●
●
●
●
●
●
●
●●
●
●
●
●
●
●
●
●
●
●
●
●
●
●
●●
●●
●
●
●
●●●
●
●
●
●
●
●
●
● ●
●●
●
●
●●
●
●
●●
●
●
●
●
●
●
●
●
●
●
●
●●
●●●
0
1
2
3
4
5
0.00 0.25 0.50 0.75 1.00
Rank within Type
Wea
lth (
mill
ions
of E
uros
)
Inheritance
●
●
●
●
●
None
Low
Mid−Low
Mid−High
High
Wealth/Effort distribution across 6 Types Men with mid parental occupational class
Obs. < 5 million euros
●● ●●●
●●●
● ●
●
● ●●
●● ● ●●●● ●
●●●
●●● ●●
●
● ●●●●●
● ● ●●
●●
●
●
●● ●● ●
●●
●
●●
●● ●
●
●
●
●●
● ●
●●●
● ●●●●● ●
●
●
●●●
●●
●●●
●
●●
● ●●
●
●
● ●● ● ● ●
●
●
●
●
● ●●●
● ●●
●
● ●●● ●●●
●
●
●●● ●●
●
●
●●
●●
●
●●
●●●●
● ●●
●
●●● ●
●
●●
●
●●● ●
●
●●
●● ● ●●
●
●
●
●●●
●
●
● ●●●
●
●
●●●
● ●● ● ● ● ●
●
●
●
●●
●
●
●
●●●● ●
●
●
●● ●●● ●
●●●●● ●●●● ●●● ●
●●● ●
●●●
●●●
●●●●
●●
●●●●
●●●
●●
●
●
●
●●
●
●●
●
●●●
● ●●
● ●●
●
●
●
●●●●
●
●● ●
●
●●●●
● ●●
●
●●
●
●●● ●● ●● ●●
●●
●
●● ●●
●●●
●● ● ●● ● ●
●
●
● ●
● ●
●●
●●
●
●
●●● ● ●
●● ● ●●●●
●●
●●●
● ●●●
●●●●
●● ●●● ●●●
●
●
●
●
●
●
●
●
●●● ●
●●●●●
●●
●●
●
●●
●
●● ●●
●●
●●
●
●
●
●
●●●
●●
●
●
●●●
●
● ●●
●
●
●●● ●●
●
● ●●● ●● ● ●●
●
● ●●
●
●●●●
●●●
●● ●
●
●
●●● ● ●
●●●
●●
●
●●
●
●
●
●●●● ●
●● ●●
●
●●
●
●
●●●● ● ●
● ●●
●
●
●●
●●
●●
●●
●●●
● ●
●●
●●
●
●
● ●
●
●●
●
●
● ●
●● ●●
●● ●●●●●
●
● ● ●●●● ● ●●
●●●
● ●●●
●●
● ● ●●
●●●● ●
●
●●
●
●●
● ●●
●● ●●
●
● ●●●●●
●●
●
● ● ●●●
●●● ●
●●●
●
● ●● ●
● ●●
●●
●
●
●
●
● ● ●●● ●
●●
●
●
●●
●●
● ●●
●
●
●●
● ●● ●●● ● ●●
●●●●
● ● ●● ●● ● ●●●●●
●
● ●
●
●●
●
●
●
●
●● ●
●
●
●●
●
●
●●●
● ●● ●
●
●●●
● ●●●●
●
●● ●●●
●●
●
● ●●●
●
● ● ●● ●● ●●
●● ●● ●
●● ● ●
● ●
●
● ● ●●●
●● ● ● ● ●
●●
●
●
●● ●● ●
●
●●
●●●●●
●●● ●●●
●● ●●●●
●
●●● ●●
●●●●
●
●
●
●●
●
● ●
●
●
●● ●●● ●
●
● ●●
●●
●
●●
●●
●
●●●
●
●●●●●
●
●
●●●
●●●
●
● ●● ●●
● ●
● ●●●
●●
●●● ●
●● ●●● ●● ● ●●
●
●
●● ●
●●● ●
●●●
● ●● ● ●
● ●●● ● ●●
●
● ● ●● ●●●
●●●●
●
●
●●
●
●●
● ●●
●● ●●●
●
● ● ●
●
●● ●●● ●
●
●●
● ●
●
● ● ●
●
●●●
●
●●●
●●
●●● ●
●●●●
●
●
● ●●●
●
●●
●● ●●●
●
● ● ●
●●
●
●
●● ●●●
●●●
●
●● ●● ● ●
● ●●
● ● ●●●
●
● ●●● ●● ● ●
●●
●●
● ●●
●
●
●● ●●●●
●
●
●●● ● ●●●
●●
●●●●
● ●●●●
● ●
●●
●●
●
● ●
●
●●●● ● ●
●
●
● ●●
●●
●●
●● ●
●●
●●
● ●● ●●
●●
●●
●
●
●
●
●●● ●
●● ●
●
●●
● ● ●● ●● ●● ● ●
●
●
●●
●
●
●● ●●
●
●
●
●●●
●● ●●
●
●●●●
●●●
●
●
● ● ●●
●
● ●●
●● ● ●●
●●
●● ●●
●●●
● ●
●●
●
●
●
●
●●● ●● ● ●● ●
●● ●
● ●●●●
● ● ●●
● ● ●● ●● ●
●
● ●●
●
● ●
●
●● ●● ●
●
● ● ●●
●● ●●
●
● ●●
● ●●●
●●
● ●
●
●●● ●
●
●●
●
●
●● ●
●●
●
●●
●
● ●●
●
●●●● ●0
0.5
1
1.5
2
0.00 0.25 0.50 0.75 1.00
Rank within Type
Inco
me
(tho
usan
ds o
f Eur
os)
Inheritance
●
●
●
●
●
None
Low
Mid−Low
Mid−High
High
Income/Effort distribution across 5 Inheritance Types Men with mid parental occupational class
(Obs. < 2 million euros)
●●
●
●
●
●
●●
●
●
●
●
●
●
●●
●●
●
●
●
●●
●
●
●
●
●●
●
●●●
●
●●
●
●
●
●
●
●
●
●
●
●
●
●
●
●●
●
●
●
●
●
●
●●
●
●
●●
●●
●
●
●
●
●●
●
●
●
●
●
●
●
●
●
●●
●
●
●
●
●
●
●
●
●
●●
● ●
●
●
●
●
●
● ●●
●
●●
●
●
●
●●
●
●
●
●
●
●
●
●
●
●
●
●
●
●
●
●
●
●
●
●
●
●
●
●
●
●
●●
●
●
●
●
●
●
●●
●
●
●
●●
●●
●
●
●
●
●
●
●
●
●
●
●
●
●
●
●
●
●
●●
●●
●
● ●●
●
●
●
●
●
●
●
●●
●
●
●
●
●
●
●●
●●
●
●
●
●
●
●
●
●
●
●
●●
●
●
●●
●
●
●
●
●●
●
●
●
●●
●
●
●
●
●
●
●
●●
●
●
●
●
●
●
●
●
●
●
●
●
●
●
●●
●
●
●
●
●
●
●
●
●●
●
●●
●
●
●
●
●
●
●
●
●
●●
●●
● ●●
●
●
●
●
●
●
●
●
●
●
●
●
●
●
●
●
●
●
●
●
●
●
●
●
●
●
●
●
●
●
●
●
●
●
●
●
●
●
●
● ●●
●
●
●
●
●
●
●
●
●
●
●
●
●
●●
●●
●
●●
●
●
●
●
●
●
●
●
●
●
●
●●
●●
●
●
●
●●
●
●
●
●
●
●●●
● ●
●
●
●
●
●
●
●
●
●
●
●
●
●
●
●
●
●
●
●
●
●
●
●
●
●
●●
●
●
●
●
●
●
●● ●
●
●
●
●
●
●
●
●
●
●
●
●●
●
●
●
●
●
●●
●
●
●
●
●
●
●
●
●
●
●
●
●
●●
●
●
●
●
●●
●
●
●
●
●
●
●
●
●
●
●
●
●
●
●
●
●
●
●
●
●
●
●
●
●
●
●●
●
●
●
●
●
●
●
●●
●
●
●
●
●
●●
●
●
●
●
●●●
●
●
●
●
●
●
●
●●
●
●
●
●
●
●
●
●
●
●
●
●
●
●
●
●
●
●
●
●
●
●
●
●
●
●
●
●
●
●
●
●
●
●
●
●
●
●●
●
●
●
●
●
●
●
●
●●
●
●
●
●
●
●
●
●
●
●
●
●
●
●
●
●
●
●
●
●
●●
●
●
●
●
●
●
●
●
●
●
●
●
●
●
●
●
●
●
●
●●
●
●
●
●
●
●●
●
●
●
●
●
●
●
●●
●●●
●
●
●
●
●
●
●
●
●
●
●
●
●
●
●
●
●
●
●
●●
●
●
●●
●●
●
●
●
●
●
●
●
●●
●
●
●
●
●●
●
●
●
●
●●
●
●
●
●
●
●●
●
●
●
●
●
●
●
●
●
●
●
●
●●
●
●●
●
●
●
●
●
●
●
●
●
●
●●
●
●
●
●
●●
●●
●
●
●
●
●●
●
●
●
●
●
●
●
●●
●
●
●
●
●
●
●●
●
●●
●
●●
●
●●
●●
● ●
●
●
●
●
●
●
●
●
●
●
●●
●
●
●
●
●
●●
●
●
●
●
●
●
●
●
● ●
●
●
●
●
●
●
●
●
●
●
●
●
●
●
●
●●●
●
●
●
●
●
●
●
●
●
●●
●
●
●
●
●
●
●
●
●●
●●
●
●
●
●●
●●
●
●
●
●●
●
●●
●
●
●
●●
●
●
●
●
●
●
●
●
●
●
●
●
●●●
●
●
●
●
●
●
●
●
●
●
●
●
●
●
●
●
●
●●
●
●
●
●
●
●●
●
●
●
●
●
●
●
●
●
●
●
●
●
●
●●
●
●
●
●●
●
●●
●
●
●
●
●
●
●
●
●●●
●
●
●●
●
●
●
●
●
●
●
●●
●
●
●
●
●
●
● ●●
●
●
●
●
●
●
●
●
●
●
●
●
●
●
●
●
●
●
●
●
●
●
●
●
●
●
●
●
●
●
●
●
●●
●
●
●
●●
●
●
●
●
●
●
●
●
●
●
●●
●●
●
●●
●
●
●
●
●
●
●
●
●
●●
●
●
●
●
●
●
●
●
●
●
●
●
●
●
●
●
●
●
●
●
●
●
●●
●
●
●
●
●
●●
●
●
●
●
●
●
●●
●
●
●
●
●
●
●
●
●
●●
●
●
●
●
●●
●●
●
●
●
●
●
●
●
●
●
●
●
●●
●
●
●
●
●
●
●
●
●
●●
●
●
●
●
●
●
●
●
●
●●
●
● ● ●
●
●
●
●
●
●
●
●●
●
●
●
●
●
●
●
●
●
●●
●
●
●
●
●
●
●
●
●
●
● ●
●●
●
●
●
●
●
●
●
●
●
●
●
●
●
●●●
●
●●
●
●
●
●
●●
●
●
●
●
●
●
●
●
●
●●
●
●
●
●
●●
●
●
●
●●●
●
0
50
100
150
200
0.00 0.25 0.50 0.75 1.00
Rank within Type
Inco
me
(tho
usan
ds o
f Eur
os)
Inheritance
●
●
●
●
●
None
Low
Mid−Low
Mid−High
High
Income/Effort distribution across 5 Inheritance Types Men with mid parental occupational class
(Obs. < 200.000 euros)
Figure 3: The inheritance thresholds to create the 5 inheritance types are the quartiles (q25, q50 and q75)of the inheritances distribution (see Table 4)
24

Figure 4: Distribution of Wealth and Income conditioned to rank within type(’effort’). Men with high-level parental occupation. Types obtained by amount of
inheritance.
●
●
●●●●
●
●
●●
●●●
●
●●
●
●●
●
●●
●
●
●
●
●
●●
●●
●●●
●
●●
●
●
●
●
●
●●
●
●
●
●●●
●
● ●
●
●
●
●
●
●
●●
●
●
●●
●●
●
●
●●
●
●
●
● ●●●
●
●
●
●
● ●
●
● ●●
●
●● ●
●●
●
●
●●
●●
●● ●
●
●
●
●
●
●
●
●
●
●●
●
●
●
● ●●●
●
●
●
● ●●●
●●
●
●
●
●●● ●
●
●
●●
●
●●
●
●
●
●●
●
●
●
●
●
● ●●
●●
●
●
●
●
● ●
●●
●
●
●
●
● ●
●●
●
● ●
●
●
●
●
●
●●
●
●
●●
●
●
●
●●
●
●
● ●
●
●●
●
●●
●
● ●
●
●
●
●
●
●●
●●
●
●
●
●●
●
●
● ●●
●
●●● ●
●
● ●
●
●●●
●
●
●●
●
●
●
●
●
●
●
●● ● ●●●
●
●●
●
●●●
●
●●
● ●●● ●
●
●
●
●●●
●
●
●●●
●
●
●
●
●●
●
●
●●
●
●
●●●
●
●●
●
●●
●●
●
● ●
●
●
●
●●
●● ●
●
●
●
●
●
●
●
●
●
●●
●
●
●
●
● ●●
●
●
●
●
●
●
●
●
●
● ●●
●
●
●● ●●
●
●●●
●●●
●● ●
●
●
●
●●●
●
● ●●
● ●
●●
●
●
●●
●
● ●●
●
●●
●●●●
●●
●●
●●
● ●●
●
●●
●
●
●●●
● ●●
●
●
●
●
● ●●
●
●●●
●● ●
●
●●●
●
●
●●
●●
●
●
●
●●
●
●
●
●
●
●
●
●● ●●
● ●●●●
●
●
●
●●
●
●●
●
●
●●
●
●
●●
●
●
●
●●
●●
●
●●
●● ●
●●
●
●●●
●
●
●●●
●
●
●●
●
●
●
●●
●●
●
●
●
●●
●
●
●
●
●●●
●
●
●
●
●
●
●
●
●●
●
●
●●
●
●● ●
●
●●
●
●
●●●
●
●
●●
●●
●
●●
●
●
●
●
● ●●
●
●
●
●●
●
●●
●●
● ● ●
●
●● ●
●
●
●
●
●
●
●
● ● ●●
● ●
●
●●●
●
●
●●●
●0
10
20
30
40
50
0.00 0.25 0.50 0.75 1.00
Rank within Type
Wea
lth (
mill
ions
of E
uros
)
Inheritance
●
●
●
●
●
None
Low
Mid−Low
Mid−High
High
Wealth/Effort distribution across 5 Inheritance Types Men with high parental occupational class
Obs. < 50 million euros
●
●
●
●
●
●
●
●
●●
●
●
●
●●
●
●
●
●
●
●
●
●
●
●
●●
●
●
●
●
●
●
●
●
●●
●
●
●
●
●
●
●
●
●
●
●
●
●
●
●
●
●
●
●
●
●
●
●
●
●
●
●
●
●
●
●
●
●
●
●
●
●
●
●●
●
●
●
●
●●
●
●
●
●
●
●
●
●
●
●
●
●
●
●
●
●
●
●
●
●● ●
●
●
●
●
●
●
●●
●
●
●●
●
●
●
●
●
●
●
●
●
● ●
●
●
●
●
●
● ●
●
●
●
●
●
●
●
●
●
●
●
●
●
●●
●
●
●
●
●
●
●
●
●
●
●
●●
●
●
● ●
●
●
●
●
●
●
●
●
●
●
●
●
●
●
●
●
●
●
●
●
●
●
●
●
●
●
●
●
●
●
●
●
●
●
●
●
●
●
●●
●
●
●
●
●
●
●
●
●
●
●
●
●●
●
●
●
●
●
●
●
●
●
●
●
●
●
●
●
●
●
●
●
●
●
●
●
●
●
●
●
●
●
●
●●
●
●
●
●
●
●
●
●
●
●
●
●●
●
●
●
●
●
●
●
●
●
●
●
●
●
●
●
●
●
●
●
●
●
●
●
●
●
●
●
●
●●
●
●
●
●
●●
●
●
●
●
●
●
●
●
●
●
●
● ●
●
●
●
●
●●
●
●
●
●
●
●
●
●●
●
●
●
●
●
●
●
●
●
●
●
●
●
●
●
●
●
●
●
●
●
●●
●
●
●
●
●
●
●
●
●
●
●
●
●●
●
●
●
●
●
●
●
●
●
●
●
●
●
●
●
●
●
●
●
●
●
●
●
●
●
●
●
●
●
●●
●
●
●
●
●
●
●
●
●
●
●
●
●
●
●
●
●
●
●
●
●
●
●
●
●
●
●
●
●●
●
●
●
●
●
●
●
●
●
●
●
●
●
●
●
●
●
●
●
●
●
●
●
●
●●
●
●
●
●
●
●
●
●
●
●
●
●
●
●
●
●
●
●
●
●
●
●
●
●
●
●
●●
●
●
●
●●
●
●
●
●
●
●
●
●
0
1
2
3
4
5
0.00 0.25 0.50 0.75 1.00
Rank within Type
Wea
lth (
mill
ions
of E
uros
)
Inheritance
●
●
●
●
●
None
Low
Mid−Low
Mid−High
High
Wealth/Effort distribution across 6 Types Men with high parental occupational class
Obs. < 5 million euros
●
●
●●
●
●
●
●●
●●
●
●
●●●
●
●
●
● ● ●●
●
●
●● ●
●●
●
●
●
●
●●
●
●
●
●
●
●
●●
●
●
●
●●
●●●
● ●●●
●
●
●
●
●
●
●
●●
●●
●
●
●●
●
●
●
●● ●●
●
● ●●
●●●●
●
●
●
● ●
●
●●●
●
●●
●
●
●●
●
●
●
●
●
●
●
●
●●
●
●●
●
●●●
●
●
●
●
●
●●
●●●
●●
●
●
●●
●
●●
●
●●●
● ●
● ●
●●
● ●●
●
●
●
●●
● ●
●
●
●
●
●
●
●
●
●●
●
●
●
● ●
●
●●
●●
●
●
●
●
●●
●●
●●
●● ●
●
● ●●
●
● ●
●
●●
●
●●
●
● ●
●●
●
●
●
●●
●
● ●●
●
●●
●
●●●●
●●●● ●
●●
●
●
●●● ●
●
●
●
●
●
●
●
●
●●
● ●
●
●
●
●●●●●
●
● ●
●
●
●●
● ●●
●
●
●●
●
●
●●
●
●●
●
●
●
●
●
●
●
●
●
● ●●●
● ●●
●
●●
●
●
●
●
●●
●●
●
●●
●
●●
●
●
●
●
●
●
●● ●
●
●●
●●
●
●
●●
●
●
●
●
●
●●
●
●
●
●●
●
●
● ●●●●
● ●
●
●
● ● ●
●
●●
●
●
●
● ●●●
●●
●●
● ●
●●
●
●
●
●
● ●●
●
● ●●● ● ●
●●
●
●
●●
●
●
●
●●●
●
●
●●●
● ●●
●
●
●●
●
●●
●
●●●
●
●
●
● ●
●●
●
●
●●●●
●●
●
●
●
●
●
●
●●
●●
●●● ●
●●
●●
●
●● ●●
●
●
●●
●
●
●
●●
●
●
●
●
●
●
● ●● ●
●
●
●
●
●●●
●
●
●
●●
●
●
●
●●
●
●
●
●
●
●
●
●●●
●
●
●
● ●
●
●
●
●
●
●
●●
●
●
●●●
●●●
●●
●
●
●●
●
●
●
●
●
● ●●●
●
●●
●
●
●● ●
●●
●●●
●
●
●
●
●
● ●
●
●
●●
●
●
●
●
●
●
●
●
●
●●
●●
●
●
●
●
●
●
●● ●
●
●●
●
●
● ●
●
●
●
●●●
0
0.5
1
1.5
2
0.00 0.25 0.50 0.75 1.00
Rank within Type
Inco
me
(tho
usan
ds o
f Eur
os)
Inheritance
●
●
●
●
●
None
Low
Mid−Low
Mid−High
High
Income/Effort distribution across 5 Inheritance Types Men with high parental occupational class
(Obs. < 2 million euros)
●
●
●
●●
●
●
●
●
●
●
●
●
●
●●
●
●
●
●
●
●
●
●
●
●
●
●
●
●
●
●
●
●
●
●
●
●
●
●
●
●●
●
●
●
●
●
●
●
●
●
●
●
●
●
●
●
●
●●
●
●
●
●
●
●
●
●
●
●
●●
●
●
●
● ●
●
●
●
●
●
●
●
●
●
●
●
●
●
●
●
●
●
●
●
●
●
●
●
●
●
●
●
●
●●
●
●
●
●
●
●
●
●
●
●
●●
●
●
●
●●
●
●
●
●
●
●
●
●
●
●
●
●
●
●
●
●
●
●
●
●
●
●
●
●
●
●
●
●
●
●
●
●
●
●
●
●
●
●
●
●
●
●
●
●
●
●
●
●
●
●
●
●
●
●
●
●●
●
●
●
●
●
●
●
●●
●
●
●
●●●
●
●
●
●●
●
●
●
●
●
●
●
●
●
●
●
●
●
●●
●●
●
●
●
●
●
●
●
●
●
●
●
●
●
●
●
●
●
●
●
●
●
●
●
●
●
●
●
●
●
●
●
●
●
●
●
●
●
●
●
●
●
●
●
●
●
●
●
●
●
●
●
●
●●
●
●
●
●
●
●
●
●
●
●
●
●●
●
●
●
●
●
●
●
●
●
●●
●
●
●
●
●
●
●
●
●
●
●
●
●
●
●
●
●
●
●
●
●
●
●
●
●
●
●
●
●
●
●
●
●
●
●
●●
●
●
●
●
●
●
●
●
●●
●
●
●
●
●
●
●
●
●
●
●
●
●
●
●
●
●
●
●
●
●
●
●
●
●
●
●●
●
●
●
●
●
●
●
●
●
●
●
●
●
●
●
●
●
●
●
● ●
●
●
●
●
●
●
●
●
●
●
●
●
●
●
●
●●
●
●
●
●
●●
●
●
●
●
●
●
●
●
●
●
●
●●
●
●
●
●
●
●
●
●
●
●
●
●
●
●
●
●
●
●
●
●
●
●
●
●
●
●
●
●
●
●
●
●
●
●
●
●
●
●
●
●
●
●
●
●
●
●●
●
●
●
●
●
●
●
●
●
●
●
●
●
●
●
●
●
●
●
●
●
●
●
●
●
●
●
●
●
●
●
●
●
●
●
●
●
●
●
●
0
50
100
150
200
0.00 0.25 0.50 0.75 1.00
Rank within Type
Inco
me
(tho
usan
ds o
f Eur
os)
Inheritance
●
●
●
●
●
None
Low
Mid−Low
Mid−High
High
Income/Effort distribution across 5 Inheritance Types Men with high parental occupational class
(Obs. < 200.000 euros)
Figure 4: The inheritance thresholds to create the 5 inheritance types are the quartiles (q25, q50 and q75)of the inheritances distribution (see Table 4)
25