inhibition of bcl2 family members increases the efficacy ... · 1 inhibition of bcl2 family members...
TRANSCRIPT
1
Inhibition of BCL2 family members increases the efficacy of copper chelation in BRAFV600E
-
driven melanoma
Ye-Jin Kim1, Tiffany Tsang2, Grace R. Anderson3, Jessica M. Posimo1, and Donita C. Brady1,4*
1Department of Cancer Biology, 2Cell and Molecular Biology Graduate Group, Perelman School of
Medicine, University of Pennsylvania, Philadelphia, PA, 19104, USA. 3 Department of Pharmacology and
Cancer Biology, Duke University Medical Center, Durham, NC, 27710, USA. 4Abramson Family Cancer
Research Institute, Perelman School of Medicine, University of Pennsylvania, Philadelphia, PA, 19104,
USA.
Running title: TTM and BH3 mimetics synergize to inhibit BRAFV600E melanoma
Corresponding Author: *Donita C. Brady, Department of Cancer Biology, Perelman School of
Medicine, 421 Curie Blvd., 612 BRBII/II, Philadelphia, PA 19104. Phone: 215-573-9705; Email:
Disclosure of Potential Conflicts of Interest: D.C. Brady holds ownership in Merlon Inc. D.C. Brady is
an inventor on the patent application 20150017261 entitled “Methods of treating and preventing cancer by
disrupting the binding of copper in the MAP kinase pathway”. No potential conflicts of interest were
disclosed by the other authors.
on June 19, 2020. © 2020 American Association for Cancer Research. cancerres.aacrjournals.org Downloaded from
Author manuscripts have been peer reviewed and accepted for publication but have not yet been edited. Author Manuscript Published OnlineFirst on January 31, 2020; DOI: 10.1158/0008-5472.CAN-19-1784
2
Abstract The principal unmet need in BRAF
V600E-positive melanoma is lack of an adequate therapeutic
strategy capable of overcoming resistance to clinically approved targeted therapies against
oncogenic BRAF and/or the downstream MEK1/2 kinases. We previously discovered that copper
(Cu) is required for MEK1 and MEK2 activity through a direct Cu-MEK1/2 interaction.
Repurposing the clinical Cu chelator tetrathiomolybdate (TTM) is supported by efficacy in
BRAFV600E
-driven melanoma models, due in part to inhibition of MEK1/2 kinase activity.
However, the antineoplastic activity of Cu chelators is cytostatic. Here, we performed high-
throughput small molecule screens to identify bioactive compounds that synergize with TTM in
BRAFV600E
-driven melanoma cells. Genetic perturbation or pharmacological inhibition of
specific members of the BCL2 family of anti-apoptotic proteins (BCL-W, BCL-XL, and MCL-1)
selectively reduced cell viability when combined with a Cu chelator and induced CASPASE-
dependent cell death. Further, in BRAFV600E
-positive melanoma cells evolved to be resistant to
BRAF and/or MEK1/2 inhibitors, combined treatment with TTM and the clinically evaluated
BCL2 inhibitor, ABT-263, restored tumor growth suppression and induced apoptosis. These
findings further support Cu chelation as a therapeutic strategy to target oncogene-dependent
tumor cell growth and survival by enhancing Cu chelator efficacy with chemical inducers of
apoptosis, especially in the context of refractory or relapsed BRAFV600E
-driven melanoma.
on June 19, 2020. © 2020 American Association for Cancer Research. cancerres.aacrjournals.org Downloaded from
Author manuscripts have been peer reviewed and accepted for publication but have not yet been edited. Author Manuscript Published OnlineFirst on January 31, 2020; DOI: 10.1158/0008-5472.CAN-19-1784

3
Introduction
Melanoma is driven in 40-50% of cases by activating mutations in the BRAF
serine/threonine kinases(1,2). Over 90% of oncogenic BRAF mutations detected in melanoma
are Val 600Glu (V600E)(3,4). Activated BRAFV600E
phosphorylates and activates MEK1/2,
which subsequently phosphorylate and activate ERK1/2, resulting in hyperactivation of the
evolutionarily conserved mitogen-activated protein kinase (MAPK) pathway to drive
melanomagenesis(4,5). Thus, late-stage BRAFV600E
-positive melanoma patients are typically
treated with the FDA-approved combination of mutant-selective, ATP-competitive BRAF
inhibitors (BRAFi, dabrafenib and vemurafenib) and allosteric MEK1/2 inhibitors (MEK1/2i,
trametinib and cobimetinib)(6–9). Although this standard-of-care is initially effective,
BRAFV600E
-mutant melanoma patients have only modest improvements in median progression-
free survival and eventually develop resistance(4,10,11). The limited clinical durability of the
combination has bolstered research aimed at additional combination strategies to forestall
resistance development, targeting multiple signaling pathways capable of driving resistance, or
exploring alternative pharmacological accessible nodes within the MAPK pathway(4,10,11).
In search of identifying novel components of the canonical MAPK pathway, several
groups have employed functional genomics approaches(12). Specifically, a whole genome RNAi
screen revealed that the primary copper (Cu) transporter Ctr1 reduced ERK1/2 phosphorylation
when knocked down in Drosophila S2 cells(13). We demonstrated that Cu directly binds to
MEK1/2 and influences the strength of the RAF-MEK-ERK cascade (14). Leveraging the
dependence of BRAF mutation-positive cancers on MEK1/2 for tumorigenesis(15), we found that
decreasing the levels of CTR1 or introducing surface accessible mutations in MEK1 that disrupt
Cu binding decreased BRAFV600E
-driven signaling and tumor growth(16). Importantly, the Cu-
selective chelator tetrathiomolybdate (TTM), used as an investigational treatment of Wilson
disease(17), diminished tumorigenesis in models of BRAFV600E
melanoma(18). Although TTM
use has not been clinically explored BRAFV600E
-driven melanoma, TTM has been assessed in
breast cancers as an anti-angiogenic compound where patients have been treated safely for
upwards of 65 months(19). Further, the combination of TTM, a well-tolerated and affordable
drug, and vemurafenib led to a survival benefit in a murine model of metastatic melanoma, but
failed to yield tumor regression (18).
on June 19, 2020. © 2020 American Association for Cancer Research. cancerres.aacrjournals.org Downloaded from
Author manuscripts have been peer reviewed and accepted for publication but have not yet been edited. Author Manuscript Published OnlineFirst on January 31, 2020; DOI: 10.1158/0008-5472.CAN-19-1784
4
In this study, we aimed to advance the therapeutic value of Cu chelation in BRAFV600E
melanomas by identifying compounds that enhanced TTM efficacy. We performed high-
throughput small molecule screens with a panel of bioactive compounds to explore collateral
drug sensitives in combination with TTM. Here, we demonstrate that co-targeting select BCL2
proteins via BH3 mimetics synergizes with Cu chelators in both naïve and resistant forms of
BRAFV600E
melanoma cells. The findings presented here highlight the potential of inducing
apoptosis and melanoma tumor suppression when Cu chelators are combined with BCL2is.
Materials and Methods
Reagents
A1210477 (ApexBio, B6011), ABT-199 (Selleck Chemicals, S8048), ABT-263 (M1637,
AbMole), ABT-737 (Selleck Chemicals, S1002), Ammonium tetrathiomolybdate (TTM, Sigma-
Aldrich, 323446), trametinib (Selleck Chemicals, S2673), WEHI-539 hydrochloride (ApexBio,
A8634), vemurafenib (CT-P4032), and Z-DEVD-FMK (Selleck Chemicals, S7312) were
purchased from indicated companies.
Cell lines
293T/17 (ATCC, catalog #CRL-11268), A375 (ATCC, catalog #CRL-1619), WM88 (Rockland,
catalog #WM88-01-0001), WM3311 (Rockland, catalog #WM3311-01-0001), WM3743
(Rockland, catalog #WM3743-01-0001) cells were purchased from the indicated companies and
maintained in Dulbecco’s Modified Eagle Media (DMEM, Gibco) supplemented with 10% v/v
fetal bovine serum (FBS, GE Lifesciences) and 1% penicillin-streptomycin (P/S, Gibco). 451Lu
parental cells and resistant derivatives, 451-Lu BRAFiR and 451-Lu MEKi
R, were a kind gift
from Jessie Villanueva (Wistar Institute) and maintained in DMEM supplemented with 5 % FBS
with 1 µM vemurafenib or 1 µM trametinib(20,21). WM983B parental cells and a resistant
derivative, WM983B BRAFiR, were a kind gift from Jessie Villanueva (Wistar Institute) and
maintained in DMEM supplemented with 5 % FBS with 1 µM vemurafenib. Cell lines were not
authenticated. Mycoalert testing was done to test for mycoplasma contamination of all cell lines.
Derived cell lines were generated by stable infection with lentiviruses derived from the
pSMARTvector inducible lentiviral shRNA plasmids (Dharmacon, see plasmids below) or
on June 19, 2020. © 2020 American Association for Cancer Research. cancerres.aacrjournals.org Downloaded from
Author manuscripts have been peer reviewed and accepted for publication but have not yet been edited. Author Manuscript Published OnlineFirst on January 31, 2020; DOI: 10.1158/0008-5472.CAN-19-1784

5
retroviruses derived from the pBABE retroviral plasmid (see plasmids below) described below
using established methods.
Plasmids
pSMARTvector inducible lentiviral shRNA plasmids were purchased from Dharmacon to
express: non targeted control, human BCL2 target sequence #1 5’-
TGACGCTCTCCACACACAT, human BCL2 target sequence #2 5’-
AAGAAGGCCACAATCCTCC, human BCL-XL target sequence #1 5’-
CAAACTGCTGCTGTGGCCA, human BCL-XL target sequence #2 5’-
CTCCGATTCAGTCCCTTCT, human BCL-W target sequence #1 5’-
AGCGGGTCTCGAACTCATC, human BCL-W target sequence #2 5’-
CTGCTGTGGATCCAGTCAG, human MCL-1 target sequence #1 5’-
CGAAGGAAGTATCGAATTT, human MCL-1 target sequence #2 5’-
AGAGTGTATACAGAACGAA. GFP and shRNA expression was induced by adding 0.5 µg/ml
(for A375) or 1 µg/ml (for WM88) of doxycycline hydrochloride (Dox, Fisher Scientific,
AAJ67043AE) to DMEM supplemented with 10% FBS and 1% P/S, Gibco. pBABEpuro-HA-
p61BRAFV600E
, pBABEpuro-HA-MEK1C121S
, and pBABEpuro-HA-PDGFRß were previously
described(18).
Cell viability assay
5 x 10³ of the indicated cells per well were plated in white 96-well plates (Fisher Scientific,
655098) and cultured for 12 hours prior to treatment with the indicated drugs for 72 hours or 96
hours. Cell viability was measured using CellTiter-Glo cell viability assay (Promega, G7571).
Normalized %ATP values were calculated by normalizing luminescence values for each drug
treatment condition to vehicle (DMSO) treated wells. To generate IC50 curves, the nonlinear fit
of Log(Drug) or Drug versus normalized response (%ATP Normalized to DMSO) with a
variable slope was calculated in Prism8 (GraphPad). Each drug treatment condition was
represented by at least three biological replicates plated in technical triplicate. The Bliss Indexes
to test for synergy in drug combinations was performed as previously described(18,22).
Flow cytometry
on June 19, 2020. © 2020 American Association for Cancer Research. cancerres.aacrjournals.org Downloaded from
Author manuscripts have been peer reviewed and accepted for publication but have not yet been edited. Author Manuscript Published OnlineFirst on January 31, 2020; DOI: 10.1158/0008-5472.CAN-19-1784
6
2 x 10⁵ of the indicated cells were seeded in 6-well plates (Genesee Scientific, 25-105) and
treated as described, floating and attached cells were harvested, stained with Annexin V-FITC
and Propidium Iodide using Annexin V-FITC apoptosis detection kit I (BD Biosciences, 556547)
according to manufacturer’s protocols. Data were acquired using the Attune NxT flow
cytometry (Thermo Scientific) and analyzed with FlowJo 8.7 (Tree Sar).
Immunoblot analysis
Indicated cells or xenograft derived tumor lysates were treated as indicated and then washed with
cold 1X PBS (phosphate buffered saline) and lysed with cold RIPA buffer containing 1X EDTA-
free HaltTM
protease and phosphatase inhibitor cocktail (Thermo Scientific, 78441). The protein
concentration was determined by BCA Protein Assay (Pierce) using BSA as a standard. Equal
amount of lysates were resolved by SDS-PAGE using standard techniques, and protein was
detected with the following primary antibodies: rabbit anti-phospho(Thr202/Tyr204)-ERK1/2
(1:1000; Cell Signaling Technology (CST), 9101), mouse anti-ERK1/2 (1:1000; CST, 9107),
rabbit anti-phospho(Ser217/221)-MEK1/2 (1:1000; CST, 9154), mouse anti-MEK1/2 (1:1000;
CST, 4694), rabbit anti-PARP (1:1000; CST, 9542), rabbit anti-cleaved PARP (1:1000; CST,
9541), rabbit anti-CASPASE-3 (1:1000; CST, 9662), mouse anti--actin (1:10000; CST, 3700),
rabbit anti-BCL2 (1:1000; CST, 4223), rabbit anti-BCL-W (1:1000; CST, 2724), rabbit anti-
BCL-XL (1:1000; CST, 2764), rabbit anti-MCL-1 (1:1000; CST, 94296), rabbit anti-
CYTOCHROME C (1:1000; CST 11940), rabbit anti-HSP60 (1:1000; CST 4870), mouse anti--
TUBULIN (1:1000; CST 3873), followed by detection with one of the horseradish peroxidase
conjugated secondary antibodies: goat anti-rabbit IgG (1:5000; CST, 7074) or goat anti-mouse
IgG (1:5000; CST, 7076), using SignalFire (CST) or SignalFire Elite ECL (CST) detection
reagents. For detection of CYTOCHROME-C release, cells were treated as described, washed
with cold 1X PBS, and mitochondrial and cytosolic fractions were separated using
mitochondria/cytosol fractionation kit (BioVision K256) according to manufacturer’s protocols.
High throughput small molecule library screen
Drug screening was performed by the University of Pennsylvania High-Throughput Screening
Core. To determine the IC20 for the indicated cell lines, 103
cells were plated per well in white
384-well plates, treated with eight concentrations of TTM (1:3 dilution, ranging from 0.0457-
on June 19, 2020. © 2020 American Association for Cancer Research. cancerres.aacrjournals.org Downloaded from
Author manuscripts have been peer reviewed and accepted for publication but have not yet been edited. Author Manuscript Published OnlineFirst on January 31, 2020; DOI: 10.1158/0008-5472.CAN-19-1784
7
100M), and cell viability was measured 96 hours later with the ATPliteTM
cell viability assay
(Perkin Elmer) on an EnVision Plate Reader (Perkin Elmer). To generate IC50 curves, the logistic
regression curve of Log(Drug) versus normalized response (%ATP Normalized to DMSO) were
fit in TIBCO Spotfire software. The IC20 was calculated using the following formula:
IC_F=[(F/(100-F)^(1/H)]*IC50 where H= the Hill slope. For the subsequent drug screens,
indicated cell lines were treated with 100nM of a compound from the SelleckChem Bioactive
Compound Library with or without TTM at the IC20 for the respective cell line. DMSO and
doxycycline were used as negative and positive controls respectively. Normalized percent
inhibition (NPI) was calculated for all data points.
Mouse xenografts and drug treatments
All studies were approved by the University of Pennsylvania Institutional Animal Care and Use
Committee. 5x10⁶ A375 ,451-Lu-BRAFi
R, or 451-Lu-MEKi
R or 8x10
6 451-Lu cells resuspended
in 1X PBS were injected subcutaneously into flanks of SCID/beige mice (Charles River
Laboratory) as previously described(23). When tumor volume reached ~100 mm3, mice were
treated daily via oral gavage: vehicle [1% methylcullulose (Sigma-Aldrich, M0512), 1%
dimethyl sulfoxide (DMSO, Sigma-Aldrich)]; 80 mg/kg TTM in vehicle; 25 mg/kg vemurafenib
in 10% ethanol, 30% polyethylene glycol (PEG) 400 (EMD Millipore, 8.07485.1000) and 60%
Phosal 50PG (Lipoid, 368315); 0.5 mg/kg trametinib in PEG; or 25 mg/kg ABT-263 in PEG.
Immunofluorescence
Tumor tissue sections were stained with either a rabbit anti-Ki67 antibody (1:100; Novus
Biologicals, NB100-89717) followed by detection with a Alexa Fluor 647-conjugated anti-rabbit
IgG (1:1000; Thermo Scientific, A27040) or DeadEnd™ Colorimetric TUNEL System
(Promega, G3250), following the manufacturer’s protocol. Photographs were taken on a Leica
DMI6000B inverted confocal microscope (40x) in a blinded fashion. Images were quantified
using Image J software.
Results
TTM-mediated reductions in BRAFV600E
-driven cell viability and MAPK signaling fail to
induce apoptosis
on June 19, 2020. © 2020 American Association for Cancer Research. cancerres.aacrjournals.org Downloaded from
Author manuscripts have been peer reviewed and accepted for publication but have not yet been edited. Author Manuscript Published OnlineFirst on January 31, 2020; DOI: 10.1158/0008-5472.CAN-19-1784
8
To examine whether the Cu chelator efficacy could be improved in BRAFV600E
-positive
melanoma, we first treated BRAFV600E
-mutant melanoma cells in vitro with increasing
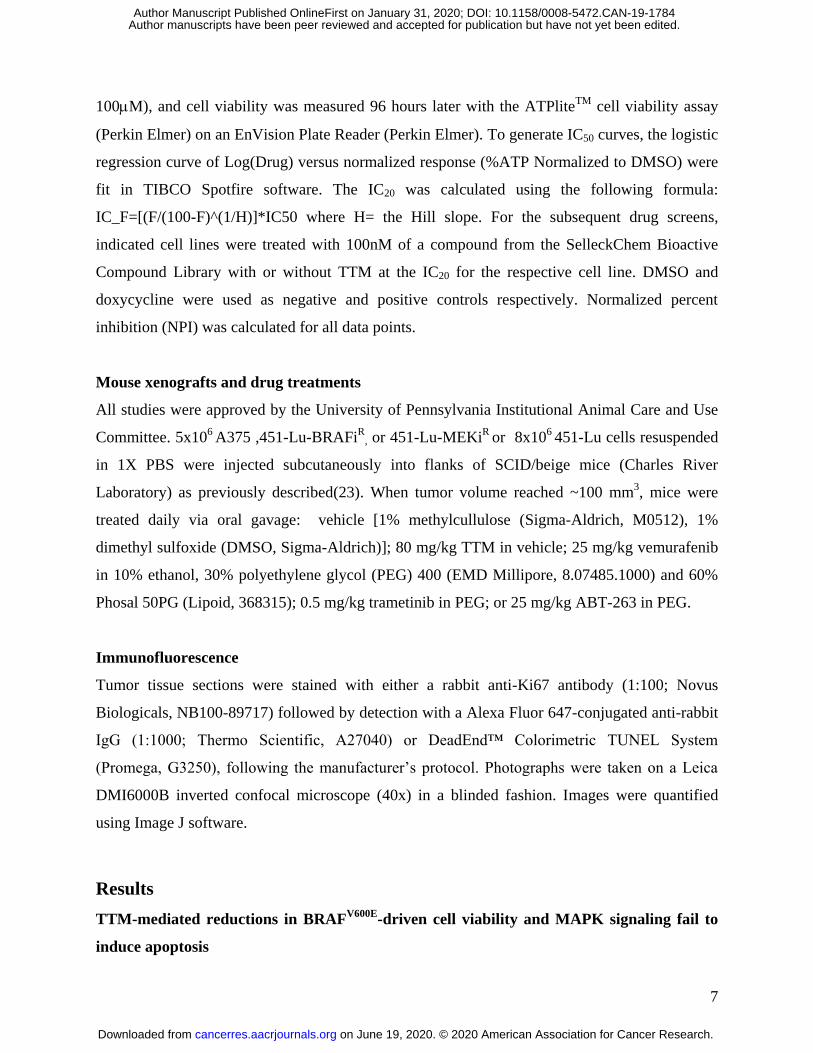
concentrations of TTM and measured cell viability. TTM reduced the number of viable 451-Lu,
A375, WM88, and WM983B cells in a dose-dependent manner (Fig. 1A-E). However, TTM
treatment failed to increase the percent of apoptotic cells (Fig. 1F-I), as measured by annexin-V
and propidium iodide(PI)-positivity via flow cytometry(24), despite effectively decreasing
ERK1/2 phosphorylation (Fig. 1J-M, Supplemental Fig. 1A-D). In agreement, cleavage of
CASPASE-3 and PARP(25,26), well-known markers of cells undergoing apoptosis, were only
observed at concentrations higher than the IC50 of TTM (Fig. 1J-M, Supplemental Fig. 1A-D).
Similarly, treatment with either MAPKi (Supplemental Fig. 2A-J) was not sufficient to increase
markers of apoptosis (Supplemental Fig. 2K-R). Thus, in vitro Cu chelators blunt MAPK
pathway activation and inhibit the viability of BRAFV600E
-driven melanoma cells but fail to
induce apoptosis, akin to treatment with MAPKis, and support the rationale to identify other
therapeutic combinations to improve Cu chelation therapy.
BH3 mimetics synergize with TTM to reduce cell viability of BRAFV600E
-driven melanoma
cells
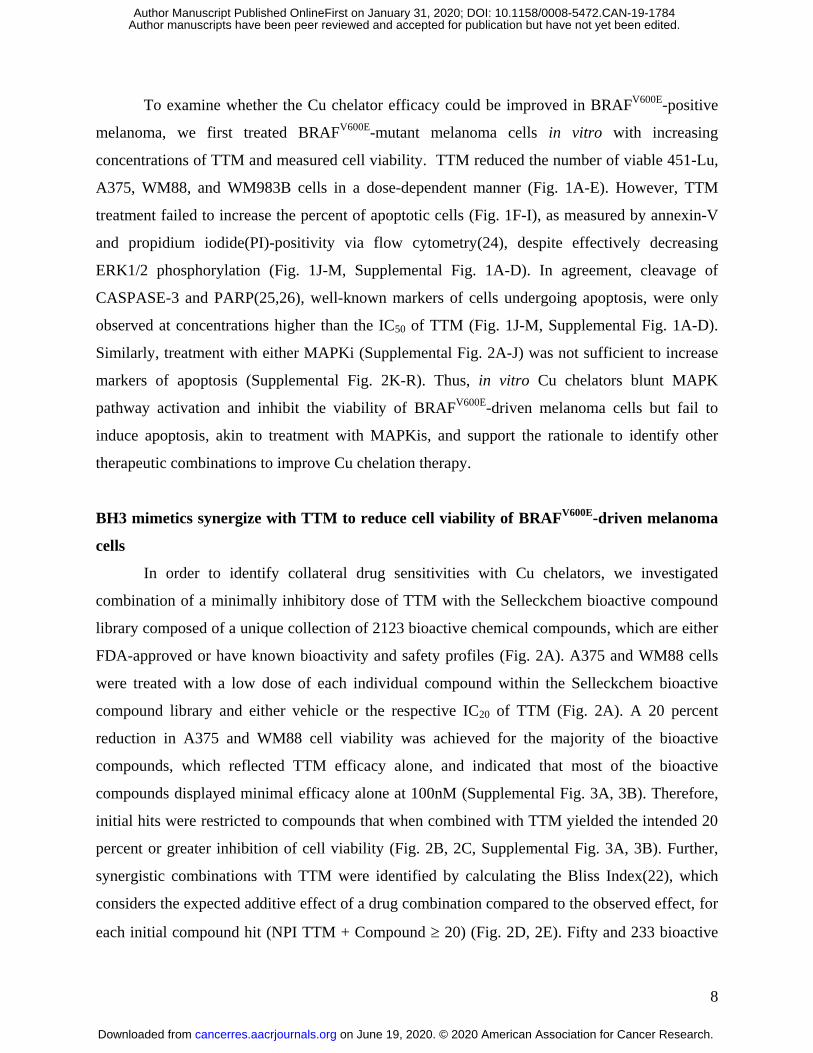
In order to identify collateral drug sensitivities with Cu chelators, we investigated
combination of a minimally inhibitory dose of TTM with the Selleckchem bioactive compound
library composed of a unique collection of 2123 bioactive chemical compounds, which are either
FDA-approved or have known bioactivity and safety profiles (Fig. 2A). A375 and WM88 cells
were treated with a low dose of each individual compound within the Selleckchem bioactive
compound library and either vehicle or the respective IC20 of TTM (Fig. 2A). A 20 percent
reduction in A375 and WM88 cell viability was achieved for the majority of the bioactive
compounds, which reflected TTM efficacy alone, and indicated that most of the bioactive
compounds displayed minimal efficacy alone at 100nM (Supplemental Fig. 3A, 3B). Therefore,
initial hits were restricted to compounds that when combined with TTM yielded the intended 20
percent or greater inhibition of cell viability (Fig. 2B, 2C, Supplemental Fig. 3A, 3B). Further,
synergistic combinations with TTM were identified by calculating the Bliss Index(22), which
considers the expected additive effect of a drug combination compared to the observed effect, for
each initial compound hit (NPI TTM + Compound 20) (Fig. 2D, 2E). Fifty and 233 bioactive
on June 19, 2020. © 2020 American Association for Cancer Research. cancerres.aacrjournals.org Downloaded from
Author manuscripts have been peer reviewed and accepted for publication but have not yet been edited. Author Manuscript Published OnlineFirst on January 31, 2020; DOI: 10.1158/0008-5472.CAN-19-1784

9
compounds synergistically inhibited cell viability of A375 or WM88 cells, respectively, with a
Bliss Index 1.5 (Fig. 2F, 2G). Only five bioactive compounds scored as hits (NPI TTM +
Compound 20/ Bliss Index 1.5) in both BRAFV600E
-positive melanoma cells (Fig. 2H, 2I).
These findings establish the utility of employing high-throughput small molecule screens to
identify synergistic drug combinations for potential cancer treatment and more importantly,
suggest that several bioactive compounds may be useful to enhance Cu chelation therapy
efficacy in BRAFV600E
-mutant melanoma.
We were keenly interested in our finding that the pan BH3 mimetic ABT-737
synergistically inhibited the viability of both A375 and WM88 cells to the greatest extent when
combined with TTM (Fig. 2I). The B-cell lymphoma-2 (BCL2) family consists of two types of
proteins(27), anti-apoptotic (e.g., BCL2, BCL-XL, BCL-W, and MCL1)(28–30) and pro-
apoptotic (e.g., BAK, BAX and BIM), which cooperate through homo- or heterodimer formation
to retain the balance between cell survival and death(31–33). Drugs termed ‘BH3 mimetics’ that
bind the surface groove of certain anti-apoptotic BCL2 proteins and thereby elicit apoptosis have
been developed(34–40). Among them, successful clinical trials of venetoclax (ABT-199), a
specific BCL2i, has led to its FDA-approval for chronic lymphocytic leukemia and clinical
evaluation for treatment of other cancers(41–44). However, single agent inhibition of BCL2 is
not sufficient to induce cell death of melanomas due in part to differential BCL2 protein
expression and diversity(45–51). Similarly, ABT-199 failed to significantly reduce BRAF-mutant
melanoma cell viability alone or in combination with TTM in the high throughput screen
(Supplemental Fig. 3C). Inhibition of multiple anti-apoptotic BCL2 proteins is a major target for
melanoma and other cancers(34,46).
Collateral inhibition of oncogenic MAPK signaling and BCL2 proteins with the pan BH3
mimetic, ABT-737, reduces targeted therapy resistance in BRAFV600E
-driven melanoma(52–54).
In support of these findings, combining MAPKis and navitoclax (ABT-263), an orally
bioavailable analog of ABT-737 (NCT01989585), is being tested clinically in BRAFV600E
-
positive melanoma. While not every BH3 mimetic in the high-throughput screen increased the
efficacy of TTM, ABT-263 synergistically reduced A375 cell viability but was only additive in
the WM88 cell line (Supplemental Fig. 3C). Combination of IC20 or IC50 doses of TTM and
on June 19, 2020. © 2020 American Association for Cancer Research. cancerres.aacrjournals.org Downloaded from
Author manuscripts have been peer reviewed and accepted for publication but have not yet been edited. Author Manuscript Published OnlineFirst on January 31, 2020; DOI: 10.1158/0008-5472.CAN-19-1784
10
100nM ABT-737 was sufficient to significantly reduce cell viability (Fig. 2J, 2K), but failed to
increase the percent of annexin-V positive cells, cleaved-CASPASE-3, or cleaved-PARP
(Supplemental Fig. 3D-G). Further, the addition of TTM to the combination of vemurafenib and
ABT-737 or trametinib and ABT-737 significantly reduced A375 and WM88 cell viability (Fig.
2L-O). Treatment with TTM, ABT-737, and either MAPKi was either equivalent or superior to
the combination of vemurafenib, trametinib, and ABT-737 (Fig. 2L-O). Finally, TTM
significantly increased the capacity of the combination of the MAPKis and ABT-737 to reduce
A375 cell viability (Fig. 2L). These findings indicate that Cu chelation therapy may be a viable
alternative to either MAPKi when combined with a BH3 mimetic, and more importantly, could
enhance the therapeutic benefit of the clinically investigated combination of the MAPKis and a
BH3 mimetic.
Genetic loss of select anti-apoptotic BCL2 family proteins decreases TTM IC50 in
BRAFV600E
-driven melanoma cells
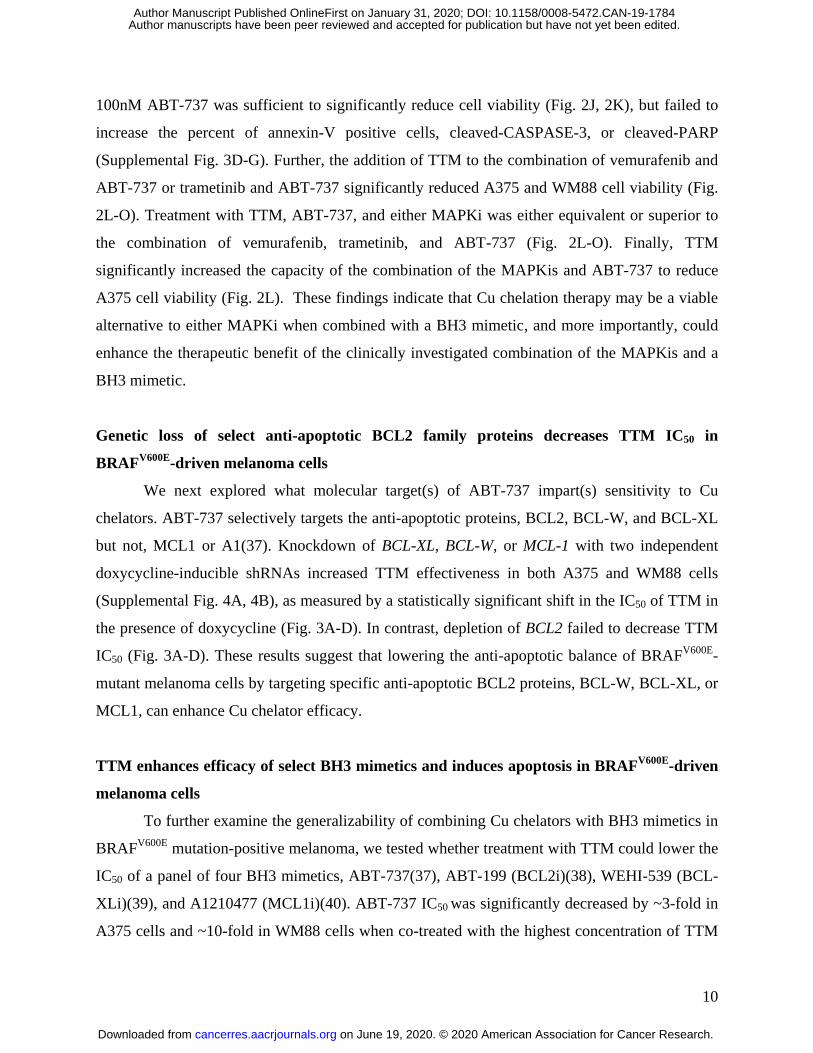
We next explored what molecular target(s) of ABT-737 impart(s) sensitivity to Cu
chelators. ABT-737 selectively targets the anti-apoptotic proteins, BCL2, BCL-W, and BCL-XL
but not, MCL1 or A1(37). Knockdown of BCL-XL, BCL-W, or MCL-1 with two independent
doxycycline-inducible shRNAs increased TTM effectiveness in both A375 and WM88 cells
(Supplemental Fig. 4A, 4B), as measured by a statistically significant shift in the IC50 of TTM in
the presence of doxycycline (Fig. 3A-D). In contrast, depletion of BCL2 failed to decrease TTM
IC50 (Fig. 3A-D). These results suggest that lowering the anti-apoptotic balance of BRAFV600E
-
mutant melanoma cells by targeting specific anti-apoptotic BCL2 proteins, BCL-W, BCL-XL, or
MCL1, can enhance Cu chelator efficacy.
TTM enhances efficacy of select BH3 mimetics and induces apoptosis in BRAFV600E
-driven
melanoma cells
To further examine the generalizability of combining Cu chelators with BH3 mimetics in
BRAFV600E
mutation-positive melanoma, we tested whether treatment with TTM could lower the
IC50 of a panel of four BH3 mimetics, ABT-737(37), ABT-199 (BCL2i)(38), WEHI-539 (BCL-
XLi)(39), and A1210477 (MCL1i)(40). ABT-737 IC50 was significantly decreased by ~3-fold in
A375 cells and ~10-fold in WM88 cells when co-treated with the highest concentration of TTM
on June 19, 2020. © 2020 American Association for Cancer Research. cancerres.aacrjournals.org Downloaded from
Author manuscripts have been peer reviewed and accepted for publication but have not yet been edited. Author Manuscript Published OnlineFirst on January 31, 2020; DOI: 10.1158/0008-5472.CAN-19-1784

11
(Fig. 3E-H). However, the BRAF mutation-negative melanoma cell lines, WM3311 and
WM3743, did not show a similar dose-dependence when TTM and ABT-737 were co-
administered (Supplemental Fig. 4C, 4D), suggesting that BRAFV600E
-mutant melanomas are
selectively sensitive to the combination. The efficacy of WEHI-539 and A1210477 was also
substantially enhanced with TTM (Fig. 3E-H). TTM only slightly decreased the IC50 of ABT-
199 in either A375 or WM88 cells (Fig. 3E-H). Further, combination of TTM with ABT-737,
WEHI-539, or A1210477 synergistically inhibited A375 and WM88 cell viability, while
combining TTM with ABT-199 was additive by Bliss Indexes (Fig. 3I, 3J). Collectively, the
above results suggest that the combined effects of TTM and BH3 mimetics on BRAF-mutant
melanoma cell viability are driven by targeting BCL-W, BCL-XL, and/or MCL1, but not BCL2.
Melanomas are known to harbor elevated levels of the anti-apoptotic BCL2
proteins(55,56), which underlies intrinsic resistance to BH3 mimetics. Mechanistically, treatment
of BRAF-mutant melanoma cells with TTM was sufficient to selectively reduce ERK1/2
phosphorylation and the expression of at least two BCL2 proteins (Fig. 4A, 4B, Supplemental
Fig. 5A, 5B). The differential expression of BCL-W, BCL-XL, and/or MCL1 correlated with
significantly increased cytosolic CYTOCHROME-C in A375 or WM88 cells treated with both
TTM and ABT-737 (Fig. 4C, 4D, Supplemental 5C, 5D), indicating that mitochondrial outer
membrane permeabilization (MOMP) was triggered. In turn, co-treatment with TTM and ABT-
737 increased the population of cells undergoing apoptotic cell death by 2- or 3-fold (Fig. 4E,
4F). Finally, cleaved CASPASE-3 and PARP levels, which are initiated by MOMP-mediated
CYTOCHROME-C release, were elevated following co-treatment with TTM and any of the
three BH3 mimetics, ABT-737, WEHI-539, and A1210477 (Fig. 4G-J, Supplemental Fig. 5E-G).
As expected, preincubation of A375 or WM88 cells with the irreversible CASPASE-3i Z-
DEVD-FMK blunted the induction of markers of apoptosis in response to the combination of
TTM and ABT-737 (Fig. 4E-H, Supplemental Fig. 5E, 5F). Taken together, these results
revealed that Cu chelation can enhance the apoptotic activity of BH3 mimetics in a CASPASE-
dependent manner in BRAFV600E
-driven melanoma cells.
TTM treatment with ABT-737 sensitizes trametinib or vemurafenib-resistant BRAFV600E
-
positive melanoma cells
on June 19, 2020. © 2020 American Association for Cancer Research. cancerres.aacrjournals.org Downloaded from
Author manuscripts have been peer reviewed and accepted for publication but have not yet been edited. Author Manuscript Published OnlineFirst on January 31, 2020; DOI: 10.1158/0008-5472.CAN-19-1784
12
To interrogate the utility of combining Cu chelation with BH3 mimetics to restore
apoptotic cell death in the setting of MAPKi acquired resistance, we employed BRAFi or
MEK1/2i resistant variants of the BRAFV600E
-mutant cell lines 451-Lu and WM983B (20,21).
Treatment with TTM, trametinib, or vemurafenib reduced the IC50 of ABT-737 in parental 451-
Lu and WM983B cells (Fig. 5A, 5B, Supplemental Fig. 6A, 6B). Whereas in 451-Lu-BRAFiR
and WM983B-BRAFiR
cells, both TTM and trametinib markedly decreased ABT-737 IC50 (Fig.
5C, 5D, Supplemental Fig. 6C, 6D), while only TTM was sufficient to sensitize the MEK1/2i
resistant 451-Lu cells to the BH3 mimetic (Fig. 5E, 5F). Further, co-treatment with TTM and
ABT-737 was the only synergistic combination in both the parental and resistant cell lines based
on Bliss Indexes (Fig. 5G-I, Supplemental Fig. 6E, 6F). As such, TTM treatment enhanced the
efficacy of a BH3 mimetic in the setting of MAPKi resistance.
Combining the Cu chelator and BH3 mimetic in the clinically relevant setting of MAPKi
resistance revealed that the combination was more efficacious than the FDA-approved
combination of vemurafenib and trametinib in both the naïve and MAPKi resistant 451-Lu and
WM983B cells (Fig. 5L-O, Supplemental Fig. 6G-J). In addition, TTM significantly increased
the efficacy of the MAPKis and BH3 mimetic in WM983B cells (Supplemental Fig. 6G, 6H).
Most importantly, TTM treatment significantly improved the efficacy of ABT-737 combined
with the MAPKis in each of the MAPKi resistant BRAF mutation-positive melanoma cells (Fig.
5L-O, Supplemental Fig. 6I, 6J). Thus, Cu chelators may be advantageous in improving the
response to the combination of a BRAFi, MEK1/2i, and BH3 mimetic being tested clinically and
more importantly be an additional treatment option in the context of MAPKi resistance.
TTM dampens the apoptotic threshold in response to BH3 mimetics by limiting anti-
apoptotic protein expression in MAPKi resistant BRAFV600E
-positive melanoma cells
Next, we tested and found in parental cells, MAPK signaling was abrogated by either
TTM or MAPKi treatment, but unlike TTM that significantly decreased the expression of BCL-
W, BCL-XL, and/or MCL1, trametinib failed to impact the levels of BCL2 proteins (Fig. 6A,
Supplemental Fig. 7A). Interestingly, vemurafenib significantly decreased the expression of
BCL2 and BCL-W in 451-Lu cells only (Fig. 6A, Supplemental Fig. 7A). Thus, surprisingly the
pattern of BCL2 protein expression was divergent amongst the 451-Lu or WM983B cells treated
on June 19, 2020. © 2020 American Association for Cancer Research. cancerres.aacrjournals.org Downloaded from
Author manuscripts have been peer reviewed and accepted for publication but have not yet been edited. Author Manuscript Published OnlineFirst on January 31, 2020; DOI: 10.1158/0008-5472.CAN-19-1784

13
with TTM or the MAPKis (Fig. 6A, Supplemental Fig. 7A-C). The BRAFi resistant 451-Lu and
WM983B cells(20,21), which harbor upregulation of receptor tyrosine kinases as a resistance
mechanism, and MEK1/2i resistant 451Lu cells(20,21), which harbor a Q60P activating mutation
in MEK2 and BRAF amplification as a resistance mechanism, displayed elevated MEK1/2 and
ERK1/2 phosphorylation (Fig. 6A-C, Supplemental Fig. 7A-D). Increased MAPK signaling in
the BRAFi resistant variants was dampened by TTM and trametinib treatment but not the mutant
selective BRAFi vemurafenib (Fig. 6B, Supplemental Fig. 7B-D). Of clinical relevance, TTM
treatment of the dual MAPKi resistant 451-Lu cells was sufficient to reduce ERK1/2
phosphorylation, along with BCL-W, BCL-XL, and MCL1 expression, which may explain their
maintained sensitivity to the combination of TTM and ABT-737 in these cells (Fig. 5E, 5F, 6C,
Supplemental Fig. 7D). These findings indicate that the cooperativity between the Cu chelator
and BH3 mimetic in MAPKi resistant BRAF mutation-positive melanoma cells may be driven in
part by diminished anti-apoptotic protein expression.
To address whether the threshold for apoptosis induction is tipped when MAPKi resistant
BRAFV600E
-mutant melanoma cells are treated with the combination of ABT-737 and TTM or a
MAPKi, we measured the percent of apoptotic cells and the levels of markers of apoptosis. Co-
treatment with TTM and ABT-737 significantly elevated the number of annexin-V positive
parental and BRAFi resistant cells, while vemurafenib failed to increase the apoptotic response
of ABT-737 in the 451-Lu BRAFiR and WM983B BRAFi
R cells (Fig. 6D, 6E, Supplemental Fig.
7E, 7F). While the dual combination of trametinib and ABT-737 was sufficient to increase the
percent of apoptotic parental and 451-Lu BRAFiR cells to a similar degree to co-treatment with
TTM and ABT-737, apoptotic cell death was only observed in MEK1/2i resistant 451-Lu cells
when TTM and ABT-737 were co-administered (Fig. 6F). Further, co-treatment of TTM with
ABT-737 was the only combination to result in elevated cleavage of CASPASE-3 and PARP in
both the parental and MAPKi resistant 451-Lu cells (Fig. 6G-I, Supplemental Fig. 7G-I). These
results provide a rationale for a co-treatment strategy with a Cu chelator and BH3 mimetics in
the context of MAPKi-resistant forms of BRAFV600E
melanoma.
Finally, to extend our findings to in vitro models with well-characterized mechanisms of
resistance to MAPKi, A375 cells were engineered to stably expressing the p61BRAFV600E
splice
on June 19, 2020. © 2020 American Association for Cancer Research. cancerres.aacrjournals.org Downloaded from
Author manuscripts have been peer reviewed and accepted for publication but have not yet been edited. Author Manuscript Published OnlineFirst on January 31, 2020; DOI: 10.1158/0008-5472.CAN-19-1784
14
variant, MEK1C121S
, or PDGFR(18). As expected, each protein conveyed resistance to
vemurafenib, while only p61BRAFV600E
and MEK1C121S
imparted resistance to trametinib(18), as
measured by an increase in the IC50 of the inhibitors (Supplemental Fig. 8A, 8B). In contrast,
TTM reduced the number of viable A375 cells expressing these MAPK-dependent drivers of
MAPKi resistance (Supplemental Fig. 8A, 8B). Mechanistically, we previously showed that
TTM treatment elicits a reduction in ERK1/2 phosphorylation in A375 cells stably expressing
either the p61BRAFV600E
splice variant, MEK1C121S
, or PDGFR (18). TTM was the only
compound capable of significantly increasing the cleavage of CASPASE-3 and PARP when
combined with ABT-737 in each cell line (Supplemental Fig. 8C, 8D). In summary, these data
indicate that MAPK-dependent forms of resistance can be countered by a Cu chelator by
mechanistically inhibiting MEK1/2 kinase activity and apoptosis induction can be achieved
when the Cu chelator is combined with BH3 mimetics.
TTM in combination with ABT-263 suppresses growth of naïve and MEK1/2i-resistant
BRAFV600E
-positive melanoma xenografts
To evaluate the therapeutic potential of combining TTM with BH3 mimetics in vivo, we
utilized mouse xenograft tumor models of parental and MAPKi-resistant BRAF mutation-
positive melanoma. Instead of using ABT-737 for in vivo experiments, we evaluated its
clinically relevant, orally available analog navitoclax, ABT-263(36). Mice bearing ~100mm3
A375 or 451-Lu parental tumors were randomly assigned to one of five treatment arms: i)
vehicle, ii) TTM, iii) TTM and ABT-263, iv) BRAFi, MEK1/2i, and ABT-263, and v) BRAFi,
MEK1/2i, ABT-263, and TTM. These treatments arms were prioritized based on their ability to
exam the benefit of combining a Cu chelator and a BH3 mimetic, along with a Cu chelator and
the clinically investigated combination of MAPKis and a BH3 mimetic. The growth of
established xenograft tumors derived from 451-Lu and A375 cells was reduced when mice were
treated with TTM alone and was enhanced when TTM was combined with ABT-263 (Fig. 7A-
F). Further, growth of the parental tumors was severely reduced when mice were treated for 30
days with the combination of MAPKis and ABT-263 and this reduction in A375 tumor growth
was significantly accentuated when TTM was also administered (Fig. 7A-F). While the in vivo
tumor growth response to the combination of MAPKis and ABT-263 was attenuated in BRAFi
resistant 451-Lu cells, the inclusion of TTM delayed tumor growth and significantly improved
on June 19, 2020. © 2020 American Association for Cancer Research. cancerres.aacrjournals.org Downloaded from
Author manuscripts have been peer reviewed and accepted for publication but have not yet been edited. Author Manuscript Published OnlineFirst on January 31, 2020; DOI: 10.1158/0008-5472.CAN-19-1784

15
the time to endpoint tumor volume (Fig. 7G-I). Finally, we demonstrate that xenograft tumors
derived from MEK1/2i resistant 451-Lu cells failed to respond to the combination of MAPKis
and ABT-263, but remained sensitive to TTM and ABT-263 dual treatment, which also
improved the anti-tumorigenic properties of the MAPKis (Fig. 7J-L). The body weights of
mice, monitored as an indicator of drugs toxicity, were similar compared to vehicle group
(Supplemental Fig. 9A-D). In concordance with reduced tumor growth kinetics, co-treatment
with either TTM and ABT-263 or MAPKis and ABT-263 significantly decreased Ki67 positive
staining and increased TUNEL positive staining of parental BRAF-mutant melanoma tumors
(Fig. 7M-T, Supplemental Fig. 9E-L). While the addition of TTM to the combination of the
MAPKis and ABT-263 did not increase tumor cell apoptosis (Fig. 7Q-T, Supplemental Fig. 9I-
L), cell proliferation was dampened in the parental and MAPKi resistant tumors (Fig. 7M-P,
Supplemental Fig. 9E-H). As further evidence of apoptosis, cleaved CASPASE-3 and PARP
were elevated in parental tumor tissues isolated from mice treated with the dual combination of
TTM and ABT-263, the triple combination of MAPKis and ABT-263, and quadruple
combination of TTM, MAPKis, and ABT-263 (Supplemental Fig. 9M, 9N). This observation
was restricted to the MAPKi resistant tumors tissue isolated from mice treated with the
aforementioned dual and quadruple combinations of TTM and ABT-263 (Supplemental Fig. 9O,
9P). Taken together these findings support our conclusion that the efficacy of Cu chelators can
be enhanced with chemical inducers of apoptosis and this combination can cooperate with
MAPKis to reduce tumor cell growth and survival, especially in the context of refractory or
relapsed BRAFV600E
-driven melanoma.
Discussion
Here, we identified several compounds with the capacity to enhance TTM efficacy in
BRAFV600E
-driven melanoma, but focused our efforts on an inhibitor of BCL2 anti-apoptotic
proteins. While the combination of ABT-737 and a BRAFi induces apoptosis in BRAFV600E
-
mutant melanoma cells(52–54), it is not effective in BRAFi resistant cells and required
additional targeted or conventional chemotherapeutics to tip the apoptotic threshold towards cell
death(54). The absence of efficacy achieved with ABT-737 and BRAFi in the context of
resistance may be driven by a unique repertoire of BCL2 proteins in melanocytes(45,46,49–
51,54,56). Additionally, pro-apoptotic BH3-only proteins expression patterns or their different
on June 19, 2020. © 2020 American Association for Cancer Research. cancerres.aacrjournals.org Downloaded from
Author manuscripts have been peer reviewed and accepted for publication but have not yet been edited. Author Manuscript Published OnlineFirst on January 31, 2020; DOI: 10.1158/0008-5472.CAN-19-1784
16
binding affinity to the anti-apoptotic proteins can induce different dependencies on BCL2
proteins(34,45,57). Recently Lee et al. defined that BCL-XL and MCL-1 dual targeting is critical
to blunt melanoma cell survival, but it remains to be determined whether their combination
targeting would reduce MAPKi-resistant melanoma cell viability(58).
Mechanistically, genetic knockdown of BCL-XL, BCL-W, or MCL1, but not BCL2,
revealed that several BCL2 proteins were involved in the synergistic reduction in cell viability
and induction of apoptotic cell death elicited by co-targeting the MAPK pathway with TTM and
anti-apoptotic machinery with BH3 mimetics (Fig. 3, 4, Supplemental Fig. 4, 6). Mechanistically,
the Cu chelator lowered the threshold for apoptotic cell death by limiting the expression of
several BCL2 proteins (Fig. 4, Supplemental Fig. 7). Encouragingly, BRAFV600E
-mutant
melanoma tumor growth was effectively suppressed and controlled when TTM was combined
with ABT-263 without negatively impacting animal welfare, suggesting that Cu chelation could
be added to current efforts to evaluate MAPKi with navitoclax in BRAF mutation-positive
melanoma (NCT01989585) (Fig. 7, Supplemental Fig 9). Our results provide the possibility that
BH3 mimetics can be an effective therapeutic with less adverse effects when dosed with a Cu
chelator based on the synergistic combination, which is not achieved with vemurafenib or
trametinib (Fig. 3, 5, Supplemental Fig. 5). Finally, in the setting of MAPKi-resistant
BRAFV600E
-driven melanoma, TTM in combination with ABT-737 in vitro or ABT-263 in vivo
reduced cell viability, decreased tumor growth kinetics, reduced tumor proliferation, and
triggered apoptotic cell death (Fig. 5, 6, 7, Supplemental Fig. 6-9). These findings highlight a
need for additional exploration of the interplay between Cu-dependent MAPK signaling and
cellular intrinsic apoptotic pathways. Thus, we provide a proof-of-concept that Cu chelation
therapy synergistically improves BH3 mimetic efficacy by inducing apoptosis and supports the
utility of this combination in BRAF mutation-positive melanoma patients that do not respond to
targeted therapy or immunotherapy, have severe side effects, or acquire resistance.
Acknowledgements
We thank J. Villanueva (The Wistar Institute) for cell lines, S. Cherry and D.C. Schultz of the
University of Pennsylvania High-Throughput Screening Core for technical support, I.A.
on June 19, 2020. © 2020 American Association for Cancer Research. cancerres.aacrjournals.org Downloaded from
Author manuscripts have been peer reviewed and accepted for publication but have not yet been edited. Author Manuscript Published OnlineFirst on January 31, 2020; DOI: 10.1158/0008-5472.CAN-19-1784
17
Asangani, L. Busino, T.P. Gade, B.J. Kim, S.W. Ryeom, and E.S. Witze (University of
Pennsylvania) for technical support, discussions, and/or review of the manuscript, and D.
Sneddon for administrative support. This work was supported by the Pew Charitable Trust Pew
Scholars Program in Biomedical Science Award #50359 (D.C. Brady) and by a pilot project
from Tara Miller Foundation at University of Pennsylvania/Wistar Institute supported by Skin
Cancer SPORE Career Enhancement Program Award to D.C. Brady (P50CA16452). T. Tsang is
supported by NCI NRSA Fellowship (F31) F31CA243294. G.R. Anderson is supported by NCI
Predoctoral to Postdoctoral Transition Fellowship (F99/K00) K00CA222728. J.M. Posimo is
supported by American Cancer Society Postdoctoral Fellowship 131203PF1714701CCG. This
work is dedicated in the memory of Maria Whitehead.
References
1. Davies H, Bignell GR, Cox C, Stephens P, Edkins S, Clegg S, et al. Mutations of the BRAF gene
in human cancer. Nature. 2002;417:949–54.
2. Siegel RL, Miller KD, Jemal A. Cancer statistics, 2019. CA Cancer J Clin. 2019;7–34.
3. The Cancer Genome Atlas Network. Genomic Classification of Cutaneous Melanoma. Cell.
2015;161:1681–96.
4. Holderfield M, Deuker MM, McCormick F, McMahon M. Targeting RAF kinases for cancer
therapy: BRAF-mutated melanoma and beyond. Nat Rev Cancer. 2014;14:455–67.
5. Wan PTC, Garnett MJ, Roe SM, Lee S, Niculescu-Duvaz D, Good VM, et al. Mechanism of
activation of the RAF-ERK signaling pathway by oncogenic mutations of B-RAF. Cell.
2004;116:855–67.
6. Flaherty KT, Infante JR, Daud A, Gonzalez R, Kefford RF, Sosman J, et al. Combined BRAF and
MEK Inhibition in Melanoma with BRAF V600 Mutations. N Engl J Med. 2012;367:1694–703.
7. Robert C, Karaszewska B, Schachter J, Rutkowski P, Mackiewicz A, Stroiakovski D, et al.
Improved Overall Survival in Melanoma with Combined Dabrafenib and Trametinib. N Engl J
Med. 2015;372:30–9.
8. Larkin J, Ascierto PA, Dreno B, Atkinson V, Liszkay G, Maio M, et al. Combined vemurafenib
and cobimetinib in BRAF-mutated melanoma. N Engl J Med. 2014;371:1867–76.
9. Long G V., Stroyakovskiy D, Gogas H, Levchenko E, De Braud F, Larkin J, et al. Dabrafenib and
trametinib versus dabrafenib and placebo for Val600 BRAF-mutant melanoma: A multicentre,
double-blind, phase 3 randomised controlled trial. Lancet. 2015;386:444–51.
10. Caunt CJ, Sale MJ, Smith PD, Cook SJ. MEK1 and MEK2 inhibitors and cancer therapy: the long
on June 19, 2020. © 2020 American Association for Cancer Research. cancerres.aacrjournals.org Downloaded from
Author manuscripts have been peer reviewed and accepted for publication but have not yet been edited. Author Manuscript Published OnlineFirst on January 31, 2020; DOI: 10.1158/0008-5472.CAN-19-1784
18
and winding road. Nat Rev Cancer. 2015;15:577–92.
11. Solit DB, Rosen N. Towards a Unified Model of RAF Inhibitor Resistance. Cancer Discov.
2014;4:27–30.
12. Friedman A, Perrimon N. High-throughput approaches to dissecting MAPK signaling pathways.
Methods. 2006;40:262–71.
13. Friedman A, Perrimon N. A functional RNAi screen for regulators of receptor tyrosine kinase and
ERK signalling. Nature. 2006;444:230–4.
14. Turski ML, Brady DC, Kim HJ, Kim B-E, Nose Y, Counter CM, et al. A novel role for copper in
Ras/MAPK signaling. Mol Cell Biol. 2012;32:1284–95.
15. Solit DB, Garraway LA, Pratilas CA, Sawai A, Getz G, Basso A, et al. BRAF mutation predicts
sensitivity to MEK inhibition. Nature. 2006;439:358–62.
16. Brady DC, Crowe MS, Turski ML, Hobbs GA, Yao X, Chaikuad A, et al. Copper is required for
oncogenic BRAF signalling and tumorigenesis. Nature. 2014;509:492–6.
17. Brewer GJ, Askari F, Lorincz MT, Carlson M, Schilsky M, Kluin KJ, et al. Treatment of Wilson
Disease With Ammonium Tetrathiomolybdate. Arch Neurol. 2006;63:521–7.
18. Brady DC, Crowe MS, Greenberg DN, Counter CM. Copper chelation inhibits BRAFV600E-
driven melanomagenesis and counters resistance to BRAFV600E and MEK1/2 inhibitors. Cancer
Res. 2017;77:6240–52.
19. Chan N, Willis A, Kornhauser N, Mward M, Lee SB, Nackos E, et al. Influencing the tumor
microenvironment: A Phase II study of copper depletion using tetrathiomolybdate in patients with
breast cancer at high risk for recurrence and in preclinical models of lung metastases. Clin Cancer
Res. 2017;23:666–76.
20. Villanueva J, Vultur A, Lee JT, Somasundaram R, Fukunaga-Kalabis M, Cipolla AK, et al.
Acquired Resistance to BRAF Inhibitors Mediated by a RAF Kinase Switch in Melanoma Can Be
Overcome by Cotargeting MEK and IGF-1R/PI3K. Cancer Cell. 2010;18:683–95.
21. Villanueva J, Infante JR, Krepler C, Reyes-Uribe P, Samanta M, Chen HY, et al. Concurrent
MEK2 Mutation and BRAF Amplification Confer Resistance to BRAF and MEK Inhibitors in
Melanoma. Cell Rep. 2013;4:1090–9.
22. Foucquier J, Guedj M. Analysis of drug combinations: current methodological landscape.
Pharmacol Res Perspect. 2015;3:e00149.
23. Hamad NM, Elconin JH, Karnoub AE, Bai W, Rich JN, Abraham RT, et al. Distinct requirements
for Ras oncogenesis in human versus mouse cells. Genes Dev. 2002;16:2045–57.
24. Vermes I, Haanen C, Steffens-Nakken H, Reutelingsperger C. A novel assay for apoptosis. Flow
cytometric detection of phosphatidylserine expression on early apoptotic cells using fluorescein
on June 19, 2020. © 2020 American Association for Cancer Research. cancerres.aacrjournals.org Downloaded from
Author manuscripts have been peer reviewed and accepted for publication but have not yet been edited. Author Manuscript Published OnlineFirst on January 31, 2020; DOI: 10.1158/0008-5472.CAN-19-1784

19
labelled Annexin V. J Immunol Methods. 1995;184:39–51.
25. Nicholson DW, Ali A, Thornberry NA, Vaillancourt JP, Ding CK, Gallant M, et al. Identification
and inhibition of the ICE/CED-3 protease necessary for mammalian apoptosis. Nature.
1995;376:37–43.
26. Li P, Nijhawan D, Budihardjo I, Srinivasula SM, Ahmad M, Alnemri ES, et al. Cytochrome c and
dATP-dependent formation of Apaf-1/caspase-9 complex initiates an apoptotic protease cascade.
Cell. 1997;91:479–89.
27. Chipuk JE, Moldoveanu T, Llambi F, Parsons MJ, Green DR. The BCL-2 family reunion. Mol
Cell. 2010;37:299–310.
28. Boise LH, González-García M, Postema CE, Ding L, Lindsten T, Turka LA, et al. bcl-x, a bcl-2-
related gene that functions as a dominant regulator of apoptotic cell death. Cell. 1993;74:597–608.
29. Gibson L, Holmgreen SP, Huang DC, Bernard O, Copeland NG, Jenkins NA, et al. bcl-w, a novel
member of the bcl-2 family, promotes cell survival. Oncogene. 1996;13:665–75.
30. Kozopas KM, Yang T, Buchan HL, Zhou P, Craig RW. MCL1, a gene expressed in programmed
myeloid cell differentiation, has sequence similarity to BCL2. Proc Natl Acad Sci U S A.
1993;90:3516–20.
31. Oltvai ZN, Milliman CL, Korsmeyer SJ. Bcl-2 heterodimerizes in vivo with a conserved homolog,
Bax, that accelerates programmed cell death. Cell. 1993;74:609–19.
32. Chittenden T, Flemington C, Houghton AB, Ebb RG, Gallo GJ, Elangovan B, et al. A conserved
domain in Bak, distinct from BH1 and BH2, mediates cell death and protein binding functions.
EMBO J. 1995;14:5589–96.
33. O’Connor L, Strasser A, O’Reilly LA, Hausmann G, Adams JM, Cory S, et al. Bim: a novel
member of the Bcl-2 family that promotes apoptosis. EMBO J. 1998;17:384–95.
34. Letai AG. Diagnosing and exploiting cancer’s addiction to blocks in apoptosis. Nat Rev Cancer.
2008;8:121–32.
35. Delbridge ARD, Strasser A. The BCL-2 protein family, BH3-mimetics and cancer therapy. Cell
Death Differ. 2015;22:1071–80.
36. Tse C, Shoemaker AR, Adickes J, Anderson MG, Chen J, Jin S, et al. ABT-263: A potent and
orally bioavailable Bcl-2 family inhibitor. Cancer Res. 2008;68:3421–8.
37. Oltersdorf T, Elmore SW, Shoemaker AR, Armstrong RC, Augeri DJ, Belli BA, et al. An inhibitor
of Bcl-2 family proteins induces regression of solid tumours. Nature. 2005;435:677–81.
38. Souers AJ, Leverson JD, Boghaert ER, Ackler SL, Catron ND, Chen J, et al. ABT-199, a potent
and selective BCL-2 inhibitor, achieves antitumor activity while sparing platelets. Nat Med.
2013;19:202–8.
on June 19, 2020. © 2020 American Association for Cancer Research. cancerres.aacrjournals.org Downloaded from
Author manuscripts have been peer reviewed and accepted for publication but have not yet been edited. Author Manuscript Published OnlineFirst on January 31, 2020; DOI: 10.1158/0008-5472.CAN-19-1784
20
39. Lessene G, Czabotar PE, Sleebs BE, Zobel K, Lowes KN, Adams JM, et al. Structure-guided
design of a selective BCL-XL inhibitor. Nat Chem Biol. 2013;9:390–7.
40. Leverson JD, Zhang H, Chen J, Tahir SK, Phillips DC, Xue J, et al. Potent and selective small-
molecule MCL-1 inhibitors demonstrate on-target cancer cell killing activity as single agents and
in combination with ABT-263 (navitoclax). Cell Death Dis. 2015;6:e1590.
41. Davids MS, Seymour JF, Gerecitano JF, Kahl BS, Pagel JM, Wierda WG, et al. Phase I study of
ABT-199 (GDC-0199) in patients with relapsed/refractory (R/R) non-Hodgkin lymphoma (NHL):
Responses observed in diffuse large B-cell (DLBCL) and follicular lymphoma (FL) at higher
cohort doses. J Clin Oncol. 2017;32:8522.
42. Konopleva M, Pollyea DA, Potluri J, Chyla B, Hogdal L, Busman T, et al. Efficacy and Biological
Correlates of Response in a Phase II Study of Venetoclax Monotherapy in Patients with Acute
Myelogenous Leukemia. Cancer Discov. 2016;6:1106–17.
43. Vogler M, Dinsdale D, Dyer MJS, Cohen GM. ABT‐199 selectively inhibits BCL2 but not
BCL2L1 and efficiently induces apoptosis of chronic lymphocytic leukaemic cells but not
platelets. Br J Haematol. 2013;163:139–42.
44. Seymour JF, Davids MS, Pagel JM, Kahl BS, Wierda WG, Miller TP, et al. Bcl-2 Inhibitor ABT-
199 (GDC-0199) Monotherapy Shows Anti-Tumor Activity Including Complete Remissions In
High-Risk Relapsed/Refractory (R/R) Chronic Lymphocytic Leukemia (CLL) and Small
Lymphocytic Lymphoma (SLL). Blood. 2013;122:872.
45. Soderquist RS, Crawford L, Liu E, Lu M, Agarwal A, Anderson GR, et al. Systematic mapping of
BCL-2 gene dependencies in cancer reveals molecular determinants of BH3 mimetic sensitivity.
Nat Commun. 2018;9:3513.
46. Anvekar RA, Asciolla JJ, Missert DJ, Chipuk JE. Born to be Alive: A Role for the BCL-2 Family
in Melanoma Tumor Cell Survival, Apoptosis, and Treatment. Front Oncol. 2011;1:pii:
fonc.2011.00034.
47. Gautschi O, Tschopp S, Olie RA, Leech SH, Simões-Wüst AP, Ziegler A, et al. Activity of a novel
bcl-2/bcl-xL-bispecific antisense oligonucleotide against tumors of diverse histologic origins. J
Natl Cancer Inst. 2001;93:463–71.
48. Del Bufalo D, Trisciuoglio D, Scarsella M, Zangemeister-Wittke U, Zupi G. Treatment of
melanoma cells with a bcl-2/bcl-xL antisense oligonucleotide induces antiangiogenic activity.
Oncogene. 2003;22:8441–7.
49. Thallinger C, Wolschek MF, Wacheck V, Maierhofer H, Gunsberg P, Polterauer P, et al. Mcl-1
Antisense Therapy Chemosensitizes Human Melanoma in a SCID Mouse Xenotransplantation
Model. J Invest Dermatol. 2003;120:1081–6.
on June 19, 2020. © 2020 American Association for Cancer Research. cancerres.aacrjournals.org Downloaded from
Author manuscripts have been peer reviewed and accepted for publication but have not yet been edited. Author Manuscript Published OnlineFirst on January 31, 2020; DOI: 10.1158/0008-5472.CAN-19-1784
21
50. Keuling AM, Felton KEA, Parker AAM, Akbari M, Andrew SE, Tron VA. RNA Silencing of
Mcl-1 Enhances ABT-737-Mediated Apoptosis in Melanoma: Role for a Caspase-8-Dependent
Pathway. PLoS One. 2009;4:e6651.
51. Nguyen M, Marcellus RC, Roulston A, Watson M, Serfass L, Madiraju SRM, et al. Small
molecule obatoclax (GX15-070) antagonizes MCL-1 and overcomes MCL-1-mediated resistance
to apoptosis. Proc Natl Acad Sci U S A. 2007;104:19512–7.
52. Cragg MS, Jansen ES, Cook M, Harris C, Strasser A, Scott CL. Treatment of B-RAF mutant
human tumor cells with a MEK inhibitor requires Bim and is enhanced by a BH3 mimetic. J Clin
Invest. 2008;118:3651–9.
53. Serasinghe MN, Missert DJ, Asciolla JJ, Podgrabinska S, Wieder SY, Izadmehr S, et al. Anti-
apoptotic BCL-2 proteins govern cellular outcome following B-RAF(V600E) inhibition and can
be targeted to reduce resistance. Oncogene. 2015;34:857–67.
54. Wroblewski D, Mijatov B, Mohana-Kumaran N, Lai F, Gallagher SJ, Haass NK, et al. The BH3-
mimetic ABT-737 sensitizes human melanoma cells to apoptosis induced by selective BRAF
inhibitors but does not reverse acquired resistance. Carcinogenesis. 2013;34:237–47.
55. McGill GG, Horstmann M, Widlund HR, Du J, Motyckova G, Nishimura EK, et al. Bcl2
regulation by the melanocyte master regulator Mitf modulates lineage survival and melanoma cell
viability. Cell. 2002;109:707–18.
56. Tang L, Tron VA, Reed JC, Mah KJ, Krajewska M, Li G, et al. Expression of apoptosis regulators
in cutaneous malignant melanoma. Clin Cancer Res. 1998;4:1865–71.
57. Certo M, Del Gaizo Moore V, Nishino M, Wei G, Korsmeyer S, Armstrong SA, et al.
Mitochondria primed by death signals determine cellular addiction to antiapoptotic BCL-2 family
members. Cancer Cell. 2006;9:351–65.
58. Lee EF, Harris TJ, Tran S, Evangelista M, Arulananda S, John T, et al. BCL-XL and MCL-1 are
the key BCL-2 family proteins in melanoma cell survival. Cell Death Dis. 2019;10:342.
on June 19, 2020. © 2020 American Association for Cancer Research. cancerres.aacrjournals.org Downloaded from
Author manuscripts have been peer reviewed and accepted for publication but have not yet been edited. Author Manuscript Published OnlineFirst on January 31, 2020; DOI: 10.1158/0008-5472.CAN-19-1784
22
Figure legends
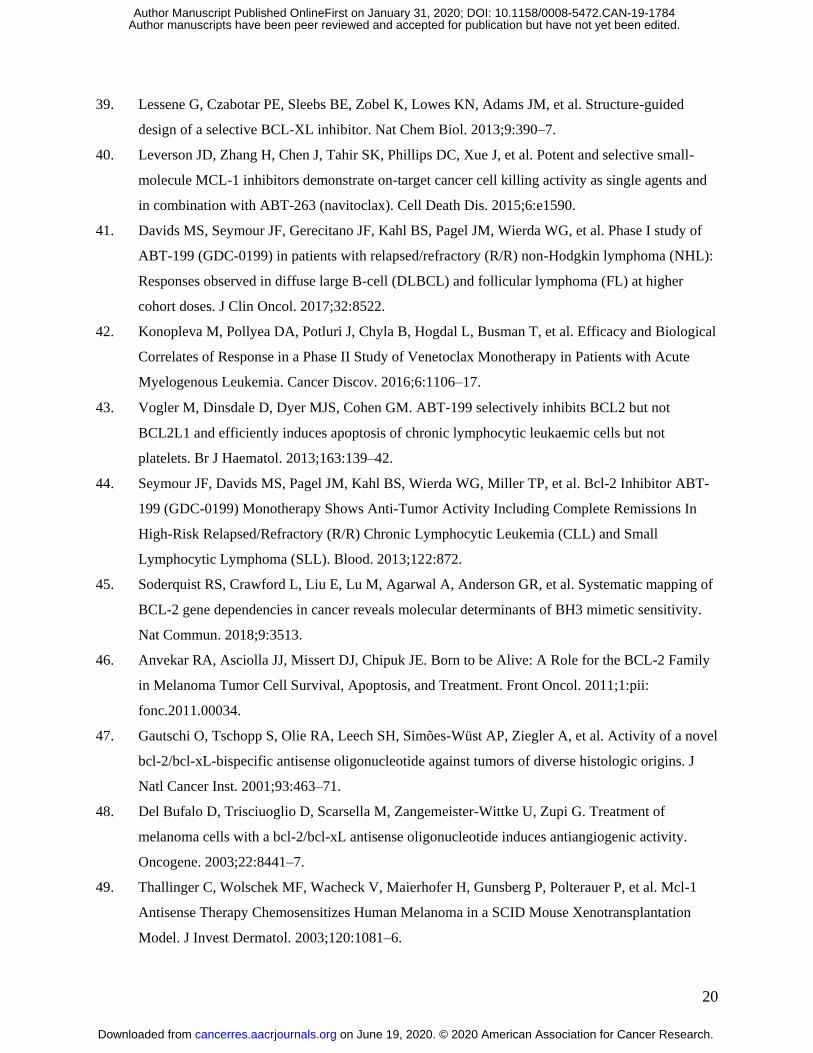
Figure 1. TTM reduces MAPK pathway activation and viability without inducing apoptosis
in BRAFV600E
-positive melanoma cells. A,B,C,D, Relative CellTiter-Glo cell viability ±
s.e.m. of indicated cells treated with indicated concentrations of tetrathiolmolybdate (TTM). n=3.
E, Scatter dot plot of TTM IC50 in indicated cell lines ± s.e.m. F,G,H,I, Representative flow
cytometry graphs and scatter dot plots of flow cytometry analysis of Annexin V-FITC and
Propidium Iodide ± s.e.m. from indicated cell lines treated with vehicle (VEH) or TTM. n=3.
J,K,L,M, Immunoblot detection of phosphorylated (P)-ERK1/2, total (T)-ERK1/2, Cleaved
(Clv.) CASPASE-3, CASPASE-3, Clv. PARP, PARP, and -actin from indicated cells treated
with vehicle or TTM. n=3. Quantification: P-ERK1/2/T-ERK1/2 normalized to vehicle control
and fold change Clv. CASPASE-3/CASPASE-3 and Clv. PARP/PARP.
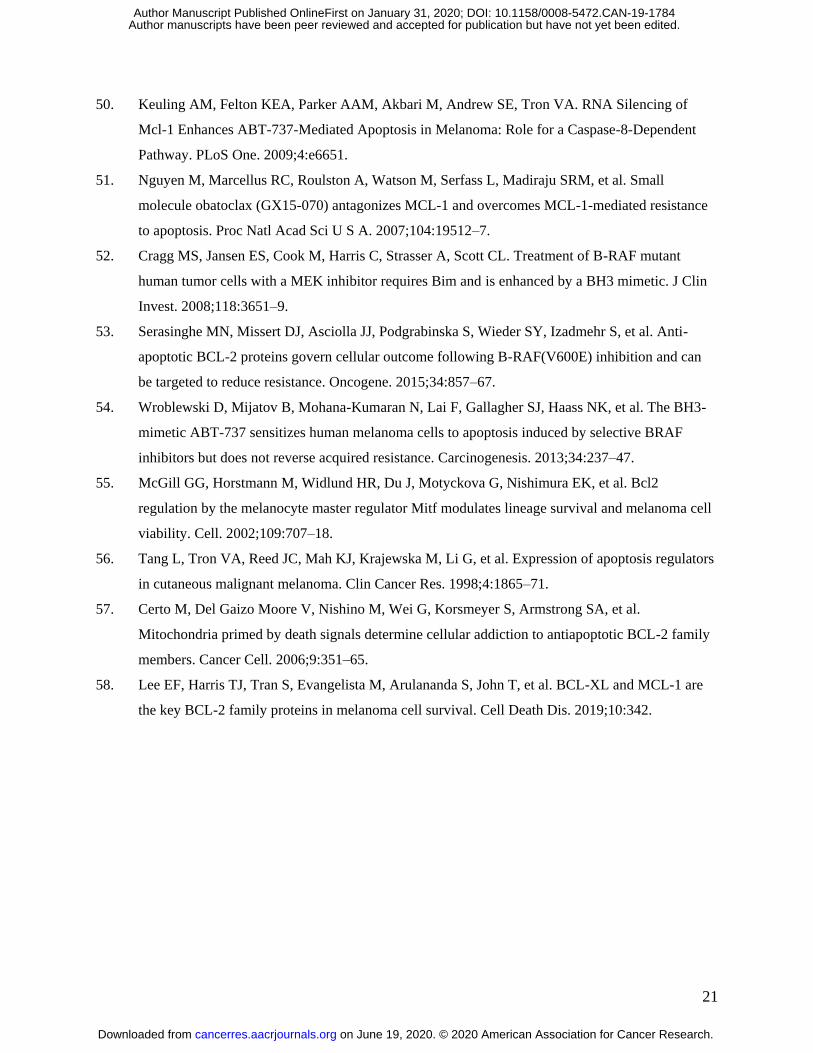
Figure 2. High throughput screen of bioactive compound library reveals BH3 mimetics as a
synergistic combination with TTM in BRAFV600E
-positive melanoma cells. A, Schematic
diagram of high throughput screen of 2123 Selleckchem bioactive compound library at 100nM
alone or in combination with the IC20 of TTM (dashed red line) in A375 or WM88. B,C,
Normalized Percent Inhibition (NPI) of TTM + Compound versus NPI Compound graph for
indicated cells treated with Selleckchem bioactive compound library alone or in combination
with IC20 of TTM. Hits (blue circles) are defined as NPI TTM + Compound 20 (dashed red
line). D,E, Observed effect versus expected effect graph for indicated cells of Hits from B and
C. Hits (blue circles) are defined as Bliss Index 1.5 (dashed red line). F,G, Graphical
representation of Hits defined as NPI TTM + Compound 20 and Bliss Index 1.5 in indicated
cells. H, Venn diagram relationship between Compound Hits. I, NPI of 5 overlapping Hit
Compounds from H alone or in combination with IC20 of TTM (dashed red line). J,K, Scatter
dot plot of %ATP normalized to VEH ± s.e.m. of indicated cells treated with vehicle or
indicated concentrations of drugs. L,M,N,O, Scatter dot plot of %ATP normalized to VEH ±
s.e.m. of indicated cells treated with VEH or indicated concentrations of drugs. Results were
compared using a one-way ANOVA followed by a Tukey’s multi-comparisons test. One asterisk,
P<0.05, Two asterisks, P<0.01, Three asterisks, P<0.001, Four asterisks, P<0.0001. n=3.
on June 19, 2020. © 2020 American Association for Cancer Research. cancerres.aacrjournals.org Downloaded from
Author manuscripts have been peer reviewed and accepted for publication but have not yet been edited. Author Manuscript Published OnlineFirst on January 31, 2020; DOI: 10.1158/0008-5472.CAN-19-1784
23
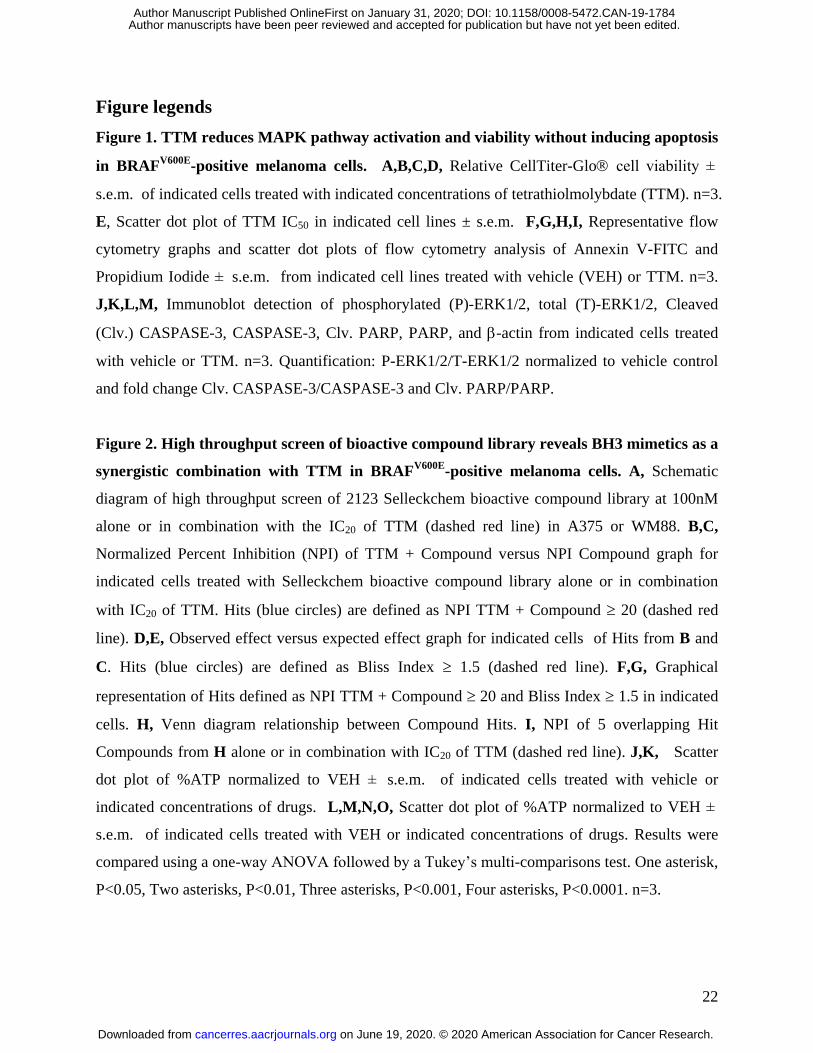
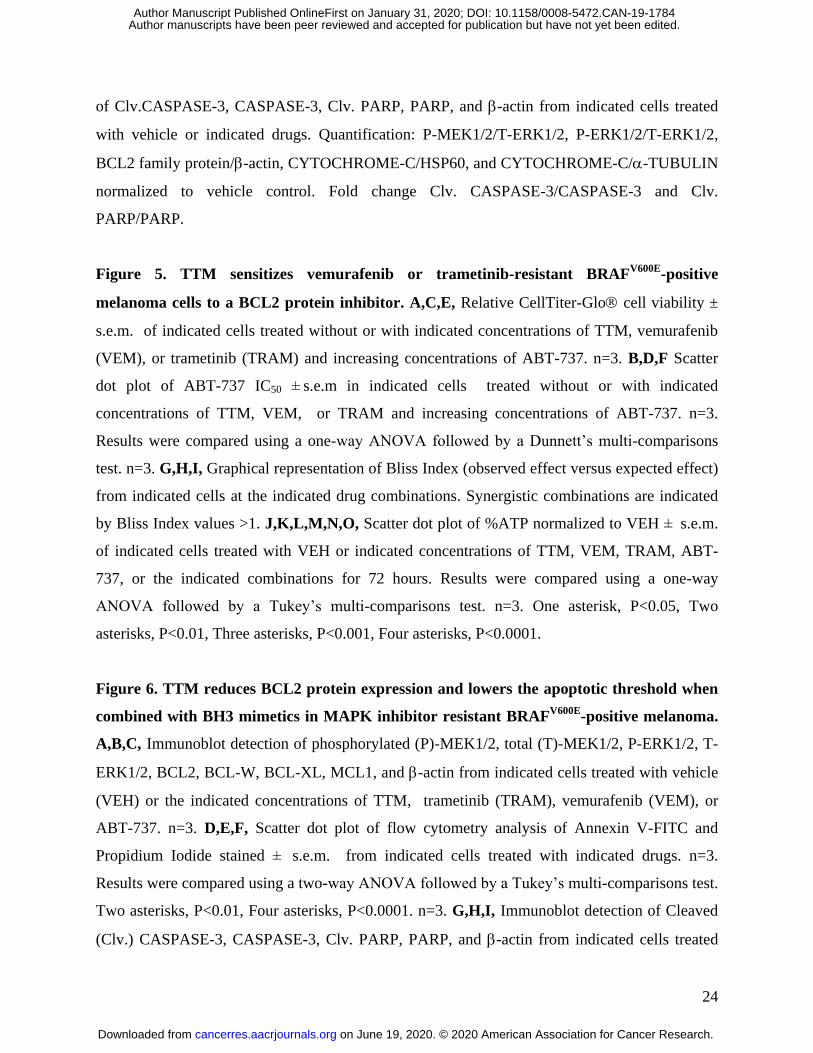
Figure 3. Targeting select BCL2 family proteins increases sensitivity to TTM in
BRAFV600E
-positive melanoma. A,C, Relative CellTiter-Glo cell viability ± s.e.m. of
indicated cells stably expressing two independent Dox-inducible shRNAs (#1 and #2) against
indicated genes treated with indicated concentrations of TTM without or with Dox n=3. B,D,
Scatter dot plot of TTM IC50 ± s.e.m in indicated cells cells stably expressing two independent
Dox-inducible shRNAs against indicated genes treated without or with Dox. Results were
compared using a two-way ANOVA followed by a Sidak’s multi-comparisons test. Three
asterisks, P<0.001, Four asterisks, P<0.0001. n=3. E,G, Relative CellTiter-Glo cell viability ±
s.e.m. of indicated cells treated without or with indicated concentrations of TTM and increasing
concentrations of indicated BH3 mimetics. n=3. F,H, Scatter dot plot of BH3 mimetic IC50
± s.e.m in indicated cells treated without or with indicated concentrations of TTM and increasing
concentrations of indicated BH3 mimetics. n=3. Results were compared using a two-way
ANOVA followed by a Tukey’s multi-comparisons test. n=3. I,J, Graphical representation of
Bliss Index (observed effect versus expected effect) from A375 (E) and WM88 (G) at the
indicated drug combinations. Synergistic combinations are indicated by Bliss Index values >1.
Two asterisks, P<0.01, Three asterisks, P<0.001, Four asterisks, P<0.0001.
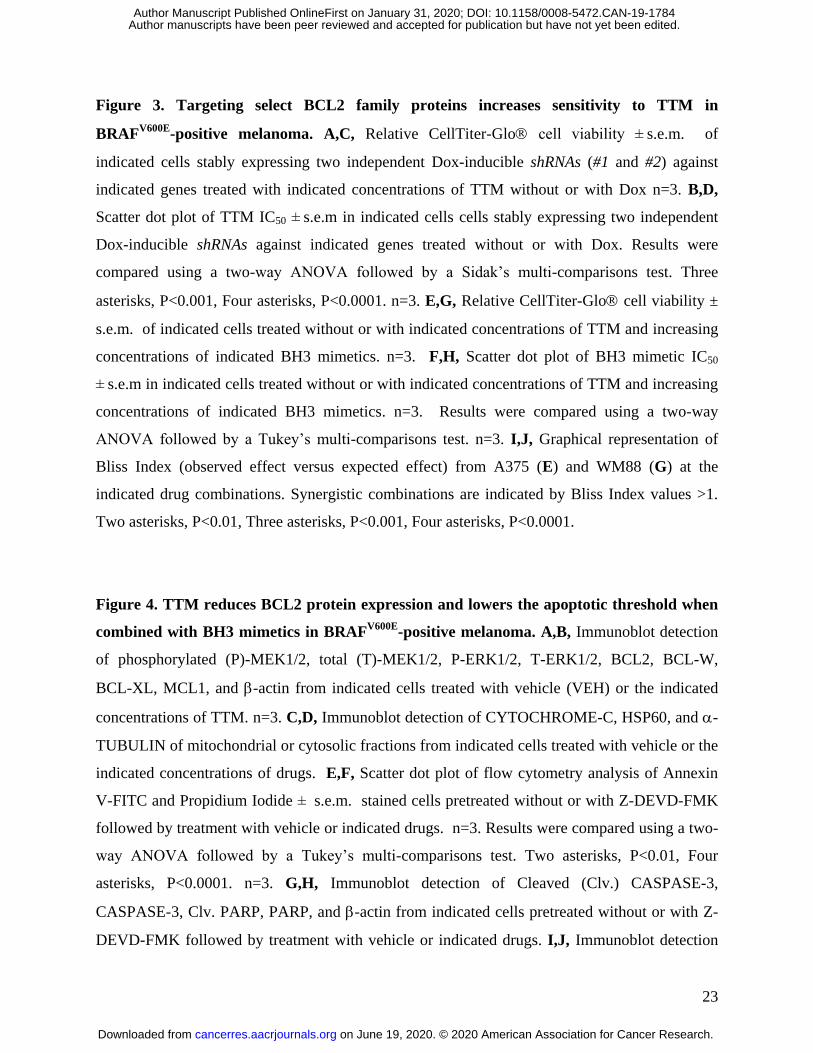
Figure 4. TTM reduces BCL2 protein expression and lowers the apoptotic threshold when
combined with BH3 mimetics in BRAFV600E
-positive melanoma. A,B, Immunoblot detection
of phosphorylated (P)-MEK1/2, total (T)-MEK1/2, P-ERK1/2, T-ERK1/2, BCL2, BCL-W,
BCL-XL, MCL1, and -actin from indicated cells treated with vehicle (VEH) or the indicated
concentrations of TTM. n=3. C,D, Immunoblot detection of CYTOCHROME-C, HSP60, and -
TUBULIN of mitochondrial or cytosolic fractions from indicated cells treated with vehicle or the
indicated concentrations of drugs. E,F, Scatter dot plot of flow cytometry analysis of Annexin
V-FITC and Propidium Iodide ± s.e.m. stained cells pretreated without or with Z-DEVD-FMK
followed by treatment with vehicle or indicated drugs. n=3. Results were compared using a two-
way ANOVA followed by a Tukey’s multi-comparisons test. Two asterisks, P<0.01, Four
asterisks, P<0.0001. n=3. G,H, Immunoblot detection of Cleaved (Clv.) CASPASE-3,
CASPASE-3, Clv. PARP, PARP, and -actin from indicated cells pretreated without or with Z-
DEVD-FMK followed by treatment with vehicle or indicated drugs. I,J, Immunoblot detection
on June 19, 2020. © 2020 American Association for Cancer Research. cancerres.aacrjournals.org Downloaded from
Author manuscripts have been peer reviewed and accepted for publication but have not yet been edited. Author Manuscript Published OnlineFirst on January 31, 2020; DOI: 10.1158/0008-5472.CAN-19-1784
24
of Clv.CASPASE-3, CASPASE-3, Clv. PARP, PARP, and -actin from indicated cells treated
with vehicle or indicated drugs. Quantification: P-MEK1/2/T-ERK1/2, P-ERK1/2/T-ERK1/2,
BCL2 family protein/-actin, CYTOCHROME-C/HSP60, and CYTOCHROME-C/-TUBULIN
normalized to vehicle control. Fold change Clv. CASPASE-3/CASPASE-3 and Clv.
PARP/PARP.
Figure 5. TTM sensitizes vemurafenib or trametinib-resistant BRAFV600E
-positive
melanoma cells to a BCL2 protein inhibitor. A,C,E, Relative CellTiter-Glo cell viability ±
s.e.m. of indicated cells treated without or with indicated concentrations of TTM, vemurafenib
(VEM), or trametinib (TRAM) and increasing concentrations of ABT-737. n=3. B,D,F Scatter
dot plot of ABT-737 IC50 ± s.e.m in indicated cells treated without or with indicated
concentrations of TTM, VEM, or TRAM and increasing concentrations of ABT-737. n=3.
Results were compared using a one-way ANOVA followed by a Dunnett’s multi-comparisons
test. n=3. G,H,I, Graphical representation of Bliss Index (observed effect versus expected effect)
from indicated cells at the indicated drug combinations. Synergistic combinations are indicated
by Bliss Index values >1. J,K,L,M,N,O, Scatter dot plot of %ATP normalized to VEH ± s.e.m.
of indicated cells treated with VEH or indicated concentrations of TTM, VEM, TRAM, ABT-
737, or the indicated combinations for 72 hours. Results were compared using a one-way
ANOVA followed by a Tukey’s multi-comparisons test. n=3. One asterisk, P<0.05, Two
asterisks, P<0.01, Three asterisks, P<0.001, Four asterisks, P<0.0001.
Figure 6. TTM reduces BCL2 protein expression and lowers the apoptotic threshold when
combined with BH3 mimetics in MAPK inhibitor resistant BRAFV600E
-positive melanoma.
A,B,C, Immunoblot detection of phosphorylated (P)-MEK1/2, total (T)-MEK1/2, P-ERK1/2, T-
ERK1/2, BCL2, BCL-W, BCL-XL, MCL1, and -actin from indicated cells treated with vehicle
(VEH) or the indicated concentrations of TTM, trametinib (TRAM), vemurafenib (VEM), or
ABT-737. n=3. D,E,F, Scatter dot plot of flow cytometry analysis of Annexin V-FITC and
Propidium Iodide stained ± s.e.m. from indicated cells treated with indicated drugs. n=3.
Results were compared using a two-way ANOVA followed by a Tukey’s multi-comparisons test.
Two asterisks, P<0.01, Four asterisks, P<0.0001. n=3. G,H,I, Immunoblot detection of Cleaved
(Clv.) CASPASE-3, CASPASE-3, Clv. PARP, PARP, and -actin from indicated cells treated
on June 19, 2020. © 2020 American Association for Cancer Research. cancerres.aacrjournals.org Downloaded from
Author manuscripts have been peer reviewed and accepted for publication but have not yet been edited. Author Manuscript Published OnlineFirst on January 31, 2020; DOI: 10.1158/0008-5472.CAN-19-1784
25
with vehicle, TTM, TRAM, VEM, and/or ABT-737. Quantification: Quantification: P-
MEK1/2/T-ERK1/2, P-ERK1/2/T-ERK1/2, or BCL2 family protein/-actin, normalized to
vehicle control. Fold change Clv. CASPASE-3/CASPASE-3 and Clv. PARP/PARP.
Figure 7. Cotreatment with TTM and ABT-263 suppresses in vivo growth of parental and
MAPK inhibitor resistant BRAFV600E
-positive melanoma. A,D,G,J, Mean tumor volume
(mm3) ± s.e.m. versus time (days) in mice (n=5 or 6) injected with indicated cells and treated
with indicated drugs until tumor volume 1.0cm3 or for 30 days. B,E,H,K, Kaplan-Meier analysis
of percentage of mice (n=5 or 6) with tumor volume ≥ 1.0cm3 versus time injected with indicated
cells treated with indicated drugs. C,F, Scatter dot plot of tumor volume (mm3) ± s.e.m. at
endpoint of 1.0cm3 or at 30 days in mice (n=5 or 6) injected with indicated cells and treated with
indicated drugs. Results were compared using unpaired student’s t-test. n=5 or 6. I,L, Scatter
dot plot of days to endpoint tumor volume ± s.e.m. of 1.0cm3 or 30 days of mice (n=5 or 6)
injected with indicated cells treated with indicated drugs. Results were compared using unpaired
student’s t-test. n=5 or 6. M,N,O,P,Q,R,S,T Scatter dot plot of percent (%) Ki67 or TUNEL
positive cells per tumor ± s.e.m. from mice injected with indicated cells treated with indicated
drugs. Results were compared using unpaired student’s t-test. n=5 or 6. One asterisk, P<0.05,
Two asterisks, P<0.01, Three asterisks, P<0.001, Four asterisks, P<0.0001. n=5 or 6.
on June 19, 2020. © 2020 American Association for Cancer Research. cancerres.aacrjournals.org Downloaded from
Author manuscripts have been peer reviewed and accepted for publication but have not yet been edited. Author Manuscript Published OnlineFirst on January 31, 2020; DOI: 10.1158/0008-5472.CAN-19-1784

0
5
10
15
TTM
IC50
(μM
)
K A375TTM (μM): 0 10 5 2.5 1
P-ERK1/2
T-ERK1/2
Clv. CASPASE-3
CASPASE-3
Clv. PARP
PARP
β−ACTIN
WM880 20 10 5 1
1917
116
89
β−ACTIN
P-ERK1/2
T-ERK1/2
Clv. CASPASE-3
CASPASE-3
Clv. PARP
PARP
TTM (μM):L
AA 451-Lu
0.0 0.5 1.0 1.5 2.00
50
100
150
Log[TTM(μM)]
% A
TP
(Nor
mal
ized
to D
MS
O)
0.0 0.5 1.0 1.5 2.00
50
100
150
Log[TTM(μM)]
% A
TP
(Nor
mal
ized
to D
MSO
)
B A375
0.0 0.5 1.0 1.5 2.00
50
100
150
Log[TTM(μM)]
% A
TP
(Nor
mal
ized
to D
MS
O)
C WM88 D WM983B
0.0 0.5 1.0 1.5 2.00
50
100
150
Log[TTM(μM)]
% A
TP
(Nor
mal
ized
to D
MS
O)
E
451-L
uA37
5WM88
WM983B
F
Annexin-V FITC
VEH TTM (12.5μM)
Pro
pidi
um Io
dide
451-Lu
H
Annexin-V FITC
VEH TTM (10μM)
Pro
pidi
um Io
dide
WM88
G
Annexin-V FITC
VEH TTM (5μM)
Pro
pidi
um Io
dide
A375
II
Annexin-V FITC
VEH TTM (12.5μM)
Pro
pidi
um Io
dide
WM983B
J 451-LuTTM (μM): 0 30 15 7.5 3.25
β−ACTIN
P-ERK1/2
T-ERK1/2
19
17Clv. CASPASE-3
CASPASE-3
Clv. PARP
116
89PARP
19
17
116
89
P-ERK1/2
T-ERK1/2
Clv. CASPASE-3
CASPASE-3
Clv. PARP
PARP
β−ACTIN
WM983BTTM (μM):
M
19
17
116
89
0 30 15 7.5 3.25
05
101520253035
Ann
exin
V-p
ositi
ve (%
)
TTM
VEH
0
5
10
Ann
exin
V-p
ositi
ve (%
)
TTM
VEH
0.0
2.5
5.0
Ann
exin
V-p
ositi
ve (%
)
TTM
VEH
0
5
10
Ann
exin
V-p
ositi
ve (%
)
TTM
VEH
Clv. CAS-3/CAS-3 0.1 1.0 0.3 0.3 0.3
Clv. PARP/PARP 0.1 0.8 0.1 0.1 0.1
Clv. CAS-3/CAS-3 0.1 1.7 0.4 0.1 0.0
Clv. PARP/PARP 0.3 0.6 0.3 0.3 0.3
Fold 1.0 0.6 0.8 0.8 1.0 Fold 1.0 0.2 0.5 0.7 1.0
Fold 1.0 0.5 1.1 1.3 1.1
Clv. CAS-3/CAS-3 0.0 0.0 0.0 0.0 0.0
Clv. PARP/PARP 0.2 0.3 0.1 0.1 0.1
Fold 1.0 0.4 0.4 0.6 0.8
Clv. CAS-3/CAS-3 0.3 1.3 0.5 0.2 0.1
Clv. PARP/PARP 0.2 0.8 0.1 0.1 0.1
Figure 1
on June 19, 2020. © 2020 American Association for Cancer Research. cancerres.aacrjournals.org Downloaded from
Author manuscripts have been peer reviewed and accepted for publication but have not yet been edited. Author Manuscript Published OnlineFirst on January 31, 2020; DOI: 10.1158/0008-5472.CAN-19-1784

-2 -1 0 1 2 30
50
100
150
Log [TTM(μM)]
% A
TP
(Nor
mal
ized
to D
MSO
)
A375WM88
0
50
100
150
% A
TP
(Nor
mal
ized
to D
MSO
) ***********
**
-20
0
20
40
60
NPI
A375 NPI COMPOUNDA375 NPI COMPOUND + TTMWM88 NPI COMPOUNDWM88 NPI COMPOUND +TTM
-1.5 -1.0 -0.5 0.5 1.0 1.5
-1.5-1.0-0.5
0.51.01.5
EXPECTED EFFECT
OB
SE
RV
ED
EF
FE
CT
-100 -50 50 100
-100
-50
50
100
NPI COMPOUND
NP
I TTM
+ C
OM
PO
UN
D
A
+
100nM
TTM IC20
A375
F A375
I
WM88G
WM88Total=2123
11.59% CANCER1.84% ENDOCRINE4.57% EPIGENETIC13.19% GPCR3.67% ION CHANNEL17.57% KINASE3.91% METABOLISM8.10% MICROBIOLOGY32.93% OTHER2.64% PROTEASE
B
-100 -50 50 100
-100
-50
50
100
NPI COMPOUND
NP
I TTM
+ C
OM
PO
UN
D A375 C WM88 D
-1.5 -1.0 -0.5 0.5 1.0 1.5
-1.5-1.0-0.5
0.51.01.5
EXPECTED EFFECT
OB
SE
RV
ED
EF
FE
CT E
Total=50
8.00% CANCER10.00% EPIGENETIC18.00% KINASE12.00% METABOLISM46.00% OTHER6.00% MICROBIOLOGY
Total=233
16.31% CANCER3.43% ENDOCRINE3.43% EPIGENETIC18.88% GPCR3.00% ION CHANNEL11.59% KINASE5.58% METABOLISM7.30% MICROBIOLOGYOTHERPROTEASE
J
A375 WM88H
5 23350Compound
Hits
Compound
Hits
NPI TTM + Compound: > 20Bliss Index: > 1.5
0
50
100
150
% A
TP
(Nor
mal
ized
to D
MSO
) ************
****
A375 WM88K
ABT-737
FOSAPREPITANT
FOSCARNET SODIUM
ICARIIN
TTM IC 50 (7
.69μM
)VEH
ABT-737
(100
nM)
TTM IC 20 (0
.85μM
)
TTM IC 50 +
ABT-737
TTM IC 50 (1
1.85μ
M)VEH
ABT-737
(100
nM)
TTM IC 20 (3
.9μM)
TTM IC 20 +
ABT-737
TTM IC 50 +
ABT-737
TTM IC 20 +
ABT-737
0
50
100
150
%AT
P (N
orm
alize
d to
DMS
O)
L
0
50
100
150
%AT
P (N
orm
alize
d to
DMS
O)
TTM IC20 (0.85μM):
ABT-737 IC20 (5.09μM):
VEM IC20 (0.15μM):TRAM IC20 (50nM):
+- -- - - + + + +- - --- -+ - + - + - ++ - +-- +- - + - - + +- + +-- -- + - + + + ++ + +
A375 M
0
50
100
150
%AT
P (N
orm
alize
d to
DMS
O)
A375
O WM88
****
***********
************ * ***
0
50
100
150
%AT
P (N
orm
alize
d to
DMS
O)
N
TTM IC20 (3.9μM):
ABT-737 IC20 (6.72μM):
VEM IC20 (0.19μM):TRAM IC20 (26nM):
WM88****
****
*****
******** ****
*****
*
****
******
***
*
****************
****
**********
****
DIMEGLUMINE SALT
HYDRO-
CHLOROTHIAZIDE
ABT-737 IC50 (20.36μM):
VEM IC50 (0.46μM):TTM IC50 (7.69μM):
TRAM IC50 (90nM):
+- -- - - + + + +- - --- -+ - + - + - ++ - +-- +- - + - - + +- + +-- -- + - + + + ++ + +
+- -- - - + + + +- - --- -+ - + - + - ++ - +-- +- - + - - + +- + +-- -- + - + + + ++ + +
TTM IC50 (11.85μM):
ABT-737 IC50 (26.86μM):
VEM IC50 (0.48μM):TRAM IC50 (65nM):
+- -- - - + + + +- - --- -+ - + - + - ++ - +-- +- - + - - + +- + +-- -- + - + + + ++ + +
Figure 2
on June 19, 2020. © 2020 American Association for Cancer Research. cancerres.aacrjournals.org Downloaded from
Author manuscripts have been peer reviewed and accepted for publication but have not yet been edited. Author Manuscript Published OnlineFirst on January 31, 2020; DOI: 10.1158/0008-5472.CAN-19-1784
0.0 0.5 1.00.0
0.5
1.0
EXPECTED EFFECT
OB
SE
RV
ED
EFF
EC
T
0.0 0.5 1.00.0
0.5
1.0
EXPECTED EFFECT
OB
SE
RV
ED
EFF
EC
T
0.0 0.5 1.00.0
0.5
1.0
EXPECTED EFFECT
OB
SE
RV
ED
EFF
EC
T
0
10
20
30
40
IC50
BH3
Mim
etic
(μM
)
******
*******
*******
0
10
20
30
40
IC50
BH3
Mim
etic
(μM
)
******
****
******
*******
0.0 0.5 1.0 1.5 2.00
50
100
150
Log[ABT-737(μM)]
%AT
P (N
orm
aliz
ed to
DM
SO)
0.0 0.5 1.0 1.5 2.00
50
100
150
Log[TTM(μM)]
%AT
P (N
orm
aliz
ed to
DM
SO)
- Dox+ Dox
0
5
10
15
20
25
IC50
TTM
(μM
) -Dox+Dox**** ****
********
**** ****
0
5
10
15
IC50
TTM
(μM
) -Dox+Dox*** ***
******* ***
**
0.0 0.5 1.0 1.5 2.00
50
100
150
Log[TTM(μM)]
%AT
P (N
orm
aliz
ed to
DM
SO)
- Dox+ Dox
A375Dox shRNA: BCL2 #1A
0.0 0.5 1.0 1.5 2.00
50
100
150
Log[TTM(μM)]
%AT
P (N
orm
aliz
ed to
DM
SO)
- Dox+ Dox
BCL2 #2
B A375
Dox shRNA
BCL2 #1
BCL-XL #1
BCL-W #1
MCL1 #1
BCL2 #2
BCL-XL #2
BCL-W #2
MCL1 #2
WM88Dox shRNA: BCL2 #1C
BCL2 #2
D WM88
Dox shRNA
BCL2 #1
BCL-XL #1
BCL-W #1
MCL1 #1
BCL2 #2
BCL-XL #2
BCL-W #2
MCL1 #2
0.0 0.5 1.0 1.5 2.00
50
100
150
Log[TTM(μM)]
%AT
P (N
orm
aliz
ed to
DM
SO)
- Dox+ Dox
E A375BCL2/-XL/-WiBH3 Mimetic:
0.0 0.5 1.0 1.5 2.00
50
100
150
Log[TTM(μM)]
%AT
P (N
orm
aliz
ed to
DM
SO)
- Dox+ Dox
0.0 0.5 1.0 1.5 2.00
50
100
150
Log[TTM(μM)]
%AT
P (N
orm
aliz
ed to
DM
SO)
- Dox+ Dox
BCL-XL #1
0.0 0.5 1.0 1.5 2.00
50
100
150
Log[TTM(μM)]%
ATP
(Nor
mal
ized
to D
MSO
)
- Dox+ Dox
BCL-XL #2
0.0 0.5 1.0 1.5 2.00
50
100
150
Log[TTM(μM)]
%AT
P (N
orm
aliz
ed to
DM
SO)
- Dox+ Dox
BCL-XL #1
BCL-XL #2
BCL2i
0.0 0.5 1.0 1.5 2.00
50
100
150
Log[TTM(μM)]
%AT
P (N
orm
aliz
ed to
DM
SO)
- Dox+ Dox
BCL-W #1
0.0 0.5 1.0 1.5 2.00
50
100
150
Log[TTM(μM)]
%AT
P (N
orm
aliz
ed to
DM
SO)
- Dox+ Dox
BCL-W #2
0.0 0.5 1.0 1.5 2.00
50
100
150
Log[TTM(μM)]
%AT
P (N
orm
aliz
ed to
DM
SO)
- Dox+ Dox
BCL-W #1
BCL-W #2
0.0 0.5 1.0 1.5 2.00
50
100
150
Log[TTM(μM)]
%AT
P (N
orm
aliz
ed to
DM
SO)
- Dox+ Dox
BCL-XL1i
MCL1 #1
0.0 0.5 1.0 1.5 2.00
50
100
150
Log[TTM(μM)]
%AT
P (N
orm
aliz
ed to
DM
SO)
- Dox+ Dox
MCL1 #2
0.0 0.5 1.0 1.5 2.00
50
100
150
Log[TTM(μM)]
%AT
P (N
orm
aliz
ed to
DM
SO)
- Dox+ Dox
MCL1 #1
MCL1 #2
0.0 0.5 1.0 1.5 2.00
50
100
150
Log[TTM(μM)]
%AT
P (N
orm
aliz
ed to
DM
SO)
- Dox+ Dox
0.0 0.5 1.0 1.5 2.00
50
100
150
Log[TTM(μM)]
%AT
P (N
orm
aliz
ed to
DM
SO)
- Dox+ Dox
MCL1i
F A375
ABT-737 ABT-199 A1210477WEHI-539G WM88BCL2/-XL/-WiBH3 Mimetic: BCL2i BCL-XL1i MCL1i
H WM88
ABT-737 ABT-199 A1210477WEHI-539
TTM(μM):
IC75
IC50
IC250
IC75
IC50
IC250
TTM(μM):
TTM(μM):
IC75
IC50
IC250
IC75
IC50
IC250
TTM(μM):
I A375
TTM + ABT-737 TTM + ABT-199 TTM + WEHI-539 TTM + A1210477
BCL2i BCL-XL1i MCL1iBCL2/-XL/-WiJ WM88
TTM + ABT-737 TTM + ABT-199 TTM + WEHI-539 TTM + A1210477
BCL2i BCL-XL1i MCL1iBCL2/-XL/-Wi
0.0 0.5 1.0 1.5 2.00
50
100
150
Log[ABT-199(μM)]
%AT
P (N
orm
aliz
ed to
DM
SO)
0.0 0.5 1.0 1.5 2.00
50
100
150
Log[A1210477(μM)]
%AT
P (N
orm
aliz
ed to
DM
SO)
0.0 0.5 1.0 1.5 2.00
50
100
150
Log[WEHI-539(μM)]
%AT
P (N
orm
aliz
ed to
DM
SO)
0.0 0.5 1.0 1.5 2.00
50
100
150
Log[ABT-737(μM)]
%AT
P (N
orm
aliz
ed to
DM
SO)
0.0 0.5 1.0 1.5 2.00
50
100
150
Log[ABT-199(μM)]
%AT
P (N
orm
aliz
ed to
DM
SO)
0.0 0.5 1.0 1.5 2.00
50
100
150
Log[A1210477(μM)]
%AT
P (N
orm
aliz
ed to
DM
SO)
0.0 0.5 1.0 1.5 2.00
50
100
150
Log[WEHI-539(μM)]
%AT
P (N
orm
aliz
ed to
DM
SO)
0.0 0.5 1.00.0
0.5
1.0
EXPECTED EFFECT
OB
SE
RV
ED
EFF
EC
T
0.0 0.5 1.00.0
0.5
1.0
EXPECTED EFFECT
OB
SE
RV
ED
EFF
EC
T
0.0 0.5 1.00.0
0.5
1.0
EXPECTED EFFECT
OB
SE
RV
ED
EFF
EC
T
0.0 0.5 1.00.0
0.5
1.0
EXPECTED EFFECT
OB
SE
RV
ED
EFF
EC
T
0.0 0.5 1.00.0
0.5
1.0
EXPECTED EFFECT
OB
SE
RV
ED
EFF
EC
T
Figure 3
on June 19, 2020. © 2020 American Association for Cancer Research. cancerres.aacrjournals.org Downloaded from
Author manuscripts have been peer reviewed and accepted for publication but have not yet been edited. Author Manuscript Published OnlineFirst on January 31, 2020; DOI: 10.1158/0008-5472.CAN-19-1784

C
CYTOCHROME C
HSP60
α−TUBULIN
TTM (μM): 0 5 0 5ABT-737 (μM): 0 0 10 10
0 5 0 50 0 10 10
CytosolMitochondria
CYTOCHROME C
HSP60
α−TUBULIN
WM88
A375
TTM (μM): 0 10 0 10ABT-737 (μM): 0 0 10 10
0 10 0 100 0 10 10
CytosolMitochondriaD
GTTM (μM): 0 5 0 5
ABT-737 (μM): 0 0 10 10
A375
116
89
19
17
0 5 0 50 0 10 10
- Z-DEVD-FMK + Z-DEVD-FMK
β−ACTIN
Clv. CASPASE-3
CASPASE-3
Clv. PARP
PARP
HTTM (μM): 0 10 0 10
ABT-737 (μM): 0 0 10 10
WM88
116
89
19
17
0 10 0 100 0 10 10
- Z-DEVD-FMK + Z-DEVD-FMK
β−ACTIN
Clv. CASPASE-3
CASPASE-3
Clv. PARP
PARP
β−ACTIN
A A375VE
H
TTM
IC20
(0.8
5μM
)
TTM
IC50
(7.6
9μM
)
P-MEK1/2
T-MEK1/2
P-ERK1/2
T-ERK1/2
BCL2
BCL-XL
BCL-W
MCL1
β−ACTIN
B WM88
VEH
TTM
IC20
(3.9μM
)
TTM
IC50
(11.
85μM
)
P-MEK1/2
T-MEK1/2
P-ERK1/2
T-ERK1/2
BCL2
BCL-XL
BCL-W
MCL1
I A375
TTM (μM): 0 5 0 5WEHI-539 (μM): 0 0 10 10
0 10 0 100 0 10 10
WM88
116
89
19
17
β−ACTIN
Clv. CASPASE-3
CASPASE-3
Clv. PARP
PARP
J A375
TTM (μM): 0 5 0 5A1210477 (μM): 0 0 10 10
0 10 0 100 0 10 10
WM88
116
89
19
17
β−ACTIN
Clv. CASPASE-3
CASPASE-3
Clv. PARP
PARP
0
2
4
6
8
10A
nnex
in V
-pos
itive
(%)
****
**
E A375
TTM (5μM
)VEH
ABT-737
(10μ
M)
TTM + ABT-7
37
- Z-DEVD-FMK + Z-DEVD-FMK
0
5
10
15
Ann
exin
V-p
ositi
ve (%
)
****
TTM (10μ
M)VEH
ABT-737
(10μ
M)
TTM + ABT-7
37
- Z-DEVD-FMK + Z-DEVD-FMK
WM88F
TTM (5μM
)VEH
ABT-737
(10μ
M)
TTM + ABT-7
37
TTM (10μ
M)VEH
ABT-737
(10μ
M)
TTM + ABT-7
37
Fold 1.0 0.9 1.1
Fold 1.0 0.4 0.6
Fold 1.0 1.6 1.5
Fold 1.0 1.0 1.1
Fold 1.0 0.6 0.6
Fold 1.0 0.1 0.4
Fold 1.0 1.0 1.1
Fold 1.0 0.4 0.9
Fold 1.0 0.9 0.5
Fold 1.0 0.8 0.5
Fold 1.0 0.5 0.6
Fold 1.0 0.6 0.5
CYTOCHROME C/HSP60CYTOCHROME C/α−TUBULIN
1.0 0.6 0.4 0.6 - - - - - - - - 1.0 0.3 2.5 5.4
CYTOCHROME C/HSP60CYTOCHROME C/α−TUBULIN
1.0 0.6 0.7 0.9 - - - - - - - - 1.0 0.5 0.7 2.2
0.2 0.2 0.3 2.2 0.3 0.2 0.2 0.1Clv. CAS-3/CAS-3
0.0 0.0 0.2 0.9 0.0 0.0 0.0 0.4Clv. PARP/PARP
0.2 0.2 0.2 1.3 0.3 0.0 0.2 0.3Clv. CAS-3/CAS-3
0.0 0.0 0.0 0.7 0.0 0.0 0.0 0.2Clv. PARP/PARP
1.6 1.4 1.8 2.1 1.8 1.8 2.6 4.9Clv. CAS-3/CAS-3
0.0 0.1 0.1 0.5 0.3 0.3 0.5 0.9Clv. PARP/PARP
0.5 0.4 0.5 0.5 1.0 1.0 1.8 3.5Clv. CAS-3/CAS-3
0.2 0.1 0.3 0.6 0.1 0.1 0.2 0.5Clv. PARP/PARP
Figure 4
on June 19, 2020. © 2020 American Association for Cancer Research. cancerres.aacrjournals.org Downloaded from
Author manuscripts have been peer reviewed and accepted for publication but have not yet been edited. Author Manuscript Published OnlineFirst on January 31, 2020; DOI: 10.1158/0008-5472.CAN-19-1784
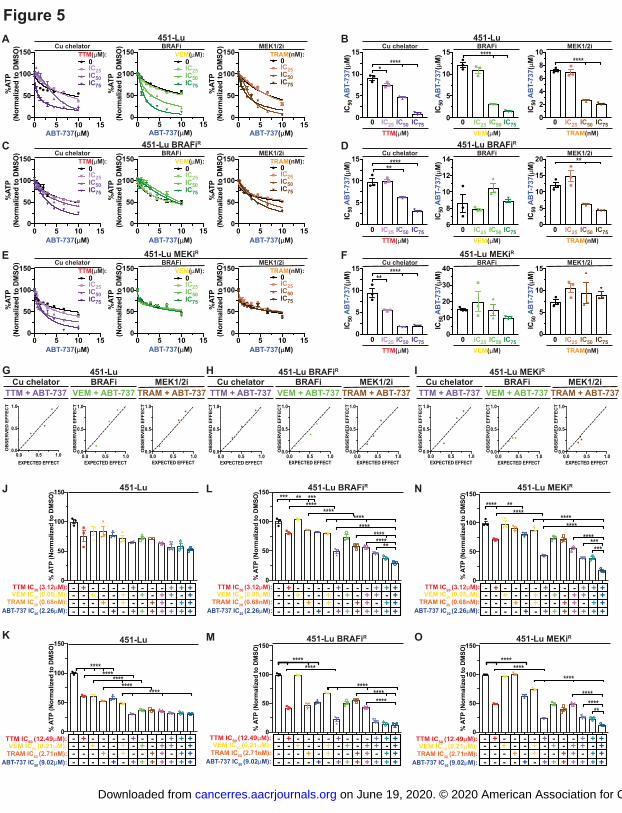
0
5
10
15
IC50
ABT
-737
(μM
)
0
50
100
150
% A
TP (N
orm
aliz
ed to
DM
SO)
*******
********
** ***
********
******
J
451-Lu
0
50
100
150
% A
TP (N
orm
aliz
ed to
DM
SO)
************
********
0
50
100
150
% A
TP (N
orm
aliz
ed to
DM
SO) 451-Lu
TTM IC20 (3.12μM):
ABT-737 IC20 (2.26μM):
VEM IC20 (0.05μM):TRAM IC20 (0.68nM):
+- -- - - + + + +- - --- -+ - + - + - ++ - +-- +- - + - - + +- + +-- -- + - + + + ++ + +
L 451-Lu BRAFiR
TTM IC20 (3.12μM):
ABT-737 IC20 (2.26μM):
VEM IC20 (0.05μM):TRAM IC20 (0.68nM):
VEM IC50 (0.21μM):TTM IC50 (12.49μM):
ABT-737 IC50 (9.02μM):TRAM IC50 (2.71nM):
+- -- - - + + + +- - --- -+ - + - + - ++ - +-- +- - + - - + +- + +-- -- + - + + + ++ + +
K
+- -- - - + + + +- - --- -+ - + - + - ++ - +-- +- - + - - + +- + +-- -- + - + + + ++ + +
******** ****
**
***********
N 451-Lu MEKiR
TTM IC20 (3.12μM):
ABT-737 IC20 (2.26μM):
VEM IC20 (0.05μM):TRAM IC20 (0.68nM):
+- -- - - + + + +- - --- -+ - + - + - ++ - +-- +- - + - - + +- + +-- -- + - + + + ++ + +
0
50
100
150
% A
TP (N
orm
aliz
ed to
DM
SO)
****
0
50
100
150
% A
TP (N
orm
aliz
ed to
DM
SO)
****
****
M 451-Lu BRAFiR
VEM IC50 (0.21μM):TTM IC50 (12.49μM):
ABT-737 IC50 (9.02μM):TRAM IC50 (2.71nM):
+- -- - - + + + +- - --- -+ - + - + - ++ - +-- +- - + - - + +- + +-- -- + - + + + ++ + +
********
********
****
O 451-Lu MEKiR
VEM IC50 (0.21μM):TTM IC50 (12.49μM):
ABT-737 IC50 (9.02μM):TRAM IC50 (2.71nM):
+- -- - - + + + +- - --- -+ - + - + - ++ - +-- +- - + - - + +- + +-- -- + - + + + ++ + +
****
0
50
100
150
% A
TP (N
orm
aliz
ed to
DM
SO)
***
******
0
5
10
15
IC50
ABT
-737
(μM
)
0 5 10 150
50
100
150
ABT-737(μM)
%AT
P (N
orm
aliz
ed to
DM
SO)
A 451-LuCu chelator
TTM(μM):0IC25IC50IC75
BRAFiVEM(μM):
0IC25IC50IC75
MEK1/2iTRAM(nM):
0IC25IC50IC75
Cu chelator BRAFi MEK1/2i451-LuB
G 451-Lu
VEM + ABT-737BRAFi
TTM + ABT-737Cu chelator
TRAM + ABT-737MEK1/2i
C 451-Lu BRAFiR
Cu chelatorTTM(μM):
0IC25IC50IC75
BRAFiVEM(μM):
0IC25IC50IC75
MEK1/2iTRAM(nM):
0IC25IC50IC75
Cu chelator BRAFi MEK1/2i451-Lu BRAFiRD
E 451-Lu MEKiR
Cu chelatorTTM(μM):
0IC25IC50IC75
BRAFiVEM(μM):
0IC25IC50IC75
MEK1/2iTRAM(nM):
0IC25IC50IC75
Cu chelator BRAFi MEK1/2i451-Lu MEKiRF
H 451-Lu BRAFiR
VEM + ABT-737BRAFi
TTM + ABT-737Cu chelator
TRAM + ABT-737MEK1/2i
I 451-Lu MEKiR
VEM + ABT-737BRAFi
TTM + ABT-737Cu chelator
TRAM + ABT-737MEK1/2i
0 5 10 150
50
100
150
ABT-737(μM)
%AT
P (N
orm
aliz
ed to
DM
SO)
0 5 10 150
50
100
150
ABT-737(μM)
%AT
P (N
orm
aliz
ed to
DM
SO)
0
5
10
15
IC50
ABT
-737
(μM
)
0
2
4
6
8
10
IC50
ABT
-737
(μM
)
0.0 0.5 1.00.0
0.5
1.0
EXPECTED EFFECT
OB
SE
RV
ED
EFF
EC
T
0.0 0.5 1.00.0
0.5
1.0
EXPECTED EFFECT
OB
SE
RV
ED
EFF
EC
T
0.0 0.5 1.00.0
0.5
1.0
EXPECTED EFFECT
OB
SE
RV
ED
EFF
EC
TTTM(μM)
0 IC25 IC50 IC75 0 IC25 IC50 IC75TRAM(nM)
0 IC25 IC50 IC75VEM(μM)
TTM(μM)0 IC25 IC50 IC75 0 IC25 IC50 IC75
TRAM(nM)0 IC25 IC50 IC75
VEM(μM)
TTM(μM)0 IC25 IC50 IC75 0 IC25 IC50 IC75
TRAM(nM)0 IC25 IC50 IC75
VEM(μM)
0 5 10 150
50
100
150
ABT-737(μM)
%AT
P (N
orm
aliz
ed to
DM
SO)
0 5 10 150
50
100
150
ABT-737(μM)
%AT
P (N
orm
aliz
ed to
DM
SO)
0 5 10 150
50
100
150
ABT-737(μM)
%AT
P (N
orm
aliz
ed to
DM
SO)
6
8
10
12
14
IC50
ABT
-737
(μM
)
0
5
10
15
20
IC50
ABT
-737
(μM
)
0 5 10 150
50
100
150
ABT-737(μM)
%AT
P (N
orm
aliz
ed to
DM
SO)
0 5 10 150
50
100
150
ABT-737(μM)
%AT
P (N
orm
aliz
ed to
DM
SO)
0 5 10 150
50
100
150
ABT-737(μM)
%AT
P (N
orm
aliz
ed to
DM
SO)
0
5
10
15
IC50
ABT
-737
(μM
)0
10
20
30
40
IC50
ABT
-737
(μM
)
0
5
10
15
IC50
ABT
-737
(μM
)
0.0 0.5 1.00.0
0.5
1.0
EXPECTED EFFECT
OB
SE
RV
ED
EFF
EC
T
0.0 0.5 1.00.0
0.5
1.0
EXPECTED EFFECT
OB
SE
RV
ED
EFF
EC
T
0.0 0.5 1.00.0
0.5
1.0
EXPECTED EFFECT
OB
SE
RV
ED
EFF
EC
T
0.0 0.5 1.00.0
0.5
1.0
EXPECTED EFFECT
OB
SE
RV
ED
EFF
EC
T
0.0 0.5 1.00.0
0.5
1.0
EXPECTED EFFECT
OB
SE
RV
ED
EFF
EC
T
0.0 0.5 1.00.0
0.5
1.0
EXPECTED EFFECT
OB
SE
RV
ED
EFF
EC
T
*****
********
********
******
Figure 5
on June 19, 2020. © 2020 American Association for Cancer Research. cancerres.aacrjournals.org Downloaded from
Author manuscripts have been peer reviewed and accepted for publication but have not yet been edited. Author Manuscript Published OnlineFirst on January 31, 2020; DOI: 10.1158/0008-5472.CAN-19-1784
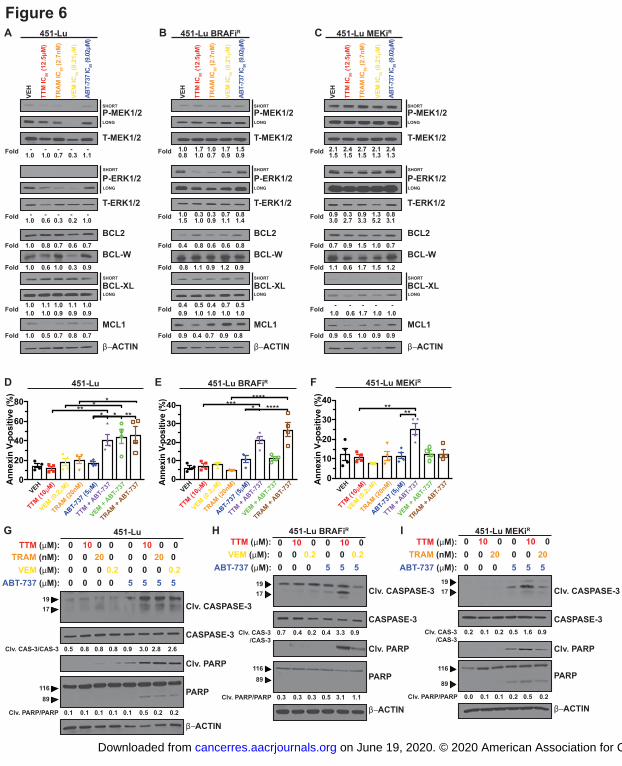
A 451-LuVE
H
TTM
IC50
(12.
5μM
)
VEM
IC50
(0.2
1μM
)
ABT-
737 I
C 50 (9
.02μM
)
TRA
M IC
50 (2
.7nM
)
0
20
40
60
80
Anne
xin
V-po
sitiv
e (%
)
** * ** * **
451-Lu 451-Lu BRAFiR
0
10
20
30
40
Anne
xin
V-po
sitiv
e (%
)
******** ****
TTM (μM): 0 10 0 0 10 0 TRAM (nM): 0 0 20 0 0 20
β−ACTIN
Clv. CASPASE-3
CASPASE-3
Clv. PARP
PARP
451-Lu MEKiR
ABT-737 (μM): 0 0 0 5 5 5
116
89
1917
G 451-LuTTM (μM): 0 10 0 0 0 10 0 0
TRAM (nM): 0 0 20 0 0 0 20 0 VEM (μM): 0 0 0 0.2 0 0 0 0.2
ABT-737 (μM): 0 0 0 0 5 5 5 5
11689
1917
D
β−ACTIN
T-MEK1/2
T-ERK1/2
BCL2
BCL-W
MCL1
P-MEK1/2
P-ERK1/2
BCL-XL
451-Lu BRAFiR
β−ACTIN
T-MEK1/2
T-ERK1/2
BCL2
BCL-W
MCL1
P-MEK1/2
P-ERK1/2
BCL-XL
B 451-Lu MEKiR
β−ACTIN
T-MEK1/2
T-ERK1/2
BCL2
BCL-W
MCL1
P-MEK1/2
P-ERK1/2
BCL-XL
C
TTM (10μ
M)VEH
ABT-737
(5μM
)
TTM + ABT-7
37
VEM (0.2μ
M)
TRAM (20n
M)
VEM + ABT-7
37
TRAM + ABT-7
37
TTM (10μ
M)VEH
ABT-737
(5μM
)
TTM + ABT-7
37
VEM (0.2μ
M)
TRAM (20n
M)
VEM + ABT-7
37
TRAM + ABT-7
37
E 451-Lu MEKiR
TTM (10μ
M)VEH
ABT-737
(5μM
)
TTM + ABT-7
37
VEM (0.2μ
M)
TRAM (20n
M)
VEM + ABT-7
37
TRAM + ABT-7
370
10
20
30
40
Anne
xin
V-po
sitiv
e (%
)
** **
F
TTM (μM): 0 10 0 0 10 0 VEM (μM): 0 0 0.2 0 0 0.2
451-Lu BRAFiR
ABT-737 (μM): 0 0 0 5 5 5
11689
1917
β−ACTIN
Clv. CASPASE-3
CASPASE-3
Clv. PARP
PARP
β−ACTIN
Clv. CASPASE-3
CASPASE-3
Clv. PARP
PARP
H I
VEH
TTM
IC50
(12.
5μM
)
VEM
IC50
(0.2
1μM
)
ABT-
737 I
C 50 (9
.02μM
)
TRA
M IC
50 (2
.7nM
)
VEH
TTM
IC50
(12.
5μM
)
VEM
IC50
(0.2
1μM
)
ABT-
737 I
C 50 (9
.02μM
)
TRA
M IC
50 (2
.7nM
)
Fold - - - - - 1.0 1.7 1.0 1.7 1.5 2.1 2.4 2.7 2.1 2.4 0.8 1.0 0.7 0.9 0.9 1.5 1.5 1.5 1.3 1.3 1.0 1.0 0.7 0.3 1.1
Fold - - - - - 1.0 0.3 0.3 0.7 0.8 0.9 0.3 0.9 1.3 0.8 1.5 1.0 0.9 1.1 1.4 3.0 2.7 3.3 5.2 3.1 1.0 0.6 0.3 0.2 1.0
Fold 1.0 0.8 0.7 0.6 0.7 0.4 0.8 0.6 0.6 0.8 0.7 0.9 1.5 1.0 0.7
Fold 1.0 0.6 1.0 0.3 0.9 0.8 1.1 0.9 1.2 0.9 1.1 0.6 1.7 1.5 1.2
Fold 1.0 1.1 1.0 1.1 1.0 1.0 1.0 0.9 0.9 0.9
0.4 0.5 0.4 0.7 0.5 0.9 1.0 1.0 1.0 1.0
- - - - - 1.0 0.6 1.7 1.0 1.0
Fold 1.0 0.5 0.7 0.8 0.7 0.9 0.4 0.7 0.9 0.8 0.9 0.5 1.0 0.9 0.9
Clv. CAS-3/CAS-3 0.5 0.8 0.8 0.8 0.9 3.0 2.8 2.6
Clv. PARP/PARP 0.1 0.1 0.1 0.1 0.1 0.5 0.2 0.2
Clv. CAS-3/CAS-3
0.7 0.4 0.2 0.4 3.3 0.9
Clv. PARP/PARP 0.3 0.3 0.3 0.5 3.1 1.1
Clv. CAS-3/CAS-3
0.2 0.1 0.2 0.5 1.6 0.9
Clv. PARP/PARP 0.0 0.1 0.1 0.2 0.5 0.2
Fold
Fold
Fold
Fold
Fold
Fold
Fold
Fold
Fold
Fold
Fold
Fold
SHORT
LONG
SHORT
LONG
SHORT
LONG
SHORT
LONG
SHORT
LONG
SHORT
LONG
SHORT
LONG
SHORT
LONG
SHORT
LONG
Figure 6
on June 19, 2020. © 2020 American Association for Cancer Research. cancerres.aacrjournals.org Downloaded from
Author manuscripts have been peer reviewed and accepted for publication but have not yet been edited. Author Manuscript Published OnlineFirst on January 31, 2020; DOI: 10.1158/0008-5472.CAN-19-1784
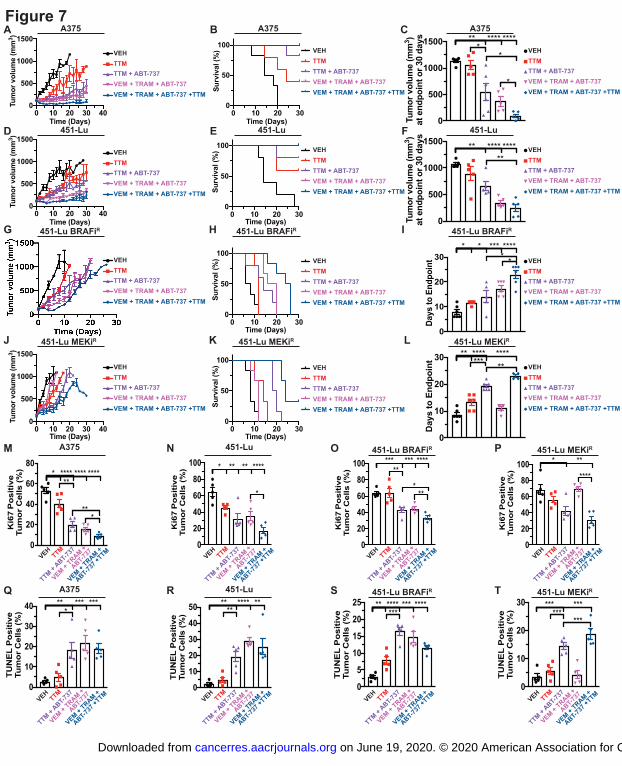
0 10 20 300
50
100
Time (Days)
Surv
ival
(%)
0 10 20 300
50
100
Time (Days)
Surv
ival
(%)
0
500
1000
1500
Tum
or v
olum
e (m
m3 )
at e
ndpo
int o
r 30
days ** **** ****
**
0
500
1000
1500
Tum
or v
olum
e (m
m3 )
at e
ndpo
int o
r 30
days **
***** ****
*
*
0 10 20 30 400
500
1000
1500
Time (Days)
Tum
or v
olum
e (m
m3 )
A A375 B A375
TTMVEH
TTM + ABT-737VEM + TRAM + ABT-737VEM + TRAM + ABT-737 +TTM
TTMVEH
TTM + ABT-737VEM + TRAM + ABT-737VEM + TRAM + ABT-737 +TTM
D 451-Lu E 451-Lu
TTMVEH
TTM + ABT-737VEM + TRAM + ABT-737VEM + TRAM + ABT-737 +TTM
TTMVEH
TTM + ABT-737VEM + TRAM + ABT-737VEM + TRAM + ABT-737 +TTM
G 451-Lu BRAFiR H 451-Lu BRAFiR
TTMVEH
TTM + ABT-737VEM + TRAM + ABT-737VEM + TRAM + ABT-737 +TTM
TTMVEH
TTM + ABT-737VEM + TRAM + ABT-737VEM + TRAM + ABT-737 +TTM
J 451-Lu MEKiR K 451-Lu MEKiR
TTMVEH
TTM + ABT-737VEM + TRAM + ABT-737VEM + TRAM + ABT-737 +TTM
TTMVEH
TTM + ABT-737VEM + TRAM + ABT-737VEM + TRAM + ABT-737 +TTM
0 10 20 30 400
500
1000
1500
Time (Days)
Tum
or v
olum
e (m
m3 )
0 10 20 300
50
100
Time (Days)Su
rviv
al (%
)
C
F
0 10 20 30 400
500
1000
1500
Time (Days)
Tum
or v
olum
e (m
m3 )
0 10 20 300
50
100
Time (Days)
Surv
ival
(%)
TTMVEH
TTM + ABT-737VEM + TRAM + ABT-737VEM + TRAM + ABT-737 +TTM
TTMVEH
TTM + ABT-737VEM + TRAM + ABT-737VEM + TRAM + ABT-737 +TTM
I
0
10
20
30
Days
to E
ndpo
int
** *** ***** *
A375
451-Lu
451-Lu BRAFiR
L 451-Lu MEKiR
0
10
20
30
Day
s to
End
poin
t
****** *********
TTMVEH
TTM + ABT-737VEM + TRAM + ABT-737VEM + TRAM + ABT-737 +TTM
TTMVEH
TTM + ABT-737VEM + TRAM + ABT-737VEM + TRAM + ABT-737 +TTM
0
20
40
60
80
Ki6
7 P
ositi
ve
Tum
or C
ells
(%) ****
****** ****
***
*
M A375
0
20
40
60
80
100
Ki6
7 P
osi
tive
Tu
mo
r C
ells
(%
) ** ** ****
*
*
451-LuN
0
20
40
60
80
100
Ki6
7 P
osi
tive
Tu
mo
r C
ells
(%
)
*** *** ****
**
**
*
451-Lu BRAFiRO
0
20
40
60
80
100
Ki6
7 P
osi
tive
Tum
or
Cel
ls (%
)
* **
****
P 451-Lu MEKiR
Q A375 451-LuR 451-Lu BRAFiRS T 451-Lu MEKiR
0
10
20
30
40
TUN
EL
Pos
itive
Tu
mor
Cel
ls (%
)
***
*** ***
0
10
20
30
40
50
TUN
EL
Pos
itive
Tu
mor
Cel
ls (%
)
****
**** **
0
5
10
15
20
25
TU
NE
L P
osi
tive
Tum
or
Cel
ls (%
) *******
*** ******
0
10
20
30
TU
NE
L P
osi
tive
Tum
or
Cel
ls (%
) ******
***
***
TTMVEH
TTM + ABT-7
37
VEM + TRAM +
ABT-737
+TTM
VEM + TRAM +
ABT-737 TTM
VEH
TTM + ABT-7
37
VEM + TRAM +
ABT-737
+TTM
VEM + TRAM +
ABT-737 TTM
VEH
TTM + ABT-7
37
VEM + TRAM +
ABT-737
+TTM
VEM + TRAM +
ABT-737 TTM
VEH
TTM + ABT-7
37
VEM + TRAM +
ABT-737
+TTM
VEM + TRAM +
ABT-737
TTMVEH
TTM + ABT-7
37
VEM + TRAM +
ABT-737
+TTM
VEM + TRAM +
ABT-737 TTM
VEH
TTM + ABT-7
37
VEM + TRAM +
ABT-737
+TTM
VEM + TRAM +
ABT-737 TTM
VEH
TTM + ABT-7
37
VEM + TRAM +
ABT-737
+TTM
VEM + TRAM +
ABT-737TTM
VEH
TTM + ABT-7
37
VEM + TRAM +
ABT-737
+TTM
VEM + TRAM +
ABT-737
Figure 7
on June 19, 2020. © 2020 American Association for Cancer Research. cancerres.aacrjournals.org Downloaded from
Author manuscripts have been peer reviewed and accepted for publication but have not yet been edited. Author Manuscript Published OnlineFirst on January 31, 2020; DOI: 10.1158/0008-5472.CAN-19-1784

Published OnlineFirst January 31, 2020.Cancer Res Ye-Jin Kim, Tiffany Tsang, Grace R Anderson, et al. copper chelation in BRAFV600E-driven melanomaInhibition of BCL2 family members increases the efficacy of
Updated version
10.1158/0008-5472.CAN-19-1784doi:
Access the most recent version of this article at:
Material
Supplementary
http://cancerres.aacrjournals.org/content/suppl/2020/01/31/0008-5472.CAN-19-1784.DC1
Access the most recent supplemental material at:
Manuscript
Authoredited. Author manuscripts have been peer reviewed and accepted for publication but have not yet been
E-mail alerts related to this article or journal.Sign up to receive free email-alerts
Subscriptions
Reprints and
To order reprints of this article or to subscribe to the journal, contact the AACR Publications
Permissions
Rightslink site. Click on "Request Permissions" which will take you to the Copyright Clearance Center's (CCC)
.http://cancerres.aacrjournals.org/content/early/2020/01/31/0008-5472.CAN-19-1784To request permission to re-use all or part of this article, use this link
on June 19, 2020. © 2020 American Association for Cancer Research. cancerres.aacrjournals.org Downloaded from
Author manuscripts have been peer reviewed and accepted for publication but have not yet been edited. Author Manuscript Published OnlineFirst on January 31, 2020; DOI: 10.1158/0008-5472.CAN-19-1784