inhibition of deoxyribonucleic acid and synthesis the ...€¦ · journal of bacteriology, mav...
TRANSCRIPT
JOURNAL OF BACTERIOLOGY, Mav 1974. p. 681-692Copyright © 1974 American Society for Microbiology
Vol. 118. No. 2Printed in U.S.A.
Effect of Inhibition of Deoxyribonucleic Acid and ProteinSynthesis on the Direction of Cell Wall Growth in
Streptococcus faecalisM. L. HIGGINS, L. DANEO-MOORE, D. BOOTHBY, AND G. D. SHOCKMAN
Department of Microbiology and Immunology, Temple University Health Sciences Center, Philadelphia,Pennsylvania 19140
Received for publication 11 February 1974
Selective inhibition of protein synthesis in Streptococcus faecalis (ATCC 9790)was accompanied by a rapid and severe inhibition of cell division and a reductionof enlargement of cellular surface area. Continued synthesis of cell wall polymersresulted in rapid thickening of the wall to an extent not seen in exponential-phasepopulations. Thus, the normal direction of wall growth was changed from a
preferential feeding out of new wall surface to that of thickening existing cellsurfaces. However, the overall manner in which the wall thickened, from nascentsepta toward polar regions, was the same in both exponential-phase andinhibited populations. In contrast, selective inhibition of deoxyribonucleic acid(DNA) synthesis using mitomycin C was accompanied by an increase in cellularsurface area and by division of about 80% of the cells in random populations.Little or no wall thickening was observed until the synthesis of macromoleculesother than DNA was impaired and further cell division ceased. Concomitantinhibition of both DNA and protein synthesis inhibited cell division butpermitted an increase in average cell volume. In such doubly inhibited cells,walls thickened less than in cells inhibited for protein synthesis only. On thebasis of the results obtained, a model for cell surface enlargement and celldivision is presented. The model proposes that: (i) each wall enlargement site isinfluenced by an individual chromosome replication cycle; (ii) during chromo-some replication peripheral surface enlargement would be favored over thicken-ing (or septation); (iii) a signal associated with chromosome termination wouldfavor thickening (and septation) at the expense of surface enlargement; and (iv) a
factor or signal related to protein synthesis would be required for one or more ofthe near terminal stages of cell division or cell separation, or both.
Considerable information has accumulatedconcerning the chemical structure and the en-zymatic mechanisms for the biosynthesis ofbacterial cell wall peptidoglycans and of the"accessory" wall polymers (20, 25). As yet littleinformation is available concerning the regula-tion of wall biosynthesis or the integration ofwall biosynthetic reactions with the many otherprocesses which occur during cellular growthand division. Obviously an increase in volumeof the protoplast requires an enlargement of thesurface area of the cell which, in bacteria,includes the protective and relatively inflexiblecell wall. The relationship between increases involume and surface area is not a simple one,even in bacterial species of relatively simpleshape (e.g., cocci and rods), since the geometryof the cell and its wall surface change during thecell division cycle (14, 22, 32).
The process of bacterial cell surface growthcan be divided into at least four distinct andpartially overlapping stages. These are: (i) en-largement of the cell wall surface; (ii) septation(or cross wall formation); (iii) daughter cellseparation (after completion of the cross wall);and (iv) wall thickening. This last process, wallthickening, occurs in a variety of gram-posi-tive species (14), most obviously under condi-tions of unbalanced growth (12, 17, 29). How-ever, at least in Streptococcus faecalis (ATCC9790), wall thickening has been shown to occurduring, and to be a part of, the normal surfacegrowth and division process in balanced, expo-nentially growing cultures (13).
In exponential-phase cultures of S. faecalis,wall thickening appears to (i) result from wallsynthesis at a large number of synthetic sites onthe entire coccal surface; (ii) occur more rapidly
681
on Novem
ber 6, 2017 by guesthttp://jb.asm
.org/D
ownloaded from

HIGGINS ET AL.
near the septal sites engaged in wall surfaceenlargement; and (iii) be a self-limiting process,since greatly thickened walls are rarely seen (11,12).For some time it has been apparent that
peptidoglycan and wall biosynthesis could beuncoupled from the biosynthesis of other cellu-lar macromolecules (29). For example, in S.faecalis, cell wall synthesis continued afterdeprivation of a required amino acid that is nota component of the peptidoglycan, such asvaline or threonine. After long periods of starva-tion, cells contained a higher percentage of wallsubstance per unit of cellular mass (29). Theincrease in cell wall substance was shown to bedue to an increase in wall thickness over theentire coccal surface rather than to an increasein the cellular surface area-to-volume ratio.Subsequent studies showed that much of thewall thickening occurred within the first 2 to 3 hof valine or threonine starvation (12).
Since the most direct and obvious conse-quence of amino acid deprivation is terminationof a further net increase in cellular protein, ithas been assumed that wall thickening is di-rectly related to the absence of protein synthe-sis. This interpretation is in agreement withresults obtained using antibiotics to inhibitprotein synthesis (5, 6). However, at the highconcentrations commonly used, most of theseantibiotics can affect more than one biosyn-thetic process (4, 10, 27). Furthermore, shortlyafter exposure to an antibiotic, secondary ef-fects on other macromolecular and morphologi-cal parameters can be frequently observed.We have now examined the effect of selective
inhibition of deoxyribonucleic acid (DNA), ri-bonucleic acid (RNA), and protein synthesis on(i) various parameters of wall biosynthesis (pep-tidoglycan and rhamnose polysaccharide accu-mulation); (ii) wall surface growth (wall thick-ening and surface enlargement); and (iii) celldivision (increase in number of cell units).Balanced, exponentially growing cultures wereexposed to concentrations of inhibitors whichrelatively selectively inhibit DNA, RNA, orprotein synthesis (4, 10, 27). Since selectivity ofinhibition is frequently a matter of degree ortime of exposure, or both, the kinetics of inhibi-tion of accumulation of the various informa-tional macromolecules was carefully monitored.With the biosynthetic parameters, determina-tions of cell numbers via a particle counterpermitted the direct comparison of ultrastruc-tural measurements (e.g., wall thickness) madeon individual cells. Many of the changes ob-served appear to be exaggerated manifestationsof events which occur during the normal cell
division cycle. Therefore, we have also at-tempted to derive information concerning theregulatory influences of informational mac-romolecules on processes involved in normalsurface enlargement and cell division. In fact,the data have been used to derive a tentativescheme for some of the events occurring duringthe surface growth and division cycle in S.faecalis.
MATERIALS AND METHODSCell growth and biochemical analyses. Cells were
grown as described previously in a chemically definedmedium modified from that of Gallant and Toennies(28). Increase in mass was monitored turbidimetri-cally (28). The relative extent of DNA, RNA, andprotein synthesis was determined by the rates ofincorporation of 14C- or 3H-labeled thymidine, uracil,and leucine into trichloroacetic acid-precipitableproducts. Peptidoglycan synthesis was determinedsimilarly by using [I 4C ]lysine and a recently describedmethod (1, 2). To use incorporation of radioactiveisotopes as a measure of net macromolecular biosyn-thesis, cells were pregrown in the presence of eachprecursor for six to seven mass doublings. Under theseconditions, the rate of isotope incorporation intotrichloroacetic acid-precipitable material is directlyproportional to the growth rate of the culture (26).The amounts and specific activities of the variousmacromolecular precursors used were as follows: forDNA, [3H]thymidine (1.5 uCi/ml, 0.05 gCi/ug); forRNA, [14C]uracil (0.1 ,uCi/ml, 0.005 ACi4lg); forprotein, L-['4C]leucine (0.2 ACi/ml, 0.005 ,Ci/gg); forpeptidoglycan, L- [14C ]lysine (0.125 ,Ci/ml, 0.005 MCi/ag). Rhamnose was determined by using a semi-micromodification of the procedure of Dische-Shettles (8).
In some instances, the data obtained from incorpo-ration of precursors by antibiotic-treated cells areexpressed as "percent inhibited" as compared withsynthesis in an untreated control (4, 27). All precursorincorporation values were related to the amount ofprecursor incorporated at the time of antibiotic addi-tion, which was given a relative value of 1.0. In anuntreated control culture (log phase) with a doublingtime of 30 min, the amount incorporated at 30 minwould be 2.0. A treated culture exhibiting at 30 min arelative incorporation value of 1.75 would be consid-ered to be inhibited by 25% with respect to thecontrol, or [(1.75-1.0)/(2.0-1.0)] x 100 = 75% of thecontrol, or 25% inhibited. This treatment was neces-sary in order to compare nonexponential increase incellular parameters. This expression of the biosyn-thetic data is useful in defining selective rates ofinhibition (4, 27). A linear, rather than exponential,treatment was used, in view of the lack of exponentialincrease in the antibiotic-treated cultures.
Antibiotics were added to exponentially growing(log) cultures at a turbidity equivalent of 136 gg/ml(dry weight) after six to eight mass doublings in theexponential phase. The antibiotics were chloram-phenicol (50 gg/ml; CAP; Parke, Davis and Co.);5-azacytidine, (5 gg/ml; AZAC; Calbiochem); ac-tinomycin D (0.25 to 5.0 Ag/ml; ACT; Merck, Sharp
682 J. BACTERIOL.
on Novem
ber 6, 2017 by guesthttp://jb.asm
.org/D
ownloaded from
DIRECTION OF WALL GROWTH
and Dohme); rifampin (0.1 ,ug/ml; RIF; Dow Chemi-cal Co.); and mitomycin C (0.5 ,Ag/ml; MIT; Nutri-tional Biochemicals Corp.).
Samples for cell counting were fixed in Formalin(final concentration, 10%) for 1 h on ice, diluted tobetween 0.08 and 0.24 ltg (dry weight) of bacterialsubstance per ml in 0.85% NaCl, and counted as soonas possible in a model B Coulter counter (CoulterElectronics, Chicago, Ill.) equipped with a 30-jAmdiameter orifice. For cell volume determinations, theCoulter counter was calibrated with Dow latex beads(1.171 ,um in diameter).The glutaraldehyde-osmium tetroxide fixation,
Epon 812 embedding, and uranyl acetate-lead citratestaining have been described (9, 12).Measurements of cell wall thickness. Measure-
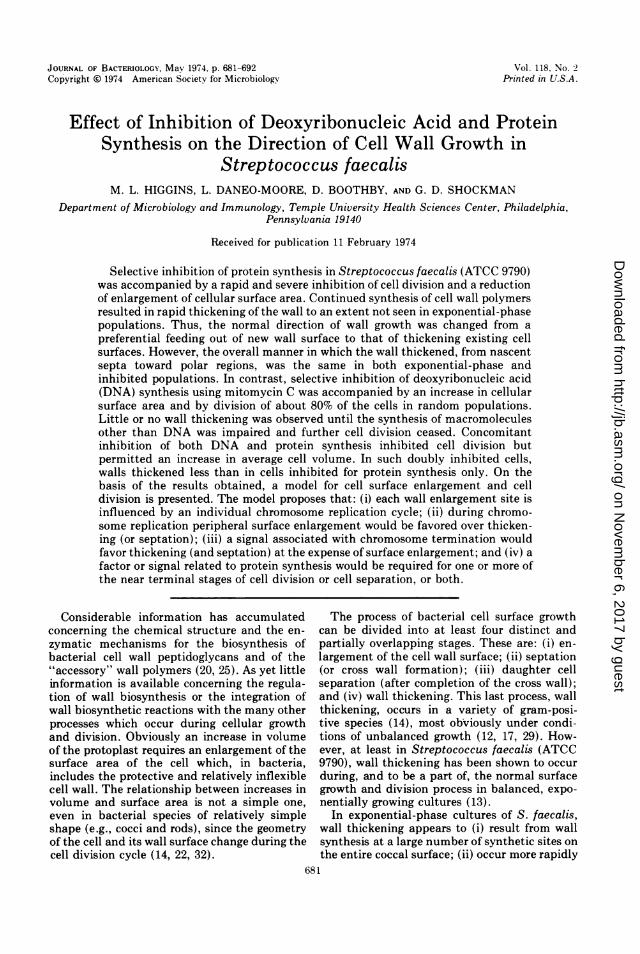
ments were taken from cells showing a tri-bandedprofile around virtually the entire cell perimeter.Such cells have been observed to be central andlongitudinal (12). Figure 1A shows a density scan ofan exponential-phase cell envelope (the dashed linesin Fig. 2A show the limits of the area scanned toproduce Fig. 1A). The cell wall thickness was definedas the distance between the outer limits of the outer(Cl, Fig. 1A) and inner (C3, Fig. 1A) electron-densebands of the cell wall. An equal distribution ofmeasurements of older, thicker poles and the newer,thinner equatorial regions were obtained by (i) visu-ally separating cells showing a nascent cross wall intotwo daughter cells (Fig. 3A, B), and (ii) taking a singlemeasurement of thickness of both the old and newwall portion of each daughter cell.The measurements were made directly from elec-
tron image plates exposed at about x 30,000 (micro-scope calibrated daily with a carbon grating replica)with a Bausch and Lomb dissection microscope atx 10 equipped with an ocular micrometer. The mea-surements were repeated at least twice on separatedays, usually by two observers, on a minimum of 40cells per experimental point.
RESULTSEffects of the selected concentrations of in-
hibitors on increase in cell numbers and onthe synthesis of cellular mass, DNA, RNA,protein, peptidoglycan, and rhamnose-con-taining polysaccharide. The effects of the an-tibiotics on the incorporation of the appropriateprecursor into DNA, RNA, and protein areshown in the graphs on the left in Fig. 4. WithCAP (50 ug/ml) and AZAC (5 ,ug/ml), furtherincorporation of leucine ceased immediately,whereas the incorporation of uracil and thymi-dine continued at the exponential rate for 15min or more. These two compounds were thusconsidered to be relatively specific inhibitors ofprotein synthesis. At this concentration, AZAChas no effect on RNA synthesis for 60 min (31)and the inhibition of protein synthesis reversesitself 20 to 30 min after exposure, consistentwith other reports (4, 27).Both RIF (0.1 ,ug/ml) and ACT (0.25 Ag/ml)
4.0
3.0
2.0
LLI
0
Et
C,')
C-)
a..
1.0 IUV V V
I I
Ml BCI C3 p*M2
3.0 - C2 1
2.0
1.0-
0 1 10 0.5 1.0 1.5 cm
FIG. 1. Density scans of thin-sectioned, cell enve-lopes of cells from (A) exponentially dividing and (B)ACT-treated cultures. Areas of normal and ACT-treated envelopes scanned are shown in Fig. 2A and2D, respectively, by dashed lines. The scans (obtainedwith a Gilford 2,000 spectrophotometer equipped witha linear absorbance readout) show a tri-banded elec-tron-dense (Cl), transparent (C2), dense (C3) cellwall followed by a space between the cell wall and theso-called periplasm (P), and finally conclude with theouter electron-dense (Ml) and middle electron-trans-parent (M2) layers of the cell membrane. Cl and C3are about 6.4 2.0 nm in thickness, whereas C2 isabout 16.0 : 5.0 nm in width. The inner dense layer ofthe membrane is not seen due to the interferingdensity of the cytoplasm. A comparison of the normalLOG cell scan (A) with the ACT-treated one (B)indicates that wall thickening after ACT treatment isdue largely to an increase in the thickness of the C2layer.
inhibited RNA accumulation extremely rap-idly, but also inhibited protein synthesis withequal speed. This was probably due to the closecoupling of these two syntheses in this species.Secondary to these effects was a delayed and
683VOL. 118, 1974
on Novem
ber 6, 2017 by guesthttp://jb.asm
.org/D
ownloaded from

HIGGINS ET AL.
LOG I',,,1ors** <5 -IVX , ,,9 44g'
ACT 301w Ns "-*.^
; :I I
CAP 40'
AZAC 4010*UlW9 r. ar,MIT 45'
FIG. 2. Typical thin section views of normal and antibiotic-treated envelopes. Electron micrographs wereselected to show the morphology of normal and treated envelopes and do not reflect the average wall thicknessvalues shown in Fig. 5. Dashed lines indicate scanned areas shown in Fig. IA and B. (A) Log = a normal ex-ponentially dividing cell; (B) CAP 40' = a cell treated with 50 ,g of CAP per ml for 40 min; (C) AZAC 40' =a cell treated with 5 jug ofAZAC per ml for 40 min; (D) ACT 30' = a cell treated with 0.25 ug ofACT per ml for30 min; (F) RIF 30' = a cell treated with 0.1 ug of RIF per ml for 30 min; and (E) MIT 45' = a cell treated with 0.5Ag of MIT per ml for 45 min. Bar in (A) applies to all micrographs and equals 100 nm.
Wall BandFIG. 3. Diagrammatic representation of a central
longitudinal section of a typical exponential phasecell. The new cell wall being produced in the currentgeneration is shown unstippled, and the old polar wallproduced in past generations is stippled. Wall bandsring the outer cell wall surface of the organism andserve as lines of demarcation between new equatorialwall and old polar wall. The mesosome (M) of this
less extreme inhibition of the rates ofDNA andmass increases. Therefore, RIF and ACT wereconsidered to be inhibitors of both RNA andprotein synthesis.MIT (0.5 ug/ml) inhibited DNA accumula-
tion and had only relatively little and delayedeffects on RNA and protein synthesis. MIT wasthus considered to be a relatively specific inhib-itor of DNA synthesis.
Since none of these inhibitors was selective inan absolute sense (as expected), the data wereinterpreted quantitatively in terms of relativespeed and extent of inhibition.The graphs on the right in Fig. 4 show the
organism is usually attached to the septum by a stalk.For purposes of quantitating the average cell wallthickness, cells were visually divided into two daugh-ter cells, A and B, and measurements were drawnequally from old and new regions. Measurements wereonly taken from cells with a tri-banded wall profilearound virtually the entire cell perimeter.
684 J. BACTERIOL.
on Novem
ber 6, 2017 by guesthttp://jb.asm
.org/D
ownloaded from

DIRECTION OF WALL GROWTH
i.5
I.0
3.0
2.0 .
'-5
CAP (A) ,+ +
.0 a.
1~~~1 ~ .
I
ACT (B) o, o
70 A A,
0 * 0 0
-RIF(B) 7 w -o- 0
MIT (B) ,
<'S~~~'
.5g
0 10 20 30 40 50 60 0 10 20 30 40 50 60
MINUTES
FIG. 4. Effect of various antibiotics on various synthetic parameters. The cultures were in balancedexponential growth for six to seven mass doublings in the presence of isotopic precursors. The rate of increase ofall parameters in untreated cultures is shown by the dashed line. For both panels A and B the data areexpressed as a function of the zero time value, taken as 1.0. Series A: protein, A; RNA, 0; DNA, 0; mass, *.Series B: peptidoglycan, 0; rhamnose, A; cell number, 0. The divergence between peptidoglycan andrhamnose accumulation after ACT treatment could have been due to relatively high blanks observed incolorimetric determinations of rhamnose on ACT-treated cells.
kinetics of the effects of each treatment on
increase in cell number and accumulation ofcell wall substance (both peptidoglycan andrhamnose-containing wall polysaccharides). Allof the compounds which rapidly and severelyinhibited further protein synthesis (CAP,AZAC, ACT, and RIF), irrespective of theirinhibitory effect on RNA synthesis, had nearlythe same effects on both cell wall synthesis andcell division. All four substances permitted (i)only a small (5 to 15%) increase in cell numbers,and (ii) continued synthesis of both wall poly-
mers, but at rates somewhat reduced from thatof untreated controls. The combination of littleincrease in cell number with a substantialincrease in cell wall polymers resulted in anoverall increase in amount of wall substance percell (see below).
In contrast, inhibition of further DNA synthe-sis by MIT permitted cell division at the controlrate, resulting in an 80% increase in cell num-ber. MIT treatment also permitted the two wallpolymers to continue to accumulate at nearlythe control rate for about 40 min, at which time
VOL. 118, 1974 685
1.5
1.0
3.0
2.0
1.5
1.0
.5
I0
(
-5 AZAC (B )
I, a8.
00, A '/
0 ., -. .
(I)
0~z
ILu
ACT (A) , 0I
I' fG --'
<*, a_,_,84
RIF (A),v'71, I 0 0
I' -
/~~~~~~L 8 F * 8-0
MIT (A)
7'1 o,'+/
o,
n Lr I L- 11
on Novem
ber 6, 2017 by guesthttp://jb.asm
.org/D
ownloaded from

HIGGINS ET AL.
their rates of accumulation slowed. In this case,continued cell division in parallel with wallpolymer accumulation did not result in anincrease in wall substance per cell, at leastduring the first 20 min (see below).
Correlation of wall thickening with inhibi-tion of protein synthesis and not with inhibi-tion of DNA, RNA, or continued peptidogly-can synthesis. A striking correlation betweenthe kinetics of the inhibition of protein synthe-sis and the increase in wall thickness wasobserved (Fig. 5). For example, CAP and ACTtreatments inhibited protein synthesis mostrapidly, and 10 or 15 min after treatment thewalls of these cells were substantially thickerthan cells from AZAC- or RIF-treated cultures.
In contrast, 15 min after MIT addition, anincrease in average wall thickness was notobserved (Fig. 5). Only later, at 45 min aftertreatment, was a relatively small increase inaverage wall thickness seen, concomitant withthe observed secondary effects of this antibioticon protein (and RNA) synthesis (Fig. 4, MIT[A]).The speed or extent of inhibition of RNA
synthesis did not correlate with wall thickening.Some of the agents used inhibited RNA synthe-sis rapidly (e.g., ACT and RIF), whereas otherscaused little (e.g., CAP) or no (e.g., AZAC)inhibition of RNA synthesis (Fig. 4A). Out-standing in this respect was AZAC, which failedto affect the rate of RNA synthesis (4, 27) butwhich resulted in substantial wall thickening.
Wall thickening also appeared not to berelated to the rate of peptidoglycan (or rham-nose-containing polysaccharide) synthesis.With all of the inhibitors used, peptidoglycansynthesis continued at virtually the same rateas that measured for log-phase cells for a periodof 10 to 15 min and, in the case of MIT treat-ment, even longer (Fig. 4B).
Ultrastructure and analysis of the fre-quency distribution of wall thicknessmeasurements. Thickened walls retained thetri-banded profile of log-phase cells (Fig. 2).Comparison of density scans of the wall pro-files (Fig. 1) showed that increased wall thick-ness was primarily accounted for by thickeningof the middle, less dense portion of the wall (C2in Fig. 1).As observed previously (12), the distribution
of wall thickness measurements of log-phasecells was skewed toward the thinner values (Fig.6, log; Table 1). Increases in average wall thick-ness were accompanied by (Fig. 5): (i) a sub-stantial decrease in frequency of walls in thethinner wall classes (e.g., classes 1 and 2 inTable 1); (ii) an increase in frequency of walls in
0
50
100
0
501
100
0
I-
JUI
4
2
0
4
2
0 E
4q
2(I)Cl)LUi
00
u I I I
RIF -4
50 - %n o-2
ifr) --- -t---e - --
50
100
4
2
0
0 10 20 30 40
MINUTES
FIG. 5. Comparison of the kinetics of inhibition ofprotein synthesis with the kinetics of increase inaverage cell wall thickness. Cell wall thicknesses were
measured on central, longitudinal sections as de-scribed in Materials and Methods and are expressedas increases or decreases (in nanometers) relative tothe average wall thickness of exponential-phase cells(27.8 nm). The method for determining and compar-ing protein synthesis on a percent basis is described inMaterials and Methods.
CAP c
I/'sPROTEIN
' AZAC
-y
z I I
I-i
%%" MIT
0-
I/
686 J. BACTERIOL.
L
on Novem
ber 6, 2017 by guesthttp://jb.asm
.org/D
ownloaded from

DIRECTION OF WALL GROWTH
the intermediate class (class 3 in Table 1), andvery thick wall (classes 4 and 5 in Table 1); and(iii) an increase in symmetry of distribution forthe thickness measurements (Fig. 6).Upon inhibition of protein synthesis, all of the
above changes were seen to occur at a speedcommensurate with the speed of inhibition ofprotein synthesis (Fig. 5). Since the measure-ments were equally distributed between theequatorial and polar regions of the cell (seeMaterials and Methods), the rapid decrease inthe thinner wall classes and the increase insymmetry of the frequency distribution mea-surements are consistent with a more rapid wallthickening of thinner and newer wall (i.e., nearnascent septal sites primarily engaged in wallenlargement). Increases in frequency of thethicker wall classes and the appearance of aclass of thick-walled cells not found in log-phasecells (12) (striking in the case of ACT treatmentfor 70 min) appeared relatively slowly. Such apattern is consistent with wall thickening occur-ring over the entire wall surface.MIT treatment for 15 min resulted in a small
increase in the thinner wall classes and reduc-tion in the average wall thickness measure-ments (Table 1 and Fig. 5). At 45 min after MITaddition, when other parameters of growth suchas rates of increase in cell numbers and RNAand protein synthesis were significantly affected(Fig. 4) and a small increase in average wallthickness was observed (Fig. 5), a shift infrequency distribution was also seen (Table 1and Fig. 6). At this late time, the frequency ofwalls of intermediate thickness (class 3) wasincreased at the expense of the thinner-walledclasses.
Correlation of wall thickening with inhibi-tion of cell division. As discussed above, treat-
TABLE 1. Frequency distribution of wall thicknessmeasurements in cultures treated with
chloramphenicol, 5-azacytidine, and mitomycin C
Wall thickness measurements (%)Timeof Class 1 Class 2 Class 5
Treatment expo- (23.8 (27.2 C(lass3 C(34 (37.4sure to to (o30. (374t to(min) 27.2 30.6 n) m
40.8nm) nrm) nm) nm) nm)
LOG 2.9 56.1 28.1 11.5 1.4Chloramphen- 10 2.0 29.4 41.2 27.4 0
icol20 1.3 16.7 46.2 30.8 5.040 5.4 8.1 32.4 43.3 10.8
5-Azacytidine 10 11.0 40.4 31.6 17.0 020 3.6 24.2 43.6 28.6 040 0 18.5 38.5 40.0 3.0
Mitomycin C 15 10.7 44.6 35.8 8.9 045 4.6 41.5 44.6 9.3 0
60 -
40 -
20 -
0 -
(I)
0
(I)
0
Lu
Q.
LOG
40
20L
40
20L
60
40 F
20[
OL40-
20-
25 30 35 40 45 50
CELL WALL THICKNESS (nm)FIG. 6. Histogram analysis of cell wall thickness
measurements of normal and antibiotic-treated cells.The dashed line indicates the average thickness of thenormal exponentially dividing cell population (log).The symbols indicating the type and time of antibi-otic treatment are as in Fig. 2. The method ofmeasuring cell wall thicknesses is given in Materialsand Methods.
ment with four drugs, CAP, RIF, ACT, andAZAC, was almost immediately accompaniedby a severe inhibition of further cell divisionafter an increase in cell numbers of 5 to 15%(Fig. 4B). In contrast, MIT permitted celldivision to occur for a longer time interval andto a much greater extent. In all five cases,synthesis of wall polymers continued, but onlywith the first four drugs was significant wallthickening observed. On the basis of theseobservations, the simple hypothesis was madethat wall thickening is a consequence of contin-ued wall polymer accumulation in cells in whichcell division (and perhaps also surface enlarge-
VOL. 118, 1974 687
on Novem
ber 6, 2017 by guesthttp://jb.asm
.org/D
ownloaded from

HIGGINS ET AL.
0 10 20 30 40 50
cz
0
Z17
10
10
0 10 20 30 40 50
Time (min.) Time (min.)FIG. 7. Comparison of changes in average cell wall thicknesses with the respective changes in amount of
peptidoglycan per cell upon treatment with the various antibiotics. The relative increase in wall thickness oftreated cells was calculated by dividing the average exponential cell wall thicknesses (27.8 nm) into the wallthickness of treated cells. The relative increase in amount of peptidoglycan per cell was calculated by dividingthe relative increases in cell numbers into the relative increases in peptidoglycan per milliliter of culture (datafrom the experiment shown in Fig. 4).
ment) was inhibited. If this was the case, thenthe kinetics of increase in amounts of wallpolymers accumulated per cell should agree
with the observed increase in wall thickness(already on a per-cell basis), regardless of thespecific effect of each treatment on either celldivision or wall polymer biosynthesis.Comparison of these two parameters (wall
thickness and amount of peptidoglycan per cell)on the same basis (Fig. 7) showed that thekinetics of increases in amounts of peptidogly-can per cell were in good agreement with thekinetics of increases in relative cell wall thick-ness (Fig. 7A). The largest and most rapidincreases in amounts of peptidoglycan per cell(Fig. 7B) were observed for those treatments(CAP, ACT, RIF) which resulted in only a smallincrease in cell numbers. MIT treatment was
not accompanied by an increase in peptidogly-can per cell for over 30 min (Fig. 7B), nor was an
increase in average wall thickness observeduntil quite late after treatment (Fig. 7A; 45min). This correlation was observed even
though synthesis of wall polymers occurred at a
rate very close to that for log-phase cells for atleast the first 40 min (Fig. 4, MIT [B DPerhaps the most convincing is the case of the
AZAC-treated cultures, where a superficial in-spection of Fig. 7A and B fails to reveal a
correlation. However, AZAC transiently andreversibly inhibited protein synthesis, mass in-crease, and cell division (Fig. 4). Thus, duringthe 20-min period of inhibition, the relativeamount of peptidoglycan per cell and averagewall thickness increased. Resumption of celldivision, about 20 min after exposure, resultedin a decrease in amount of peptidoglycan per
cell (Fig. 7B), which at later times (e.g., at 40min) approached the amounts seen in logcultures (i.e., 1.0). Between 20 and 40 min, a
corresponding decrease in average wall thick-ness was not seen (Fig. 7A). Since polar (and inthis case, thickened) wall is conserved, thecontinued presence of thickened polar wallwould contribute to the measurements andwould require several generations of recovery
from AZAC to approach the distribution ofthickness measurements of the untreated con-
trols.Role of surface enlargement in wall
thickening. The unexpectedly good correlationbetween relative amounts of peptidoglycan percell and relative wall thickness suggested thatnot only was the presence or absence of contin-ued cell division a factor in the occurrence ofwall thickening, but the presence or absence otan increase in surface area per cell may alsoplay a role. Surface enlargement and cell divi-sion may not always be closely coupled since,under some circumstances, nondividing cellscan increase in volume and in the surface area
required to enclose the increased volume (for a
recent review see ref. 14). Therefore, the effectsof inhibition of DNA and protein synthesis on
the relationship between surface area enlarge-ment and wall thickening were examined. Forthese experiments, ACT was used at a concen-
tration of 5 gg/ml to rapidly and severely in-hibit DNA synthesis. ACT rather than MITwas used since the latter, even at high concen-
trations, failed to act as rapidly on DNA syn-thesis (L. Daneo-Moore, unpublished observa-tions).Treatment with 5 or even 1 ,g of ACT per ml
688 J. BACTERIOL.
1.16
1.14
1.12
1.10
1.081.06
1.04
1.02
1.00
(Q)
10c0i
0Z
0a
0AC ACAP
0/ A RIF AZAC/ / A _
MIT
A* U
on Novem
ber 6, 2017 by guesthttp://jb.asm
.org/D
ownloaded from
DIRECTION OF WALL GROWTH
TABLE 2. Effects of 40 min of treatment withchloramphenicol and actinomycin D, alone and in
combination, on cell wall thickening, increase in cellnumbers, and protein and DNA synthesis
Wall thickness Relative increase(nm ± SD) ina
Treatment
Average In- Cell DNA Pro-crease no. tein
None 27.8 ± 2.2 2.32 2.32 2.32Chloramphenicol 32.5 ± 3.0 4.7 1.04 1.39 1.01
(50 mg/ml)Actinomycin D (5 31.1 2. 1 3.3 1.12 1.01 1.01
sg/ml )Chloramphenicol 31.5 + 2.0 3.7 1.07 1.01 1.01
(50 ug/ml) plusactinomycin D(5 pg/ml)a Calculated as relative increases from zero time values of
1.0.
L&Jl'2 A
8 8.00
lI)0(1)0-2 30 40 5 60 7
4.0-
-J
Lii
u x
A
'2
tLii-J A~~
0 10 20 30 40 50 60 70
MINUTES
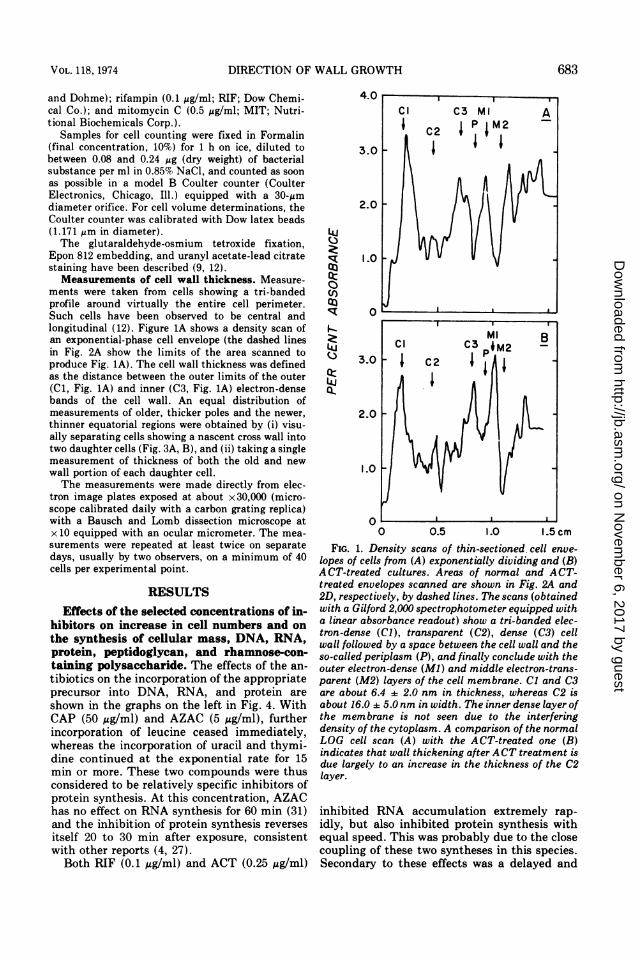
FIG. 8. Effect of various concentrations of ac-tinomycin D on cell wall thickness and amount ofpeptidoglycan per milliliter of culture with time.Actinomycin concentrations, in,ug/ml, are: (0) 0.251(A) 1.0, and (v) 5.0. (A) Increases in wall thickness;(B) increase in peptidoglycan per milliliter of culture.
was accompanied by less wall thickening thanwas treatment with CAP (50 ,ug/ml; Table 2) or0.25 ,tg of ACT per ml (Fig. 8). Moreover, thecombined effect of 40 min of treatment withboth CAP (50,ug/ml) and ACT (5 ,ug/ml) on wallthickening was very similar to the effect of 5 jigof ACT per ml alone (Table 2). Whereas CAP(50 ,ug/ml) alone inhibited protein synthesis andcell division, both ACT at 5 ,ug/ml and CAPplus ACT inhibited DNA synthesis as well. Theobservation of less wall thickening in the ab-sence of a substantial increase in cell numberswhen DNA as well as protein synthesis wasseverely inhibited suggests that under these
conditions there is either a decrease in rate ofwall biosynthesis or an increase in cellularsurface area. These two possibilities were inves-tigated further by comparing the results oftreatment with ACT concentrations of 0.25, 1.0,and 5.0,ug/ml on peptidoglycan synthesis andaverage cell volume.The effect of ACT on peptidoglycan synthesis
was almost the same at three concentrationstested (Fig. 8B). That is, peptidoglycan synthe-sis continued at nearly the control rate for about10 min before synthesis slowed. At 15 min theamount of peptidoglycan made was only 10%less than in the untreated control. Also, all threeconcentrations of ACT inhibited cell division toabout the same extent (Table 3). However, onlythe two higher concentrations of ACT (1 and 5,ug/ml) rapidly halted DNA synthesis (Table 3).The two higher ACT concentrations also per-mitted a greater increase in average cellularvolume than did the lower (0.25 zg/ml) concen-tration. It seems that superimposing a rapidand severe inhibition of DNA synthesis on cellsin which protein synthesis and cell division areinhibited permits an increase in cell volume butpermits less wall thickening. Since the rates ofpeptidoglycan synthesis were virtually identi-cal, inhibition of DNA synthesis appears tofavor surface enlargement at the expense of wallthickening.
DISCUSSIONIn contrast to cells in balanced exponential
growth, wall thickening after antibiotic treat-ment does not seem to be self-limiting but doesappear to proceed as seen in log cells; that is,those regions associated with the septum appearto thicken more rapidly than the wall found inthe poles (13, 14). Since in both cases thicken-ing occurs along this same gradient, it seemsattractive to consider the antibiotic-inducedprocess as the rapid and concerted expression ofpotential synthetic sites normally engaged in
TABLE 3. Effects of exposure of exponential-phasecells to various concentrations of actinomycin D for 15min on increases in cell volume, cell numbers, and
DNA synthesis
Relative increase ina:Actinomycin D
(Vg/ml) Mean cell Cell no. DNAvolume
0 1.00o 1.35 1.350.25 1.09 1.14 1.201.0 1.17 1.18 1.065.0 1.19 1.12 1.01
aCalculated as relative increases from zero timevaluies of 1.0.
I For exponential-phase cells.
VOL. 118, 1974 689
on Novem
ber 6, 2017 by guesthttp://jb.asm
.org/D
ownloaded from
HIGGINS ET AL.
the slower thickening of walls of log cells.Factors other than availability of' precursor areprobably involved in limiting ultimate wallthickness, since the extent of thickening of thetwo polar caps of' log cells appears to be regu-lated. A decreased eff'iciency of interactionof' membrane-bound enzymes with precursors,carriers, and/or wall acceptor could provide asurface age-dependent decrease in rate of thick-ening. A preferential thickening of newer. equa-torial wall after starvation for valine or threo-nine was observed previously (12).
In antibiotic-treated cells, it seems clear thatboth peptidoglycan and wall polvsaccharidescontaining rhamnose continue to accumulateeven after substantial inhibition of' either DNA,RNA, or protein synthesis (Fig. 4). In all cases,except perhaps for ACT treatment (Fig. 4, ACT[BI), the kinetics of increase in the two types of'wall polymers examined were nearly the same,indicating the absence of' a change in overallcomposition of the wall during treatment, andstrongly suggesting that the synthesis of' the twocovalently linked polymers are closely coor-dinated. The addition of new teichoic andteichuronic acid moieties to only concurrentlysynthesized peptidoglycan (19), and the ab-sence of appreciable dissociation of teichoic acidf'rom peptidoglycan synthesis after chloram-phenicol treatment (16), both occurring in Ba-cillus subtilis, also support the idea that thebiosynthesis of' covalently linked wall polymersis coordinated.
In the interpretation of the thickening ob-served after inhibition of' protein synthesis,three presumably related f'eatures seem to be of'importance. First is the severe inhibition of'further cell division observed 5 to 10 min afterinhibition of' protein synthesis but not observedvery soon after inhibition of DNA synthesis(Fig. 4B). Second is the relatively rapid inhibi-tion of' an increase in cellular surface area toenclose the increased cell volume. The closeagreement between the kinetics of' wall thicken-ing with peptidoglycan accumulation per cell(Fig. 7) indicated a lack of' increase in surfacearea. The data from the culture treated so thatboth protein and DNA synthesis were concomi-tantly and severely inhibited conf'irmed it (Ta-bles 2 and 3; Fig. 8). Third is the similaritybetween the kinetics of inhibition of proteinsynthesis and the kinetics of wall thickening(Fig. 5).The extent to which newly synthesized wall
polymers are incorporated into enlarged orthickened wall could depend on the rate of'surface enlargement and on the stage of the celldivision cycle at that instant. Integration ot theanalysis of' morphological and biochemical al-
teration observed upon treatment ot exponen-tial-phase populations with appropriate inhibi-tors (21) permitted us to derive a model for theregulation of cell surface growth and division.The chromosome replication time (C time)
can be calculated t'rom the relative amount of'DNA synthesized after inhibition of' proteinsynthesis (.39:W; see Fig. 4, CAP) (23). Calcu-lated in this manner, the C time for S. faecalis isapproximately 50 to 52 min, only a little longerthan the C time of Escherichia coli.The fraction of the population which goes on
to divide after inhibition of' DNA synthesis(80'7; see Fig. 4, MIT [B]) can be used to derivethe time between the termination of' a round of'chromosome replication and the subsequent celldivision (D time of' Helmstetter [7 1). This valuewas found to be 25 to 28 min for S. faecalis.'This value is similar to a D time of' 20 to 25 minfound for E. coli (3. 18) ancl Salmonella (30). Celldivision therefore appears to be related to DNAsynthesis through a signal associated withtermination of chromosome replication.
Finally, from the number of' cells in a randomexponential-phase population which goes on todivide after inhibition of protein synthesis (5 to16C;4; see Fig. 4 and Table 2) and the generalizedgrowth equation, it can be determined that pro-tein synthesis is not required for about 5 min be-fore final daughter cell separation. This timemust be at the end of' the cell division cycle andmust be an integral part ot' the D time as def'inedby Helmstetter (7). The overlapping sequencesof' C and D times in an S. faecalis culture divid-ing every 30 min are shown in Fig. 9.On the basis of' the observation that protein
svnthesis is not required for the last 5 minbefore cell separation, we have divided the Dtime into two components: D, (20 min in Fig. 9),during which protein synthesis may be partiallyor totally required, and D2 (5 min in Fig. 9),during which protein synthesis is no longerrequired. Theref'ore, the S. faecalis regulatoryscheme is similar but not identical to thatproposed by Zusman et al. (33) for E. coli. They
'The xalties t)r D) and D2 were derived (21)m'rom theg,,eneralized -rowth eqUatinn \N N. e-'> where N is thetinial nUmb)er of cells ob)served alter nltibiot ic addition at acell density (ot N,, anid t (in imiintites- is the timie in the celldiv isi n cvcle (act uallv hefore finl (ell setlatrationl of theevent crucial to (ell division wnhich is affected h!b the anti-bi)ttic. In this discussion. the D t imwe is the titnie ini the celldivision cycle o)btained after inhibition (of D)NA svnlthesis.This t imie is tllaoo(tOs to the 1) t imie of Helmstet ter (7). TheD2 t imie is the titlme in the cell divisi n cycle obtained in thesamne maniter. )(ut tronm residuial divisionin 'ter inhibitioni ofproteini synthesis. The 1), time is (letited aIs 1), D 1)2.anid therefore represents aI time between c(mipletion of chro-mosotaie replicationi anid that later division event which isprevented by inhibit ion of protein synthesis.
690 J. BACTERIOL.
on Novem
ber 6, 2017 by guesthttp://jb.asm
.org/D
ownloaded from

DIRECTION OF WALL GROWTH
propose a scheme for the cell division processwhere a, which is related to termination ofchromosome replication, interacts with fd, whichis related to protein synthesis.The relationship observed among chromo-
some replication, surface enlargement, and celldivision must be site specific. This requirementcomes from the observation of the initiation ofsecondary, subequatorial wall growth sites (nas-cent septa) well before the completion of theprimary central cross wall, at least in rapidlygrowing cultures (13, 14; Fig. 9). At certaintimes in the cell cycle these secondary sites areprimarily engaged in peripheral wall synthesis(and surface enlargement), whereas the primarysite is septating the protoplasm. Thus, whereasthe primary equatorial site would be under thecontrol of the replication cycle of one chromo-some, the secondary sites would be under thecontrol of the daughter cell's replication cycle.In this way, regulation of surface enlargementand division at each site would occur independ-ently. Communication between a chromosomeand a septal wall growth site could be mediatedvia septally associated mesosomes, as proposedpreviously (10). In S. faecalis, selective inhibi-tion of DNA synthesis was accompanied by adecrease in mesosome size, whereas inhibitionof protein synthesis (and cell division) wasaccompanied by an increase in mesosome size.Prevention of termination of chromosome
replication, by means of inhibition of DNAsynthesis in the middle of a round of replication,permits increases in cellular mass (Fig. 4) andvolume (Table 3). Similar observations havebeen made in other species (3, 15, 24). Thus,during rounds of chromosome replication, sur-face enlargement can and does occur.
In the present study, wall thickening wasleast in cells in which chromosome replicationhad not been completed, i.e., in populationsblocked during C time (see Fig. 9). In contrast,wall thickening was most pronounced in cellswhich failed to exhibit surface enlargement anddivision after inhibition of protein synthesis.These cells were blocked primarily in the D,stage of the cell cycle (Fig. 9); therefore, cellsurface enlargement and wall thickening ap-peared to be temporally separable during thecell cycle.Our observations are most consistent with a
model in which each chromosome replicationcycle controls one surface enlargement site,with cessation of surface enlargement occurringafter completion of chromosome replication.Cell wall thickening during the normal celldivision cycle would occur primarily during theD time, secondarily to cessation of surfaceexpansion. Although it remains possible that
[1111m x i 7/, 1tl Dw X D2 |1 ; fiD21 'D2
DIVISION DIVISION DIVISION
0 10 20 30 0 l0 20 30O lD 20 30
MINUTES* CHROMOSOME INITIATION| " TERMINATION
FIG. 9. Diagrammatic representation of threesuccessive cell cycles in cultures of S. faecalis dividingevery 30 min. C = 50 min, D = 25 min (D1 = 20 min,D2 = 5 min), and I = 30 min. The round ofchromosome replication initiated about 15 min intothe first 30-min division cycle continues through thesecond division cycle and terminates 5 min into thethird division cycle. Thus, in each 30-min cell cyclethere are three partially overlapping chromosomereplication cy-les. Based on the models relatingchromosome replication to cell division in E. coli (7),we propose here that termination of a round ofchromosome replication 5 min into the cell cycle of S.faecalis would signal the cell division occurring 25 minlater.
wall thickening is merely a consequence ofdecreased competition for wall precursors and isunrelated to events in the cell division cycle,this seems unlikely for several reasons. First isthe occurrence of a defined pattern of wallthickening as a normal part of surface growth inexponentially growing and dividing cells (13).Second is the close correlation of the kinetics ofwall thickening with the kinetics of.inhibition ofprotein synthesis and the observed absence ofthickening shortly after the inhibition of DNAsynthesis. Last are the observations made ondoubly inhibited cells. Because of possible un-known secondary effects and decreased specific-ity upon exposure to higher concentrations ofACT, this last set of observations is open tosome question. However, the effect of the con-centrations of ACT which inhibited DNA aswell as protein synthesis on wall thickening wasvery similar to that of MIT inhibition of DNAsynthesis. These effects differed in that ACTinhibited cell division and an increase in aver-age cell volume was observed, whereas MITpermitted substantial cell division. Both in-creased average cell volume and cell divisionrequire more surface.The model presented here is purely descrip-
tive. Elsewhere, a mechanism has been pro-posed to account for the morphological andregulatory features of the cell surface expansionprocess in S. faecalis (G. D. Shockman, L.Daneo-Moore, and M. L. Higgins, Ann. N.Y.Acad. Sci., in press).
691VOL. 118, 1974
on Novem
ber 6, 2017 by guesthttp://jb.asm
.org/D
ownloaded from
HIGGINS ET AL.
ACKNOWLEDGMENTS
This investigation was supported by grants GB 20813 andGB 31920 from the National Science Foundation and PublicHealth Service grants AI 05044 and Al 10971 from theNational Institute of Allergy and Infectious Diseases. M. L.
Higgins is a Public Health Service research career awardeeunder grant 5-K04 GM 7(0251 from the National Institute ofGeneral Medical Sciences.We wish to acknowledge the excellent technical assistance
of M. P. O'Connor in electron microscopy and P. Washingtonin sample preparation and radioactive incorporation studies.J. Dvckman and M. Savare contributed critical and stimulat-ing comments.
LITERATURE CITED
1. Boothby. D., L. Daneo-Moore, M. L. Higgins. J. Coyette.and G. D. Shockman. 1973. Turnover of bacterial cellwall peptidoglycans. J. Biol. Chem. 248:2161-2169.
2. Boothby, D., L. Daneo-Moore. and G. D. Shockman.1971. A rapid, quantitative, and selective estimation ofa radioactively labeled peptidoglycan in gram-positivebacteria. Anal. Biochem. 44:645-653.
3. Clark, D. J. 1968. The regulation of DNA replication andcell division in E. coli B/r. Cold Spring Harbor Symp.Quant. Biol. 33:832-838.
4. Daneo-Moore. L.. and M. L. Higgins. 1972. Morphoki-netic reaction of Streptococcus faecalis (ATCC 9790)cells to the specific inhibition of macromolecular syn-
thesis: nucleoid condensation on the inhibition ofprotein synthesis. .J. Bacteriol. 109:1210-1220.
5. Giesbrecht, P., and H. Ruska. 1968. Uber Vanderungender Feinstrukturen von Bacterien under der Einwir-kung von Chloramphenicol. Klin. Wochenschr.46:575-582.
6. Hash, J. H., and M. C. Davies. 1962. Electron microscopyof Staphylococcus aureus treated with tetracycline.Science 138:828-829.
7. Helmstetter, C. E. 1969. Regulation of chromosomereplication and cell division in Escherichia coli, p.15-35. In G. M. Padilla, G. L. Whitson, and I. L.Cameron (ed.), The cell cycle. Academic Press Inc.,New York.
8. Heymann, H., J. M. Manniello, and S. S. Barkulis. 1967.Structure of streptococcal cell walls. V. Phosphateesters in the walls of group A Streptococcus pyogenes.Biochem. Biophys. Res. Commun. 26:486-491.
9. Higgins, M. L. 1973. A fixation and embedding procedurefor thin-sectioning bacteria, p. 686-689. In A. I. Laskinand H. Lechevalier (ed.), CRC handbook of microbiol-ogy, vol 1. CRC Press, Cleveland.
10. Higgins, M. L., and L. Daneo-Moore. 1972. Morphoki-netic reaction of cells of Streptococcus faecalis (ATCC9790) to specific inhibition of macromolecular synthe-sis: dependence of mesosome growth on deoxyribonu-cleic acid synthesis. J. Bacteriol. 109:1221-1231.
11. Higgins, M. L., H. M. Pooley, and G. D. Shockman. 1971.Reinitiation of cell wall growth after threonine starva-tion of Streptococcus faecalis (ATCC 9790). J. Bacte-riol. 105:1175-1183.
12. Higgins, M. L., and G. D. Shockman. 1970. Early changesin, the ultrastructure of Streptococcus faecalis afteramino acid starvation. J. Bacteriol. 103:244-253.
13. Higgins, M. L., and G. D. Shockman. 1970. Model for cellwall growth of Streptococcus faecalis. J. Bacteriol.101:643-648.
14. Higgins, M. L., and G. D. Shockman. 1971. Procaryoticcell division with respect to wall and membranes. CRCCrit. Rev. Microbiol. 1:29-72.
15. Hirota, Y., A. Rvter, and F. Jacob. 1968. Thermo-sensi-tive mutants of E. coli affected in the process of DNAsynthesis and cellular division. Cold Spring HarborSymp. Quant. Biol. 33:677-693.
16. Hughes. A. H., M. Stow, I. C. Hancock, and J. Baddilev.1971. Function of teichoic acids and effects of Novobi-ocin on control of Mg2+ at the bacterial membrane.Nature N. Biol. 229:53-55.
17. Hughes. R. C.. P. J. Tanner, and E. Stokes. 1970.Cell-wall thickening in Bacillus subtilis. Comparison ofthickened and normal walls. Biochem. J. 120:159-170.
18. Kubitschek, H. E., and M. L. Freedman. 1971.Chromosome replication and the division cycle ofEscherichia coli B/r. J. Bacteriol. 107:95-99.
19. Mauck, ,J., and L. Glaser. 1972. On the mode of in vivoassemblv of the cell wall of Bacillus subtilis. J. Biol.Chem. 247:1180-1187.
20. Osborn. M. J. 1969. Structure and biosynthesis of theb,acterial cell wall. Annu. Rev. Biochem. 38:501-538.
21. Painter, P. R., and A. G. Marr. 1968. Mathematics ofmicrobial populations. Annu. Rev. Microbiol.22:519-548.
22. Previc, E. P. 1970. Biochemical determination of bacte-rial morphology and the geometry of cell division. J.Theor. Biol. 27:471-497.
23. Pritchard. R. H., and A. Zaritskv. 1970. Effect of thvmineconcentration on the replication velocity of DNA in athymineless mutant of Escherichia coli. Nature (Lon-don) 226:126-131.
24. Reeve, J. N., D. J. Groves, and D. J. Clark. 1971.Regulation of cell division in Escherichia coli: charac-terization of temperature-sensitive division mutants. J.Bacteriol. 104:1052-1064.
25. Rogers, H. J. 1970. Bacterial growth and cell envelope.Bacteriol. Rev. 34:194-214.
26. Roth, G. S., G. D. Shockman, and L. Daneo-Moore. 1971.Balanced macromolecular biosynthesis in 'proto-plasts' of Streptococcus faecalis. J. Bacteriol.105:710-717.
27. Sayare, M., L. Daneo-Moore, and G. D. Shockman. 1972.Influence of macromolecular biosynthesis on cellularautolysis in Streptococcus faecalis. J. Bacteriol.112:337-344.
28. Shockman, G. D. 1962. Amino acids, p. 567-673. In F.Kavanagh (ed.), Analytical microbiology. AcademicPress Inc., New York.
29. Shockman, G. D. 1965. Symposium on the fine structureand replication of bacteria and their parts. IV. Un-balanced cell-wall synthesis: autolysis and cell-wallthickening. Bacteriol. Rev. 29:345-358.
30. Spratt, B. G., and R. J. Rowbury. 1971. Cell division in a
mutant of Salmonella typhimurium which is tempera-ture-sensitive for DNA synthesis. J. Gen. Microbiol.65:305-314.
31. Suhadolnik, R. J. 1970. Nucleoside antibiotics, p.
271-297. Wiley-Interscience, New York.32. Thompson, J. S. 1971. Role of autolytic enzymes in the
growth and morphogenesis of bacterial cell walls. J.Theor. Biol. 33:63-75.
33. Zusman, D. R., M. Inouye, and A. B. Pardee. 1972. Celldivision in Escherichia coli: evidence for regulation ofseptation by effector molecule. J. Mol. Biol.69:119-136.
692 J. BACTERIOL.
on Novem
ber 6, 2017 by guesthttp://jb.asm
.org/D
ownloaded from