inhibition of hypothalamic mct4 and mct1–mct4 expressions ... · inhibition of hypothalamic mct4...
TRANSCRIPT
Inhibition of Hypothalamic MCT4 and MCT1–MCT4 ExpressionsAffects Food Intake and Alters Orexigenic and AnorexigenicNeuropeptide Expressions
Roberto Elizondo-Vega1 & Karina Oyarce1,2 & Magdiel Salgado1& María José Barahona1 & Antonia Recabal1 &
Patricio Ordenes1 & Sergio López1 & Roxana Pincheira3 & Patricia Luz-Crawford4& María Angeles García-Robles1
Received: 18 June 2019 /Accepted: 1 September 2019# The Author(s) 2019
AbstractFeeding behavior regulation is a complex process, which depends on the central integration of different signals, such as glucose,leptin, and ghrelin. Recent studies have shown that glial cells known as tanycytes that border the basal third ventricle (3V) detectglucose and then use glucose-derived signaling to inform energy status to arcuate nucleus (ARC) neurons to regulate feedingbehavior. Monocarboxylate transporters (MCT) 1 and MCT4 are localized in the cellular processes of tanycytes, which couldfacilitate monocarboxylate release to orexigenic and anorexigenic neurons. We hypothesize that MCT1 and MCT4 inhibitionscould alter the metabolic communication between tanycytes and ARC neurons, affecting feeding behavior. We have previouslyshown thatMCT1 knockdown rats eat more and exhibit altered satiety parameters. Here, we generateMCT4 knockdown rats andMCT1–MCT4 double knockdown rats using adenovirus-mediated transduction of a shRNA into the 3V. Feeding behavior wasevaluated in MCT4 and double knockdown animals, and neuropeptide expression in response to intracerebroventricular glucoseadministration was measured. MCT4 inhibition produced a decrease in food intake, contrary to double knockdown. MCT4inhibition was accompanied by a decrease in eating rate and mean meal size and an increase in mean meal duration, parametersthat are not changed in the double knockdown animals with exception of eating rate. Finally, we observed a loss in glucoseregulation of orexigenic neuropeptides and abnormal expression of anorexigenic neuropeptides in response to fasting when thesetransporters are inhibited. Taken together, these results indicate that MCT1 and MCT4 expressions in tanycytes play a role infeeding behavior regulation.
Keywords Hypothalamus .Monocarboxylates . Tanycytes . Feeding behavior . POMCneuron
Introduction
It has been hypothesized that hypothalamic glucosensingis, at least in part, an indirect process mediated by a met-abolic coupling through monocarboxylates between gliaand neurons. Tanycytes, which are hypothalamic radial-like glial cells surrounding the walls of the third ventricle(3V), are potentially key players in energy homeostasis.Their position gives them privileged access to the ventric-ular cerebrospinal fluid (CSF), and their long processesproject into the nuclei that control feeding behavior, es-tablishing close contact with anorexigenic and orexigenicneurons of arcuate nucleus (ARC). The ARC is formed byneuronal populations with antagonist functions, which in-clude neurons that inhibit food intake through the releaseof anorexigenic peptides, such as the α-melanocyte stim-ulating hormone (α-MSH), a product processed from thepro-opiomelanocortin (POMC), which co-expresses the
Elizondo-Vega Roberto and Oyarce Karina contributed equally to thiswork.
Main Points: Food intake initiation and satiety establishment aredysregulated in MCT4 knockdown animals, indicating thathypothalamic signaling mediated by monocarboxylates is important forhypothalamic glucosensing and feeding behavior.
* María Angeles Garcí[email protected]
1 Laboratorio de Biología Celular, Departamento de Biología Celular,Facultad de Ciencias Biológicas, Universidad de Concepción,Concepcion, Chile
2 Facultad de Medicina y Ciencia, Universidad San Sebastián,Concepcion, Chile
3 Departamento de Bioquímica y Biología Molecular, Facultad deCiencias Biológicas, Universidad de Concepción, Concepcion, Chile
4 Laboratorio de Inmunología Celular y Molecular, Centro deInvestigación Biomédica, Facultad de Medicina, Universidad de losAndes, Santiago, Chile
https://doi.org/10.1007/s12035-019-01776-6Molecular Neurobiology (2020) 57:896–909
/Published online: 2 October 2019
transcript regulated by amphetamine and cocaine (CART)[1, 2]. This pathway also contains neurons capable ofstimulating food intake through the secretion oforexigenic peptides such as neuropeptide Y (NPY) andthe peptide associated with agouti (AgRP). In this path-way, also known as the “melanocortin system,” increasedNPY and AgRP release and messenger RNA (mRNA)levels are observed with fasting, decreasing after feeding[3]. In contrast, POMC and CART releases are stimulatedwith feeding [4].
It has been previously shown that tanycytes respond toglucose by increasing intracellular free Ca2+ levels, as aresult of ATP released through hemichannels [5].Interestingly, ATP production is dependent on glycolysisand not oxidative phosphorylation. The high glycolyticactivity present in tanycytes is further demonstrated bythe fact that they release lactate using monocarboxylatetransporters (MCTs) [6]. MCT1 and MCT4 located in gli-al cells have Km of 6 and 30 mM respectively, whereasMCT2 is expressed in neurons and has a Km of 0.8 mM[7, 8]. MCT2 is involved in the monocarboxylate influx inboth anorexigenic and orexigenic neurons, suggesting thatmonocarboxylates could regulate the activity of these twoneuronal types [9]. Interestingly, it has been reported thatdirect i.c.v. injections of lactate into the hypothalamussuppressed appetite in rats [10].
Recently, we selectively inhibited the expression ofMCT1 in tanycytes by injecting adenoviral particles inthe 3V, which express a shRNA for MCT1. MCT1 isthe main transporter expressed by tanycytes and is lo-cated in the short cellular processes of ventral β1-tanycytes, which are in close contact with neurons thatexpress AgRP and NPY. MCT1 knockdown produces aloss in glucose regulation of orexigenic neuropeptidesand abnormal anorexigenic neuropeptide expression inresponse to fasting, accompanied by an increase in foodintake and body weight gain [11]. However, tanycytesalso express MCT4 to a lesser extent [6] in the longcellular processes of dorsal β1-tanycytes, which are inclose contact with neurons that release POMC andCART [6].
Due to the location, as well as kinetics properties, wehypothesized that the inhibition of MCT4 can producedifferential alterations in feeding behavior, in compari-son with MCT1 [11]. To test this hypothesis, weinhibited the expression of MCT4 (AdshMCT4) intanycytes using a similar experimental approach. We an-alyzed changes in feeding behavior during fasting-refeeding cycles, through the determination of meal fre-quency, inter-meal intervals, meal size, and meal dura-tion. Also, we evaluated the expression of neuropeptidesin response to i.c.v. glucose injection after MCT4 orMCT1 and MCT4 inhibitions.
Results
MCT4 and MCT1/MCT4 Knockdown in TanycyteCultures
In order to assess the ability of the adenovirus to inhibitMCT4, different viral titers were tested on the HEK 293T cellline, which showed that 5 × 10⁷ IFU/mL was the most effec-tive (nearly 100% transduction) and non-toxic titer (data notshown). The MCT4 adenoviral construct is shown in Fig. 1a.EGFP expression was used to monitor MCT4 adenoviraltransduction (Fig. 1b–d), with a high infection rate observedafter 72 and 96 h (Fig. 1e). Using a similar protocol, we pre-viously generated AdshMCT1 [11]. In order to use both ade-noviruses for in vivo studies, we use half of the concentrationfor each adenovirus (2.5 × 10⁷ IFU/mL) and evaluated if therewas a significant inhibition of both transporters. Cell survivalwas also measured after adenovirus infection, which showed> 99% of living cells at all times analyzed forMCT4 alone andfor both adenoviruses (Fig. 1f), compared to the control con-dition, transduced with AdshβGal. MCT1 (Fig. 1g) andMCT4 (Fig. 1h) mRNA expressions were quantified after48, 72, and 96 h post-AdshMCT4 or AdshMCT1–4 transduc-tion by quantitative real-time polymerase chain reaction (Q-RT-PCR). A significant reduction in MCT1 and MCT4 ex-pression levels relative to cyclophilin was detected at all timesassayed in the knockdown cultures with respect to controls; nosignificant differences in MCT4 expression were detectedcomparing AdshMCT4 knockdown with AdshMCT1–4knockdowns. The effect of AdshMCT4 alone (I-J) andAdshMCT1–4 (K-L) onMCT1 andMCT4 protein expressionwas also evaluated in total protein extracts of tanycyte culturesat 96 h post-transduction using EGFP as a transduction controland actin as a loading control. We detected a decrease in bothMCT1 and MCT4 band intensity (i.e., protein expression).Quantification revealed that using AdshMCT4 alone resultedin an 81 ± 3.2% MCT4 inhibition when compared withAdshβGal and 66% MCT4 inhibition using both adenovi-ruses; a similar significant reduction in MCT1 was obtainedin this condition. However, because reduction in the proteinlevels may not necessarily translate to loss in functionality ofthese transporters, we analyzed lactate uptake and release inprimary tanycyte cultures.
Functional Analysis of Lactate Transport in TanycytesCultures Transduced with AdshMCT1 and/orAdshMCT4
Uptake of 0.1 and 25 mM lactate over 5 min was determinedin tanycyte cultures transduced for 96 h with AdshβGal,AdshMCT1, AdshMCT4, and a mix of AdshMCT1 andAdshMCT4. Data was normalized to the uptake of cells trans-duced with the same titer of control adenovirus. A significant
Mol Neurobiol (2020) 57:896–909 897

decrease in lactate uptake was observed in MCT1- (Fig. 2a,yellow bar) and MCT4-transduced cells (Fig. 2a, red bar) at0.1 mM L-lactate. MCT1–MCT4 double inhibitions reduceduptake by 35% (Fig. 2a, orange bar). Using 25 mM L-lactate,where the relative contribution of MCT4 to transport is higherthan for MCT1 [8], a significant reduction of uptake was ob-served after inhibiting MCT1 (Fig. 2b, yellow bar) and MCT4(Fig. 2b, red bar). However, a higher reduction in lactate up-take was obtained when both transporters were inhibited,reaching a 48% uptake reduction (Fig. 2b, orange bar).
Next, we evaluated if in vitro lactate effluxwas inhibited byadenoviruses. MCT1 knockdown reduces lactate release by
14.1 ± 9.4% (Fig. 2c, yellow bar), while MCT4 inhibition de-creased lactate release by 88.3 ± 1.8% (Fig. 2c, red bar). Thissignificant reduction in lactate release is maintained whenboth transporters are inhibited, reaching 83.4 ± 7.5% reduc-tion in release (Fig. 2c, orange bar), compared to AdshβGalcontrol.
MCT1 and MCT4 In Vivo Inhibition by AdenoviralInjection into the 3V
Because adenovirus transduction at 96 h in vitro significantlyreduced lactate efflux, we used the same condition to evaluate
MC
T1
expr
essi
onre
lativ
e to
cycl
ophi
lin
gP = 0.0011
P = 0.0044
P = 0.0036
MC
T4
expr
essi
onre
lativ
e to
cycl
ophi
lin
hf 140
120
100
80
60
40
20 0.25
0.50
0.75
1.00
1.25
0.6
0.8
1.0
1.2
1.4
0.2
0.4
Adsh Gal
AdshMCT4AdshMCT1-4
AdshMCT1
b c d96 h72 h48 h
Ads
hMC
T4
i
0.6
0.8
1.0
1.2
1.4
0.2
0.4MC
T4
expr
essi
onre
lativ
e to
act
in
k
Rel
ativ
e ex
pres
sion
to a
ctin
*
MCT1(45 kDa)
GFP(25 kDa)
Actin(45 kDa)
Adsh Gal
AdshMCT4 - - - + + +
+ + + - - -AdshMCT1 - - - + + +
MCT4(45 kDa) 0.6
0.8
1.0
1.2
1.4
0.2
0.4
MCT1 MCT4
MCT4(45 kDa)
GFP(25 kDa)
Actin(45 kDa)
Adsh GalAdshMCT4
+ + + - - -- - - + + +
e100
80
60
40
20
19-21 bp 19-21 bpspacer TTTTTT5'
3'3'
5'+1
shRNA-ratMCT4, shRNA-ratMCT1
shRNA-�galactosidaseor
Ampr Ori
LoxPPacI
AscI
pH1 pUb EGFP SV40-polyA
pDC311.2
a
48h 72h 96h
EG
FP p
ositi
ve c
ells
(%)
48h 72h 96h 48h 72h 96h 48h 72h 96h
Surv
ival
of ta
nycy
tes
(% r
elat
ive
to Ads
hG
al)
j l
E-L
P = 0.0167
P = 0.0091
P = 0.0095P = 0.0159 P = 0.0286
P = 0.0075
P = 0.0095
P = 0.0247
P = 0.0061
Fig. 1 Knockdown of MCT1 and MCT4 in primary cultures ofhypothalamic tanycytes. (a) The experimental protocol shows theconstruction of adenoviral shuttle vector. The cassette encoding the H1-promotor, multicloning site (MCS), ubiquitin promoter, EGFP, and SV40polyA contained in the Fux vector was cloned into the PDC311adenoviral shuttle expression vector for generating the vector,PDC311.2. The shRNAs were cloned into the MCS. (b–d) TemporalEGFP expression in tanycyte cultures transduced for 48, 72, and 96 hwith AdshMCT4. Nuclei were stained with TOPRO-3 (blue). (e)Quantification of EGFP expression normalized to total cells in thetanycyte cultures transduced with AdshMCT1 (yellow bars),AdshMCT4 (red bars), or AdshMCT1 and AdshMCT4 (orange bars) at48, 72, and 96 h. (f) Quantification of survival in tanycytes culturestransduced with AdshMCT4 (red bars) or a mix of AdshMCT1 and
AdhMCT4 (orange bars) at 48, 72, and 96 h relative to survival of cellstransduced with AdshβGal. (g, h) Q-RT-PCR analysis of MCT1 (g) andMCT4 (h) expression in tanycytes infected with AdshβGal (open bars),AdshMCT4 (red bars), or a mix of AdshMCT1 and AdhMCT4 at 48, 72,and 96 h. (i, j) Western blot (i) and semi-quantitative densitometricanalysis of MCT4 (j) and MCT1–MCT4 (k, l). Lanes 1–3: total cellextracts treated for 96 h with AdshβGal; lanes 4–6: total cell extractstreated for 96 h with AdshMCT4 (i) or a mix of AdshMCT1 andAdshMCT4 (k). GFP: transduction control. Actin: loading control.Unpaired t test and p values were incorporated in the plots. Resultsrepresent the mean ± SD of at least four independent experiments. Scalebar 25 μm. MCS multicloning site, pH 1 H1 promoter, pUb ubiquitinpromoter, SV40-poly A polyadenylation sequence from Simian virus 40,T4 DNA ligase from bacteriophage
Mol Neurobiol (2020) 57:896–909898

the selectivity and capacity of adenoviruses for reducing theexpression of MCTs in vivo. Previously, we have shown thatinjection of adenoviral particles transduces ependymocytesand tanycytes [11–13]. Frontal sections of the basal hypothal-amus of 96-h transduced animals were analyzed by immuno-fluorescence and spectral confocal microscopy to detectEGFP (green), the tanycyte marker, anti-vimentin (red), theastrocyte marker anti-GFAP (magenta), and the adult neuronalmarker NeuN (white) (Fig. 3a–i). EGFP expression was de-tected in ventricular cells with elongated processes, which dueto their location corresponds to α- and β-tanycytes (Fig. 3a,arrows) and with higher magnification exhibiting clear co-localization with vimentin (Fig. 3b, c). Also, these EGFP-positive cells were negative for GFAP at low (Fig. 3d,arrows) and higher magnification (Fig. 3e, f). EGFP expres-sion did not overlap with Neu-N expression (Fig. 3g, arrows),which was most evident at higher magnification (Fig. 3h, i),suggesting the absence of EGFP expression in neurons. Then,we evaluated if MCT1 and MCT4 expressions were affectedin vivo after transduction using Q-RT-PCR analysis. MCT4knockdown rats showed no significant changes for MCT1mRNA expression (Fig. 3j, red bar) compared with controlgroup (Fig. 3j, open bar) although MCT4 expression was sig-nificantly reduced by 56.9 ± 14.9% (Fig. 3k, red bar) com-pared with control (Fig. 3k, open bar), demonstrating the spec-ificity of shRNA against MCT4. Similarly, the double knock-down showed that the expression of both MCT1 and MCT4was significantly reduced by 46.8 ± 11.4% (Fig. 3l, orangebar) for MCT1 and 47.4 ± 13.5% for MCT4 (Fig. 3m,orange bar) compared with controls (Fig. 3l, m, open bar).
Feeding Behavior of Rats Following MCT1 and MCT4Inhibitions
We have previously reported that 50% inhibition of MCT1 intanycytes in vivo produces an increase in food intake [11].
Since MCT1 is localized in tanycyte processes that mainlycontact orexigenic neurons, while MCT4 is found in tanycyteprocesses that contact anorexigenic neurons, we evaluated iffood intake is altered in knockdown animals for MCT4 or indouble knockdown animals in a different way.
Ten animals per condition were subjected to the experi-mental protocol shown in Fig. 4a. Briefly, 3 days after adeno-viral 3V injection (day 8), rats were exposed to fasting condi-tions for 24 h (day 9) and then feeding conditions for 24 h (day10). At the beginning and end of the last 24 h, glycemia,changes in body weight, and food intake were measured(Fig. 4b–d). We did not detect variations in glycemia follow-ing MCT4 inhibition or MCT1–MCT4 inhibitions as concen-trations remained within normal ranges at all points (Fig. 4b).Similarly, we did not detect changes in body weight (Fig. 4c).However, a significant decrease in food intake was detected inthe MCT4 knockdown group (Fig. 4d, red bar) and a signifi-cant increase in food intake for theMCT1–MCT4 knockdowngroups (Fig. 4d, orange bar), compared with the AdshβGalcontrol group (Fig. 4d, open bar).
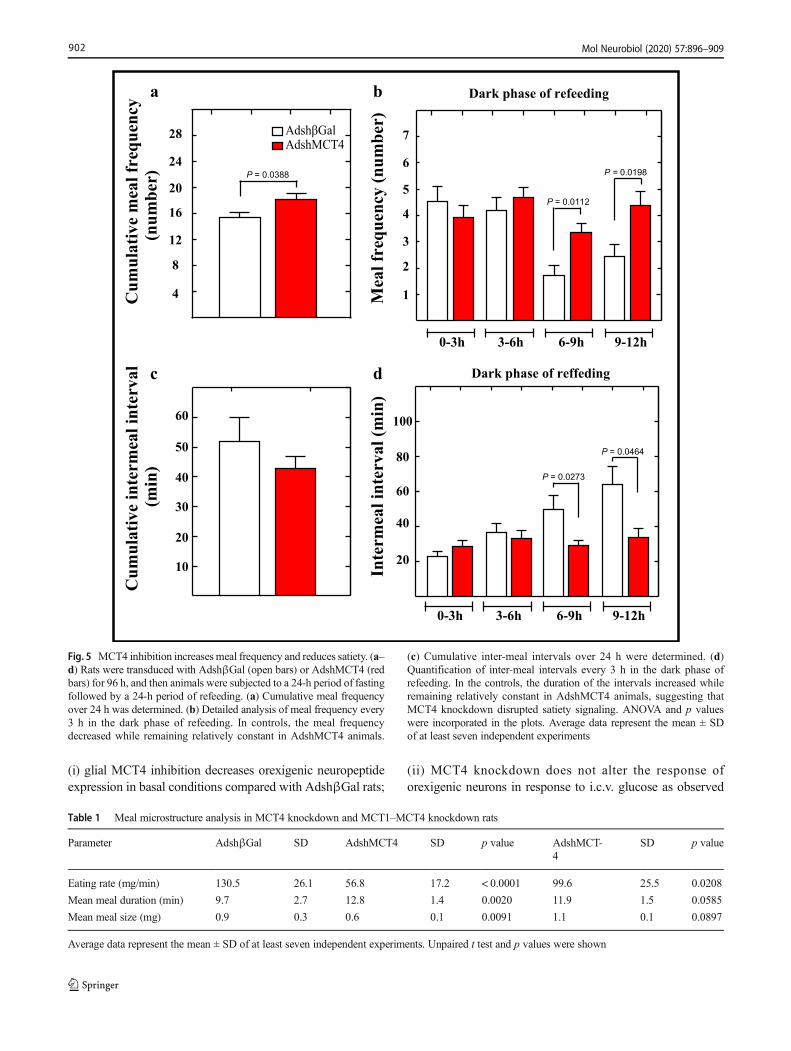
We next performed feeding analyses in each individualcondition. A general analysis of cumulative meal frequency,defined as the number of times that a feeding event occurs,showed that MCT4 knockdown rats had significantly in-creased meal frequency than the control group (Fig. 5a, redbar). Cumulative meal frequency was next analyzed in fourperiods of 3 h, during the dark phase of feeding. During thethird (6–9 h) and fourth (9–12 h) periods, a significantlyhigher meal frequency was observed (Fig. 5b, red bars), whichmay represent an increase in hunger or a delay in establishingsatiety.
Because the shortening of inter-meal intervals suggests aninhibitory effect on satiety, we analyzed the inter-meal inter-vals in the same periods within the dark phase. A generalanalysis of inter-meal intervals showed no differences be-tween the MCT4 knockdown rats and the control group
AdshMCT4AdshMCT1-4
AdshMCT1
a b c
Lac
tate
upt
ake
(% o
f con
trol
Ads
hG
al)
100
75
50
25
Lac
tate
upt
ake
(% o
f con
trol
Ads
hG
al)
100
75
50
25
0.1 mM 25 mM
Lac
tate
eff
lux
(% o
f con
trol
Ads
hG
al)
100
75
50
25
P = 0.0159
P = 0.0286
P = 0.0040 P = 0.0079 P = 0.0043
P = 0.0025
P = 0.0286
P = 0.0061P = 0.0076
Fig. 2 Functional analysis of the MCTs in tanycyte cultures under viraltransduction. (a, b) A total of 0.1 mM L-lactate (a) and 25 mM L-lactate(b) transport at 4 °C, pH 7.0 at 5 min in tanycytes infected withAdshMCT1 (yellow bar), AdshMCT4 (red bar), or a mix ofAdshMCT1 and AdshMCT4 (orange bar), relative to lactate uptake ofcells transduced with AdshβGal for 96 h. (c) Analysis of lactate efflux
over 30 min following incubation with 5 mM glucose in tanycytesinfected with AdshMCT1 (yellow bar), AdshMCT4 (red bar), or a mixof AdshMCT1 and AdshMCT4 (orange bar), relative to lactate efflux ofcells transduced with AdshβGal for 96 h. Unpaired t test and p valueswere incorporated in the plots. Average data represent themean ± SD of atleast four independent experiments
Mol Neurobiol (2020) 57:896–909 899

(Fig. 5c, red bar). However, a more detailed analysis revealedthat during the third and fourth periods, the MCT4 knock-down group had a significantly lower inter-meal interval(Fig. 5d, red bars). Specifically, the inter-meal intervalremained constant throughout the dark phase inMCT4 knock-down group; however, it increased in duration during the de-velopment of the dark phase in the control group (Fig. 5d,open bars). These data suggest that MCT4 knockdown re-duces satiety, but it does not explain the lower food intake inthese animals. For this reason, we perform an analysis of themicrostructure, which included parameters, such as eatingrate, meal duration, and meal size. These parameters werecalculated as mean values for the whole cycle, including lightand dark phases (Table 1). MCT4 inhibition reduced the eat-ing rate and had a minor effect onmeanmeal size compared tothe control group, which could explain the significant de-crease in food intake. However, these animals also showed
an increase in mean meal duration (i.e., they stayed longerinside the feeder). Thus, average feeding events were per-formed at a lower speed for a longer period of time and con-suming a smaller amount of food.
We next evaluated if the cumulative meal frequency indouble knockdown animals was related to an increase in foodintake (Fig. 5c, orange bar). The MCT1–MCT4 knockdowngroups showed an increase in their cumulative meal frequency(Fig. 6a, orange bar) compared to the control group (Fig. 6a,open bar). Analysis of meal frequency at short periods oftimes showed that only at the fourth period that double knock-down rats had a significantly higher meal frequency than thecontrol group (Fig. 6b, orange bar), similar to that observed inMCT4 knockdown rats (Fig. 5b, red bar). Analysis of cumu-lative inter-meal intervals showed no differences between thedouble knockdown rats and the control group (Fig. 6c, orangebar). However, like the MCT4 knockdown group, the MCT1–
AdshMCT4AdshMCT1-4
Adsh Galj k
mlM
CT
1 ex
pres
sion
rela
tive
to cy
clop
hilin 1.25
1.00
0.75
0.50
0.25 MC
T4
expr
essi
onre
lativ
e to
cycl
ophi
lin 1.25
1.00
0.75
0.50
0.25
MC
T1
expr
essi
onre
lativ
e to
cycl
ophi
lin 1.25
1.00
0.75
0.50
0.25 MC
T4
expr
essi
onre
lativ
e to
cycl
ophi
lin 1.25
1.00
0.75
0.50
0.25
P = 0.0071P = 0.0025
P = 0.0030
EGFP/Vimentin/Nucleus
3V
g h
3V 3V
i
ME
ARC ARC ARC
EGFP/NeuN/Nucleus
3V
d e
3V 3V
f
ME
ARC ARCARC
EGFP/GFAP/Nucleus
3V
a b
3V 3V
c
ME
ARC ARC ARC
Fig. 3 Specificity of adenoviral transduction and MCT mRNAexpression in the hypothalamus of rats following i.c.v. injection in the3V with AdshMCT4 or AdshMCT1 and AdshMCT4. (a–c) Frontalsections of the hypothalamus (40 μm) in which the immunoreactivityfor vimentin (red), EGFP fluorescence (green), and nuclei marker(blue), is shown in rat transduced with AdshβGal at 96 h post-injection(A scale bar 150 μm; B, C scale bar 100 μm). (d–f) Immunoreactivity forGFAP (magenta), EGFP fluorescence (green), and nuclei marker (blue) isshown in rat transduced with AdshβGal at 96 h post-injection (D scalebar 150 μm; E, F scale bar 100 μm). Co-localization between EGFP and
GFAPwas not detected. (g–i) Immunoreactivity for NeuN (white), EGFPfluorescence (green), and nuclei marker (blue) is shown in rat transducedwith AdshβGal at 96 h post-injection (g scale bar 150 μm; H, I scale bar100 μm). Co-localization between EGFP and NeuN was not detected. (j–m) Q-RT-PCR analysis of MCT1 (j, l) and MCT4 (k, m) after 96 h ofi.c.v. injection of AdshβGal (open bars), AdshMCT4 (red bars), or a mixof AdshMCT1 and AdshMCT4 (orange bars). ARC arcuate nucleus, 3Vthird ventricle, MEmedian eminence,β1β1-tanycytes,β2β2-tanycytes.Unpaired t test and p values were incorporated in the plots. Resultsrepresent the mean ± SD of at least five independent experiments
Mol Neurobiol (2020) 57:896–909900

MCT4 group showed significantly lower inter-meal intervalduring the last period (9–12 h) of the dark phase (Fig. 6d,orange bar), remaining constant throughout this time period,compared to control group (Fig. 6d, open bar).
Meal microstructure analysis showed that MCT1–MCT4knockdown rats had decreased eating rate compared to thecontrol group, but to a lesser degree when compared withthe MCT4 knockdown rats (Table 1). No significant differ-ences were detected in the mean meal size with a slight in-crease in mean meal duration, which was not significant whenwere compared to control group. Thus, average feeding eventswere performed at a lower speed for a similar period of timeand amount of food compared with control group, but with ahigher cumulative meal frequency.
Neuropeptide Expression in Response to i.c.v. Glucosein Rats FollowingMCT1 andMCT1–MCT4 Knockdowns
It has previously been reported that a 50-mM glucose stimulusdirectly into the 3V generates a neuronal response mediatedby changes in anorexigenic and orexigenic neuropeptidemRNA expressions [11, 12, 14]. Under normal conditions,an increase in 3V glucose concentration decreases the expres-sion of NPY and AgRP neuropeptides; however, in MCT1knockdown rats, this response does not occur [11].
Therefore, we tested if this glucose response was maintainedin MCT4 knockdown rats and in the double knockdown rats,according to the experimental scheme shown in Fig. 7a, whichhas been used for previous reports [11–14]. Neuropeptide ex-pression was measured by Q-RT-PCR after 2 h of saline (openbars) or D-glucose (dashed bars) i.c.v. injection and normal-ized to the saline treatment in Adsgβgal knockdown animals(Fig. 7b–e, open bars). After glucose injection, the controlAdshβGal group had reduced expression of the orexigenicneuropeptides, reaching a 52% decrease in NPY expression(Fig. 7b, open-dashed bar) and 64.4% decrease in AgRP ex-pression (Fig. 7c, open-dashed bar). In contrast, POMC ex-pression was increased by 42.9% (Fig. 7d, open-dashed bar);CART expression increased by 60.8% (Fig. 7e, open-dashedbar) relative to rats treated with saline, which was similar tothat previously reported with this experimental approach [11,12, 14].
In MCT4 knockdown rats, i.c.v. glucose injection de-creased NPY (Fig. 7b, red-dashed bar) and AgRP (Fig. 7c,red-dashed bar) expression by approximately 50% relative tothe saline group in a similar way to control conditions (Fig.7b, c, open bars). However, analysis of MCT1–MCT4 doubleknockdown in fasting conditions showed a reduced expres-sion of orexigenic neuropeptides, and no differences wereobserved in response to glucose. These results indicate that
injectionAdenovirus
Refeeding
Fasting-refeeding cycle
Fasting
Sacrifice
Day 10Day 9 ***
***
***
Adsh�Gal
Gly
cem
ia (
mM
)
9.0
7.5
dc
a
b6
5
4
3
2
1
28
24
20
16
12
8
4
Fasting
6.0
4.5
3.0
1.5
Refeeding
Recovery
Cannulation
Day 8Day 5Day 1
% C
han
ge
bo
dy
wei
gh
t
Fo
od
in
tak
e
(g/2
00
g o
f b
od
y w
eig
ht)
Sprague Dawley
Food intake (g)
Body Weight
Glycemia
AdshMCT4AdshMCT1-4
P = 0.0022
P = 0.0309
Fig. 4 Knockdown of MCT4 decreases food intake while doubleknockdown of MCT 1 and MCT4 increases food intake. (a) Scheme ofthe experimental protocol. Adult male rats were stereotaxicallycannulated into the 3V. After 5 days of recovery, the rats were injectedwith AdshβGal or a mix of AdshMCT1 and AdshMCT4. At 72 h post-adenoviral injection, the rats were subjected to 24 h of fasting followed by24 h of refeeding. Parameters, including glycemia, body weight and foodintake, were measured. (b) Quantification of glycemia after fasting andrefeeding in rats transduced with AdshβGal (open bars), AdshMCT4 (redbars), or a mix of AdshMCT1 and AdhsMCT4 (orange bars). (c)
Percentage of change in body weight at 24 h after refeeding in ratstransduced with AdshβGal (open bars), AdshMCT4 (red bars), or amix of AdshMCT1 and AdhsMCT4 (orange bars). (d) Quantification offood intake by rats transduced with AdshβGal (open bars), AdshMCT4(red bars), or a mix of AdshMCT1 and AdhsMCT4 (orange bars) over24 h after refeeding and expressed as grams per 200 g of body weight. nsno significance. Unpaired t test and p values were incorporated in theplots. Average data represent the mean ± SD of at least sevenindependent experiments
Mol Neurobiol (2020) 57:896–909 901
(i) glial MCT4 inhibition decreases orexigenic neuropeptideexpression in basal conditions compared with AdshβGal rats;
(ii) MCT4 knockdown does not alter the response oforexigenic neurons in response to i.c.v. glucose as observed
Dark phase of refeeding
Dark phase of reffeding
0-3h 3-6h 6-9h 9-12h
d
0-3h 3-6h 6-9h 9-12h
AdshMCT4Adsh�Gal
Cum
ulat
ive
mea
l fre
quen
cy(n
umbe
r)28
24
20
16
12
8
4
a b
Mea
l fre
quen
cy (n
umbe
r)
7
6
5
4
3
2
1
Cum
ulat
ive
inte
rmea
l int
erva
l (m
in)
60
50
40
30
20
10
cIn
term
eal i
nter
val (
min
)
100
80
60
40
20
P = 0.0388
P = 0.0112
P = 0.0273
P = 0.0464
P = 0.0198
Fig. 5 MCT4 inhibition increases meal frequency and reduces satiety. (a–d) Rats were transduced with AdshβGal (open bars) or AdshMCT4 (redbars) for 96 h, and then animals were subjected to a 24-h period of fastingfollowed by a 24-h period of refeeding. (a) Cumulative meal frequencyover 24 h was determined. (b) Detailed analysis of meal frequency every3 h in the dark phase of refeeding. In controls, the meal frequencydecreased while remaining relatively constant in AdshMCT4 animals.
(c) Cumulative inter-meal intervals over 24 h were determined. (d)Quantification of inter-meal intervals every 3 h in the dark phase ofrefeeding. In the controls, the duration of the intervals increased whileremaining relatively constant in AdshMCT4 animals, suggesting thatMCT4 knockdown disrupted satiety signaling. ANOVA and p valueswere incorporated in the plots. Average data represent the mean ± SDof at least seven independent experiments
Table 1 Meal microstructure analysis in MCT4 knockdown and MCT1–MCT4 knockdown rats
Parameter AdshβGal SD AdshMCT4 SD p value AdshMCT-4
SD p value
Eating rate (mg/min) 130.5 26.1 56.8 17.2 < 0.0001 99.6 25.5 0.0208
Mean meal duration (min) 9.7 2.7 12.8 1.4 0.0020 11.9 1.5 0.0585
Mean meal size (mg) 0.9 0.3 0.6 0.1 0.0091 1.1 0.1 0.0897
Average data represent the mean ± SD of at least seven independent experiments. Unpaired t test and p values were shown
Mol Neurobiol (2020) 57:896–909902

with MCT1 inhibition; and (iii) finally, glial MCT1–MCT4inhibitions clearly alter the expression of counter-regulatoryneuropeptides in both saline and glucose conditions.
In MCT4 knockdown rats, the expression of anorexigenicneuropeptides in response to glucose differs from that ob-served in the control group; POMC decreased by 61.6%(Fig. 7d, red-dashed bar), and CART decreased by 66.7%(Fig. 7e, red-dashed bar) in MCT4 knockdown rats. TheMCT1–MCT4 knockdown groups again showed a loss inthe regulatory expression of anorexigenic neuropeptides withreduced POMC (Fig. 7d, orange bar) and CART (Fig. 7e,orange bar) expression without changes in response to
glucose. These results suggest that responses of anorexigenicneurons to i.c.v. glucose depend on monocarboxylates re-leased by tanycytes through MCT4, while double knockdownanimals showed a complete alteration of neuropeptide expres-sion in response to i.c.v. glucose administration and in fastingconditions (Fig. 7d, e, orange-dashed bars).
Discussion
We have previously demonstrated that MCT4 is located in thelong cellular processes of dorsal β1-tanycytes, which are in
0-3h 3-6h 6-9h 9-12h
Dark phase of refeeding
Dark phase of refeeding
0-3h 3-6h 6-9h 9-12h
AdshMCT1-4Adsh�Gal
Cum
ulat
ive
mea
l fre
quen
cy(n
umbe
r)28
24
20
16
12
8
4
a b
Mea
l fre
quen
cy (n
umbe
r)
7
6
5
4
3
2
1
d
Cum
ulat
ive
inte
rmea
l int
erva
l (m
in)
60
50
40
30
20
10
cIn
term
eal i
nter
val (
min
)
100
80
60
40
20
P = 0.0451
P = 0.0216
P = 0.0350
Fig. 6 MCT1 and MCT4 knockdowns alter satiety and increase mealfrequency. (a–d) Rats were transduced with AdshβGal (open bars) orAdshMCT1 and AdshMCT4 (orange bars) for 96 h, after which theywere subjected to a 24-h period of fasting followed by 24 h ofrefeeding. (a) Cumulative meal frequency over 24 h was determined.
(b) Detailed analysis of meal frequency every 3 h in the dark phase ofrefeeding. (c) Cumulative inter-meal intervals over 24 h were determined.(d) Quantification of inter-meal intervals every 3 h in the dark phase ofrefeeding. ANOVA and p values were incorporated in the plots. Averagedata represent the mean ± SD of at least seven independent experiments
Mol Neurobiol (2020) 57:896–909 903

close contact with anorexigenic neurons, while MCT1-positive processes preferentially contact orexigenic neurons[6]. Due their location, we hypothesized that MCT4 inhibitioncould alter feeding behavior, in comparison with MCT1 [11].Our results showed that MCT4 knockdown in rats decreasedtheir food intake, which is opposite to that reported in MCT1knockdown rats [11]. MCT4 inhibition in tanycytes also de-creased the expression of NPY and AGRP under fasting con-ditions, which could explain the reduction in food intake;however, their expression did not change in response to glu-cose. However, MCT4 inhibition shortened meal intervals,which is associated with decreased satiety and increased num-ber of feeding events, all of which results in increased hunger.These results suggest that the animals are less satiated aftereach meal event, resulting in increased meal frequency. Thelower food intake can be explained by analyzing the eatingbehavior microstructure, in which the animals eat at half theeating rate of controls.
Feeding behavior is a complex process with several inter-connected regulating mechanisms. Thus, the alterations pro-duced by MCT4 knockdown cannot be explained solely byimpaired lactate flux between tanycytes and anorexigenic neu-rons. Recent studies show that other monocarboxylates mightalso affect anorexigenic or orexigenic neurons though theirbinding to ketone body receptors [15, 16]. In addition to theirrole as metabolic and energy substrates, monocarboxylatescan act as signaling molecules through specific G protein-coupled hydroxycarboxylic acid receptors (HCARs) [17]. Inrodents, two inhibitory G-coupled receptors subtypes havebeen described, HCA1R which is activated by physiologicconcentrations of lactate, and HCA2R, which responds selec-tively to β-hydroxybutyrate. Recently, the expression of thesereceptors has been shown in neurons of the adult brain [17],suggesting that they could influence neuronal activity [17,18]. On the other hand, immunolocalization studies haveshown high levels ofMCT2 in the membrane of ARC neurons
Recovery
Adenovirusinjection
Hypothalamus dissected
qRT-PCRCannulation
Day 1 Day 5 Day 7 Day 9Fasting
Saline or D-Glucoseinjection
2 h
Sacrifice
SalineGlucose
***
+ + +- - -++ +- - -
+ + +- - -++ +- - -
Adsh GalAdshMCT4AdshMCT1-4
+ + +- - -++ +- - -
+ + +- - -++ +- - -
SalineGlucose
NPY
exp
ress
ion
rela
tive
to cy
clop
hilin
1.25
1.00
0.75
0.50
0.25
b
a
AgR
P ex
pres
sion
rela
tive
to cy
clop
hilin
1.25
1.00
0.75
0.50
0.25
c
POM
C e
xpre
ssio
nre
lativ
e to
cycl
ophi
lin
2.50
2.00
1.50
1.00
0.50
d
CA
RT
exp
ress
ion
rela
tive
to cy
clop
hilin
2.50
2.00
1.50
1.00
0.50
e
P = < 0.0001
P = 0.0287
P = < 0.0001
P = < 0.0001
P = 0.0373
P = < 0.0001
P = < 0.0001P = < 0.0001
P = 0.0017
P = < 0.0001
P = 0.0027
P = < 0.0001
P = < 0.0001
P = 0.0002
P = 0.0005
P = 0.0005P = < 0.0001
P = < 0.0001
Fig. 7 MCT1 and MCT4inhibitions impair both orexigenicand anorexigenic neuropeptideexpressions. (a) Scheme of theexperimental protocol. Adultmale rats were stereotaxicallycannulated into the 3V. After 96 hof recovery, the rats were injectedwith AdshβGal, AdshMCT4, or amix of AdshMCT1 andAdshMCT4. At 48 h post-injection, the rats were fasted for48 h and subsequently injectedwith saline buffer or 50 mM D-glucose (dashed bars). At 2 hpost-3V i.c.v. injection, theanimals were sacrificed, and thehypothalamus was dissected forRNA extraction and Q-RT-PCRanalysis. (b–e) Q-RT-PCRanalysis of NPY (b), AgRP (c),POMC (d), and CART (e)neuropeptide expressions in ratstransduced with AdshβGal (openbars), AdshMCT4 (red bars), or amix of AdshMCT1 andAdshMCT4 (orange bars) for96 h. ANOVA and p values wereincorporated in the plots. Averagedata represent the mean ± SD of atleast seven independentexperiments
Mol Neurobiol (2020) 57:896–909904

and are not detected in tanycytes [9]. MCT2 expression isupregulated by an increase in extracellular monocarboxylateconcentrations [19]; therefore, it is possible that MCT1 andMCT4 glial inhibitions could lead to a reduction in MCT2neuronal expression [11]. In this aspect, further studies willbe necessary to evaluate the neuronal function of MCT2 onfood intake.
We previously reported that MCT1 inhibition in tanycytesreduced hunger sensations at the beginning of the dark phase,which could be associated with a minor food anticipation phe-nomenon, a process known to be regulated by ketone bodies[20]. This loss of food intake anticipation does not occur inMCT4 knockdown animals, which could be explained by thefact that ketone bodies can be transported by MCT1 but notMCT4 [8, 21], suggesting that MCT4 in tanycytes does notparticipate in food intake anticipation.
The opposite results observed between MCT1 and MCT4knockdown animals suggested that if both transporters wereinhibited, compensatory responses may occur when evaluat-ing feeding behavior. However, both MCT1 inhibition [11]andMCT1–MCT4 double inhibition led to an increase in foodintake, masking the effects of MCT4. This can be attributed toMCT1 being the main transporter expressed by tanycytes [6]and to the fact that MCT4-inhibitted animals also showedsatiety inhibition.
A more detailed analysis of feeding behavior in doubleknockdown animals revealed that they have increased foodintake, similar to MCT1-inhibited animals, but exhibit in-creased cumulative meal frequency similar to MCT4 inhibi-tion; they also had reduced eating rate, although it was lesssignificant than MCT4-inhibited animals. We believe thatfood intake velocity in double knockdown animals is the re-sult of compensatory effects between MCT1 and MCT4 inhi-bition, as we previously reported that MCT1 inhibition slight-ly increased food intake rate [11]. Thus, the inhibition of bothtransporters generates combined feeding behavior responsesas well as severely altered the expression of neuropeptides,resulting in loss of satiety establishment.
The increase of food intake observed in double knockdownanimals agrees with previous studies where proteins involvedin glucosensing are inhibited in vivo, specifically in tanycytes.GLUT2 and GK inhibitions in tanycytes also increase foodintake, which also altered the expression of orexigenic andanorexigenic neuropeptides under increased glycorrhachia[12, 13]. Based on these recent reports, we propose that analteration in glycolytic metabolism, either by reducing theincorporation, phosphorylation, or metabolization of glucoseto lactate in tanycytes, participates in modulating food intake,due at least in part, to changes in the function of neuroendo-crine neurons from the ARC.
Altogether, these data support a metabolic signaling be-tween tanycytes and neurons that participate in the regulationof feeding behavior under physiological conditions induced
by glucose and mediated by lactate. It would be interestingto know if this interaction is altered in pathologies that involvechanges in cell metabolism, such as diabetes and obesity.
Materials and Methods
Ethics Statement
All studies performed using animals were in strict accordancewith the Guidance on the Operation of the Animals (ScientificProcedures) Act 1986 and approved by Animal EthicsCommittee of the Chile’s National Commission forScientific and Technological Research (CONICYT, protocolfor project no. 1180871) and the appropriate Ethics andAnimal Care and Use Committee of the Universidad deConcepción, Chile (permit number 2010101A). Male adultSprague-Dawley rats weighing 250–300 g were used in allexperiments. Animals were housed in a separate animal roomwith constant temperature (21 ± 2 °C) and a controlled 12-hlight/ 12-h dark cycle; lights were turned on every day at 7:00a.m. Animals were fed ad libitum with a standard rodent diet(Lab Diet, 5P00 Prolab RMH 3000, Purina Mills, St. Louis,MO) and had free access to tap water.
Preparations of Adenoviral shRNA-MCT1 Vectors
DNA sequences were designed with siDESIGN Center soft-ware (Dharmacon RNAi Technologies, Lafayette, CO, USA)in order to target rat MCT1 (GenBank: D63834.1) and MCT4(Gene ID: 295356) transcriptional expression. Using Blast,those sequences targeting the expression of other rat geneswere discarded from the selection. Primer sets were validatedusing dissociation curves and used previously in Cortes-Campos et al. [6], Cortes-Campos et al. [9], and Elizondo-Vega et al. [11]. The following sets of oligonucleotides wereused: MCT1 sense 5′-CGC GCC GCA GCT TCT TTC TGTAAC ATT CAA GAG ATG TTA CAG AAA GAA GCTGCT TTT TTT TAA T-3′ and MCT1 antisense 5′-TAAAAA AAA GCA GCT TCT TTC TGT AAC ATC TCTTGA ATG TTA CAG AAA GAA GCT GCG G-3′, MCT4sense 5′-CGC GCC GGG ATT GGC TAC AGC GAC ATTCAA GAG ATG TCG CTG TAG CCA ATC CCT TTT TTTTAAT-3′ andMCT4 antisense 5′-TAAAAAAAAGGGATTGGC TAC AGC GAC ATC TCT TGA ATG TCG CTG TAGCCA ATC CCG G-3′. A ring sequence of nine base pairs(TTC AAG AGA) was placed between the sense and anti-sense strands. Control siRNA oligonucleotides were designedand selected to target β-galactosidase from E. coli: sense 5′-CGC GCC AAG GCC AGA CGC GAA TTA TTT CAAGAG AATAAT TCG CGT CTG GCC TTT TTT TTT TAAT-3′ and antisense 5′-TAAAAAAAAAAGGCCAGACGCGAATTATTC TCT TGA AATAAT TCG CGT CTG GCC
Mol Neurobiol (2020) 57:896–909 905
TTG G-3′. Cloning of the expression cassette into the adeno-viral shuttle vector was performed as previously reported [11,12], inserting the shRNA coding sequence into themulticloning site through the AscI and PacI sites. The adeno-viral expression system was produced in HEK293A cells bythe cotransfection of pBHGlox(Δ)E1,3Cre (Admax system,Microbix biosystems Inc., Ontario, Canada) adenoviral geno-mic DNA and either pDC311-H1-shMCT1-Ub-EGFP,pDC311-H1-shMCT4-Ub-EGFP, or the pDC311-H1-shβGal-Ub-EGFP expression vectors. The resulting adenovi-ral expression vectors were titered by EGFP expression usingthe Adeno-XTM Rapid Titer Kit Protocol (ClontechLaboratories, Inc., CA, USA). After amplification, adenoviralparticles were purified using the VirakitAdenoMini-4 kit(Virapur, CA, USA), aliquoted, and stored at − 80 °C.
Primary Culture of Tanycytes
Cultures of hypothalamic tanycytes were isolated followingthe method described previously [5, 6, 22, 23]. One-day post-natal rats were rapidly decapitated, the brains were removed,and the region close to the ventricular region was dissected inthe cold. Samples were incubated with 0.25% trypsin-0.2%EDTA (w/v) for 20 min at 37 °C, before transfer to MEMmedia ((Invitrogen, Carlsbad, CA, USA) supplemented with10% (v/v) fetal bovine serum (FBS) (Thermo Fisher ScientificInc., Waltham, MA, USA), 2 mM L-glutamine, 100 U/mLpenicillin, 100 μg/mL streptomycin (Thermo FisherScientific, Auckland, NZ), and 2 mg/mL DNase I (Sigma-Aldrich, St. Louis, MO, USA). For subsequent experimentalprocedures, tanycytes were washed twice in 0.1 M phosphatebuffer solution (PBS), pH 7.4, and treated with 0.25% trypsin-0.2% EDTA for 3 min at 37 °C. Dishes with the highest den-sity of confluent epithelial cells were expanded for subsequentadenoviral transduction to measure cell survival, transductionefficiency, and protein expression.
Adenoviral Transduction In Vitro
To measure cell survival and transduction efficiency, cellswere grown on poly-L-lysine-coated glass cover slides in 24-well plates in MEM medium supplemented with 10% (v/v)FBS. Cells were infected with Ad-MCT1-shRNA, Ad-MCT4-shRNA, Ad-βGal-shRNA (control), or a mix of Ad-MCT1-shRNA and Ad-MCT4-shRNA at 5 × 10⁷ infectiousunits per mL (IFU/mL). Virus-containing medium was re-placed 24 h later with MEM medium containing 10% (v/v)FBS and incubated for a total of 48, 72, and 96 h. Survival wasmeasured by the Trypan Blue 0.4% (Thermofisher) viabilityassay. After fixation with 4% paraformaldehyde (PFA) andvisualization using a confocal microscopy LSM 700 (Zeiss,Oberkochen, Germany), the percentage of transduction was
calculated as the number of EGFP-positive cells over the totalof cells using TOPRO-3 (1:1000, Invitrogen) nuclear staining.
Cannula Implantation
Cannulas were stereotaxically implanted into the 3V with thefollowing protocol. Rats were anesthetized with an intraperi-toneal injection of ketamine-xylazine (90–10 mg/kg), and thefur at the top of the head was removed to expose the area to beincised. A hole was drilled in the skull, and a guide cannula(28 gauge stainless steel; Plastics One, Roanoke, VA) waslowered using the following stereotaxic coordinates:anterior-posterior from bregma − 3.14 mm, medial-lateralfrom midsaggital sinus 0.0, and dorsal-ventral from the topof the skull 9.2 mm. The guide cannula was secured to theskull using 3/32 mm mounting screws and dental acrylic. Aremovable dummy cannula (28 gauge stainless steel; PlasticsOne, Roanoke, VA) was placed into the cannula guide, sealingthe opening in the guide cannula throughout the experimentsexcept when it was removed for the injections. Rats werehoused individually following surgery and allowed to recoverfor 5 days before adenovirus administration and starting theexperimental procedures.
I.c.v. Injections of AdshMCT4, AdshβGal, or bothAdshMCT1 and AdshMCT4 Adenoviruses
Rats were anesthetized with isoflurane and then injected intothe 3V with 30 μL of 2 × 10⁹ IFU/mL. For mRNA expressionanalysis, rats were injected with adenovirus as described inFig. 7a. Subsequently, the rats were anesthetized withisoflurane and injected with 10 μL of saline buffer (128 mMNaCl, 3 mM KCl, 1.3 mM CaCl2, 1.0 mM MgCl2, 1.3 mMNaH2PO4, 21 mM Na2HPO4, pH 7.4 and 320 mOsm) or10 μL of 50 mM D-glucose diluted in the same buffer(320 mOsm, pH 7.4). Hypothalamic samples were collectedafter 2 h post-glucose or saline injection for the mRNA ex-pression analysis. For protein analysis, hypothalamic sampleswere collected at 96 h post-adenoviral injection. At 72 h post-adenoviral injection, rats were subjected to one cycle of a 24-hfasting period followed by 24-h refeeding period for the feed-ing behavior analysis.
Measurement of hypothalamic mRNA
A-Q-RT-PCR analysis was used to measure the expression ofthe hypothalamic cyclophilin, MCT1, MCT4, NPY, AgRP,POMC, and CART. First, the brain of each rat was removed,and hypothalamic areas (Bregma − 1.74/− 4.56) close to the3V were isolated and further dissected. Total RNA from hy-pothalamic samples was isolated using TRIZOL (LifeTechnologies, Carlsbad, CA) and treated with DNase I(Fermentas International, Burlington, Ontario, Canada). RT-
Mol Neurobiol (2020) 57:896–909906

PCR was performed according to the manufacturer’s protocol(Fermentas International) using 2 μg of RNA and 20 μL re-action volume containing 10 mM Tris-HCl (pH 8.3), 50 mMKCl, 5 mM MgCl2, 20 U RNase inhibitor, 1 mM dNTPs,2.5 μM of oligo d(T) primers, and 50 units of MuLV reversetranscriptase (New England Biolabs, Ipswich, MA, USA) for60 min at 42 °C followed by 10 min at 70 °C. Parallel reac-tions were performed in the absence of reverse transcriptase tocontrol for the presence of genomic DNA. Q-RT-PCR reac-tions were prepared with 1x Brilliant II SYBR Green qPCRMasterMix kit (Agilent Technologies, Santa Clara, CA, USA)in a final volume of 12.5 μL containing 1 μL cDNA and thefollowing sets of primers (500 nM each): cyclophilin, sense5′-ATA ATG GCA CTG GTG GCA AGT C-3′ and antisense5′-ATT CCT GGA CCC AAA ACG CTC C-3′; MCT1, sense5′-TGG AAT GTT GTC CTG TCC TCC TGG-3′ and anti-sense 5′-TCC TCCGCT TTC TGT TCT TTG GC-3′; MCT4,sense 5′-TTC TCC AGT GCC ATT GGT CTC GTG-3′ andantisense 5′-CCC GCC AGG ATG AAC ACATAC TTG-3′;NPY, sense 5′-TGT TTG GGC ATT CTG GCT GAG G-3′and antisense 5′- CTG GGG GCATTT TCT GTG CTT TC-3′; AGRP, sense 5′-GCA GAC CGA GCA GAA GAT GTTC-3′ and antisense 5′- GTAGCACGT CTTGAAGAAGCGG-3′; POMC, sense 5′-CTC CTG CTT CAG ACC TCC ATAGAC-3′ and antisense 5′-AAG GGC TGT TCA TCT CCGTTG-3′; and CART, sense 5′-TCT GGG AAG AAG AGGGAC TTT CGC-3′ and antisense 5′-TCC ATT TGT GTTGCT TTG GGG TG-3′. All reactions were performed withan initial denaturation of 5min at 95 °C, followed by 40 cyclesof 30 s at 95 °C, annealing for 30 s at 55 °C, and extension for1 min at 72 °C. The relative changes in gene expression werecalculated by the relative quantification method (2−ΔΔCt) andnormalized according to the expression in control conditions.
Immunoblotting
Total protein extracts were obtained from rat hypothalamicsamples and primary cultures of tanycytes. Samples were ho-mogenized in protease inhibitor cocktail (ROCHE) and soni-cated three times on ice at 300 W. Proteins were resolved bySDS-PAGE (50 μg/lane) in a 5–15% (w/v) polyacrylamidegel, transferred to PVDF membranes (0.45 μm pore,Amersham Pharmacia Biotech., Piscataway, NJ, USA), andprobed overnight at 4 °C with the following antibodies: chick-en anti-MCT1 (1:1000, MERCK, Darmstadt, Germany),chicken anti-MCT4 (1:1000, MERCK, Darmstadt,Germany), and mouse anti-β-actin (1:10,000; Santa Cruz).After extensive washing, the PVDF membranes were incubat-ed for 2 h at 4 °C with peroxidase-labeled rabbit anti-chickenor anti-goat (1:1000; Jackson ImmunoResearch Laboratories,Inc., PA, USA) secondary antibodies. The reactionwas carriedout using the enhanced chemiluminescence (ECL) Westernblot analysis system (Amersham Biosciences). Images shown
are representative of at least three samples originated from atleast three separate experiments. β-Actin expression levelswere used as a loading control for densitometric analysis.
Immunocytochemistry
In order to analyze the specificity of the adenovirus in vivo,the animals were injected with the adenovirus, and the brainswere collected at 48 and 96 h. The rat brains were fixed in 4%PFA by immersion for 48 h. Free-floating frontal hypothalam-ic slices of 40 μm thickness were obtained by a cryostat andsubsequently processed. Tissues were stained with chickenanti-vimentin (1:200; Millipore, Billerica, MA, USA), mouseanti-GFAP (1:200; Millipore), and rabbit anti-NeuN (1:5000;Abcam, Cambridge, MA, USA) antibody diluted in Tris-HClbuffer (pH 7.8) containing 1% bovine serum albumin. Afterextensive rinsing, the sections were incubated for 2 h at roomtemperature with Cy2- or Cy3-labeled secondary antibodies(1:200; Jackson ImmunoResearch Laboratories). TOPRO-3(1:1000; Invitrogen) was used as nuclei staining. The slideswere visualized and captured using confocal laser microscopyLSM 700 (Zeiss).
Lactate Uptake and Efflux Analysis
For lactate uptake and efflux assays, we following the methoddescribed previously [6]. Briefly, tanycyte primary cultureswere washed and placed in incubation buffer (15 mMHEPES [pH 7.0], 135 mM NaCl, 5 mM KCl, 1.8 mMCaCl2, 0.8 mM MgCl2, 320 mOsm) for 10 min at room tem-perature. Uptake assays were performed in 0.2 mL of incuba-tion buffer at 4 °C with two different L-lactate (Sigma-Aldrich) concentrations (0.1 and 25 mM) and 1–4 μCi ofL-[14C(U)] lactic acid sodium salt (> 100 mCi [3.70GBq]/mmol; PerkinElmer-NEN, Boston, MA, USA). Uptake wasstopped by washing the cells with ice-cold stop buffer (incu-bation buffer plus 1mMHgCl2). Cells were lysed in 0.4 mL oflysis buffer (10 mM Tris-HCl [pH 8.0], 0.2% SDS), and theincorporated radioactivity was quantified by liquid scintilla-tion counting.
For lactate release assays, cells were washed with 0.1 MPBS and incubated for several times in efflux buffer (44 mMsucrose, 10 mMHEPES [pH 7.4], 135 mMNaCl, 5 mMKCl,0.15 mM Na2HPO4, 0.2 mM KH2PO4, and 5 mM glucose).Supernatant was removed and assayed for lactate determina-tion using a high-performance liquid chromatography (HPLC)system from Merck Hitachi (Merck, Darmstadt, Germany),consisting in an L-6200 pump and a Hitachi L-4200 UV-VIS (225 nm) detector. Samples were separated by chroma-tography on an Aminex HPX-87H column (Bio-RadLaboratories, Hercules, CA, USA) of 300 × 7.8 mm. The mo-bile phase consisted of an isocratic solution of 20 mMH2SO4.The L-lactate peak was identified by comparison of its
Mol Neurobiol (2020) 57:896–909 907
retention time with that of a reference standard, and its con-centration was quantified using the area under the peak(Merck Hitachi D-2500 chromato-integrator).
Measurement of Blood Glucose
Blood samples for glucose measurements were taken by nee-dle puncture from the tail vein after 24 h in a fasting conditionto ensure a hypoglycemic state. Blood glucose measurementsperformed on whole blood were made with an Accu-Chek Go(Roche) glucometer.
Measurement of Food Intake
Rats were handled for 1 week each day to become accustomedto the researchers and experimental procedures. This includedremoval of the rats from the cage to measure food intake andbody weight. Food intake was quantified by providing rats adefined mass of chow and weighing the food not consumedfood after a defined time interval. Food intake was expressedas grams consumed per 200 g of body weight (g/200 g bodyweight). Every interaction with the feeder was recorded by acomputerized data acquisition system (VitalView,Respironics, Inc., Murraysville, PA, USA). A meal was de-fined as a bout at the feeder that was larger than 5 s, and theseevents were separated from other feeding bouts by more than10 min of inter-meal interval [15, 24]. When bouts of feedingwere longer than 30 min, they were considered two mealevents. The meal pattern parameters were calculated as fol-lows: inter-meal interval (min), meal frequency (number), cu-mulative meal frequency (number), mean meal size (mg/meal), mean meal duration (min/meal), and eating rate (mg/min). The inter-meal interval was calculated as the periodbetween the end of one meal and the initiation of the subse-quent one. The cumulative meal frequency was defined as thetotal meals in 24 h. The mean meal size was determined as thetotal food intake (mg) divided by frequency. The mean mealduration was calculated by dividing the total meal duration(min) by meal frequency, and the eating rate was estimatedby dividing total food intake (mg) by total meal duration(min).
Statistical Analyses
For statistical analysis, each treatment was compared to itsrespective control. Significant differences were determinedusing the Student’s t test and Mann-Whitney post-hoc U testor one-way ANOVA with multiple comparison test.Differences were considered significant when p < 0.05 usingGraphPad Prism 5.0 Software (GraphPad Software Inc., SanDiego, CA, USA). Results were expressed as mean ± standarddeviation (SD), and n refers to the number of animals used.
Acknowledgments The authors thank Dra. Marjet Heitzer for her helpfuldiscussion and suggestions on the manuscript.
Author Contributions The experiments were performed at theDepartment of Cell Biology at the University of Concepcion. MA.G-R,K.O, and R.E-V conceived the experiments; MA.G-R and R.E-V de-signed the experiments; R.E-V, K.O, M.S, MJ. B, A.R, P.O, S.L, andP.L-C performed the experiments; MA.G-R, K.O, and R.E-V analyzedthe data; MA.G-R, R.E-V, P.L-C, R.P, and K.O contributed reagents/ma-terials/analysis tools; R.E-V, K.O, andMA.G-R wrote the paper; and KO,R.E-V, M.S, A.R, P.O, S.L, R.P, and MA.G-R critically revised themanuscript.
Funding Information Grant sponsor: FONDECYT; Grant number:1180871.
Compliance with Ethical Standards
All studies performed using animals were in strict accordance with theGuidance on the Operation of the Animals (Scientific Procedures) Act1986 and approved by Animal Ethics Committee of the Chile’s NationalCommission for Scientific and Technological Research (CONICYT, pro-tocol for project no. 1180871) and the appropriate Ethics and AnimalCare and Use Committee of the Universidad de Concepción, Chile (per-mit number 2010101A).
Disclaimer All authors have approved the final version of the manu-script and agree to be accountable for all aspects of the work in ensuringthat questions related to the accuracy or integrity of any part of the workare appropriately investigated and resolved. All persons designated asauthors qualify for authorship, and all those who qualify for authorshipare listed.
Conflict of Interest The authors declare that they have no competinginterests.
Open Access This article is distributed under the terms of the CreativeCommons At t r ibut ion 4 .0 In te rna t ional License (h t tp : / /creativecommons.org/licenses/by/4.0/), which permits unrestricted use,distribution, and reproduction in any medium, provided you give appro-priate credit to the original author(s) and the source, provide a link to theCreative Commons license, and indicate if changes were made.
References
1. Elias CF, Lee C, Kelly J, Aschkenasi C, Ahima RS, Couceyro PR,Kuhar MJ, Saper CB et al (1998) Leptin activates hypothalamicCART neurons projecting to the spinal cord. Neuron 21:1375–1385
2. Kristensen P, Judge ME, Thim L, Ribel U, Christjansen KN, WulffBS, Clausen JT, Jensen PB et al (1998) Hypothalamic CART is anew anorectic peptide regulated by leptin. Nature 393:72–76
3. Swart I, Jahng JW, Overton JM, Houpt TA (2002) HypothalamicNPY, AGRP, and POMC mRNA responses to leptin and refeedingin mice. Am J Physiol Regul Integr Comp Physiol 283:R1020–R1026
4. Wynne K, Stanley S, McGowan B, Bloom S (2005) Appetite con-trol. J Endocrinol 184:291–318
5. Orellana JA, Saez PJ, Cortes-Campos C et al (2012) Glucose in-creases intracellular free Ca(2+) in tanycytes via ATP releasedthrough connexin 43 hemichannels. Glia 60:53–68
Mol Neurobiol (2020) 57:896–909908
6. Cortes-Campos C, Elizondo R, Llanos P, Uranga RM, Nualart F,Garcia MA (2011) MCT expression and lactate influx/efflux intanycytes involved in glia-neuron metabolic interaction. PLoSOne 6:e16411
7. Bergersen LH, Magistretti PJ, Pellerin L (2005) Selective postsyn-aptic co-localization of MCT2 with AMPA receptor GluR2/3 sub-units at excitatory synapses exhibiting AMPA receptor trafficking.Cereb Cortex 15:361–370
8. Elizondo-Vega R, Garcia-Robles MA (2017) Molecular character-istics, regulation, and function of monocarboxylate transporters.Adv Neurobiol 16:255–267
9. Cortes-Campos C, Elizondo R, Carril C, Martinez F, Boric K,Nualart F, Garcia-Robles MA (2013) MCT2 expression and lactateinflux in anorexigenic and orexigenic neurons of the arcuate nucle-us. PLoS One 8:e62532
10. Lam CK, Chari M, Wang PY, Lam TK (2008) Central lactate me-tabolism regulates food intake. Am J Physiol Endocrinol Metab295:E491–E496
11. Elizondo-Vega R, Cortes-Campos C, Barahona MJ, Carril C,Ordenes P, Salgado M, Oyarce K, Garcia-Robles ML (2016)Inhibition of hypothalamic MCT1 expression increases food intakeand alters orexigenic and anorexigenic neuropeptide expression.Sci Rep 6:33606
12. Barahona MJ, Llanos P, Recabal A, Escobar-Acuña K, Elizondo-Vega R, Salgado M, Ordenes P, Uribe E et al (2018) Glial hypotha-lamic inhibition of GLUT2 expression alters satiety, impacting eat-ing behavior. Glia 66:592–605
13. Uranga RM, Millan C, Barahona MJ et al (2017) Adenovirus-mediated suppression of hypothalamic glucokinase affects feedingbehavior. Sci Rep 7:3697
14. Bady I, Marty N, Dallaporta M, Emery M, Gyger J, Tarussio D,Foretz M, Thorens B (2006) Evidence from glut2-null mice thatglucose is a critical physiological regulator of feeding. Diabetes55:988–995
15. Carneiro L, Geller S, Fioramonti X, Hebert A, RepondC, LeloupC,Pellerin L (2016a) Evidence for hypothalamic ketone body sensing:impact on food intake and peripheral metabolic responses in mice.Am J Physiol Endocrinol Metab 310:E103–E115
16. Carneiro L, Geller S, Hebert A, Repond C, Fioramonti X, LeloupC,Pellerin L (2016b) Hypothalamic sensing of ketone bodies afterprolonged cerebral exposure leads to metabolic control dysregula-tion. Sci Rep 6:34909
17. Lauritzen KH, Morland C, Puchades M, Holm-Hansen S, HagelinEM, Lauritzen F, Attramadal H, Storm-Mathisen J et al (2014)Lactate receptor sites link neurotransmission, neurovascular cou-pling, and brain energy metabolism. Cereb Cortex 24:2784–2795
18. Tang F, Lane S, Korsak A, Paton JF, Gourine AV, Kasparov S,Teschemacher AG (2014) Lactate-mediated glia-neuronal signal-ling in the mammalian brain. Nat Commun 5:3284
19. Matsuyama S, Ohkura S, Iwata K et al (2009) Food deprivationinduces monocarboxylate transporter 2 expression in the brainstemof female rat. J Reprod Dev 55:256–261
20. Chavan R, Feillet C, Costa SS, Delorme JE, Okabe T, Ripperger JA,Albrecht U (2016) Liver-derived ketone bodies are necessary forfood anticipation. Nat Commun 7:10580
21. Perez-Escuredo J, Van Hee VF, Sboarina M, Falces J, Payen VL,Pellerin L, Sonveaux P (2016) Monocarboxylate transporters in thebrain and in cancer. Biochim Biophys Acta 1863:2481–2497
22. Garcia M, Millan C, Balmaceda-Aguilera C et al (2003)Hypothalamic ependymal-glial cells express the glucose transport-er GLUT2, a protein involved in glucose sensing. J Neurochem 86:709–724
23. Salgado M, Tarifeno-Saldivia E, Ordenes P et al (2014) Dynamiclocalization of glucokinase and its regulatory protein in hypotha-lamic tanycytes. PLoS One 9:e94035
24. Fioramonti X, Contie S, Song Z, Routh VH, Lorsignol A, PenicaudL (2007) Characterization of glucosensing neuron subpopulationsin the arcuate nucleus: integration in neuropeptide Y and pro-opiomelanocortin networks? Diabetes 56:1219–1227
Publisher’s Note Springer Nature remains neutral with regard to jurisdic-tional claims in published maps and institutional affiliations.
Mol Neurobiol (2020) 57:896–909 909