ininvveesstitinngg i inn s smmaallllhhoollddeerr...
TRANSCRIPT

1
Investing in Smallholder Livestock: Investing in Smallholder Livestock:
A Private Sector Perspective on A Private Sector Perspective on
Development Development
World Bank Agriculture and Rural Development Week World Bank Agriculture and Rural Development Week
Bradley J. Buck Bradley J. Buck March 3, 2009 March 3, 2009

2
Question…
Can smallholder livestock producers survive and compete in
rapidly globalizing livestock markets?

3
Drivers to Yes
n Demand pull: n Increasing local, regional and global demand
n Supply response: n 65 75% of the global livestock herd is owned by smallholder farmers
n Success stories n India n Kenya n Ethiopia
demand for livestock products

4
Presentation Focus
Opportunities and methods for smallholder inclusion in livestock & livestock product valuechains.
n Investment framework n Growth drivers n Return on investment

5
Investment Framework
n Use analysis to guide and target investment n Follow market and economic principles n Leverage resources through publicprivate partnerships and scalable investments throughout the value chain
6
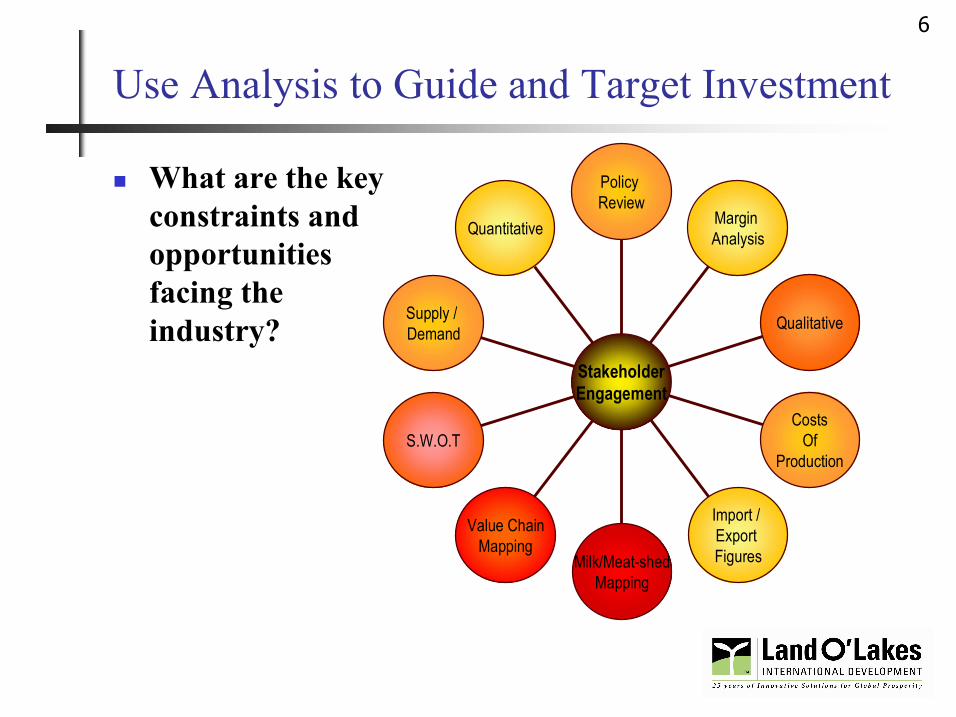
Use Analysis to Guide and Target Investment
n What are the key constraints and opportunities facing the industry?
Policy Review
Margin Analysis
Qualitative
Costs Of
Production
Import / Export Figures Milk/Meatshed
Mapping
Value Chain Mapping
S.W.O.T
Supply / Demand
Quantitative
Stakeholder Engagement

7
Global Enabling Environment
Local / National Enabling Environment
Producers Producers
Processors Processors
Retailers Retailers
Exporters Exporters
Global/Regional Retailers
Global/Regional Retailers
Transporters Transporters
Traders Traders
Input Providers Input
Providers
Financial Service Providers
Financial Service Providers
Vendors Vendors
Consumers Consumers
Policies Policies
Standards Standards
Inspection/ Surveillance Inspection/ Surveillance
Research Research
Assembly Groups
Assembly Groups
Support Markets
Workforce development Workforce
development
Business/ Technical Service Providers
Business/ Technical Service Providers
Valuechain Analysis Private Sector Capacity Private Sector Capacity Increase Demand Increase Demand

8
Global Enabling Environment
Local / National Enabling Environment
Producers Producers
Processors Processors
Retailers Retailers
Exporters Exporters
Global/Regional Retailers
Global/Regional Retailers
Transporters Transporters
Traders Traders
Input Providers Input
Providers
Financial Service Providers
Financial Service Providers
Vendors Vendors
Consumers Consumers
Policies Policies
Standards Standards
Inspection/ Surveillance Inspection/ Surveillance
Research Research
Assembly Groups
Assembly Groups
Support Markets
Workforce development Workforce
development
Business/ Technical Service Providers
Business/ Technical Service Providers
Valuechain Analysis Informal Informal Markets Markets

9
Follow Market & Economic Principles
n Fundamentals of supply & demand n Economic viability n Market incentives
n And when these principles are not used n Inappropriate infrastructure development n Restocking not integrated into markets n Low rates of technology adoption n Failed farms and businesses
10
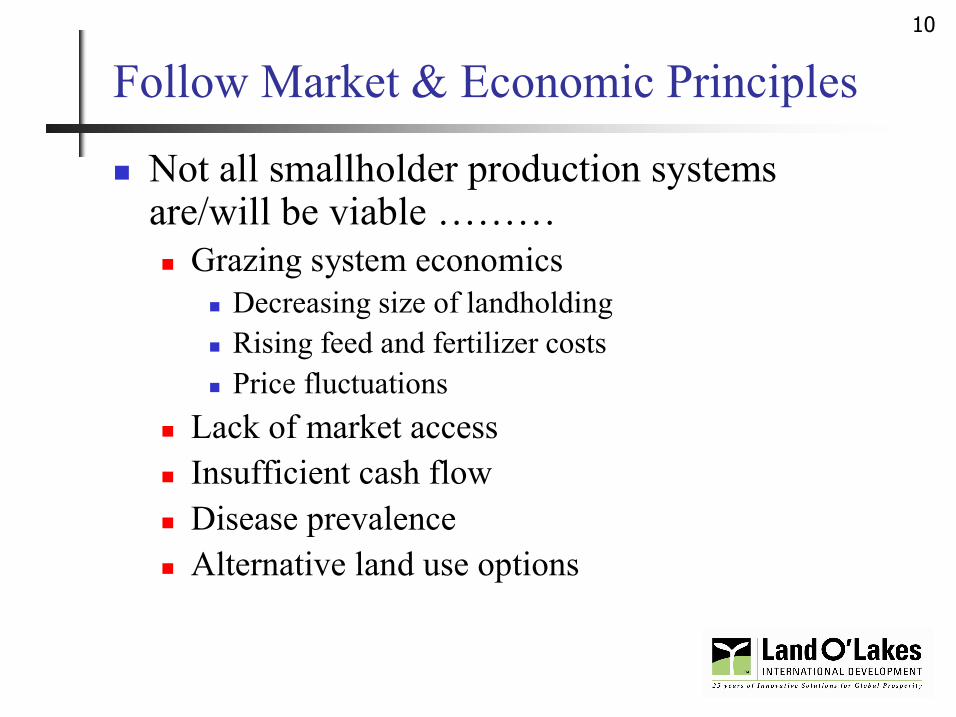
Follow Market & Economic Principles
n Not all smallholder production systems are/will be viable ……… n Grazing system economics
n Decreasing size of landholding n Rising feed and fertilizer costs n Price fluctuations
n Lack of market access n Insufficient cash flow n Disease prevalence n Alternative land use options

11
Leverage Resources
Private Sector
National Government
NGO’s
Research Institutions
Donor Agencies
Foundations
Maximizing impact and return on investment

12
Global Enabling Environment
Local / National Enabling Environment
Producers Producers
Processors Processors
Retailers Retailers
Global/Regional Retailers
Global/Regional Retailers
Input Providers Input
Providers
Financial Service Providers
Financial Service Providers
Support Markets
Business/ Technical Service Providers
Business/ Technical Service Providers
Example: Malawi
•Net Importer of milk products
•Underutilized milk processing and collection infrastructure
•Small dairy herd
•Recent restocking initiatives
•Private sector investment in UHT
•Fledgling inputs industry
•Limited Extension services
Milk Bulking Groups
Milk Bulking Groups

13
Global Enabling Environment
Local / National Enabling Environment
Producers Producers
Processors Processors
Retailers Retailers
Global/Regional Retailers
Global/Regional Retailers
Input Providers Input
Providers
Financial Service Providers
Financial Service Providers
Support Markets
Business/ Technical Service Providers
Business/ Technical Service Providers
Malawi Dairy Development Alliance
Strategic Objective:
To increase dairy production and productivity in the Northern and Central milksheds of Malawi to achieve economies of scale in milk production required to meet consumer demand and ensure the commercial viability of farmer owned Milk Bulking Groups, private dairy processors and input supply and service providers.
Milk Bulking Groups
Milk Bulking Groups

14
Expanded farmer access to: •Feed •Breeding Services •Financial Services
•Restocking •Refurbishing MCCs •Upgraded processing plant •Milk supply delivery agreements •Credit guarantee for working assets •Industry capacity building •Competitiveness initiatives •Restocking •Training of extension staff •Farmlevel upgrades •Breeding services •Internal capacity building
Approach: Malawi Dairy Development Alliance
USAID / Land O’Lakes
NGOs
Input & Service Providers
Lilongwe Dairies
Government of Malawi
Farmers & Farmer Associations

15 Investment: Malawi Dairy Development Alliance
n USAID initial investment n US$ 2.5 million
n Total investment over 2 years n US$11 million
Dairy Sector Investment (US$ millions)
Leveraged Funds 8.5
USAID 2.5

16 Outcomes: Malawi Dairy Development Alliance n Milk processing capacity utilization
n 60% increase n Local milk supply
n 40% increase n Employment expansion
n 700+ positions in private firms n Extension provision
n 300 Government extension agents with improved capacity

17
Public vs. Private Sector Investments
n Driven by analysis, market/economic principles and available resources
n Public sector investments can… n Attract/facilitate private sector investment n Promote environment for increased competitiveness and trade n Buydown high cost and/or risk of entry n Facilitate capital flows n Create social safety nets (e.g., income, nutrition)
n Some grey areas… n Market distortions n Market/price stabilization n Defining public goods

18
Focusing Investment on Growth Drivers
n Market facilitation n Achieving economies of scale n Access to and utilization of productivityenhancing inputs, services and technologies
n Fostering an enabling environment for competitiveness

19
Global Enabling Environment
Local / National Enabling Environment
Producers Producers
Processors Processors
Retailers Retailers
Exporters Exporters
Global/Regional Retailers
Global/Regional Retailers
Transporters Transporters
Traders Traders
Input Providers Input
Providers
Financial Service Providers
Financial Service Providers
Vendors Vendors
Consumers Consumers
Policies Policies
Standards Standards
Inspection/ Surveillance Inspection/ Surveillance
Research Research
Assembly Groups
Assembly Groups
Support Markets
Workforce development Workforce
development
Business/ Technical Service Providers
Business/ Technical Service Providers
D1: Market Facilitation

20 Example: Ethiopia Meat
n Facilitating exports n Development & training of Ethiopian meat traders association
n Assessment of foreign market opportunities, understanding consumer demand
n Creating direct contacts with Middle Eastern markets
n Expansion of live animal trade to chilled meat
n Linkages with programs focused on supply chain

21 Example: Macedonia Seal of Quality
n Interventions n Business management n Value addition n Product standards &
certification criteria n Seal of Quality
education campaign
n Upgraded the SOQ standards for meat, poultry and dairy products
n Established National Meat and Dairy Association + Quality Control (QC) Lab
n SOQ for 99 meat & dairy products n 48% of companies participating in the SOQ program increased profitability by at least 15 percent
n 1997 to 2005: market share of locally processed meat and dairy products grew from 35 to 74 percent, and from 56 to 87 percent, respectively.

22
D2: Achieving Economies of Scale
n Aggregate meat and milk supply to: n Increase efficiencies in supplychain management
n Centralize quality control n Create viable input and service markets

23 Example: Kenya Milkshed Assessment
n Use mapping to focus and prioritize investments
n Evaluate existing/required infrastructure
n Form/strengthen producer groups
n Similar approach to meat

24 D3: Increasing Access to and Utilization of Productivity enhancing of Inputs, Services and Technologies
n Utilize private (and public) providers of n Inputs: feed, seed, fertilizers, farm implements n Services: breeding, veterinary, extension, financing n Technologies: silage making, sexed semen, biogas, milk analyzers

25
Global Enabling Environment
Local / National Enabling Environment
Producers Producers
Processors Processors
Retailers Retailers
Exporters Exporters
Global/Regional Retailers
Global/Regional Retailers
Transporters Transporters
Traders Traders
Input Providers Input
Providers
Financial Service Providers
Financial Service Providers
Vendors Vendors
Consumers Consumers
Policies Policies
Standards Standards
Inspection/ Surveillance Inspection/ Surveillance
Research Research
Assembly Groups
Assembly Groups
Support Markets
Workforce development Workforce
development
Business/ Technical Service Providers
Business/ Technical Service Providers
D4: Enabling Environment for Competitiveness

26 Example: Harmonization of EAC/COMESA Standards
n Objectives n Ease and enable dairy product trade and commerce within EAC and COMESA
n Adopt a single set of product Standards recognized and implemented by all members of EAC and COMESA
n Recognized and accepted internationally
n Reference EAC and COMESA Standards to n CODEX (Codex Alimentarius Commission), n ISO (International Standards Organization) n IDF (International Dairy Federation)

27 Example: Harmonization of EAC/COMESA Standards
n Participating countries n Kenya, Uganda, Tanzania + DRC, Egypt, Ethiopia, Madagascar, Malawi, Mauritius, Rwanda, Sudan, Zambia, and Zimbabwe
n Product standards developed n Raw Cow’s Milk n Pasteurized and UHT Milk n Butter and Whey Butter n Yoghurt and Sweetened Yoghurt n Dairy Milk ices and Dairy Ice Cream n Sweetened Condensed Milk n Dried Whole Milk Powder and Skimmed Milk Powder
n 42 chemical and bacteriological analytical methods Standards

28
Measuring Return on Investment
n Performance indicators n Impact studies n Multiplier effect

29
Performance Indicators
n HH income (net) n Volume and value of production and/or sale
n Yield/weight increases n Reduced mortality n Milk/meat meeting quality standards
n Adoption of NRM practices
n Employment generation n Participation of women and youth

30
Impact Assessment: Kenya
n Independent evaluation of USAIDfunded Kenya Dairy Development Program
n $US 7.8 m investment n 2003 – 2007 n Implementing partners: Land O’Lakes, International Livestock Research Institute, African Breeders ServiceTotal Cattle Management, and World Wide Sires

31
Example: Kenya
n Findings: quantitative n 70,752 farmers trained, 64% adopted improved farm management practices
n $US 39 m increase in net income for farmers n 3,050 full time equivalent annual jobs n 10,874 farms moved above poverty line n 230 million liter increase in milk production ($US 53 m value)
n IRR on net farm profits = 132%

32
Example: Kenya
n Findings: qualitative (focus groups) n Increased onfarm milk consumption (12 lts) n Improved health of children n Reduced school absenteeism n Lower stress with higher income n School fees guaranteed with letter from MBG n Community recognition (esp. women) n Manure for fertilizer and biogas
33
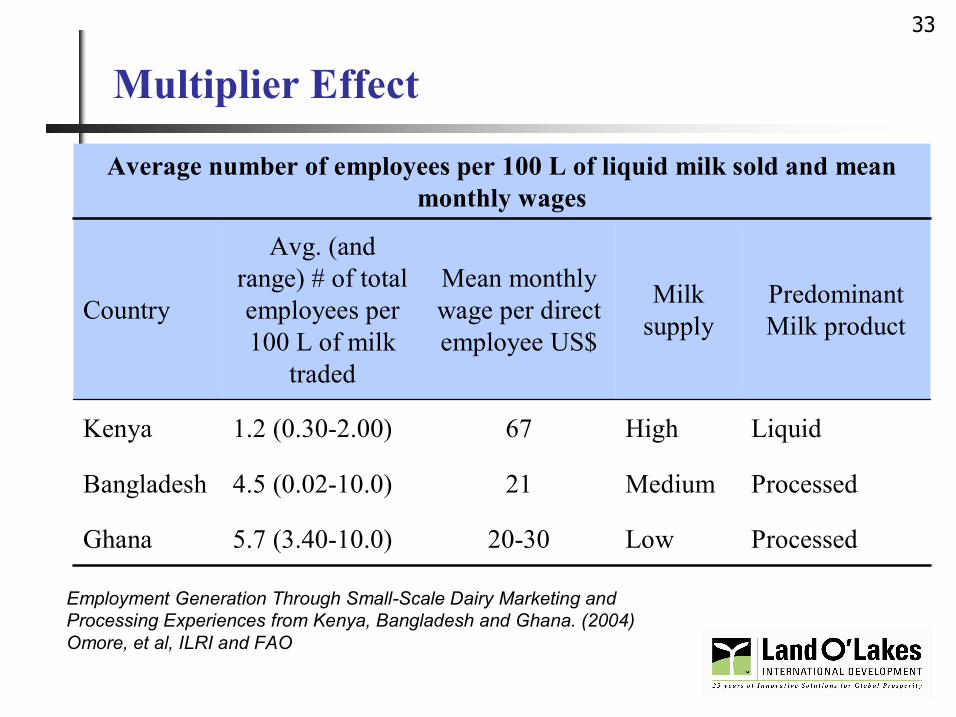
Multiplier Effect
Processed Low 2030 5.7 (3.4010.0) Ghana
Processed Medium 21 4.5 (0.0210.0) Bangladesh
Liquid High 67 1.2 (0.302.00) Kenya
Predominant Milk product
Milk supply
Mean monthly wage per direct employee US$
Avg. (and range) # of total employees per 100 L of milk
traded
Country
Average number of employees per 100 L of liquid milk sold and mean monthly wages
Employment Generation Through SmallScale Dairy Marketing and Processing Experiences from Kenya, Bangladesh and Ghana. (2004) Omore, et al, ILRI and FAO

34
Take Away…
n Through smart, targeted investments, smallholder livestock producers can participate in and benefit from expanding markets

35 Land O’Lakes, Inc. Corporate Background
n An agribusiness cooperative with member owners in 39 states; 9,000+ employees
n Established in 1921 by dairy producers and processors in Minnesota, USA
n Third largest cooperative in the US n #3 dairy company n #1 livestock feed company n #1 crop protection products wholesaler n #3 farm seed company n #2 shell egg company

36 Land O’Lakes International Development
Background n Created in 1981 as a division of Land O’Lakes, Inc. n Express the values and good will of our members n Develop global awareness within the company n Transfer knowledge, skills and technologies
Experience n 150 projects in over 70 developing and transitional countries n Work in agriculture and food systems
Resources n Staff of 300 employees worldwide n Funding from USAID and USDA n Work with multiple implementing partners

37
Project Countries in 2008
Russia/Siberia
Angola Ethiopia Kenya Madagascar Malawi
Sudan Tanzania Uganda Zambia
Albania
Mozambique Nigeria Rwanda Senegal South Africa
Afghanistan Bangladesh Pakistan Sri Lanka
East Timor Philippines
Kosovo
Dominican Republic

38
For Further Information…
Asia Programs – Zaheer Baber, Land O’Lakes Regional Director; Arden Hills, Minnesota, email: [email protected]; Phone: +1 651 494 5100
Africa Programs – Dr. Joe Carvalho, Land O’Lakes Regional Director; Nairobi, Kenya; email: [email protected]; Phone: +254 20 374 6034
Global Inquiries – Bradley Buck, Land O’Lakes Director, Business and Practice Expansion; Washington DC; email: [email protected]; Phone: +1 703 247 7565