initial flight test evaluation of the f-15 active ... initial flight test evaluation of the f-15...
TRANSCRIPT

NASA/TM-1998-206558
Initial Flight Test Evaluation of the F-15 ACTIVE Axisymmetric Vectoring Nozzle Performance
John S. OrmeDryden Flight Research CenterEdwards, California
Ross HathawayAnalytical Services & MaterialsEdwards, California
Michael D. FergusonUnited Technologies CorporationPratt & WhitneyWest Palm Beach, Florida
July 1998

The NASA STI Program Office . . . in Profile
Since its founding, NASA has been dedicatedto the advancement of aeronautics and space science. The NASA Scientific and Technical Information (STI) Program Office plays a keypart in helping NASA maintain thisimportant role.
The NASA STI Program Office is operated byLangley Research Center, the lead center forNASA’s scientific and technical information.The NASA STI Program Office provides access to the NASA STI Database, the largest collectionof aeronautical and space science STI in theworld. The Program Office is also NASA’s institutional mechanism for disseminating theresults of its research and development activities. These results are published by NASA in theNASA STI Report Series, which includes the following report types:
• TECHNICAL PUBLICATION. Reports of completed research or a major significantphase of research that present the results of NASA programs and include extensive dataor theoretical analysis. Includes compilations of significant scientific and technical data and information deemed to be of continuing reference value. NASA’s counterpart of peer-reviewed formal professional papers but has less stringent limitations on manuscriptlength and extent of graphic presentations.
• TECHNICAL MEMORANDUM. Scientificand technical findings that are preliminary orof specialized interest, e.g., quick releasereports, working papers, and bibliographiesthat contain minimal annotation. Does notcontain extensive analysis.
• CONTRACTOR REPORT. Scientific and technical findings by NASA-sponsored contractors and grantees.
• CONFERENCE PUBLICATION. Collected papers from scientific andtechnical conferences, symposia, seminars,or other meetings sponsored or cosponsoredby NASA.
• SPECIAL PUBLICATION. Scientific,technical, or historical information fromNASA programs, projects, and mission,often concerned with subjects havingsubstantial public interest.
• TECHNICAL TRANSLATION. English- language translations of foreign scientific and technical material pertinent toNASA’s mission.
Specialized services that complement the STIProgram Office’s diverse offerings include creating custom thesauri, building customizeddatabases, organizing and publishing researchresults . . . even providing videos.
For more information about the NASA STIProgram Office, see the following:
• Access the NASA STI Program Home Pageat
http://www.sti.nasa.gov
• E-mail your question via the Internet to [email protected]
• Fax your question to the NASA Access HelpDesk at (301) 621-0134
• Telephone the NASA Access Help Desk at(301) 621-0390
• Write to:NASA Access Help DeskNASA Center for AeroSpace Information7121 Standard DriveHanover, MD 21076-1320

NASA/TM-1998-206558
Initial Flight Test Evaluation of the F-15 ACTIVE Axisymmetric Vectoring Nozzle Performance
John S. OrmeDryden Flight Research CenterEdwards, California
Ross HathawayAnalytical Services & MaterialsEdwards, California
Michael D. FergusonUnited Technologies CorporationPratt & WhitneyWest Palm Beach, Florida
July 1998
National Aeronautics andSpace Administration
Dryden Flight Research CenterEdwards, California 93523-0273

NOTICE
Use of trade names or names of manufacturers in this document does not constitute an official endorsementof such products or manufacturers, either expressed or implied, by the National Aeronautics andSpace Administration.
Available from the following:
NASA Center for AeroSpace Information (CASI) National Technical Information Service (NTIS)7121 Standard Drive 5285 Port Royal RoadHanover, MD 21076-1320 Springfield, VA 22161-2171(301) 621-0390 (703) 487-4650
INITIAL FLIGHT TEST EVALUATION OF THE F-15 ACTIVE AXISYMMETRIC VECTORING NOZZLE PERFORMANCE
John S. Orme*
NASA Dryden Flight Research CenterEdwards, CA
Ross Hathaway†
Analytical Services & MaterialsEdwards, CA
Michael D. Ferguson‡
United Technologies CorporationPratt & Whitney
West Palm Beach, FL
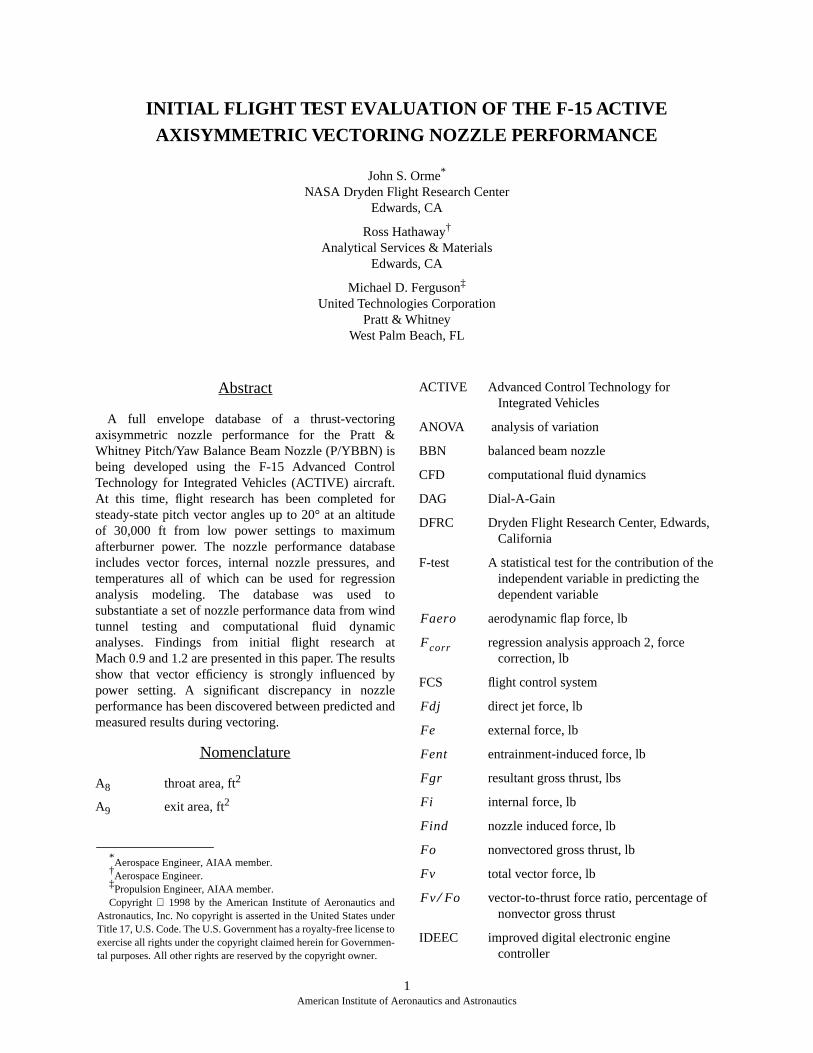
Abstract
A full envelope database of a thrust-vectoringaxisymmetric nozzle performance for the Pratt &Whitney Pitch/Yaw Balance Beam Nozzle (P/YBBN) isbeing developed using the F-15 Advanced ControlTechnology for Integrated Vehicles (ACTIVE) aircraft.At this time, flight research has been completed forsteady-state pitch vector angles up to 20° at an altitudeof 30,000 ft from low power settings to maximumafterburner power. The nozzle performance databaseincludes vector forces, internal nozzle pressures, andtemperatures all of which can be used for regressionanalysis modeling. The database was used tosubstantiate a set of nozzle performance data from windtunnel testing and computational fluid dynamicanalyses. Findings from initial flight research atMach 0.9 and 1.2 are presented in this paper. The resultsshow that vector efficiency is strongly influenced bypower setting. A significant discrepancy in nozzleperformance has been discovered between predicted andmeasured results during vectoring.
Nomenclature
A8 throat area, ft2
A9 exit area, ft2
1American Institute of Aero
*Aerospace Engineer, AIAA member.†Aerospace Engineer.‡Propulsion Engineer, AIAA member.Copyright 1998 by the American Institute of Aeronautics and
Astronautics, Inc. No copyright is asserted in the United States underTitle 17, U.S. Code. The U.S. Government has a royalty-free license toexercise all rights under the copyright claimed herein for Governmen-tal purposes. All other rights are reserved by the copyright owner.
ACTIVE Advanced Control Technology for Integrated Vehicles
ANOVA analysis of variation
BBN balanced beam nozzle
CFD computational fluid dynamics
DAG Dial-A-Gain
DFRC Dryden Flight Research Center, Edwards, California
F-test A statistical test for the contribution of the independent variable in predicting the dependent variable
aerodynamic flap force, lb
regression analysis approach 2, force correction, lb
FCS flight control system
direct jet force, lb
external force, lb
entrainment-induced force, lb
resultant gross thrust, lbs
internal force, lb
nozzle induced force, lb
nonvectored gross thrust, lb
total vector force, lb
vector-to-thrust force ratio, percentage of nonvector gross thrust
IDEEC improved digital electronic engine controller
Faero
Fcorr
Fdj
Fe
Fent
Fgr
Fi
Find
Fo
Fv
Fv Fo⁄
nautics and Astronautics

IFT in-flight thrust model
IPE improved performance engine
LaRC Langley Research Center, Hampton, Virginia
Max 130° of power setting
Mil 85° of power setting
MPD multipurpose display
MUX Military Standard 1553 multiplex databus
NC nozzle control computer
NPR nozzle pressure ratio
OAR optimum area ratio
P-test A statistical test for the probability of being wrong in concluding there is an association between variables
P0 ambient pressure
Pt6 total pressure of engine augmentor, lb/in2
PW Pratt & Whitney, West Palm Beach, Florida
P/YBBN Pitch/Yaw Balance Beam Nozzle
R2 coefficient of determination
S/MTD Short Take-Off and Landing/Maneuver Technology Demonstrator
sync ring annular synchronization ring
Tt2 total temperature at engine face, °F
USAF United States Air Force
VMSC vehicle management system computer
2D two-dimensional
force angle, deg
metal angle, deg
plume angle, deg
vector efficiency, percentage of metal angle
regression analysis approach 1, angle correction, deg
regression analysis approach 4, angle correction, deg
regression analysis approach 3, vector force effectiveness, lb
Introduction
Future aircraft designers could benefit from theavailability of efficient thrust vectoring nozzles.
Because thrust vectoring may efficiently produce pitchand/or yaw forces and moments with relatively less dragthan conventional aerodynamic surfaces, vectoringnozzles could augment or possibly replace aerodynamiccontrols altogether. Thrust vectoring enables potentialimprovements in aircraft maneuverability by providingaircraft with forces and moments in some regions of theflight envelope that are more effective than aerodynamicsurfaces. Additionally, aircraft safety enhancementscould be realized with thrust vectoring when vectoringnozzles are used as redundant or backup controleffectors to aerodynamic surfaces. Use of trade namesor names of manufacturers in this document does notconstitute an official endorsement of such products ormanufacturers, either expressed or implied, by theNational Aeronautics and Space Administration.
Background
Thrust vectoring aircraft offer numerous advantagesover conventionally equipped aircraft, includingimproved maneuverability, survivability, and aircraftcruise performance.1 Many turbofan engines of today’shigh-performance aircraft include nonvectoring nozzlesof axisymmetric design, such as the General ElectricF404 and Pratt & Whitney F100. The performancepotential of vectoring axisymmetric nozzles has beeninvestigated and predicted in subscale wind tunnel testsand in analytical studies.2, 3, 4 Ultimately, however, onlywith the application and validation available from flighttests may the full-scale vectoring nozzle performancepotential be realized.
Vectoring additions to the F404 and the F100 engineshave been the focus of recent flight research testprograms.5, 6 With the development of the Pitch/YawBalance Beam Nozzle (P/YBBN), Pratt & Whitney(PW) of West Palm Beach, Florida has extended thecapabilities of their standard F100 nozzle to includeaxisymmetric vectoring and independent exit areacontrol. Requiring very few engine changes, theP/YBBN mated with an F100 offers up to 20° ofaxisymmetric vectoring, and provides for up to 4000 lbvector force, normal to the engine centerline.
To mature vectoring axisymmetric nozzle technologyand assess in-flight the operability and performance ofthe P/YBBN design, two F100-PW-229 engines weremodified with the addition of two P/YBBN. The aircraftchosen to host the vectoring propulsion system was thehighly modified F-15 ACTIVE (Advanced ControlTechnology for Integrated Vehicles) vehicle. Flighttesting is currently being conducted at the NASA DrydenFlight Research Center (DFRC), Edwards, California.
δ f
δm
δp
ηv
θcorr1
θcorr4
µ f
2American Institute of Aeronautics and Astronautics

ACTIVE Flight Research Program
The F-15 ACTIVE flight test team consists of anindustry and government partnership involving Pratt &Whitney, Boeing Phantom Works (St. Louis, Missouri),United States Air Force (USAF) Wright Laboratories,and NASA DFRC. Conceived in 1992, the program wasdesigned to mature and evaluate a thrust vectoringsystem as it is gradually and fully integrated with theadvanced aircraft flight control capability unique to theF-15 ACTIVE.
Aircraft modifications required to integrate theP/YBBN vectoring system included structuralreinforcement and avionics upgrades. Flight clearancewas granted after an installed static ground test verifiedaircraft and vectoring system modifications with the full4000 lb vector and 20° of vector angle. This test alsoprovided the first opportunity to evaluate nozzleperformance, although nozzle pressure ratios andgeometries were far from design operating conditions.
Following the ground tests, the first flight researchoperation occurred on February 14, 1996. Flightresearch was divided into two phases: nozzle envelope-expansion and nozzle performance. During the initialnozzle envelope expansion, operability andcompatibility issues of the integrated F-15 ACTIVEvehicle and vectoring system were addressed. Envelope-expansion cleared nozzle operation to 6.5 g, Mach 2.0,1600 lb/ft2 dynamic pressure, and 30° angle of attack,allowing adequate capability to meet the programsresearch requirements.
One of the program’s major flight research objectivesis to measure and evaluate thrust vectoring nozzleperformance and the potential improvements in aircraftperformance. Initial nozzle performance flight data weregathered during the summer and fall of 1996. In-flightnozzle loads were directly measured at the enginemounts using a pioneering approach that significantlyaided both the nozzle envelope expansion and researchtest phases.7 In coordination with precisely controlledengine and nozzle configurations, a valuable database isbeing generated that was never before available. Thisdatabase can contribute to understanding the capabilitiesand characteristics of the axisymmetric vectoringP/YBBN. Up to this date, a limited amount of high-quality nozzle performance data has been collected atsubsonic and supersonic conditions, spanning nozzlepressure ratios from 3.7 to 7.5. Data from Mach 0.9 andan altitude of 30,000 ft is considered as a base-pointflight condition for comparison of future data analysis.Results shown in this report highlight the initial findings
of the ACTIVE nozzle performance flight testing atMach 0.9 and 1.2 at an altitude of 30,000 ft. A review ofcritical flight instrumentation, test technique, andplanning are also included. To aid the interpretation ofthe data, a regression analysis technique was appliedand vector performance models developed.
Nozzle Performance Flight TestResearch Objectives
Flight research of full-scale axisymmetric nozzlevectoring performance and flight validation ofpredictive methods are the primary objectives of theACTIVE nozzle performance testing. The nozzleperformance evaluation attempts to identify whatinfluences vectoring efficiency and how measuredperformance correlates with design tool predictions andwind tunnel results. Areas where predictions fall shortof tested nozzle performance are closely examined, tounderstand the differences and how the design tools maybe improved. This understanding is important because itmay lead to prediction tool improvements and bring tolight the strengths and weaknesses of theP/YBBN design. Table 1 lists the specific flight testresearch objectives.
The primary influences on nozzle performance for agiven area ratio and vector angle configuration areexpected to be nozzle pressure ratio, dynamic pressure,and Mach number, based upon data from analyticalmodels and limited wind tunnel testing. The flight testobjectives were derived in an attempt to span as large arange as possible for each of these parameters within thecleared portions of the F-15 ACTIVE envelope.
Nozzle Performance Evaluation
Propulsion system forces and nozzle loads weremeasured during parametric variations in power setting,Mach number, altitude, pitch vector angle, and area
Table 1. Nozzle performance flight test researchobjectives.
A. Identify baseline nozzle performance with1. NPR sweep at constant altitude 2. Altitude effects at constant Mach number3. NPR sweep at constant dynamic pressure
B. Identify nozzle performance at reduced area ratio
C. Evaluate and compare yaw nozzle performance with pitch vector
D. Identify nozzle performance at low power settings
3American Institute of Aeronautics and Astronautics

ratio. Specific levels of nozzle pressure ratio (NPR)were achieved through selection of the appropriatecombination of target power setting, Mach number, andaltitude. Exhaust plume angles were determined andcompared with the nozzle vector angle. Critical straingage instrumentation, that measured the engine mountloads and the flexible ACTIVE open-loop flight controlarchitecture to precisely position the nozzle, alloweduniquely valuable data of excellent quality to begathered during the flight testing.
Validation of CFD and Wind-Tunnel Results
A computational fluid dynamics (CFD) analysis ofthe P/YBBN design was accomplished in thedevelopment of the full-scale flight test article. CFDpredictions of nozzle performance were confirmed withwind tunnel testing of a subscale axisymmetricnozzle.2, 3 The wind tunnel tests also provided the onlyinsight into expected effects of external airflow over thenozzle. Computational fluid dynamic predictions andsubscale model wind tunnel results can be validatedwith in-flight measures of vector force angles andlimited nozzle internal static pressures. Comparisonscan be made over a large portion of the ACTIVE flightand engine operating envelope but are limited to thelower NPRs and nozzle configurations that were usedduring the CFD analysis and wind tunnel testing.
Flight Test Technique
Before the actual flight test was accomplished anddata collected, test techniques and datasets weredesigned and cleared for flight. Test techniques weredeveloped and dataset verification and validation wereaccomplished with NASA’s piloted aircraft simulation.Dataset verification consisted of checking trims sentfrom the vehicle management system computer(VMSC) to the flight control system (FCS) to confirmthat they produced the desired commands in vectordeflection and area ratio. Dataset validation ensured thatthe nozzle responded to the trims in the expectedmanner and that the vector forces did not produceunsafe transients in aircraft response.
Datasets were designed to command a pulse in pitchvector waveforms to the left nozzle, and primarily in thenegative or trailing-edge-up direction. Most datasetswere designed to capture steady-state vectoring data at–2°, –4°, –7°, –10°, and –20° of pitch vector angle. Insome cases, particularly at the highest power settings,the nozzle control computer (NC) predicts that 4000 lbof vector force may be exceeded and limits the range ofachievable vector metal angle. Additional steady-statedata was collected for off-scheduled area ratio duringvectoring by overlaying a slow rate square doubletwaveform of commanded area ratio trim superimposedon a pulse pitch vector command (fig. 1).
4American Institute of Aeronautics and Astronautics
Figure 1. Pitch vector command and area ratio trim dataset waveform.
– 15
– 10
– 5
0
0 5 10 15 20 25Time, sec
δm,
deg
– .3
– .2
– .1
0
.1
.2
.3
Arearatiotrim
980330
Area ratio trimδm

Execution of the dataset in flight was typically doneduring wings-level 1-g cruise. All of the data presentedin this paper are for single left-hand nozzle only; theright-hand nozzle was not vectored. The pilot wasallowed to make small stick and right-engine-throttleadjustments during the tests to maintain conditions, butthere was no left-engine throttle movement. If theaircraft excess thrust exceeded that for level flight, awings-level climb not exceeding ±1000 ft was initiated.To minimize the effects of unsteady external loads, theaircraft speedbrake was not deployed.
Aircraft System And Nozzle Description
A description of the unique features and capabilitiesof the ACTIVE system follows. The propulsion system,nozzle control computer and control algorithms, andaircraft measurements are discussed in some detail.
ACTIVE Unique Features and Capabilities
The test aircraft, NASA 837, is pre-productionF-15B number 1, (USAF S/N 71-0290) on loan toNASA from the Air Force. The aircraft is highlymodified and is not representative of productionF-15 aircraft. It was selected to serve as the research testbed for the ACTIVE program because of the flexibilityof its unique quad-redundant, digital, fly-by-wire, flightand propulsion control system. This unique test bed hadpreviously been used to demonstrate two-dimensional
(2D), pitch-vectoring, thrust-reversing nozzles(predecessors to the F-22 2D pitch-vectoring nozzles) aspart of the F-15 S/MTD program (Short Take-Off andLanding/Maneuver Technology Demonstrator).8 NASAreplaced the 2D pitch-vectoring nozzles with state-of-the-art axisymmetric pitch and yaw thrust-vectoringnozzles. To support thrust vectoring research in the yawaxis, the aircraft structure has been modified toaccommodate 4,000 lb of yaw vector force and 20° yawvectoring. Figure 2 summarizes the flight testconfiguration of the aircraft.
The aircraft is controlled by a quad-redundant, digital,fly-by-wire, FCS. All mechanical linkages between thecontrol stick, rudder pedals, and control surfaces havebeen removed from the aircraft. The throttles digitallycontrol the engines through the FCS, 1553 Multiplex(MUX) bus, and improved digital electronic enginecontrollers (IDEECs). No mechanical linkage existsbetween the throttles and the engines.
The aircraft cockpit closely resembles the F-15Ecockpit. Options added to the multipurpose display(MPD) allow the pilot to select and configure the aircraftfor testing. Two flight test displays, the Dial-A-Gain(DAG) display and the ACTIVE display, are relevant tothe tests described in this paper. The DAG systemfunctions primarily to establish software test limits forthe research control law commands from the vehiclemanagement system computer (VMSC). DAG
5American Institute of Aeronautics and Astronautics
Figure 2. The F-15 ACTIVE vehicle configuration.
Tri-channel VMSC computer for research control laws
Electronic air inlet controllers
Production design P/YBBN thrust vectoring nozzles
Canards
980331
F100-PW-229 IPE engines with IDEECs
F-15E crew station
Quad digital flight controllers
Dual-channel nozzle controllers

parameters include pitch or yaw thrust vectoring forcelimits. The ACTIVE display allows the pilot to select 1of 15 pre-programmed datasets stored in the VMSC.Datasets contain open-loop commands processed in theVMSC and transmitted to the FCS through the MUXbus. Simple reprogramming of the load of the15 ACTIVE datasets accommodates entirely differenttest requirements. With the current avionicsconfiguration, nozzle vectoring can only occur when thepilot selects a vector dataset through the ACTIVEcockpit display.
ACTIVE Propulsion System Description
The ACTIVE propulsion system consists of twoF100-PW-229 engines, each equipped with a PWaxisymmetric thrust vectoring P/YBBN featuringindependent exit area control (fig. 3). The F100-PW-229is an augmented 29,000 lbf thrust class turbofan engine,featuring a three-stage fan and ten-stage compressor,each driven by a two-stage turbine. Only minor enginemodifications were required to mount the P/YBBNnozzle module.
The F100 balanced beam nozzle (BBN), from whichthe P/YBBN is derived, is of convergent-divergentdesign. Throat area is controlled by the IDEEC thatcommands pneumatically driven actuators to achievenozzle throat areas ranging from 2.9 to 6.5 ft2. TheP/YBBN extends the capabilities of the proven BBNdesign to provide mechanical vectoring up to 20° in anycircumferential direction and independent nozzle exit-to-throat area ratio modulation from 1.1 to 3. Becausethe possibility exists of exceeding the 4000 lb vectorforce design limitation, limits are imposed on thecommanded vector angle. Only three principal additionsto the BBN nozzle allow for vectoring and exit areacontrol capability. These additions include: (1) adivergent actuation system that drives (2) an annularsynchronization (sync) ring supported and enclosed by(3) a static structure. Three divergent actuators, 16 flaps,and link hardware attach to the sync ring.
Symmetric translation of the three divergent actuatorsproduces changes in area ratio (fig. 4). Coordinateddifferential positioning of the three divergent actuators
6American Institute of Aeronautics and Astronautics
Figure 3. Pitch/Yaw Balance Beam Nozzle module.
Figure 4. Divergent section motion is dependent upon sync ring position.
980332
Response to A8 modulation Area ratio modulation Thrust vectoring980333
Divergent actuators (3) Sync ring translation Sync ring rotation
A8 A9

produces changes in vector angle. The actuator motionsrequired to set exit area and thrust vector angle aresuperimposed over each other. The throat area, arearatio, and vector angle comprise three degrees offreedom for the PYBBN.
Nozzle Control Computer and Control Algorithm
A nozzle control computer (NC) provides closed-looppositioning of the divergent section of each nozzle. TheFCS transfers vector and area ratio modulationcommands over the MUX Bus to the NC. The NCtranslates vector and area ratio commands intorequested divergent actuator stroke positions. Beforeapplying any such requests, the NC performs extensivefault detection and accommodation. The NC nominallyschedules the divergent actuators to a schedule referredto as the “optimum area ratio” or OAR. Theoretically,with the OAR schedule, the total pressure supplied tothe nozzle should be completely expanded to ambientstatic pressure. The NC does not schedule vector angle,and only commands vectoring when requests are sentfrom the VMSC, transmitted by the FCS, and receivedby the NC.
The NC applies software limitations to the vector andarea ratio scheduling to prevent potential divergentsection hardware damage such as left- and right-nozzleinterference. Because neither engine gross thrust orvector forces are directly measured, the NC possesses analgorithm to estimate both. Based upon its vector forceestimate, the NC limits vector force to 4000 lb pernozzle to protect the aircraft, engine, and nozzlestructure from overload.
The NC uses a simplified pressure-area gas generatormethod to calculate engine resultant gross thrustdirected along the nozzle centerline. The resultant grossthrust, , is determined by taking a gross thrust
coefficient scheduled with nozzle pressure ratio (NPR)and multiplying by the estimated total pressure at thenozzle convergent inlet and the effective nozzle throatarea. The effective nozzle throat area is derived from themeasured physical throat area and compensation for theeffect of vectoring on the nozzle discharge coefficient.
Nozzle vector forces and angles are depicted infigure 5. The total vector force, , is directed normallyto the engine centerline and consists of internal andexternal forces acting on the nozzle. A direct jet, ,and a nozzle induced force, , comprise the internalforce, . Whereas, an aerodynamic flap, , andan entrainment-induced force, , comprise theexternal force, .
The direct jet force term, , is determined bymultiplying the resultant gross thrust by the sin of thevector metal angle. represents the internal vectorforce arising from redirecting the engine gross thrust bythe vector metal angle, . Under most circumstancesthe complex flow within the nozzle deviates from themetal angle. The angle at which the flow turns is theplume angle, . To account for the force associatedwith the difference between turning the flow through theplume and metal angles, the NC models a nozzle-induced force, . The induced force phenomenonwas observed during static testing of a subscaleaxisymmetric nozzle in the 16-foot Transonic WindTunnel at NASA Langley Research Center (LaRC).2 Atwo-dimensional Euler calculation of the internal nozzlevector forces, , conducted by PW was verified withLARC results and then implemented in tabular formatinto the NC.
In addition to the internally generated forces, thenozzle also generates external forces whenever air flowsover the exterior surface of the nozzle. The aerodynamicflap force, , arises from the component of dragFgr
Fv
FdjFind
Fi FaeroFent
Fe
Fdj
Fdj
δm
δp
Find
Fi
Faero
7American Institute of Aeronautics and Astronautics
(a) Nozzle vector angle definitions.
Figure 5. Schematic of nozzle vector force components and angles.
Engine
980334
CL
Gas path
Vector plume angle, δp
Vector metal angle, δm

(b) Nozzle vector force components.
Figure 5. Concluded.
Engine
External force components, Fe
Entrainment induced force, Fent
Aerodynamic flap force, Faero
Internal force components
Nozzle induced force, Find
Direct jet force, Fdj
980335
CL
Gas path
acting normal to the engine centerline whenever thenozzle is vectored into the free stream; it is independentof power setting. The entrainment-induced force, Fent,arises from free-stream airflow that is impartingmomentum to the nozzle as a result of the engineexhaust flow. Limited Langley subscale model windtunnel data were incorporated to provide an estimate ofthe total external vector force.3 No distinction betweenthe aerodynamic flap and entrainment-induced forces ismade in the NC model and only a total external force ismodeled. Like the wind tunnel data from which it isderived, the simplified NC model is only valid for 0° ofangle of attack and sideslip. To summarize, the totalvector force is mathematically represented as follows:
(1)
The NC also limits vector and area ratio requests to theload-carrying capability of the divergent actuators. Thealgorithm limits maximum vector angle and the amountof area ratio modulation below optimum to ensure thatpredicted divergent actuator loads are not exceeded. Thislimiting occurs in the far right-hand side of the flightenvelope and only in the augmented power range.
Aircraft Measurements
The aircraft was fitted with a flight researchinstrumentation package that recorded over 3000 analogand digital signals. Most of these signals were alsotransmitted to the control room for real-time monitoringby the research team. The aircraft instrumentationsystem recorded the production standard measurements
of engine variables such as pressure, temperature, andfuel flows. Many measurements are taken from theMUX including such parameters as aircraft rates,accelerations, attitude, atmospheric and flightconditions, pilot commands of stick, rudder, throttle,and switch position, and nozzle control computerparameters. The aircraft instrumentation system alsorecorded the production standard measurements ofengine variables such as pressure, temperature, and fuelflows from the MUX. Most measurements wererecorded at a rate of at least 80 samples per second.
Extensive flight test instrumentation on the left engineand nozzle measured essential parameters for nozzleperformance determination. Measurements of pressureand temperature taken upstream of the nozzleconvergent section supplied airflow conditions.Measurements of nozzle throat and divergent actuatorpositions were used to determine nozzle exit area.Measurements of the three divergent actuator positionswere used to determine nozzle vector angle. Enginemounts and links transfer all propulsion system forcesfrom the engine to the airframe, including axial netthrust, pitch and yaw vector forces, inertial andgyroscopic forces. These mounts and links wereequipped with strain gage instrumentation to measurepropulsion system forces. Exhaustive ground checkoutand calibration testing made possible the separation oftotal vector and net thrust forces transferred through themounts and links. The technique developed for reducingthe strain gage measurements to propulsion systemforces is more fully described in Conners and Sims.7
Fv Fdj Find+( ) Faero Fent+( )+=
8American Institute of Aeronautics and Astronautics

Vectoring Nozzle Performance
Parameters used to quantify and represent nozzleperformance, and presented in the Results section,include vector-to-thrust force ratio, ( ), plumeangle ( ), and vector efficiency ( ). When takentogether these parameters relate the capability of thenozzle to deflect the engine thrust in the direction ofvector in terms of exhaust plume angle and force
represents the ratio of the total vector force tothe non-vectored gross thrust, Fo, respectively. The non-vectored gross thrust, was determined from the NCcomputed value for while the nozzle was notvectored. An installed ground test and in-flightevaluation of the NC computed value for wascompleted. During the ground test, from the NCagreed within 2.5 percent of direct thrust standmeasurements. A higher fidelity postflight, in-flightthrust model (IFT), was also evaluated relative to thethrust stand and found to be within 1 percent of standmeasurements.6 Because of additional uncertaintiesin-flight, accuracy of the NC and IFT were less.In-flight accuracy of the IFT is considered to be within2 percent at most flight conditions. Figure 6 shows acomparison of NC to IFT-calculated duringnegative pitch vectoring at ground static and an altitude
of 30,000 ft for Mil power (Mil power ranges from 83°to 88° of power setting while Max power lies between127° and 130° of power setting). NC to IFT agreement within the 2.5 percent shown in figure 5 isvery good for the purposes of most postflight datareduction and standardization.
There were two sources for in-flight determination oftotal vector force, . First, was determinedthrough a series of reduction equations to translateuncompensated strain gage measurements fromindividual mount and link loads to total pitch and yawvector forces. was also available from the onboardmodel hosted in the NC computer.
The plume angle may be determined from the internalvector force and resulant gross thrust by the followingequation:
(2)
from the NC is really available as a recorded MUXparameter. An estimate of the strain-gage-derived can also be made. measured through the strain gagesmust be estimated by subtracting out the external vectorforce from the total vector force measurement.Currently, the best estimate of is based upon the
Fv Fo⁄δp ηv
Fv Fo⁄
FoFgr
FgrFgr
Fgr
Fgr
Fgr
Fv Fv
Fv
δp Fi Fgr⁄( )–1sin=
FiFi
Fi
Fe
9American Institute of Aeronautics and Astronautics
Figure 6. Resultant gross thrust comparison of the nozzle control and in-flight thrust models at Mil power.
Difference,percent
5Ground static30,000 ft, Mach 0.9
4
3
2
1
0– 20 – 15 – 10
δm, deg980336
– 5 0

NASA wind tunnel data and implemented in the NC.Therefore, strain-gage-derived is a combination ofmeasured and calculated variables.
The vector efficiency, , is the ratio of vector plumeangle, , to vector metal angle, , and is expressedas a percentage of metal angle. values greater than100 percent metal angle indicate flow overturning,whereas values less than 100 percent metal angleindicate flow underturning. The vector metal angle isdirectly measured from the NC and represents theaverage of the top and bottom divergent flaps. Areduction in axial thrust accompanies nozzle vectoringand is proportional to the vector metal angle. Thus, tominimize axial thrust loss, vectoring nozzles should beoptimized to produce as much vector force and momentas possible for a given vector angle. This may beaccomplished through maximizing the efficiency ofturning of the nozzle plume.
Predictions
As previously mentioned, a study on internal nozzleperformance characteristics was conducted at NASALaRC in the static test facility of the Langley 16-FootTransonic Tunnel.2 In an attempt to verify the pitch andyaw thrust vectoring capabilities of the multiaxis thrustvectoring axisymmetric nozzle, subscale models offixed geometry, representing both dry and maximum
afterburning power settings were tested. The results at20° of vector metal angle indicated strong flowoverturning and that the vector plume angle was astrong function of NPR (fig. 7). The findings of thisstudy were heavily relied upon for development of theNC software vector force model and flight test plandesign.
Flight Test Planning
Test Plan
A nozzle performance test plan was developed toguide the research and is described. Flight data shown inthis report represent only a limited portion of the dataexpected to be collected through the execution of thisplan (fig. 8). Flight test conditions were selected to spana large range of NPR, dynamic pressure, Mach number,and ambient pressure, as shown in figure 8. Testingincludes standard configurations of power setting andvector angle at each condition. Power settings include alow power of 43°, maximum non-augmented powersetting of 85° (Mil), a mid afterburner power setting of110° (at Mach 0.9), to a maximum afterburner powersetting of 130° (Max). Vector angle break points includedeflections of –20°, –10°, –7°, –4°, and –2° whilenonvectored testing occurs between vectoring tests.Other tests include variations in nozzle area ratio whilevectoring, and symmetry tests in pitch and yaw.
Fi
ηvδp δm
ηv
10American Institute of Aeronautics and Astronautics
Figure 7. Subscale nozzle plume angle results at maximum afterburning and dry power settings for 20° of pitch vectorangle.
10
20
30
Maximum afterburning power settingDry power setting
δp,
deg
δm
0 2 4
980337
6 8NPR

Figure 8. Nozzle performance flight test matrix.
60 x 103
Altitude,ft
50
40
30
20
10
0 .2 .4 .6 .8 1.0Mach number
1.2 1.4 1.6 1.8
980338
2.0
4
3
2
2
3
3
1 1 1 1 1
2
Data presented in this report were collected at these flight conditions
Lines of constant dynamic pressure
F-15 ACTIVE flight envelope
Because of the number of variables, testing of allpossible configurations and conditions is beyond thescope of the program and impractical. Initial testsevaluate the effects of test technique on datarepeatability so that most data are collected with aconsistent technique. Baseline testing, that is negativedeflection pitch vector tests with the scheduled arearatio at an altitude of 30,000 ft, is of highest priority toestablish nozzle performance. Nozzle pressure ratioranges from near 5 to over 10 at an altitude of 30,000 ft,depending on power setting and Mach number. Testsdesigned to measure nozzle performance with variousambient pressures, by flying at different altitudes withthe same Mach number, are of high priority. Nozzletesting at off-design area ratio, at low power settings, atconstant dynamic pressure, or with yaw and positivepitch vector deflections are considered to be oflower priority.
Data Reduction and Analysis
Data Reduction
Approximately 1 to 1.5 seconds (80 to 120 samples ofdata) were used for most test points; mean values wereused in all computations. The parameters were reviewedduring the test point to determine when a quasi-steadystate aircraft and engine condition had been reached.The parameters that have proven best to accomplish this
are normal load factor and divergent actuator position.Based on this review, the same time interval segment foreach parameter is averaged to represent the steady stateconditions of that data point. Each of these averageddata points are then recorded in the P/YBBNperformance database.
For vectoring test points, strain-gage-derived required bias corrections to remove apparent vectorforce when the nozzle was not vectoring. The time traceof from a step and hold waveform shown in figure 9illustrates the bias correction. Although the method ofobtaining the strain-gage derived was designed toeliminate non-vector forces, biases still exist. Theseresidual biases may arise from the applied forces such asexternal airloads and inertia loads. Time-averaged datawere taken prior to, and after, vectoring deflections toestablish the zero vector bias on .
Table 2 presents some of the parameters extractedfrom the raw flight test database and nominal standarddeviations during the steady-state segment used for datapoint averaging. These standard deviations are not toimply this is the accuracy of the flight test data, but toshow how little variation there was during the selectedquasi-steady state maneuvers.
An important point is that once the correct timeinterval has been identified, any other flight test
Fv
Fv
Fv
Fv
11American Institute of Aeronautics and Astronautics

Figure 9. Zero vector bias correction and time-averaging data reduction of strain-gage-derived vector force.
400
Fv,lbs
200
0
– 200
– 400
– 600
– 800
– 10000 2 4 6 8
980339
10 12 14Time, sec
190 lb zero vectorbias correction
Corrected Fv
Uncorrected Fv
parameter can be extracted from the raw flight testdatabase and included in the P/YBBN performancedatabase. This procedure was included to allowconsideration of numerous parameters in thedevelopment of a regression model for convergent anddivergent nozzle actuator loads during vectoring andnonvectoring maneuvers.
Flight Data Regression Analysis
The NC vectoring performance model over-predictedthe actual flight test vector forces by a substantialamount. A regression analysis to predict correctionfactors to this initial model and three variations of thismodel was accomplished. The purpose of this regressionwas to provide a tool to better predict vectoringperformance and give unbiased insight into the mostsignificant parameters that affect vectoring nozzleperformance. Also, a flight-test based vectoringperformance model provides help in evaluating changesto the nozzle controller software.
Candidate Model Formulations
Four different approaches for correction factors wereconsidered in the regression analysis. In all cases, was taken from strain-gage-derived vector force. Thefour different approaches are:
In the first and fourth approaches, the correctionfactor is an angle applied to the direct jet term. Thebasic difference between these approaches is theinclusion or exclusion of the internal induced force,
, and the external vector force, , in the modelformulation. All four approaches rely upon the NCmodeled , and the correction terms will reflect any
error. In approach 1, which includes and taken from the onboard NC model, the angle correction
Table 2. Parameters included in the P/YBBNperformance database.
VariableNominal standard
deviation
Strain-gage-derived 50 lb
10 lb
Nozzle divergent actuator loads 300–600 lb
0.2 lb
Mach 0.0005
Altitude > 5ft
P0 0.0001 psi
Tt2 > 0.1 °F
0.02°
Area ratio 0.0008
Throat area 0.0006 sq. ft
NPR 0.002
Pt6 0.05 psi
Angle of attack 0.01°
Fv
Fgr
Fe
δm
Fv
Find Fe
FgrFgr Find Fe
12American Institute of Aeronautics and Astronautics

( ) will reflect any errors in modeled , ,and .
APPROACH 1
(3)
In approach 2, the correction factor is a force ( ).The assumption here is that we understand the direct jetterm, so combine all differences into a single catch-allcorrection force.
APPROACH 2
(4)
In approach 3, the correction factor is a newconcept—vector force effectiveness ( ). Thedefinition of this parameter turns the equation forapproach 3 into unity.
APPROACH 3
(5)
where is the vector force effectiveness =
and is for force angle = arc
By omitting and in the model formulation ofapproach 4, the angle correction ( ) will reflect thetotal contribution of these two vector forces to . Bothapproach 1 and 4 models were formulated forconsideration, because at this time the accuracy of themodeled and is not known.
APPROACH 4
(6)
Process and Tools Description
A statistical software package is used to develop theinitial regression model for each approach. The actualcorrection factor for each approach is calculated tomake the left-hand side of the equation equal the right-hand side, the actual measured vector force.Mathematical transformations for each parameter arealso included, such as the second, third, and fourthpower of the term, the reciprocal of the term, crossproducts with each other parameter, the square root ofthe term, etc. All of these new independent parametersare used in a forward stepwise regression to calculate apredicted correction factor. In a forward stepwiseregression, an analysis of variation (ANOVA) is
calculated on all independent variables and identifies theindependent variable which most contributes topredicting the dependent variable (in this case thepredicted correction factor). This independent variableis included in the model and a new ANOVA iscalculated to identify the next most importantindependent variable. This process continues until noindependent variable can satisfy the statistical tests to beincluded in the regression. Two statistical tests are usedin the ANOVA. The F-test checks on the contribution ofthe independent variable in predicting the dependentvariable. The larger the value of F the better. The P-testis the probability of being wrong in concluding there is atrue association between variables. A smaller value of Pis better.9 The cutoff values used in this regressionanalysis are F > 4 and P < 0.05.
The initial regression models are used on 90 percentof the P/YBBN database. (Note that Approach 3 cannotuse all the data in the database because for very smallmetal angles, , the vector force effectiveness, ,becomes infinite.) The remaining 10 percent of theP/YBBN database can be used as a check on theresulting regression model in two ways. First,comparisons of the actual correction factor to thepredicted correction factor, for data points not used inthe development of the regression model, are a check onthe accuracy of the model. Secondly, the stepwiseregression is repeated using all of the P/YBBN database.A comparison of the initial regression model (using90 percent of the database) with the final regressionmodel (using 100 percent of the database) addresses theissue of regression model stability or robustness. If thesame variables appear in the 90 percent model and the100 percent model at a given level of model accuracythen the model is robust. A coefficient of determination(R2) of 0.9 was chosen as the level of model accuracybecause this gives an answer to the same acceptableminimum level of resolution as the measured straingages of ±100 lb. However, if new variables appearusing 100 percent of the database, then the regressionmodel is sensitive and should not be used beyond thebounds of the database. The selection criteria for the10 percent of the data not used in the initial models wassimply a random choice of data points that covered thefull range of Mach numbers (Mach 0.9 and 1.2) andpowersettings.
The results of comparing the 90 percent and100 percent regression models are as follows: (1)Approach 1 and 4 are very robust. (2) Approach 2 isvery sensitive to new data and (3) Approach 3 is
θcorr1 Find FeFgr
Fgr δ m θ corr 1 – ( ) sin Find Fe + + Fv =
Fcorr
Fgr δ m ( ) F corr +sin Fv =
µ f
Fgr δ m µ f ×( ) sin Fv =
µ f δ f δm⁄( )
δ f Fv Fgr⁄( )sin
Find Feθcorr4
Fv
Find Fe
Fgr δ m θ corr 4 – ( ) sin Fv =
δm µ f
13American Institute of Aeronautics and Astronautics
moderately sensitive. In the case of approach 3, newindependent variables appear in the best model possible(R2 = 0.94) but at the R2 = 0.9 level the sameindependent variables are in the 90 percent and the100 percent regression models.
Discussion of Results
Description of Data Sample
Data presented here were collected at an altitude of30,000 ft and Mach numbers of 0.9 and 1.2 for thebaseline performance objective A1. Tests covered4 power settings including maximum afterburner, fromminimum to maximum nozzle throat area and vectorangle, and at scheduled and off-scheduled nozzleexit areas.
Data were not collected beyond –10° at maximumafterburner and –16.5° at 112° power settings becauseof NC limiting. The NC model predicted the 4000 lbvector force limit was achieved at these angles.
Nozzle Performance Results
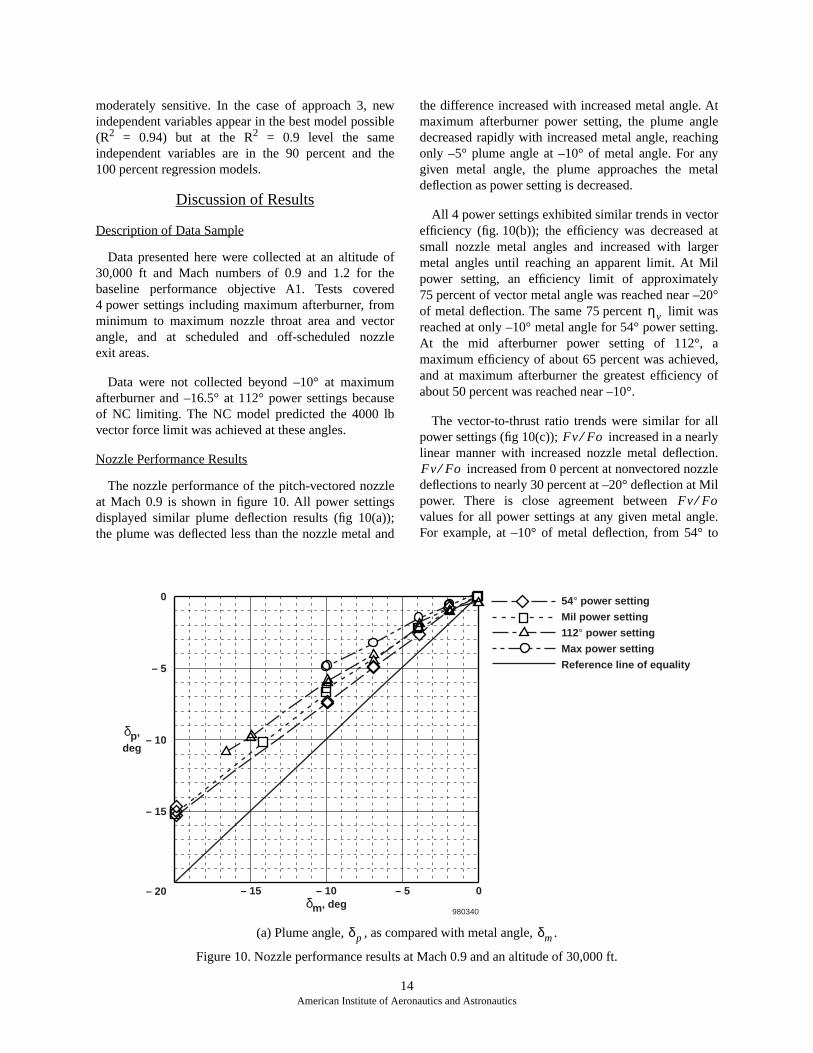
The nozzle performance of the pitch-vectored nozzleat Mach 0.9 is shown in figure 10. All power settingsdisplayed similar plume deflection results (fig 10(a));the plume was deflected less than the nozzle metal and
the difference increased with increased metal angle. Atmaximum afterburner power setting, the plume angledecreased rapidly with increased metal angle, reachingonly –5° plume angle at –10° of metal angle. For anygiven metal angle, the plume approaches the metaldeflection as power setting is decreased.
All 4 power settings exhibited similar trends in vectorefficiency (fig. 10(b)); the efficiency was decreased atsmall nozzle metal angles and increased with largermetal angles until reaching an apparent limit. At Milpower setting, an efficiency limit of approximately75 percent of vector metal angle was reached near –20°of metal deflection. The same 75 percent limit wasreached at only –10° metal angle for 54° power setting.At the mid afterburner power setting of 112°, amaximum efficiency of about 65 percent was achieved,and at maximum afterburner the greatest efficiency ofabout 50 percent was reached near –10°.
The vector-to-thrust ratio trends were similar for allpower settings (fig 10(c)); increased in a nearlylinear manner with increased nozzle metal deflection.
increased from 0 percent at nonvectored nozzledeflections to nearly 30 percent at –20° deflection at Milpower. There is close agreement between values for all power settings at any given metal angle.For example, at –10° of metal deflection, from 54° to
ηv
Fv Fo⁄
Fv Fo⁄
Fv Fo⁄
14
American Institute of Aeronautics and Astronautics
(a) Plume angle, , as compared with metal angle, .
Figure 10. Nozzle performance results at Mach 0.9 and an altitude of 30,000 ft.
– 15
980340
– 10δm, deg
– 5 0
0
– 5
– 10δp,
deg
– 15
– 20
54° power setting
Mil power setting
112° power setting
Max power setting
Reference line of equality
δp δm

15
American Institute of Aeronautics and Astronautics
(b) Vector efficiency, , as compared with metal angle, .
(c) Vector-to-thrust force ratio, as compared with metal angle, .
Figure 10. Concluded.
980341
100
ηv,
percent
80
60
40
20
0– 20 – 15 – 10
δm, deg– 5 0
54° power setting
Mil power setting
112° power setting
Max power setting
ηv δm
50
Fv/Fo,percent
54° power setting
Mil power setting
112° power setting
Max power setting40
30
20
10
0– 20 – 15 – 10
δm, deg– 5
980342
0
Fv Fo⁄ δm

maximum afterburner power settings, valuesspan less than a 5 percent band.
Overall, the flight test results indicate nozzleperformance to be a strong function of both powersetting and vector metal angle. The most efficientvectoring occurs at the lowest power settings withvector deflections beyond –10°. Vector efficiency, , isproportional to vector metal angle but only up to somemaximum attainable limit. This limit is inverselyproportional with power setting. Not only is the limit inversely proportional to power setting, but isalso proportional to vector metal angle.
As vector metal angle increases, one side of thenozzle is deflected further into the exhaust flow andexperiences increased pressure. Conversely, theopposite side of the nozzle has a relatively lowerpressure that decreases as the nozzle is further deflected.Too much low pressure or suction could lead to flowseparation under the right set of conditions. If thecontribution to the vector force is greatest by the high-pressure side of the nozzle, this may explain theincreased vector efficiency with increased nozzledeflection. However, it is difficult to substantiate thishypothesis without internal pressure instrumentation. Asfor the reduced efficiencies at lower angles, this may bea result of taking percentages of small numbersnear zero.
As power settings increase from 54° to maximumafterburner, the nozzle throat area and area ratio bothincrease to maintain scheduled engine pressure ratio andnozzle pressure ratio. Additionally, the exhaust flowproperties of pressure and temperature change as poweris increased. Changes in either the nozzle geometry orflow properties may explain the trends in vectorefficiency seen with power setting. The limited scope ofdata makes it difficult to substantiate this hypothesis atthis time. However, the regression results presented nextprovide insight into these effects.
One possible source of error affecting the plumeangle and the vector efficiency results is the modeledexternal vector forces. However, the magnitude of isexpected to be significantly less than the internal forces,especially at Mach 0.9 and an altitude of 30,000 ft.Once again, it is difficult to assess the accuracy of the
model without additional external pressureinstrumentation or additional testing.
Regression Fit Results
The P/YBBN vectoring database is still beingdeveloped. However, even with the limited number of
flight conditions some interesting trends are emergingfrom regression analysis. At the same level of regressionmodel accuracy (R
2
= 0.9), the nozzle hardwaregeometry dominates the vectoring performance. Inapproach 1 and 4 the correction term is an angle whichcorrects the direct jet force term. With both approachesthe correction angle is a function of the feedback nozzlevector angle and the nozzle exit area. In approach 2, thecorrection term is a force that is a function of thecommanded vector angle, nozzle pressure ratio, actuatorload 1, and the radius of the nozzle exit area. Inapproach 3, the correction term is vector forceeffectiveness which is a function of altitude, radius ofthe nozzle exit area, nozzle area ratio, actuator load 1,nozzle exit area, feedback nozzle vector angle, andcommanded nozzle vector angle. Note that in each ofthese regression models, the important parametersinclude vector angle (feedback, commanded, or both),and nozzle exit area. Because exit area is directly relatedto power setting, the regression results seem tosubstantiate the data trends and the hypothesis that theeffect of power setting on vector efficiency is related tonozzle geometry.
Comparisons With Predictions
The plume angle results for a –10° pitch-vectorednozzle from the NC model and the strain gage are shownas a function of nozzle pressure ratio in figure 11. Onlynozzle configurations that were tested in NASA LaRC’sstatic test facility are considered, one of which was a drypower nozzle at an area ratio of 1.35. As previouslynoted in the “Vectoring Nozzle Performance” sectionunder “Predictions”, from the NC represents thetabular format of the CFD predictions that were matchedwith the LaRC data. Therefore it is not surprising that
, as predicted by the NC, is overturned at all NPR;whereas the flight measured result shows flowunderturning to occur at all NPR. The largest differencebetween the NC model and flight measured is at thelowest NPR where the greatest amount of flowoverturning is modeled to occur. The results show thatthe plume from the NC shows a strong trend with NPRlike the tunnel results; the greatest of about –15°occurred at the lowest NPR, about 3.75. As the NPRincreased, from the NC decreased to approximately–12°. In contrast to the NC result, the flight results showless than a 1° variation from –7° measured across theNPR range.
Given the number of variables and the limits of in-flight measurements, it is difficult to precisely identifywhat accounts for the large differences between the
Fv Fo⁄
ηv
ηvηv
Fe
Fe
δp
δp
δp
δp
δp
δp
16American Institute of Aeronautics and Astronautics

Figure 11. Comparison of modeled and measured vector turning results for a 10° pitch vectored nozzle at dry power,1.35 area ratio, at an altitude of 30,000 ft and Mach numbers of 0.9 and 1.2.
980343NPR
2
– 5
0
– 10δp,
deg
– 15
– 20
Metal angle
NC model
Strain gage
Regression approach 1
4 6 8
predicted nozzle performance and the measured nozzleperformance. However, the sources of the differencemay be classified into either nozzle geometry or flowproperties. The wind-tunnel-tested nozzle was ofapproximately 1/12
th
scale, contained minimal surfaceimperfections and lacked any potential for flow leakage.The 16 flaps that make up the gas path boundary forP/YBBN have greater roughness than the milledsubscale nozzles. Additionally, the cross section of thenozzle is not perfectly circular, but rather more like apolygon made up of the 16 flaps and seals. The potentialexists for flow leakage between the flaps and seals. Themany details of the P/YBBN geometry open up thepossibility for complex flow phenomena, includingshock and boundary layer interaction or flow separation.The air flowing through the subscale nozzle was a coldflow of standard air composition, including near sealevel ambient pressure into which the nozzle exhaustflowed. On the other hand, the air flowing through theP/YBBN is made up of combustion products attemperatures that may exceed 1000 °F. Also, the flightarticle exhaust flowed into whatever back pressureexisted at the testing altitudes. Given the number andextent of differences between the flight article and thewind tunnel or CFD-modeled nozzle, the lack of goodagreement between predicted and measured nozzleperformance is not surprising. This comparison of
predicted with measured performance clearly illustratesthe value of flight research in exploring and validatingwind tunnel and CFD results, to separate the real fromthe imagined.
Conclusions and Recommendations
Preliminary flight test research has been conducted onthe F-15 ACTIVE aircraft to determine the vectoringperformance of an axisymmetric, convergent-divergentnozzle with variable throat area, exit area, and multi-axis vectoring. Comparisons are made for selectconditions with CFD and wind tunnel performancepredictions. The nozzle was tested with variableexpansion ratios ranging from 1.06 to 1.67 and over arange of nozzle pressure ratios (NPR) including under-and over-expanded flows up to 7.5 NPR. The primarytest parameter was nozzle geometry. For the limitedcases studied, an analysis of the research resultssuggests the following conclusions:
1. Vector efficiency is strongly influenced by powersetting and vector metal angle.
2. CFD-based predictions and wind tunnel results arein good agreement with each other, but do notcorrelate well with flight test results.
17American Institute of Aeronautics and Astronautics

3. Flight research shows that the nozzle performanceis more strongly influenced by geometry, ratherthan by flow properties as predicted.
4. Nozzle pressure ratio is not the major factorinfluencing vector plume angles.
5. Vector plume angles are usually less than the vectormetal angle.
6. Nozzle efficiency is proportional to vector metalangle and inversely proportional to power setting.
7. An apparent limit on maximum nozzle efficiency isinversely proportional to power setting.
The F-15 ACTIVE open-loop architecture has beenextremely valuable for the collection of high quality,repeatable data. It has allowed significant conclusions tobe discovered relative to full-scale vectoring nozzleperformance and emphasized the importance of flightresearch.
The following are specific recommendations:
1. Make a control law change to the nozzle controlcomputer that updates the original vector forcemodel to more accurately reflect theflight-measured vector forces, thus allowing forhigher metal angles to be achieved.
2. Design and install internal and external pressureand temperature instrumentation on the divergentsection of one nozzle to assist in understanding thecomplexities of the vectoring exhaust plume andmake comparisons with predictions.
3. Expand the nozzle performance database to includemore flight conditions.
References
1
Doane, P., R. Bursey, and G. S. Schkolnik,
F-15
ACTIVE: A Flexible Propulsion Integration Testbed
,AIAA 94-3360, June 1994.
2
Carson, George T., Jr. and Francis J. Capone,
StaticInternal Performance of an Axisymmetric Nozzle withMultiaxis Thrust-Vectoring Capability
, NASA TM-4237,February 1991.
3
Wing, David J. and Francis J. Capone,
PerformanceCharacteristics of Two Multiaxis Thrust-VectoringNozzles at Mach Numbers up to 1.28
, NASA TP-3313,May 1993.
4
Silhavy, Robert Edward,
Dual Flow Performanceof 10° Thrust Vectored Axisymmetric Nozzles WithVarying Area Ratios
, California Polytechnic StateUniversity, San Luis Obispo, California, Master’sThesis, December 1996.
5
Kidman, David S., Jesse E. Vickers, and Brian P.Olson,
Evaluation Of The F-16 Multi-Axis ThrustVectoring Aircraft
, AFFTC-TR-95-12, September 1995.
6
Smolka, J. W., et al,
F-15 ACTIVE Flight ResearchProgram
, Fortieth Symposium Proceedings of theSociety of Experimental Test Pilots, ISSN 0742-3705,September 1996.
7
Conners, Timothy and Robert Sims,
Full FlightEnvelope Direct Thrust Measurement on a SupersonicAircraft
, AIAA-98-3872, July 1998.
8
Crawford, Mark, Brian Hobbs, Steven Roell,and Gerard Schkolnik,
STOL/Maneuver TechnologyDemonstrator Flying Qualities and IntegratedFlight/Propulsion Control System Evaluation, FinalReport
, AFFTC-TR-91-29, December 1991.
9
Draper, N. R. and H. Smith,
Applied RegressionAnalysis, Second Edition
, John Wiley & Sons, Inc., New
York, New York, 1981.
18American Institute of Aeronautics and Astronautics

REPORT DOCUMENTATION PAGE
Form ApprovedOMB No. 0704-0188
Public reporting burden for this collection of information is estimated to average 1 hour per response, including the time for reviewing instructions, searching existing data sources, gathering andmaintaining the data needed, and completing and reviewing the collection of information. Send comments regarding this burden estimate or any other aspect of this collection of information,including suggestions for reducing this burden, to Washington Headquarters Services, Directorate for Information Operations and Reports, 1215 Jefferson Davis Highway, Suite 1204, Arlington,VA 22202-4302, and to the Office of Management and Budget, Paperwork Reduction Project (0704-0188), Washington, DC 20503.
1. AGENCY USE ONLY (Leave blank) 2. REPORT DATE 3. REPORT TYPE AND DATES COVERED
4. TITLE AND SUBTITLE 5. FUNDING NUMBERS
6. AUTHOR(S)
8. PERFORMING ORGANIZATION REPORT NUMBER
7. PERFORMING ORGANIZATION NAME(S) AND ADDRESS(ES)
9. SPONSORING/MONITORING AGENCY NAME(S) AND ADDRESS(ES) 10. SPONSORING/MONITORING AGENCY REPORT NUMBER
11. SUPPLEMENTARY NOTES
12a. DISTRIBUTION/AVAILABILITY STATEMENT 12b. DISTRIBUTION CODE
13. ABSTRACT (Maximum 200 words)
14. SUBJECT TERMS 15. NUMBER OF PAGES
16. PRICE CODE
17. SECURITY CLASSIFICATION OF REPORT
18. SECURITY CLASSIFICATION OF THIS PAGE
19. SECURITY CLASSIFICATION OF ABSTRACT
20. LIMITATION OF ABSTRACT
NSN 7540-01-280-5500 Standard Form 298 (Rev. 2-89)
Prescribed by ANSI Std. Z39-18298-102
Initial Flight Test Evaluation of the F-15 ACTIVE AxisymmetricVectoring Nozzle Performance
WU 529-50-40-00-32-00-001
John S. Orme, Ross Hathaway, and Michael D. Ferguson
NASA Dryden Flight Research CenterP.O. Box 273Edwards, California 93523-0273
H-2267
National Aeronautics and Space AdministrationWashington, DC 20546-0001 NASA/TM-1998-206558
A full envelope database of a thrust-vectoring axisymmetric nozzle performance for the Pratt & WhitneyPitch/Yaw Balance Beam Nozzle (P/YBBN) is being developed using the F-15 Advanced Control Technologyfor Integrated Vehicles (ACTIVE) aircraft. At this time, flight research has been completed for steady-statepitch vector angles up to 20° at an altitude of 30,000 ft from low power settings to maximum afterburnerpower. The nozzle performance database includes vector forces, internal nozzle pressures, and temperatures allof which can be used for regression analysis modeling. The database was used to substantiate a set of nozzleperformance data from wind tunnel testing and computational fluid dynamic analyses. Findings from initialflight research at Mach 0.9 and 1.2 are presented in this paper. The results show that vector efficiency isstrongly influenced by power setting. A significant discrepancy in nozzle performance has been discoveredbetween predicted and measured results during vectoring.
Axisymmetric nozzle, Convergent-divergent nozzles, Flight test, Internalperformance, Mechanical thrust vectoring, Thrust Vectoring,
A03
24
Unclassified Unclassified Unclassified Unlimited
July 1998 Technical Memorandum
Presented at the 34th AIAA/ASME/SAE/ASEE Joint Propulsion Conference, Cleveland, Ohio, July 13–15, 1998. John S.Orme, NASA Dryden Flight Research Center, Edwards, California; Ross Hathaway, Analytical Services & Materials,Edwards, California; Michael D. Ferguson, United Technologies Corporation, Pratt & Whitney, West Palm Beach, Florida.
Unclassified—UnlimitedSubject Category 05, 07