initial report iowa statewide rest area management plan · iowa statewide rest area management plan...
TRANSCRIPT

Initial Report
Iowa Statewide Rest Area Management PlanApril 2013

This Page Intentionally Left Blank

Iowa Statewide Rest Area Management Plan
ACKNOWLEDGEMENTS
Iowa DOT Technical Advisory CommitteeTracey Bramble, Office of Strategic CommunicationMike Clayton, Highway Division District 1 OfficeCatherine Cutler, Highway Division District 6 OfficeMitchell Dillavou, Highway Division BureausBrad Hofer, Office of Location and EnvironmentTroy Jerman, Highway Division District 4 OfficeMark Masteller, Design RoadsideSteven McMenamin, Rest Areas - GeneralJames Rost, Office of Location and EnvironmentJim Schnoebelen, Highway Division District 6 OfficeTim Simodynes, Office of Traffic OperationsWilly Sorenson, Office of Traffic and SafetyScott Suhr, Highway Division District 4 OfficeJanet Vine, Office of Location and Environment
Iowa State PatrolCaptain Shane Antle, Iowa State Patrol
Iowa Motor Vehicle EnforcementChief David Lorenzen, Office of Motor Vehicles
Prepared By
HDR EngineeringBrian Ray, Project ManagerMike Forsberg, Traffic LeadWill Sharp, Project Principal

i
Iowa Statewide Rest Area Management Plan
TABLE OF CONTENTSEXECUTIVE SUMMARY ............................................................................................................................................. E-1Study Purpose ............................................................................................................................................................................ E-1Review of Rest Area Existing Conditions ................................................................................................................................ E-1Interstate Corridor Evaluation ................................................................................................................................................... E-1User Survey ................................................................................................................................................................................. E-2Rest Area Needs ......................................................................................................................................................................... E-2Rest Area Strategies .................................................................................................................................................................. E-3
CHAPTER 1 – INTRODUCTION .....................................................................................................................................1Background .....................................................................................................................................................................................1Study Process .................................................................................................................................................................................1Study Goals .....................................................................................................................................................................................3
CHAPTER 2 – EXISTING REST AREA REVIEW ...........................................................................................................4Summary of Existing Interstate Rest Area Services ...................................................................................................................4Existing Rest Area Traffic Volumes ..............................................................................................................................................8Existing Rest Area Parking Utilization........................................................................................................................................13
CHAPTER 3 – IOWA INTERSTATE CORRIDOR EVALUATION .................................................................................19Alternative Service Locations (ASLs) .........................................................................................................................................19Alternative Truck Parking Locations ..........................................................................................................................................19Iowa Interstate Daily Traffic Volumes .........................................................................................................................................24Truck Travel between Major Freight Hubs .................................................................................................................................26Fatigue-Related Safety Analysis .................................................................................................................................................30
CHAPTER 4 – USER SURVEY.....................................................................................................................................32
CHAPTER 5 – NEEDS ..................................................................................................................................................35Aging Rest Area Infrastructure ...................................................................................................................................................35Truck Parking Needs ....................................................................................................................................................................37Rest Area Spacing ........................................................................................................................................................................39Iowa State Patrol Needs ...............................................................................................................................................................39Iowa Motor Vehicle Enforcement Needs ....................................................................................................................................40Areas Lacking Services ...............................................................................................................................................................40Traveler Information Dissemination ...........................................................................................................................................41
CHAPTER 6 – STRATEGIES .......................................................................................................................................42Rest Area Guidelines ...................................................................................................................................................................42
Rest Area Location Study .............................................................................................................................................................................. 42Directional versus Single-Point Rest Area ..................................................................................................................................................... 43Design Standards and Templates .................................................................................................................................................................. 43Iowa State Patrol and Motor Vehicle Enforcement ........................................................................................................................................ 43Green Technologies and Practices ................................................................................................................................................................ 46
Public/Private Partnerships (P3s) ...............................................................................................................................................46Interstate Oasis Program ............................................................................................................................................................................... 47Rest Area Sponsorship .................................................................................................................................................................................. 47

ii
Iowa Statewide Rest Area Management Plan
Public/Private Partnerships (P3s) near Single-Point Rest Areas ................................................................................................................... 47Parking Expansion Opportunities ...............................................................................................................................................48
Parking at Rest Areas .................................................................................................................................................................................... 48Parking at Weigh Stations ............................................................................................................................................................................. 48Other Parking Opportunities and Considerations .......................................................................................................................................... 48
Traveler Information Dissemination ...........................................................................................................................................49
LIST OF TABLESTable 2-1. Existing Rest Area Services ............................................................................................................................................................ 5Table 2-2. Existing Rest Area Services at Adjacent Rest Areas to Iowa .......................................................................................................... 7Table 2-3. Iowa Rest Area Weekday Traffic Volumes ...................................................................................................................................... 9Table 2-4. Iowa Rest Area Car Parking Utilization ......................................................................................................................................... 14Table 2-5. Iowa Rest Area Truck Parking Utilization ...................................................................................................................................... 16Table 3-1. Additional Iowa Truck Parking Locations ...................................................................................................................................... 22Table 3-2. Trucks Parked on Service Interchange Ramps ............................................................................................................................. 24Table 3-3. Corridor Traffic Volumes Growth ................................................................................................................................................... 24Table 3-4. Truck Freight Through Iowa .......................................................................................................................................................... 28
LIST OF FIGURESFigure 1-1. Iowa Interstate Rest Areas ............................................................................................................................................................ 2Figure 2-1. Average Hourly Rest Area Volume by Corridor ........................................................................................................................... 11Figure 2-2. Weekday and Weekend Average Hourly Rest Area Volume ....................................................................................................... 12Figure 2-3. Rest Area Truck Parking by Corridor ........................................................................................................................................... 18Figure 3-1. Alternative Service Locations ...................................................................................................................................................... 20Figure 3-2. Truck Parking Locations .............................................................................................................................................................. 21Figure 3-3. Iowa Interstate Daily Traffic Volumes .......................................................................................................................................... 25Figure 3-4. Freight Stopping Ranges ............................................................................................................................................................. 27Figure 3-5. Rest Area Spacing and the Density of Fatigue-Related Crashes ................................................................................................ 31Figure 4-1. User’s Primary Reason for Stopping at a Rest Area ................................................................................................................... 32Figure 4-2. User’s Overall Satisfaction with the Rest Area they Visited ........................................................................................................ 33Figure 4-3. User-Rated Safety and Security of the Rest Area they Visited ................................................................................................... 33Figure 4-4. User Preference on Proximity of Rest Areas to Other Services such as Gas Stations or Other Rest Areas .............................. 34Figure 4-5. User Perception of the Condition of the Rest Area they Visited .................................................................................................. 34Figure 5-1. Aging Rest Area Infrastructure .................................................................................................................................................... 36Figure 5-2. Truck Parking Utilization .............................................................................................................................................................. 38Figure 6-1. Directional Template .................................................................................................................................................................... 44Figure 6-2. Single-Point Templates ................................................................................................................................................................ 45

E-1
Iowa Statewide Rest Area Management Plan
EXECUTIVE SUMMARYStudy PurposeThis study presents a summary of Iowa interstate rest area services, demands, needs and strategies to address identified needs. This includes a review of each rest area and service location along Iowa interstates, and identifies user needs along interstate corridors in the state. The primary goal of this study is to document rest area needs in Iowa so that the Iowa Department of Transportation (DOT) can make informed planning and programming investment decisions for their rest areas.
Review of Rest Area Existing ConditionsIowa rest areas offer motorists a safe place to rest and provide access to a variety of services. Rest areas are also safe locations for the travelling public to make phone calls, text, email or conduct other business not appropriate while driving. There are 40 full service rest areas in Iowa. In year 2012 approximately 15 million travellers visited Iowa interstate full service rest areas. Of the 40 full service rest areas, 39 are open year round. The one location that is not open year round is the Loveland Overlook rest area located on I-680 near mile post 15 with access provided in the westbound direction. Additionally, the Loveland Overlook rest area does not provide truck parking, a service that is heavily utilized among rest areas. Since the Loveland Overlook rest area is not open year round and does not provide truck parking, it was not included in this study.
The existing conditions of each rest area in Iowa that is open year round was reviewed. All of the services provided at each rest area are available 24 hours per day and are free of charge with the exception of telephones and food purchase. All of the rest areas in Iowa provide many of the same services, including parking, restrooms, picnic facilities, pet exercise areas, telephones, traveler information and Wi-Fi.
Twenty-four hour daily traffic counts, including truck percentages, were conducted at each interstate rest area during year 2012. Rest area daily traffic varied by location. Rest areas on I-80 and I-380 had the highest average hourly volumes. Rest areas on I-680 had the lowest average hourly volumes. The peak traffic volumes generally occurred between 9:00 AM and 3:00 PM.
Twenty-four hour parking utilization for cars and trucks at each rest area was also recorded during year 2012. The parking utilization for cars found that car parking spaces at each rest area is sufficient based on the observed demand during the peak times. The parking utilization for trucks was highest during the overnight hours (approximately 10:00 PM to 8:00 AM). During much of this time, the number of trucks parking at a rest area exceeded the number of available parking spaces. When parking spaces were full, trucks parked on the shoulders of the rest area entry/exit ramps or in the areas designated for cars. The peak time for truck parking generally occurred between 2:00 AM and 6:00 AM.
Interstate Corridor EvaluationAn evaluation of the interstate rest area corridors in Iowa was performed to identify additional locations where similar rest area services are provided to the travelling public. This evaluation included a review of Alternative Service Locations (ASLs). ASLs are businesses or public facilities near interstate service interchanges where travelers can find services similar to those provided at rest areas. On Iowa interstate rest area corridors, 228 ASLs were identified. There is a high concentration of ASLs around the Des Moines metropolitan area. Rural areas have the most limited coverage of ASLs.

E-2
Iowa Statewide Rest Area Management Plan
The majority of similar rest area services are provided at ASLs throughout the state. However, accessing an ASL at a service interchange can be more challenging for motorists than accessing a directional rest area that provides access directly off the interstate. Challenges of using ASLs to find similar rest area services include:
■ Signage to guide motorists to businesses or public facilities at a service interchange is often limited. This can lead to some motorists travelling greater distances on a service roadway to find their desired use.
■ Access provided at businesses or public facilities may be difficult to navigate.
■ Motorists seeking multiple services at service interchanges may be inconvenienced by having to go to several locations to find all of the services that they desire.
■ During peak travel times of the day, some roadways become congested. Motorists attempting to locate similar rest area services at service interchanges may be subject to added delay because of congested conditions.
■ Many businesses or public facilities are not available 24 hours per day.
The interstate corridor evaluation also reviewed alternative parking locations for trucks. These locations included parking only rest areas, weigh stations and ASLs that provide truck parking. Approximately 85 alternative truck parking locations were identified along Iowa interstate rest area corridors, equating to nearly 4,700 truck parking spaces.
A review of truck travel between major freight hubs was performed to identify probable locations where truck drivers would stop to rest throughout Iowa. This review focused on truck travel within a single day from major freight hubs. The review identified 11 freight routes between major freight hubs where drivers would end their first day of travel on Iowa interstates. Probable locations for truck drivers along these routes to stop and rest were primarily located near the Des Moines metropolitan area.
The corridor evaluation also included a review of fatigue-related crashes along the interstate corridors. Fatigue-related crashes were reviewed for each segment between rest areas. It was found that 2.3% of total crashes on Iowa interstates were fatigue-related crashes. Additionally, less than 6% of the segment crashes were fatigue-related crashes for each segment between Iowa interstate rest areas. Interstate corridors were also reviewed to determine if there was a relationship between the spacing of rest areas and the number of fatigue-related crashes. No relationship was found between rest area spacing and fatigue-related crashes.
User SurveyThe Iowa DOT administered a rest area survey across the state of Iowa from June 28, 2012 until July 23, 2012. The survey was designed to provide a qualitative assessment of user opinions regarding services and amenities at full service rest area locations. 759 individual surveys were completed. Major findings of the survey included:
■ 83% of respondents indicated they were very satisfied or satisfied with the rest area facility they visited.
■ 70% of respondents said that safety and security at the rest area they visited was excellent or very good.
■ 50% of survey respondents indicated that a rest area should be located 30 minutes to 1 hour from other services or rest areas, while 25% of respondents reported that rest areas should be located 1 to 2 hours from other services or rest areas.
■ 65% of survey respondents indicated that the rest area they visited should be left as is.
Rest Area NeedsIowa interstate rest area needs were identified to determine potential for improvements. These needs address aging infrastructure, truck parking, rest area spacing, user preferences and Iowa State Patrol and Motor Vehicle Enforcement needs. The review of rest area needs identified the following:

E-3
Iowa Statewide Rest Area Management Plan
■ Of the 39 rest area buildings, 21 have exceeded their anticipated service life.
■ Of the services provided at rest areas, truck parking is the most over utilized service at rest areas throughout the state.
� Truck parking demand exceeds capacity at most of the full service rest areas during peak times.
� Truck parking demand exceeds capacity at over half of the parking only rest areas during peak times.
� Weigh stations are sparsely used for truck parking during overnight hours.
� Truck parking at ASLs was observed to be 70% to 90% utilized.
■ Rest area spacing exceeds the recommended 60 miles 1 between the following rest area pairs. However, they all meet the recommended criteria of “about one hour apart”.
� Osceola (I-35) – Ankeny (I-35) – 66 miles.
� Osceola (I-35) – Mitchellville (I-80) – 64 miles.
� Underwood (I-80) – Adair (I-80) – 62 miles.
� Loveland (I-680) – Adair (I-80) – 66 miles.
■ Iowa State Patrol and Motor Vehicle Enforcement would like office space incorporated into any rest area building that is part of new construction or being updated.
■ Iowa Motor Vehicle Enforcement would like weighing and inspection capabilities at interstate rest areas to supplement the existing weigh station locations.
■ There are 8 segments of Iowa interstates where locations providing 24-hour restroom facilities are not available for at least 30 miles. These segments are spread throughout the state.
Rest Area StrategiesRest area strategies were identified to improve rest area services for travelers based on the needs identified in the earlier study stages. Strategies included guidelines for developing rest areas, a review of public/private partnerships (P3s), evaluating parking expansion opportunities at Iowa rest areas and weigh stations, and ways to provide additional traveler information.
The review of P3s presents different types of P3s that some States are using to supplement rest area locations with private business locations that provide similar services. Common forms of P3s for supplementing rest area services include an Interstate Oasis Program, rest area sponsorship and coordinated P3 commercial development near single-point rest areas.
Parking expansion opportunities were explored for rest areas, weigh stations and other locations. This included potential challenges of parking expansion.
Traveler information dissemination was reviewed and a specific example of providing information on truck parking availability was discussed. Dynamic, real-time truck parking availability technologies are currently being investigated by other DOTs and the Federal Highway Agency (FHWA). These systems are still in their infancy and can be costly.
1 Source: AASHTO. 2001. Guide for Development of Rest Areas on Major Arterials and Freeways. American Association of State Highways and Transportation Officials: Washington, D.C.

1
Iowa Statewide Rest Area Management Plan
CHAPTER 1 – INTRODUCTIONThis study presents a summary of Iowa interstate rest area services, demands, needs and strategies to address identified needs. Iowa rest areas offer motorists a safe place to rest and access to a variety of services. Rest areas are also safe locations for the travelling public to make phone calls, text, email or conduct other business not appropriate while driving. There are 40 full service rest areas in Iowa. In year 2012 approximately 15 million travellers visited Iowa interstate full service rest areas.
Of the 40 full service rest areas, 39 are open year round. The one location that is not open year round is the Loveland Overlook rest area located on I-680 near mile post 15 with access provided in the westbound direction. The Loveland Overlook rest area is closed from December 1st to April 30th. Additionally, the Loveland Overlook rest area does not provide truck parking, a service that is heavily utilized among rest areas. Since the Loveland Overlook rest area is not open year round and does not provide truck parking, it was not included in this study.
The 39 full service rest areas in Iowa that are open year round are shown on Figure 1-1. This study reviews each of the Iowa interstate rest areas and identifies user needs along interstate corridors in the state.
BackgroundHDR completed a rest area study for the Iowa Department of Transportation (DOT) in 2012 that focused on the available services in central Iowa at rest areas and service interchanges. That study, titled Central Iowa Rest Area Study, focused on the areas along I-80 between the Adair rest areas (near mile post 80) and Mitchellville rest areas (near mile post 147) and along I-35 between the Osceola rest areas (near mile post 33) and Story City rest areas (near mile post 120). The Central Iowa Rest Area Study also included planning for a statewide rest area study. This included a review of other States’ Rest Area Plans and development of a bullet scope, public involvement strategies and data needs based on the review of rest area plans. Upon completion of the Central Iowa Rest Area Study Iowa DOT requested HDR to prepare a Statewide Rest Area Management Plan that would build upon the work completed in the Central Iowa Rest Area Study.
Study ProcessThe Guide for Development of Rest Areas on Major Arterials and Freeways prepared by the American Association of State Highways and Transportation Officials (AASHTO) was used to guide the process of conducting this study. The study was completed through several tasks that included the following:
■ Data Collection
� Collecting information at each rest area (this included available services, traffic volumes accessing the rest area, and parking utilization).
� Identifying alternative service locations (ASLs), businesses or public facilities along the interstate corridors where travelers can find similar rest area services.
� Collecting parking utilization at parking only rest areas, weigh stations and truck stops along interstate corridors.
■ Issues and Needs Identification
� Analyze data collected at rest areas and along the interstate corridors.
� Conduct a user survey and document responses.
� Coordinate with Iowa State Patrol and Motor Vehicle Enforcement to determine their potential needs at rest areas.
■ Rest Area Strategies
� Document rest area guidelines.
� Evaluate rest area opportunities.

2
Iowa Statewide Rest Area Management Plan
!(
!(
!(!(!(
!(
!(!(!( !(
!( !(
!(!( !(!(
!(!( !(
!(
!( !(!( !(!( !(!( !(
!(!(!( !(
!(!(
!(!( !(!( !( !(!(!(!(
!(!(
!(
!( !( !(!(
!(!(!( !( !(
!(!(
!(!(
!(
!(!(!(
!(!(
!( !(
!(
!(
!5
!5 !5
!5!5
!5!5
!5!5
!5!5
!5!5
!5!5
!5
!5!5
!5!5
!5
!5!5
!5!5
!5!5
!5!5
!5
!5
!5!5
!5!5
!5
!5!5
!5
!5!5
!5!5
!5!5
!5
!5
!5
!5
!5
!5
!5
!5!5
!¾
!5!5
!5!¾
!¾!5
!5!¾
!5!5
!5!¾
!5!5 !¾
!5!¾
!¾ !5!5
!¾!¾
Nebraska §̈¦29
§̈¦80
§̈¦35
§̈¦80
§̈¦35
§̈¦380
§̈¦29
§̈¦90
§̈¦88
§̈¦74
§̈¦680
Illinois
Minnesota
Missouri
Nebraska
SouthDakota
Wisconsin
LYON OSCEOLA DICKINSON EMMET
ALLAMAKEE
KOSSUTH
WINNESHIEK
HOWARDWINNEBAGO
MITCHELL
WORTH
SIOUX OBRIEN CLAY PALOALTO HANCOCK CERRO
GORDO CHICKASAWFLOYD
CLAYTONFAYETTE
PLYMOUTH CHEROKEE BUENAVISTA
POCAHONTASHUMBOLDT
WRIGHT
BREMER
FRANKLIN BUTLER
DUBUQUEDELAWAREWEBSTER
BUCHANANBLACKHAWK
WOODBURY IDA SAC CALHOUN
HAMILTON
HARDINGRUNDY
JACKSON
JONESLINNBENTONTAMA
MONONA CRAWFORD CARROLL GREENEBOONE
STORY MARSHALL
CLINTON
CEDARHARRISON
SHELBY
AUDUBONGUTHRIE
JOHNSON
DALLASIOWA
POLK POWESHIEKJASPER SCOTT
MUSCATINE
POTTAWATTAMIECASS
WASHINGTONADAIR KEOKUKWARRENMADISON
MAHASKAMARION
LOUISA
MILLS MONTGOMERY ADAMS
HENRY
JEFFERSONUNION WAPELLO
CLARKE
LUCAS MONROEDES
MOINES
FREMONT PAGE TAYLOR RINGGOLDVAN
BURENDAVISDECATUR WAYNE APPANOOSELEE £¤67
£¤81
£¤20
£¤169
£¤30
£¤18
£¤151
£¤34
£¤218
£¤34
£¤151
£¤149
£¤14£¤18
£¤30
£¤136 £¤218
£¤77
£¤18
£¤9
£¤65
£¤2
£¤20
£¤69
£¤75
£¤65
£¤75
£¤30
£¤75
£¤136
£¤14
£¤52
£¤36
£¤59
£¤218
£¤51
£¤12
£¤275
£¤63
£¤275
£¤77
£¤65 £¤63
£¤67
£¤34
£¤73
£¤34
£¤81
£¤136
£¤20
£¤20
£¤63
£¤218
£¤52
£¤34
£¤61
£¤24
£¤59
£¤275
£¤150
£¤59
£¤6
£¤281
£¤30
£¤71
£¤69
£¤18
£¤71
£¤6
£¤61
£¤52
£¤81
£¤281
£¤136
£¤30
£¤69
£¤6
£¤169
£¤6
£¤20
£¤18
Keokuk
FortMadison
Centerville
ClarindaShenandoah
Burlington
MountPleasantFairfield
Red Oak OttumwaGlenwood
Creston
CouncilBluffs
OskaloosaWashingtonKnoxvilleIndianola
Atlantic Pella Muscatine
Davenport
BettendorfWest desMoines
DesMoines
Urbandale AltoonaHarlan IowaCity
CoralvilleNewtonAnkeny
Grinnell
PerryClinton
CedarRapids
Denison NevadaAmesMarshalltown
MarionHiawatha
Boone
CarrollMaquoketa
AnamosaVinton
WebsterCity Independence Manchester
SiouxCity
Waterloo
DubuqueFortDodge
IowaFalls
CedarFalls
StormLake
OelweinWaverly
CherokeeLe Mars
OrangeCity
CharlesCityAlgona
SiouxCenter
ClearLake
SpencerMasonCity
Decorah
Estherville
Great SaukTrail, IL
KrisdalaBaka, IL
StraightRiver, MN
AlbertLea, MN
Eagleville, MO
Vermillion, SD
MeliaHill, NEPlatteRiver, NE
MississippiRapids, IL
Rockport, MO
DavenportWilton
CedarRapids
TiffinVictorGrinnell
Northwood
Mitchellville
Dows
StoryCity
Ankeny
Osceola
Waukee
Lamoni
Adair
Underwood
Loveland
PacificJunction
MissouriValley
Onawa
SergeantBluff
Legend!( City
Interstate
U.S. Highway
State Boundary
County Boundary
!5 Full Service Rest Area in Iowa
!5 Full Service Rest Area outside Iowa
!5 Parking Only Rest Area
!¾ Weigh Station
0 3015Miles
I
Figure 1-1. Iowa Interstate Rest Areas
Source: Rest area and weigh station locations - Iowa DOT, Nebraska Department of Roads, Missouri DOT, Illinois DOT, Minnesota DOT and South Dakota DOT websites, Accessed May 2012

3
Iowa Statewide Rest Area Management Plan
Study GoalsThe primary goal of this study is to document rest area needs in Iowa so that the Iowa DOT can make informed planning and programming investment decisions for their rest areas. Another goal is to develop guidelines for constructing new rest areas. This study also presents potential opportunities to partner with private entities in an effort to provide travelers with necessary services and dissemination of those services.
Additionally, this study will serve as an inventory of existing rest area services and needs that may be used in the creation of a rest area development program. The primary goal of a rest area development program is to establish and maintain a comprehensive system responsive to safety and service needs of commercial and recreational motorists. Comprehensive, ongoing, statewide rest area program planning allows agencies to effectively manage their development, operation and rehabilitation needs.

4
Iowa Statewide Rest Area Management Plan
CHAPTER 2 – EXISTING REST AREA REVIEWThe existing Iowa interstate rest areas were reviewed to identify what rest area services are provided, where they are provided and how utilized they are. This was conducted by collecting data at each of the existing Iowa interstate rest areas. Existing services at all Iowa interstate rest areas were documented. Rest area services were also documented for interstate rest areas adjacent to Iowa located in neighboring states. Additionally, daily traffic volumes and parking utilization information was collected at each Iowa interstate rest area. The following sections summarize existing rest area services, daily traffic volumes and daily parking utilization for each interstate rest area in Iowa.
Summary of Existing Interstate Rest Area ServicesRest area services were identified through a review of information provided on the Iowa DOT website, site visits and correspondence with Iowa DOT staff. Rest area services are provided to the travelling public 24 hours per day. All rest areas in Iowa provide many of the same services. Each of the rest areas provides the following services:
■ Car Parking
■ Handicap Parking
■ Truck Parking
■ Restroom Facilities
■ Handicap Accessible Facilities
■ Picnic Facilities
■ Pet Exercise Areas
■ Telephone Services
■ Traveler Information (Weather, Road Construction and Construction Detours via the Iowa DOT Traveler Information Network; Motorist Information such as local attractions)
■ Vending Machines (Located at 36 of the 39 Rest Areas)
■ Wi-Fi
A full list of the existing services provided at each of the Iowa rest areas is shown in Table 2-1.
Additionally, existing rest area services were identified for the rest areas adjacent to Iowa. These are the rest areas nearest to Iowa in adjacent states on interstate routes. A list of the existing services provided at the adjacent rest areas is shown in Table 2-2.
The anticipated service life for a rest area building is around 20 years (per Iowa DOT). This is based on projected future traffic at the rest area and wear of facility equipment (stools, sinks, hand rails, etc.). Facility equipment is often upgraded as needed at rest areas to extend the service life of buildings until a new building can be constructed. There are 39 rest area buildings in Iowa. Of these 39, 21 were built between 1966 and 1975 (ranging between 37 and 46 years old). Improvements are scheduled for 5 of the 21 outdated buildings, leaving 16 rest areas that will continue to exceed their anticipated service life. This set of 16 rest areas includes the rest areas on I-80 near Waukee that are anticipated to be closed as a result of a local project that will construct a new I-80 interchange with Alice’s Road over the existing Waukee rest areas.

5
Iowa Statewide Rest Area Management Plan
Car
Par
king
(N
on-
Han
dic
ap)
Han
dic
ap P
arki
ng
Tru
ck P
arki
ng
Pacific Junction NB 38 1974 26 2 15 Pacific Junction SB 38 1974 26 2 15 Missouri Valley NB 79 1971 18 2 13 Missouri Valley SB 79 1971 16 2 13 Onawa NB 110 1971 25 2 16 Onawa SB 110 1971 25 2 15 Sergeant Bluff NB 139 1966 28 2 14 Sergeant Bluff SB 139 2000 29 4 15
Lamoni NB/SB 7 2000 31 2 16 Osceola NB 33 1971 35 2 11 Osceola SB 33 1971 37 2 11
Ankeny NB 3 99 2014 48 4 20
Ankeny SB 3 99 2014 48 4 20 Story City NB 120 1969 27 2 16 Story City SB 119 2009 28 2 15 Dows NB/SB 159 2003 95 4 50 Northwood NB/SB 214 1998 95 5 34
Underwood EB 19 2007 24 2 15 Underwood WB 19 1969 26 2 16 Adair EB 81 2002 33 4 12 Adair WB 80 2011 38 2 12 Waukee EB 119 1969 30 2 22 Waukee WB 119 1969 31 2 22 Mitchellville EB 147 1966 47 2 24 Mitchellville WB 147 2002 54 3 22 Grinnell EB 180 1999 30 2 25 Grinnell WB 180 1966 23 2 10 Victor EB 208 1967 87 3 22 Victor WB 208 1967 72 3 19 Tiffin EB 237 2010 71 4 23 Tiffin WB 237 2001 77 6 23 Wilton EB 270 2002 36 2 16 Wilton WB 270 1999 40 2 15 3 Davenport EB 300 1966 39 2 14 Davenport WB 300 2001 46 4 20
Cedar Rapids NB 13 2012 26 2 16 Cedar Rapids SB 13 1975 26 2 15
Loveland EB 16 1970 16 2 10 3
Loveland WB 18 1970 50 2 15 3
I-680 Rest Areas
Pic
nic
Fac
iliti
es
Service
Number of Spaces 1
I-80 Rest Areas
I-380 Rest Areas
I-35 Rest Areas
Wi-
Fi
I-29 Rest Areas
Pet
Exe
rcis
e A
rea
Tel
epho
ne S
ervi
ces
TD
D 2
Tra
vele
r In
form
atio
n
RV
Dum
p St
atio
n
Ven
din
g M
achi
nes
Rest Area Han
dic
ap A
cces
sibl
e F
acili
ties
Mile
Pos
t
Yea
r Bu
ilt
Car
/ P
icku
p w
ith
Tra
iler
Par
king
Res
troo
m F
acili
ties
Fam
ily R
estr
oom
F
acili
ties
Table 2-1. Existing Rest Area Services (Page 1 of 2)
Source: Unless otherwise noted, data was obtained from Iowa DOT, July 20121 Data collected by HDR during field review, June 20122 Telecommunications Device for the Deaf3 Rest area site/building currently under construction. New facility will be open in year 2014/2015. Services shown are for new rest area.

6
Iowa Statewide Rest Area Management Plan
Table 2-1. Existing Rest Area Services (Page 2 of 2)
Source: Unless otherwise noted, data was obtained from Iowa DOT, July 20121 Data collected by HDR during field review, June 20122 Telecommunications Device for the Deaf3 Truck parking spaces are not individually striped. Number represents approximate number of spaces for truck parking.
Car
Par
king
(N
on-
Han
dic
ap)
Han
dic
ap P
arki
ng
Tru
ck P
arki
ng
Pacific Junction NB 38 1974 26 2 15 Pacific Junction SB 38 1974 26 2 15 Missouri Valley NB 79 1971 18 2 13 Missouri Valley SB 79 1971 16 2 13 Onawa NB 110 1971 25 2 16 Onawa SB 110 1971 25 2 15 Sergeant Bluff NB 139 1966 28 2 14 Sergeant Bluff SB 139 2000 29 4 15
Lamoni NB/SB 7 2000 31 2 16 Osceola NB 33 1971 35 2 11 Osceola SB 33 1971 37 2 11
Ankeny NB 3 99 2014 48 20 4
Ankeny SB 3 99 2014 48 20 4 Story City NB 120 1969 27 2 16 Story City SB 119 2009 28 2 15 Dows NB/SB 159 2003 95 4 50 Northwood NB/SB 214 1998 95 5 34
Underwood EB 19 2007 24 2 15 Underwood WB 19 1969 26 2 16 Adair EB 81 2002 33 4 12 Adair WB 80 2011 38 2 12 Waukee EB 119 1969 30 2 22 Waukee WB 119 1969 31 2 22 Mitchellville EB 147 1966 47 2 24 Mitchellville WB 147 2002 54 3 22 Grinnell EB 180 1999 30 2 25 Grinnell WB 180 1966 23 2 10 Victor EB 208 1967 87 3 22 Victor WB 208 1967 72 3 19 Tiffin EB 237 2010 71 4 23 Tiffin WB 237 2001 77 6 23 Wilton EB 270 2002 36 2 16 Wilton WB 270 1999 40 2 15 3 Davenport EB 300 1966 39 2 14 Davenport WB 300 2001 46 4 20
Cedar Rapids NB 13 2012 26 2 16 Cedar Rapids SB 13 1975 26 2 15
Loveland EB 16 1970 16 2 10 3
Loveland WB 18 1970 50 2 15 3
Han
dic
ap A
cces
sibl
e F
acili
ties
Mile
Pos
t
Yea
r Bu
ilt
Car
/ P
icku
p w
ith
Tra
iler
Par
king
Res
troo
m F
acili
ties
Fam
ily R
estr
oom
F
acili
ties
I-680 Rest Areas
Pic
nic
Fac
iliti
es
Service
Number of Spaces 1
I-80 Rest Areas
I-380 Rest Areas
I-35 Rest Areas
Wi-
Fi
I-29 Rest Areas
Pet
Exe
rcis
e A
rea
Tel
epho
ne S
ervi
ces
TD
D 2
Tra
vele
r In
form
atio
n
RV
Dum
p St
atio
n
Ven
din
g M
achi
nes
Rest Area
Car
Par
king
(N
on-
Han
dic
ap)
Han
dic
ap P
arki
ng
Tru
ck P
arki
ng
Pacific Junction NB 38 1974 26 2 15 Pacific Junction SB 38 1974 26 2 15 Missouri Valley NB 79 1971 18 2 13 Missouri Valley SB 79 1971 16 2 13 Onawa NB 110 1971 25 2 16 Onawa SB 110 1971 25 2 15 Sergeant Bluff NB 139 1966 28 2 14 Sergeant Bluff SB 139 2000 29 4 15
Lamoni NB/SB 7 2000 31 2 16 Osceola NB 33 1971 35 2 11 Osceola SB 33 1971 37 2 11
Ankeny NB 3 99 2014 48 20 4
Ankeny SB 3 99 2014 48 20 4 Story City NB 120 1969 27 2 16 Story City SB 119 2009 28 2 15 Dows NB/SB 159 2003 95 4 50 Northwood NB/SB 214 1998 95 5 34
Underwood EB 19 2007 24 2 15 Underwood WB 19 1969 26 2 16 Adair EB 81 2002 33 4 12 Adair WB 80 2011 38 2 12 Waukee EB 119 1969 30 2 22 Waukee WB 119 1969 31 2 22 Mitchellville EB 147 1966 47 2 24 Mitchellville WB 147 2002 54 3 22 Grinnell EB 180 1999 30 2 25 Grinnell WB 180 1966 23 2 10 Victor EB 208 1967 87 3 22 Victor WB 208 1967 72 3 19 Tiffin EB 237 2010 71 4 23 Tiffin WB 237 2001 77 6 23 Wilton EB 270 2002 36 2 16 Wilton WB 270 1999 40 2 15 3 Davenport EB 300 1966 39 2 14 Davenport WB 300 2001 46 4 20
Cedar Rapids NB 13 2012 26 2 16 Cedar Rapids SB 13 1975 26 2 15
Loveland EB 16 1970 16 2 10 3
Loveland WB 18 1970 50 2 15 3
Han
dic
ap A
cces
sibl
e F
acili
ties
Mile
Pos
t
Yea
r Bu
ilt
Car
/ P
icku
p w
ith
Tra
iler
Par
king
Res
troo
m F
acili
ties
Fam
ily R
estr
oom
F
acili
ties
I-680 Rest Areas
Pic
nic
Fac
iliti
es
Service
Number of Spaces 1
I-80 Rest Areas
I-380 Rest Areas
I-35 Rest Areas
Wi-
Fi
I-29 Rest Areas
Pet
Exe
rcis
e A
rea
Tel
epho
ne S
ervi
ces
TD
D 2
Tra
vele
r In
form
atio
n
RV
Dum
p St
atio
n
Ven
din
g M
achi
nes
Rest Area

7
Iowa Statewide Rest Area Management Plan
Table 2-2. Existing Rest Area Services at Adjacent Rest Areas to Iowa
Car
Par
king
(N
on-H
andi
cap)
Han
dica
pPa
rkin
g
Tru
ck P
arki
ng
Rockport, MO - SB 108 54 4 (2 2) 40
Vermillion, SD – NB/SB 26 35 2 25
Eagleville, MO – SB 112 55 4 (3 2) 39
Albert Lea, MN – NB 1 77 4 31 Straight River, MN – NB 35 47 3 14 Straight River, MN - SB 35 49 3 12
Krisdala Baka, IL - EB 28 24 2 (2 2) 14
Krisdala Baka, IL - WB 28 24 2 (2 2) 14
Platte River, NE - EB 425 42 2 10 Melia Hill, NE – WB 432 38 4 24 Mississippi Rapids, IL - EB 1 33 2 3 Great Sauk Trail, IL - EB 51 33 2 41 Great Sauk Trail, IL - WB 51 54 5 46
I-29 Rest Areas
I-35 Rest Areas
I-74 Rest Areas
I-80 Rest Areas
Tel
epho
ne S
ervi
ces
TD
D1
Tra
vele
r In
form
atio
n
RV
Dum
p St
atio
n
Ven
ding
Mac
hine
s
Wi-F
i
Rest Area Mile
Pos
t
Service
Number of Spaces
Car
/ Pi
ckup
with
Tra
iler
Park
ing
Res
troo
m F
acili
ties
Fam
ily R
estr
oom
Fac
ilitie
s
Han
dica
p A
cces
sibl
e Fa
cilit
ies
Picn
ic F
acili
ties
Pet E
xerc
ise
Are
a
Source: Data obtained from aerial photography and conversations with Nebraska Department of Roads, Missouri DOT, Illinois DOT, Minnesota DOT and South Dakota DOT staff, July 20121 Telecommunications Device for the Deaf2 Number in parenthesis indicates the number of additional handicap parking spots designated in the truck parking area

8
Iowa Statewide Rest Area Management Plan
Existing Rest Area Traffic VolumesTwenty-four hour daily traffic counts, including truck percentages, were conducted at each of the 39 Iowa interstate rest areas during year 2012. Traffic counts for the rest areas included in the Central Iowa Rest Area Study were conducted on weekdays during the week of January 9, 2012. These include the 12 rest areas near Adair, Waukee, Mitchellville, Osceola, Ankeny and Story City. Traffic counts at the remaining 27 rest areas were conducted on weekdays between June 5, 2012 and June 21, 2012. Additionally, weekend counts were conducted at four rest areas to assess variation between weekday and weekend traffic. Weekend counts were conducted at the two Grinnell rest areas during the weekend of June 9 and 10, 2012 and at the two Pacific Junction rest areas during the weekend of June 16 and 17, 2012.
The daily traffic for each site is shown in Table 2-3. The peak volumes generally occurred between 9:00 AM and 3:00 PM. Rest area daily traffic volumes varied by location. The percentage of rest area daily traffic volumes as trucks ranged from 14% to 57%. Rest areas with the lowest truck percentages were the single-point rest areas on I-35 at Dows and Northwood. Rest areas with the highest truck percentages were at locations that were part of the Central Iowa Rest Area Study 1. Most of the rest areas were found to capture between 5% and 9% of the mainline interstate daily traffic. Figure 2-1 shows the average hourly rest area volume for each of the interstate rest area corridors through Iowa. The average hourly volumes at the I-80 and I-380 rest areas are the highest in the state. The average hourly volumes at the Loveland rest areas on I-680 are the lowest in the state. This is consistent with the interstate corridors that have the highest and lowest amounts of daily traffic. Figure 2-2 shows the comparison of hourly volumes between weekday and weekend conditions at the Grinnell and Pacific Junction rest areas. Volume trends for weekday and weekend traffic were found to be similar in magnitude and peaking characteristics.
1 Data collected at rest areas as part of the Central Iowa Rest Area Study generally resulted in lower average hourly volume, higher truck percentages and lower capture rates. Data for the Central Iowa Rest Area Study was collected in January, when car traffic at rest areas is lower than it is in June, when information was collected at the remaining rest areas. The differentiation in data from the Central Iowa Rest Area Study and data collected at the remaining rest areas was determined to not have a substantial impact on the overall interstate rest area system results.

9
Iowa Statewide Rest Area Management Plan
Table 2-3. Iowa Rest Area Weekday Traffic Volumes (Page 1 of 2)
Source: Unless noted otherwise, data was collected in June 2012 by HDR1 Annual Average Daily Traffic. Source: Iowa Department of Transportation City/County Traffic Maps (Years 2008-2011)2 Percentage of mainline interstate traffic using the rest area3 Data collected in January 2012 by HDR as part of the Central Iowa Rest Area Study. Ankeny rest area data is for the previous
location of these rest areas near mile post 94 on I-35 that were removed in year 2012.4 The single point rest areas at Dows and Northwood are located at full service interchanges and directional volumes were not
able to be determined. Volumes represent users for both directions of travel on I-35.
Rest Area Mile Post
Average Hourly Volume
Peak Hourly Volume
Time of Peak Volume
Daily Volume
% Trucks at Rest
AreaMainline AADT 1
Capture Rate 2
Pacific Junction NB 38 38 99 2:00 PM 910 25% 10200 8.90%Pacific Junction SB 38 21 46 12:00 PM 515 32% 10200 5.00%Missouri Valley NB 79 16 40 12:00 PM 385 33% 6500 5.90%Missouri Valley SB 79 22 44 1:00 PM 520 21% 6500 8.00%Onawa NB 110 22 51 10:00 AM 529 27% 6100 8.70%
Onawa SB 110 15 3111:00:00 AM/
2:00PM362 31% 6100 5.90%
Sergeant Bluff NB 139 19 45 10:00 AM 449 33% 9300 4.80%Sergeant Bluff SB 139 21 47 12:00 PM 504 34% 9300 5.40%
Lamoni NB 7 23 56 3:00 PM 554 30% 6300 8.80%Lamoni SB 7 14 57 7:00 PM 338 22% 6300 5.40%
Osceola NB 3 33 13 24 12:00 PM 309 55% 7000 4.40%
Osceola SB 3 33 10 2312:00 PM/ 2:00 PM
234 48% 7000 3.30%
Ankeny NB 3 94 14 29 3:00 PM 338 43% 18600 1.80%
Ankeny SB 3 94 15 41 10:00 AM 367 35% 18600 2.00%
Story City NB 3 120 16 36 9:00 AM 381 44% 12300 3.10%
Story City SB 3 119 20 44 12:00 PM 475 37% 12300 3.90%
Dows NB/SB 4 159 31 87 11:00 AM 745 14% 13300 5.60%
Northwood NB/SB 4 214 41 95 1:00 PM 994 15% 17300 5.70%
Underwood EB 19 38 74 4:00 PM 901 41% 9600 9.40%Underwood WB 19 35 73 2:00 PM 837 32% 9600 8.70%
Adair EB 3 81 23 47 2:00 PM 540 49% 9700 5.60%
Adair WB 3 80 19 40 3:00 PM 449 48% 9700 4.60%
Waukee EB 3 119 21 39 1:00 PM 498 56% 17000 2.90%
Waukee WB 3 119 22 46 9:00 AM 538 51% 17000 3.20%
Mitchellville EB 3 147 18 33 8:00 AM 434 57% 14700 3.00%
Mitchellville WB 3 147 22 4811:00 AM/2:00 PM
522 54% 14700 3.60%
Grinnell EB 180 33 689:00 AM/10:00 AM
798 29% 14200 5.60%
Grinnell WB 180 33 67 12:00 PM 786 34% 14200 5.50%Victor EB 208 33 63 9:00 AM 780 30% 13400 5.80%Victor WB 208 33 63 2:00 PM 801 33% 13400 6.00%Tiffin EB 237 32 64 10:00 AM 762 32% 14900 5.10%
Tiffin WB 237 31 649:00:00 AM/
12:00 PM746 35% 14900 5.00%
Wilton EB 270 32 80 11:00 AM 762 27% 16600 4.60%Wilton WB 270 34 75 10:00 AM 812 37% 16600 4.90%Davenport EB 300 28 52 10:00 AM 669 41% 13800 4.80%Davenport WB 300 46 90 9:00 AM 1115 33% 13800 8.10%
Cedar Rapids NB 13 30 59 10:00 AM 716 37% 24700 2.90%Cedar Rapids SB 13 33 68 11:00 AM 803 36% 24700 3.30%
Loveland EB 16 9 21 4:00 PM 224 28% 2500 9.00%Loveland WB 18 13 34 10:00 AM 315 29% 2500 12.60%
I-380
I-680
I-80
I-35
I-29

10
Iowa Statewide Rest Area Management Plan
Table 2-3. Iowa Rest Area Weekday Traffic Volumes (Page 2 of 2)
Rest Area Mile Post
Average Hourly Volume
Peak Hourly Volume
Time of Peak Volume
Daily Volume
% Trucks at Rest
AreaMainline AADT 1
Capture Rate 2
Pacific Junction NB 38 38 99 2:00 PM 910 25% 10200 8.90%Pacific Junction SB 38 21 46 12:00 PM 515 32% 10200 5.00%Missouri Valley NB 79 16 40 12:00 PM 385 33% 6500 5.90%Missouri Valley SB 79 22 44 1:00 PM 520 21% 6500 8.00%Onawa NB 110 22 51 10:00 AM 529 27% 6100 8.70%
Onawa SB 110 15 3111:00:00 AM/
2:00PM362 31% 6100 5.90%
Sergeant Bluff NB 139 19 45 10:00 AM 449 33% 9300 4.80%Sergeant Bluff SB 139 21 47 12:00 PM 504 34% 9300 5.40%
Lamoni NB 7 23 56 3:00 PM 554 30% 6300 8.80%Lamoni SB 7 14 57 7:00 PM 338 22% 6300 5.40%
Osceola NB 3 33 13 24 12:00 PM 309 55% 7000 4.40%
Osceola SB 3 33 10 2312:00 PM/ 2:00 PM
234 48% 7000 3.30%
Ankeny NB 3 94 14 29 3:00 PM 338 43% 18600 1.80%
Ankeny SB 3 94 15 41 10:00 AM 367 35% 18600 2.00%
Story City NB 3 120 16 36 9:00 AM 381 44% 12300 3.10%
Story City SB 3 119 20 44 12:00 PM 475 37% 12300 3.90%
Dows NB/SB 4 159 31 87 11:00 AM 745 14% 13300 5.60%
Northwood NB/SB 4 214 41 95 1:00 PM 994 15% 17300 5.70%
Underwood EB 19 38 74 4:00 PM 901 41% 9600 9.40%Underwood WB 19 35 73 2:00 PM 837 32% 9600 8.70%
Adair EB 3 81 23 47 2:00 PM 540 49% 9700 5.60%
Adair WB 3 80 19 40 3:00 PM 449 48% 9700 4.60%
Waukee EB 3 119 21 39 1:00 PM 498 56% 17000 2.90%
Waukee WB 3 119 22 46 9:00 AM 538 51% 17000 3.20%
Mitchellville EB 3 147 18 33 8:00 AM 434 57% 14700 3.00%
Mitchellville WB 3 147 22 4811:00 AM/2:00 PM
522 54% 14700 3.60%
Grinnell EB 180 33 689:00 AM/10:00 AM
798 29% 14200 5.60%
Grinnell WB 180 33 67 12:00 PM 786 34% 14200 5.50%Victor EB 208 33 63 9:00 AM 780 30% 13400 5.80%Victor WB 208 33 63 2:00 PM 801 33% 13400 6.00%Tiffin EB 237 32 64 10:00 AM 762 32% 14900 5.10%
Tiffin WB 237 31 649:00:00 AM/
12:00 PM746 35% 14900 5.00%
Wilton EB 270 32 80 11:00 AM 762 27% 16600 4.60%Wilton WB 270 34 75 10:00 AM 812 37% 16600 4.90%Davenport EB 300 28 52 10:00 AM 669 41% 13800 4.80%Davenport WB 300 46 90 9:00 AM 1115 33% 13800 8.10%
Cedar Rapids NB 13 30 59 10:00 AM 716 37% 24700 2.90%Cedar Rapids SB 13 33 68 11:00 AM 803 36% 24700 3.30%
Loveland EB 16 9 21 4:00 PM 224 28% 2500 9.00%Loveland WB 18 13 34 10:00 AM 315 29% 2500 12.60%
I-380
I-680
I-80
I-35
I-29
Source: Unless noted otherwise, data was collected in June 2012 by HDR1 Annual Average Daily Traffic. Source: Iowa Department of Transportation City/County Traffic Maps (Years 2008-2011)2 Percentage of mainline interstate traffic using the rest area3 Data collected in January 2012 by HDR as part of the Central Iowa Rest Area Study

11
Iowa Statewide Rest Area Management Plan
Figure 2-1. Average Hourly Rest Area Volume by CorridorFigure 2-1. Average Hourly Rest Area Volume by Corridor (2)
0
5
10
15
20
25
30
35
40
45
50
55
60
65
70
Num
ber
of V
ehic
les
Time
I-29
I-35
I-80
I-380
I-680
Source: HDR, January 2012 (Central Iowa Rest Area Study) and June 2012

12
Iowa Statewide Rest Area Management Plan
Figure 2-2. Weekday and Weekend Average Hourly Rest Area Volume (2)
0
10
20
30
40
50
60
70
80
Num
ber
of V
ehic
les
Time
Weekday Average
Weekend Average
* Data from Pacific Junction and Grinnell Rest Area Sites
Figure 2-2. Weekday and Weekend Average Hourly Rest Area Volume
Source: HDR, June 2012

13
Iowa Statewide Rest Area Management Plan
Existing Rest Area Parking UtilizationTwenty-four hour parking utilization was recorded for each of the 39 Iowa interstate rest areas during year 2012. Parking utilization was recorded every 90 minutes for the rest areas that were included in the Central Iowa Rest Area Study on weekdays during the week of January 9, 2012. Parking utilization for the remaining 27 rest areas was recorded every two hours on weekdays between June 5, 2012 and June 21, 2012.
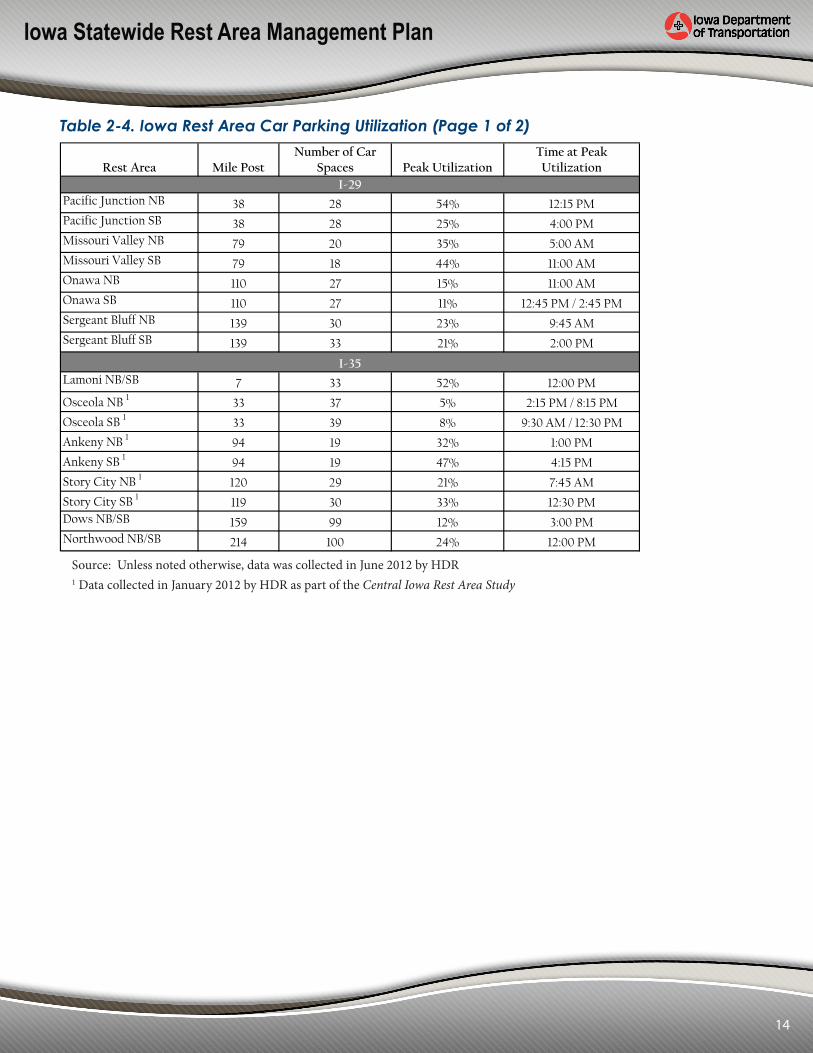
Parking utilization at each rest area for cars is shown in Table 2-4. The peak times for car parking is generally between 9:00 AM and 3:00 PM, similar to the peak times identified from the collected daily traffic counts. The peak car parking utilization occurred during this time range for 32 of the 39 Iowa interstate rest areas. It appears that the number of car parking spaces at each rest area is sufficient based on the observed demand during the data collection. The peak car parking utilization was found to be below 50% at all but two rest areas in the state. The two locations with peak car parking utilization above 50% were the northbound Pacific Junction rest area on I-29 (54% peak utilization) and the Lamoni rest area on I-35 (52% peak utilization).
Table 2-5 shows the parking utilization at each rest area for trucks. The peak time for truck parking is generally between 2:00 AM and 6:00 AM, when truck drivers park and sleep during the overnight hours. The peak truck parking utilization occurred during this time range for 34 of the 39 Iowa interstate rest areas. Truck parking capacity is not sufficient at most of the Iowa interstate rest areas to serve the peak overnight demand. During times where demand exceeds the capacity of the truck parking, trucks were observed parking on the entry/exit ramps of the rest areas or in the spaces designated for cars and trailers. The peak truck parking utilization was over 100% for 29 out of 39 rest areas. Among these 29 locations, the peak parking utilization exceeded 200% at 7 rest areas, and the average hourly parking utilization exceeded 100% at 5 sites. The truck parking capacity and single day truck parking volumes for each of the rest area interstate corridors in Iowa are shown in Figure 2-3. Figure 2-3 shows that the parking utilization was highest on the I-380, I-80 and I-35 corridors, with the total truck parking demand exceeding the total truck parking capacity during a portion of time on these corridors. This is consistent with the interstate corridors that have the highest amounts of daily traffic.
14
Iowa Statewide Rest Area Management Plan
Table 2-4. Iowa Rest Area Car Parking Utilization (Page 1 of 2)
Source: Unless noted otherwise, data was collected in June 2012 by HDR1 Data collected in January 2012 by HDR as part of the Central Iowa Rest Area Study
Rest Area Mile PostNumber of Car
Spaces Peak UtilizationTime at Peak Utilization
Pacific Junction NB 38 28 54% 12:15 PMPacific Junction SB 38 28 25% 4:00 PMMissouri Valley NB 79 20 35% 5:00 AMMissouri Valley SB 79 18 44% 11:00 AMOnawa NB 110 27 15% 11:00 AMOnawa SB 110 27 11% 12:45 PM / 2:45 PMSergeant Bluff NB 139 30 23% 9:45 AMSergeant Bluff SB 139 33 21% 2:00 PM
Lamoni NB/SB 7 33 52% 12:00 PM
Osceola NB 1 33 37 5% 2:15 PM / 8:15 PM
Osceola SB 1 33 39 8% 9:30 AM / 12:30 PM
Ankeny NB 1 94 19 32% 1:00 PM
Ankeny SB 1 94 19 47% 4:15 PM
Story City NB 1 120 29 21% 7:45 AM
Story City SB 1 119 30 33% 12:30 PMDows NB/SB 159 99 12% 3:00 PMNorthwood NB/SB 214 100 24% 12:00 PM
Underwood EB 19 26 46% 1:00 PMUnderwood WB 19 28 21% 11:15 AM
Adair EB 1 81 37 19% 10:00 AM
Adair WB 1 80 40 38% 8:15 AM
Waukee EB 1 119 32 19% 7:45 AM / 9:15 AM
Waukee WB 1 119 33 15% 3:00 PM
Mitchellville EB 1 147 49 14% 6:30 AM
Mitchellville WB 1 147 57 16% 9:45 AMGrinnell EB 180 32 41% 12:15 PMGrinnell WB 180 25 44% 4:00 PMVictor EB 208 90 8% 3:00 PMVictor WB 208 75 16% 1:15 PMTiffin EB 237 75 12% 10:30 AM / 12:30 PMTiffin WB 237 83 8% 2:00 PMWilton EB 270 38 29% 9:15 AMWilton WB 270 42 29% 1:00 PMDavenport EB 300 41 22% 2:00 PMDavenport WB 300 50 26% 10:15 AM
Cedar Rapids NB 13 28 36% 1:00 PMCedar Rapids SB 13 28 29% 11:15 AM
Loveland EB 16 18 11% 12:00 PM / 2:00 PMLoveland WB 18 52 8% 2:15 PM / 4:15 PM
I-29
I-35
I-80
I-380
I-680

15
Iowa Statewide Rest Area Management Plan
Table 2-4. Iowa Rest Area Car Parking Utilization (Page 2 of 2)
Source: Unless noted otherwise, data was collected in June 2012 by HDR1 Data collected in January 2012 by HDR as part of the Central Iowa Rest Area Study
Rest Area Mile PostNumber of Car
Spaces Peak UtilizationTime at Peak Utilization
Pacific Junction NB 38 28 54% 12:15 PMPacific Junction SB 38 28 25% 4:00 PMMissouri Valley NB 79 20 35% 5:00 AMMissouri Valley SB 79 18 44% 11:00 AMOnawa NB 110 27 15% 11:00 AMOnawa SB 110 27 11% 12:45 PM / 2:45 PMSergeant Bluff NB 139 30 23% 9:45 AMSergeant Bluff SB 139 33 21% 2:00 PM
Lamoni NB/SB 7 33 52% 12:00 PM
Osceola NB 1 33 37 5% 2:15 PM / 8:15 PM
Osceola SB 1 33 39 8% 9:30 AM / 12:30 PM
Ankeny NB 1 94 19 32% 1:00 PM
Ankeny SB 1 94 19 47% 4:15 PM
Story City NB 1 120 29 21% 7:45 AM
Story City SB 1 119 30 33% 12:30 PMDows NB/SB 159 99 12% 3:00 PMNorthwood NB/SB 214 100 24% 12:00 PM
Underwood EB 19 26 46% 1:00 PMUnderwood WB 19 28 21% 11:15 AM
Adair EB 1 81 37 19% 10:00 AM
Adair WB 1 80 40 38% 8:15 AM
Waukee EB 1 119 32 19% 7:45 AM / 9:15 AM
Waukee WB 1 119 33 15% 3:00 PM
Mitchellville EB 1 147 49 14% 6:30 AM
Mitchellville WB 1 147 57 16% 9:45 AMGrinnell EB 180 32 41% 12:15 PMGrinnell WB 180 25 44% 4:00 PMVictor EB 208 90 8% 3:00 PMVictor WB 208 75 16% 1:15 PMTiffin EB 237 75 12% 10:30 AM / 12:30 PMTiffin WB 237 83 8% 2:00 PMWilton EB 270 38 29% 9:15 AMWilton WB 270 42 29% 1:00 PMDavenport EB 300 41 22% 2:00 PMDavenport WB 300 50 26% 10:15 AM
Cedar Rapids NB 13 28 36% 1:00 PMCedar Rapids SB 13 28 29% 11:15 AM
Loveland EB 16 18 11% 12:00 PM / 2:00 PMLoveland WB 18 52 8% 2:15 PM / 4:15 PM
I-29
I-35
I-80
I-380
I-680

16
Iowa Statewide Rest Area Management Plan
Table 2-5. Iowa Rest Area Truck Parking Utilization (Page 1 of 2)
Rest Area Mile PostNumber of Truck
SpacesAverage Hourly
Utilization Peak UtilizationTime at Peak Utilization
Pacific Junction NB 38 15 64% 127% 12:15 AM
Pacific Junction SB 38 15 44% 67% 4:00 AM/6:00 AM
Missouri Valley NB 79 13 49% 108% 3:00 AM
Missouri Valley SB 79 13 60% 115% 3:15 AM
Onawa NB 110 16 43% 106% 3:00 AM
Onawa SB 110 15 37% 87% 4:45 AM
Sergeant Bluff NB 139 14 48% 114% 3:45 AM
Sergeant Bluff SB 139 15 61% 113% 4:00 AM
Lamoni NB/SB 7 16 81% 138% 2:00 AM/4:00 AM
Osceola NB 1 33 11 92% 227% 2:15 AM
Osceola SB 1 33 11 43% 82% 3:30 AM
Ankeny NB 1 94 5 84% 180% 8:30 PM
Ankeny SB 1 94 5 143% 280% 1:15 AM
Story City NB 1 120 16 55% 119% 6:15 AM
Story City SB 1 119 15 58% 127% 12:30 AM/2:00 AM
Dows NB/SB 159 50 26% 62% 3:00 AM
Northwood NB/SB 214 34 71% 115% 8:00 PM
Underwood EB 19 15 75% 133% 3:00 AM
Underwood WB 19 16 82% 175% 1:15 AM/3:15 AM
Adair EB 1 81 12 107% 208% 2:30 AM
Adair WB 1 80 12 124% 267% 2:15 AM
Waukee EB 1 119 22 69% 145% 4:45 AM
Waukee WB 1 119 22 72% 159% 4:30 AM/6:00 AM
Mitchellville EB 1 147 24 53% 100% 2:00 AM
Mitchellville WB 1 147 22 57% 118% 3:45 AM
Grinnell EB 180 25 41% 80% 4:15 AM
Grinnell WB 180 10 85% 200% 4:00 AM
Victor EB 208 22 28% 59% 5:00 AM
Victor WB 208 19 55% 142% 3:15 AM
Tiffin EB 237 23 47% 96% 2:30 AM/4:30 AM
Tiffin WB 237 23 49% 96% 6:00 AM
Wilton EB 270 16 51% 94% 3:15 AM
Wilton WB 270 15 74% 133% 5:00 AM
Davenport EB 300 14 57% 100% 2:00 AM
Davenport WB 300 20 101% 205% 2:15 AM
Cedar Rapids NB 13 16 96% 188% 5:00 AM
Cedar Rapids SB 13 15 109% 220% 3:15 AM
Loveland EB 16 10 15% 40% 2:00 AM
Loveland WB 18 15 39% 107% 4:15 AM
I-29
I-35
I-80
I-380
I-680
Source: Unless noted otherwise, data was collected in June 2012 by HDR1 Data collected in January 2012 by HDR as part of the Central Iowa Rest Area Study

17
Iowa Statewide Rest Area Management Plan
Table 2-5. Iowa Rest Area Truck Parking Utilization (Page 2 of 2)
Rest Area Mile PostNumber of Truck
SpacesAverage Hourly
Utilization Peak UtilizationTime at Peak Utilization
Pacific Junction NB 38 15 64% 127% 12:15 AM
Pacific Junction SB 38 15 44% 67% 4:00 AM/6:00 AM
Missouri Valley NB 79 13 49% 108% 3:00 AM
Missouri Valley SB 79 13 60% 115% 3:15 AM
Onawa NB 110 16 43% 106% 3:00 AM
Onawa SB 110 15 37% 87% 4:45 AM
Sergeant Bluff NB 139 14 48% 114% 3:45 AM
Sergeant Bluff SB 139 15 61% 113% 4:00 AM
Lamoni NB/SB 7 16 81% 138% 2:00 AM/4:00 AM
Osceola NB 1 33 11 92% 227% 2:15 AM
Osceola SB 1 33 11 43% 82% 3:30 AM
Ankeny NB 1 94 5 84% 180% 8:30 PM
Ankeny SB 1 94 5 143% 280% 1:15 AM
Story City NB 1 120 16 55% 119% 6:15 AM
Story City SB 1 119 15 58% 127% 12:30 AM/2:00 AM
Dows NB/SB 159 50 26% 62% 3:00 AM
Northwood NB/SB 214 34 71% 115% 8:00 PM
Underwood EB 19 15 75% 133% 3:00 AM
Underwood WB 19 16 82% 175% 1:15 AM/3:15 AM
Adair EB 1 81 12 107% 208% 2:30 AM
Adair WB 1 80 12 124% 267% 2:15 AM
Waukee EB 1 119 22 69% 145% 4:45 AM
Waukee WB 1 119 22 72% 159% 4:30 AM/6:00 AM
Mitchellville EB 1 147 24 53% 100% 2:00 AM
Mitchellville WB 1 147 22 57% 118% 3:45 AM
Grinnell EB 180 25 41% 80% 4:15 AM
Grinnell WB 180 10 85% 200% 4:00 AM
Victor EB 208 22 28% 59% 5:00 AM
Victor WB 208 19 55% 142% 3:15 AM
Tiffin EB 237 23 47% 96% 2:30 AM/4:30 AM
Tiffin WB 237 23 49% 96% 6:00 AM
Wilton EB 270 16 51% 94% 3:15 AM
Wilton WB 270 15 74% 133% 5:00 AM
Davenport EB 300 14 57% 100% 2:00 AM
Davenport WB 300 20 101% 205% 2:15 AM
Cedar Rapids NB 13 16 96% 188% 5:00 AM
Cedar Rapids SB 13 15 109% 220% 3:15 AM
Loveland EB 16 10 15% 40% 2:00 AM
Loveland WB 18 15 39% 107% 4:15 AM
I-29
I-35
I-80
I-380
I-680
Source: Unless noted otherwise, data was collected in June 2012 by HDR1 Data collected in January 2012 by HDR as part of the Central Iowa Rest Area Study

18
Iowa Statewide Rest Area Management Plan
Figure 2-3. Rest Area Truck Parking by CorridorFigure 2-3. Rest Area Truck Parking by Corridor (2)
0
50
100
150
200
250
300
350
400
450
Num
ber
of P
arke
d T
ruck
s
Time
I-29 - Trucks Parked
I-29 Truck Spaces
I-35 - Trucks Parked
I-35 Truck Spaces
I-80 - Trucks Parked
I-80 Truck Spaces
I-380 - Trucks Parked
I-380 Truck Spaces
I-680 - Trucks Parked
I-680 Truck Spaces
Source: HDR, January 2012 (Central Iowa Rest Area Study) and June 2012Note: Data was collected over a single day. Truck parking volumes vary each day.

19
Iowa Statewide Rest Area Management Plan
CHAPTER 3 – IOWA INTERSTATE CORRIDOR EVALUATIONAn evaluation of the interstate rest area corridors in Iowa was performed to identify additional locations where similar rest area services are provided to the travelling public. This evaluation included a review of ASLs and alternative parking locations for trucks. The corridor evaluation also included a review of truck travel between major freight hubs and fatigue-related crashes along the interstate corridors. The following sections summarize the evaluation of the Iowa interstate rest area corridors.
Alternative Service Locations (ASLs)Opportunities for travelers to find services that are provided at full service rest areas are also available at ASLs along the interstate corridors. ASLs are businesses or public facilities near interstate service interchanges that provide services similar to those provided at a full service rest area. Typical ASLs include truck stops, gas stations or parks. Locations identified as ASLs were those in close proximity to the interstate, defined as being within a 3-mile radius at interchanges in rural areas and a ½-mile radius at interchanges in urban areas.
On Iowa interstate rest area corridors, 228 ASLs were identified. Figure 3-1 shows the ASLs throughout Iowa on the interstate rest area corridors. Figure 3-1 also identifies the level of services that are provided at each ASL, specifically, ASLs that provide a combination of services identified as those most important to travelers (restrooms, truck parking and traveler information). Locations that provide a combination of these important services are spread throughout the state. There is a high concentration of ASLs around the Des Moines metropolitan area. Rural areas have the most limited coverage of ASLs.
Alternative Truck Parking LocationsFull service rest areas in Iowa provide approximately 660 truck parking spaces. In addition to full service rest areas, there are a number of other parking locations for trucks along the Iowa interstate corridors. Specific examples include parking only rest areas, weigh stations and ASLs that provide truck parking. The previous section identified some ASLs that provide truck parking in combination with 24-hour restrooms, as shown in Figure 3-1. However, some other ASLs that do not provide 24-hour restrooms do provide truck parking. Approximately 85 alternative truck parking locations were identified along Iowa interstate rest area corridors, equating to nearly 4,700 truck parking spaces. Truck parking locations along the Iowa interstate rest area corridors (including full service rest areas, parking only rest areas, weigh stations and ASLs with truck parking) are shown in Figure 3-2.
To gain an idea of the truck parking utilization at these alternate locations, each of the parking only rest areas, weigh stations and approximately half of the ASLs with truck parking (most of the large truck stops) along the rest area interstate corridors were observed at a single moment in time (“snapshot”) during the overnight hours (12:00 AM to 6:00 AM). Table 3-1 shows the truck parking utilization at each of the parking only rest areas, weigh stations and most of the large truck stops along the interstate rest area corridors during the “snapshot” data collection period. All of the observed truck stop parking was 70% to 95% utilized. Some of the parking only rest areas were found to be over 100% utilized during the overnight hours. Weigh stations were generally found to be sparsely used for truck parking. Trucks were also observed using ramps at service interchanges to park during overnight hours. A summary of the observed trucks parked on service interchange ramps during the “snapshot” data collection period is shown in Table 3-2.

20
Iowa Statewide Rest Area Management Plan
Figure 3-1. Alternative Service Locations
Nebraska 29
80
35
35
380
29
90
88
74
80
Illinois
Minnesota
Missouri
Nebraska
SouthDakota
Wisconsin
LYON OSCEOLA DICKINSON EMMET
ALLAMAKEE
KOSSUTH
WINNESHIEK
HOWARDWINNEBAGO
MITCHELLWORTH
SIOUX OBRIEN CLAY PALOALTO HANCOCK CERRO
GORDOCHICKASAWFLOYD
CLAYTONFAYETTE
PLYMOUTH CHEROKEE BUENAVISTA
POCAHONTASHUMBOLDT
WRIGHT
BREMER
FRANKLIN BUTLER
DUBUQUEDELAWAREWEBSTER
BUCHANAN
BLACKHAWK
WOODBURY IDA SAC CALHOUN HAMILTON HARDINGRUNDY
JACKSON
JONESLINNBENTONTAMA
MONONACRAWFORD CARROLL GREENE
BOONE
STORY MARSHALL
CLINTON
CEDAR
HARRISONSHELBY
AUDUBONGUTHRIE
JOHNSON
DALLASIOWA
POLK
POWESHIEKJASPERSCOTT
MUSCATINE
POTTAWATTAMIE CASSWASHINGTON
ADAIR KEOKUKWARREN
MADISONMAHASKA
MARION
LOUISA
MILLS MONTGOMERY ADAMS
HENRY
JEFFERSONUNION WAPELLO
CLARKE
LUCAS MONROEDES
MOINES
FREMONT PAGE TAYLOR RINGGOLDVAN
BURENDAVISDECATUR
WAYNE APPANOOSELEE 67
81
169
30
18
151
34
218
34
151
149
1418
30
136
20
218
77
18
9
65
2
69
20
75
6575
30
75
136
14
52
36
59
218
51
12
275
63
275
77
65 63
67
34
73
34
81
136
2020
63
52
6
34
61
24
59
275
150
59
6
281
30
71
69
18
71
6
61
52
81
281
136
30
69
6
169
6
20
18
Keokuk
FortMadison
Centerville
ClarindaShenandoah
Burlington
MountPleasantFairfield
Red Oak OttumwaGlenwoodCreston
Council Bluffs
OskaloosaWashingtonKnoxvilleIndianola
Atlantic Pella Muscatine
Davenport BettendorfDesMoines
Urbandale Altoona
Harlan
IowaCity
CoralvilleNewtonAnkeny
Grinnell
PerryClinton
CedarRapids
Denison NevadaAmes Marshalltown Marion
HiawathaBooneCarrollMaquoketa
AnamosaVinton
WebsterCity Independence Manchester
SiouxCity
Waterloo
DubuqueFortDodge
IowaFalls
CedarFalls
StormLake
OelweinWaverly
CherokeeLe Mars
OrangeCity
CharlesCityAlgona
SiouxCenter
ClearLake
SpencerMasonCity
Decorah
Estherville 0 3015Miles
Legend
Alternative Service Location24-Hour Restroom, Truck Parking, & Traveler Information24-Hour Restroom & Truck Parking
24-Hour Restroom
Restroom (Not 24-Hour)
Full Service Rest Area
Park Without Restroom
U.S. Highway
Interstate
State Boundary
County Boundary
City
Source: HDR, September 2012

21
Iowa Statewide Rest Area Management Plan
Figure 3-2. Truck Parking Locations
!(
!(
!(!(!(
!(
!(!(!( !(
!( !(
!(!( !(!(
!(!( !(
!(
!( !(!( !(!( !(!( !(
!(!(!( !(
!(!(
!(!( !(!( !( !(!(!(!(
!(!(
!(
!( !( !(!(
!(!(!( !( !(
!(!(
!(!(
!(
!(!(!(
!(!(
!( !(
!(
!(
!5!5
!5!5
!5!5
!5!5
!5!5
!5!5
!5
!5!5
!5
!5!5
!5!5
!5!5
!5!5
!5
!5!5
!5!5
!5
!5!5
!5
!5!5
!5!5
!5!5
!5!5
!¾
!5!5
!5!¾
!¾!5
!5!¾
!5!5
!5!¾
!5!5 !¾
!5!¾
!¾ !5!5
!¾!¾
")")")
")")")
")")
")
")
")")")")")")")")")
")")")")")")")
")")")")")")
")
")
")")
")
")
")
")
")
")
")
")
")
")")")
")
")
")")
")
")
")")
")
")
")")
Nebraska §̈¦29
§̈¦80
§̈¦35
§̈¦80
§̈¦35
§̈¦380
§̈¦29
§̈¦90
§̈¦88
§̈¦74
Illinois
Minnesota
Missouri
Nebraska
SouthDakota
Wisconsin
LYON OSCEOLA DICKINSON EMMET
ALLAMAKEE
KOSSUTH
WINNESHIEK
HOWARDWINNEBAGO
MITCHELLWORTH
SIOUX OBRIEN CLAY PALOALTO HANCOCK CERRO
GORDO CHICKASAWFLOYD
CLAYTONFAYETTE
PLYMOUTH CHEROKEE BUENAVISTA
POCAHONTASHUMBOLDT
WRIGHT
BREMER
FRANKLIN BUTLER
DUBUQUEDELAWAREWEBSTER
BUCHANANBLACKHAWKWOODBURY IDA SAC CALHOUN HAMILTON HARDIN
GRUNDY
JACKSON
JONESLINNBENTONTAMA
MONONACRAWFORD CARROLL GREENE BOONE STORY MARSHALL
CLINTON
CEDAR
HARRISONSHELBY
AUDUBONGUTHRIE
JOHNSON
DALLASIOWA
POLK
POWESHIEKJASPER SCOTT
MUSCATINE
POTTAWATTAMIE CASSWASHINGTON
ADAIR KEOKUKWARRENMADISONMAHASKA
MARION
LOUISA
MILLS MONTGOMERY ADAMS
HENRY
JEFFERSONUNION WAPELLO
CLARKELUCAS MONROE
DESMOINES
FREMONT PAGE TAYLOR RINGGOLDVAN
BURENDAVISDECATUR
WAYNE APPANOOSELEE £¤67
£¤81
£¤169
£¤30
£¤18
£¤151
£¤34
£¤218
£¤34
£¤151
£¤149
£¤14£¤18
£¤30
£¤136
£¤20
£¤218
£¤77
£¤18
£¤6
£¤9
£¤65
£¤2
£¤69
£¤20
£¤75
£¤65£¤75
£¤30
£¤75
£¤136
£¤14
£¤52
£¤36
£¤59
£¤218
£¤51
£¤12
£¤275
£¤63
£¤275
£¤77
£¤65 £¤63
£¤67
£¤34
£¤73
£¤34
£¤81
£¤136
£¤20
£¤20
£¤63
£¤218
£¤52
£¤34
£¤61
£¤24
£¤59
£¤275
£¤150
£¤59
£¤6
£¤281
£¤30
£¤71
£¤69
£¤18
£¤71
£¤6
£¤61
£¤52
£¤81
£¤281
£¤136
£¤30
£¤69
£¤6
£¤169
£¤6
£¤20
£¤18
Keokuk
FortMadison
Centerville
ClarindaShenandoah
Burlington
MountPleasantFairfield
Red Oak OttumwaGlenwood
Creston
CouncilBluffs
OskaloosaWashingtonKnoxvilleIndianola
Atlantic Pella Muscatine
Davenport
BettendorfDes
Moines
UrbandaleAltoona
Harlan IowaCity
CoralvilleNewtonAnkeny
Grinnell
PerryClinton
CedarRapids
Denison NevadaAmesMarshalltown
MarionHiawatha
BooneCarrollMaquoketa
AnamosaVinton
WebsterCity Independence Manchester
SiouxCity
Waterloo
DubuqueFortDodge
IowaFalls
CedarFalls
StormLake
OelweinWaverly
CherokeeLe Mars
OrangeCity
CharlesCityAlgona
SiouxCenter
ClearLake
SpencerMasonCity
Decorah
Estherville
Legend!( City
Interstate
U.S. Highway
State Boundary
County Boundary
!5 Full Service Rest Area
!5 Parking Only Rest Area
!¾ Weigh Station
") Alternative Service Locations with Truck Parking
0 3015Miles
I
Source: HDR, September 2012

22
Iowa Statewide Rest Area Management Plan
Table 3-1. Additional Iowa Truck Parking Locations (Page 1 of 2)
Additional Truck Parking Mile PostApproximate Number of
Truck SpacesTruck Parking
Utilization
Sapp Bros 1B 110 85%Pilot Travel Center 1B 70 90%Travel Centers of America 3 95 80%Sapp Bros 10 150 85%Weigh Station NB 11 7 30%Taylor Quik-Pik 75 80 80%Parking Only Rest Area NB/SB 92 10 10%Parking Only Rest Area NB 132 8 50%Weigh Station SB 132 8 0%Sioux Harbor Travel Plaza 143 35 70%
Weigh Station NB 30 3 35%Parking Only Rest Area SB 30 3 65%Casey’s General Store 33 30 90%Pilot Travel Center 34 80 95%Parking Only Rest Area SB 51 6 100%Parking Only Rest Area NB 53 6 100%Parking Only Rest Area NB 105 8 90%Weigh Station SB 105 8 40%Boondocks Truck Haven 144 100 80%Flying J Travel Center 144 115 75%Dows Junction 159 35 85%Dudley’s Corner 165 30 85%Pilot Travel Center 194 120 95%Parking Only Rest Area NB/SB 196 50 100%Parking Only Rest Area NB 211 5 140%Weigh Station SB 211 5 0%
Parking Only Rest Area EB/WB 32 12 280%Wings America Travel Center 40 250 70%Parking Only Rest Area EB 44 8 125%Weigh Station WB 44 8 75%Weigh Station EB 115 13 0%Love’s Travel Center 125 250 90%Pilot Travel Center 126 75 85%QuikTrip 136 40 75%Bosselman Travel Center 142 230 95%Weigh Station WB 151 11 20%Love’s Travel Center 168 100 90%Pilot Travel Center 201 155 80%Kwik Trip 201 200 80%Pilot Travel Center 265 75 80%Parking Only Rest Area EB/WB 268 16 75%Pilot Travel Center 284 40 85%Pilot Travel Center 284 160 75%Iowa 80 284 850 85%Flying J Travel Center 292 200 95%
Center Point Travel Plaza 35 100 70%Weigh Station NB 51 5 0%Weigh Station SB 53 5 40%Road Ranger Truck Plaza 68 200 85%Flying J Travel Center 68 105 75%
I-380
I-29
I-35
I-80Source: HDR, June 2012

23
Iowa Statewide Rest Area Management Plan
Table 3-1. Additional Iowa Truck Parking Locations (Page 2 of 2)
Additional Truck Parking Mile PostApproximate Number of
Truck SpacesTruck Parking
Utilization
Sapp Bros 1B 110 85%Pilot Travel Center 1B 70 90%Travel Centers of America 3 95 80%Sapp Bros 10 150 85%Weigh Station NB 11 7 30%Taylor Quik-Pik 75 80 80%Parking Only Rest Area NB/SB 92 10 10%Parking Only Rest Area NB 132 8 50%Weigh Station SB 132 8 0%Sioux Harbor Travel Plaza 143 35 70%
Weigh Station NB 30 3 35%Parking Only Rest Area SB 30 3 65%Casey’s General Store 33 30 90%Pilot Travel Center 34 80 95%Parking Only Rest Area SB 51 6 100%Parking Only Rest Area NB 53 6 100%Parking Only Rest Area NB 105 8 90%Weigh Station SB 105 8 40%Boondocks Truck Haven 144 100 80%Flying J Travel Center 144 115 75%Dows Junction 159 35 85%Dudley’s Corner 165 30 85%Pilot Travel Center 194 120 95%Parking Only Rest Area NB/SB 196 50 100%Parking Only Rest Area NB 211 5 140%Weigh Station SB 211 5 0%
Parking Only Rest Area EB/WB 32 12 280%Wings America Travel Center 40 250 70%Parking Only Rest Area EB 44 8 125%Weigh Station WB 44 8 75%Weigh Station EB 115 13 0%Love’s Travel Center 125 250 90%Pilot Travel Center 126 75 85%QuikTrip 136 40 75%Bosselman Travel Center 142 230 95%Weigh Station WB 151 11 20%Love’s Travel Center 168 100 90%Pilot Travel Center 201 155 80%Kwik Trip 201 200 80%Pilot Travel Center 265 75 80%Parking Only Rest Area EB/WB 268 16 75%Pilot Travel Center 284 40 85%Pilot Travel Center 284 160 75%Iowa 80 284 850 85%Flying J Travel Center 292 200 95%
Center Point Travel Plaza 35 100 70%Weigh Station NB 51 5 0%Weigh Station SB 53 5 40%Road Ranger Truck Plaza 68 200 85%Flying J Travel Center 68 105 75%
I-380
I-29
I-35
I-80
Source: HDR, June 2012
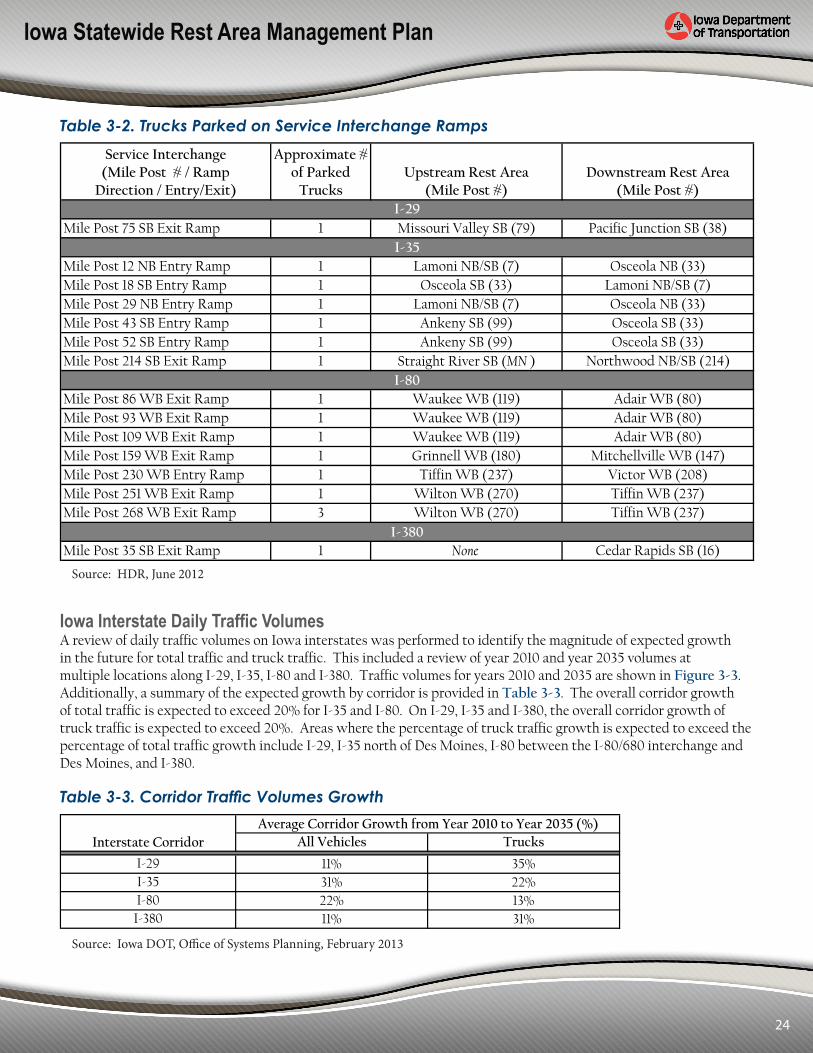
24
Iowa Statewide Rest Area Management Plan
Table 3-2. Trucks Parked on Service Interchange Ramps
Iowa Interstate Daily Traffic VolumesA review of daily traffic volumes on Iowa interstates was performed to identify the magnitude of expected growth in the future for total traffic and truck traffic. This included a review of year 2010 and year 2035 volumes at multiple locations along I-29, I-35, I-80 and I-380. Traffic volumes for years 2010 and 2035 are shown in Figure 3-3. Additionally, a summary of the expected growth by corridor is provided in Table 3-3. The overall corridor growth of total traffic is expected to exceed 20% for I-35 and I-80. On I-29, I-35 and I-380, the overall corridor growth of truck traffic is expected to exceed 20%. Areas where the percentage of truck traffic growth is expected to exceed the percentage of total traffic growth include I-29, I-35 north of Des Moines, I-80 between the I-80/680 interchange and Des Moines, and I-380.
Service Interchange(Mile Post # / Ramp
Direction / Entry/Exit)
Approximate # of Parked
TrucksUpstream Rest Area
(Mile Post #)Downstream Rest Area
(Mile Post #)
Mile Post 75 SB Exit Ramp 1 Missouri Valley SB (79) Pacific Junction SB (38)
Mile Post 12 NB Entry Ramp 1 Lamoni NB/SB (7) Osceola NB (33)Mile Post 18 SB Entry Ramp 1 Osceola SB (33) Lamoni NB/SB (7)Mile Post 29 NB Entry Ramp 1 Lamoni NB/SB (7) Osceola NB (33)Mile Post 43 SB Entry Ramp 1 Ankeny SB (99) Osceola SB (33)Mile Post 52 SB Entry Ramp 1 Ankeny SB (99) Osceola SB (33)Mile Post 214 SB Exit Ramp 1 Straight River SB (MN ) Northwood NB/SB (214)
Mile Post 86 WB Exit Ramp 1 Waukee WB (119) Adair WB (80)Mile Post 93 WB Exit Ramp 1 Waukee WB (119) Adair WB (80)Mile Post 109 WB Exit Ramp 1 Waukee WB (119) Adair WB (80)Mile Post 159 WB Exit Ramp 1 Grinnell WB (180) Mitchellville WB (147)Mile Post 230 WB Entry Ramp 1 Tiffin WB (237) Victor WB (208)Mile Post 251 WB Exit Ramp 1 Wilton WB (270) Tiffin WB (237)Mile Post 268 WB Exit Ramp 3 Wilton WB (270) Tiffin WB (237)
Mile Post 35 SB Exit Ramp 1 None Cedar Rapids SB (16)I-380
I-80
I-29
I-35
Source: HDR, June 2012
All Vehicles Trucks
I-29 11% 35%I-35 31% 22%I-80 22% 13%I-380 11% 31%
Interstate CorridorAverage Corridor Growth from Year 2010 to Year 2035 (%)
Table 3-3. Corridor Traffic Volumes Growth
Source: Iowa DOT, Office of Systems Planning, February 2013

25
Iowa Statewide Rest Area Management Plan
Figure 3-3. Iowa Interstate Daily Traffic Volumes
!(
!(
!(!(!(
!(
!(!(!( !(
!( !(
!(!( !(!(
!(!( !(
!(
!( !(!( !(!( !(!( !(
!(!(!( !(
!(!(
!(!( !(!( !( !(!(!(!(
!(!(
!(
!( !( !(!(
!(!(!( !( !(
!(!(
!(!(
!(
!(!(!(
!( !(!( !(
!(
!(
!5!5
!¾
!5!5
!5!¾
!¾!5
!5!¾
!5!5
!5!¾
!5!5 !¾
!5!¾
!¾ !5!5
!¾!¾
!5!5
!5!5
!5!5
!5!5
!5!5
!5!5
!5
!5!5
!5
!5!5
!5!5
!5!5
!5!5
!5
!5!5
!5!5
!5
!5!5
!5
!5!5
!5!5
!5!5
! !
!
!!
!
!
!
!
!
!
!
!
!
!
!
!
!
!
!
Nebraska§̈¦29
§̈¦80
§̈¦35
§̈¦80
§̈¦35
§̈¦380
§̈¦29
§̈¦90
§̈¦88
§̈¦74
§̈¦680
Illinois
Minnesota
Missouri
Nebraska
SouthDakota
Wisconsin
LYON OSCEOLADICKINSON
EMMET
ALLAMAKEE
KOSSUTH
WINNESHIEK
HOWARDWINNEBAGOMITCHELL
WORTH
SIOUX OBRIEN CLAYPALOALTO
HANCOCK CERROGORDO
CHICKASAW
FLOYD
CLAYTONFAYETTEPLYMOUTH
CHEROKEE BUENAVISTA
POCAHONTASHUMBOLDT
WRIGHTBREMER
FRANKLIN BUTLER
DUBUQUEDELAWARE
WEBSTER
BUCHANAN
BLACKHAWK
WOODBURY IDA SAC CALHOUNHAMILTON
HARDINGRUNDY
JACKSONJONESLINN
BENTONTAMAMONONA CRAWFORD
CARROLLGREENE
BOONESTORY
MARSHALL
CLINTON
CEDARHARRISON
SHELBY AUDUBONGUTHRIE
JOHNSON
DALLASIOWA
POLK
POWESHIEKJASPERSCOTT
MUSCATINE
POTTAWATTAMIE CASS WASHINGTONADAIR KEOKUKWARRENMADISON MAHASKAMARION
LOUISA
MILLS
MONTGOMERY
ADAMSHENRYJEFFERSON
UNION
WAPELLO
CLARKELUCAS MONROE
DESMOINES
FREMONT PAGE TAYLOR RINGGOLDVAN
BURENDAVISDECATUR WAYNE APPANOOSELEE £¤67
£¤81
£¤169
£¤9
£¤30
£¤218
£¤18
£¤151
£¤61
£¤34
£¤218
£¤151
£¤149
£¤14
£¤136
£¤20
£¤77
£¤18
£¤65
£¤2
£¤20
£¤69
£¤75
£¤65
£¤75
£¤30
£¤75
£¤136
£¤52
£¤14
£¤34
£¤36
£¤59
£¤218£¤51
£¤18£¤12
£¤275
£¤63
£¤65 £¤63
£¤77
£¤67
£¤73
£¤34
£¤81
£¤136
£¤20
£¤20
£¤63
£¤52
£¤34
£¤6
£¤61
£¤24
£¤59
£¤275
£¤150
£¤6
£¤59
£¤281
£¤30
£¤34
£¤71
£¤69
£¤18
£¤71
£¤6
£¤52
£¤61
£¤81
£¤281
£¤136
£¤69
£¤30
£¤6
£¤169
£¤6
£¤20
£¤18
Keokuk
FortMadison
CentervilleClarindaShenandoah
Burlington
MountPleasantFairfield
Red Oak OttumwaGlenwood
Creston
CouncilBluffs
Oskaloosa WashingtonKnoxville
IndianolaAtlantic Pella
Muscatine
Davenport BettendorfDesMoines
Urbandale AltoonaHarlan
IowaCity
CoralvilleNewtonAnkeny
Grinnell
PerryClinton
CedarRapidsDenison Nevada
Marshalltown
Marion
HiawathaBooneMaquoketa
AnamosaVinton
WebsterCity
Independence
Manchester
SiouxCity
WaterlooDubuque
FortDodge
IowaFalls
CedarFalls
StormLake
OelweinWaverly
CherokeeLe Mars
OrangeCity
CharlesCity
Algona
SiouxCenter
ClearLake
Spencer
MasonCity
Decorah
Estherville
DavenportWilton
CedarRapidsTiffinVictorGrinnell
Northwood
Mitchellville
Dows
StoryCity
Ankeny
Osceola
Waukee
Lamoni
AdairUnderwood
Loveland
PacificJunction
MissouriValley
Onawa
SergeantBluff
0 3015Miles
I
XX,XXXX,XXX
XX,XXXX,XXX
24,0007,500
25,2008,000
4,10016,1004,600
4,00019,7004,800
21,2004,300
28,5005,500
87,30013,400
8,60033,7008,900
36,0005,500
47,3007,500
20,7004,100
3,60019,2004,500
19,1005,300
26,4008,700
11,20049,50012,500
31,40011,200
26,4004,600
29,4006,000
Legend!( City
Interstate
U.S. Highway
State Boundary
County Boundary
!5 Parking Only Rest Area
!¾ Weigh Station
Daily Traffic Volumes2010 AADT2010 Truck AADT2035 ADT2035 Truck ADT
18,5003,100
21,2003,900
13,7003,400
13,6004,400
12,7003,400
14,3005,200 19,800
7,40023,5008,800
21,0006,700
22,0006,90011,800
3,20014,2004,100 12,500
15,800
125,40016,000
30,90036,900
30,7009,900
48,40014,600
21,4006,000
15,700
22,6005,100
!5 Full Service Rest Area
Source: Iowa DOT, Office of Systems Planning, February 2013

26
Iowa Statewide Rest Area Management Plan
Truck Travel between Major Freight HubsTruck travel was reviewed to identify routes between major freight hubs that use Iowa interstates and probable locations where truck drivers would stop to rest throughout Iowa. For the purposes of this review, major freight hubs were identified as cities with metropolitan area population greater than 1,000,000.
Federal regulations allow truck drivers a period of 14 consecutive hours of duty time after they have been off duty for 10 or more consecutive hours 1. These drivers are allowed to drive up to 11 hours of that 14-hour period and must be off duty for another 10 consecutive hours before driving again. Based on these hours-of-service limits it was assumed that the average truck driver travels between 10 and 11 hours from their origin before stopping to rest during the first day of their trip.
Ten major freight hubs were identified where the route to other major freight hubs travels along Iowa interstates and the probable stopping location at the end of the first day of travel is within Iowa. This one day of travel is equal to a driving time between 10 and 11 hours (based on the driving time restrictions and assumptions listed above). This time range difference (11 hours - 10 hours = 1 hour) equates to approximately 65 miles of interstate roadway (based on the average posted speed of Iowa interstate). For the purposes of documenting the results of this analysis, this 65-mile range is referred to as a “freight stopping range”. It was decided to only identify the freight stopping ranges in Iowa where truck drivers would stop after one day of travel from the originating major freight hub as opposed to stopping after more than one day of travel. This was because of the increase to the freight stopping range distance at the end of more than one day of travel. After two days of travel from the originating major freight hub the assumed time window would expand to 20-22 hours (representing a freight stopping range 130 miles wide), and after three days of travel from the trip origin the window expands to 30-33 hours (representing a freight stopping range 195 miles wide). For example, a truck driver originating in Las Vegas and destined for Minneapolis could end their second day of travel after 20 hours near Des Moines or after 22 hours near the Iowa/Minnesota border on I-35, encompassing a large portion of the state.
The 10 major freight hubs identified as origination points for routes between major freight hubs with trucks stopping in Iowa after one day of travel results in 11 freight stopping ranges (there are two separate freight stopping ranges for routes originating from Denver and destined east of Des Moines versus north of Des Moines). These 11 freight stopping ranges are shown on Figure 3-4. The locations for these freight stopping ranges include:
■ All 11 freight stopping ranges are located along I-80 or I-35.
■ No freight stopping ranges are located along I-29. Minneapolis is the only major freight hub north of Iowa that was identified. Routes to and from Minneapolis use I-35 to travel north/south through Iowa. The next largest city north of Iowa is Winnipeg, Canada. Some routes to and from Winnipeg use I-29; however, the population for Winnipeg is below the threshold of 1,000,000 used in this review.
■ Eight of the 11 freight stopping ranges have portions that are 30 minutes or less from the Des Moines metropolitan area. The areas encompassed by these 8 ranges include approximately 1,020 of the 5,360 truck parking spaces identified along Iowa interstates. The areas encompassed by the other 3 ranges include approximately 1,810 of the 5,360 truck parking spaces.
1 Source: FMCSA. 2011. Interstate Truck Driver’s Guide to Hours of Service. U.S. Department of Transportation, Federal Motor Carrier Safety Administration: Washington, D.C.

27
Iowa Statewide Rest Area Management Plan
Figure 3-4. Freight Stopping Ranges
Nebraska
29380
29
90
88
74
80
80
35
35
Illinois
Minnesota
Missouri
Nebraska
SouthDakota
Wisconsin
LYON OSCEOLA DICKINSON EMMET
ALLAMAKEE
KOSSUTH
WINNESHIEK
HOWARDWINNEBAGOMITCHELL
WORTH
SIOUX OBRIEN CLAY PALOALTO HANCOCK CERRO
GORDO CHICKASAWFLOYD
CLAYTONFAYETTE
PLYMOUTH CHEROKEE BUENAVISTA
POCAHONTASHUMBOLDT
WRIGHTBREMER
FRANKLIN
BUTLER
DUBUQUEDELAWARE
WEBSTERBUCHANAN
BLACKHAWK
WOODBURY IDA SAC CALHOUN
HAMILTON
HARDINGRUNDY
JACKSON
JONESLINNBENTON
TAMAMONONA CRAWFORD
CARROLLGREENE
BOONESTORY MARSHALL
CLINTON
CEDAR
HARRISONSHELBY
AUDUBON GUTHRIE JOHNSON
DALLAS
IOWAPOWESHIEKJASPER
SCOTT
MUSCATINE
POTTAWATTAMIE CASSWASHINGTON
ADAIR KEOKUKWARRENMADISONMAHASKA
MARION
LOUISA
MILLSMONTGOMERY ADAMS
HENRY
JEFFERSONUNION
WAPELLOCLARKELUCAS MONROE
DESMOINES
FREMONT PAGE TAYLOR RINGGOLDVAN
BURENDAVISDECATUR
WAYNE APPANOOSELEE 67
81
169
30
218
18
34
218
34
151
149
1418
30
20
136218
77
18
9
65
30
2
69
20
75
65
75
75
52
14
136
34
36
59
21851
12
275
63
275
77
65 63
67
73
34
81
136
281
2020
63
52
34
6
61
24
59
275
150
59
6
281
30
71
69
18
71
6
61
52
81
281
136
30
69
6
169
20
18
Keokuk
FortMadison
Centerville
ClarindaShenandoah
Burlington
MountPleasantFairfieldRed Oak
OttumwaGlenwood
Creston
CouncilBluffs
OskaloosaWashington
Knoxville
Indianola
Atlantic Pella Muscatine
DavenportBettendorf
Harlan
IowaCity
Coralville
Clinton
CedarRapids
Denison MarionHiawathaCarroll
MaquoketaAnamosaVinton
WebsterCity Independence Manchester
SiouxCity
Waterloo Dubuque
FortDodge
IowaFalls
CedarFalls
StormLake
OelweinWaverly
CherokeeLe Mars
OrangeCity
CharlesCityAlgona
SiouxCenter
SpencerMasonCity
Decorah
Estherville 0 3015Miles
LegendCity
Interstate
U.S. Highway
State Boundary
County Boundary
Probable Freight Hub Stopping RangeFull Service Rest Area in Iowa
Weigh Station
Parking Only Rest Area
From Cleveland Using I-80 WB
From Denver Using I-80 EB
From Denver Using I-80 EB / I-35 NB
From Memphis Using I-80 WB / I-35 NB
From Columbus Using I-80 WB
From Nashville Using I-80 WB
From Pittsburgh Using I-80 WB
From Detroit Using I-80 WB
From Oklahoma City Using I-35 NB
From Dallas Using I-35 NB
From Cincinnati Using I-80 WB
Source: HDR (using Google Maps), October 2012

28
Iowa Statewide Rest Area Management Plan
Source: FHWA FAF3, Year 20071 Truck freight reported in kilotons (ktons)
Origin Destination Freight (ktons) 1
Dallas Minneapolis 143.54143.54
Oklahoma City Minneapolis 14.1814.18
Total
Total
Truck Travel from Dallas using I-35 NB through Iowa
Truck Travel from Oklahoma City using I-35 NB through Iowa
Truck Travel from Detroit using I-80 WB through IowaDetroit Denver 136.05Detroit Las Vegas 5.48Detroit Los Angeles 315.67Detroit Portland 17.14Detroit Sacramento 14.91Detroit Salt Lake City 48.81Detroit San Diego 26.93Detroit San Francisco 33.06
598.04Total
Truck Travel from Detroit using I-80 WB through Iowa
4
Pittsburgh Denver 15.01Pittsburgh Las Vegas 12.94Pittsburgh Portland 4.95Pittsburgh Sacramento 6.00Pittsburgh Salt Lake City 19.78Pittsburgh San Francisco 12.12
70.80
N h ill Mi li 30 65
Total
Truck Travel from Pittsburgh using I-80 WB through Iowa
Truck Travel from Nashville using I-80 WB through IowaNashville Minneapolis 30.65
30.65
Columbus Portland 21.04Columbus Sacramento 8.02Columbus Salt Lake City 15.99Columbus San Francisco 28.00
73.06
Memphis Minneapolis 99.86
Total
Truck Travel from Columbus using I-80 WB through IowaTotal
Truck Travel from Memphis using I-80 WB / I-35 NB through IowaMemphis Minneapolis 99.86
99.86
Denver Minneapolis 88.3688.36
Denver Boston 19.20Denver Buffalo 11.44Denver Chicago 74.05Denver Cleveland 5.19
Total
Total
Truck Travel from Denver using I-80 EB / I-35 NB through Iowa
Truck Travel from Denver using I-80 EB through Iowa
Denver Detroit 76.36Denver Hartford 10.00Denver Milwaukee 6.40Denver New York City 97.71Denver Rochester 5.45
305.80
Cincinnati Portland 15.13Cincinnati Sacramento 5.94Cincinnati Salt Lake City 47 07
TotalTruck Travel from Cincinnati using I-80 WB through Iowa
Cincinnati Salt Lake City 47.07Cincinnati San Francisco 28.01
96.15
Cleveland Denver 31.00Cleveland Las Vegas 51.64Cleveland Los Angeles 221.18Cleveland Portland 16.58Cleveland Sacramento 8.00Cleveland Salt Lake City 28.41
TotalTruck Travel from Cleveland using I-80 WB through Iowa
yCleveland San Diego 19.15Cleveland San Francisco 58.08
434.04Total
Table 3-4. Truck Freight Through Iowa (Page 1 of 2)
The 11 freight stopping ranges represent 44 different origin-destination pairs (some of the freight stopping ranges include trucks that begin their trip at the same location but have different destinations, and travel along much of the same route). These origin-destination pairs were determined by reviewing the shortest interstate travel between major freight hubs to identify pairs that stop on the interstates in Iowa at the end of one day of travel. For these origin-destination pairs, the Federal Highway Administration (FHWA) Freight Analysis Framework (FAF3) database was used to determine the amount of truck freight along each of these routes through Iowa. A breakdown of the freight amounts for each of 44 routes in the freight stopping ranges is shown in Table 3-4.

29
Iowa Statewide Rest Area Management Plan
Table 3-4. Truck Freight Through Iowa (Page 2 of 2)
Origin Destination Freight (ktons) 1
Dallas Minneapolis 143.54143.54
Oklahoma City Minneapolis 14.1814.18
Total
Total
Truck Travel from Dallas using I-35 NB through Iowa
Truck Travel from Oklahoma City using I-35 NB through Iowa
Truck Travel from Detroit using I-80 WB through IowaDetroit Denver 136.05Detroit Las Vegas 5.48Detroit Los Angeles 315.67Detroit Portland 17.14Detroit Sacramento 14.91Detroit Salt Lake City 48.81Detroit San Diego 26.93Detroit San Francisco 33.06
598.04Total
Truck Travel from Detroit using I-80 WB through Iowa
4
Pittsburgh Denver 15.01Pittsburgh Las Vegas 12.94Pittsburgh Portland 4.95Pittsburgh Sacramento 6.00Pittsburgh Salt Lake City 19.78Pittsburgh San Francisco 12.12
70.80
N h ill Mi li 30 65
Total
Truck Travel from Pittsburgh using I-80 WB through Iowa
Truck Travel from Nashville using I-80 WB through IowaNashville Minneapolis 30.65
30.65
Columbus Portland 21.04Columbus Sacramento 8.02Columbus Salt Lake City 15.99Columbus San Francisco 28.00
73.06
Memphis Minneapolis 99.86
Total
Truck Travel from Columbus using I-80 WB through IowaTotal
Truck Travel from Memphis using I-80 WB / I-35 NB through IowaMemphis Minneapolis 99.86
99.86
Denver Minneapolis 88.3688.36
Denver Boston 19.20Denver Buffalo 11.44Denver Chicago 74.05Denver Cleveland 5.19
Total
Total
Truck Travel from Denver using I-80 EB / I-35 NB through Iowa
Truck Travel from Denver using I-80 EB through Iowa
Denver Detroit 76.36Denver Hartford 10.00Denver Milwaukee 6.40Denver New York City 97.71Denver Rochester 5.45
305.80
Cincinnati Portland 15.13Cincinnati Sacramento 5.94Cincinnati Salt Lake City 47 07
TotalTruck Travel from Cincinnati using I-80 WB through Iowa
Cincinnati Salt Lake City 47.07Cincinnati San Francisco 28.01
96.15
Cleveland Denver 31.00Cleveland Las Vegas 51.64Cleveland Los Angeles 221.18Cleveland Portland 16.58Cleveland Sacramento 8.00Cleveland Salt Lake City 28.41
TotalTruck Travel from Cleveland using I-80 WB through Iowa
yCleveland San Diego 19.15Cleveland San Francisco 58.08
434.04Total
Source: FHWA FAF3, Year 20071 Truck freight reported in kilotons (ktons)

30
Iowa Statewide Rest Area Management Plan
1 Source: Iowa DOT. 2010. 2010 Truck Traffic Map and 2010 Vehicular Traffic Map. Iowa Department of Transportation State Maps.
Fatigue-Related Safety AnalysisA review of fatigue-related crashes along the Iowa interstate rest area corridors was conducted using the Iowa DOT’s GIS crash analysis software, SAVER (Safety, Analysis, Visualization and Exploration Resource). These interstate corridors included I-29, I-35, I-80, I-380 and I-680. Crashes along the interstate corridors for the 3-year period of 2008-2010 were chosen for analysis. The following presents a summary of the crash analysis. The complete fatigue-related safety analysis can be found on the digital appendix.
A total of 375 fatigue-related crashes occurred on Iowa interstates as part of the safety review. Of these, 50 were caused by truck drivers that were fatigued (approximately 13% of the total fatigue-related crashes). Fatigue-related crashes caused by truck drivers were primarily located on I-29, I-80 and I-35 (fatigue-related crashes caused by truck drivers ranged between 13% and 16% of the total fatigue-related crashes on these interstates in Iowa). For comparison, truck traffic was approximately 25% - 35% of the total daily traffic on these roadways in year 2010 1.
Each corridor was independently reviewed to determine fatigue-related crash statistics between rest areas. Highlights of the corridor analysis include:
■ A total of 53 fatigue-related crashes occurred on I-29 during the 3-year analysis period of 2008-2010. The highest fatigue-related crash density (crashes/mile) occurred on the northern segment of I-29 in the Sioux City metropolitan area.
■ A total of 96 fatigue-related crashes occurred on I-35 during the 3-year analysis period of 2008-2010. Over one-third of these crashes occurred on the 61-mile segment between the Osceola and Ankeny rest areas, which includes the I-35/80 overlap section in the Des Moines metropolitan area.
■ A total of 186 fatigue-related crashes occurred on I-80 during the 3-year analysis period of 2008-2010. Three of these crashes were fatal (three separate segments with a fatal crash). The segment with the highest percentage of fatigue-related crashes and fatigue-related crash density was between the Grinnell and Victor full service rest areas.
■ A total of 36 fatigue-related crashes occurred on I-380 during the 3-year analysis period of 2008-2010. One of the crashes on the segment between the Cedar Rapids rest area and the I-380 north terminus was fatal.
■ A total of 4 fatigue-related crashes occurred on I-680 during the 3-year analysis period of 2008-2010.
The interstate corridors of I-29, I-35 and I-80 were further reviewed to determine if a shorter distance between rest areas shows a lower occurrence of crashes related to fatigue. However, based on the data used in this SAVER crash analysis within Iowa, no correlation was determined between rest area spacing and the frequency of fatigue-related crashes. This data is shown, by corridor, in Figure 3-5. The results shown in this figure indicate that the rest areas with the longest spacing do not necessarily have the highest crash densities, when compared with the spacing of other rest areas on these corridors.

31
Iowa Statewide Rest Area Management Plan
Figure 3-5. Rest Area Spacing and the Density of Fatigue-Related CrashesFigure 3-4. Rest Area Spacing and the Density of Fatigue-Related Crashes
0.00
0.50
1.00
1.50
2.00
2.50
3.00
3.50
0 10 20 30 40 50 60 70
Fat
igue
-Rel
ated
Cra
sh R
ate
(Cra
shes
/ 100
MV
M)
Distance Between Rest Areas (Mi)
I-29
I-35
I-80
Volume-Weighted Average Iowa Interstate Fatigue-Related Crash Rate
Source: HDR, based on 2008-2010 crash data provided by the Iowa DOT Office of Traffic and Safety, April 2011

32
Iowa Statewide Rest Area Management Plan
CHAPTER 4 – USER SURVEYThe Iowa DOT administered a rest area user survey across the state of Iowa from June 28, 2012 until July 23, 2012. The survey was designed to provide a qualitative assessment of user opinions regarding services and amenities at rest area locations. The results of the survey were compiled for use in identifying user needs and areas for improvement.
The 19-question survey was administered in-person at rest areas, online through direct email, QR code advertising, social media and by mail-in surveys available at rest area locations. 759 individual surveys were completed through these various mechanisms. The full summary of the user survey results can be found on the digital appendix. The following provides major findings of the user survey:
■ 45% of participant’s primary reason for stopping is to use the restrooms. Another 21% stopped to stretch and walk. Other primary purposes for stopping at a rest area were to get travel information, rest/sleep and use a vending machine. A breakdown of the primary reasons for stopping is shown in Figure 4-1.
Figure 4-1. User’s Primary Reason for Stopping at a Rest Area
Chapter 4 – User Survey
The Iowa DOT administered a rest area user survey across the state of Iowa from June 28, 2012 until July 23, 2012. The survey was designed to provide a qualitative assessment of user opinions regarding services and amenities at rest area locations. The results of the survey were compiled for use in identifying user needs and areas for improvement.
The 19-question survey was administered in-person at rest areas, online through direct email, QR code advertising, social media and by mail-in surveys available at rest area locations. 759 individual surveys were completed through these various mechanisms. The full summary of the user survey results can be found on the digital appendix. The following provides major findings of the user survey:
45% of participant’s primary reason for stopping is to use the restrooms. Another 21% stopped to stretch and walk. Other primary purposes for stopping at a rest area were to get travel information, rest/sleep and use a vending machine. A breakdown of the primary reasons for stopping is shown in Figure 4-1.
Figure 4-1. User’s Primary Reason for Stopping at a Rest Area
Allow children to play2%
Change driver
3%
Check/repair vehicle
1%
Get travel information
5%
Rest/sleep5%
Stretch/walk21%
Use picnic area2%
Use pay telephone0%Use cell phone
2%
Use restroom45%
Use vending machine
5%
Use WiFi/internet3%
Attend to pets3%
Bus stop0% Other
3%
Source: HDR user survey, July 2012

33
Iowa Statewide Rest Area Management Plan
■ 83% of respondents indicated they were very satisfied or satisfied with the rest area facility they visited. Overall user satisfaction at rest areas they visited is shown in Figure 4-2.
Figure 4-2. User’s Overall Satisfaction with the Rest Area they Visited
83% of respondents indicated they were very satisfied or satisfied with the rest area facility they visited. Overall user satisfaction at rest areas they visited is shown in Figure4-2.
Figure 4-2. User’s Overall Satisfaction with the Rest Area they Visited
Very Satisfied
45%
Satisfied38%
Somewhat Satisfied
11%
Unsatisfied2% Very
Unsatisfied4%
■ 70% of respondents said that safety and security at the rest area they visited was excellent or very good. User perception of safety and security at rest areas is shown in Figure 4-3.
Figure 4-3. User-Rated Safety and Security of the Rest Area they Visited
70% of respondents said that safety and security at the rest area they visited was excellent or very good. User perception of safety and security at rest areas is shown in Figure 4-3.
Figure 4-3. User-Rated Safety and Security of the Rest Area they Visited
Excellent36%
Very Good34%
Good22%
Fair6%
Poor2%
Source: HDR user survey, July 2012
Source: HDR user survey, July 2012

34
Iowa Statewide Rest Area Management Plan
■ 50% of survey respondents indicated that a rest area should be located 30 minutes to 1 hour from other services or rest areas. 25% of respondents reported that rest areas should be located 1 to 2 hours from other services or rest areas. User preference on the proximity of rest areas to other services such as gas stations or other rest areas is shown in Figure 4-4.
Figure 4-4. User Preference on Proximity of Rest Areas to Other Services such as Gas Stations or Other Rest Areas
50% of survey respondents indicated that a rest area should be located 30 minutes to 1 hour from other services or rest areas. 25% of respondents reported that rest areas should be located 1 to 2 hours from other services or rest areas. User preference on the proximity of rest areas to other services such as gas stations or other rest areas is shown in Figure 4-4.
Figure 4-4. User Preference on Proximity of Rest Areas to Other Services such as Gas Stations or Other Rest Areas
Less than .5 hr15%
.5-1 hr50%
1-2 hr25%
2-4 hr6%
Other4%
65% of survey respondents indicated that the rest area they visited should be left as is. A breakdown of users’ perception on the condition of the rest area they visited is shown in Figure 4-5.
Figure 4-5. User Perception of the Condition of the Rest Area they Visited
Closed0%
Improved19%
Left as-is65%
Repaired3%
Other13%
■ 65% of survey respondents indicated that the rest area they visited should be left as is. A breakdown of users’ perception on the condition of the rest area they visited is shown in Figure 4-5.
Figure 4-5. User Perception of the Condition of the Rest Area they Visited
Source: HDR user survey, July 2012
Source: HDR user survey, July 2012

35
Iowa Statewide Rest Area Management Plan
CHAPTER 5 – NEEDSIowa interstate rest area needs were identified to determine potential for improvements. These needs address aging infrastructure, truck parking, rest area spacing, user preferences and Iowa State Patrol and Motor Vehicle Enforcement needs. Needs were identified through collection of data at the existing rest areas, correspondence with Iowa DOT staff, rest area user surveys and correspondence with Iowa State Patrol and Motor Vehicle Enforcement. Additionally, a review of ASLs along the interstate corridors where travelers can find similar rest area services was performed to identify areas where specific services are not available. The following sections describe rest area needs along Iowa interstates.
Aging Rest Area InfrastructureThe anticipated service life for a rest area building is 20 years. This is based on projected future traffic at the rest area and wear of facility equipment (stools, sinks, hand rails, etc.). As mentioned in Chapter 2, facility equipment is often upgraded as needed at rest areas to extend the service life of buildings until a new building can be constructed. There are 39 full service rest area buildings in Iowa. Of these 39 buildings, 21 were built between 1966 and 1975 (ranging between 37 and 46 years old). Improvements are scheduled to replace 5 of the 21 outdated buildings, leaving 16 rest area buildings that will continue to exceed their anticipated service life. The 5 buildings scheduled for replacement are:
■ Pacific Junction NB.
■ Underwood WB.
■ Mitchellville EB.
■ Grinnell WB.
■ Victor EB.
Two of the rest area buildings over 20 years old that are not scheduled for replacement are at the rest areas on I-80 near Waukee that will be closed as a result of the new I-80 interchange with Alice’s Road. The aging rest area infrastructure is summarized on Figure 5-1.

36
Iowa Statewide Rest Area Management Plan
!(
!(
!(!(!(
!(
!(!(!( !(
!( !(
!(!( !(!(
!(!( !(
!(
!( !(!( !(!( !(!( !(
!(!(!( !(
!(!(
!(!( !(!( !( !(!(!(!(
!(!(
!(
!( !( !(!(
!(!(!( !( !(
!(!(
!(!(
!(
!(!(!(
!(!(
!( !(
!(
!(
!!55
!
!
!
!
!
!
5
5
5
5
5
5
!!!
!!
!
!
!
!
!
555
5
5
5
5
5
5
5
!
!
!!
!
!
!
!!
!!
!
!
!!
!
!!
!!
!
5
5
55
5
5
5
55
55
5
5
55
5
55
55
5
Nebraska §̈¦29
§̈¦80
§̈¦35
§̈¦80
§̈¦35
§̈¦380
§̈¦29
§̈¦90
§̈¦88
§̈¦74
Illinois
Minnesota
Missouri
Nebraska
SouthDakota
Wisconsin
LYON OSCEOLA DICKINSON EMMET
ALLAMAKEE
KOSSUTH
WINNESHIEK
HOWARDWINNEBAGO
MITCHELLWORTH
SIOUX OBRIEN CLAY PALOALTO HANCOCK
CERROGORDO CHICKASAWFLOYD
CLAYTONFAYETTE
PLYMOUTH CHEROKEE BUENAVISTA
POCAHONTASHUMBOLDT
WRIGHT
BREMER
FRANKLIN BUTLER
DUBUQUEDELAWAREWEBSTER
BUCHANANBLACKHAWK
WOODBURY IDA SAC CALHOUN
HAMILTON
HARDINGRUNDY
JACKSON
JONESLINNBENTONTAMAMONONA
CRAWFORD CARROLL GREENEBOONE
STORY MARSHALL
CLINTON
CEDARHARRISON
SHELBY
AUDUBONGUTHRIE
JOHNSONDALLAS IOWA
POLK
POWESHIEKJASPER SCOTT
MUSCATINE
POTTAWATTAMIE CASSWASHINGTON
ADAIR KEOKUKWARRENMADISONMAHASKA
MARION
LOUISA
MILLS MONTGOMERY ADAMS
HENRY
JEFFERSON
UNIONWAPELLO
CLARKELUCAS MONROE
DESMOINES
FREMONT PAGE TAYLOR RINGGOLDVAN
BURENDAVISDECATUR WAYNE APPANOOSELEE £¤67
£¤6
£¤81
£¤20
£¤169
£¤30
£¤18
£¤151
£¤34
£¤218
£¤34
£¤151
£¤149
£¤14£¤18
£¤30
£¤136 £¤218
£¤77
£¤18
£¤9
£¤65
£¤2
£¤20
£¤69
£¤75
£¤65£¤75
£¤30
£¤75
£¤136
£¤14
£¤52
£¤36
£¤59
£¤218
£¤51
£¤12
£¤169£¤275
£¤63
£¤275
£¤77
£¤65£¤63
£¤67
£¤34
£¤73
£¤34
£¤81
£¤136
£¤20
£¤20
£¤63
£¤218
£¤52
£¤34
£¤61
£¤24
£¤59
£¤275
£¤150
£¤59
£¤6
£¤281
£¤30
£¤71
£¤69
£¤18
£¤71
£¤6
£¤61
£¤52
£¤81
£¤281
£¤136
£¤30
£¤69
£¤6
£¤169 £¤6
£¤20
£¤18
Keokuk
FortMadison
Centerville
ClarindaShenandoah
Burlington
MountPleasantFairfield
Red Oak OttumwaGlenwood Creston
CouncilBluffs Oskaloosa
WashingtonKnoxvilleIndianola
Atlantic Pella MuscatineDavenport Bettendorf
DesMoines
Urbandale AltoonaHarlanIowaCity
CoralvilleNewtonAnkeny
PerryClinton
CedarRapids
Denison NevadaAmesMarshalltown
MarionHiawathaBoone
CarrollMaquoketa
AnamosaVinton
WebsterCity Independence Manchester
SiouxCity
Waterloo
DubuqueFortDodge
IowaFalls
CedarFalls
StormLake
OelweinWaverly
CherokeeLe Mars
OrangeCity
CharlesCityAlgona
SiouxCenter
ClearLakeSpencer
MasonCity
Decorah
Estherville
DavenportWilton
CedarRapidsTiffinVictorGrinnell
Northwood
Mitchellville
Dows
StoryCity
Ankeny
Osceola
Waukee
Lamoni
AdairUnderwood
Loveland
Pacific Junction
MissouriValley
Onawa
SergeantBluff
Legend!( City
Interstate
U.S. Highway
State Boundary
County Boundary
!5 Rest Area Building Exceeded Design Life
!5 Rest Area Building in Second Half of Design Life
!5 Rest Area Building in First Half of Design Life
!5 New Rest Area Building Under Construction
0 3015Miles
I
Figure 5-1. Aging Rest Area Infrastructure
Source: Iowa DOT, July 2012

37
Iowa Statewide Rest Area Management Plan
Truck Parking NeedsCar and truck parking were monitored at each full service rest area over a 24-hour period. While the capacity for car parking was more than adequate for the observed demand, it was found that truck parking demand exceeded the capacity at most of the full service rest areas. The data collected for truck parking utilization found the following:
■ The total truck parking capacity (designated truck parking spaces) at all of the full service rest areas is approximately 660 spaces.
■ The peak truck parking utilization exceeded 100% at 29 out of the 39 rest areas. This equated to over 200 trucks parked in areas that are not designated for truck parking.
■ The peak truck parking utilization exceeded 200% at 7 rest areas.
■ The average hourly truck parking utilization exceeded 100% at 5 rest areas.
The majority of the excess truck parking demand was observed at rest areas on I-80 (during the peak time, approximately 120 trucks over the truck parking capacity were parked at I-80 full service rest areas). However, it was found that the demand exceeds capacity at full service rest areas throughout the state, on each interstate corridor.
Truck parking demand was also captured for a single “snapshot” during the overnight hours (12:00 AM to 6:00 AM) at parking only rest areas, weigh stations and approximately half of the ASLs with truck parking (most large truck stops) along Iowa interstate corridors. The data collected for truck parking utilization at parking only rest areas, weigh stations and truck stops found the following:
■ There are 15 parking only rest areas on Iowa interstate corridors, equating to approximately 130 truck parking spaces. Eight of the 15 parking only rest areas were observed to be at or over capacity (≥ 100% utilized) during the single “snapshot”. This resulted in the demand exceeding the statewide capacity of these parking only rest areas by 27 trucks.
■ There are 10 weigh stations on the Iowa interstate corridors, equating to approximately 75 truck parking spaces. All of the weigh stations had truck parking below 100% utilized and 4 of the weigh stations had no trucks parked during the single “snapshot”.
■ There are approximately 60 ASLs that allow truck parking along Iowa interstate corridors that provide approximately 4,500 truck parking spaces. Approximately half of these ASLs were observed during the “snapshot” data collection, accounting for approximately 4,000 truck parking spaces (nearly 90% of truck parking provided at ASLs). Truck parking at all observed ASLs was under 100% utilized, ranging between 75% and 95% utilized. This equated to approximately 600 additional truck parking spaces available at the observed ASLs throughout the state during the single “snapshot”.
Truck parking utilization at the full service rest areas (observed for a 24-hour period) and the parking only rest areas, weigh stations and most large truck stops (observed during the “snapshot” data collection) is shown in Figure 5-2. As shown in Figure 5-2, truck parking locations that are at or over capacity during the overnight hours are spread out throughout the state. Figure 5-2 also shows that there are few locations that are less than 75% utilized and are also spread throughout the state.
Additionally, the review of projected traffic volume growth from year 2010 to year 2035 found that truck traffic is expected to increase approximately 30% along I-29, I-35 between Des Moines and Mason City, and along I-380. The existing truck parking utilization shown in Figure 5-2 reveals potential for existing excess truck parking along parts of these areas; however, additional capacity will be needed to accommodate the projected growth of truck traffic along the interstate corridors.

38
Iowa Statewide Rest Area Management Plan
!(
!(
!(!(!(
!(
!(!(!( !(
!( !(
!(!( !(!(
!(!( !(
!(
!( !(!( !(!( !(!( !(
!(!(!( !(
!(!(
!(!( !(!( !( !(!(!(!(
!(!(
!(
!( !( !(!(
!(!(!( !( !(
!(!(
!(!(
!(
!(!(!(
!(!(
!( !(
!(
!(
!
!
!!
!
!!
!
!
!
!
!
!!
!
!!
!!
!
!
!
!
!
!!
!
!!
!
!!!
!
!
!
!
!
!
!5!5
!5!5
!5!5
!5
!5
!5
!5!5
!5!5
!5
!5
!5
!5
!5!5
!5
!5!5
!5
!5
!5
!5
!5
!5!5
!5
!5!5
!5!5
!5
!5
!5
!5
!5
!5!5
!5
!5!5
!5
!5!5!5
!5
!5
!5
!5
!5
!5
!¾
!¾
!¾
!¾
!¾
!¾ !¾
!¾
!¾!¾
!¾
!¾
!¾
!¾
!¾
!¾ !¾
!¾
!¾!¾
"""
"""
""
"
"""""
""""
"
"
"
"
""
""
"
"
"
"""
"""
""
""""""""
"
"
"
"
""
""
"
"
"
"
"
Nebraska
SouthDakota
Minnesota
Wisconsin
Illinois
Missouri
§̈¦29
§̈¦80
§̈¦35
§̈¦80
§̈¦35
§̈¦380
§̈¦29
§̈¦90
§̈¦88
§̈¦74
! 5
!
5
!
8
!
13
!
40
!
75
!
250
!
95!
70
!110
!
105
!
200
!
100
!
200
!
850
!
40
!
160
!
75
!
200
!
155
!
100
!
230
!
250
!
120
!
30
!
35
!
100
!
115
!
80
!
30
!
35
!
80
!
150
!
7
!
3
!
8
!
8
!
11
!
5
! 20
!
14
!
15
!
16
!
16
!
15
!
23
!
23
!
19
!
22
!
10
!
25
!
34
!
22
!
24
!
50
!
16
!
15
!
5
!
5
!11 ! 11
!
22
!22
!
16
!
12
!
12
!
15
!
16
!
10
!
15
!
15
!
15
!
13
!13
!16
!15
!
14
!15
!
6!6
!
5
!
5!
8
!
3
!
8
!
25
!
25
!
5
!
6
!
6
!
8
!
8
!
8
LYON OSCEOLADICKINSON
EMMET
ALLAMAKEE
KOSSUTH
WINNESHIEK
HOWARDWINNEBAGO
MITCHELLWORTH
SIOUX OBRIEN CLAYPALOALTO
HANCOCKCERROGORDO
CHICKASAW
FLOYD
CLAYTONFAYETTE
PLYMOUTHCHEROKEE BUENA
VISTAPOCAHONTAS
HUMBOLDTWRIGHT
BREMER
FRANKLIN BUTLER
DUBUQUEDELAWAREWEBSTER
BUCHANAN
BLACKHAWK
WOODBURY IDA SAC CALHOUN HAMILTON HARDINGRUNDY
JACKSONJONESLINN
BENTONTAMA
MONONA
CRAWFORDCARROLL
GREENE
BOONE STORY
MARSHALL
CLINTON
CEDARHARRISON
SHELBY AUDUBONGUTHRIE
JOHNSONDALLAS
IOWAPOLK
POWESHIEKJASPER
SCOTT
POTTAWATTAMIE
CASSWASHINGTONADAIR
KEOKUKWARREN
MADISONMAHASKA
MARION
LOUISA
MILLS
MONTGOMERY
ADAMSHENRYJEFFERSON
UNION
WAPELLO
CLARKELUCAS MONROE
DESMOINES
FREMONT PAGE TAYLOR RINGGOLDVAN
BURENDAVISDECATUR WAYNE APPANOOSE
LEE £¤67
£¤81
£¤169
£¤9
£¤30
£¤18
£¤151
£¤61
£¤34
£¤218
£¤151
£¤149
£¤14
£¤136
£¤20
£¤77
£¤18
£¤6
£¤65
£¤2
£¤20
£¤69
£¤75
£¤65£¤75
£¤30
£¤75
£¤136
£¤52
£¤14
£¤34
£¤30
£¤36
£¤59
£¤218
£¤51
£¤18
£¤20
£¤12
£¤169£¤275
£¤63
£¤65 £¤63
£¤77
£¤67
£¤73
£¤34
£¤81
£¤136
£¤20
£¤63
£¤218
£¤52
£¤34
£¤61
£¤24
£¤59
£¤275
£¤150
£¤6
£¤59
£¤281
£¤30
£¤34
£¤71
£¤69
£¤18
£¤71
£¤6
£¤52
£¤61
£¤81
£¤281
£¤136
£¤69£¤30
£¤6
£¤20
£¤169
£¤6
£¤20
£¤18
Keokuk
FortMadison
CentervilleClarindaShenandoah
Burlington
MountPleasant
Fairfield
Red Oak OttumwaGlenwood Creston
CouncilBluffs
Oskaloosa
Washington
Knoxville
Indianola
Atlantic PellaMuscatine
Davenport BettendorfDesMoines
Harlan
IowaCity
CoralvilleNewtonAnkeny
Grinnell
PerryClinton
CedarRapids
Denison
NevadaAmes
Marshalltown MarionHiawathaBoone
MaquoketaAnamosa
Vinton
WebsterCity
Independence Manchester
SiouxCity
WaterlooDubuque
FortDodge Iowa
Falls
CedarFalls
StormLake
OelweinWaverly
Cherokee
Le Mars
OrangeCity
CharlesCityAlgona
SiouxCenter
ClearLake
Spencer
MasonCity
Decorah
Estherville 0 3015Miles
I
Legend!( City
Interstate
U.S. Highway
State Boundary
County Boundary
!5 Full Service Rest Area
!5 Parking Only Rest Area
!¾ Weigh Station
" Alternative Service Location
Truck Parking Peak Percent Utilization
! 0-74%
! 75-99%
! 100-149%
! 150-199%
! ≥ 200%
Truck Parking Spaces
#
#
#
#
Full Service Rest Area
Parking Only Rest Area
Weigh Station
Alternative Service Location
Figure 5-2. Truck Parking Utilization
Source: HDR, September 2012

39
Iowa Statewide Rest Area Management Plan
Rest Area SpacingAASHTO recommends that rest areas are spaced 60 miles or about one hour apart. The following rest areas have more than 60 miles between them.
■ Osceola (I-35) – Ankeny (I-35) – 66 miles.
■ Osceola (I-35) – Mitchellville (I-80) – 64 miles.
■ Underwood (I-80) – Adair (I-80) – 62 miles.
■ Loveland (I-680) – Adair (I-80) – 66 miles.
Although these rest areas exceed the 60 mile spacing recommendation, they all meet the AASHTO criteria of “about one hour apart”.
AASHTO also suggests that rest areas spaced less than 30 miles apart be evaluated for their use and location. The following rest areas have less than 30 miles between them.
■ Onawa (I-29) and Sergeant Bluff (I-29) – 29 miles.
� The other rest areas adjacent to Onawa on I-29 are at Missouri Valley, 31 miles south.
� The other rest areas adjacent to Sergeant Bluff on I-29 are at Vermillion, SD, 38 miles north.
■ Ankeny (I-35) and Story City (I-35) – 21 miles.
� The other rest areas adjacent to Ankeny on I-35 are at Osceola, 66 miles south.
� The other rest area adjacent to Story City on I-35 is at Dows, 39 miles north.
Iowa State Patrol NeedsThe Iowa State Patrol would like office space available at full service rest areas. This would primarily be at locations where the rest area buildings are part of new construction or are being updated. One location that Iowa State Patrol identified as a beneficial location for office space was the rest area sites near Adair, as this is a central location between offices in Council Bluffs and Des Moines. For directional rest area sites, where a rest area is provided in each direction of travel, office space would only be needed at one of the two sites. The office space would serve as a location for officers to conduct administration work without having to travel to troop headquarters, local police stations or local DOT offices. Officers would use this space for approximately one to two hours at a time. This space would be able to be shared with the office space provided for DOT maintenance staff. Office needs include:
■ Desk/work station.
■ Internet (Ethernet/land line connection) - Rest area buildings currently have a land line internet connection but would need to be upgraded to a higher bandwidth to accommodate State Patrol needs.
■ Telephone.
■ Copy Machine.
■ First aid/fire extinguisher.
Iowa State Patrol would not have any special parking or storage needs at the rest area sites. State Patrol sees officers using an office at rest areas as an added benefit that shows officer presence at rest areas.
40
Iowa Statewide Rest Area Management Plan
Iowa Motor Vehicle Enforcement NeedsIowa Motor Vehicle Enforcement currently has 10 weigh stations on the Iowa interstate system (there are 12 total statewide, including 2 on non-interstate facilities). At the existing weigh stations, Motor Vehicle Enforcement would like to make improvements, where available, to include inspection buildings that would provide added safety to officers inspecting trucks. The existing weigh station sites in Dallas and Jasper counties would be able to accommodate the addition of inspection buildings.
Motor Vehicle Enforcement would like to supplement the existing weigh station locations with weighing and inspection capabilities at interstate rest areas. This would primarily be at locations where the rest area buildings are part of new construction or are being updated and where right-of-way is available to accommodate space for inspections. The inspection area would need to be segregated from general public areas. The weigh station building needs could be incorporated into the rest area building at these locations. This would include a small office with needs similar to those listed for the Iowa State Patrol. This space would be used to detain truck drivers as needed. Motor Vehicle Enforcement would be able to share office space with Iowa State Patrol but would like the space to be separate from the office space provided for DOT maintenance staff. Addition of weighing and inspection capabilities at rest areas would require new technology to be installed on the interstate mainline. This would include weigh-in-motion technology, license plate readers and DOT number readers. Locations in the state that would be beneficial for Motor Vehicle Enforcement to conduct inspections at rest areas include:
■ I-35 southbound south of Des Moines.
■ I-35 northbound north of US 20.
■ I-80 between Iowa City and Davenport.
■ I-380 between Iowa City and Cedar Rapids.
Areas Lacking ServicesA review of ASLs along interstate corridors where travelers can find services similar to rest areas was performed to identify areas where specific services are not available. This review also included existing full service rest areas. The primary service used at rest areas, as identified in the user survey, was restrooms. The spacing between locations (ASLs and full service rest areas) that provide rest area services 24 hours per day was determined. These locations are also likely to provide other services similar to those provided at rest areas such as food purchase, telephones and traveler information. The preference of users is to have services available within 30 miles from one another; therefore, those interstate segments with 30 mile or greater spacing between locations offering 24-hour services were documented. There are eight 30-mile segments on interstate corridors throughout the state where 24-hour restrooms are not available. These areas are:
■ I-29 between mile post 79 (Missouri Valley rest areas) and mile post 110 (Onawa rest areas) (31 miles apart).
■ I-35 between mile post 43 (ASL with 24-hour restrooms) and mile post 125 (on the I-80/35 overlap) (ASL with 24-hour restrooms) (30 miles apart).
■ I-35 between mile post 159 (Dows rest area and ASL with 24-hour restrooms) and mile post 193 (ASL with 24-hour restrooms) (34 miles apart).
■ I-80 between mile post 46 (ASL with 24-hour restrooms) and mile post 80 (Adair rest areas) (34 miles apart).
■ I-80 between mile post 80 (Adair rest areas) and mile post 110 (ASL with 24-hour restrooms) (30 miles apart).
■ I-80 between mile post 201 (ASL with 24-hour restrooms) and mile post 237 (Tiffin rest areas) (36 miles apart).
41
Iowa Statewide Rest Area Management Plan
■ I-380 between mile post 35 (ASL with 24-hour restrooms) and mile post 68 (ASL with 24-hour restrooms) (33 miles apart).
■ Between mile post 43 on I-35 (ASL with 24-hour restrooms) and mile post 121 on I-80 (ASL with 24-hour restrooms) (30 miles apart).
Traveler Information DisseminationTraveler information dissemination is a way to provide travelers information about the availability of services along the interstate corridors and means to guide travelers to these services. Currently, travelers on Iowa interstates are only given information regarding rest area locations and some of the services available at service interchanges. The availability of services and a comprehensive list of all services available at a service interchange are not provided.
Traveler information dissemination would be useful in guiding travelers to available 24-hour services. A specific example would be guiding truck drivers to available parking. To make travelers aware of available services, signage or some form of media along the interstate would be beneficial.

42
Iowa Statewide Rest Area Management Plan
CHAPTER 6 – STRATEGIESStrategies were identified to improve rest area services for travelers based on the needs identified in the earlier study stages. The strategies listed in this chapter provide general guidance to assist the Iowa DOT in managing their rest area system. These strategies include guidelines for developing rest areas, a review of public/private partnerships (P3s), evaluating parking expansion opportunities at Iowa rest areas and weigh stations, and ways to provide additional traveler information. Many of the strategies identified in this chapter would benefit from additional documentation to standardize practices for developing new rest areas or policies affecting rest area services. The following sections describe potential rest area service strategies for Iowa.
Rest Area GuidelinesGuidelines for developing rest areas were created to provide a list of principal items that should be addressed whenever a rest area is built or modified. These guidelines should be followed after review with Iowa DOT management identifies rest area needs that are consistent with the findings of this Iowa Statewide Rest Area Management Plan. The principal items of the rest area guidelines include:
■ Perform a rest area location study.
■ Evaluate directional versus single-point rest area.
■ Review Iowa DOT design standards and templates for use in designing the rest area.
■ Address needs of Iowa State Patrol and Motor Vehicle Enforcement.
■ Review potential for green technologies.
The following sections present each of the principal rest area guidelines when developing full service rest areas.
Rest Area Location StudyDevelopment of a new rest area site should include a review of the following 1.
■ Site quality – Select a site that will assist in the design development based on features that would attract user interest and could be used to enhance the design.
■ Utilities available – Make sure that the site has access to potable water and that wastewater disposal can be provided, preferably to a municipal wastewater treatment facility.
■ Site spacing – Ensure that the site is located within 60 miles of other rest area facilities or large cities where several service locations are available. Site spacing should also strive to provide balance between other available service locations.
■ Corridor geometry – The site should have adequate sight distance on the mainline and ramps to/from the rest area site to account for merging and diverging traffic.
■ Potential environmental impacts – Identify resources protected by law, such as endangered species, wetlands, historic properties, significant archaeological complexes, publicly owned parks, recreation areas, and wildlife or waterfowl refuges.
■ Right-of-way opportunities – Identify right-of-way locations where owners would be willing to sell if needed to speed acquisition of land. Adequate right-of-way should be acquired to allow for future expansion.
1 Source: AASHTO. 2001. Guide for Development of Rest Areas on Major Arterials and Freeways. American Association of State Highways and Transportation Officials: Washington, D.C.

43
Iowa Statewide Rest Area Management Plan
A selection process should be established prior to review of site locations. A sample format would include:
■ Identify potential sites based aerial photography.
■ Perform a field review to reduce the number of potential sites.
■ Complete environmental documentation through the National Environmental Policy Act (NEPA) process to identify the preferred site.
Directional versus Single-Point Rest AreaRest area sites can be constructed as a directional site that provides a rest area site for one direction of travel or a single-point site that provides a rest area site for use by both directions of travel. Typically, directional sites are constructed in pairs so that rest area services are available for both directions of travel near the same location. Single-point rest area sites are typically constructed at a service interchange where both directions of travel access the same rest area site.
Directional sites allow for easy access to the interstate. Directional sites can be located at any location along the interstate as long as they do not impact operations at an interchange and the appropriate selection criteria is satisfied. Single-point sites generally yield lower construction and maintenance costs since they require construction of only a single site and typically utilize access that is already provided to the interstate via an adjacent interchange. There are benefits to each of these rest area types, and each should be considered when developing a new rest area site to determine which option is best suited for a given location.
Design Standards and TemplatesIowa DOT has developed standard design templates for directional and single-point rest area sites. The directional rest area template is shown in Figure 6-1. The directional templates show accommodations for up to 64 car and 40 truck parking spaces. The single-point rest area templates are shown in Figure 6-2. The single-point templates show accommodations for up to 130 car and 80 truck parking spaces. The AASHTO 2001 Guide for Development of Rest Areas on Major Arterials and Freeways presents guidance for determining the number of spaces needed for cars and trucks based on a variety of factors. This guidance in addition to data collected at existing rest area sites should be used to determine if the number of spaces at a new site should deviate from those in the design templates. Design standards used for developing the layout of a rest area site including entrance and exit ramps, internal circulation roads, parking and pedestrian accommodations are based on the Iowa DOT Design Manual, the AASHTO 2011 Green Book and the AASHTO 2001 Guide for Development of Rest Areas on Major Arterial and Freeways.
Iowa State Patrol and Motor Vehicle EnforcementDesign of a rest area site and facility should address the needs of Iowa State Patrol and Motor Vehicle Enforcement at rest areas. This includes office space for both State Patrol and Motor Vehicle Enforcement. This also includes space for Motor Vehicle Enforcement to inspect trucks in a location that is separated from car/truck parking areas.
Additional documentation of the needs for Iowa State Patrol and Motor Vehicle Enforcement can be found of Chapter 5 of this document. Though the needs listed in Chapter 5 are based on conversations with staff of State Patrol and Motor Vehicle Enforcement, these departments should be contacted when designing a new rest area site to determine their specific needs at each location.
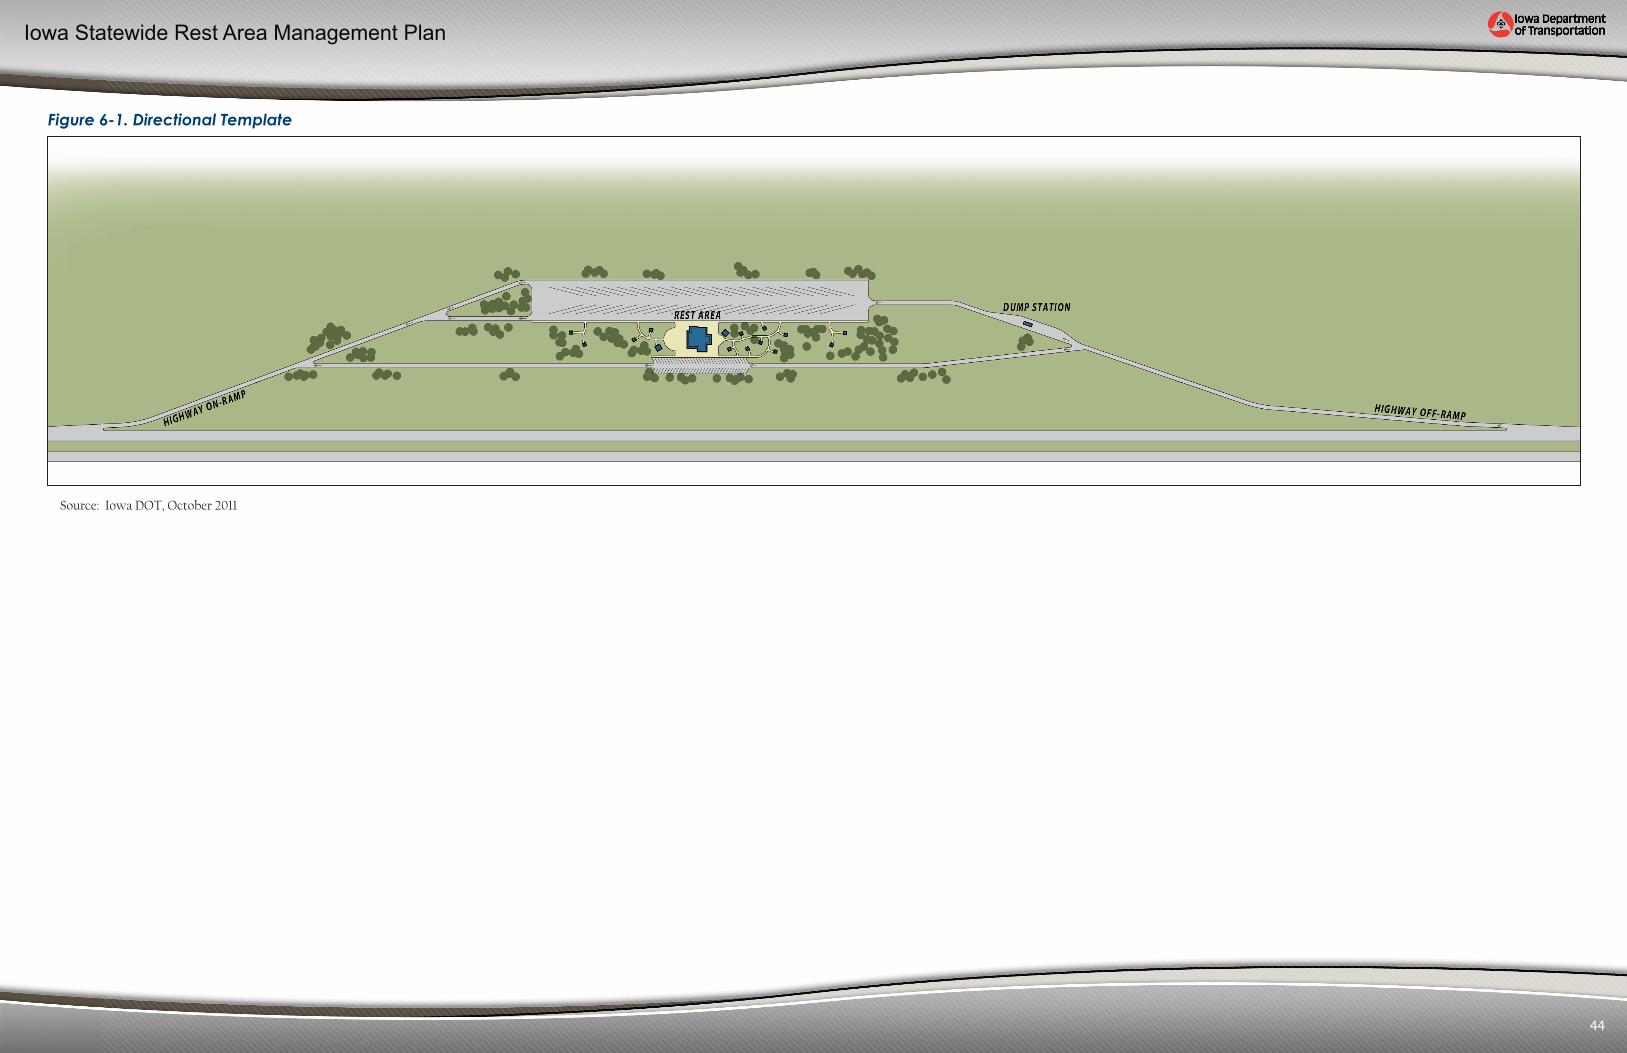
44
Iowa Statewide Rest Area Management Plan
Figure 6-1. Directional Template
Source: Iowa DOT, October 2011

45
Iowa Statewide Rest Area Management Plan
Figure 6-2. Single-Point Templates
600’ Minimum
600’
Min
imum
Source: Iowa DOT, January 2012

46
Iowa Statewide Rest Area Management Plan
Green Technologies and PracticesGreen technologies and practices are those items included in a design that reduce energy use and overall environmental impact. These include alternative energy sources to heat, cool and power the building and other site elements. Examples of alternative energy sources include solar, wind and thermal energy from biomass fuels. The design of a rest area building can also reduce energy consumption. Example design elements that are considered green practice include:
■ Designing the building to let as much natural light in during the day as possible to reduce the amount of energy needed to power artificial lights.
■ Using motion sensor lights to reduce energy costs when no one is present in areas of the building.
■ Using green building materials made with recycled content.
When designing new rest area sites green technologies and practices should be considered in an effort to reduce energy costs. The cost to implement green technologies should be reviewed to assess whether or not implementing certain technologies would be cost prohibitive.
Public/Private Partnerships (P3s)P3s involve a contractual agreement formed between public and private sector partners, which allow more private sector participation than is traditional. The agreements usually involve a government agency contracting with a private company to renovate, construct, operate, maintain and/or manage a facility or system. Some States are applying this principal to expand the level of rest area services available for travelers by supplementing rest area locations with private business locations that provide similar services. In this model, public agencies are benefitting from lower construction/maintenance costs as a result of additional services provided by private businesses.
The potential benefits of P3s have led many states to evaluate implementing them. However, several challenges exist to implementing P3s. Title 23, Section 111 of the United States Code (23 USC 111) prohibits commercial development at travel information centers or rest areas. 23 USC 111 also prohibits private commercial development located on the interstate system. State legislatures can, and have in some States, supplement federal law on the prohibition of commercialization at rest areas. For example, Iowa State Code 306C.21 states:
“After January 1, 1997, private persons, firms, or corporations entering into an agreement with the department under this section shall not develop, establish, or own any commercial business located on land adjacent to the rest area which is subject to the agreement. An interstate rest area shall be located entirely on the interstate right-of-way, including, but not limited to, all entrance and exit ramps, all rest area buildings including information centers, and all parking facilities. Department money and resources shall not be used for any other type of interstate rest area. Whenever an interstate rest area is reconstructed, the area available for parking shall be equal to or more than the area available for parking prior to the reconstruction.”
Additionally, businesses located at service interchanges along interstate corridors and the National Organization of Truck Stop Operators (NATSO) are strongly opposed to commercial development at rest areas because of the loss of business/revenues that they would likely incur at existing businesses along interstates.
Despite the challenges listed above there are a variety of P3s that could be implemented with the appropriate legislation. States that are incorporating P3s have first passed appropriate enabling legislation. Before beginning a program that involves P3s, States should review any impacts of the program to ensure that the program is in their best interest. The following sections give a brief overview of types of P3s that are being explored by some States as a means to reduce construction/maintenance costs of their rest areas.

47
Iowa Statewide Rest Area Management Plan
Interstate Oasis ProgramThe Interstate Oasis Program 1 allows States to partner with private operators who meet the minimum criteria to provide basic rest area services in exchange for online highway signing and official designation as an Interstate Oasis. This results in expanded free parking and restroom services to supplement the services available at existing rest areas without having to construct and maintain new rest area facilities.
Implementing an Interstate Oasis Program would require the appropriate signage at each interchange where businesses that meet the minimum criteria and partner with the State are located. If a State elects to provide or allow Interstate Oasis signing, there should be a statewide policy, program, procedures, and criteria for the designation and signing of a facility as an Interstate Oasis that complies with FHWA’s policy. The statewide policy may require signage of an interchange as an Interstate Oasis for any interchange where businesses meeting the minimum criteria are located within 3 miles of an interstate interchange. This could be considered an inconvenience to some travelers when locating services 3 miles from an interchange in an urban area. Additionally, before a business can become part of an Oasis Program, engineering studies must be completed that determine that the route to the businesses can safely and conveniently provide access to the business from the interstate and that the site layout of the business can safely and efficiently accommodate movements into and out of the site.
Rest Area SponsorshipRest area sponsorship represents another type of partnership with the private sector, where the private partner(s) would fund a particular service at a rest area in exchange for advertising rights within the rest area. This advertising would be limited to a single free-standing sign prior to the rest area exit (as stated by FHWA policy) and limited to locations within the rest area building (based on Title 23, Section 752.7 of the Code of Federal Regulations (23 CFR 752.7)). Among other requirements as stated in Title 23 of the Code of Federal Regulations, the advertising must be limited to matters relating to and of interest to the traveling public.
Public/Private Partnerships (P3s) near Single-Point Rest AreasSingle-point rest areas located at an interchange present an opportunity to supplement their services with the services provided at commercial businesses located adjacent or near the rest area. Opportunities to supplement services may include:
■ Shared access from the street to single-point rest areas and adjacent businesses.
■ Shared parking between single-point rest areas and adjacent businesses.
■ Additional service locations available to the traveling public.
■ Added security at rest areas as a result of adjacent commercial businesses.
■ Lower maintenance costs for the rest areas as a result of travelers using similar services at adjacent businesses.
■ Shared uses between single-point rest areas and adjacent businesses such as purchasing food from an adjacent business and using the picnic facilities of the rest area to eat.
1 The Interstate Oasis Program was developed as a means to enhance safety and convenience for interstate users by allowing States, in accordance with the policy developed for the Interstate Oasis Program by FHWA, to designate and provide signing to certain facilities off the freeway that will provide increased opportunities for stopping to rest, using restroom facilities and obtaining other basic services. FHWA defines an Interstate Oasis as a facility near an interstate but not within the interstate right-of-way, designated by a State after meeting the eligibility criteria of the policy developed by FHWA, that provides products and services to the public, 24-hour access to public restrooms, and parking for automobiles and heavy trucks.

48
Iowa Statewide Rest Area Management Plan
Parking Expansion OpportunitiesAs shown in Chapter 3 of this document several truck parking locations along the interstate system are at or over capacity throughout the state. Over two-thirds of the truck parking at full service and parking only rest areas are at or over capacity during peak times. Much of the available truck parking is at ASLs that are approaching capacity during the overnight hours (between 75% and 99%). Additionally, truck parking volumes are expected to increase approximately 30% by year 2035 along I-29, I-35 between Des Moines and Mason City, and along I-380. To increase truck parking capacity along the interstate rest area corridors, options for expanding existing parking locations and adding new parking locations were explored.
Parking at Rest AreasIn Iowa there are currently 39 full service rest areas and 15 parking only rest areas that combined provide approximately 790 truck parking spaces. Each of the full service and parking only rest areas should be reviewed for truck parking expansion opportunities, specifically those locations that are currently at or over capacity. This would include a review of right-of-way impacts/opportunities and costs to expand existing sites. Other development considerations listed in the Rest Area Location Study section should also be reviewed when considering expansion.
Another alternative for expanding rest area parking within the state would be to construct new parking only rest areas. New parking only rest areas would be most beneficial in parts of the state where parking capacity is exceeded and expansion of parking at existing rest areas is not available. If a review of existing rest areas that are currently at or over capacity finds that expansion is not an option, construction of new parking only rest areas should be explored.
Parking at Weigh StationsParking at weigh stations was also reviewed. Parking is available at weigh stations, but some challenges exist to using the available parking at these sites. Many truck drivers are hesitant to use parking at weigh stations due to potential of inspection that may otherwise be avoided. Currently there are no methods available for truck drivers to park at a weigh station without the potential for being inspected upon arrival or departure of the weigh station. Truck parking space is currently limited at weigh stations and many of the available spaces need to be maintained for inspection. Additional truck parking could be accomplished through signing/striping of spaces within the weigh station and a program that provides education to truck drivers on parking at weigh stations. To ensure use of available parking at weigh stations, parking availability signage at weigh stations would need to be incorporated as well as educating drivers of the availability of parking at weigh stations.
Other Parking Opportunities and ConsiderationsAnother opportunity to expand available truck parking options would be the use of park and ride lots during overnight hours. Coordination with the agencies controlling these lots would be necessary to determine the availability of parking at these locations, and to ensure that trucks leave the park and ride lot before commuters start using it in the morning. Similar challenges of providing parking at weigh stations would also exist for providing parking at park and ride lots. Specifically, using park and ride lots as an alternative for truck parking would require appropriate signage, agency coordination and education to make them a useful option.
Expansion of truck parking should be based on locations with the largest needs. Many of these locations were identified in Chapter 3 through the review of truck parking utilization at existing truck parking locations. Additionally, the freight stopping range information reported in the Truck Travel between Major Freight Hubs section of Chapter 3 should be considered when making decisions about locations to expand or add parking locations.

49
Iowa Statewide Rest Area Management Plan
Traveler Information DisseminationTraveler information dissemination is a way to maximize the use of services by making travelers aware of service locations and availability. Example traveler information dissemination means include signage, radio and web-based information. Based on the data collected, services that appear to be most important to users include rest rooms and parking (specifically, truck parking). To inform travelers of locations and availability of these services, traveler information dissemination should be explored along the interstate corridors. An example of this would be to incorporate additional information into the existing 511 service provided to travelers. Additionally, as technology advances, different means of conveying information to travelers via smartphones or other media should be explored.
To address traveler dissemination of truck parking, truck parking availability technology is currently being investigated. A review of existing programs, funding, projects and research was conducted on truck parking availability technology. There are currently several demonstration and pilot projects, funded through FHWA, that are on-going related to real-time truck parking availability technologies. However, there are no current commercial off the shelf (COTS) truck parking availability systems available. Based on the work completed to date, it is difficult to estimate the costs to deploy a real-time truck parking availability system. Most of the systems to date are being deployed for $5 million per corridor. As this technology advances and COTS systems are developed it is reasonable to assume that this cost will decrease. Based on planning-level costs for developing a central system, data collection system and operations and maintenance of a system for the first 3 years, estimated costs to deploy a system at 10 sites would range between approximately $2,000,000 and $5,000,000. There is a high variation in costs due to the level of functionality and the type of technology used. Additional information regarding research conducted on truck parking availability technology is provided on the digital appendix.