initial testing of a prototype phased array device for ... paper for... · 1 a random phased array...
TRANSCRIPT

1
A random phased array device for delivery of High Intensity Focused Ultrasound
J W Hand1, A Shaw2, N Sadhoo2, S Rajagopal2, R J Dickinson3 and L R Gavrilov4 1 Radiological Sciences Unit, Imperial College Healthcare NHS Trust, London W12 0HS 2 Quality of Life Division, National Physical Laboratory, Teddington TW11 0LW 3 Dept of Bioengineering, Imperial College, London SW7 2AZ 4 N.N. Andreev Acoustics Institute, 117036 Moscow, Russia email: [email protected] Abstract Randomised phased arrays can offer electronic steering of a single focus and simultaneous multiple foci concomitant with low levels of secondary maxima and so are potentially useful as sources of high intensity focused ultrasound (HIFU). This work describes laboratory testing of a 1 MHz random phased array consisting of 254 elements on a spherical shell of radius of curvature 130 mm and diameter 170 mm. A novel technique in which an infra-red camera is used to provide a rapid qualitative assessment of temperature changes in an absorbing target (and by inference relative intensity distributions) due to HIFU pulses for a range of focusing conditions is described. The results show that the array can steer a single focus laterally to at least ±15 mm off axis and axially to more than ±15 mm from the centre of curvature of the array and patterns of 4 and 5 simultaneous foci ±10 mm laterally and axially whilst maintaining low intensity levels in secondary maxima away from targeted area in good agreement with linear theoretical predictions. Experiments in which pork meat was thermally ablated indicate that contiguous lesions several cm3 in volume can be produced using the multiple foci patterns.
1. Introduction High intensity focused ultrasound (HIFU), an ablative therapy that is unique in having the potential for non-invasive delivery, is currently the subject of considerable research and development (Dubinsky et al 2008; ter Haar and Coussios 2007). Although HIFU systems based on the use of a single focused transducer have the advantage of being relatively simple, they have disadvantages, including the need to scan the small focus through clinically relevant volumes of tissue by mechanically translating the transducer. This is time consuming and can lead to clinical treatments of impractically long duration. The use of phased arrays offers not only electronically controlled dynamic focusing and the ability to vary and control precisely the range, location and size of a focus during treatment without moving the array, but also a means of synthesizing fields with multiple simultaneous foci. Several investigators have proposed phased arrays in which

2
(a) (b) (c) Figure 1. (a) Front view of array and positioning mechanism, (A) stainless steel ring used to hold and seal the thin membrane, (B) is the central hole for locating imaging transducer (not shown), (C) is part of the spherical surface of the array, and (D) and (E) are entry and exit ports for the circulating, temperature controlled, degassed water bolus. 1(b), (A) i flexible housing containing the water bolus, (B) screw mechanism for adjusting the position of the array with respect to the front membrane, (C) protective tube containing thermocouples for monitoring the array's temperature, and (D) 2 of the 4 bundles of cables supplying RF signals to the 4 quadrants of elements. 1(c) shows the distribution of elements and their grouping into 4 quadrants containing (clockwise from top right) 63, 64, 64, and 63 elements respectively. The outer diameter is 170 mm and the diameter of the central aperture is 38 mm. elements are placed on a spherical shell, thereby combining electronic and geometric focusing (Ebbini and Cain 1991, Goss et al 1996, Daum and Hynynen 1999, Gavrilov and Hand 2000a). Disadvantages of phased arrays include the unwanted presence of grating lobes and other secondary intensity maxima and, particularly for relatively large extracorporeal, 2-D arrays, complexity and potentially relatively high cost. There is a common need to reduce grating lobes and several techniques aimed at achieving this have been reported. Hutchinson et al (1996) developed an aperiodic linear array based on a random distribution of different-sized elements. Goss et al (1996) showed theoretically that the use of elements randomly distributed on a segment of a spherical surface may improve phased array performance. They also suggested that the use of sparse phased arrays may be promising in the reduction of the complexity and relatively high cost of large 2D arrays. Lu et al (2005) described the use of a genetic algorithm to optimise the phase and amplitude distributions at array elements to reduce grating lobes. Apodization, broad banding (Doupenloup et al 1996) and the use of subsets of elements (Gavrilov et al 1997) have also been investigated. In this work we report details of the initial testing of a phased array comprised of elements that are randomly distributed on a segment of a spherical surface according to previous theoretically-based criteria (Gavrilov and Hand 2000a, Hand and Gavrilov 2000, 2002). Details of the array's power handling capability, assessment of intensity distributions for both single and multiple foci located at, and displaced axially and laterally from, the geometrical centre of curvature of the spherical segment, and results of tissue ablation in pork meat samples are discussed.
2. Materials and Methods 2.1 The array transducer The array transducer consisted of 254 circular elements, each 7 mm in diameter, distributed randomly, but with a minimum inter-element (centre to centre) spacing of 7.9 mm, on a spherical surface with radius of curvature 130 mm and a diameter 170 mm. The device was

3
constructed using composite material (Imasonic, Voray sur l'Ognon, France) and was compliant with design criteria described previously (Hand and Gavrilov 2000, Gavrilov and Hand 2000a). A central aperture 38 mm in diameter was provided for insertion of an imaging transducer. Figs. 1(a-b) show front and side views of the array and its holding mechanism that provided adjustment of the position of the array relative to the thin membrane and therefore to the medium to be sonicated. The array could be operated frequency within the range 0.8 to 1.2 MHz; in the testing described here an operating frequency of 1 MHz was used. RF signals were fed via 4 bundles of miniature coaxial cables to 4 groups of elements located in different quadrants of the surface of the array (Fig 1(c)). Provision for air cooling of the array was incorporated in the design and its internal temperature could be monitored by thermocouples. A flexible housing contained a temperature controlled degassed water bolus that was circulated using a pump and thermostatically controlled water bath (model GD120, Grant Instruments, Cambridge, UK). 2.2 RF power/control system Generation and control of RF signals applied to the array elements were provided by a commercially available system (Model 500-013, Advanced Surgical Systems Inc, Tucson, AZ). The 256 channel system had a power capability of up to 60 W/channel, constrained within a total power of 1800 W and frequency was adjustable from 0.8 to 1.25 MHz. 4 RF outputs via multi-pin connectors (ITT/Cannon type DL 156) provided power to the 4 quadrants of the array. 256 customised L-C impedance matching networks were designed and constructed. Measurements made on a sample of 254 channels showed better than approximately -10 dB return loss. No further optimization of impedance matching by individually tuning each of the 254 channels was carried out. The matching networks were constructed in 4 groups of 64 and inserted between the 4 outputs of the generator and the quadrants of the array. The generator was controlled by a laptop computer (Dell Latitude, Intel® Core™ 2 Duo U7600 1.2 GHz processor, 2 GB RAM) via a RS-232 link. Proprietary software (Large Array Interface v1.2.0.0, Advanced Surgical Systems Inc, Tucson, AZ) was used to set the operating frequency and to select active channels and their relative phases (0 to 360 degrees in increments of 2.25 degrees) and relative powers (8 bit control) via a text file. The nominal electrical power level, limits on forward and reflected power per channel, and the duration of sonication were set via the main window of the user interface. The array could also be driven with a stack of files containing differing relative phases and powers. The rate at which this stack was sequenced and the relative power applied to each set of driving parameters within the stack could also be selected, or for refresh rates greater than 9 Hz, could be controlled by an external timing signal. Phase and power data for each of 254 channels to produce and steer a single focus and patterns of multiple simultaneous foci were generated using a Fortran 90 code based on theory outlined below in section 2.4.2 and described in full by Gavrilov and Hand (2000a). 2.3 Ultrasound Power Measurements Ultrasound power was determined using radiation force measurements with a target containing castor oil (Shaw 2008). The array and its holding system, pointed vertically, were fixed to a frame which also supported a water tank mounted above the array. The oil-filled target was placed in the tank and was suspended from a balance and positioned to intercept the whole of the ultrasound field generated by the array. A series of experiments was performed in which the array was driven on for 6.5 s and off for 6.5 and when on, the power was stepped from 20% to 100% of the maximum power level set in steps of 20%.

4
Figure 2. IR camera and absorber set up for assessment of intensity distributions produced by the array. The output of the balance was recorded at 100 ms intervals throughout each experiment. The maximum electrical power applied to the array in these experiments was approximately 490 W. 2.4 Assessment of ultrasound intensity distributions in water 2.4.1 Experimental assessment Since a method based on a scanned hydrophone would be prohibitively slow given the potentially large number of focusing conditions and fields that can be generated by the array, an alternative technique based on measurements made using an infra-red (IR) camera was used to provide a rapid qualitative assessment of intensity distributions, including identification of existence and location of sidelobes and other local regions of high intensity. This is a new method that will be explored in detail in a separate paper. IR measurements were carried out using a modified ThermoScope® pulsed thermography system (Thermal Wave Imaging Inc., Ferndale, MI) consisting of an IR camera and a PC running EchoTherm® v6.4 software (Thermal Wave Imaging Inc., Ferndale, MI). The camera was a Phoenix MWIR 9705 (FLIR Systems, Boston, MA) operating in the band 1.5 to 5.0 μm with an indium antimonide detector providing 320 x 256 pixels at a pitch of 30 µm. It had a 14 bit range with a specified noise-equivalent temperature of less than 25 mK and a frame rate of up to 120 fps. Image data was transferred via a RS422 link to the PC. The system and software provided a method of acquiring, viewing, and saving IR images synchronised to a pulsed source. In this work the system was modified to trigger a burst of ultrasound. The burst length was variable, but for most measurements a duration of 0.8 s was used. The system was configured to capture a sequence of 75 frames at a rate of 50 fps, with the ultrasound burst starting at the 10th frame. The sequence was stored as a movie in RAW format to preserve maximum dynamic range for later analysis. The heating distributions shown were derived from the subtraction of the 10th frame from the 14th. Since the temperature rise is proportional to the intensity for short duration sonication, the technique provided an estimate of the relative intensity distribution. The experimental set-up is shown in fig. 2. The ultrasound beam was directed vertically upwards onto a 2 mm thick sheet of NPL F28 ultrasonic absorber (Precision Acoustics, Dorchester, UK) with a single-pass attenuation coefficient of 7.5 dB at 1 MHz. The distance between the absorber and the transducer was adjustable using a micrometer positioning stage with ±25 mm of travel. The other side of the sheet was air-backed and viewed from above by the IR camera which was focused on the upper surface of the sheet. The distance between the lens and the sheet was approximately 24 cm, giving a spatial

5
resolution of 0.28 mm using a 25 mm lens. The thermal resolution was approximately 5.6 mK. The plane of the geometric focus of the array was determined by driving all elements with the same phase, and identifying the position of the micrometer where the maximum temperature rise was observed. This was determined at the start of each set of experiments and used as a datum. For the majority of measurements made, the nominal output power of the generator was set to 20 W. 2.4.2 Theoretically predicted distributions Intensity distributions for the single and simultaneous multiple foci patterns measured experimentally were compared with those predicted theoretically using a method similar to that described by Goss et al (1996). The complex pressure distribution associated with a single plane circular element was found using the Point Radiator Method in which the acoustic piston source was represented by many point radiators (Ocheltree and Frizzell, 1989). Square elemental radiators of side length 0.1 - 0.25 mm were used to describe the radiating surface of each element. Assuming radial symmetry for a circular element, its 3-dimensional acoustic field was found by calculating the complex pressure p(rs, zs) as a function of axial distance from the element, zs, and distance off its central axis, rs, according to
( )∑
∆=
+−
surface
Rjko
ss ReAukcjzrp
α
πρ
2),( (1)
where ρ is the density (1000 kg m-3), c is speed of sound (1500 m s-1), k is the propagation constant, uo is the velocity amplitude of the surface of the elemental sources, ∆A is the area of each elemental source, α is the attenuation coefficient (approximated to 0 dB MHz-1 cm-1 for water) and R is the distance from the centre of an elemental source to the point (rs, zs) where the field is calculated. Complex pressure values were calculated at points on a 0.1 mm grid. The total complex pressure distributions from the 254 elements on the spherical shell were calculated by summing the complex pressure contributions from each element in the array at each point in the 3-dimensional volume of interest as described by Gavrilov and Hand (2000a). The relative phases of the velocities at the elements' surfaces required to produce a single focus were determined from the paths between the centre of each element and the position of the focus. To produce simultaneous multiple foci, the complex surface velocity un at the nth of the 254 elements was determined using the method described by Ebbini and Cain (1991). The un are related to the complex pressures pm at each of M target points by the matrix equation
u = H*t (HH*t)-1 p (2)
where u = [u1, u2, ....., un, ..... u254]t , p = [p1, p2, ....., pm, ..... pM]t, and H is the M x 254 matrix
with elements hmn = ( )dS
rrkjkcj
S mn
mn∫−exp
2πρ
, where rmn is the distance from the mth
target point to the centre of the nth element and S is the area of an array element. H*t is the conjugate transpose of H and []t denotes transpose. To determine the un (n = 1, 2 , ... 254), equal amplitudes were assumed for the pm (m = 1, 2 , ... M) and their phases were chosen such that the phases at the location of each maximum in the pattern of foci varied in a manner similar to that described by Fan and Hynynen (1996a). The intensity at each grid point was found from the product of the complex pressure and its complex conjugate.

6
Calculations were made using a FORTRAN 90 code and executed on a PC running Fortran PowerStation 4.0 in Microsoft Developer Studio (Filonenko et al 2004). 2.5 Sonication of pork meat Several experiments were carried out to produce thermal ablation in various pieces of pork (pork chops, leg of pork). Typically, meat was degassed under vacuum for approximately 1 hour prior to sonication. The oxygen level in the degassed water in the experimental tank and bolus was measured to be 0.85 ppm. To avoid contaminating this water, meat samples were trimmed to fit within a perspex cylinder with a base formed from a thin (~10 µm) cling-film membrane and placed on an annular spacer at the bottom of the container to avoid direct contact the membrane. In some cases a small piece of liquid crystal film was placed on top of the assembly to identify the location of heating. The container and two meat stacked samples were positioned so that the common surfaces of the two samples were located approximately in the focal plane of the array. 3 Results 3.1 Ultrasound power measurements The output of the balance was recorded at 100 ms intervals throughout each experiment. Fig. 3(a) shows a typical response of the balance during a period on which the array was turned on for 6.5 s and off for 6.5 s with 90 W (net) electrical power. The absorbed ultrasound produced an instantaneous radiation force and a progressive heating of the castor oil. Fig. 3(b) shows the output of the balance, averaged over 1 s to remove an oscillation artefact, for the duration of the experiment in which the maximum electrical power applied to the array was 490 W. The observed change in weight of the target δm is related to the acoustic power P through P = c δm g where c is the speed of sound in the castor oil, and g is the acceleration due to gravity. Due to the distribution of elements on the spherical surface of the array, a correction factor Pcorrected = 1.17 x Pmeasured was applied to account for the orientation of each element. Figure 4 shows the variation of acoustic power produced by the array with net electrical power applied. The efficiency of the array was ~73% at low power levels, decreasing to ~50% at high power levels. When the acoustic power was 244 W, the average power density at each of the 254 elements was ~2.5 W cm-2. Under these conditions the predicted maximum intensity in a single focus on axis at the centre of curvature of the array is ~5.5 kW cm-2 and the corresponding maximum pressure amplitude is ~13.2 MPa, assuming linear propagation.
(a) (b)
Fig 3. (a) changes in weight recorded by balance due to sonication for 6.5 s on, 6.5 s off and net electrical power 90 W. (b) output of balance, averaged over 1 s, as a function of time during which net electrical power applied is stepped from 98 W, through 196, 294, and 392 to 490 W with 50% duty cycle (6.5 s on, 6.5 s off).

7
Figure 4. Acoustic power produced by the array, corrected for orientation of elements on the spherical surface,
versus net electrical power applied. 3.2 Ultrasound intensity distributions in water 3.2.1 Single focus 3.2.1.1 Single focus located on axis at the centre of curvature. The measured -6 dB full width of a single focus targeted at the centre of curvature of the
(a) (b) Figure 5. Relative intensity profiles for a single focus at (0,0,130). (a) measured (solid line) and predicted (broken lines) profiles along x- and y-axes. (b) measured and predicted variation in maximum intensity along central axis of the array.
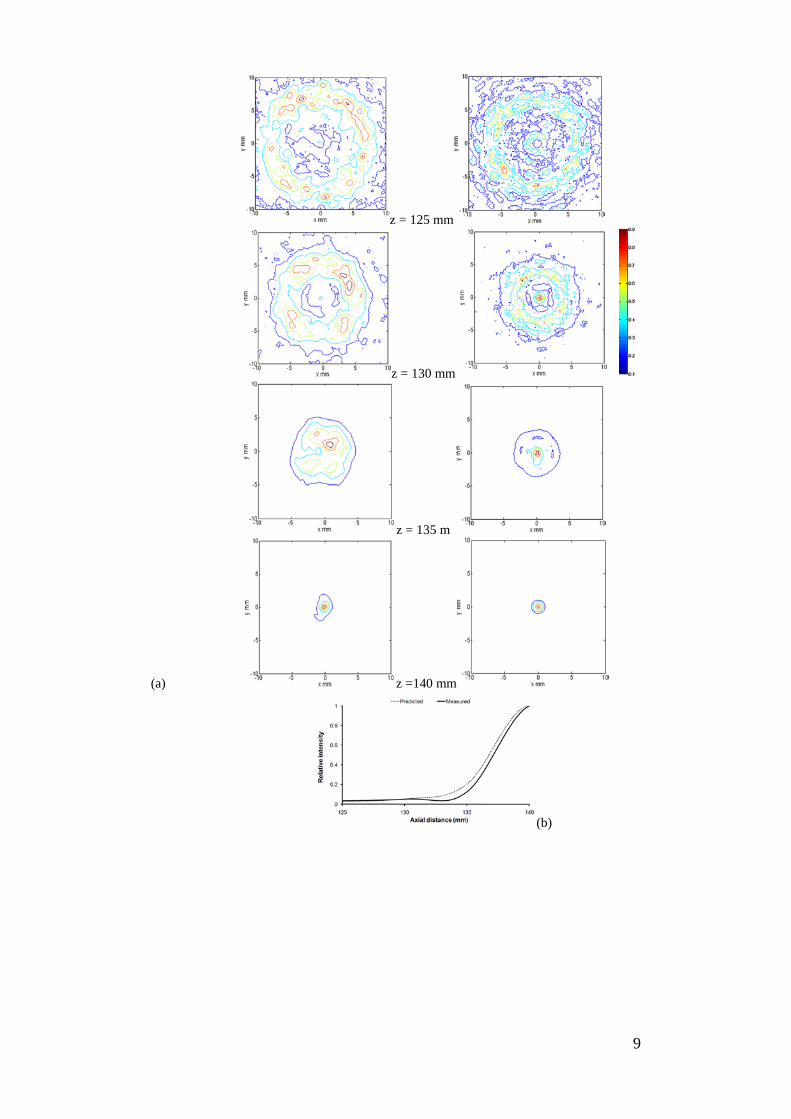
array (i.e. at co-ordinates 0, 0, 130) was 1.6 mm, compared to the predicted value of 1.7 mm, as shown in figure 5(a). Fig 5(b) compares the variation in maximum intensity with axial distance obtained by IR measurement of temperature changes and the predicted variation. 3.2.1.2 Single focus located on axis out of the plane containing the centre of curvature. Fig 6a shows measured and predicted distributions in x-y planes at z = 125, 130, 135 and 140 mm for a single focus on axis and focused at z = 140 mm. The variation of maximum intensity with axial distance over the same range is shown in fig 6b. The -6 db half length of the focal region was 4 mm. In the plane z = 140 mm its -6 dB full width was approximately 2 mm. When a single focus was targeted on axis at z = 120 mm , the predicted -6 dB full length and full width were 7.2 mm and 1.5 mm, respectively; these values were also in good agreement with measurements. Cases in which the focus was

8
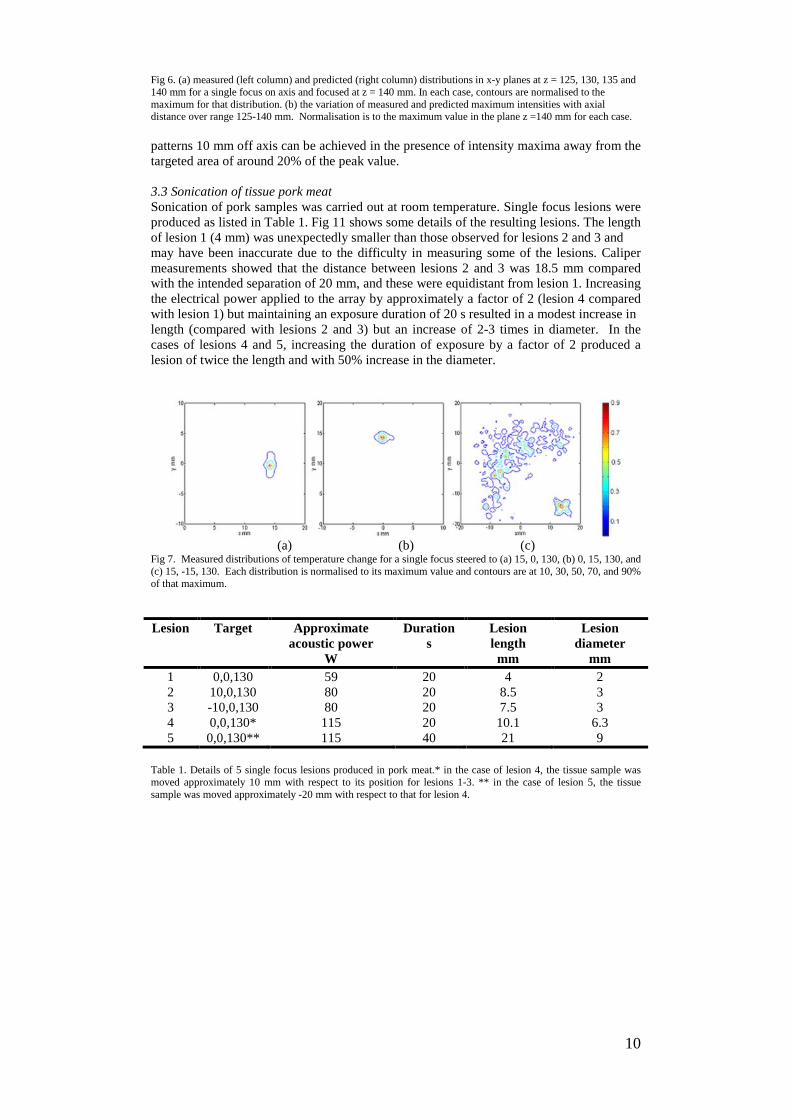
shifted axially up to ± 20 mm from the centre of curvature were also investigated and results showed that intensity away from the focal region was < 10 dB relative to the maximum for shifts ∆z for which 15 ≤ ∆z < 20 mm, in accord with linear theoretical predictions. 3.2.1.3 Single focus steered off axis Figs 7(a) and (b) show IR measured temperature changes when a single focus was steered 15 mm along the array's x- and y-axes, respectively, in the z = 130 mm plane. In each case the peak of the distribution is within 1 mm of the targeted position and temperature changes away from the immediate location of the focus are less than 10% of the maximum. However, as shown in fig 7(c), when the focus is steered 15 mm off both x- and y-axes (ie approximately 21 mm from the central axis) with z = 130 mm, the observed distribution shows local "hot spots" away from the targeted location in which the change is in excess of 70% of the maximum. IR measured temperature changes and predicted intensity distributions in x-y planes from z = 120 mm to 140 mm for a single focus steered to (0, -10, 130) are shown in figure 8(a). The maximum values in these planes plotted against axial distance for both predictions and measurements are shown in figure 8(b). 3.2.2 Multiple simultaneous foci The phases at the 254 elements were calculated so as to produce patterns of 4 and 5 foci. In the case of the pattern consisting of 4 foci, the foci were targeted at (4, 0, 130), (0, -4, 130), (-4, 0, 130), and (0, 4, 130). This case was referred to by the location of the centre of the pattern which was (0, 0, 130). In the case of the pattern of 5 foci, when centred, these occurred at (4, 4, 130), (4, -4, 130), (-4, -4, 130), (-4, 4, 130), and (0, 0, 130). When the patterns were steered off axis and focused in different x-y planes, the co-ordinate describing the position referred to the central point in the pattern. 3.2.2.1 Patterns of 4 and 5 foci in the z = 130 plane Figs 9(a)-(c) show measured distributions for the pattern of 4 simultaneous foci with the centre of the pattern located at (0, 0, 130), (0, 10, 130), and (0, 15, 130), respectively. With the exception of the case when the pattern is steered to (0, 15, 130), the secondary intensity maxima are below approximately 25% of the peak value. Figs 11(d)-(f) show measured distributions for the pattern of 5 simultaneous foci located at (0, 0, 130), (0, 10, 130), and (-10, 10, 130), respectively. With the exception of the latter case, the secondary intensity maxima are again below approximately 25% of the peak value. Figs 9(g) and (h) show the results of switching between the 4 and 5 simultaneous foci patterns when these are located at (0, 0, 130) and (0, 10, 130), respectively. Although the multiple foci in these examples were intended to have equal peak values (and assumed equal power delivery from all elements), the measurements show some variation between foci. This could be due to the limited spatial resolution of ~0.28 mm in the configuration used or because some elements provided more acoustic power than others. Fig 9(i) shows relative intensity maxima in z planes for predicted and measured data versus axial distance z for the case of the 4 foci pattern located at (0,10,130). 3.2.2.2 Patterns of 4 and 5 foci in planes other than z = 130 mm Figures 10(a)-(f) show measured distributions for patterns of 4 and 5 simultaneous foci centred at x = 0 mm, y = -10 mm in 3 z-planes (z = 125, 135, and 140mm). With the exception of the 5 foci pattern centred at (0,-10,125) where the intensity maximum away from the target area is marginally greater than 30% of the peak value, targeting these
9
z = 125 mm
z = 130 mm
z = 135 m
(a) z =140 mm
(b)
10
Fig 6. (a) measured (left column) and predicted (right column) distributions in x-y planes at z = 125, 130, 135 and 140 mm for a single focus on axis and focused at z = 140 mm. In each case, contours are normalised to the maximum for that distribution. (b) the variation of measured and predicted maximum intensities with axial distance over range 125-140 mm. Normalisation is to the maximum value in the plane z =140 mm for each case. patterns 10 mm off axis can be achieved in the presence of intensity maxima away from the targeted area of around 20% of the peak value. 3.3 Sonication of tissue pork meat Sonication of pork samples was carried out at room temperature. Single focus lesions were produced as listed in Table 1. Fig 11 shows some details of the resulting lesions. The length of lesion 1 (4 mm) was unexpectedly smaller than those observed for lesions 2 and 3 and may have been inaccurate due to the difficulty in measuring some of the lesions. Caliper measurements showed that the distance between lesions 2 and 3 was 18.5 mm compared with the intended separation of 20 mm, and these were equidistant from lesion 1. Increasing the electrical power applied to the array by approximately a factor of 2 (lesion 4 compared with lesion 1) but maintaining an exposure duration of 20 s resulted in a modest increase in length (compared with lesions 2 and 3) but an increase of 2-3 times in diameter. In the cases of lesions 4 and 5, increasing the duration of exposure by a factor of 2 produced a lesion of twice the length and with 50% increase in the diameter.
(a) (b) (c) Fig 7. Measured distributions of temperature change for a single focus steered to (a) 15, 0, 130, (b) 0, 15, 130, and (c) 15, -15, 130. Each distribution is normalised to its maximum value and contours are at 10, 30, 50, 70, and 90% of that maximum. Lesion Target Approximate
acoustic power W
Duration s
Lesion length mm
Lesion diameter
mm 1 0,0,130 59 20 4 2 2 10,0,130 80 20 8.5 3 3 -10,0,130 80 20 7.5 3 4 0,0,130* 115 20 10.1 6.3 5 0,0,130** 115 40 21 9
Table 1. Details of 5 single focus lesions produced in pork meat.* in the case of lesion 4, the tissue sample was moved approximately 10 mm with respect to its position for lesions 1-3. ** in the case of lesion 5, the tissue sample was moved approximately -20 mm with respect to that for lesion 4.

11
To show the ability to produce multiple-foci lesions, patterns of 4 simultaneous foci (individual foci in the pattern targeted at (4,0,130), (0,4,130), -4,0,130), and (0,-4,130)) followed by 5 simultaneous foci (individual foci at (4,4,130), (-4,4,130), (-4,-4,130), (4,-4,130), and (0,0,130)) were produced. The approximate acoustic power emitted by the array was 142 W for the 4 foci pattern and 188 W for the 5 foci pattern. In each case the duration of exposure was 20 s. Upon inspection of the meat samples a large contiguous lesion with lateral dimensions approximately 11 mm x 11 mm x 16 mm was observed. Serial sections (approximately normal to the direction of ultrasound propagation) are shown in fig 12. A similar experiment with the same power levels but with an increased exposure duration (30 s) produced a single contiguous lesion approximately 16 mm x 14 mm and of length 27 mm (at edge) and 28 mm (central region). The ability to steer multiple foci off axis in tissue was demonstrated using a sequence of 5 foci on axis (0, 0, 130) followed by 4 foci steered 10 mm off axis (10, 0, 130) with acoustic power of 187 W and 152 W, respectively, delivered to the array and a duration of 25 s in each case. The resulting lesion is shown in fig 13. The ability to steer single and multiple foci along the central axis was demonstrated by an experiment in which a single focus lesion (54 W acoustic power for 30 s) was targeted at (0, 0, 140), a second single focus lesion (59 W acoustic power for 30 s) was targeted at (0, 0, 130), and a 5 foci pattern (189 W acoustic power for 20 s) was targeted at (0, 0, 120). Fig 14 shows some details of the resulting lesions. Square and single lesions were detected at differing depths in the tissue. All three exposures produced a lesion on the axis; a section showing part of a contiguous lesion over a thickness of 23 mm of tissue resulting from these axial lesions can be seen. 4 Discussion Gavrilov and Hand (2000a) suggested several criteria to assess the quality of intensity distributions produced by phased arrays. For single focus fields the most stringent criterion was that I < 0.1 Imax in all areas of the field outside the focal region. This was in agreement with other recommendations (Ebbini and Cain 1991, Goss et al 1996, Hutchinson et al 1996) that secondary maxima away from the focus should be -8 to -10 dB with respect to the maximum intensity for safe delivery of treatment. Poorer quality distributions were categorised as those with a number of distinct regions (≤ 10 or >10) in which 0.1 I max ≤ I ≤ 0.15 Imax. Distributions in which I ≥ 0.2 I max occurred outside the focal region were considered poor and inappropriate. For multiple-foci fields the criteria for intensity values outside the multi-focal volume were I < 0.3 Imax, for which the risk of producing a thermal lesion outside the focal region should be low, and I > 0.4 Imax for which the risk of producing an unwanted lesion could be significant. Accurate assessment of intermediate distributions (0.3 Imax < I ≤ 0.4 I max) requires further information, for example from thermal modelling or experimental studies. These criteria were based on data including the likely maximum tissue temperature achieved during HIFU treatments is 80-90 oC (Hill and ter Haar 1995, Fan and Hynynen 1996a,b), that there is a threshold value of thermal dose for tissue necrosis (Fan and Hynynen 1996b), and the approximation that the increase in temperature produced by the brief HIFU exposure is linearly related to the intensity (ie neglecting the effects of thermal conduction and perfusion). Previous work (Gavrilov and Hand 2000a, 2000b, Gavrilov et al 2000) has shown that improvement of the quality of the intensity distributions, particularly in cases when the focus or foci is/are steered from the geometric centre of curvature of the array, can be

12
z = 120 mm
z = 125 mm
z = 130 mm
z = 135 mm

13
(a) z = 140 mm
(b) Fig 8. (a) measured (left column) and predicted (right column) distributions in x-y planes at z = 120, 125, 130, 135 and 140 mm for a single focus located at (0,-10,130). Each case is normalised to its maximum value. (b) the variations in measured and predicted maximum intensities with axial distance over range 110-150 mm. In each case normalisation is to the respective maximum in the plane z = 130 mm.
(a) (b) (c)
(d) (e) (f)

14
(g) (h) (i) Fig 9 Measured intensities for multiple simultaneous foci in the plane z =130 mm on and steered off the central axis. Upper row: 4 foci at (a) (0,0,130), (b) (0,10,130), (c) (0,15,130). Central row: 5 foci at (d) (0,0,130), (e) (0,10,130), (f) (-10,10,130). Lower row: results of switching between 4 and 5 foci patterns at (g) (0,0,130) and (h) (0,10,130). (i) Relative intensity maxima in z planes for predicted and measured data versus axial distance z for the case of the 4 foci pattern located at (0,10,130). In all distributions contours are at 10, 30, 50, 70 and 90% of the maximum value in each case.
Figure 10. Measured distributions for patterns of 4 (upper row) and 5 (lower row) simultaneous foci steered off axis and centred on different planes at (0,-10, 125) (a) and (d); (0,10,135) (b) and (e); and (0,10,140) ((c) and (f). Contours are shown at 10%, 30%. 50%. 70%, and 90% of the maximum value in each case.

15
(a) (b) (c)
(d) (e) (f) (g) Fig 11. Single focus lesions (see Table 2) produced in pork. (a) overview showing lesions 2, 1, and 3 (diagonally from upper right to lower left on RHS sample), lesion 4 (lower right on right hand sample), and lesion 5 (upper left on right hand sample) on mid surfaces of the meat samples; (b) caliper measurement of separation of lesions 2 and 3 (18.5 mm); (c) caliper measurement of diameter of lesion 4 (6.3 mm); (d) caliper measurement of diameter of lesion 5 (9 mm); (e) section through lesion 1 showing lesion length (~4 mm); (f) section through lesion 4 showing lesion length (~10.1 mm); (g) section through lesion 5 showing lesion length (21 mm).
(a) (b) (c)

16
(c) (d) (e) Fig 12. Lesion produced by a sequence of 4 foci (142 W acoustic power, 20 s) followed by 5 foci (188 W acoustic power, 20 s). (a) - (e) sequential sections through lesion showing essentially square cross sections. The sections covered approximately 16 mm of tissue; (f) caliper measurement of lesion (11 mm side length).
(a) (b) Fig 13 Lesion produced by a sequence of 5 foci (187 W acoustic power, 25 s) followed by 4 foci offset by 10 mm (152 W acoustic power, 25 s). (a) section of lesion - the region to the left is due to the 5 foci, that to the right due to 4 foci. (b) section closer to geometric centre of array. The "cross" and "diamond" due to the 5 and 4 foci patterns respectively are evident in this section. Section (a) was in tissue marginally closer to the array than that in (b).
Fig 14. Section through tissue showing essentially contiguous lesion along central axis due to a sequence of single focus lesions at (0, 0, 140), (0, 0, 130), and (0, 0, 120). "A" is due to the single focus at (0, 0, 140), "B" due to that

17
at (0, 0, 130), and "C" due to that at (0, 0, 120). Ultrasound propagated from top to bottom through this section of tissue. achieved if 3 conditions are fulfilled simultaneously. These are (i) the elements should be randomly distributed over the array surface, (ii) element dimensions should be comparable to one or a few ultrasound wavelengths, and (iii) the active surface of the array should be large enough to ensure a sufficiently high intensity in the focus whilst avoiding excessively tight packing of the elements. The good agreement between measurements and predictions discussed in this paper supports these design criteria. The benefits of using arrays in which the locations of the elements are randomized have been recognised for many years and this approach has been applied to diverse problems (Skolnik 1962, (Turnbull and Foster 1991), as well as to therapeutic ultrasound systems (Goss et al 1996). Recent reports involving therapeutic applications of randomized arrays include those by Pernot et al (2003), Aitkenhead et al (2008) and Aubry et al (2008) The potential benefit of the use of a phased array to produce relatively large volumes of thermally ablated tissue has been described by several authors. Daum and Hynynen (1999) investigated switching between various patterns of multiple foci. Filonenko et al (2004) studied thermal dose distributions associated with a 9 foci regime produced by a random phased array, including cases where the patterns were steered up to 7 mm off axis. Alternatively, scanning a focus along spiral and other trajectories (Mougenot et al 2004, Malinen et al 2005) has also been shown to be effective in producing large thermal lesions. Other potential advantages of extracorporeal phased arrays include the possibility to customise the acoustic field to enable ablation of liver by sonicating through intercostal spaces and without overheating the ribs (McGough et al 1996, Botros et al 1997, 1998, Aubry et al 2008). Preliminary investigations using the current phased array for this purpose have been carried out and will be the subject of a future publication. To our knowledge the use of an IR camera to map intensity distributions in the way described is new. It is very useful in that a 2D field map can be generated within seconds, although it necessitates the introduction of an air-interface and acoustic reflections into the beam path. The measured distribution is also, of course, dependent on thermal conduction and convection, and on the spectral content of the acoustic field. Conduction and convection effects have been minimised by using only sub-second exposure periods; we found that the temperature increase was a linear function of time for at least the first 0.2 s, indicating that these effects are small over the time scale considered. Acoustic reflections are reduced by the high attenuation coefficient of the F28 rubber used as the window material for which the 2-way insertion loss is approximately 15 dB. Reflections can be a problem for characterising unfocused transducers, but much less so in the focal region of a focused transducer. Here, the intensity level of the main incident beam is much higher than the levels from the first reflection (which has to travel 3 times the distance) and so the pattern is dominated by the main beam. Enhanced temperature rise in regions with nonlinear harmonics can be expected, although these harmonics will be more highly attenuated by the window material and so their influence on the outer surface may be limited. These aspects will be studied in detail in a future paper. The pork meat experiments were carried out over relatively long durations for a single HIFU exposure (up to 30 s) but the ablated volume was large for the multiple focus fields, which inevitably requires more energy to be delivered. We have not tried to identify the minimum time required to produce a single small lesion. It is also worth noting that the experiments were carried out at room temperature, thus requiring a temperature increase of approximately 40 oC to achieve ablation. Starting from body temperature, the increase (and

18
therefore time) required will be greatly reduced, especially where ablation is achieved between individual focal points by thermal conduction. 5 Conclusion Laboratory testing of a random phased array HIFU device and associated electronics has shown that the position of the focus or a pattern of simultaneous multiple foci can be controlled dynamically, and that steering of single and multiple foci in depth and laterally from the central axis is possible whilst maintaining low intensity levels in secondary maxima away from targeted area. These results are in good agreement with linear theoretical predictions. Experiments in which pork meat was thermally ablated indicate that single and multiple foci lesions can be steered off and along the central axis of the array. Large contiguous lesions can be produced using the multiple foci patterns and relatively short exposure times. Acknowledgements. This work was supported by Cancer Research UK through project grant C18509/A78. J Hand is also grateful for support from the NIHR Biomedical Research Centre funding scheme. A Shaw, N Sadhoo, and S Rajagopal were also supported in part by the National Measurement Systems Directorate of the UK Department of Innovation, Universities and Skills. L Gavrilov is grateful for support from the INTAS (project no. 05-1000008-7841) and the Russian Foundation for Basic Research (project no. 06-02-16079). References
Aitkenhead A H, Mills J A, and Wilson, A J 2008 The design and characterization of an ultrasound phased array suitable for deep tissue hyperthermia. Ultrason. Med. Biol. 34 1793-807
Aubry J-F, Pernot M, F Marquet F, Tanter M and Fink M 2008 Transcostal high-intensity-focused ultrasound: ex vivo adaptive focusing feasibility study Phys. Med. Biol. 53 2937-51
Botros Y Y, Volakis J L, VanBaren P and Ebbini E S 1997 A hybrid computational model for ultrasound phased-array heating in presence of strongly scattering obstacles IEEE Trans. Biomed. Eng. 44 1039-50
Botros Y Y, Ebbini E S and Volakis J L 1998 Two-step hybrid virtual array-ray (VAR) technique for focusing through the rib cage IEEE Trans. Ultrason. Ferroelectr. Freq. Control 45 989-99
Daum D R and Hynynen K 1999 A 256-element ultrasonic phased array system for the treatment of large volumes of deep seated tissue IEEE Trans.Ultrason. Ferroelect. Freq. Contr. 46 1254-68
Dubinsky T J, Cuevas C, Dighe M K, Kolokythas O, Hwang J H 2008 High-intensity focused ultrasound: current potential and oncologic applications. American Journal Roentgenology 190 191-9
Dupenloup F, Chapelon J Y, Cathignol D J and Sapozhnikov O A 1996 Reduction of the grating lobes of annular arrays used in focused ultrasound surgery IEEE Trans. Ultrason. Ferroelect. Freq. Contr. 43 991-8
Ebbini E S and Cain C A 1991 A spherical-section ultrasound phased-array applicator for deep localized hyperthermia IEEE Trans. Biomed. Eng. 38 634-43
Fan X and Hynynen K 1996a A study of various parameters of spherically curved phased arrays for non-invasive ultrasound surgery Phys. Med. Biol. 41 591-608
Fan X and Hynynen K 1996b Ultrasound surgery using multiple sonications - treatment time considerations Ultrason. Med. Biol. 22 471-82
Filonenko E A, Gavrilov L R, Khokhlova V A and Hand J W 2004 Heating of biological tissues by two-dimensional phased arrays with random and regular element distributions Acoustical Physics 50 222–31
Gavrilov L R and Hand J W 2000a A theoretical assessment of the relative performance of spherical phased arrays for ultrasound surgery IEEE Trans. Ultras. Ferroelec. Freq. Ctrl. 47 125-39
Gavrilov L R, Hand J W. 2000b Two dimensional phased arrays for surgery. Movement of a single focus Acoustical Physics 46 390-9

19
Gavrilov L R, Hand J W, Abel P, and Cain C A 1997, A method of reducing grating lobes associated with an ultrasound linear phased array intended for transrectal thermotherapy IEEE Trans. Ultrason. Ferroelect. Freq. Contr. 44 1010-17
Gavrilov L R, Hand J W, and Yushina I G. 2000 Two-dimensional phased arrays for application in surgery: scanning by several focuses. Acoustical Physics 46 551-8
Goss S A, Frizell L A , Kouzmanoff J T, Barich J M, and Yang J M 1996 Sparse random ultrasound phased array for focal surgery IEEE Trans. Ultras. Ferroelec. Freq. Ctrl. 43 1111-21
Hand J W and Gavrilov L R 2000 Ultrasound transducer array. GB patent GB2347043A 23 August 2000 Hand J W and Gavrilov L R 2002 Arrays of quasi-randomly distributed ultrasound transducers US patent
6488630 03 December 2002 Hill C R and ter Haar G R 1995 High intensity focused ultrasound-potential for cancer treatment Br. J.
Radiol. 68 1296-1303 Hutchinson E B, Buchanan M T, and Hynynen K 1996 Design and optimization of an aperiodic ultrasound
phased array for intracavitary prostate thermal therapies Med. Phys. 23 767-76 Lu M, Wan M, Xu F, Wang X, and Zhong H 2005 Focused beam control for ultrasound surgery with
spherical-section phased array: sound field calculation and genetic optimization algorithm IEEE Trans. Ultrason. Ferroelec. Freq. Contr. 52 1270-90
Malinen M, Huttunen T, Kaipio J P, Hynynen K 2005 Scanning path optimization for ultrasound surgery Phys. Med. Biol. 50 3473-90
McGough R J, Kessler M L, Ebbini E S and Cain C A 1996 Treatment planning for hyperthermia with ultrasound phased arrays IEEE Trans. Ultrason. Ferroelect. Freq. Control 43 1074-84
Mougenot C, Salomir R, Palussiere J, Grenier N, Moonen C T 2004 Automatic spatial and temporal temperature control for MR-guided focused ultrasound using fast 3D MR thermometry and multispiral trajectory of the focal point. Magn. Reson. Med. 52 1005-15
Ocheltree K and Frizzell L 1989 Sound field calculations for rectangular sources IEEE Trans. Ultrason. Ferroelec. Freq. Ctrl. 36 242-8
Pernot M, Aubry J F, Tanter M, Thomas J L and Fink M 2003 High power transcranial beam steering for ultrasonic brain therapy. Phys. Med. Biol. 48 2577-89
Skolnik M I 1962 Introduction to Radar Systems. Mc Graw-Hill, New York - San Francisco - Toronto - London
Shaw 2008 A buoyancy method for the measurement of total ultrasound power generated by HIFU transducers. Ultrasound Med. Biol. 34 1327-42
ter Haar G and Coussios C 2007 High intensity focused ultrasound: physical principles and devices. Int. J. Hyperthermia 23 89-104.
Turnbull D H and Foster F S 1991 Beam steering with pulsed two-dimensional transducer arrays IEEE Trans Ultrason. Ferroelec. Freq. Contr. 38 320-33